Article

Surface Quality Related to Face Milling Parameters in 3D Printed Carbon Fiber-Reinforced PETG

Department of Mechanical, Chemical and Materials Engineering, University of Cagliari, Via Marengo 2, 09123 Cagliari, Italy
*
Authors to whom correspondence should be addressed.
J. Compos. Sci. 2024, 8(4), 128; https://doi.org/10.3390/jcs8040128
Submission received: 19 January 2024 / Revised: 23 February 2024 / Accepted: 26 March 2024 / Published: 29 March 2024
(This article belongs to the Special Issue Carbon Fiber Composites, Volume III)

Abstract

:
Three-dimensional printing technology holds significant potential for enhancing the flexibility and cost-efficiency of producing carbon fiber-reinforced polymer composites (CFRPs). However, it faces limitations such as challenges in achieving high surface qualityand precise dimensional accuracy and managing the distinctive anisotropic mechanical properties that it demonstrates. This study aims to explore the machinability of 3D printed PETG infused with 20% short carbon fiber and to assess the resulting surface roughness and burr formation. Employing a Design of Experiments (DoE) approach, three factors were considered: rotational speed, feed rate, and depth of cut. These factors were tested at varying levels—rotational speeds of 3000, 5500, and 8000 rpm; feed rates of 400, 600, and 800 mm/min; and depth of cut values of 0.2, 0.4, 0.6, and 0.8 mm. The evaluation of machinability relied on two key response parameters: surface roughness (Sa) determined from the milled surface and burr height measured on both sides using a roughness meter. The findings revealed a significant influence of milling parameters on both roughness and burr formation. However, the ideal conditions for minimizing roughness and reducing burr formation did not align. Furthermore, a comparative analysis was conducted between these results and the machinability of PETG under similar conditions.

1. Introduction

Additive Manufacturing (AM), also known as 3D printing, is a well-established technology gaining an ever-rising interest in several industrial branches ranging from automotive to aerospace, civil, and biomedical engineering [1,2,3]. Compared to conventional manufacturing processes, AM is able to produce intricately shaped parts at a cost-effective rate, facilitate swift processes, allow rapid prototyping, and diminish scrap production [4]. Therefore, several AM techniques, differing in both the methodology and the material employed for manufacturing, have been proposed, including Fused Deposition Modeling (FDM), Direct Metal Deposition (DRM), Selective Laser Sintering (SLS), Ink Jet Modeling (IJM), and stereo-lithography (SLA).
Nowadays, Polylactic Acid (PLA) and Acrylonitrile Butadiene Styrene (ABS) are among the most widely employed thermoplastic materials for 3D printing, although polyethylene terephthalate glycol (PETG) is receiving increasing attention. Synthesized from the co-polymerization of PolyEthylene Terephthalate (PET) with cyclohexane-dimethanol, PETG provides relatively high machinability and impact resistance, a higher toughness and ductility than conventional thermoplastics, which result in an increased tensile modulus and strength [5]. Moreover, PETG exhibits high transparency [6] and resistance to crystallization when exposed to high heat levels [7], good hydrophobic properties and hygrothermal aging resistance [8,9], high photostability, and a high glass transition temperature [10], making it a viable material for a wide range of industrial applications, especially biomedical and clinical applications. Kim et al. studied the fatigue behavior of 3D printed PETG, developing a theoretical method for predicting residual fatigue life [11].
Among the proposed 3D printing technologies, Fused Deposition Modeling (FDM), also named Fused Filament Fabrication (FFF), consists of melting a thermoplastic filament, which is subsequently extruded and selectively layered to create a three-dimensional object. However, due to the layer-by-layer printing process, the bonding between layers (interlayer bonding) tends to be inherently weaker than that within the material itself. The resulting material anisotropy may significantly limit the application of 3D printed components in critical applications. Hence, extensive research has been devoted to characterizing the mechanical properties of FDM 3D printed components and structures [12,13,14,15], which highly depend on the employed process variables. In this regard, Durgashyam et al. [16] evaluated the influence of several printing parameters, i.e., infill density, feed rate, and layer thickness, on the tensile and flexural strength of 3D printed PETG samples. The authors found that higher flexural performance was achieved when the layer thickness and the feed rate were set at the minimum level. Furthermore, improved tensile properties were achieved by combining a high percentile of infill density with a low layer thickness and feed rate. Similarly, Kumar and co-workers [8] investigated the effect of three process parameters, namely, print speed, layer height, and infill density, on the tensile and flexural strength of PETG samples. The experimental results showed that layer height and infill density predominantly affect the flexural strength, while the print speed and infill density most affect the hardness and the tensile strength of 3D printed samples.
Besides the mechanical properties, printing parameters were also found to significantly influence surface quality [17,18,19]. Barrios and Romero [20] investigated the influence of several printing parameters on the surface quality of 3D printed PETG samples, highlighting the significant impact of flow rate and print acceleration. Later on, Vidakis and co-workers [19] employed a variance analysis and a reduced quadratic regression model to further assess the influence of six printing parameters, i.e., raster deposition angle, infill density, nozzle temperature, bed temperature, printing speed, and layer thickness, on three critical quality indicators (i.e., surface roughness, dimensional deviation, and porosity) and provide predictive models to optimize the desired response parameter.
These findings point out the limitations of FDM technology, which, while enabling intricate designs, often falls short in terms of surface finish, dimensional tolerance, mechanical properties, and machinability. The surface quality of FDM is inferior when compared to that of other 3D printing processes [21]. In a study by Kadhum et al., the influence of infill patterns on roughness was investigated, with the best condition identified as a quarter cubic pattern, yielding an Ra value of 4.8 μm [22]. Mat et al. [23] explored the impact of layer thickness and infill design on PETG samples. They discovered that the lowest roughness (4.2 μm) was achieved at the highest infill density and lowest layer thickness. Adding 15% carbon fiber to PETG improved its surface properties by 32.7%, reducing roughness from 6.34 to 4.01 μm, according to the study by Hadeeyah et al. [24]. Some authors studied the effects of process parameters on the dimensional accuracy of FDM 3D printed samples using various materials, showing acceptable dimensional accuracy [25,26,27,28].
In order to address these issues, several post-printing solutions have been proposed, such as applying post-processing heat treatment [29], hot cutter, milling, and acetone vapor bath [1,21,30,31,32]. Among them, the potential of CNC milling to refine 3D printed samples has been widely exploited, especially in 3D printed carbon fiber-reinforced polymer (CFRP) composites [33]. Table 1 shows the main milling parameters on 3D printed samples of different materials that are available in the literature. In this regard, Cococcetta et al. [34] investigated the surface finish, burr formation, and tool wear during the machining of 3D printed CFRP composites to take advantage of the chance to vary the fill geometry, fill density, and fiber orientation. The authors observed that post-process milling increased the surface quality of the inspected samples. In particular, a lower feed rate allowed part of the workpiece to adhere to the tool, causing tool wear and burr formation, which may be minimized through minimum quantity lubrication. Meanwhile, Guo et al. [35] performed an investigation on the dry milling of the exterior stepped surfaces of amorphous PEEK and CF/PEEK components, highlighting the influence of factors like raster angle on surface quality and demonstrating the co-dependency between the milling parameters (e.g., the raster angle and the layer thickness) and 3D-printing parameters (e.g., the depth of cut, the spindle speed, and the feed rate per tooth).
Despite the numerous studies on PLA and ABS components, only a few attempts have been made to assess whether a post-printing milling process is a viable solution to enhance the surface quality of 3D printed PETG and CF-PETG samples. Vallejo et al. [36] investigated CF-PETG machinability, finding that the layer thickness was mostly insignificant, except for in peripheral milling, while a higher layer thickness negatively impacted geometric properties.
This study focuses on the machinability of CF-PETG components and assesses the effects of milling parameters, i.e., rotational speed, feed rate, and depth of cut, on surface roughness and burr formation. In order to comprehensively capture their impact, different parameter configurations are considered. An Analysis of Variance (ANOVA) is performed to pinpoint the most influential parameter in the machining process. Additionally, the mechanical properties of the 3D printed components are assessed across three printing directions. Furthermore, a comparison is made between the achieved results and those obtained under similar conditions for unreinforced PETG. This comparative analysis highlights the performance and characteristics of both PETG and carbon fiber-reinforced PETG components, enriching the understanding of their distinctions.

2. Materials and Methods

This study compares the mechanical properties and machinability of two PETG filaments: a PETG infused with 20% short carbon fiber, referred to as CF-PETG, and an unreinforced PETG. Both materials were manufactured by Soitech (Bernin, France).
Samples were printed following the manufacturer’s guidelines, employing a Tronxy 5SA FDM printer equipped with a 0.4 mm extruder. Thus, while the extrusion temperature was set at 250 °C, the temperature of the printer bed, treated with a lacquer spray to enhance adhesion, was set at 70 °C. The project’s mesh and G-code files were generated using the open-source software FreeCAD (v. 0.17).
In order to evaluate the mechanical properties of the printed samples, room-temperature tensile tests were performed on a Galdabini Sun500 servo-electric machine equipped with a 5 kN load cell. Sample geometry and printing directions, shown in Figure 1, were defined in accordance with the UNE 116005:2012 standard [37], as the results achieved following its guidelines show superior repeatability to those achieved following alternative standards [38]. During testing, an HBM DD1 displacement transducer was mounted on the sample to measure its strain across a 50 mm gauge length. Each printing direction underwent three replications to ensure the robustness and reliability of the results.
Figure 2 shows the specimen designed for the machinability tests. In order to maximize the efficiency of the milling experiments, a Design of Experiments (DoE) approach incorporating a full factorial design that accounts for the three selected parameters was applied. The selected factors, i.e., rotational speed ( n ), feed rate ( V f ), and depth of cut ( a p ), are detailed in Table 2, for a total of 36 different conditions. These parameters were chosen after a thorough study of the available literature to determine a feasible range that could suit PETG material, despite the limited existing research on the milling of 3D printed PETG and CF-PETG (Table 1). Milling trials were conducted on a CNC3018 milling machine equipped with a commercial tool (Master 660C). The experiment was conducted in a random order to minimize the effects of uncontrolled external variables. Vectric Aspire software V11.5 was used as CAD-CAM software, and the GRBL control open-source controller was employed to perform the milling process. Throughout the milling process, experiments were conducted in MQL using mineral oil in water emulsion. One replicant was used for each milling condition.
Surface roughness was assessed by measuring a 3 × 4 mm2 area (shown in Figure 3a) at the center of the milled surface for each milling condition, using the Taylor Hobson Ultra 2 roughness tester, equipped with a 50 mm stylus. Subsequently, the gathered surface data underwent processing through Talymap Silver software (V4.1). The S a parameter, defined by Equation (1), was employed to characterize the surface quality (Figure 3b).
S a = 1 A A S ( x , y ) d x d y
To measure the burr height on both sides of each milled surface, three profile measurements were taken perpendicular to the milling direction, evenly spaced at 10 mm intervals, as shown in Figure 3a. The burr height measurements were processed in Matlab (version R2024a) using the least-squares method to establish a zero line, providing a reference level for precise evaluation, with the methodology described in [1]. Each measurement was divided into five zones: the non-milled surface zones were utilized to determine a regression line based on points lacking a burr, and the burr’s height was calculated by subtracting the coordinate of the highest point on the burr from the corresponding coordinate on the regression line.

3. Results

3.1. Mechanical Properties

Figure 4 displays the nominal stress–strain curves for the examined CF-PETG samples and unreinforced PETG. Using the recorded applied load and measured strain data, Young’s modulus ( E ), Ultimate Tensile Strength ( U T S ), and Elongation at Break ( A % ) were determined. These computed values are detailed in Table 3 alongside those for the unreinforced PETG for comparability.
The tensile test results for CF-PETG indicate varied mechanical properties across different printing directions. Among the examined orientations, the Y printing direction notably showed the highest mechanical properties. The X direction demonstrated mechanical properties similar to those of the Y direction, indicating its suitability for achieving desirable mechanical strength. Conversely, the Z direction exhibited inferior mechanical properties in comparison to both the X and Y directions. This disparity can be attributed to the inherent challenges associated with establishing robust interlayer bonding vertically. In FDM technology, building layers vertically poses difficulties in ensuring adequate adhesion and bonding, leading to the Z direction’s diminished mechanical attributes, including reduced strength, stiffness, and elongation at break. These findings align with those of prior research by other authors [39], validating the reliability of these conclusions across different studies.
Figure 5 presents three bar graphs comparing the mechanical properties of the 3D printed PETG and carbon fiber-reinforced PETG (PETG-Carbon) across three printing directions: X, Y, and Z. Figure 5a illustrates the Young’s modulus for both materials in each printing direction. CF-PETG consistently shows a higher Young’s Modulus than the unreinforced PETG, with the most significant difference observed in the Y direction. Conversely, PETG exhibits better performance in the X direction, while CF-PETG shows better mechanical properties in the Y direction. The results in the Z direction are similar for both materials. The second graph, presented in Figure 5b, displays the ultimate strength (MPa). Like the Young’s Modulus, CF-PETG has a higher ultimate strength in the X and Y directions, with the Y direction showing the greatest difference. The Z direction results are comparable for both materials. Figure 5c depicts elongation (%). In this case, the differences between the two materials are quite evident, with PETG exhibiting higher ductility in the X and Y directions. The Z direction shows the lowest elongation for both materials, a typical outcome due to the layer-by-layer printing process, which often leads to weaker interlayer bonding. This evidence may be linked to the microstructure of the sample printed in the Z direction, shown in Figure 6. It can be seen that the short carbon fibers lie within the filament in a plane orthogonal to the applied load. Thus, as they are not aligned with the load direction, fibers do not significantly contribute to the sample’s load-bearing capability.

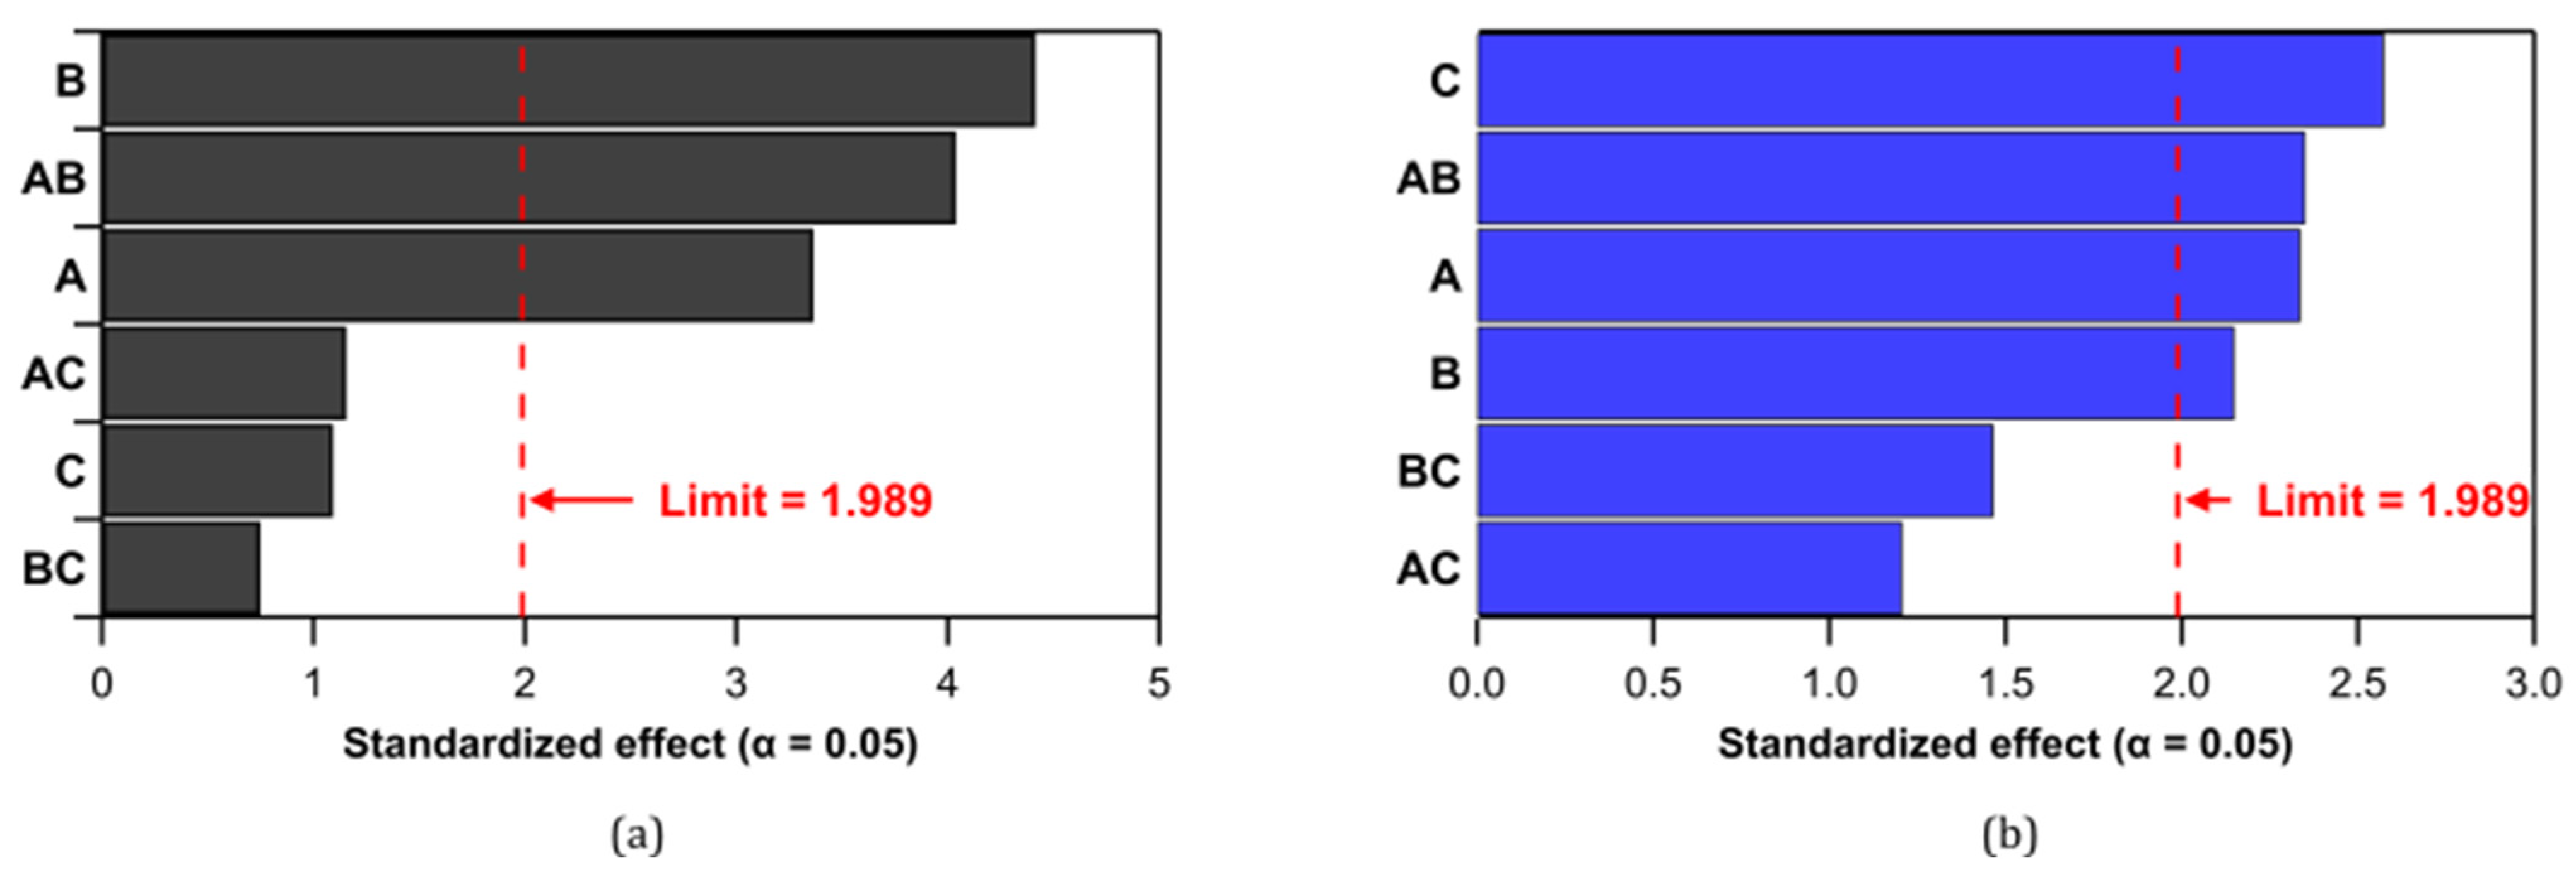
3.2. ANOVA Analysis of S a

The CF-PETG and PETG milled surface data, processed with Talymap Silver software, allowed us to obtain the S a parameter for each condition, as indicated above. The S a values for CF-PETG ranged from 3.04 µm to 7.65 µm, recorded under the conditions of 8000 rpm at a feed rate of 800 mm/min with a 0.2 mm depth of cut and 3000 rpm at a feed rate of 600 mm/min with a 0.6 mm depth of cut, respectively. In the study of the PETG data, surface roughness ( S a ) variability was observed within a range of 3.46 µm to 8.79 µm under the conditions of 5500 rpm, 400 mm/min, and 0.2 mm, and 5500 rpm, 800 mm/min, and 0.4 mm. These values were analyzed using Minitab software (v. 19) to assess the significance of the effect of each factor on surface quality, using a preset p-value threshold of 0.05 to determine statistical relevance. The Pareto plots of the Standardized Effects for the unreinforced PETG (Figure 7a) rank the parameters by their statistical significance. The plot reveals that rotational speed ( A ), feed rate ( B ), and depth of cut ( C ), along with their interactions, significantly affect the surface roughness, except for the combination of rotational speed and depth of cut ( A C ). Among these factors, the feed rate was found to have the most significant influence on the milling process. The chart in Figure 7b ranks the parameters by their statistical significance for CF-PETG, indicating that the rotational speed ( A ), feed rate ( B ), and depth of cut ( C ), along with their interaction ( A C ), significantly influence the response. Among these, the rotational speed was identified as having the most substantial impact on the process.
Figure 8a presents the main effect plot for surface roughness ( S a ), delineating the impact of various factors on the milled surface roughness of both PETG and CF-PETG. For PETG, the graph indicates that an increase in rotational speed results in decreased roughness, whereas an increased feed rate and depth of cut contribute to greater roughness. In the case of CF-PETG, the plot distinctly shows a decrease in roughness with higher rotational speeds, achieving the lowest roughness at a medium level. However, a rise in feed rate and depth of cut correlates with an increase in surface roughness, exhibiting a more linear relationship than for PETG.

3.3. Burr Height Response

Burr formation was evaluated on both sides of the milled surface, with each condition undergoing three measurements. The burr height response was analyzed using an ANOVA test, which took into account the mean values from both sides and included three replicates for accuracy. The outcomes of burr height are depicted in Figure 9.
The Pareto diagrams of the Standardized Effects depicted in Figure 9a show the results for the unreinforced PETG. It indicates that only three parameters have a statistically significant influence on the process. They are ranked in order of impact as follows: feed rate ( B ), the combination of feed rate and rotational speed ( A B ), and rotational speed ( A ).
In Figure 9b, the Pareto chart of the Standardized Effects shows the results for CF-PETG; four parameters are identified as having a statistically significant impact on the process, listed in order of their effect as follows: depth of cut ( C ), the interaction between feed rate and rotational speed ( A B ), rotational speed ( A ), and feed rate ( B ). Figure 8b, however, shows the main effect plot for burr height, illustrating the relationship between the process parameters and the range of burr heights observed. The plot reveals that, in the case of PETG, increasing all process parameters typically leads to a decrease in burr height. However, it is important to note that, at elevated feed rates and depths of cut, there is a slight increase in burr height. Similarly, for CF-PETG, an overall increase in the process parameters typically leads to a reduction in burr height. However, it is notable that, at the medium level of rotational speed, the minimum burr height is achieved, and at the second level of depth of cut, there is a slight increase in burr height.
In summary, within the studied range, reducing burr formation for CF-PETG necessitates operating at higher levels for each parameter, except for rotational speed, for which the minimum burr height is achieved at a medium level. Conversely, achieving a smoother surface involves milling at lower feed rates and depths of cut, coupled with medium rotational speeds. Hence, the optimal settings for minimizing burrs and refining surface roughness distinctly differ and exhibit an inverse relationship, except for the rotational speed. While diminishing burr formation calls for working at elevated parameter levels within the range studied, obtaining a smoother surface requires lower feed rates and depths of cut. Thus, striking a balance among these parameters is crucial to achieving desired outcomes for both burr formation and surface roughness in the machining process. For instance, aiming to enhance the surface quality of a 3D printed part necessitates lower feed rates and depths of cut. However, it is important to note that this condition tends to yield higher burr formation, potentially requiring an additional process to eliminate the burrs. This implication affects the overall process time, as lower V f and a p also mean reduced material removal per unit time, along with added time to remove burrs post-milling.

4. Discussion and Conclusions

The results indicate a pronounced impact of the milling parameters on the responses, with the optimal settings for minimizing surface roughness not coinciding with those for mitigating burr formation. A comparative evaluation of the machinability of standard PETG under analogous conditions further underscored the differential effects of carbon fibers on machining outcomes. This study on 3D printed PETG and CF-PETG yields several key findings, summarized as follows:
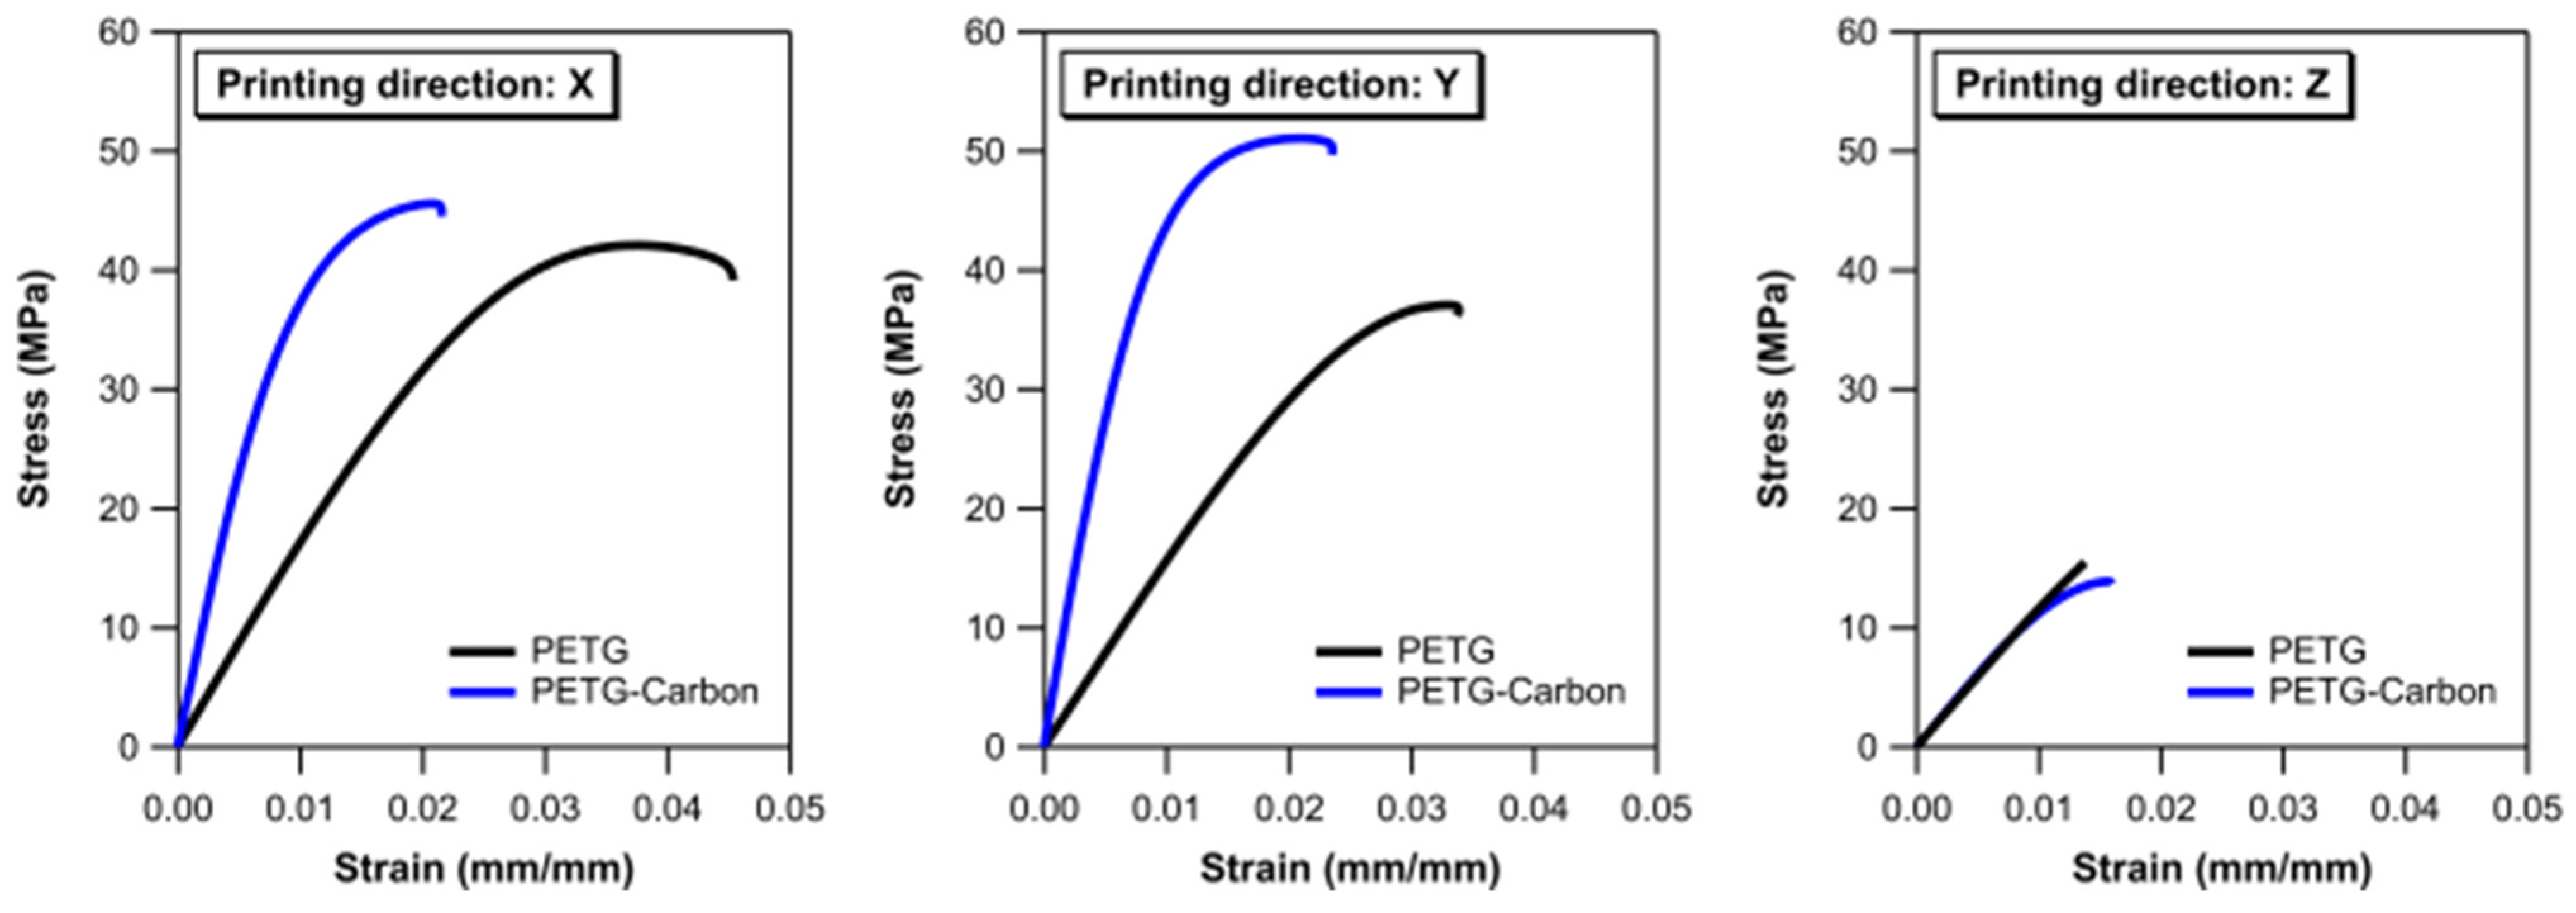
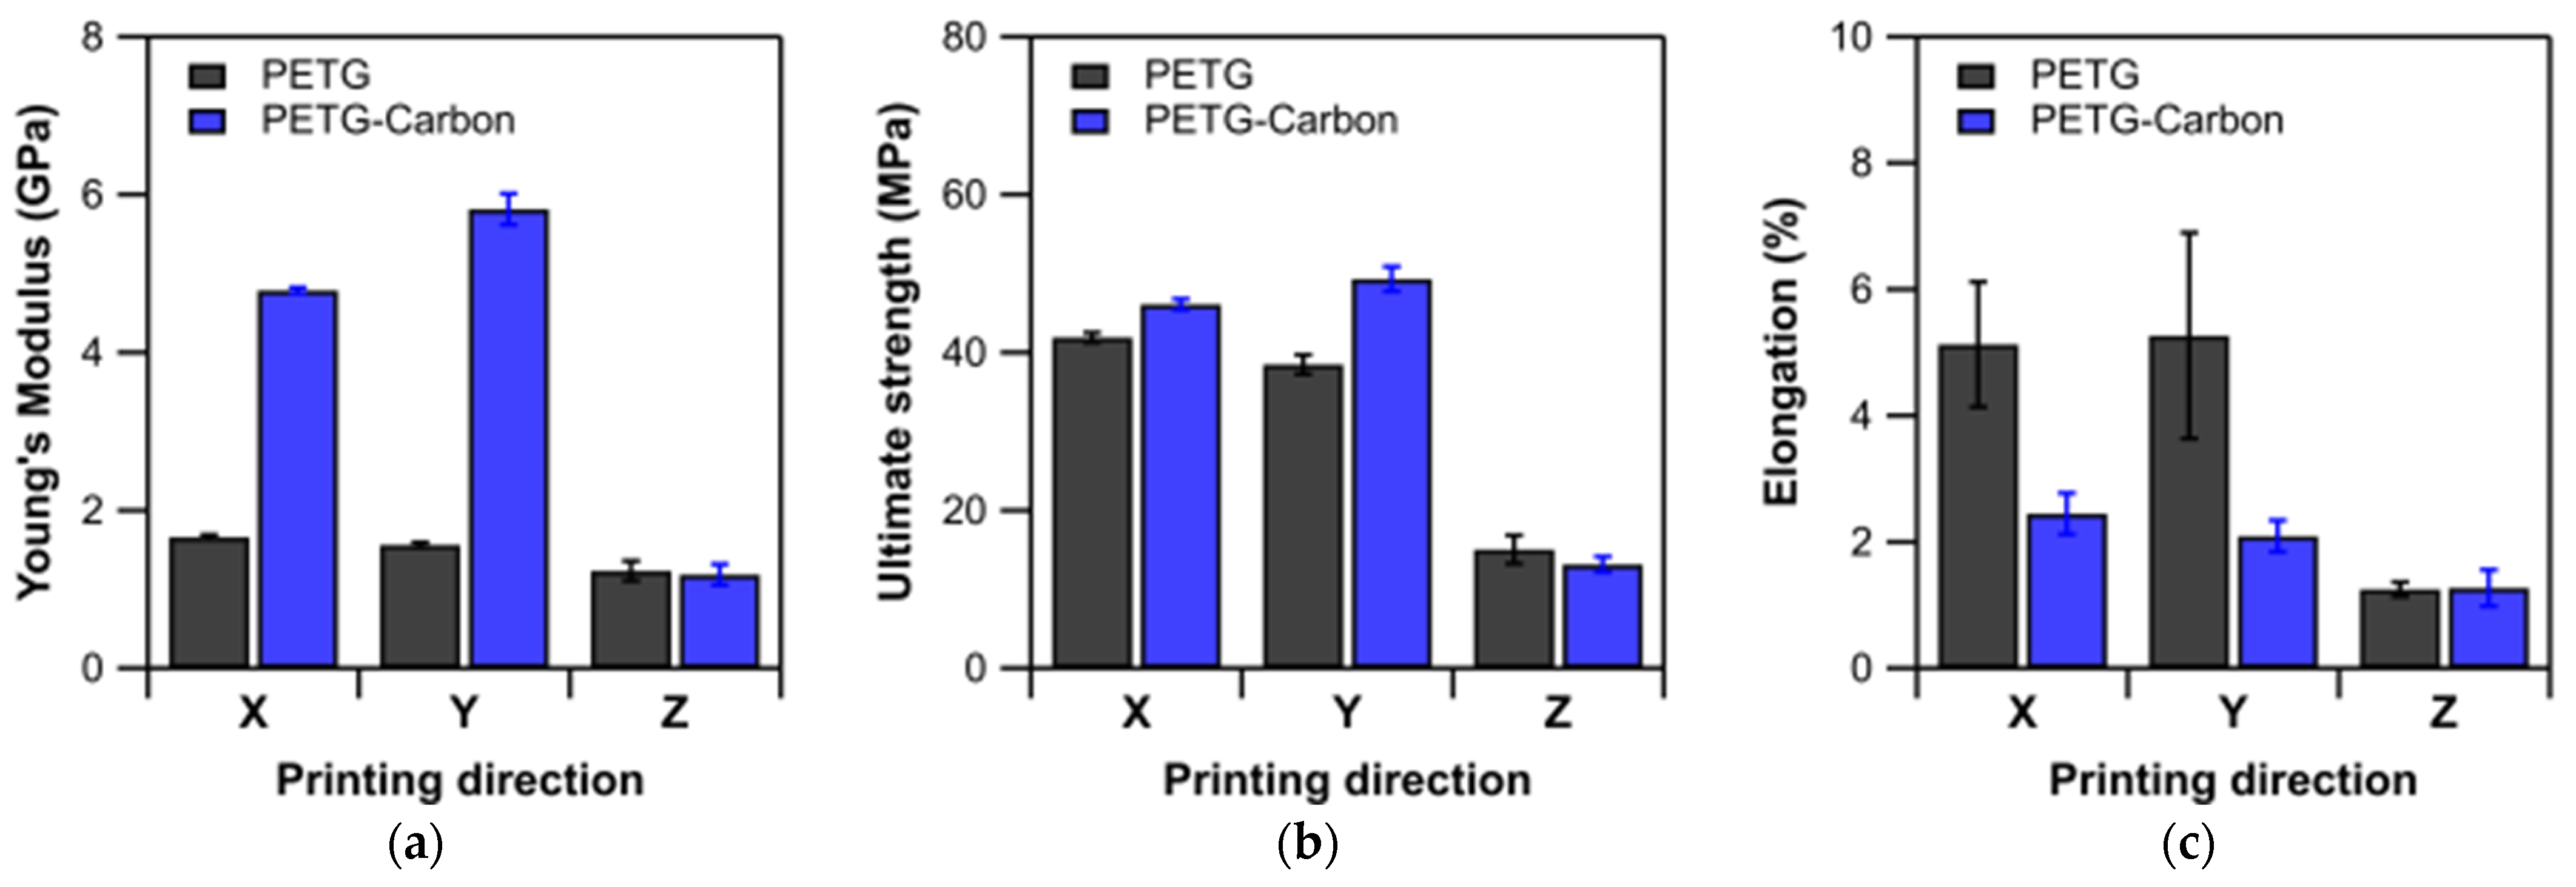
  • Mechanical properties: CF-PETG consistently exhibited a higher Young’s modulus in the X and Y printing directions compared to the unreinforced PETG and a comparable value in the Z direction. Among the CF-PETG samples, the most significant difference was observed in the samples printed along the Y direction, indicating superior stiffness in this orientation for CF-PETG. In contrast, PETG showed a higher E modulus in the X direction, suggesting directional variability in material properties. Similar to the Young’s Modulus, CF-PETG demonstrated a higher ultimate strength in the X and Y directions, with the Y direction showing the most notable disparity when compared with PETG. This finding implies that CF-PETG is mechanically stronger in these two directions. For both materials, the results in the Z direction were comparable, highlighting the uniformity in strength across the layering axis. The elongation data revealed pronounced differences between the two materials. PETG showed higher ductility in the X and Y directions. However, both materials exhibited the lowest elongation in the Z direction. This outcome is typical for layer-by-layer printed objects and is attributed to weaker interlayer bonding, which restricts elongation in this direction. The data suggest that the addition of carbon fibers to PETG significantly enhances its mechanical properties in terms of stiffness and strength, particularly in the X and Y directions. This enhancement makes CF-PETG a suitable material for applications where high structural rigidity and load-bearing capacity are required. However, for applications where a higher degree of deformation is necessary before failure, unreinforced PETG might be the preferable choice due to its higher ductility. These results are consistent with the findings reported in the existing literature by other researchers [40].
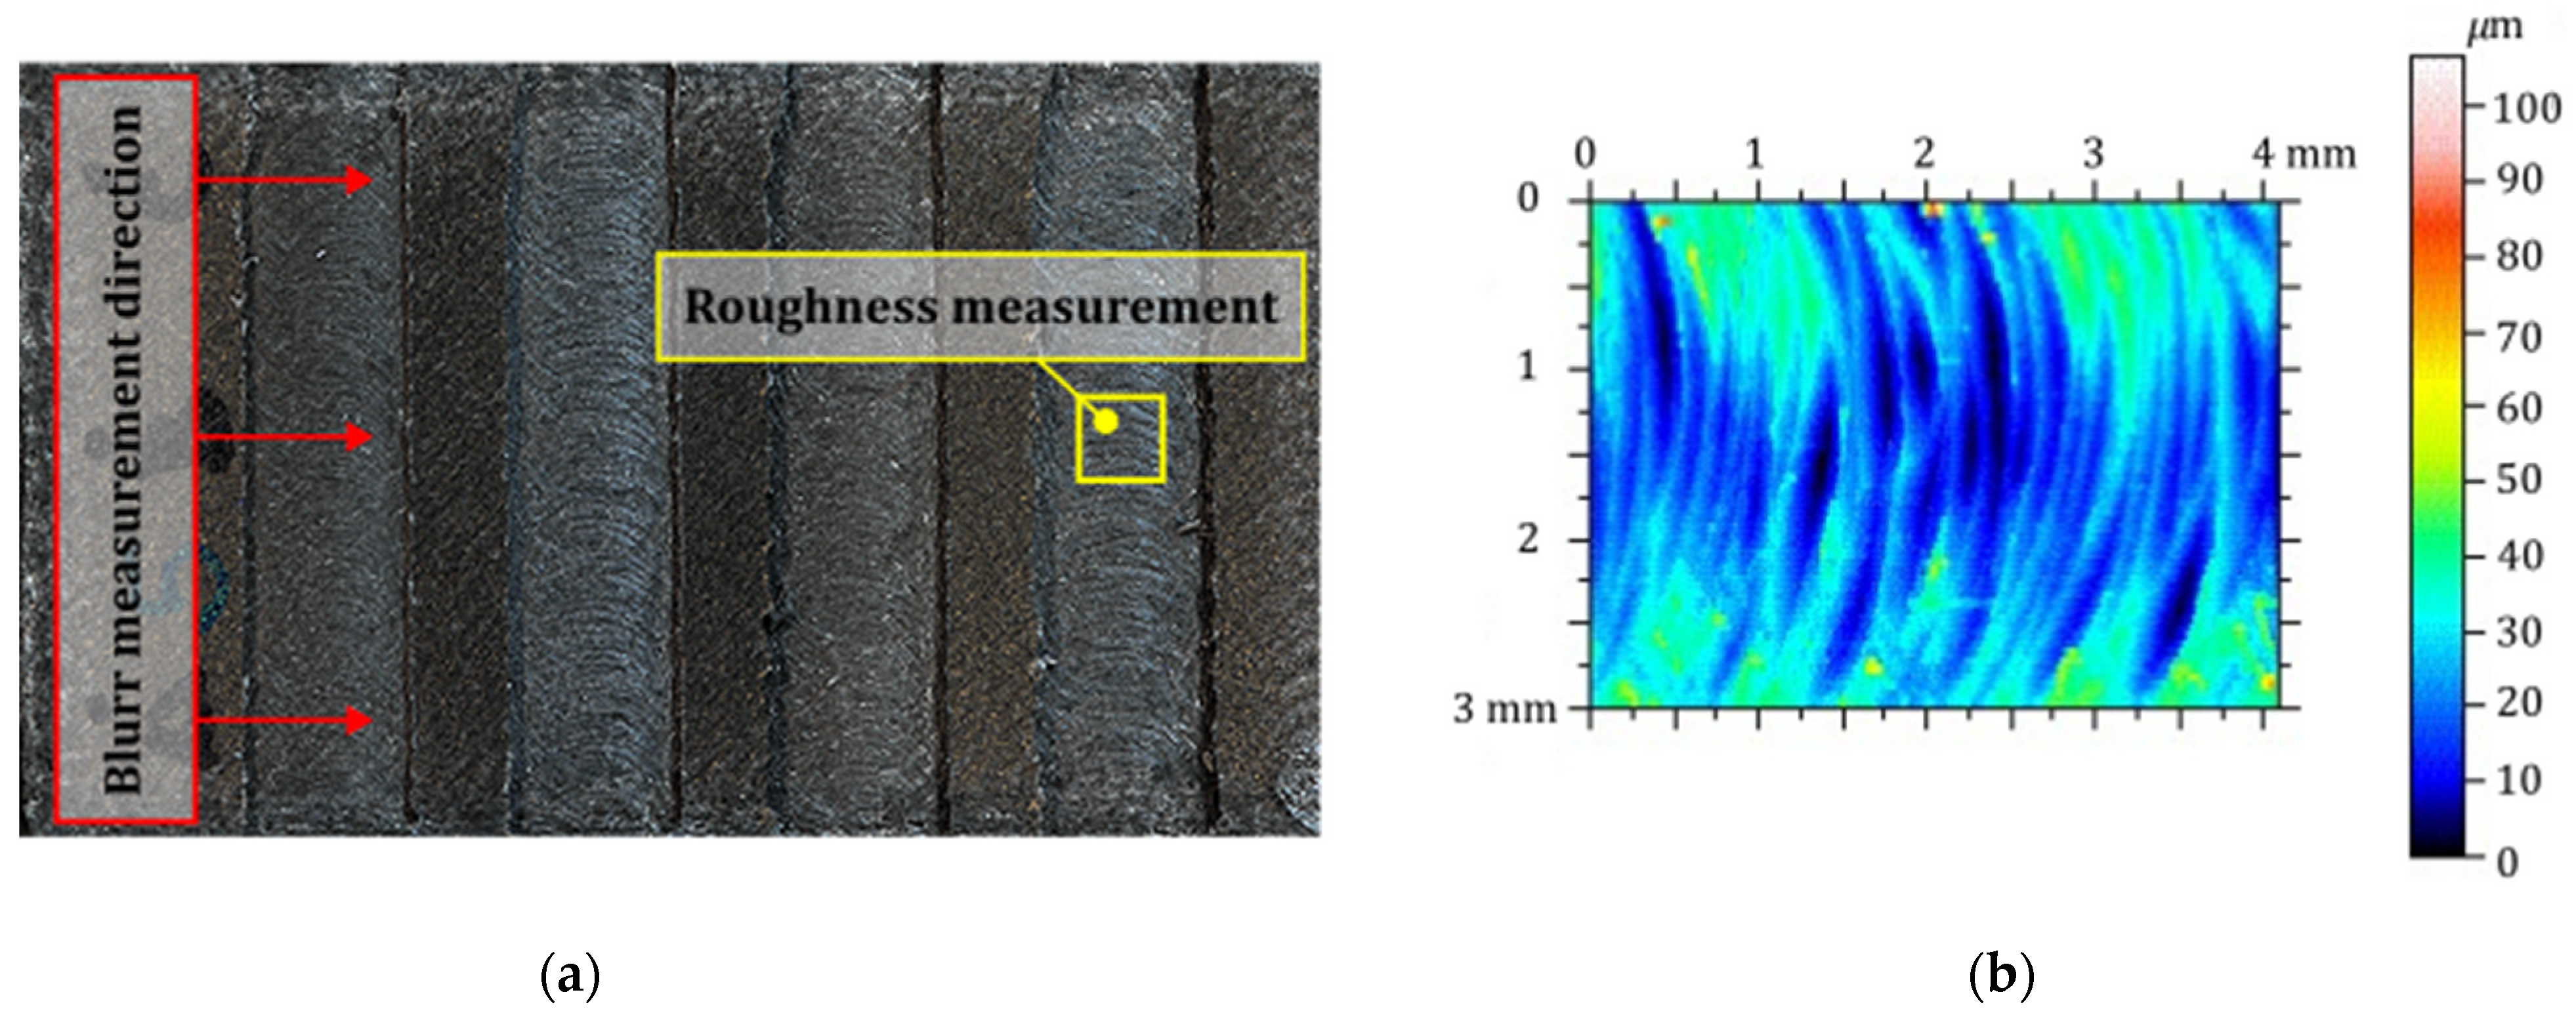
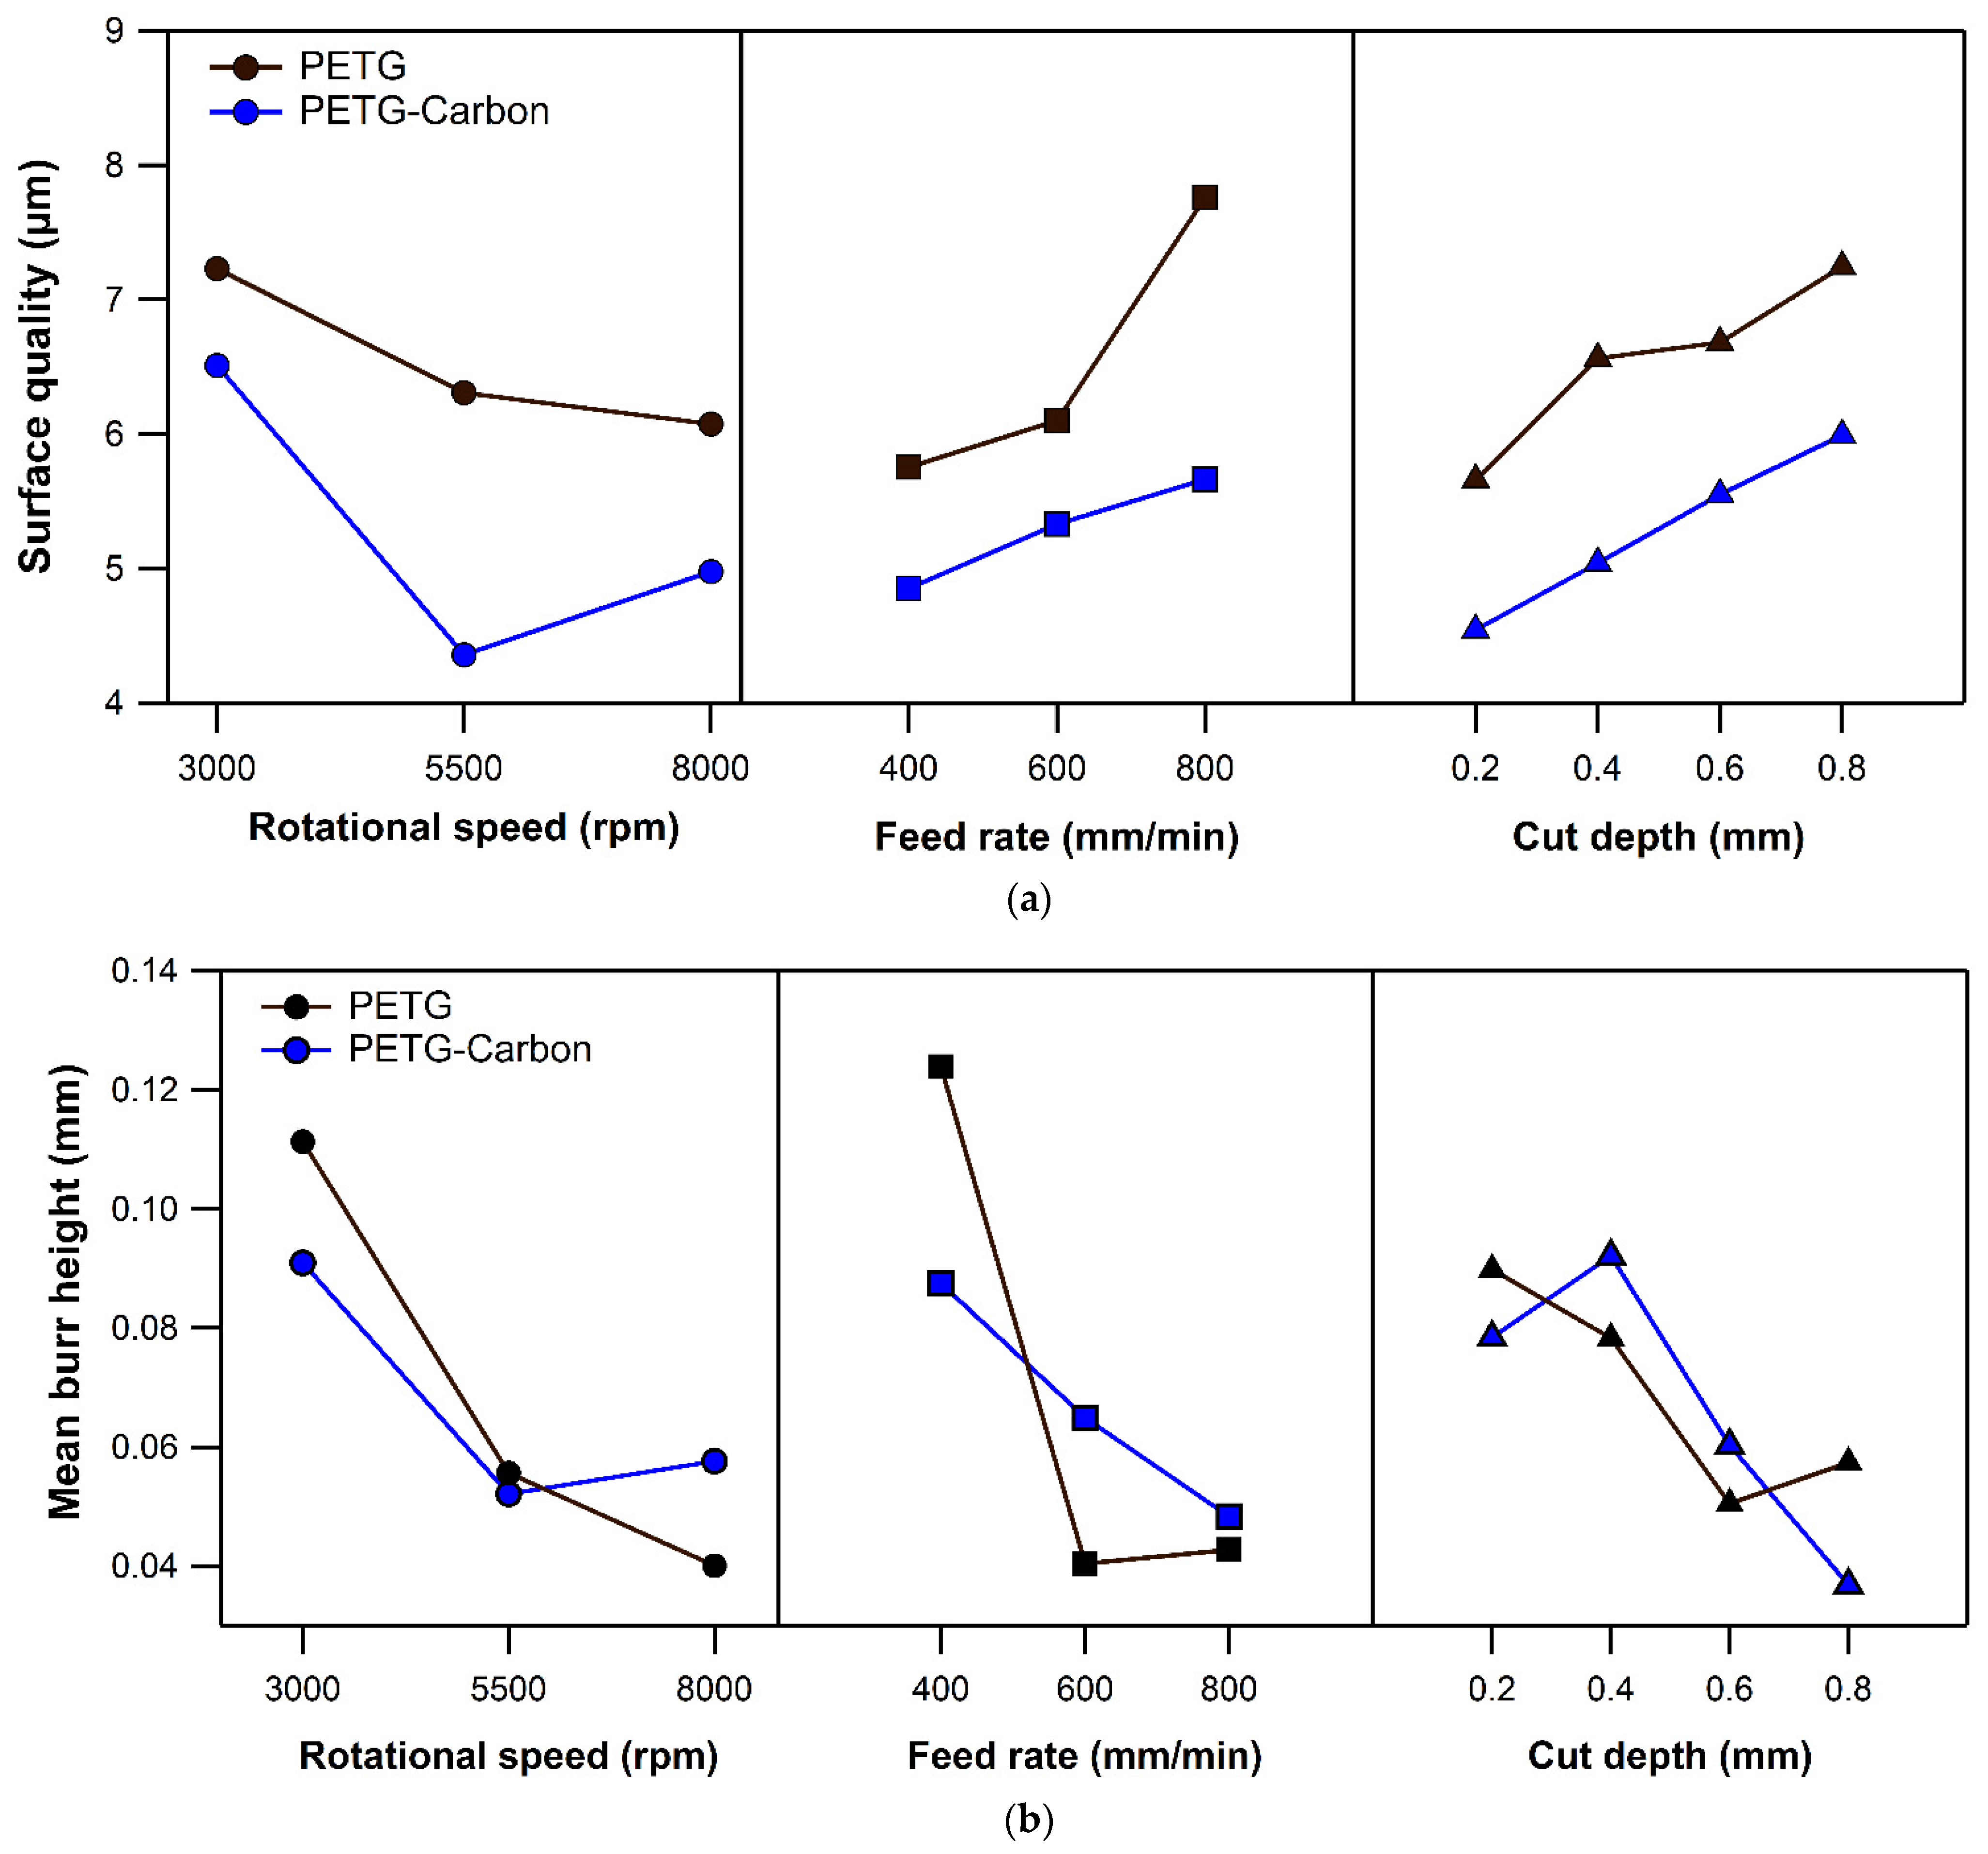
  • Roughness: Figure 8a presents a comparison of the machinability between PETG and CF-PETG in terms of surface roughness. The main effect plot in Figure 8a shows that incorporating carbon fibers into PETG consistently yields a lower surface roughness across all tested conditions. Notably, as the rotational speed increases from 3000 to 8000 rpm, CF-PETG exhibits decreased surface roughness, with the lowest roughness at the medium level. PETG, however, shows reduced roughness at the highest rotational speed. Roughness increases for both materials as the feed rate increases, but CF-PETG maintains a lower roughness at all feed rates, suggesting better performance under increased feed rates in terms of maintaining a smoother surface. Both materials experience increased surface roughness with a greater depth of cut; however, CF-PETG’s roughness remains lower at each depth of cut level. Nonetheless, CF-PETG consistently maintains a lower roughness compared to PETG in all the studied conditions, highlighting its ability to retain a smoother surface even at higher material removal rates. Overall, the main effect plot suggests that CF-PETG offers a machining advantage over PETG, with better surface finishes achievable under a broader range of machining conditions. This could be attributed to the enhanced material properties provided by the carbon fiber reinforcement, such as increased rigidity and thermal stability, which contribute to a more consistent cutting action and less material deformation during the machining process.
  • Burr height: Figure 8b illustrates the mean burr height of the 3D printed PETG and PETG reinforced with short carbon fibers (CF-PETG). Burr height, a critical quality attribute in machining and finishing, affects the fit and function of parts and, if necessary, must be removed with additional processing. Both materials show decreased burr height with increased rotational speed, but CF-PETG demonstrates a minimum burr height at a medium level and a consistently lower burr height compared to PETG, except for at the highest rotational speed. A higher feed rate generally leads to reduced burr height for both materials, with PETG showing a more pronounced decrease between lower and medium levels before stabilizing, and CF-PETG presenting a gradual, linear reduction. This behavior could result from the carbon fibers’ reinforcing effect, which might offer more cutting stability. Concerning depth of cut, burr height generally decreases for both materials but with distinct patterns. PETG’s burr height diminishes until 0.6 mm and then slightly rises, while CF-PETG experiences an initial increase in burr height from 0.2 to 0.4 mm before linearly decreasing with greater depths of cut. Overall, the data suggest that both PETG and CF-PETG exhibit similar tendencies in burr formation across the range of machining parameters. This indicates that the addition of carbon fibers to PETG does not significantly alter the material’s propensity for burr formation.
  • Optimal milling parameters and implications for manufacturing: The lower roughness of CF-PETG might be attributed to the carbon fibers reinforcing the material, promoting a smoother surface by providing uniformity and reducing deformation during milling. These fibers could also enhance the material’s structural stability, resisting surface irregularities during machining. Such data are invaluable for applications where surface finish is paramount, suggesting CF-PETG as the preferable material for achieving a finer surface quality. In terms of rotational speed, CF-PETG is optimal at 5500 rpm, showing reduced roughness and burr height, indicative of a cleaner cut and superior finishing surface. For PETG, a higher rotational speed is advisable to minimize both burr and roughness. CF-PETG is less sensitive to feed rate variations, maintaining lower roughness levels compared to PETG while showing comparable burr heights, albeit with inverse trends. Overall, CF-PETG exhibits preferable machining characteristics across all the studied parameters. It consistently achieves a lower surface roughness while also maintaining a burr formation comparable to that of PETG. This advantage enables the production of parts with superior quality, considering not only the improved surface finish but also the enhanced mechanical properties, and it represents an essential benefit for industries where both attributes are critical. Consequently, opting for 3D printed CF-PETG and then milling operations could be a strategic choice for manufacturers aiming to enhance both the quality and the efficiency of their production processes.
Achieving an optimal balance among rotational speed, feed rate, and depth of cut is crucial for the machining of 3D printed parts to optimize surface roughness and burr height. Lower feeds and shallower cuts can improve surface finish but may increase burr formation, requiring additional deburring processes. Such adjustments, while enhancing surface quality, could lower the material removal rate and prolong the total processing time due to the extra deburring step after machining. These conclusions highlight the potential of CF-PETG in enhancing the quality and efficiency of 3D printing applications, especially where surface finish and mechanical properties are critical.
These study results help find the optimal conditions for milling parameters to achieve not only the desired surface quality but also dimensional accuracy. Milling allows for precise material removal, which can correct dimensional inaccuracies introduced during the printing process. This is especially important for parts with tight tolerances. Milling can help remove excess material and layers from the surface of a 3D printed part, effectively smoothing rough surfaces caused by layering in FDM printing. This combination of processes holds promise across various industrial sectors such as the aerospace and automotive. It offers a cost-effective solution for producing functional prototypes or customized components. Furthermore, in sectors where timely repair and maintenance are crucial, this approach can facilitate the on-demand manufacturing of replacement parts, thereby minimizing downtime and inventory expenses.

Author Contributions

Conceptualization, M.E.M., M.C. and P.B.; investigation, G.L., P.B., R.E.M., M.C., M.E.M. and F.A.; writing—original draft preparation, G.L., P.B., R.E.M., M.C., M.E.M. and F.A.; writing—review and editing, G.L., M.C. and M.E.M. All authors have read and agreed to the published version of the manuscript.

Funding

This work was developed within the framework of the project eINS—Ecosystem of Innovation for Next Generation Sardinia (cod. ECS 00000038)—funded by the Italian Ministry for Research and Education (MUR) under the National Recovery and Resilience Plan (PNRR)-MISSION 4 COMPONENT 2, “From research to business” INVESTMENT 1.5, “Creation and strengthening of Ecosystems of innovation” and construction of “Territorial R&D Leaders”.

Data Availability Statement

The data presented in the paper are available upon request.

Conflicts of Interest

The authors declare no conflicts of interest.

References

  1. El Mehtedi, M.; Buonadonna, P.; Carta, M.; El Mohtadi, R.; Marongiu, G.; Loi, G.; Aymerich, F. Effects of milling parameters on roughness and burr formation in 3D-Printed PLA Components. Procedia Comput. Sci. 2023, 217, 1560–1569. [Google Scholar] [CrossRef]
  2. Boparai, K.S.; Singh, R.; Singh, H. Development of rapid tooling using Fused Deposition Modeling: A review. Rapid Prototyp. J. 2016, 22, 281–299. [Google Scholar] [CrossRef]
  3. Clini, P.; El Mehtedi, M.; Nespeca, R.; Ruggeri, L.; Raffaelli, E. A Digital Reconstruction Procedure from Laser Scanner Survey to 3d Printing: The Theoretical Model of the Arch of Trajan (Ancona). SCIRES-IT-Sci. Res. Inf. Technol. 2018, 7, 1–12. [Google Scholar] [CrossRef]
  4. Wang, X.; Jiang, M.; Zhou, Z.; Gou, J.; Hui, D. 3D Printing of Polymer Matrix Composites: A Review and Prospective. Compos. Part B Eng. 2017, 110, 442–458. [Google Scholar] [CrossRef]
  5. Guessasma, S.; Belhabib, S.; Nouri, H. Printability and Tensile Performance of 3D Printed Polyethylene Terephthalate Glycol Using Fused Deposition Modelling. Polymers 2019, 11, 1220. [Google Scholar] [CrossRef] [PubMed]
  6. Petrov, P.; Agzamova, D.; Pustovalov, V.; Zhikhareva, E.; Saprykin, B.; Chmutin, I.; Shmakova, N. Research into the Effect of the 3D-Printing Mode on Changing the Properties of PETG Transparent Plastic. In Proceedings of the ESAFORM 2021 24th International Conference on Material Forming, Liege, Belgium, 14–16 April 2021. [Google Scholar] [CrossRef]
  7. Tsai, H.-H.; Wu, S.-J.; Wu, Y.-D.; Hong, W.-Z. Feasibility Study on the Fused Filaments of Injection-Molding-Grade Poly(Ethylene Terephthalate) for 3D Printing. Polymers 2022, 14, 2276. [Google Scholar] [CrossRef] [PubMed]
  8. Moreno Nieto, D.; Alonso-García, M.; Pardo-Vicente, M.-A.; Rodríguez-Parada, L. Product Design by Additive Manufacturing for Water Environments: Study of Degradation and Absorption Behavior of PLA and PETG. Polymers 2021, 13, 1036. [Google Scholar] [CrossRef] [PubMed]
  9. Li, W.; Zhao, X.; Liu, Y.; Ouyang, Y.; Li, W.; Chen, D.; Ye, D. Hygrothermal aging Behavior and Flexural Property of Carbon Fiber-Reinforced Polyethylene Terephthalate Glycol Composites. Text. Res. J. 2023, 93, 1005–1018. [Google Scholar] [CrossRef]
  10. Brydson, J.A. Plastics Materials; Elsevier: Amsterdam, The Netherlands, 1999; ISBN 978-0-08-051408-6. [Google Scholar]
  11. Kim, H.S.; Huang, S. S-N Curve Characterisation for Composite Materials and Prediction of Remaining Fatigue Life Using Damage Function. J. Compos. Sci. 2021, 5, 76. [Google Scholar] [CrossRef]
  12. Mansour, M.; Tsongas, K.; Tzetzis, D.; Antoniadis, A. Mechanical and Dynamic Behavior of Fused Filament Fabrication 3D Printed Polyethylene Terephthalate Glycol Reinforced with Carbon Fibers. Polym.-Plast. Technol. Eng. 2018, 57, 1715–1725. [Google Scholar] [CrossRef]
  13. Rodríguez-Panes, A.; Claver, J.; Camacho, A. The Influence of Manufacturing Parameters on the Mechanical Behaviour of PLA and ABS Pieces Manufactured by FDM: A Comparative Analysis. Materials 2018, 11, 1333. [Google Scholar] [CrossRef] [PubMed]
  14. Vinyas, M.; Athul, S.J.; Harursampath, D.; Nguyen Thoi, T. Mechanical Characterization of the Poly Lactic Acid (PLA) Composites Prepared through the Fused Deposition Modelling Process. Mater. Res. Express 2019, 6, 105359. [Google Scholar] [CrossRef]
  15. Selvam, A.; Mayilswamy, S.; Whenish, R.; Velu, R.; Subramanian, B. Preparation and Evaluation of the Tensile Characteristics of Carbon Fiber Rod Reinforced 3D Printed Thermoplastic Composites. J. Compos. Sci. 2021, 5, 8. [Google Scholar] [CrossRef]
  16. Durgashyam, K.; Indra Reddy, M.; Balakrishna, A.; Satyanarayana, K. Experimental Investigation on Mechanical Properties of PETG Material Processed by Fused Deposition Modeling Method. Mater. Today Proc. 2019, 18, 2052–2059. [Google Scholar] [CrossRef]
  17. Kovan, V.; Tezel, T.; Topal, E.S.; Camurlu, H.E. Printing Parameters Effect on Surface Characteristics of 3D Printed PLA Materials. Mach. Technol. Mater. 2018, 12, 266–269. [Google Scholar]
  18. Vasudevarao, B.; Natarajan, D.P.; Henderson, M.; Razdan, A. Sensitivity of RP Surface Finish to Process Parameter Variation 251. 2000. Available online: https://repositories.lib.utexas.edu/items/649c6e91-1b20-4a36-8cb2-5350cda868be (accessed on 27 December 2023).
  19. Vidakis, N.; David, C.; Petousis, M.; Sagris, D.; Mountakis, N.; Moutsopoulou, A. The Effect of Six Key Process Control parameters on the Surface Roughness, Dimensional Accuracy, and Porosity in Material Extrusion 3D Printing of Polylactic Acid: Prediction Models and Optimization Supported by Robust Design Analysis. Adv. Ind. Manuf. Eng. 2022, 5, 100104. [Google Scholar] [CrossRef]
  20. Barrios, J.M.; Romero, P.E. Improvement of Surface Roughness and Hydrophobicity in PETG Parts Manufactured via Fused Deposition Modeling (FDM): An Application in 3D Printed Self–Cleaning Parts. Materials 2019, 12, 2499. [Google Scholar] [CrossRef] [PubMed]
  21. Lalegani Dezaki, M.; Mohd Ariffin, M.K.A.; Ismail, M.I.S. Effects of CNC Machining on Surface Roughness in Fused Deposition Modelling (FDM) Products. Materials 2020, 13, 2608. [Google Scholar] [CrossRef] [PubMed]
  22. Kadhum, A.H.; Al-Zubaidi, S.; Abdulkareem, S.S. Effect of the Infill Patterns on the Mechanical and Surface Characteristics of 3D Printing of PLA, PLA+ and PETG Materials. ChemEngineering 2023, 7, 46. [Google Scholar] [CrossRef]
  23. Mat, M.A.C.; Ramli, F.R.; Alkahari, M.R.; Sudin, M.N.; Abdollah, M.F.B.; Mat, S. Influence of Layer Thickness and Infill Design on the Surface Roughness of PLA, PETG and Metal Copper Materials. Proc. Mech. Eng. Res. Day 2020, 7, 64–66. [Google Scholar]
  24. Hadeeyah, A.; Jamhour, H.; Emhemed, I.; Alhadar, F.; Masmoudi, N.; Wali, M. The Impact Of Carbon Fiber on the Surface Properties of the 3D Printed PEGT Product. J. Pure Appl. Sci. 2023, 22, 23–27. [Google Scholar] [CrossRef]
  25. Tunçel, O. The Influence of the Raster Angle on the Dimensional Accuracy of FDM-Printed PLA, PETG, and ABS TENSILE specimens. Eur. Mech. Sci. 2024, 8, 11–18. [Google Scholar] [CrossRef]
  26. Bolat, Ç.; Ergene, B. An Investigation on Dimensional Accuracy of 3D Printed PLA, PET-G and ABS Samples with Different Layer Heights. Çukurova Üniversitesi Mühendislik Fakültesi Derg. 2022, 37, 449–458. [Google Scholar] [CrossRef]
  27. Alexopoulou, V.E.; Christodoulou, I.T.; Markopoulos, A.P. Effect of Printing Speed and Layer Height on Geometrical Accuracy of FDM-Printed Resolution Holes of PETG Artifacts. Eng. Proc. 2022, 24, 11. [Google Scholar] [CrossRef]
  28. Santana, L.; Lino Alves, J.; Da Costa Sabino Netto, A. Dimensional analysis of pla and petg parts built by open source extrusion-based 3d printing. In Proceedings of the 10° Congresso Brasileiro de Engenharia de Fabricação, São Carlos, SP, Brazil, 5–7 August 2019. [Google Scholar]
  29. Bhandari, S.; Lopez-Anido, R.A.; Gardner, D.J. Enhancing the Interlayer Tensile Strength of 3D Printed Short Carbon Fiber Reinforced PETG and PLA Composites via Annealing. Addit. Manuf. 2019, 30, 100922. [Google Scholar] [CrossRef]
  30. Pămărac, R.G.; Petruse, R.E. Study Regarding the Optimal Milling Parameters for Finishing 3D Printed Parts from ABS and PLA Materials. ACTA Univ. Cibiniensis 2018, 70, 66–72. [Google Scholar] [CrossRef]
  31. Pandey, P.M.; Reddy, N.V.; Dhande, S.G. Improvement of Surface Finish by Staircase Machining in Fused Deposition Modeling. J. Mater. Process. Technol. 2003, 132, 323–331. [Google Scholar] [CrossRef]
  32. Lalehpour, A.; Barari, A. Post processing for Fused Deposition Modeling Parts with Acetone Vapour Bath. IFAC-PapersOnLine 2016, 49, 42–48. [Google Scholar] [CrossRef]
  33. Altin Karataş, M.; Gökkaya, H. A Review on Machinability of Carbon Fiber Reinforced Polymer (CFRP) and Glass Fiber Reinforced Polymer (GFRP) Composite Materials. Def. Technol. 2018, 14, 318–326. [Google Scholar] [CrossRef]
  34. Cococcetta, N.M.; Pearl, D.; Jahan, M.P.; Ma, J. Investigating Surface Finish, Burr Formation, and Tool Wear during Machining of 3D Printed Carbon Fiber Reinforced Polymer Composite. J. Manuf. Process. 2020, 56, 1304–1316. [Google Scholar] [CrossRef]
  35. Guo, C.; Liu, X.; Liu, G. Surface Finishing of FDM-Fabricated Amorphous Polyetheretherketone and Its Carbon-Fiber-Reinforced Composite by Dry Milling. Polymers 2021, 13, 2175. [Google Scholar] [CrossRef] [PubMed]
  36. Vallejo, J.; García-Plaza, E.; Núñez, P.J.; Chacón, J.M.; Caminero, M.A.; Romero, A. Machinability Analysis of Carbon Fibre Reinforced PET-Glycol Composites Processed by Additive Manufacturing. Compos. Part A Appl. Sci. Manuf. 2023, 172, 107561. [Google Scholar] [CrossRef]
  37. Fabricación por Adición de Capas en Materiales Plásticos. Fabricación Aditiva. Preparación de Probetas. 2012. Available online: https://www.en-standard.eu/une-116005-2012-manufacturing-by-additive-of-caps-on-plastics-additive-manufacturing-preparation-of-test-pieces/ (accessed on 1 March 2024).
  38. García-Domínguez, A.; Claver, J.; Camacho, A.M.; Sebastián, M.A. Considerations on the Applicability of Test Methods for Mechanical Characterization of Materials Manufactured by FDM. Materials 2020, 13, 28. [Google Scholar] [CrossRef] [PubMed]
  39. Mahesh, V.; Joseph, A.S.; Mahesh, V.; Harursampath, D.; Vn, C. Investigation on the Mechanical Properties of Additively Manufactured PETG Composites Reinforced with OMMT Nanoclay and Carbon Fibers. Polym. Compos. 2021, 42, 2380–2395. [Google Scholar] [CrossRef]
  40. Kannan, S.; Ramamoorthy, M.; Sudhagar, P.E.; Gunji, B. Mechanical Characterization and Vibrational Analysis of 3D Printed PETG and PETG Reinforced with Short Carbon Fiber. In AIP Conference Proceedings; AIP Publishing: Melville, NY, USA, 2020; Volume 2270. [Google Scholar]
Figure 1. Geometry of the dog-bone samples used for the tensile strength tests (a) and printing direction used for tensile samples (b).
Jcs 08 00128 g001
Figure 2. Geometry of the samples used for CNC milling.
Jcs 08 00128 g002
Figure 3. (a) Machined sample showing the three measured burr directions, (b) example measurement of surface roughness Sa (in µm).
Jcs 08 00128 g003
Figure 4. Stress vs. engineering strain for CF-PETG test samples.
Jcs 08 00128 g004
Figure 5. Comparison between the mechanical properties of PETG and CF-PETG among different printing orientations: Young’s modulus (a), ultimate tensile strength (b), elongation (c).
Jcs 08 00128 g005
Figure 6. Microstructure of the 3D printed sample in Z direction: cross-section (a) and detail (b).
Jcs 08 00128 g006
Figure 7. Pareto chart of the Standardized Effects for surface quality ( S a ): PETG (a) and CF-PETG (b).
Jcs 08 00128 g007
Figure 8. Comparison of roughness (a) and burr height (b) main effect plots for PETG (black solid line) and CF-PETG (blue solid line). Different markers indicate the effect of each considered process parameters: circles for the rotational speed, squares for feed rate, and tringles for depth of cut.
Jcs 08 00128 g008
Figure 9. Pareto chart of the Standardized Effects for burr height: PETG (a) and CF-PETG (b).
Jcs 08 00128 g009
Table 1. Comparison of the main milling parameter ranges for 3D printed samples, as available in the literature.
Authors3D Printed MaterialsnVf
Lalelgani et al. [21]PLA3283–10,504 rpm1000 mm/min
Pamarac et al. [30]ABS3500 rpm35–840 mm/min
Pamarac et al. [30]PLA3500 rpm35–1880 mm/min
EL Mehtedi et al. [1]PLA3500–8000 rpm400–800 mm/min
Guo et al. [35]PEEK and CF-PEEK3000–12,500 rpm0.02–0.1 mm/teeth
Cococcetta et al. [34]Onyx and CF-Onyx6000 rpm600–1200 mm/min
Vallejo et al. [36]PETG and CF-PETG3500 rpm800 mm/min
Table 2. Summary of Design of Experiments factors.
FactorsLevels
NameTypeUnitsSymbols1234
Rotational speed ( n )Numeric[rpm]A300055008000-
Feed rate ( V f )Numeric[mm/min]B400600800-
Depth of cut ( a p )Numeric[mm]C0.20.40.60.8
Table 3. Mechanical properties of 3D printed PETG and CF-PETG under different printing orientations.
Young’s Modulus [MPa]Ultimate Strength [MPa]Elongation [%]
PETGCF-PETGPETGCF-PETGPETGCF-PETG
X1661.1 ± 30.44784.5 ± 37.241.9 ± 0.646.1 ± 0.75.1 ± 1.02.4 ± 0.35
Y1560.8 ± 34.15816.8 ± 197.938.5 ± 1.249.3 ± 1.65.3 ± 1.62.1 ± 0.31
Z1233.4 ± 126.21186.2 ± 133.715.0 ± 1.813.2 ± 1.01.3 ± 0.11.3 ± 0.34
Disclaimer/Publisher’s Note: The statements, opinions and data contained in all publications are solely those of the individual author(s) and contributor(s) and not of MDPI and/or the editor(s). MDPI and/or the editor(s) disclaim responsibility for any injury to people or property resulting from any ideas, methods, instructions or products referred to in the content.

