1. Introduction
The tensile testing of Material Extrusion (MEX) printed, or 3D printed specimens, to obtain material data has seen an increase in recent years due to the adoption of additive manufacturing practices as the technology developed to commercially viable standards. MEX Additive Manufacturing has the advantage of fabricating parts with complex geometry while eliminating most limitations related to specific traditional manufacturing methods, thus, allowing the elaboration of flexible designs [
1,
2]. One of the widely used techniques in additive manufacturing is MEX, which is considered as the most commercialized rapid prototyping technology currently available for printing complex geometry objects [
2,
3,
4]. A validation of this MEX additive manufacturing method for polymers requires a strength characteristics test to obtain material properties.
MEX printing has become one of the most reliable and popular additive manufacturing technologies that it is able to process thermoplastic polymers such as acrylonitrile butadiene styrene (ABS), polylactic acid (PLA), and nylon [
5,
6]. Several studies have been conducted on MEX 3D printed filament materials such as PLA and ABS, however, very limited studies conducted tests for the materials being investigated in this study.
Several studies in literature evaluated the tensile strength test through different printing parameters [
7,
8,
9]. Chacon et al. [
10] found that the tensile strength of specimens with a flat orientation varies significantly compared to the high tensile strength that occurred because of a small layer height. The authors conducted tests to investigate the influence of feed rate, build orientation, and layer height on the strength of PLA specimens fabricated with an MEX-based 3D printer. Aloyaydi et al. [
11] tested the strength of MEX printed specimens by means of a compression test and a low-velocity impact test to investigate the effect of infill patterns. The study found that the grid pattern has the highest compressive strength while the triangular pattern has higher impact energy. Wang et al. [
12] tested different printing parameters to test the mechanical properties of 3D-printed samples of PLA material and concluded that the height of the layer affects the layer bonding strength of 3D printed specimens. Faidallah et al. [
13] conducted tensile strength tests on 0°, 15°, and 90° polyethylene terephthalate glycol (PETG) and the results showed that side-orientated specimens (90°) have a larger tensile strength than the flat-orientated specimens (0°). The study also indicated that rectangular-shaped test specimens fared better than the dog-bone shape specimens, indicating that the shape of the stressed cross-sectional area influences the results.
Research conducted thus far shows that each study tends to focus on the effect of changing one variable such as the infill density, orientation, or filament material in isolation and not as a combination. In order to gain a holistic understanding for improved application during the design process and to fill the research gap, this study was conducted to provide greater detail as to what can occur when there are a variety of variables and test configurations. Some materials tested in this paper that are limited in the literature are Nylon 12, Nylon 12 Carbon Fiber (CF), ULTEM 1010, and ULTEM 9085. Thus, this research contributes to the body of knowledge through testing these various materials and providing a holistic test on the combination of its variables. The study will also be able to compare Nylon 12 with Nylon 12 CF filament, which contains chopped fibres embedded in the filament itself. This will allow for the determination of the effect the carbon fibres have on the material properties of Nylon 12.
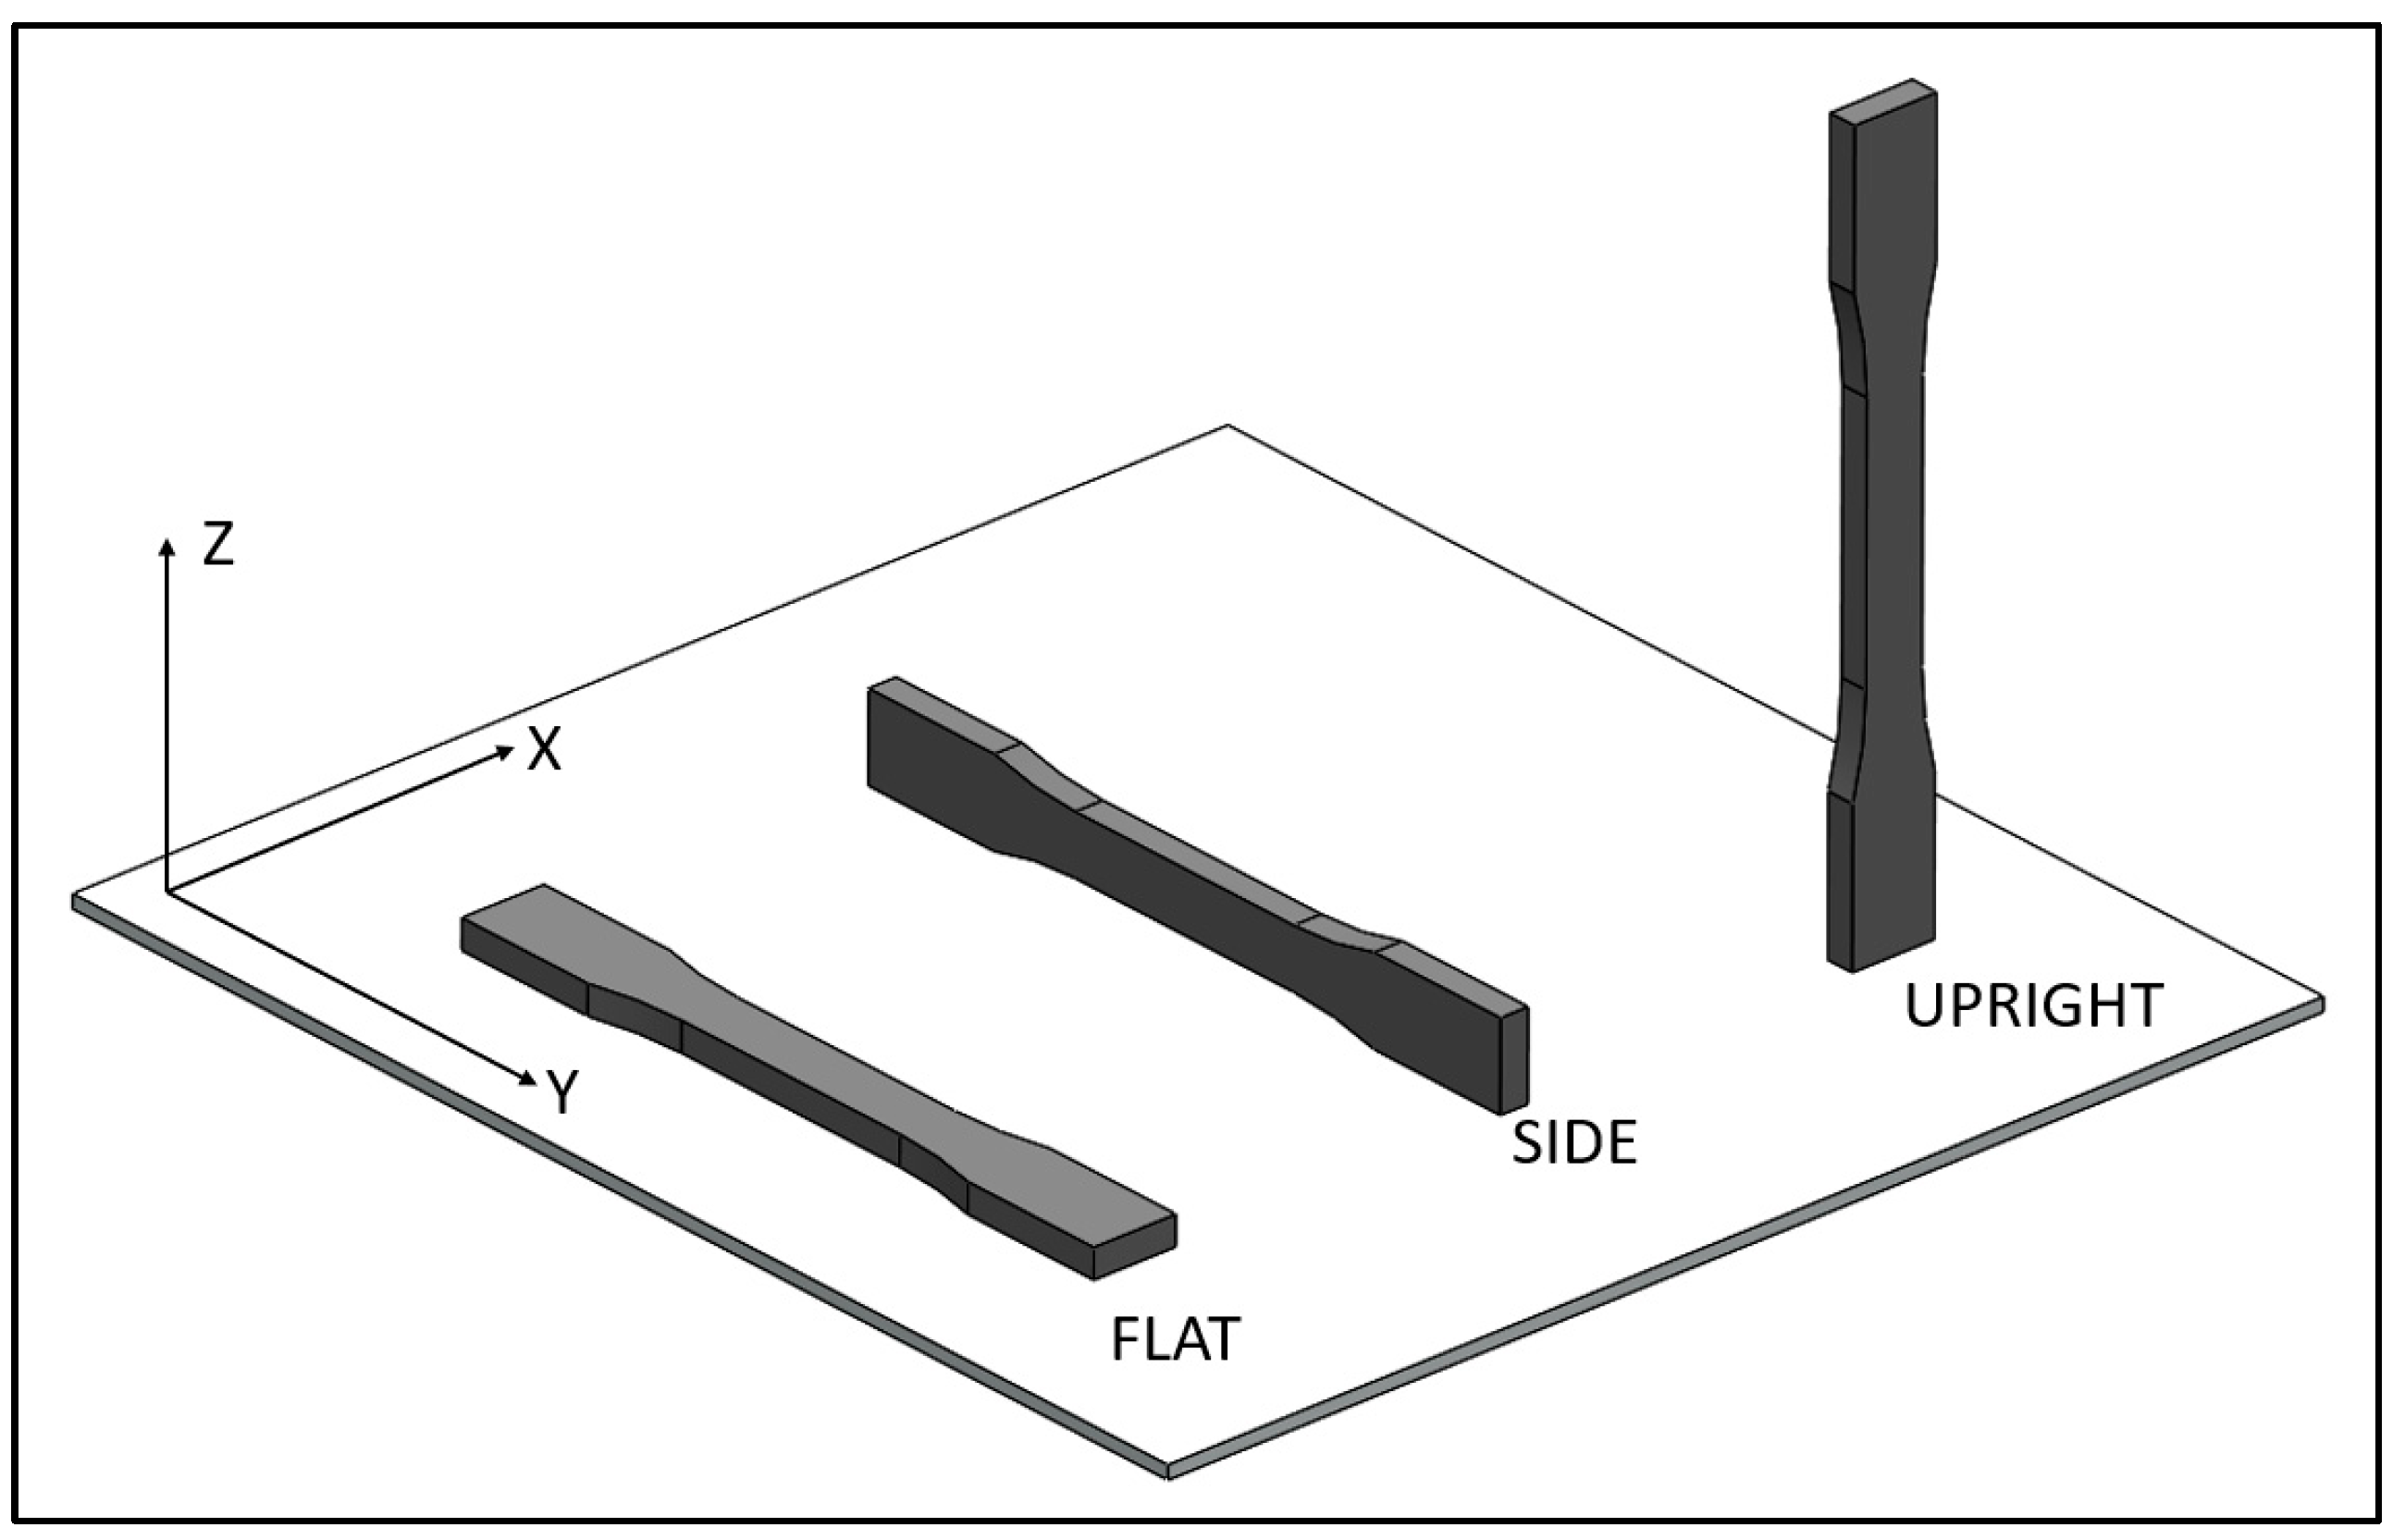
Therefore, the aim of the research was to investigate the effect of varying print orientations and infill densities on the mechanical properties of different 3D printer polymer specimens by conducting tensile tests. The objectives of this research included determining if the print direction makes a difference in the tensile strength of a dog-bone test sample and if printing a test sample with a lower percentage infill (sparse) makes a linear difference in the tensile strength of a dog-bone test sample.
4. Discussion
The research referenced the ASTM D638 standard [
14] as the guideline document through which the tests were conducted and the data were analysed. The standard also draws attention to the results necessary for reporting, which are the Young’s Modulus, tensile strength and strain. These data are prominently seen in the literature and can be considered the dependent variables, with the changes investigated being the independent variables.
The tensile tests conducted investigated these material properties, which define the material behaviours. Ten specimens for each test specimen configuration were printed on the Stratasys Fortus 900mc MEX printer and tested according to the ASTM D638 standard [
14]. The data were organized and analysed to understand the effect that the varying infill densities and orientations had on the material properties.
In terms of the infill density, it was found that the solid infill almost always outperformed the sparse infill specimens. However, for certain upright specimens, the sparse infill samples often had higher strain with only a marginally smaller UTS and yield strength, meaning that these specimens were more ductile and possibly tougher than the solid infill variants. Furthermore, with regards to the strain data, it was observed that many of the sparse infill specimens had either marginally smaller, equal, or larger strain values than the solid infill specimens for all specimen configurations. This was not expected but conforms to the notion that higher UTS polymer specimens are stronger and more brittle, hence the lower strain values. The material behaviour of the nylons and ULTEM materials concur with the polymer composition properties highlighted in the textbook by A W Birley et al. [
20].
The upright specimens displayed behaviour that is indicative of the infill percentage disparity between the different specimens. It is known that the strength of the upright specimens is related to the force being applied perpendicular to the print plane. This therefore results in the force being counteracted by the strength of the adhesion of the bond between layers during the deposition of the filament during the printing of the test specimen. This adhesive force is not nearly as strong as the force of the uniform strand of the filament and thus would fail at much lower stresses as compared to flat and side specimens, which have the applied force parallel to the direction of the print plane. The higher strain values obtained with sparse upright specimens as compared to the solid upright specimens correlate with the expected failure modes of polymers. As stated in the textbook by Smith and Hashemi [
21], polymers fail in brittle modes below the glass transition temperature.
The solid specimens have more surface area due to the 100% infill and thus more adhesion between layers to counteract the applied force. Therefore, it should be stronger and more brittle, failing with a lower strain rate. The sparse upright specimens failed with an expected lower stress. However, it was not directly proportionally linked to the infill percentage, i.e., the 50% infill did not fail at half the stress at which the 100% infill failed. The unexpected result was that the failure was at a value closer to that of the 100% infill specimens. This indicates that the adhesive force reaches a point of saturation with regards to the area percentage. This means that adding additional cross-sectional area will not necessarily add a significant strength and will reduce the ductile behaviour of the component. Therefore, the high strain rate of the sparse upright specimens shows it can withstand a slightly lower load with larger elongation. This may be a point to consider throughout the design and development process when using 3D printed components.
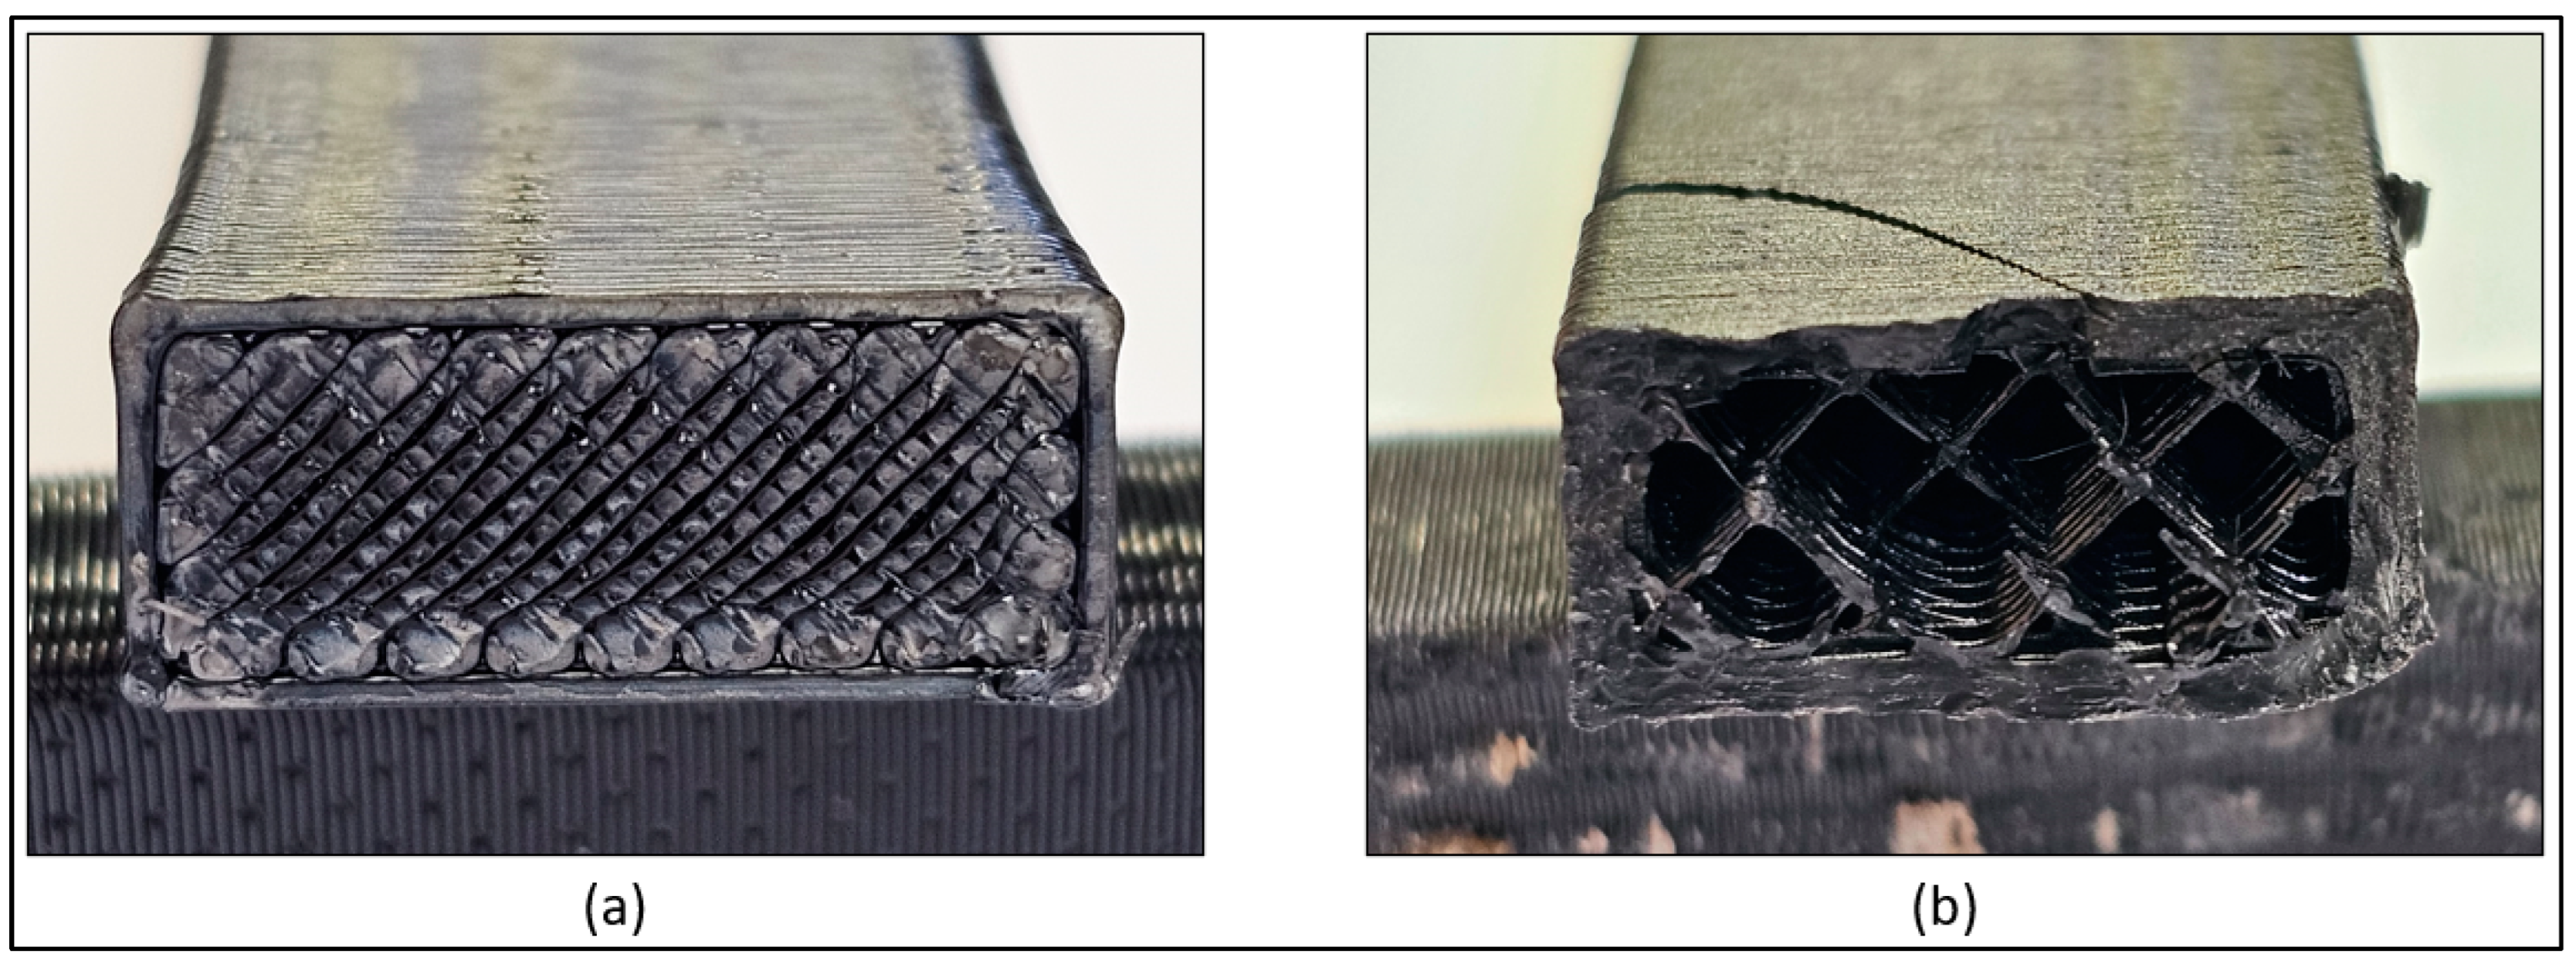
Figure 5 displays the fracture cross-sectional area of solid and sparse Nylon 12 upright specimens. The solid upright specimen displays a clean break indicative of the delamination failure common in 3D printed components whilst the sparse upright specimen shows a more traditional tensile specimen fracture. Delamination failure represents a more brittle fracture, which therefore explains the discrepancies in the strain rates between the solid and sparse upright specimens. This indicates that the additional material in the solid upright specimens meant that the material strength was stronger than the delaminating force. The sparse specimen had lesser material and thus could not withstand as high a load before resulting in delamination failure, and hence the failure is due to the material.
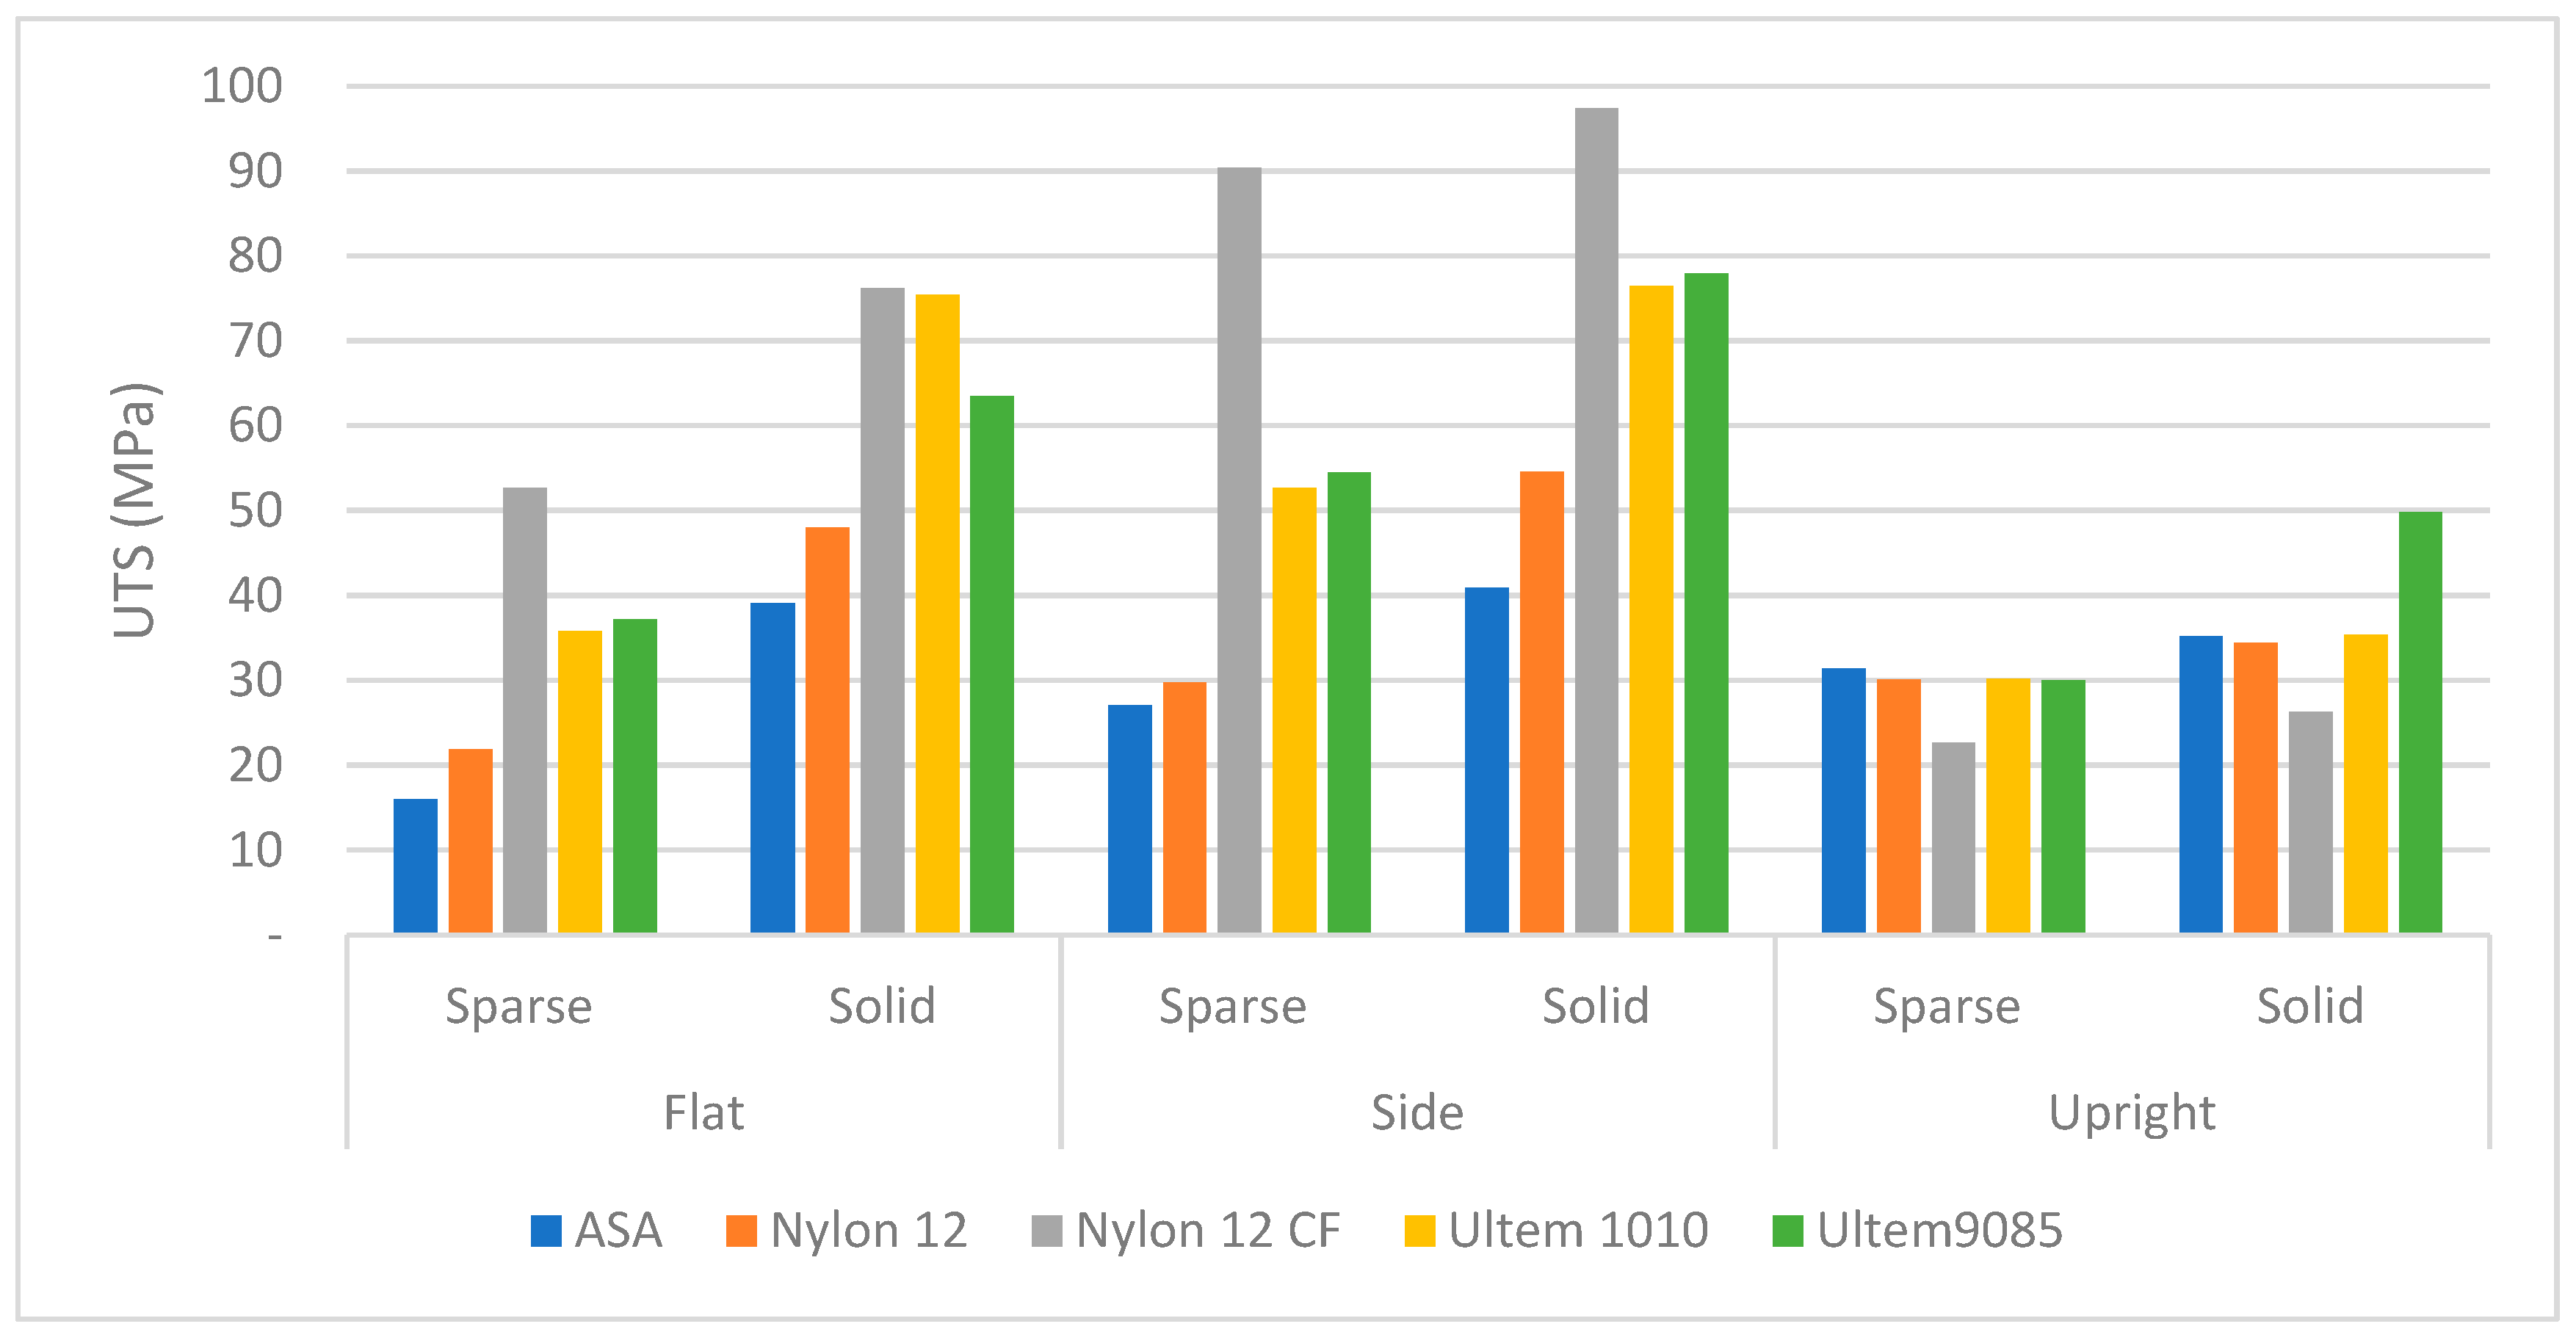
With regards to the print orientation, the side-orientated specimens were seen to have the best material properties, followed by the flat specimens, and the upright specimens had the lowest performance, which was expected as the applied load was perpendicular to the planes on which its layers were printed. However, what was not expected was the discernible difference in the performance of the side- and flat-orientated specimens, given that the load applied was parallel to the planes on which it was printed. The initial expectations were that these orientations should have no discernible difference in performance. However, the results show otherwise. A postulated theory is that the area at which fracture (the neck region) occurs undergoes compressive stresses as well when subjected to the tensile load. Side specimens have more layers perpendicular to that stress whereas flat specimens have layers parallel to that stress. This could be the reason for the discrepancy in the results; however, this is only speculation for now and should be investigated further with other tests in future work.
Additional evidence for this theory can be seen in
Figure 6 and
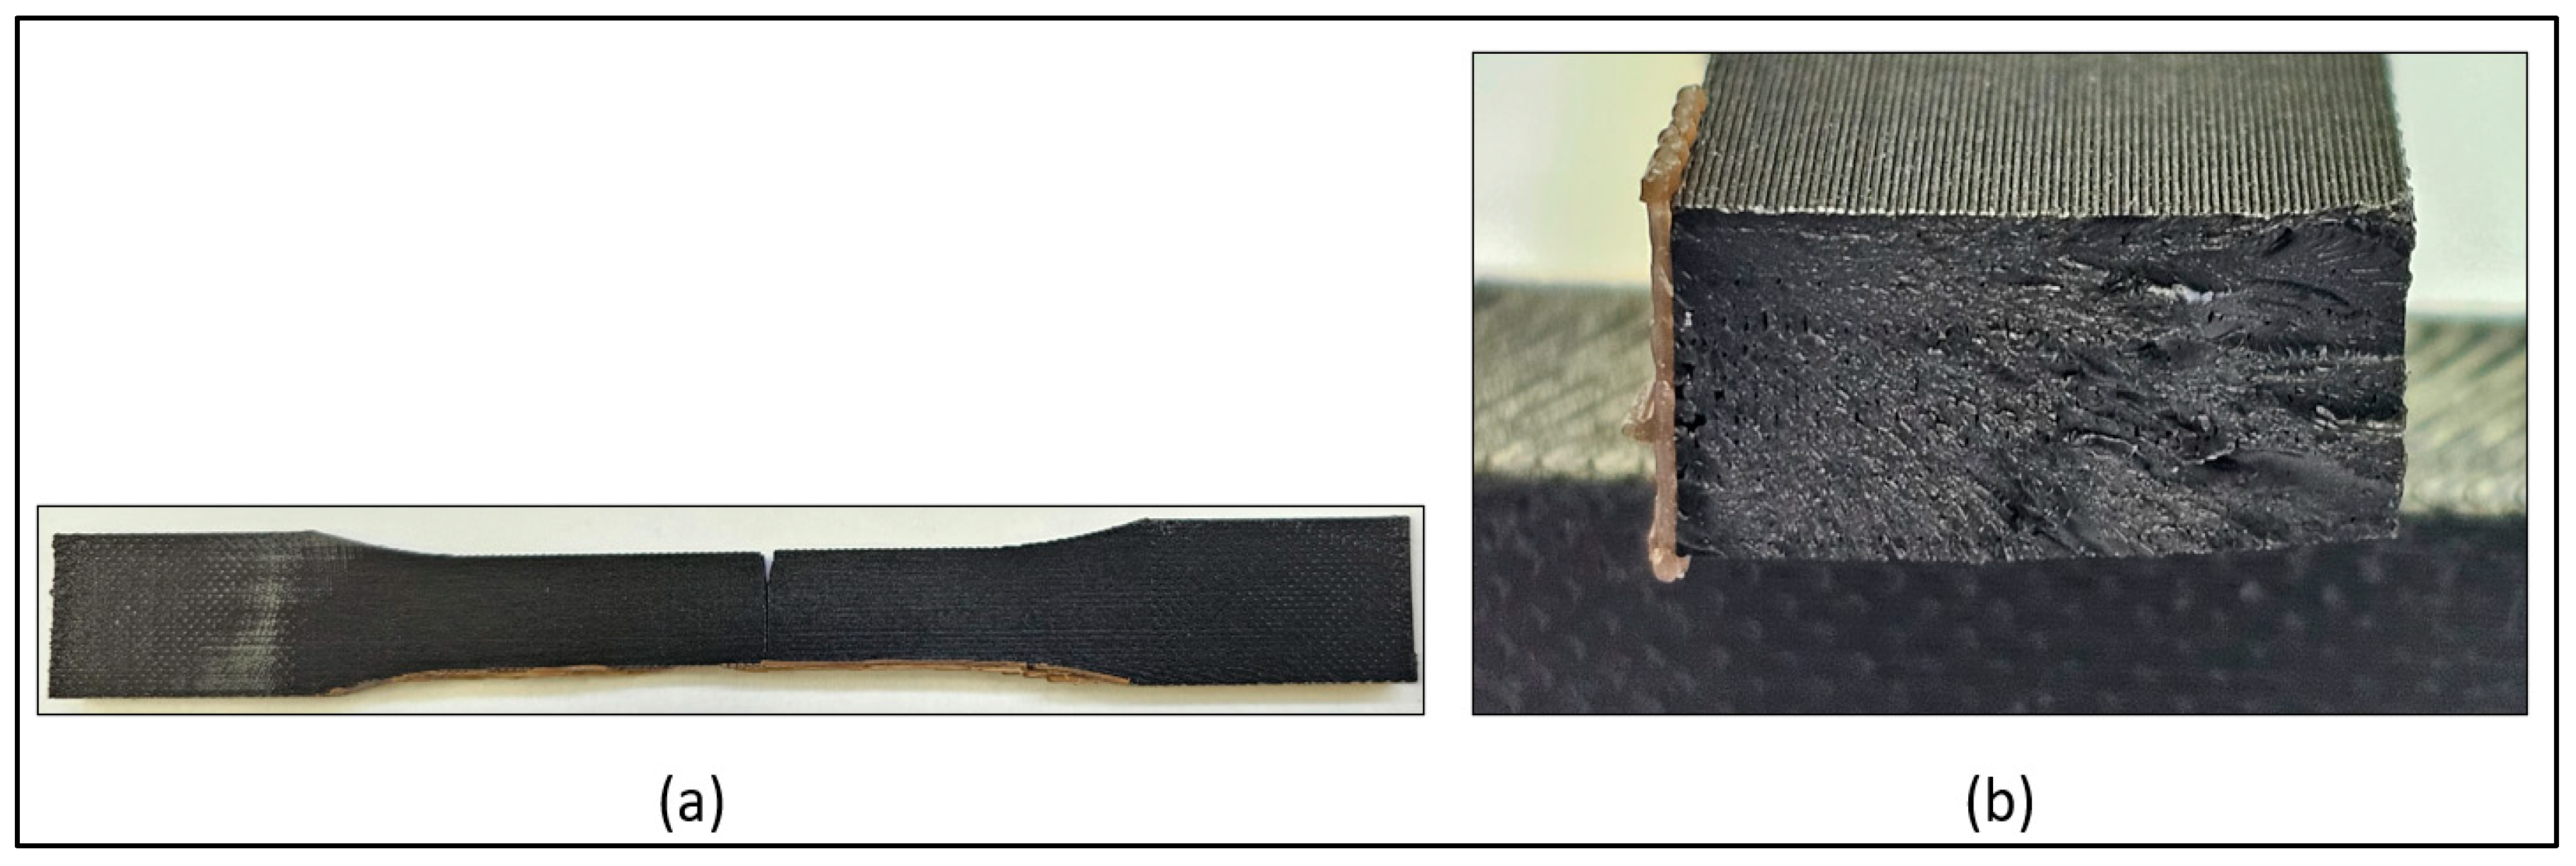
Figure 7. The images contrast Nylon 12 flat solid and side solid samples. The flat-orientated sample clearly demonstrates a more significant crack propagation growth and failure than the side-orientated sample. This supports the theory that the side samples can resist the crack propagation much better than the flat samples. This is particularly evident with the Nylon 12 samples as this material had the largest strain at break compared to the other materials tested. This material was the most ductile and could visually display crack propagation. It can even be seen that the flat samples had the crack split into two paths which resulted in a piece of the sample breaking off during failure.
The work conducted by Kung, et al. [
22] aimed to test the material properties of PLA on a RepRap MEX platform. Also testing according to the ASTM standard, a similarity between the investigation conducted in the publication above and this investigation is the analysis of the effect of print orientation on the material strength. It was found that a 45° orientation print produced a higher strength specimen as compared to a flat 0° orientated specimen. To further analyse the discrepancies between the flat and side specimens, one can utilize the knowledge of composite materials as a possible means of characterizing the mechanical properties of layered anisotropic specimens by borrowing the theory applied to laminates. The analysis of composites focuses on the orientation and fibre direction to determine the strength of the material in tension. Similarly, it is believed the internal distribution of the filament holds the key in determining the reason for the difference in performance.
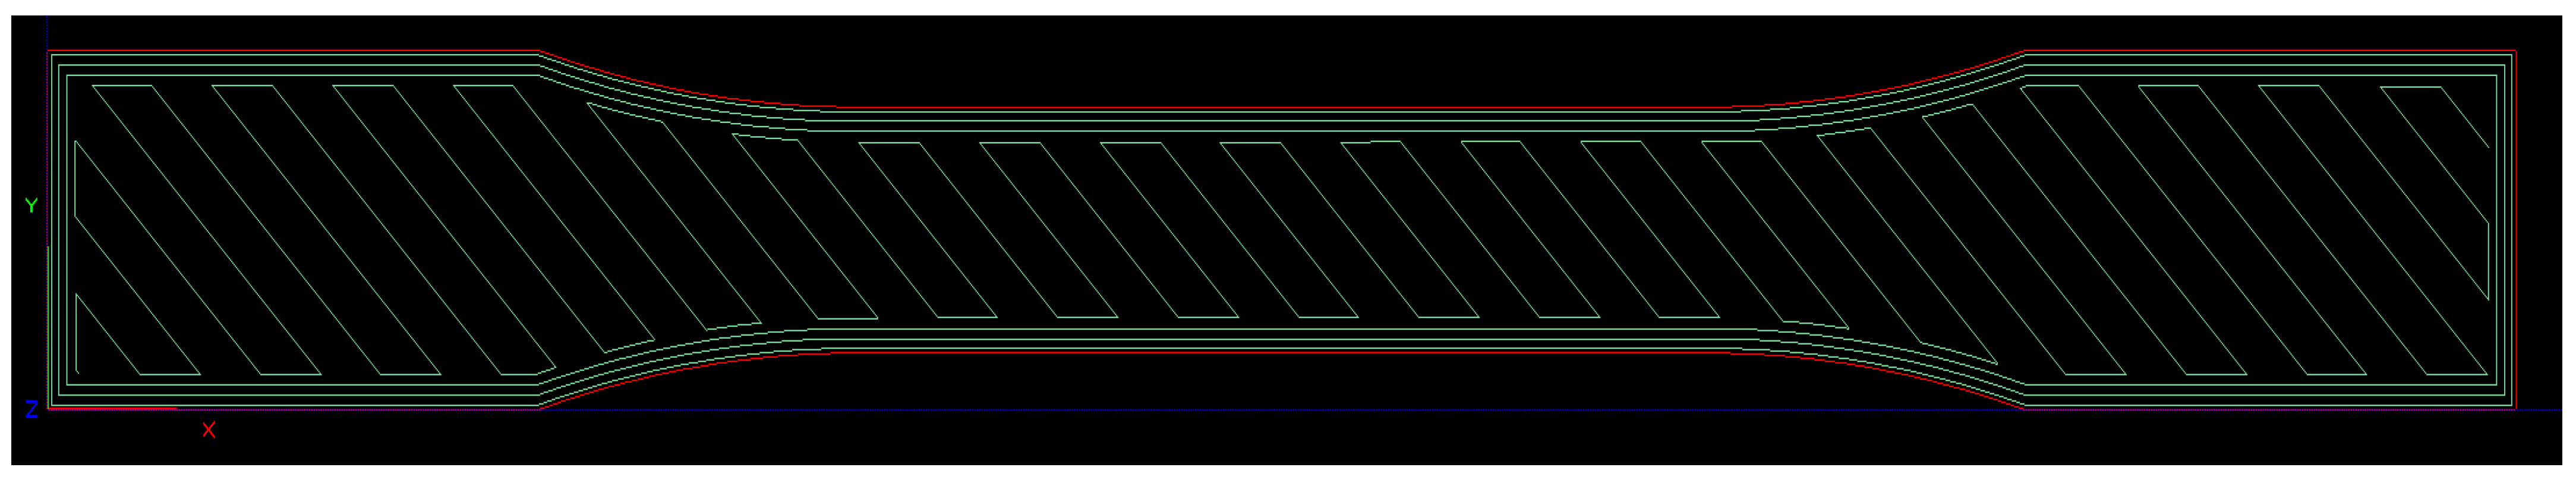
To undertake this analysis, the toolpath which is indicative of the orientation and layer up of the filament within the part is needed. The images in
Figure 8 and
Figure 9 are cross-sections of the flat sparse and side sparse specimens respectively. These were extracted from the Insight software (version: 16.6
®) used to slice the sample files. The figures generated on the software highlight the print specimens with different colours. The red colour outline in the figures derived from the software indicate the walls of the sample whilst the green colour indicates the infill pattern of the samples.
The sparse flat sample was comprised of 31 total layers and the side sparse side sample was comprised of 75 total layers, but 42 continuous layers where the print runs from end to end. When the layer slices were first observed in the slicing software, the hypothesis that was generated was that the flat sparse sample would have a longer continuous filament fibre due to the increased width of the sample cross-section and the side sparse sample would have an increased strength capability due to the increase in the layers under stress. Should the stressed area have been equally as thick as it was wide, one would expect no observable difference in the print sample’s mechanical properties when printed in either the side or flat orientation as the sample should be geometrically symmetric. The discrepancy noted in the tests conducted can therefore be attributed to the difference in this ratio of the width to thickness of the stressed area. Future work should include determining the effect of the width to thickness ratio on the strength of the test samples. The correlation between composite mechanics and the polymer should also be investigated as the possibility of similarities between the two could help determine a method for the analysis of the additive manufacturing components.
Figure 10 and
Figure 11, which show the sliced stl files cross-sectional areas of the flat solid and side solid specimens, respectively, display a more compact pattern, as shown in the corresponding sparse versions of the specimens, seen in
Figure 8 and
Figure 9. The denser infill pattern should correlate to an increased strength as compared to the sparse specimens but should follow a similar trend under the hypothesis.
Another notable mention is that the added layers of the side samples seemingly increase the strength by resisting crack propagation. This also accounts for possible edge effects from the postulated theory. The stress would naturally be larger on the side cross-section as the area is smaller. There are more perpendicular layers counteracting that force in the side specimens, as compared to the flat specimens, which have layers parallel to the force direction, and hence the flat specimens should not be as strong as the side specimens when counteracting that stress. Hence, this is where the idea behind the postulated theory was derived.
The strain disparity is, however, not as apparent as the differences between the tensile strengths of the side and flat samples, as initially predicted. Although the flat sample trends indicated a higher strain, the side samples had almost similar strain values, with some even higher than the flat samples of the same material and infill density. Therefore, the theory initially hypothesized may not be as accurate with regards to strain. Reasons for the inaccuracy may be attributed to the fact that the additional tensile strength of the side specimens may prolong possible crack propagation and failure by having the layers perpendicular to the crack growth area, hence, extending the strain.
Identifying if the difference in infill densities was directly proportional to the mechanical properties was one of the research aims and thus needed to be evaluated using the data obtained.
Table 4 and
Table 5 indicate the relationship between the sparse and solid infill in terms of mechanical behaviour.
Table 4 identifies the performance of the tensile strength of the sparse specimens as a percentage of the corresponding solid specimens and
Table 5 represents the strain of the sparse specimens as a percentage of the corresponding solid specimens. The definitive result is that there is no direct proportionality with respect to infill density. However, the results do reveal other considerations with regards to the infill densities.
The data in
Table 4 show that the sparse infill specimens were weaker than the solid infill specimens but not by a set defined margin. The upright specimens showed the highest correlation between the sparse and solid infill densities in terms of tensile strength, followed by the side specimens, and lastly, the flat.
The flat sparse specimens behaved very similarly to the hypothesized case meaning that there would be a direct correlation, i.e., 50% infill would result in a 50% tensile strength performance; however, the side and upright specimens had a much higher percentage performance. The upright sparse specimens shared 85% and above performance with the corresponding solid specimens except for ULTEM 9085, which was above 60%.
This indicates one could extract sufficiently high performance with 50% less infill density, which would save on the weight of the designed component.
The strain data in
Table 5 show that all sparse samples had at least a 50% larger strain compared to the solid data, with the upright specimens having greater strain values as compared to the solid samples except for ULTEM 9085, which had greater strain in the side and flat orientations. These data will be highly useful for future design as the performance comparison of strength to weight ratios for various print orientations have been illustrated.
The data above can be seen to demonstrate the overall superior properties of ULTEM 9085 in maintaining a seemingly high strength to ductility ratio with its relatively high strain at break values as compared to the other tested materials. The reason for this is thought to be seen in the fracture cross-sections of the tested samples, and particularly in the solid flat and side samples.
Figure 12 shows these fracture cross-sections and one can see clearly defined filament strands, which are not as apparent in the other materials, such as the Nylon 12 samples in
Figure 6b.
These individual strands could indicate that the filament material is bearing a significant portion of the load and, given that the filament is homogenous as compared to the printed cross-section, should improve the overall material properties of the print.
Nylon 12 CF utilizes chopped fibre strands of carbon fibre embedded in the filament itself to achieve its high strength properties. The fibres are, however, susceptible to more brittle fractures and thus do not have a high strain at break value. The image in
Figure 13 shows the fracture cross-section of a Nylon 12 CF flat solid sample. These fibres were exposed during fracture and can thus also be seen in the picture. The data from the tests also indicate that the addition of the chopped carbon fibres in the Nylon 12 CF filament significantly increased the strength of the printed component as compared to traditional Nylon 12 filament for the side and flat orientations with both infill densities. However, in the upright orientation, the Nylon 12 was stronger than the Nylon 12 CF specimens in both infill density configurations. This could be due to the additional fibres in the Nylon 12 CF reducing the total surface area for adhesion between the layers as this is the main resistance to the delamination force in the upright configuration. The chopped fibres also significantly decreased the strain at break values of the Nylon 12 CF filament as compared to Nylon 12 in all configurations, indicating the fibres reduce the ductility of the material. This is further evidenced by the more ductile fracture of the Nylon 12 samples seen in
Figure 6b and the more brittle fracture seen in
Figure 13.
The results produced in the experimental investigation were then reviewed in conjunction with the supplier data, which revealed that the test specimens followed similar trends but were outperformed in most configurations with the supplier materials often being stronger, with mostly lower strains as well. The work done by Halapi, et al. [
23] compares the effects of MEX printing on material strength on used and unused filament samples for PLA reinforced with different materials. When comparing it to the literature used in the study, it was found that the printed materials displayed lower strength than the supplied data.
It should be noted that the supplier only provided data for side solid and upright solid infill specimens and thus the test conducted provides greater insight on a flat-orientated specimen and the effect of a sparse infill density on the mechanical properties of the specimens. The standard deviation values of the obtained data were calculated to determine the accuracy. This was checked against the range of each set of samples, and it can be confirmed that the standard deviation was less than the range for every sample set, indicating that there were no errors from the data analysis portion.
Errors and outliers in the data could have resulted from a multitude of factors such as air temperature and moisture, storage and transportation of the samples, the post processing of the samples and so forth. These conditions could not be controlled and thus could have had a role in skewing certain results. This is why multiple tests must be conducted to average these points out.
5. Conclusions
This investigation set out to identify the mechanical properties of five frequently used filament materials for polymer material extrusion additive manufacturing methods. To complete this analysis, tensile tests of the samples had to be completed according to the ASTM D638 standard for polymers. Two different infill percentages and three different print orientations were then further used to categorize the samples into specific configurations for improved comparison and data collection. The tests conducted produced results that, when further analysed, revealed both expected and unexpected results. Some of the expected results included the higher performance materials such as the ULTEM filaments and Nylon 12 CF, which outperformed ASA and Nylon 12 overall. The upright specimens all experienced significantly lower performance than the side- and flat-orientated specimens due to the direction of the force being perpendicular to the print plane. The solid infill specimens outperformed the sparse infill specimens. Some of the unexpected results included the upright sparse specimens having almost equal properties to those of the upright solid specimens, with 50% less infill percentage. A further analysis of the fracture cross-sections of the upright specimens showed that these specimens were limited by the delamination force and this force would have been sufficiently high for the sparse specimens to have material failure first as the cross-sectional area would have been less than the solid, and thus have less strength to counter delamination. Another interesting result was the discrepancy in the performance of the flat- and side-orientated specimens. A theory was proposed that the stacking of the extrusion layers resulted in better crack propagation resistance on the side-orientated samples as compared to the flat samples. This was further supported with fracture samples and analysis from composite theory. Other notable discussion points include the ULTEM 9085 performance, which can be linked to the mode of failure seen in the fracture cross-section. The Nylon 12 CF’s high strength and low ductility, which is attributed to its chopped fibre inclusion in the filament, was also seen.
The direct comparison of the inclusion of carbon fibre chopped strands to plain filament material was also investigated through the testing of both the Nylon 12 and Nylon 12 CF filament materials. This allowed for the determination of the effect of adding this additive to the filament. The results showed that Nylon 12 was more ductile, with a higher strain at break; however, it was significantly weaker than the Nylon 12 CF filament material which had a higher tensile strength. The overall conclusion to the addition of these fibres in the filament material was that it would greatly increase the maximum breaking strength of the material; however, it would also significantly decrease the ductility of the material.
This test provides substantial data for consideration during the design and implementation of these materials in engineering applications. This data can now be used to develop and set up simulation models where 3D printed components can be analysed for structural loading. The software available for these applications is being investigated and a possible viable program uses machine learning techniques to predict different behaviour based on previous experimental data.
This is only possible as the decision to test multiple configurations resulted in a significant data yield that is sufficient to undertake an extensive design analysis of additive manufactured parts not previously done. Future work in this field should include further testing of samples to obtain more material data. The material supplier has completed tests such as flexural mechanical, compression strength, and Izod notched tests. These tests should also be completed to improve the understanding of the various parameters on the material properties of 3D printed components. In addition, composite equivalent tests should be completed to understand any correlation, if present, between the effect of the thickness to width ratio and the strength of the print/layer orientation.


