Abstract
Carbon-fiber-reinforced epoxy composite (CEC) has gained widespread acceptance as a structural material in various applications. Drilled holes are essential for assembling composite material components. Reducing drilling-induced damage and temperature effects is crucial for improved surface quality and integrity of the drilled composite. In the present work, drilling experiments were conducted on CEC, hexagonal-boron nitride (h-BN) dispersed CEC, and molybdenum disulfide (MoS2) dispersed CEC at three different levels of spindle speed, feed, and drill diameter using solid carbide twist drills. The filler concentrations used in this study were 4, 6, and 8 wt%. Analysis of variance (ANOVA) was used to determine the significance of input factors (feed, spindle speed, drill diameter, and filler concentration) on the drilling responses such as thrust force, temperature, arithmetic mean surface roughness (Ra), and push-out delamination factor (DFexit). The average drilling temperature, Ra, and DFexit of MoS2 dispersed CEC were reduced by 24.7, 46.5, and 11.3%, respectively, when compared to neat CEC. In h-BN dispersed CEC, the average drilling temperature, Ra, and DFexit were reduced by 25.2, 40.9, and 13.2%, respectively, compared to neat CEC. The lubricating properties and high thermal conductivity of filler added to epoxy are responsible for the lower temperature and improved hole surface finish. The improved delamination resistance in filler-loaded CEC is due to the strengthening of the matrix and fiber–matrix interface. Scanning electron microscopy (SEM) was used to examine the morphology of the drilled composite surface. The spindle speed of 5500 rpm, feed of 0.03 mm.rev−1, and filler loading of 4 wt% produced the minimum Ra and DFexit. The response surface method (RSM) was applied to determine the input parameters based on multi-response optimum criteria.
1. Introduction
Carbon-fiber-reinforced epoxy composite (CEC) is replacing metals and metal alloys in many structural applications because it has impressive properties such as specific strength, stiffness, impact resistance, fatigue strength, and low thermal expansion [1,2]. In most applications, the composite parts are connected with another through fasteners. For instance, the wing surface, skin panels, vertical fin assembly, engine nacelles, fuselage inner walls, and empennage ribs include fastener-connected joints [3,4,5]. Hence, a large number of holes are required for mechanically fastened joints [6]. As many as 55,000 drilled holes are necessary to complete the construction of an Airbus A350 aircraft [7]. Drilling composite is a challenging process due to its heterogeneity (multi-phase), anisotropy, and multi-layer architecture apart from the heat-sensitive matrix [8]. The drilling of CEC induces numerous damage types including delamination, matrix cracking, matrix crazing, fiber debonding, fiber splintering, fiber fuzzing, fiber pullout, and burrs [9,10]. Furthermore, the poor heat conduction of epoxy matrix in composite causes severe heat accumulation and rapid temperature rise [11,12,13]. As the drilling temperature exceeds the glass-transition temperature (Tg), the interfacial shear strength, interlaminar fracture toughness, and anti-deformation capacity of the CEC deteriorates, resulting in surface roughness and delamination damage [14]. As a consequence of poor drilled hole quality, nearly 60% of drilled CEC components are rejected in the production line [15,16,17]. Hence, it is important to minimize drilling-induced damage.
The separation of adjacent layers while drilling multi-layered CEC is known as delamination. It forms due to the presence of a weak polymer matrix at the laminate interfaces, resulting in inadequate flexural rigidity and interlaminar toughness of the composite [18,19,20]. Peel-up delamination is the separation of the top layers of composite noticed during the drill entry into the composite. It is caused by the wedge-pushing action produced by drill’s chisel edge portion and excess developed force acting normal to the stacking plane [21]. Push-out delamination is noticed when the drill bit is on the verge of completing the drilling operation during which uncut laminas beneath the drill tip exhibit relatively lower resistance to feed force due to decreased stiffness [22]. Due to the smaller uncut thickness (less supporting force) at the end of the drilling cycle, the magnitude of push-out delamination is higher than that of peel-up [12]. When subjected to repetitive loads, delamination in composite propagates quickly across the entire laminate [23], reducing load-bearing strength, fatigue life, and long-term performance [24]. Hence, delamination damage reduction in drilling composite is an active research topic.
The drilled hole quality of the composite relies on machining and tool parameters (geometry, diameter, point angle, coating material) [17,21,25]. The drilled surface quality is also affected by the composite’s mechanical properties, its thermal properties, and the cooling method used [21]. To date, several researchers have made efforts to minimize drill-induced damage by design material, tool, and process parameter optimization. Harris et al. [26] investigated the hole quality of woven CEC drilled using aluminum chromium nitride (AlCrN)-coated cobalt steel and uncoated high-speed steel (HSS) twist drills at a constant feed of 0.05 mm.rev−1 but varying spindle speed. The minimum push-out delamination factor (DFexit) of 1.046 was reported for CEC drilled using an AlCrN-coated drill at a speed 2700 rpm. The minimum roughness of 8.17 µm was reported using an AlCrN-coated drill at a speed of 1300 rpm. Ameur et al. [27] conducted drilling on quasi-isotropic stacked CEC and reported the least thrust force of 28 N using a tungsten carbide (WC) drill at a speed of 9000 rpm and feed of 60 mm.min−1, whereas the minimum DFexit of 1.08 occurred using a WC-coated titanium nitride (TiN) drill at a speed of 6000 rpm and feed of 60 mm.min−1. Wang et al. [22] reported a minimum DFexit of 1.31 for quasi-static stacked CEC drilled at a feed of 0.03 mm.rev−1 and speed of 3500 rpm, whereas the minimum arithmetic mean surface roughness (Ra) of 1.7 µm occurred at a feed of 0.03 mm.rev−1 and speed of 1500 rpm.
High-speed drilling increases productivity but induces a higher drilling temperature [28]. The high temperature generated during drilling softens the matrix and deteriorates its structural integrity [11,12]. Thermal damage during drilling can be reduced in certain circumstances using lubricant or coolant. However, the cutting fluid could be absorbed by the moisture-sensitive composite [29] and long-term exposure to the coolant is detrimental to the physical, mechanical, and chemical properties of the composite [30]. Moreover, most cutting fluids contain toxic additives that are harmful to humans and the environment [31]. Also, when coolants are used, there will be additional time and cost involved in cleaning the machine parts [32]. As an alternative to conventional flood cooling, eco-friendly methods such as compressed-air (vortex-tube) cooling and minimal quantity of lubricant (MQL) are used in machining processes [5,33]. Abish et al. [34] compared the drilling response of CEC in dry and chilled air conditions. The chilled-air-assisted drilling increased thrust force by 15% and decreased DFexit by 14% compared to dry drilling. In chilled air conditions, a minimum DFexit of 1.8 was reported at a speed of 125 mm.min−1 and feed of 0.03 mm.rev−1. When compared to dry drilling, chilled air reduced Ra by 10% at a drilling speed of 150 m.min−1 and feed of 0.09 mm.rev−1. Rajkumar et al. [35] compared the drilling response of CEC in dry and chilled air conditions. The chilled-air-assisted drilling of CEC decreased DFexit (1.58) by 9% and Ra (1.36 µm) by 25% at a drilling speed of 100 mm.min−1 and feed of 0.03 mm.rev−1. John et al. [36] carried out drilling of CEC at varying temperatures of 10, 30 (room temperature), 60, 90, and 120 °C in chilled air, dry air, and hot air conditions. The average thrust force recorded in a chilled air environment was 50 and 66% higher compared to drilling at room temperature and 60 °C, respectively. This was primarily due to an increase in hardness when using low temperature. A minimum DFexit of 1.045 was found for composite drilled under hot air drilling conditions (90 °C) at a speed of 2000 rpm and feed rate of 100 mm.min−1. It was 2.8% lower compared to drilling at room temperature. Drilling composite in a chilled air environment produced the fewest burr defects and lowest Ra.
Vortex-tube cooling and MQL-assisted drilling incur additional installation costs. Solid-lubricant-assisted drilling is another option for lowering the drilling temperature by alleviating the frictional heating effect [37]. Unlike flooded fluid lubrication, solid-lubricant-assisted drilling does not involve polluting chemicals [38]. The solid lubricant is effective in lubrication at wider elevated temperatures [39]. In addition, the inclusion of a thermally conductive solid lubricant filler in a composite improves thermal conductivity and facilitates heat dissipation. Hence, various researchers have attempted to improve composite drilled hole quality with the inclusion of solid lubricant fillers such as graphite (G), graphene, graphene oxide (GO), carbon nanotubes (CNT), and carbon nanofiber (CNF) reinforcements in the epoxy matrix. Kumar et al. [40] performed drilling experiments on graphite (G)-reinforced epoxy composite and reported a minimum Ra of 0.95 µm in case of 10 wt% G-added epoxy at a drilling speed of 2500 rpm and feed rate of 150 mm.min−1. This reduced the roughness caused by graphite’s solid lubricant characteristics. Çelik et al. [41] explored the drilling behavior of 0.2 wt% graphene and 0.2 wt% GO fillers added separately to CECs. The inclusion of graphene in CEC increased the thrust force from 83 to 105 N and DFexit from 1.05 to 1.11 while drilling at a speed of 15 m.min−1, feed of 0.1 mm.rev−1, and drill point angle of 90°. The thrust force and DFexit of GO-loaded CEC increased to 107 N and 1.12, respectively. The highest drilling temperature of 205 °C was reported while drilling neat CEC at a maximum speed of 45 m.min−1, which was attributed to increased friction. The better thermal properties of graphene and GO fillers are responsible for heat absorption and a reduction in the drilling temperature. Kumar et al. [42] conducted a drilling study on GO-loaded unidirectional CEC using a titanium aluminum nitride (TiAlN)-coated silicon carbide drill. A minimum thrust force of 54 N was reported while drilling 2 wt% GO-loaded CEC at a speed of 2400 rpm and feed rate of 80 mm.min−1. The minimum DFexit of 1.019 was reported for 1 wt% GO-loaded CEC drilled at a spindle speed of 1600 rpm and feed rate of 80 mm.min−1. In another study, Kumar et al. [43] confirmed the lowest Ra of 1.65 µm for 1 wt% GO-loaded CEC drilled using a spindle speed of 1600 rpm and feed rate of 80 mm.min−1. Kaybal et al. [44] carried out drilling on nano-sized h-BN-filled CEC and revealed a slightly higher thrust force for h-BN loaded composite than neat CEC. However, the lowest one-dimensional DFexit of 1.276 and Ra of 0.25 µm were noted with h-BN-added CEC. A feed of 0.005 mm.rev−1 and a speed of 90 m.min−1 were the optimum conditions. At the optimum conditions, the DFexit decreased by 2% and Ra by 16% for h-BN-loaded CEC compared to neat CEC. Rajakumar et al. [45] computed the delamination factor of drilled CNF-loaded CEC. The inclusion of 1.5 wt% CNF in the epoxy improved the stiffness and interlaminar shear strength (ILSS) of the composite, according to the authors. As a result, CNF addition to the composite decreased the thrust force and delamination factor. The lowest DFexit of 1.06 and thrust force of 57 N were reported for 1.5 wt% CNF-loaded CEC drilled at a feed of 0.02 mm.rev−1 and speed of 28.27 m.min−1. It is evident from the discussed literature that h-BN and CNF are solid lubricant fillers but they exhibit dissimilar effects on the thrust force. Thus, there exists scope for further investigation.
Kharwar et al. [46] evaluated the thrust force and roughness of drilled multi-walled carbon nanotube (MWCNT)-filled epoxy composite. The minimum thrust force of 13.72 N was reported while drilling 1 wt% MWCNT-loaded epoxy with a carbide drill at a spindle speed of 1500 rpm and feed rate of 50 mm.min−1. The minimum Ra of 0.52 µm was noted for 1 wt% MWCNT-loaded epoxy drilled with a TiAlN drill at a speed of 1000 rpm and feed rate of 100 mm.min−1. The addition of MWCNT to epoxy creates a lubrication effect between the drill–chip and drill–workpiece interfaces, improving surface finish. Kaybal et al. [47] reported a decrease in thrust force from 166 to 157 N and DFexit from 1.261 to 1.214 for 0.3 wt% CNT-incorporated CEC at a drilling speed of 67 m.min−1 and feed of 0.005 mm.rev−1. Vijayan et al. [48] reported a lowest thrust force of 12.2 N during the drilling of 5% CNT-dispersed CEC at a spindle speed of 500 rpm and feed rate of 6 mm.min−1. The minimum DFexit of 1.015 was reported for 4% CNT-dispersed CEC drilled at a speed of 800 rpm and feed of 6 mm.min−1. Using Raman spectroscopy, Miyake et al. [49] evaluated the residual stress of carbon fibers on the hole periphery while drilling CEC. A solid lubricant water microcapsule sheet 0.1 mm thick was attached on the surface of drill entry. For drilling, a polycrystalline diamond drill of 8 mm diameter was considered. The authors demonstrated that the water microcapsules lowered the drilling temperature and residual stress of fiber. The study confirmed that drilling at a higher spindle speed of 3800 rpm lowered fiber residual stress. Table 1 lists the process parameters considered in the literature while drilling CEC, filler-loaded epoxy, and filler-loaded CEC.

Table 1.
Process parameters considered for drilling CEC and filler-loaded CEC in the literature.
The influence of h-BN and MoS2 fillers on the drill hole quality of CEC is less explored by the research community. In the present research, drilling was performed on the composite developed from solid lubricant fillers such as h-BN and MoS2. The h-BN exhibits excellent thermal conductivity along with high strength and modulus [50,51,52,53]. MoS2 has excellent thermal, electronic, and mechanical properties [54]. The MoS2 and h-BN have lamellar structures wherein the adjacent layers of molybdenum–sulfur and boron–nitrogen atoms are held together by van der Waals forces [55]. These adjacent layers shear easily by friction-induced stress, imparting lubrication properties [56]. The coefficient of friction (µ) is used to measure lubricity. The µ of MoS2 ranges from 0.002 to 0.25, while that of h-BN ranges from 0.150 to 0.7 [57]. The thermal conductivity of h-BN varies from 300 to 500 W.m−1.K−1 [58]. The thermal conductivity of MoS2 varies from 38 to 131 W.m−1.K−1 [59]. The drilling experiments were conducted on CEC, h-BN-dispersed CEC, and MoS2-dispersed CEC at various levels of filler concentration and responses such as thrust force, temperature, hole wall surface roughness (Ra), and push-out delamination factor (DFexit) were measured. The composite drilled hole wall morphology and drilling-induced damage were examined using scanning electron microscopy (SEM) and ultrasonic C-scan, respectively.
2. Materials and Methods
2.1. Material Description and Preparation Details
Twill woven carbon fabric (TORAYCA® T300B grade, Toray Composite Materials America, Inc., Tacoma, WA, USA) with two sets of interlaced yarns (warp and weft) was used as a reinforcement. The chosen fabric has an area density of 200 g.m−2. The matrix is diglycidyl-ether-bisphenol-A epoxy (Lapox-L12, Atul Ltd., Valsad, India), and hardener is a room-temperature-curing tri-ethylene tetraamine (Lapox-K6). Magnetic stirring (rotational speed = 500 rpm; temperature = 70 °C; duration = 20 min) and ultrasonication (frequency = 20 kHz; amplitude = 35%; duration = 30 min) were utilized to disperse MoS2 and h-BN fillers of 0, 4, 6, and 8 wt% in the epoxy. Composites were prepared using hand layup, in which each successive layer of carbon fabric was coated with filler-dispersed hardener-added epoxy. The hand roller movement spread the resin in all directions. Ten layers of lamina were stacked. The stacked material was sealed with vacuum bagging film and coupled with a vacuum pump. Due to the pressure difference between the sealed chamber and the outside atmosphere, force acts on the bag and compacts the lamina. Lastly, 90 min of post-curing at 75 °C was completed, followed by 24 h of room-temperature curing. A detailed description of the fabrication procedure has been published [60]. Neat CEC refers to a carbon-fabric–epoxy composite composed of 50 wt% of carbon fabric and 50 wt% resin. The abbreviations 4BN-CEC, 6BN-CEC, and 8BN-CEC denote carbon fabric/h-BN/epoxy composites containing 4, 6, and 8 wt% of h-BN filler, respectively. The abbreviations 4MoS2-CEC, 6MoS2-CEC, and 8MoS2-CEC denote carbon fabric/MoS2/epoxy composite containing 4, 6, and 8 wt% of MoS2 filler, respectively. The drilling coupons of dimension 100 mm × 75 mm × 4 mm were prepared from each fabricated composite panel using water-jet machining at Stonemax water-jet, (StoneMax Waterjet & Laser Cutting, Kochi, India, machine used: SAME water-jet cutting machine 1525, Qingdao, China).
2.2. Design of Drilling Experiments
Drilling experiments were performed in a computer numerical control (CNC) vertical machining center (ACE Designers, Micromatic Machine Tools Pvt. Ltd., Bengaluru, India) as shown in Figure 1a. Two-facet twist drills made of solid carbide were used for drilling. In solid carbide material, the hard tungsten carbide particles aggregate in a soft cobalt matrix. As a result, the solid carbide drill has higher hardness, excellent abrasion, rupture, and wear resistance accompanied by higher temperature endurance than the HSS drill [17]. The solid carbide cermet drill has Vicker’s hardness, modulus, and thermal conductivity of 1550 kgf.mm−2, 600 GPa, and 70 W.m−1·K−1, respectively. In this work, drills of diameter 4, 6, and 8 mm were considered as they are the most frequently used in the applications. Each drill has a point angle of 120° and a helix angle of 30° (right-hand helix) and was purchased from ‘M/S. Varalakshmi sharp tools, Bengaluru, India’. Figure 1b shows a picture of the drill bits along with their geometric specifications.
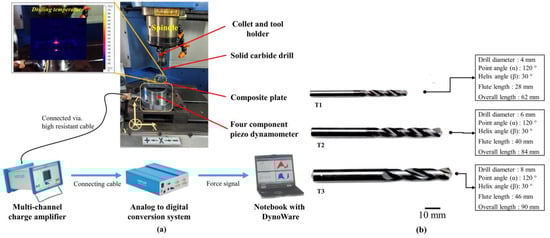
Figure 1.
(a) CNC vertical machining setup with temperature and thrust force measurement and (b) photograph with details of solid carbide twist drills.
Response surface analysis was adopted for designing experiments, assessing the effects of input factors, and determining the best combination of input factors for optimum response. Response surface method (RSM) is relatively simple to use, more practical, and computationally fast with optimum use of resources [61]. In this study, a Box–Wilson face-centered central composite design (CCD) matrix was selected to determine the optimum number of drilling experiments without sacrificing accuracy. This design has three levels per factor, with repetitions occurring in the middle level of each factor. Table 2 shows the levels of input variables such as spindle rotational speed, feed, drill diameter, and filler concentration. The significance of input variables on the thrust force, temperature, and hole quality parameters (surface roughness, push-out delamination factor) were investigated using analysis of variance (ANOVA). RSM and ANOVA were carried out using Minitab19 software.
Table 2.
Input factors with levels.
2.3. Details of Thrust Force Assessment
Thrust force is the resistance force exhibited by the composite for the cutting action [62,63]. The drilling thrust force was measured using a piezoelectric dynamometer (Make/Model: Kistler 9272, Winterthur, Switzerland) that was attached to the machining center via rigid fixtures. The dynamometer’s sensitivity and measuring ranges are −3.63 pC.N−1 and 0–2000 N, respectively. The data flow sequence is indicated in Figure 1a. The force signal is transmitted from the dynamometer to a multi-channel charge amplifier for pre-processing (filtered and amplified), then it is forwarded in the sequence analog to digital converter (ADC) card and data storage software. DynoWare software® (version 2825D-02) was used to record the thrust force.
2.4. Details of Temperature Measurement
The drilling temperature was measured using a non-contact-type infrared (IR) thermal imager (Make/Model: Fluke thermography, Ti32). IR temperature measurement is a reliable method for capturing real-time temperature distribution [34,64]. The eminence of energy radiated is dependent on the surface temperature and emissivity of the workpiece [65]. An emissivity of 0.85 was entered in the IR thermal imager, as recommended by ASTM E1933 for CEC [66]. The accuracy, measuring temperature range, and image capture frequency of the IR thermal imager are ±2 °C, −20 to +600 °C, and 9 to 60 Hz, respectively. The IR thermal imager was held near the workpiece to detect variation in infrared energy at the machining area and measure the temperature. SmartView® 4.3 software was used to view the IR image (.IS2 file format). To avoid the effect of pre-heating due to thermal stress, drilling was performed with interruptions between each successive hole to cool down the workpiece.
2.5. Details of Roughness Measurement
The Ra is the arithmetic average of profile heights within the sampling length [67]. It is also referred to as a mean deviation of roughness profile from the imaginary line that divides the irregular area trough and crest portions equally. The Ra of the drilled hole wall was measured using a contact-type profilometer (Make/Model: Taylor Hobson Taly Surf 50) of resolution ±0.1 µm. For the measurement, a tungsten carbide stylus of tip radius 1.5 to 2.5 µm was used. Figure 2a shows a photo of the surface roughness measuring setup. The sampling length and travel speed were set to 0.8 mm and 0.5 mm.s−1, respectively. The profilometer was calibrated with a steel ball and the obtained profile is shown in Figure 2b, for which Ra is close to the standard value. The Ra readings were taken in four different directions on the inner surface of the hole, and the average value was reported.
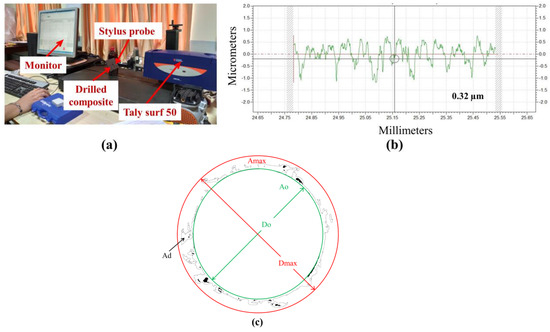
Figure 2.
(a) Taylor Hobson surface roughness measuring instrument; (b) surface roughness calibration profile and (c) schematics of delamination zone labeled with area and diameter to estimate delamination factor.
2.6. Estimation of Delamination Factor
Davim’s adjusted delamination factor (Fda) was quantified in this study using Equation (1) [15]. The image of the drilled hole’s exit side surface was captured with a high-resolution camera and processed with Image-J software to determine Fda (also known as DFexit). The image brightness and contrast were adjusted in Image-J so that the delamination zone was brighter than the surrounding region. To observe delamination, the image was converted to binary image format. The delamination/damage area ‘Ad’ was measured using a wand (tracing tool). The maximum diameter of the circle enclosing the delamination ‘Dmax’ and corresponding area ‘Amax’ were measured. The nominal drilled hole diameter ‘Do’ and corresponding area ‘Ao’ were also determined. Figure 2c shows the delamination zone with area and diameter to estimate the delamination factor.
where Fda is the Davim’s adjusted delamination factor, Fd is the conventional delamination factor = Dmax/Do, Dmax is the maximum diameter of delaminated zone, Do is the nominal drilled hole diameter, Ad is the delaminated area, Amax is the area corresponding to Dmax, and Ao is the area corresponding to Do.
2.7. Ultrasonic C-Scan Test Details
Non-destructive inspection techniques such as ultrasonic C-scan testing (3 axis immersion ultrasonic testing system, Dhvani-Research and Development Solution, Chennai, India) was used to investigate the drilled composite surface. The ultrasonic test was conducted with a scan resolution of 0.5 mm and a focal distance of 50 mm. The inspection was carried out using a through-transmission method, with the transducer frequency of 2.25 MHz, pulsar voltage of 207 V, low pass filter of 7.5 MHz, and high pass filter of 1 MHz. A gain of 28–33 dB was selected so that the signal was not saturated. The composite specimen and transducer were immersed in the coupling medium (distilled water bath). The sound waves produced by exciting the piezo-transducer were introduced into the composite surface via a coupling medium to prevent attenuation of ultrasonic waves. The through-transmission method employs two transducers, one for sending and another for receiving the energy. The transducer records propagation and reflection of acoustic waves in the sample. The presence of discontinuities (such as porosity, impurities, or delamination) in the sample is responsible for attenuation in the energy levels of transmitted sound waves. The transducer converts reflected echo waves into electric pulses, revealing the inner damage/defect in an ultrasound map [68]. Hence, barely visible damage present in carbon/epoxy composite can be examined.
2.8. Inspection of Drilled Hole Morphology
The morphology of the sectioned drilled hole was inspected using SEM (Make/Model: ZEISS EVO 18, Oberkochen, Germany). Each specimen was sputter coated with electrically conducting material (gold/palladium alloy) in a low vacuum for SEM inspection. Sputtering reduces electric charge accumulation on the specimen during electron irradiation and improves image clarity.
3. Results and Discussion
The design matrix and drilling responses of neat CEC, MoS2-loaded CEC, and h-BN-loaded CEC are shown in Table 3, Table 4 and Table 5, respectively.
Table 3.
Drilling experiment design matrix and responses of carbon fabric–neat epoxy.
Table 4.
Drilling experiment design matrix and responses of MoS2-reinforced CEC.
Table 5.
Drilling experiment design matrix and responses of h-BN-reinforced CEC.
3.1. Thrust Force
Figure S1 indicates the thrust force variation with time scale for three variants of composites: neat-CEC, MoS2-CEC, and BN-CEC for selected holes. The magnitude of the thrust force increases sharply when the drill makes contact with the workpiece because of chisel edge penetration, rubbing, and plowing effects [11]. This stage is crucial in deciding the peel-up delamination. Further, when the chisel edge and cutting edges make complete contact with the workpiece, the thrust force increases and the material removal process starts. The thrust force increases abruptly as the drill interacts with the carbon fiber and decreases when it comes in contact with the epoxy resin [41]. As the drill approaches the last few plies, the uncut material resisting the thrust becomes less. Therefore, the piercing action of the chisel edge is more effective than the cutting action, which causes bending of the lamina beneath the drill. The thrust force decreases gradually as the chisel edge comes out the bottom surface of the composite. This behavior agrees well with the published literature [45].
As the feed varied from 0.03 to 0.07 mm.rev−1, the average thrust force increased by 45.2% in neat CEC, 18.8% in MoS2-loaded CEC, and 16.4% in h-BN-loaded CEC. This is because high-feed involves a larger chip cross-sectional area, which increases cutting resistance [36,69]. The average thrust force increased by 37.5% in neat CEC, 15.9% in MoS2-loaded CEC, and 13.3% in h-BN-loaded CEC when drilling with an 8 mm diameter drill instead of 4 mm. This is because a smaller drill has a sharper pointed tip with a smaller web thickness and chisel edge length, which reduces the thrust force. As the spindle speed increased from 1000 to 5500 rpm, the thrust force reduced by 6.5% in neat CEC, 1.2% in MoS2-loaded CEC, and 5.1% in h-BN-loaded CEC. This is due to increased friction between the drill and the composite at high speeds, which results in increased drilling temperature and composite softening [70]. As a result, less cutting energy is required for drill bit advancement during high-speed drilling. The filler-loaded CEC exhibited higher thrust force than neat CEC due to the stiffness of the filler, which demands more cutting energy. The highest thrust force of 28.55 N was recorded for 6 wt% h-BN-loaded CEC while drilling with a 6 mm drill diameter at a spindle speed of 3250 rpm and feed of 0.07 mm.rev−1. Although filler-added CEC produces more thrust force, the critical level of thrust force in filler-added composite is also higher due to improved flexural rigidity, ILSS, and toughness. As a result, the optimum filler wt%-added CEC can sustain higher thrust force. Similar findings of higher thrust force for h-BN-particle-filled CEC [44] and CNT-filled CEC have been reported in the literature [48].
3.2. Drilling Temperature
According to energy balance, the work due to torque and thrust force involved in a turn angle of the drill is equal to the energy necessary for material removal, kinetic energy transferred to the chip, and heat generated due to friction [71]. The major portion of the energy consumed in drilling is converted into heat [13]. The tool–workpiece and tool–chip contact friction are the major sources of elevated drilling temperature [72]. The heat-affected region in composite can cause thermal softening of composite and disintegration of fiber–matrix interface bonding [13].
Figures S2–S4 represent IR thermal images of various composites under different drilling conditions. The drilling temperature varies with the process parameters. Based on the data provided in Table 3, Table 4 and Table 5, the percentage increase in temperature was calculated. As the spindle speed level was varied from 1000 to 5500 rpm, the average temperature increased by 42.8% in neat CEC, 47.5% in MoS2-loaded CEC, and 37.8% in h-BN-loaded CEC. This increased temperature is caused by rubbing friction at the drill–composite interface as well as heat accumulation [41,47]. The increase in drilling temperature of graphite-reinforced epoxy composite with increased spindle speed has been reported in the literature [40]. The average temperature decreased by 5.8% in neat CEC, 17.3% in MoS2-loaded CEC, and 13.5% in h-BN-loaded CEC as the feed was varied from 0.03 to 0.07 mm.rev−1. When using a larger drill diameter of 8 mm rather than 4 mm, the average drilling temperature increased by 6.8% in neat CEC, 13.1% in MoS2-loaded CEC, and 11.1% in h-BN-loaded CEC. Drilling with a larger drill diameter involves more material removal and tool–workpiece contact friction, which raises the temperature. The highest drilling temperature of 128.9 °C was recorded while drilling neat CEC with a larger drill size (8 mm) under high spindle speed (5500 rpm) and low feed (0.03 mm.rev−1) conditions. Because of the poor thermal properties of the epoxy matrix in neat composite, heat accumulates, resulting in a higher drilling temperature [49]. This highest drilling temperature surpasses Tg (88 °C) but is less than the composite decomposition temperature (260 °C) [60]. As a result, no severe thermal damage was observed.
When a higher quantity of thermal-conductive 2D filler is added to epoxy resin, they contact each other in a matrix and form a thermal conductive path [73]. This improves heat dissipation. Moreover, h-BN and MoS2 addition to the polymer matrix reduces friction and frictional heat due to their lubricating properties [56,74]. As a result, the drilling temperature was reduced by 15.3 and 11.5% in 8 wt% MoS2-CEC and 8 wt% BN-CEC, respectively as compared to 4 wt% filler-added CEC. The lowest temperature was 49.2 °C with 8 wt% MoS2-CEC and 51.7 °C with 8 wt% BN-CEC achieved when drilling using a 4 mm drill at a spindle speed of 1000 rpm and feed of 0.07 mm.rev−1. The majority of filler-loaded CECs exhibit drilling temperatures lower than the Tg of the composite. The average drilling temperature of MoS2-dispersed CEC and h-BN-dispersed CEC reduced by 24.7 and 25.2%, respectively, compared to neat CEC. The reduced temperature at the drilling area lessens material stiffness degradation. A similar finding of reduced drilling temperature was reported for GO solid-lubricant-filled CEC in the literature [42]. The MoS2 and h-BN fillers can retain lubricity up to 420 and 1200 °C, respectively [74]. Because the highest drilling temperature noted in the present study is less than 400 °C, both h-BN and MoS2 exhibit lubrication characteristics and lessen drilling temperature.
3.3. Drilled Hole Surface Roughness
The surface roughness profiles for low and high Ra of neat CEC, MoS2-CEC, and BN-CEC are shown in Figure 3 and Figure 4a–d, respectively. It was noted that the roughness profiles lack periodicity, which may be caused by the composite’s inhomogeneity and anisotropy. For drilled-hole aerospace parts, Ra of less than 4.8 μm is recommended [75]. As the spindle speed varied from 1000 to 5500 rpm, the average Ra decreased by 59.3% in neat CEC, 56.2% in MoS2-loaded CEC, and 56.9% in h-BN-loaded CEC. The morphology confirms improved hole wall surface finish under moderate- to high-speed drilling. When using a larger drill diameter of 8 mm compared to 4 mm, the average Ra decreased by 27.9% in neat CEC, 28% in MoS2-loaded CEC, and 28.9% in h-BN-loaded CEC. As the feed was increased from 0.03 to 0.07 mm.rev−1, the average Ra value increased by 61.7% in neat CEC, 48.1% in MoS2-loaded CEC, and 55.2% in h-BN-loaded CEC. High feed reduces surface finish because it increases the load on the cutting tool [46]. The maximum Ra of 7.77 µm was observed in drilled neat CEC at a spindle speed of 1000 rpm, feed of 0.07 mm.rev−1, and drill diameter of 4 mm. At a higher spindle speed (5500 rpm), lower feed (0.03 mm.rev−1), larger drill size (8 mm), and lower filler concentration (4 wt%), the lowest Ra of 0.78 and 0.79 µm were obtained in MoS2-loaded CEC and h-BN-loaded CEC, respectively. Improved hole surface finish was attributed to reduced interface friction and thermal-associated damage in drilling filler-loaded CEC [46]. As the filler concentration varied from 4 to 8 wt%, the average Ra increased by 24.4% in MoS2-loaded CEC and 27.9% in h-BN-loaded CEC. The MoS2-added CEC contributed to lower surface roughness than h-BN-added CEC, owing to the lower µ of MoS2 compared to h-BN [76].
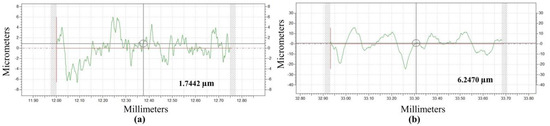
Figure 3.
Roughness profiles of neat-CEC (a) A = 5500 rpm, B = 0.03 mm.rev−1, C = 8 mm and (b) A = 1000 rpm, B = 0.07 mm.rev−1, C = 4 mm.
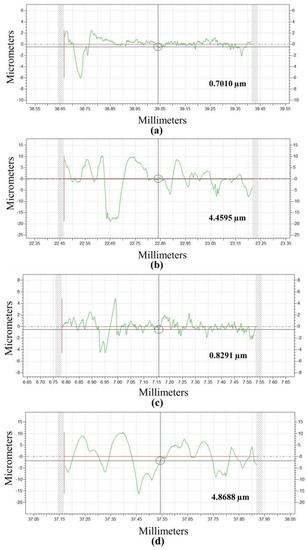
Figure 4.
Roughness profiles: MoS2-CEC (a) A = 5500 rpm, B = 0.03 mm.rev−1, C = 8 mm, D = 4 wt%; (b) A = 1000 rpm, B = 0.07 mm.rev−1, C = 4 mm, D = 8 wt%; BN-CEC (c) A = 5500 rpm, B = 0.03 mm.rev−1, C = 8 mm, D = 4 wt% and (d) A = 1000 rpm, B = 0.07 mm.rev−1, C = 4 mm, D = 8 wt%.
3.4. Push-Out Delamination Factor
The permissible delamination factor in aeronautical standards for a drill diameter of 6.35 mm is less than 1.4 [62]. Figure 5, Figure 6 and Figure 7 show the drilled hole image and DFexit of neat CEC, MoS2-loaded CEC, and h-BN-loaded CEC under various drilling conditions. As the spindle speed was varied from 1000 to 5500 rpm, the average DFexit decreased by 6.2, 8.1, and 8.7% in neat CEC, MoS2-loaded CEC, and h-BN-loaded CEC, respectively. This is possibly due to the increased temperature at a higher level of drilling speed. As the feed was varied from 0.03 to 0.07 mm.rev−1, the average DFexit increased by 9.4% in neat CEC, 5.9% in MoS2-loaded CEC, and 6.1% in h-BN-loaded CEC. High feed force causes inter-layer crack growth in composite and increases the delamination effect [19]. A higher DFexit was reported in the literature for CNF-loaded CEC at a higher feed and lower spindle rotational speed [45]. The average DFexit increased by 15.9% in neat CEC, 6.8% in MoS2-loaded CEC, and 5.5% in h-BN-loaded CEC when a drill of diameter 8 mm was used instead of 4 mm. It is known that a drill of shorter chisel edge length reduces delamination and thrust force [77]. The 4, 6, and 8 mm diameter drills used in this study have chisel edge lengths of 1.2, 1.5, and 1.8 mm, respectively. Therefore, delamination decreased when using a 4 mm drill.
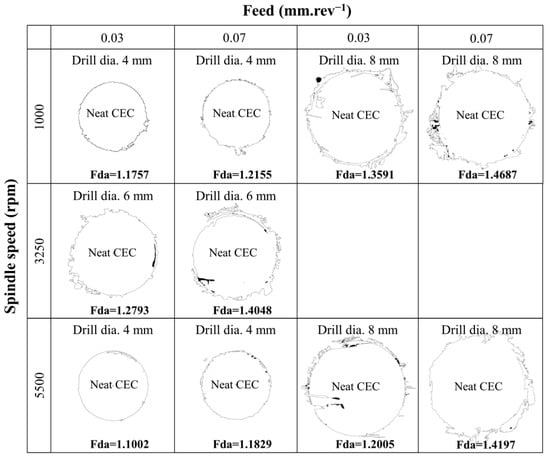
Figure 5.
Delamination images of neat CEC under various drilling conditions.
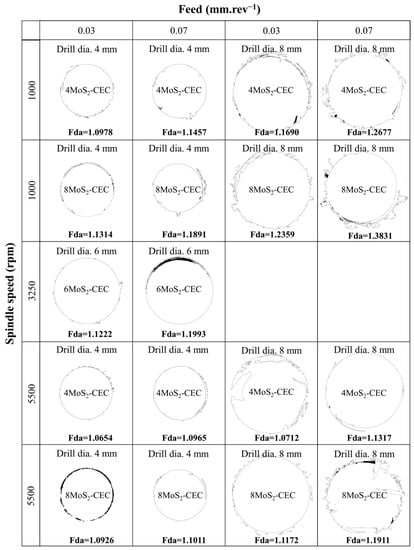
Figure 6.
Delamination images of MoS2-loaded CEC under various drilling conditions.
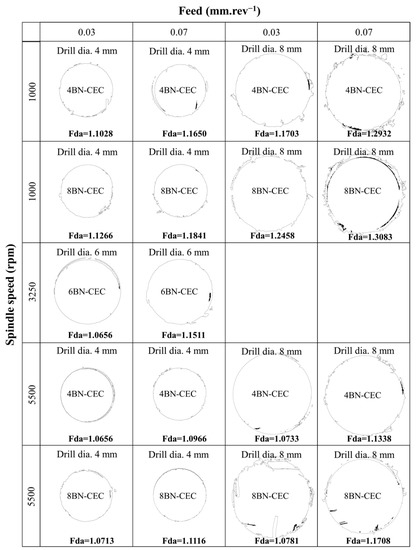
Figure 7.
Delamination images of h-BN-loaded CEC under various drilling conditions.
The highest DFexit of 1.4687 was observed for neat CEC drilled at 1000 rpm, feed of 0.07 mm.rev−1, and drill size of 8 mm. For 4 wt% MoS2-loaded CEC drilled with high spindle speed (5500 rpm), low feed (0.03 mm.rev−1), and small drill size (4 mm), a minimum DFexit of 1.0654 was obtained. Compared to neat CEC, the average DFexit of MoS2-loaded CEC and h-BN-loaded CEC reduced by 11.3 and 13.2%, respectively. It is known that a judicious quantity of h-BN as well as MoS2 filler added to CEC improves ILSS [78,79], fracture toughness [80], and flexural rigidity (bending resistance) [78,79]. As a result, the filler-strengthened matrix reduces stiffness variation between laminas, resulting in less surface deformation/delamination. The 4 wt% filler was found to be more effective in reducing DFexit. As the filler concentration was increased from 4 to 8 wt%, the average DFexit increased by 4.5% in MoS2-loaded CEC and 2.6% in h-BN-loaded CEC. This is because higher filler wt%-loaded composites are brittle and have a weaker fiber–filler–matrix interaction mainly due to filler agglomeration. Similar findings have been reported for CNT-filled CEC in the literature [48].
3.5. Drilled Surface Morphology
The fiber–matrix interfacial interaction is a major determinant of drilled hole structural integrity of composite [20]. Figure 8a–c shows the SEM images of neat CEC (hole no. 19) that was drilled using a speed of 1000 rpm, feed of 0.07 mm.rev−1 and a 4 mm sized drill. The push-out delamination observed in Figure 8a was caused due to high-feed and low-spindle-speed drilling. Fiber debonding and resin loss observed in the morphology (Figure 8b) cause poor hole surface finish. Matrix debonding indicates a poor carbon-fiber–epoxy matrix interface. The matrix fragments and fracture of carbon fibers (Figure 8c) reveal the brittleness of the matrix as well as carbon fibers. Figure 8d–f displays the SEM fractography of a neat CEC (hole no. 4) drilled with a 6 mm drill diameter at a speed of 3250 rpm and feed of 0.05 mm.rev−1. It reveals carbon fiber pullout, matrix damage, and a charcoal-like mark owing to a high drilling-induced temperature. Surface cavities (Figure 8e) were caused due to loss of matrix. The tensile strength of carbon fibers is higher than that of the epoxy matrix; hence it is difficult to machine fibers compared to resin. Thus, some fibers are pulled along the flute and noticed as uncut fibers (Figure 8f) resulting in a poor surface finish. Figure 8g–i depicts the SEM micrograph of neat CEC (hole no. 12) drilled using an 8 mm drill at a speed of 3250 rpm and feed of 0.05 mm.rev−1. The confirmation of resin loss, carbon fiber pullout, and charcoal mark are witnessed in Figure 8g. The material removal of composite in drilling is caused by a series of brittle fractures [81]. As a result, the morphology of drilled neat CEC (Figure 8h) shows matrix cracking and fiber breakage. The wrenching of carbon fibers is also observed in the aforesaid composite. The matrix degradation (damage) (Figure 8i) is caused by the high temperature generated during the drilling process of neat CEC. The high temperature causes matrix softening [10,48].
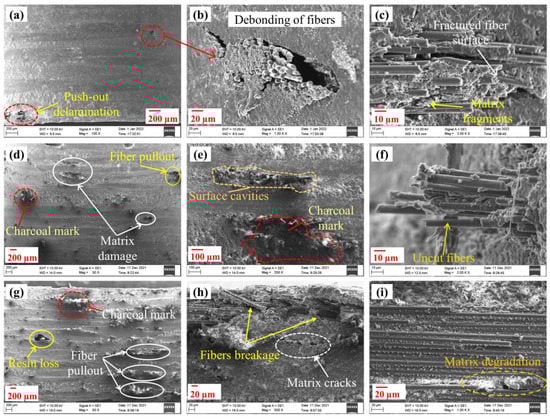
Figure 8.
Morphology of neat CEC drilled at (a–c) A = 1000 rpm, B = 0.07 mm.rev−1, C = 4 mm; (d–f) A = 3250 rpm, B = 0.05 mm.rev−1, C = 6 mm; and (g–i) A = 3250 rpm, B = 0.05 mm.rev−1, C = 8 mm.
Figure 9a,b illustrates the SEM morphology of 4 wt% MoS2-loaded CEC (hole no. 25) drilled using a 4 mm diameter drill at a speed of 1000 rpm and feed of 0.07 mm.rev−1. The surface damage on the hole wall is caused by matrix cracking and poorly cut carbon fiber (Figure 9a). Carbon fiber splintering is visible in Figure 9b. The micrograph in Figure 9d shows intact carbon fiber filler-reinforced epoxy. Figure 9e,f indicates SEM images of 6 wt% MoS2-loaded CEC (hole no. 30) drilled using a 6 mm drill at a speed of 3250 rpm and feed of 0.05 mm.rev−1. Most of the drilled region in this composite has a smooth surface because MoS2-loaded epoxy can absorb rupture energy and reduce matrix cracking. Slight fiber debonding from the matrix is still evident. The SEM micrographs of 8 wt% MoS2-loaded CEC (hole no. 7) drilled at a speed of 3250 rpm and feed of 0.05 mm.rev−1 with a 6 mm diameter drill are shown in Figure 9g,h. The hole has a good drilled surface with less severe matrix debonding. Figure 9i,j shows the SEM images of a drilled 8 wt% MoS2-loaded CEC (hole no. 27) with an 8 mm drill at 5500 rpm spindle speed and 0.07 mm.rev−1 feed. A zone of surface damage is visible in the morphology (Figure 9i). The magnified view reveals matrix cracking and debonding (Figure 9j). This is due to the matrix’s inability to bind filler particles because of agglomeration. Moreover, at high feed, drilling-induced defects and cracks are severe [43].
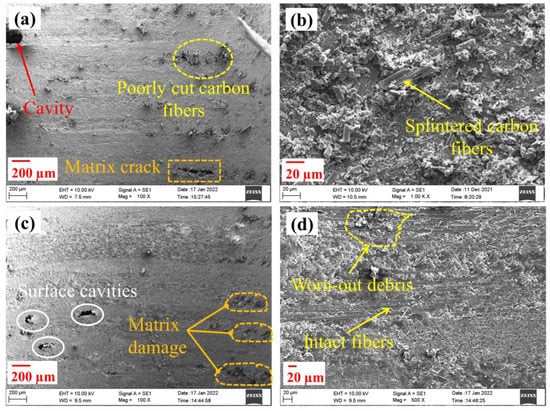
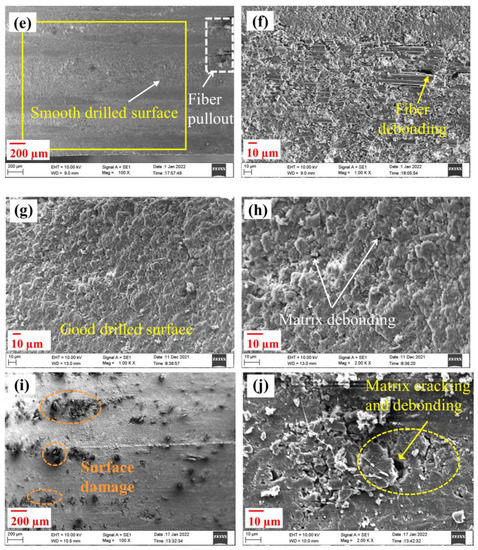
Figure 9.
Morphology of MoS2-loaded CEC drilled at (a,b) A = 1000 rpm, B = 0.07 mm.rev−1, C = 4 mm, D = 4 wt%; (c,d) A = 3250 rpm, B = 0.05 mm.rev−1, C = 4 mm, D = 6 wt%; (e,f) A = 3250 rpm, B = 0.05 mm.rev−1, C = 6 mm, D = 6 wt%; (g,h) A = 3250 rpm, B = 0.05 mm.rev−1, C = 6 mm, D = 8 wt% and (i,j) A = 5500 rpm, B = 0.07 mm.rev−1, C = 8 mm, D = 8 wt%.
Figure 10a,b shows SEM micrographs of a 4 wt% h-BN-loaded CEC (hole no. 23) drilled with an 8 mm diameter drill at 1000 rpm spindle speed and 0.07 mm.rev−1 feed. The surface roughness arises due to matrix debonding (Figure 10a). Due to drilling-induced force, the epoxy matrix fractured into pieces as revealed in Figure 10b. Figure 10c,d shows SEM micrographs of a 6 wt% h-BN-loaded CEC (hole no. 19) drilled with a 6 mm drill at a speed of 3250 rpm and feed of 0.05 mm.rev−1. The river line pattern (Figure 10c) denotes matrix deformation. The undamaged (intact) carbon-fiber-reinforced epoxy is evident in Figure 10d. Figure 10e,f indicates SEM images of an 8 wt% h-BN-loaded CEC (hole no. 20) drilled with a 4 mm sized drill at a spindle speed of 5500 rpm and feed of 0.07 mm.rev−1. Intact fiber–filler–matrix (Figure 10e) are noticed. This could be due to the use of a high spindle speed and small drill size for drilling. Figure 10g,h displays the SEM images of 4 wt% h-BN-loaded CEC (hole no. 17) drilled with an 8 mm drill size at a spindle speed of 5500 rpm and feed of 0.07 mm.rev−1. The white-colored region noticed in the morphology indicates epoxy matrix smearing (Figure 10g,h). This is due to the high temperature generated, particularly when a high drilling speed is used [82].
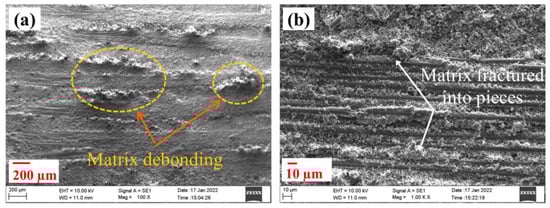
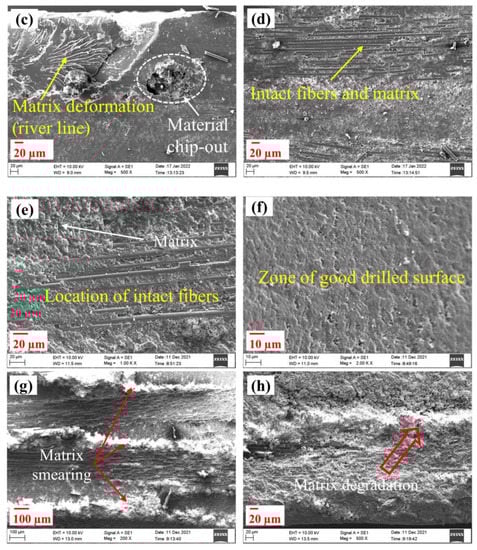
Figure 10.
Morphology of h-BN-loaded CEC drilled at (a,b) A = 1000 rpm, B = 0.07 mm.rev−1, C = 8 mm, D = 4 wt%; (c,d) A = 3250 rpm, B = 0.05 mm.rev−1, C = 6 mm, D = 6 wt%; (e,f) A = 5500 rpm, B = 0.07 mm.rev−1, C = 4 mm, D = 8 wt% and (g,h) A = 5500 rpm, B = 0.07 mm.rev−1, C = 8 mm, D = 4 wt%.
3.6. Damage Identification Using Ultrasonic C-Scan
The A-scan and C-scan images of neat CEC, 4 wt% MoS2-CEC, and 4 wt% h-BN-CEC drilled at a speed of 5500 rpm, feed of 0.03 mm.rev−1, and drill diameter of 4 mm are shown in Figure 11 and Figure 12a,b, respectively. Ultrasonic instruments record two fundamental parameters of an echo: amplitude and pulse transit time. A-scan is a representation of the amplitude of reflected signals versus the discontinuity depth or time of flight. A-scan shows a good region with the highest amplitude and a damaged region with low amplitude. The color scale of signal attenuation is indicated in the C-scan images, where 0% represents high attenuation of the transmitted echo due to the presence of damage in the samples and is represented in blue. The red-colored region (except at the hole) represents low attenuation (region of high density or no damage). The green-colored region signifies a lack of resin (dry spots) with an echo signal attenuation of around 55%, which may be attributed to variation in the applied pressure during the fabrication stage. It cannot be considered as a flaw or delamination [83]. The presence of resin-rich regions at the fabric stitch regions causes signal attenuation [84]. The greenish-blue area indicates a delamination region where the receiver is not receiving a complete signal because of an air gap. This is mainly seen close to larger-sized drilled holes. Compared to neat CEC, the greenish-blue region is reduced in 4 wt% MoS2-added CEC and 4 wt% h-BN-added CECs. The blue region in the C-scan image indicates that the echo completely attenuates due to critical damage developed in the composite, resulting in a significant loss of sound energy. The C-scan images of 4 wt% MoS2-CEC and 4 wt% h-BN-CEC drilled holes showed the least damage compared to neat CEC.
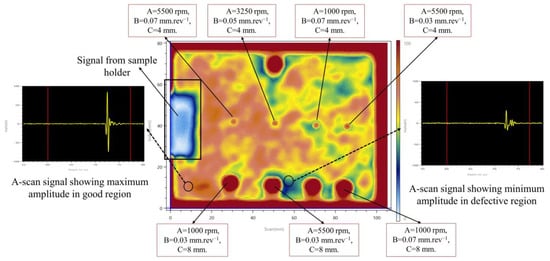
Figure 11.
Through-transmission C-scan images of neat CEC.
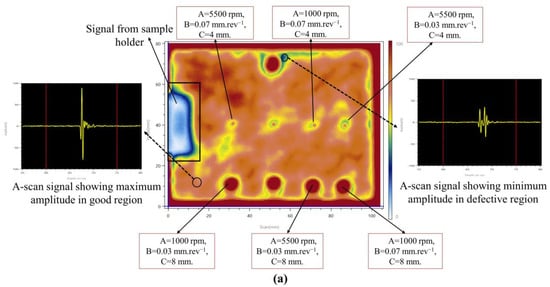
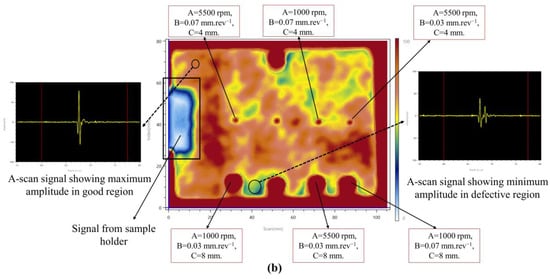
Figure 12.
Through-transmission C-scan images of (a) 4MoS2-CEC and (b) 4BN-CEC.
3.7. Statistical Significance of Factors
ANOVA was performed to determine the significance of input factors over responses. Table 6, Table 7, Table 8, Table 9, Table 10, Table 11, Table 12, Table 13, Table 14, Table 15, Table 16 and Table 17 show the ANOVA findings and levels of contribution of each input factor on individual responses in neat CEC, MoS2-loaded CEC, and h-BN-loaded CEC, respectively. The variance (Fisher’s) F-ratio is the ratio of the mean square of the regression model (factor) to the mean square of the residual error. A factor is said to be significant on a specific response if its associated significance value (p) is less than 0.05 and its calculated F-ratio is greater than the critical F-ratio (tabulated) as determined by the F-distribution chart.
Table 6.
ANOVA for thrust force of carbon fabric-neat epoxy.
Table 7.
ANOVA for drilling temperature of carbon fabric-neat epoxy.
Table 8.
ANOVA for surface roughness of carbon fabric-neat epoxy.
Table 9.
ANOVA for delamination factor of carbon fabric-neat epoxy.
Table 10.
ANOVA for thrust force of MoS2-loaded CEC.
Table 11.
ANOVA for drilling temperature of MoS2-loaded CEC.
Table 12.
ANOVA for surface roughness of MoS2-loaded CEC.
Table 13.
ANOVA for delamination factor of MoS2-loaded CEC.
Table 14.
ANOVA for thrust force of h-BN-loaded CEC.
Table 15.
ANOVA for drilling temperature of h-BN-loaded CEC.
Table 16.
ANOVA for surface roughness of h-BN-loaded CEC.
Table 17.
ANOVA for delamination factor of h-BN-loaded CEC.
The feed had a significant impact on thrust force, contributing 47, 21, and 16% in neat CEC, MoS2-loaded CEC, and h-BN-loaded CEC, respectively. The quadratic term of feed is also significant on the thrust force of neat CEC, implying that a small change in feed causes a significant variation in thrust force. Apart from feed, the filler concentration and drill diameter have a significant impact on the thrust force of filler-loaded CECs. According to the literature, the feed significantly affects the drilling-induced thrust force of woven CEC [85]. The contribution of the spindle speed to the drilling temperature was 87, 60, and 65% for neat CEC, MoS2-added CEC, and h-BN-added CEC, respectively. Additionally, in all three composite variants, the feed influenced temperature. Filler concentration and drill diameter also had a significant influence on the drilling temperature of MoS2-loaded CEC and h-BN-loaded CEC. The spindle speed had the greatest contribution to temperature, followed by feed, filler concentration, and drill diameter in decreasing order.
The surface roughness was significantly affected by spindle speed, drill diameter, and two-way interaction terms associated with spindle speed in all three composites. The contribution of spindle speed to the surface roughness was 59, 50, and 47% for neat CEC, MoS2-added CEC, and h-BN-added CEC, respectively. Furthermore, feed and filler concentration had a significant effect on the roughness of filler-loaded CEC. Drill diameter had a 49.6% contribution to the delamination factor in neat CEC. Spindle speed, drill diameter, feed, and filler concentration had significant effects on the delamination factor of MoS2-loaded CEC, with percentage contributions of 31.6, 19.2, 14.9, and 8.7%, respectively. Spindle speed, feed, drill diameter, and filler concentration had a significant influence on the delamination factor of h-BN-loaded CEC, with percentage contributions of 33.5, 14.5, 11.7, and 2.7%, respectively. The interaction between spindle speed and drill diameter also had a notable influence on the delamination of filler-loaded CEC.
3.8. Response Surface Regression and Residuals Analysis
Based on the experimental results, a mathematical model was developed from the regression analysis that relates each response to the input factors. This regression equation can be used to predict the response corresponding to new input conditions. The second-order regression equations (uncoded format) of neat CEC, MoS2-loaded CEC, and h-BN-loaded CEC are shown in Equations (2)–(5), (6)–(9), and (10)–(13), respectively. There are linear, square, interaction, and constant terms in the regression equations. The negative coefficients in the regression equation decrease the response while the positive coefficients increase the response. The coefficient of determination (R2) is a measure of the proportion of the variation in the dependent variable that can be predicted from the independent variables (both significant and insignificant). Adjusted R2 (R2 adj.) reveals the percentage of variation explained by the significant independent variables on the dependent variable. Based on the results, it was found that the R2 adj. value for all the responses was greater than 0.85 (85%), indicating that the regression model was adequate in explaining the variation.
The standardized residual is the raw residual (difference between observed and predicted response) divided by an estimate of the standard deviation of residuals. The validity of the regression model is confirmed by the standardized residual plot. Figures S5 and S6 show the standardized residual value plotted against the fitted value. The standardized residual graphs of all the composites indicate residuals randomly spread around the centerline with no discernable patterns, indicating that there are no outliers that could have an undesirable effect on the quality of prediction. Figures S7 and S8 show the normal probability plot (NPP) of residuals for various responses. The NPP of all three types of composites demonstrate that the experimental errors follow a straight line and have a small deviation from the standard, supporting the least-square fit. Also, the error is randomly distributed; therefore, the regression model is deemed adequate [61]. Hence, the fitted response surface regression model is statistically solid.
3.9. Contour Plot Analysis
The contour plot depicts the variation in response in a 2D projection view of the surface. The contour plot is obtained by considering two input factors at a time while the other input factors are held at the middle level. All input data points with the same response are connected to produce contour lines. The thrust force contour plot of neat CEC in Figure 13a shows that choosing a feed of 0.03 mm.rev−1, drill diameter of 4 mm, and spindle speed greater than 3250 rpm can lower the thrust force. According to the temperature contour plot of neat CEC shown in Figure 13b, a feed higher than 0.05 mm.rev−1, speed of 1000 rpm, and drill of 4 mm are favorable for reducing the drilling temperature. The surface roughness contour plot of neat CEC in Figure 14a shows that using a spindle speed of 5500 rpm, feed of 0.03 mm.rev−1, and drill diameter higher than 6 mm improves the hole surface finish of neat CEC. Figure 14b displays the contour plot of DFexit related to neat CEC. It indicates that a feed of 0.03 mm.rev−1, drill diameter of 4 mm, and spindle speed higher than 3250 rpm lowers DFexit. The thrust force contour plot of MoS2-loaded CEC displayed in Figure 15a demonstrates that a feed less than 0.05 mm.rev−1, drill of 4 mm, and filler concentration greater than 6 wt% can reduce the thrust force. The thrust force contour plot of h-BN-loaded CEC displayed in Figure 15b illustrates that a feed of 0.03 mm.rev−1, drill diameter of 4 mm, and filler concentration greater than 6 wt% can reduce the thrust force. The contour plot of temperature of filler-loaded CECs (Figure 16) shows that a feed higher than 0.05 mm.rev−1, spindle speed of 1000 rpm, drill diameter of 6 mm, and filler concentration greater than 6 wt% are favorable for lowering the drilling temperature. The surface roughness contour plot related to filler-loaded CEC (Figure 17) illustrates that a speed of 5500 rpm, feed of 0.03 mm.rev−1, drill diameter greater than 6 mm, and filler concentration between 4 and 6 wt% are the best conditions for achieving low Ra. Based on the contour plot of DFexit of filler-loaded CECs (Figure 18), a feed of 0.03 mm.rev−1, spindle speed higher than 3250 rpm, drill diameter of 4 mm, and filler concentration between 4 and 8 wt% will result in a lower DFexit.
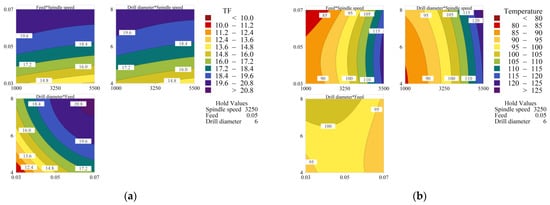
Figure 13.
Contour plot of neat CEC (a) thrust force and (b) temperature.
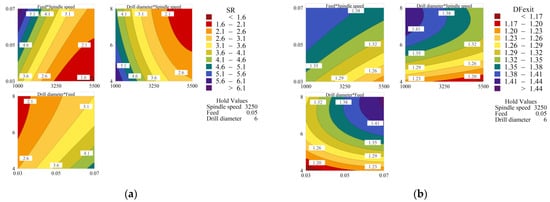
Figure 14.
Contour plot of neat CEC (a) surface roughness and (b) delamination.
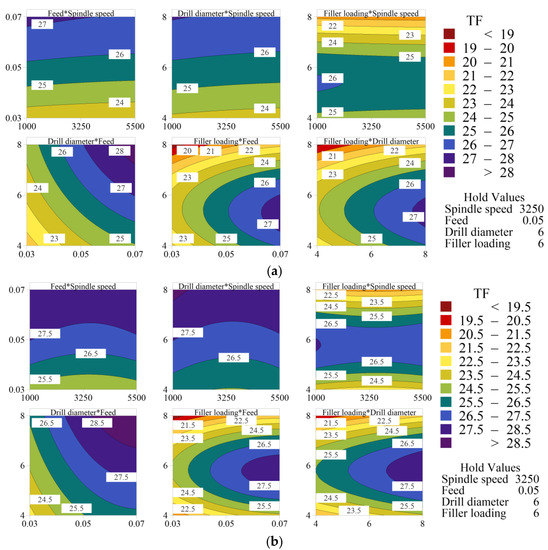
Figure 15.
Thrust force contour plot of (a) MoS2-loaded CEC and (b) h-BN-loaded CEC.
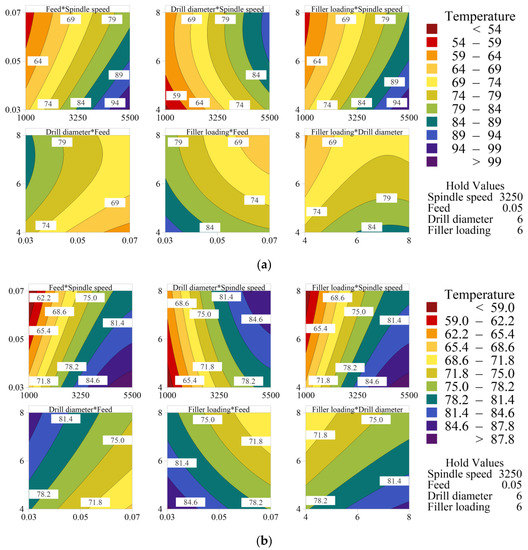
Figure 16.
Temperature contour plot of (a) MoS2-loaded CEC and (b) h-BN-loaded CEC.
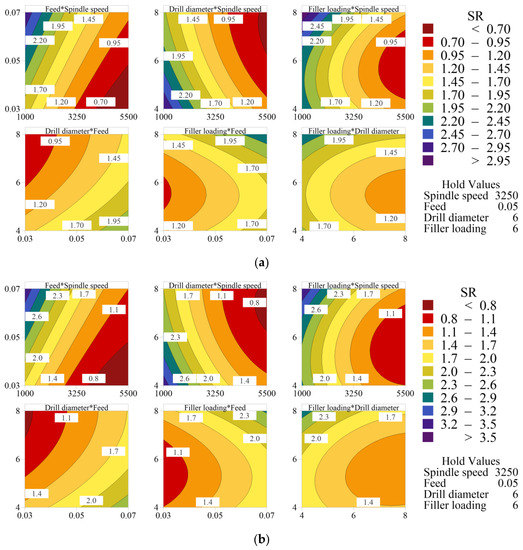
Figure 17.
Surface roughness contour plot of (a) MoS2-loaded CEC and (b) h-BN-loaded CEC.
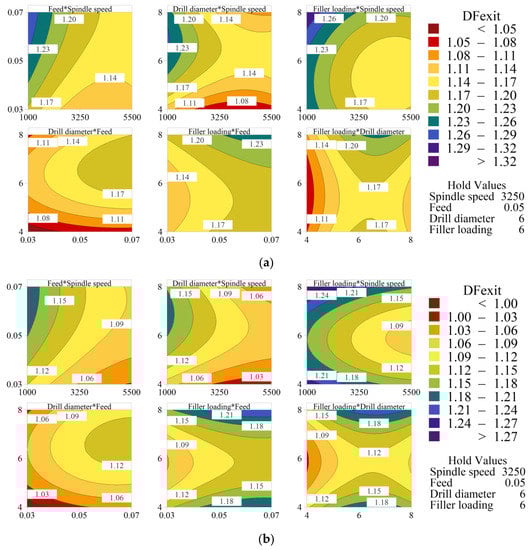
Figure 18.
Delamination contour plot of (a) MoS2-loaded CEC and (b) h-BN-loaded CEC.
3.10. Confirmatory and Validation Results
The optimal parametric combination for multiple responses obtained from RSM are shown in Table 18. The multi-response of neat CEC is optimum when the spindle speed is 3273 rpm, feed is 0.03 mm.rev−1, and drill diameter is 4 mm. A spindle speed of 3409 rpm, feed of 0.03 mm.rev−1, drill diameter of 4 mm, and MoS2 concentration of 7.8 wt% are the optimum conditions for MoS2-loaded CEC. A spindle speed of 2500 rpm, feed of 0.03 mm.rev−1, drill diameter of 4 mm, and h-BN concentration of 7.6 wt% are the optimum conditions for h-BN-loaded CEC. A confirmatory drilling experiment was carried out at multi-response optimum conditions to check the accuracy and validate the optimization results. Table 18 also indicates the predicted response based on the regression model and percentage of error between the predicted and experimental results at the optimum conditions for each response. The maximum deviation was 5.02%. Thus, it is clear that the experimentally measured response is close to that predicted by the RSM.
Table 18.
Optimal combination based on multiple responses and confirmation test results.
The correctness of the developed RSM regression model was verified using a validation test. The drilling experiment was conducted with twelve different sets of process parameters for the validation test, which were not used previously but were within the defined experimental range, and the response was analyzed. Table 19 shows the input conditions chosen for the validation test. The experimental result, RSM predicted value, and percentage error between experimental and predicted results are displayed in Table 20. The average percentage error was less than 4%. The RSM-predicted responses and experimentally determined value agree fairly well. The results of the confirmatory and validation tests closely match the regression model’s predicted values.
Table 19.
The input conditions of validation tests.
Table 20.
Experimental and RSM-predicted results of validation tests.
3.11. Desirability Response
The desirability approach identifies input conditions ‘x’ corresponding to the most desirable response value. Derringer et al. [86] proposed a modified desirability function to solve a multi-response optimization problem. In the present case, low values are desired for all responses to achieve better hole quality. Therefore, the individual desirability function is defined for the minimization problem, as shown in Equation (14), where Li, Ui and Ti are the lower, upper, and target values, respectively, with Li ≤ Ti ≤ Ui. The value s = 1 was chosen in this case.
The desirability index is a dimensionless single-output variable used to assess the success of response surface optimization. A desirability function di(Yi) assigns numbers between 0 and 1 to each response Yi(x). The desirability index is a number between 0 and 1, with a value close to unity being considered acceptable. By combining the individual desirability functions using the geometric mean, the overall desirability D of a multi-response system can be estimated according to Equation (15), where k denotes the number of responses.
Figure 19 and Figure 20a,b show the response optimization plots for neat CEC, MoS2-loaded CEC and h-BN-loaded CEC, respectively. The intersection point of the red line with the curve is the condition of the input parameter corresponding to multi-response optimization. The overall desirability of neat CEC, MoS2-loaded CEC and h-BN-loaded CEC are, respectively, 0.83, 0.76, and 0.73.
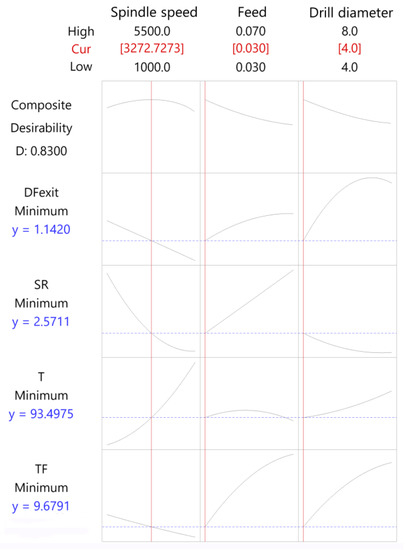
Figure 19.
Response optimization desirability plot of neat CEC.
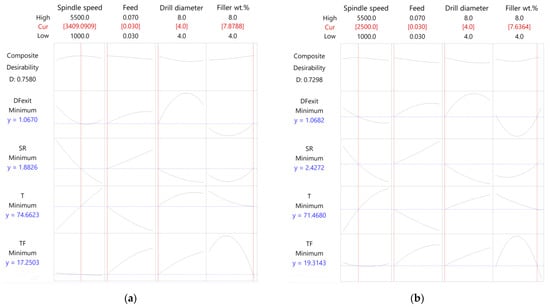
Figure 20.
Response optimization desirability plot (a) MoS2-loaded CEC and (b) h-BN-loaded CEC.
4. Conclusions
The drilling experiments were conducted on seven variants of composites with varying filler percentages. The influence of drilling process parameters and fillers on the thrust force, temperature, surface roughness, and delamination factor were investigated. The main findings are summarized as follows.
- The results demonstrate that drilling composite containing h-BN/MoS2 filler improves heat dissipation and reduces drilling temperature. This is due to the filler’s good lubricating properties and thermal conductivity. A minimum drilling temperature of 49.2 °C was recorded for 8 wt% MoS2-dispersed CEC when using a 4 mm drill diameter, spindle speed of 1000 rpm, and feed of 0.07 mm.rev−1.
- The lowest surface roughness of 0.78 µm was observed in the case of 4 wt% MoS2-dispersed CEC drilled at a spindle speed of 5500 rpm, feed of 0.03 mm.rev−1, and drill diameter of 8 mm. Improved hole surface finish may be caused by reduced interface friction and thermal damage in filler-loaded CEC.
- The minimum DFexit of 1.0654 was achieved for 4 wt% MoS2-loaded CEC at a spindle speed of 5500 rpm, feed of 0.03 mm.rev−1, and drill diameter of 4 mm. The improved delamination resistance is a result of the improved fiber–filler–matrix interface property as well as toughness of the filler-added epoxy. The Ra and DFexit values of h-BN-filled CEC are comparable to those of MoS2-filled CEC.
- According to the C-scan inspection of the drilled composite, the drilling-induced damage region is lesser in filler-loaded CEC compared to neat CEC. The SEM micrographs of drilled neat CEC reveal matrix cracking, matrix debonding, and fiber pullout. The majority of the drilled region was smooth with intact fibers in filler-dispersed CEC. This is because the filler-strengthened epoxy decreases matrix cracking, matrix smearing, and fiber pullout.
- The developed second-order response surface regression model can predict responses close to experimental results with an acceptable percentage of error.
- The current research can be extended to vortex-tube (chilled air) assisted drilling and MQL-assisted drilling. The damage developed in the drilled samples will be examined using the X-ray CT method. In future studies, a metaheuristic algorithm can be used to perform multi-response optimization. Drilling studies on a filler-loaded 3D layer-to-layer interlock woven composite, MoS2-loaded epoxy, h-BN-loaded epoxy, and liquid-encapsulated filler-reinforced epoxy composites will be investigated.
Supplementary Materials
The following are available online at https://www.mdpi.com/article/10.3390/jcs7020046/s1, Figure S1: Variation of thrust force with drilling time; Figure S2: IR thermal images of neat CEC under various drilling conditions; Figure S3: IR thermal images of MoS2-loaded CEC under different drilling conditions; Figure S4: IR thermal images of h-BN-loaded CEC under different drilling conditions; Figure S5: Standardized residuals versus fitted value of neat CEC (a) thrust force; (b) temperature; (c) surface roughness and (d) delamination factor; Figure S6: Standardized residuals versus fitted value of MoS2-loaded CEC (a) thrust force; (b) temperature; (c) surface roughness; (d) delamination factor; standardized residuals versus fitted value of h-BN-loaded CEC (e) thrust force; (f) temperature; (g) surface roughness and (h) delamination factor; Figure S7: NPP of residual of neat CEC (a) thrust force; (b) temperature; (c) surface roughness and (d) delamination factor; and Figure S8: NPP of residual of MoS2-loaded CEC (a) thrust force; (b) temperature; (c) surface roughness; (d) delamination factor; NPP of residual of h-BN-loaded CEC (e) thrust force; (f) temperature; (g) surface roughness and (h) delamination factor.
Author Contributions
Conceptualization, Y.S.R., N.S.M., N.S. and S.A.; Methodology, Y.S.R., N.S.M. and N.S.; Investigation, Y.S.R.; Formal analysis Y.S.R., N.S.M., N.S. and S.A.; Resources, Y.S.R. and S.A.; Data curation, Y.S.R. and N.S.M.; Writing—original draft, Y.S.R.; Writing—review & editing, N.S.M., N.S. and S.A.; Validation, Y.S.R., N.S.M. and N.S.; Supervision, N.S.M. and N.S.; Project administration, N.S.M. and N.S. All authors have read and agreed to the published version of the manuscript.
Funding
This research received no external funding.
Data Availability Statement
Data can be made available from the corresponding author upon reasonable request.
Acknowledgments
The authors are thankful to the Manipal Institute of Technology, MAHE for affording all feasible help in carrying out experimentation. The authors appreciate and acknowledge the valuable inputs provided by Sathyashankara Sharma, Nagaraja Upadhya, Shivamurthy B, Arunachala Chandavar, Gururaj Bolar, Vijay G S, Padmaraj, Manjunath Shettar, Rithesh B, and Elton Dylan Nazareth. The first author thanks Somayaji and the machine-shop staff who helped in the execution of drilling experiments.
Conflicts of Interest
The authors declare no conflict of interest.
References
- Campbell, F.C. Structural Composite Materials, 1st ed.; ASM International: Novelty, OH, USA, 2010. [Google Scholar] [CrossRef]
- Rafique, I.; Kausar, A.; Muhammad, B. Epoxy resin composite reinforced with carbon fiber and inorganic filler: Overview on preparation and properties. Polym. Plast. Technol. Eng. 2016, 55, 1653–1672. [Google Scholar] [CrossRef]
- Kumar, D.; Singh, K.K. Investigation of delamination and surface quality of machined holes in drilling of multiwalled carbon nanotube doped epoxy/carbon fiber reinforced polymer nanocomposite. Proc. Inst. Mech. Eng. Pt. L J. Mater. Des. Appl. 2017, 233, 647–663. [Google Scholar] [CrossRef]
- Soutis, C. Fibre reinforced composites in aircraft construction. Prog. Aerosp. Sci. 2005, 41, 143–151. [Google Scholar] [CrossRef]
- Pervaiz, S.; Kannan, S.; Huo, D.; Mamidala, R. Ecofriendly inclined drilling of carbon fiber-reinforced polymers (CFRP). Int. J. Adv. Manuf. Technol. 2020, 111, 2127–2153. [Google Scholar] [CrossRef]
- Sorrentino, L.; Turchetta, S.; Bellini, C. A new method to reduce delaminations during drilling of FRP laminates by feed rate control. Compos. Struct. 2018, 186, 154–164. [Google Scholar] [CrossRef]
- Faraz, A.; Biermann, D.; Weinert, K. Cutting edge rounding: An innovative tool wear criterion in drilling CFRP composite laminates. Int. J. Mach. Tools. Manuf. 2009, 49, 1185–1196. [Google Scholar] [CrossRef]
- Liu, D.F.; Tang, Y.J.; Cong, W.L. A review of mechanical drilling for composite laminates. Compos. Struct. 2012, 94, 1265–1279. [Google Scholar] [CrossRef]
- Saleem, M.; Zitoune, R.; El Sawi, I.; Bougherara, H. Role of the surface quality on the mechanical behavior of CFRP bolted composite joints. Int. J. Fatigue 2015, 80, 246–256. [Google Scholar] [CrossRef]
- Tyczynski, P.; Sliwa, R.E.; Ostrowski, R. Analysis of possibilities for modification of drill bit geometrical parameters used to drill holes in composite materials of various composition. Aircr. Eng. Aerosp. Technol. 2015, 87, 120–130. [Google Scholar] [CrossRef]
- Xu, J.; Li, C.; Chen, M.; El Mansori, M.; Ren, F. An investigation of drilling high-strength CFRP composites using specialized drills. Int. J. Mach. Tools. Manuf. 2019, 103, 3425–3442. [Google Scholar] [CrossRef]
- Gaugel, S.; Sripathy, P.; Haeger, A.; Meinhard, D.; Bernthaler, T.; Lissek, F.; Kaufeld, M.; Knoblauch, V.; Schneider, G. A comparative study on tool wear and laminate damage in drilling of carbon-fiber reinforced polymers (CFRP). Compos. Struct. 2016, 155, 173–183. [Google Scholar] [CrossRef]
- Merino-Pérez, J.L.; Royer, R.; Ayvar-Soberanis, S.; Merson, E.; Hodzic, A. On the temperatures developed in CFRP drilling using uncoated WC-Co tools part I: Workpiece constituents, cutting speed and heat dissipation. Compos. Struct. 2015, 123, 161–168. [Google Scholar] [CrossRef]
- Wang, H.; Zhang, X.; Duan, Y. Effects of drilling area temperature on drilling of carbon fiber reinforced polymer composites due to temperature-dependent properties. Int. J. Mach. Tools. Manuf. 2018, 96, 2943–2951. [Google Scholar] [CrossRef]
- Davim, J.P.; Rubio, J.C.; Abrao, A.M. A novel approach based on digital image analysis to evaluate the delamination factor after drilling composite laminates. Compos. Sci. Technol. 2007, 67, 1939–1945. [Google Scholar] [CrossRef]
- Xu, J.; An, Q.; Cai, X.; Chen, M. Drilling machinability evaluation on new developed high-strength T800S/250F CFRP laminates. Int. J. Precis. Eng. Manuf. 2013, 14, 1687–1696. [Google Scholar] [CrossRef]
- Sheikh-Ahmad, J.Y. Conventional machining of FRPs. In Machining of Polymer Composites; Springer: Boston, MA, USA, 2009; pp. 143–235. [Google Scholar] [CrossRef]
- Sun, Z.; Hu, X.; Shi, S.; Guo, X.; Zhang, Y.; Chen, H. Edge delamination and residual properties of drilled carbon fiber composites with and without short-aramid-fiber interleaf. Appl. Compos. Mater. 2016, 23, 973–985. [Google Scholar] [CrossRef]
- Heidary, H.; Karimi, N.Z.; Minak, G. Investigation on delamination and flexural properties in drilling of carbon nanotube/polymer composites. Compos. Struct. 2018, 201, 112–120. [Google Scholar] [CrossRef]
- Panchagnula, K.K.; Palaniyandi, K. Drilling on fiber reinforced polymer/nanopolymer composite laminates: A review. J. Mater. Res. Technol. 2018, 7, 180–189. [Google Scholar] [CrossRef]
- Hocheng, H. Machining Technology for Composite Materials, 1st ed.; Woodhead Publishing Limited: Cambridge, UK, 2012. [Google Scholar] [CrossRef]
- Wang, Q.; Jia, X. Optimization of cutting parameters for improving exit delamination, surface roughness, and production rate in drilling of CFRP composites. Int. J. Adv. Manuf. Technol. 2021, 117, 3487–3502. [Google Scholar] [CrossRef]
- Shi, Y.; Wang, X.; Wang, F.; Gu, T.; Xie, P.; Jia, Y. Effects of inkjet printed toughener on delamination suppression in drilling of carbon fibre reinforced plastics (CFRPs). Compos. Struct. 2020, 245, 112339. [Google Scholar] [CrossRef]
- Durão, L.M.P.; Tavares, J.M.R.S.; de Albuquerque, V.H.C.; Marques, A.T.; Magalhães, A.G.; Vieira, A.A. Tool effects on hybrid laminates drilling. Mater. Manuf. Process. 2010, 25, 476–481. [Google Scholar] [CrossRef]
- Geier, N.; Szalay, T. Optimisation of process parameters for the orbital and conventional drilling of uni-directional carbon fibre-reinforced polymers (UD-CFRP). Measurement 2017, 110, 319–334. [Google Scholar] [CrossRef]
- Harris, M.; Qureshi, M.A.M.; Saleem, M.Q.; Khan, S.A.; Bhutta, M.M.A. Carbon fiber-reinforced polymer composite drilling via aluminum chromium nitride-coated tools: Hole quality and tool wear assessment. J. Reinf. Plast. Compos. 2017, 36, 1403–1420. [Google Scholar] [CrossRef]
- Ameur, M.F.; Habak, M.; Kenane, M.; Aouici, H.; Cheikh, M. Machinability analysis of dry drilling of carbon/epoxy composites: Cases of exit delamination and cylindricity error. Int. J. Adv. Manuf. Technol. 2017, 88, 2557–2571. [Google Scholar] [CrossRef]
- John, K.M.; Kumaran, S.T.; Kurniawan, R.; Moon Park, K.; Byeon, J.H. Review on the methodologies adopted to minimize the material damages in drilling of carbon fiber reinforced plastic composites. J. Reinf. Plast. Compos. 2019, 38, 351–368. [Google Scholar] [CrossRef]
- Turner, J.; Scaife, R.J.; El-Dessouky, H.M. Effect of machining coolant on integrity of CFRP composites. Adv. Manuf. Polym. Compos. Sci. 2015, 1, 54–60. [Google Scholar] [CrossRef]
- Almudaihesh, F.; Holford, K.; Pullin, R.; Eaton, M. The influence of water absorption on unidirectional and 2D woven CFRP composites and their mechanical performance. Compos. B Eng. 2020, 182, 107626. [Google Scholar] [CrossRef]
- Katna, R.; Suhaib, M.; Agrawal, N. Nonedible vegetable oil-based cutting fluids for machining processes–a review. Mater. Manuf. Process. 2020, 35, 1–32. [Google Scholar] [CrossRef]
- Koklu, U.; Morkavuk, S.; Featherston, C.; Haddad, M.; Sanders, D.; Aamir, M.; Pimenov, D.Y.; Giasin, K. The effect of cryogenic machining of S2 glass fibre composite on the hole form and dimensional tolerances. Int. J. Adv. Manuf. Technol. 2021, 115, 125–140. [Google Scholar] [CrossRef]
- Klein, R.F.; Hoffmann, N.; Souza, A.J.; Rebelo, F.J.; Amorim, H.J. Optimization of cutting parameters for finish end milling CFRP under vortex-cooled compressed air. Mater. Res. 2021, 24. [Google Scholar] [CrossRef]
- Abish, J.; Samal, P.; Narenther, M.S.; Kannan, C.; Balan, A.S.S. Assessment of drilling-induced damage in CFRP under chilled air environment. Mater. Manuf. Process. 2018, 33, 1361–1368. [Google Scholar] [CrossRef]
- Rajkumar, G.M.; Bhardwaj, D.; Kannan, C.; Oyyaravelu, R.; Balan, A.S.S. Effect of chilled air on delamination, induced vibration, burr formation and surface roughness in CFRP drilling: A comparative study. Mater. Res. Express 2018, 6, 035305. [Google Scholar] [CrossRef]
- John, K.M.; Kumaran, S.T. A feasible strategy to produce quality holes using temperature-assisted drilling on CFRP. Int. J. Adv. Manuf. Technol. 2020, 110, 3113–3127. [Google Scholar] [CrossRef]
- Briscoe, B.J.; Sinha, S.K. Tribological applications of polymers and their composites: Past, present and future prospects. In Tribology and Interface Engineering Series; Friedrich, K., Schlarb, A.K., Eds.; Elsevier: Oxford, UK, 2008; pp. 1–14. [Google Scholar] [CrossRef]
- Basavaraj, E.; Ramaraj, B.; Siddaramaiah. Polycarbonate/molybdenum disulfide/carbon black composites: Physicomechanical, thermal, wear, and morphological properties. Polym. Compos. 2012, 33, 619–628. [Google Scholar] [CrossRef]
- Furlan, K.P.; de Mello, J.D.B.; Klein, A.N. Self-lubricating composites containing MoS2: A review. Tribol. Int. 2018, 120, 280–298. [Google Scholar] [CrossRef]
- Kumar, J.; Verma, R.K.; Mondal, A.K. Taguchi-Grey theory based harmony search algorithm (GR-HSA) for predictive modeling and multi-objective optimization in drilling of polymer composites. Exp. Tech. 2021, 45, 531–548. [Google Scholar] [CrossRef]
- Çelik, Y.H.; Kilickap, E.; Koçyiğit, N. Evaluation of drilling performances of nanocomposites reinforced with graphene and graphene oxide. Int. J. Adv. Manuf. Technol. 2019, 100, 2371–2385. [Google Scholar] [CrossRef]
- Kumar, J.; Kumar Verma, R.; Debnath, K. A new approach to control the delamination and thrust force during drilling of polymer nanocomposites reinforced by graphene oxide/carbon fiber. Compos. Struct. 2020, 253, 112786. [Google Scholar] [CrossRef]
- Kumar, J.; Kumar Verma, R. A novel methodology of combined compromise solution and principal component analysis (CoCoSo-PCA) for machinability investigation of graphene nanocomposites. CIRP J. Manuf. Sci. Technol. 2021, 33, 143–157. [Google Scholar] [CrossRef]
- Kaybal, H.B.; Unuvar, A.; Kaynak, Y.; Avcı, A. Evaluation of boron nitride nanoparticles on delamination in drilling carbon fiber epoxy nanocomposite materials. J. Compos. Mater. 2019, 54, 215–227. [Google Scholar] [CrossRef]
- Rajakumar, P.T.; Hariharan, P.; Srikanth, I. A study on monitoring the drilling of polymeric nanocomposite laminates using acoustic emission. J. Compos. Mater. 2013, 47, 1773–1784. [Google Scholar] [CrossRef]
- Kharwar, P.K.; Verma, R.K.; Singh, A. Neural network modeling and combined compromise solution (CoCoSo) method for optimization of drilling performances in polymer nanocomposites. J. Thermoplast. Compos. Mater. 2022, 35, 1604–1631. [Google Scholar] [CrossRef]
- Kaybal, H.B.; Ünüvar, A.; Koyunbakan, M.; Avcı, A. A novelty optimization approach for drilling of CFRP nanocomposite laminates. Int. J. Adv. Manuf. Technol. 2019, 100, 2995–3012. [Google Scholar] [CrossRef]
- Vijayan, D.; Rajmohan, T. Modeling and evolutionary computation on drilling of carbon fiber-reinforced polymer nanocomposite: An integrated approach using RSM based PSO. J. Braz. Soc. Mech. Sci. Eng. 2019, 41, 395. [Google Scholar] [CrossRef]
- Miyake, T.; Mukae, K.; Futamura, M. Evaluation of machining damage around drilled holes in a CFRP by fiber residual stresses measured using micro-Raman spectroscopy. Mech. Eng. J. 2016, 3, 301. [Google Scholar] [CrossRef]
- Ulus, H.; Üstün, T.; Eskizeybek, V.; Şahin, Ö.S.; Avcı, A.; Ekrem, M. Boron nitride-MWCNT/epoxy hybrid nanocomposites: Preparation and mechanical properties. Appl. Surf. Sci. 2014, 318, 37–42. [Google Scholar] [CrossRef]
- Ribeiro, H.; Trigueiro, J.P.C.; Owuor, P.S.; Machado, L.D.; Woellner, C.F.; Pedrotti, J.J.; Jaques, Y.M.; Kosolwattana, S.; Chipara, A.; Silva, W.M.; et al. Hybrid 2D nanostructures for mechanical reinforcement and thermal conductivity enhancement in polymer composites. Compos. Sci. Technol. 2018, 159, 103–110. [Google Scholar] [CrossRef]
- Duan, X.; Wang, M.; Jia, D.; Jing, N.; Wu, Z.; Yang, Z.; Tian, Z.; Wang, S.; He, P.; Wang, Y.; et al. Anisotropic mechanical properties and fracture mechanisms of textured h-BN composite ceramics. Mater. Sci. Eng. A 2014, 607, 38–43. [Google Scholar] [CrossRef]
- Yu, B.; Xing, W.; Guo, W.; Qiu, S.; Wang, X.; Lo, S.; Hu, Y. Thermal exfoliation of hexagonal boron nitride for effective enhancements on thermal stability, flame retardancy and smoke suppression of epoxy resin nanocomposites via sol–gel process. J. Mater. Chem. A 2016, 4, 7330–7340. [Google Scholar] [CrossRef]
- Sethulekshmi, A.S.; Jayan, J.S.; Appukuttan, S.; Joseph, K. MoS2: Advanced nanofiller for reinforcing polymer matrix. Phys. E Low Dimens. Syst. Nanostruct. 2021, 132, 114716. [Google Scholar] [CrossRef]
- Scharf, T.W.; Prasad, S.V. Solid lubricants: A review. J. Mater. Sci. 2013, 48, 511–531. [Google Scholar] [CrossRef]
- Chen, B.; Zhang, M.; Li, X.; Dong, Z.; Jia, Y.; Li, C. Tribological properties of epoxy-based self-lubricating composite coating enhanced by 2D/2D h-BN/MoS2 hybrid. Prog. Org. Coat. 2020, 147, 105767. [Google Scholar] [CrossRef]
- Sharma, S.M.; Anand, A. Solid lubrication in iron based materials–A review. Tribol. Ind. 2016, 38, 318–331. [Google Scholar]
- Cai, Q.; Scullion, D.; Gan, W.; Falin, A.; Zhang, S.; Watanabe, K.; Taniguchi, T.; Chen, Y.; Santos, E.J.G.; Li, L.H. High thermal conductivity of high-quality monolayer boron nitride and its thermal expansion. Sci. Adv. 2019, 5, eaav0129. [Google Scholar] [CrossRef] [PubMed]
- Gandi, A.N.; Schwingenschlögl, U. Thermal conductivity of bulk and monolayer MoS2. EPL (Europhys. Lett.) 2016, 113, 36002. [Google Scholar] [CrossRef]
- Rao, Y.S.; Shivamurthy, B.; Shetty, N.; Mohan, N.S. Thermomechanical properties of carbon fabric reinforced epoxy laminates with h-BN and MoS2 fillers. Mater. Res. 2021, 24. [Google Scholar] [CrossRef]
- Mongomery, D.C. Design and Analysis of Experiments; John Wiley & Sons: Hoboken, NJ, USA, 2017. [Google Scholar]
- Eneyew, E.D.; Ramulu, M. experimental study of surface quality and damage when drilling unidirectional CFRP composites. J. Mater. Res. Technol. 2014, 3, 354–362. [Google Scholar] [CrossRef]
- Shetty, N.; Herbert, M.A.; Shetty, R.; Shetty, D.S.; Vijay, G.S. Soft computing techniques during drilling of bi-directional carbon fiber reinforced composite. Appl. Soft Comput. 2016, 41, 466–478. [Google Scholar] [CrossRef]
- Brinksmeier, E.; Fangmann, S.; Rentsch, R. Drilling of composites and resulting surface integrity. CIRP Ann. 2011, 60, 57–60. [Google Scholar] [CrossRef]
- Paramasivam, B. Investigation on the effects of damping over the temperature distribution on internal turning bar using infrared fusion thermal imager analysis via smartview software. Measurement 2020, 162, 107938. [Google Scholar] [CrossRef]
- ASTME1862-14; Standard Practice for Measuring and Compensating for Reflected Temperature Using Infrared Imaging Radiometers. ASTM International: West Conshohocken, PA, USA, 2018. [CrossRef]
- Giasin, K.; Ayvar-Soberanis, S.; French, T.; Phadnis, V. 3D finite element modelling of cutting forces in drilling fibre metal laminates and experimental hole quality analysis. Appl. Compos. Mater. 2017, 24, 113–137. [Google Scholar] [CrossRef]
- Xu, J.; Li, C.; Mi, S.; An, Q.; Chen, M. Study of drilling-induced defects for CFRP composites using new criteria. Compos. Struct. 2018, 201, 1076–1087. [Google Scholar] [CrossRef]
- Krishnaraj, V.; Prabukarthi, A.; Ramanathan, A.; Elanghovan, N.; Senthil Kumar, M.; Zitoune, R.; Davim, J.P. Optimization of machining parameters at high speed drilling of carbon fiber reinforced plastic (CFRP) laminates. Compos. B Eng. 2012, 43, 1791–1799. [Google Scholar] [CrossRef]
- Liu, D.; Xu, H.H.; Zhang, C.Y.; Yan, H.J. Drilling force in high speed drilling carbon fibre reinforced plastics (CFRP) using half core drill. Adv. Mat. Res. 2010, 102–104, 729–732. [Google Scholar] [CrossRef]
- Díaz-Álvarez, J.; Olmedo, A.; Santiuste, C.; Miguélez, M. Theoretical estimation of thermal effects in drilling of woven carbon fiber composite. Materials 2014, 7, 4442–4454. [Google Scholar] [CrossRef] [PubMed]
- Joshi, H.S.; Pal, S.K.; Chakraborty, G. Study on the delamination of GFRP composites in drilling: A finite element model. In Simulations for Design and Manufacturing; Lecture Notes on Multidisciplinary Industrial, Engineering; Dixit, U., Kant, R., Eds.; Springer: Singapore, 2018. [Google Scholar] [CrossRef]
- Wu, X.; Wang, Z.; Chen, J.; Wang, X.; Qu, X. Research on preparation and performance of epoxy resin-boron nitride thermal-conductive composite. IOP Conf. Ser. Mater. Sci. Eng. 2018, 394, 022052. [Google Scholar] [CrossRef]
- Patel, S.H. Surface property modifiers. In Functional Fillers for Plastics; Marino, X., Ed.; Wiley-VCH Verlag GmbH & Co. KGaA: Weinheim, Germany, 2005; pp. 339–366. [Google Scholar] [CrossRef]
- Coromant, S. Machining Carbon Fibre Materials: User’s Guide; Sandviken, Sweden, 2010. [Google Scholar]
- Reeves, C.J.; Menezes, P.L.; Lovell, M.R.; Jen, T.C. Tribology of solid lubricants. In Tribology for Scientists and Engineers; Springer: New York, NY, USA, 2013; pp. 447–494. [Google Scholar] [CrossRef]
- Isbilir, O.; Ghassemieh, E. Numerical investigation of the effects of drill geometry on drilling induced delamination of carbon fiber reinforced composites. Compos. Struct. 2013, 105, 126–133. [Google Scholar] [CrossRef]
- Rao, Y.S.; Mohan, N.S.; Shetty, N.; Shivamurthy, B. Effects of solid lubricant fillers on the flexural and shear strength response of carbon fabric-epoxy composites. Polym. Test. 2021, 96, 107085. [Google Scholar] [CrossRef]
- Ulus, H.; Şahin, Ö.S.; Avcı, A. Enhancement of flexural and shear properties of carbon fiber/epoxy hybrid nanocomposites by boron nitride nano particles and carbon nano tube modification. Fibers Polym. 2015, 16, 2627–2635. [Google Scholar] [CrossRef]
- Rao, Y.S.; Basavannadevaru, S.; Subbarao, N.M.; Shetty, N. Influence of hBN and MoS2 fillers on toughness and thermal stability of carbon fabric-epoxy composites. Frat. Ed. Integrità Strutt. 2022, 16, 240–260. [Google Scholar] [CrossRef]
- Hejjaji, A.; Singh, D.; Kubher, S.; Kalyanasundaram, D.; Gururaja, S. Machining damage in FRPs: Laser versus conventional drilling. Compos. A Appl. Sci. Manuf. 2016, 82, 42–52. [Google Scholar] [CrossRef]
- Krishnaraj, V.; Zitoune, R.; Davim, J.P. Drilling of composites. In Drilling of Polymer-Matrix Composites; Springer: Berlin/Heidelberg, Germany, 2013; pp. 13–35. [Google Scholar] [CrossRef]
- Shiino, M.Y.; Faria, M.C.M.; Botelho, E.C.; Oliveira, P.C. Assessment of cumulative damage by using ultrasonic C-scan on carbon fiber/epoxy composites under thermal cycling. Mater. Res. 2012, 15, 495–499. [Google Scholar] [CrossRef]
- Kumar, D.; Gururaja, S. Machining damage and surface integrity evaluation during milling of UD-CFRP laminates: Dry vs. cryogenic. Compos. Struct. 2020, 247, 112504. [Google Scholar] [CrossRef]
- Iliescu, D.; Gehin, D.; Gutierrez, M.E.; Girot, F. Modeling and tool wear in drilling of CFRP. Int. J. Mach. Tools. Manuf. 2010, 50, 204–213. [Google Scholar] [CrossRef]
- Derringer, G.; Suich, R. Simultaneous optimization of several response variables. J. Qual. Technol. 1980, 12, 214–219. [Google Scholar] [CrossRef]
Disclaimer/Publisher’s Note: The statements, opinions and data contained in all publications are solely those of the individual author(s) and contributor(s) and not of MDPI and/or the editor(s). MDPI and/or the editor(s) disclaim responsibility for any injury to people or property resulting from any ideas, methods, instructions or products referred to in the content. |
© 2023 by the authors. Licensee MDPI, Basel, Switzerland. This article is an open access article distributed under the terms and conditions of the Creative Commons Attribution (CC BY) license (https://creativecommons.org/licenses/by/4.0/).