Article

Structural Characterization of Composites Based on Butadiene Rubber and Expanded Perlite

1
Department of Chemistry, Faculty of Education, Khartum University, Khartum 406, Sudan
2
Department of High-Molecular Compounds Chemistry, Faculty of Chemistry, Baku State University, AZ1148 Baku, Azerbaijan
3
Department Chemical & Chemical Processing Technology, Tatvan Vocat High School, Bitlis Eren University, Bitlis 13100, Turkey
4
Faculty of Sciences, Erciyes University, Kayseri 38039, Turkey
5
Technology Research and Application Center (ERU-TAUM), Erciyes University, Kayseri 38039, Turkey
6
Turkish Academy of Sciences (TUBA), Ankara 06670, Turkey
7
Women Researchers Council, Azerbaijan State University of Economics (UNEC), Istiglaliyyat 6, AZ1001 Baku, Azerbaijan
8
Department of Ecology, Faculty of Water Management and Engineering Communication Systems, Azerbaijan University of Architecture and Construction, AZ1073 Baku, Azerbaijan
9
School of High Technologies and Innovative Engineering, Western Caspian University, AZ1001 Baku, Azerbaijan
10
Nano Research Laboratory, Baku State University, AZ1148 Baku, Azerbaijan
*
Author to whom correspondence should be addressed.
J. Compos. Sci. 2023, 7(12), 487; https://doi.org/10.3390/jcs7120487
Submission received: 19 October 2023 / Revised: 8 November 2023 / Accepted: 20 November 2023 / Published: 24 November 2023
(This article belongs to the Special Issue Characterization of Polymer Nanocomposites)

Abstract

:
The article presents a method for obtaining new composites using the well-known mineral expanded perlite (EP), and the industrial polymer butadiene rubber (BR). For the design of composites, a joint oxidative chlorophosphorylation reaction of BR and EP (as well as BR and modified EP) was carried out, and the modifications resulting from these reactions were further hydrolyzed. The structure and morphology of the obtained samples were characterized in detail using Fourier transform infrared spectroscopy, ultraviolet-visible spectroscopy, X-ray powder diffraction, as well as scanning electron microscopy, and energy-dispersive X-ray analysis. EP and BR were separately modified with a similar reaction and characterized for data interpretation.

1. Introduction

Expanded perlite (EP) mainly consists of about 70–75% silicon dioxide, aluminum oxide, and other metal oxides. It is obtained through calcination at 850–900 °C of volcanic glassy hydrated rock perlite, which is a mineral of natural origin. EP particles are chemically inert, have low thermal conductivity, and have a spherical glass wall with pores of various sizes [1,2,3]. In industry, EP is applied in many fields such as horticultural fill, light-construction components, environmental and temperature insulators, and in the preparation of flame retardant, acoustic, and filter materials [1,2]. In addition, EP attracts the attention of researchers for its physical and chemical properties. In several works, scientists have studied the influence of EP waste on the properties of autoclaved aerated concrete [4] and have presented a method for using expanded perlite waste as a valuable, high-performance pozzolanic additional binder material [5]. Based on the literature, a new type of insulating material [6] and a magnetic nanocomposite [7] were developed.
Recently, EP/polymer composites have attracted impressive attention due to their attractive mechanical, thermal, and other properties. As with all mineral/polymer composites, the morphological structure, properties, and effective characteristics of EP/polymer composites depend on the interfacial interaction of EP particles with the polymer matrix, which is affected by the quality of the EP particle dispersion and the chemical compatibility of EP particles with the polymer matrix [8]. As expected, all this is determined by the methods of composite synthesis.
Polypropylene/amorphous aluminosilicate rock composites containing 0–20 wt% raw perlite and EP were synthesized with extrusion–compression molding by Esabbir et al. [9]. The method provides good dispersion, distribution, and interfacial adhesion of EP in the polymer matrix. In general, the mechanical properties and thermal stability of the polymer were improved by the addition of EP. It is known that epoxy resin and EP-based composites with desired ablative properties can be prepared by exploiting the mechanical mixing method and followed by gravity casting. As a result of this study, EP was observed to improve the ablative properties of epoxy resin [10]. The compression molding technique was applied by Arifuzzaman et al. to produce a new composite material using EP and recycled Styrofoam. The resulting material has low-weight, -sound, and -heat-insulating properties [11]. There is a known method for producing EP-filled high-density polyethylene (HDPE) composites by adding different weight fractions (5, 10, 20, and 30 wt%) of EP powder to the HDPE matrix using a thermokinetic mixer. From the mechanical tests, it was observed that the amount of EP has a different effect on the individual properties of composites [12]. Polyamide 6/acrylonitrile butadiene rubber/EP nanocomposites with different percentages of NBR phase and mineral nanoparticles were prepared using a melt-blending process. The peculiarity of this study was that two types of polymers (thermoplastic and elastomer) were used to prepare composites. The results confirmed that changing the percentage ratio of elastomer and EP nanoparticles makes it possible to obtain composites with optimal mechanical properties [13]. Akkaya et al. synthesized a novel poly(acrylamide-EP) composite through free-radical polymerization. It was revealed that acrylamide plays the role of a cross-linking agent for perlite, and the composite has an increased chemical resistance [14]. In another study, the adsorption properties of the composite against Tb3+ ions from aqueous solutions were investigated [15].
Thus, from the reviewed studies it is clear that to create EP/Polymer composites, researchers have proposed both physical [9,10,11,12,13] and chemical synthesis methods [14,15].
In the present study, industrial polymer–butadiene rubber (BR) was chosen as the polymer component for the preparation of EP/polymer composite. The synthesis procedure involved a joint reaction of oxidative chlorophosphorylation (OxCh) of BR and EP, followed by hydrolysis of the resulting intermediate composite. It should be noted that the OxCh reaction was previously used for the synthesis of phosphorus- and phosphorus/nitrogen-containing functional polymers (based on BR), as well as hybrid composites of BR with graphene nanoplates and bentonite [16,17,18]. The scientific novelty of the work lies in the fact that the OxCh reaction was used for the first time to synthesize an EP/polymer composite. The structure of new composites was studied using FTIR, XRD, UV-Vis, and SEM-EDX methods. For comparison, the results of a study of phosphorus-containing BR (without filler) synthesized using the same method are also presented. In addition, the preparation of composites of this type is because silanol groups are very sensitive to the presence of other organic molecules that can interact with them. These are groups that are present on the surface of the EP and can be attracted to organic molecules (in this case, rubber macromolecules).

2. Materials and Methods

2.1. Materials

BR was purchased from the Voronezh Synthetic Rubber Plant (Voronezh, Russian Federation. It consists of 96–98% cis-1,4 units. The EP was purchased from Bitlis (Turkey). Phosphorus trichloride (PCl3), carbon tetrachloride (CCl4), and sulfuric acid were used without further purification (Gorex Analyt GmbH, Bad Vilbel, Germany). Oxygen was supplied to the reaction medium by purging through the concentrated sulfuric acid.

2.2. Methods

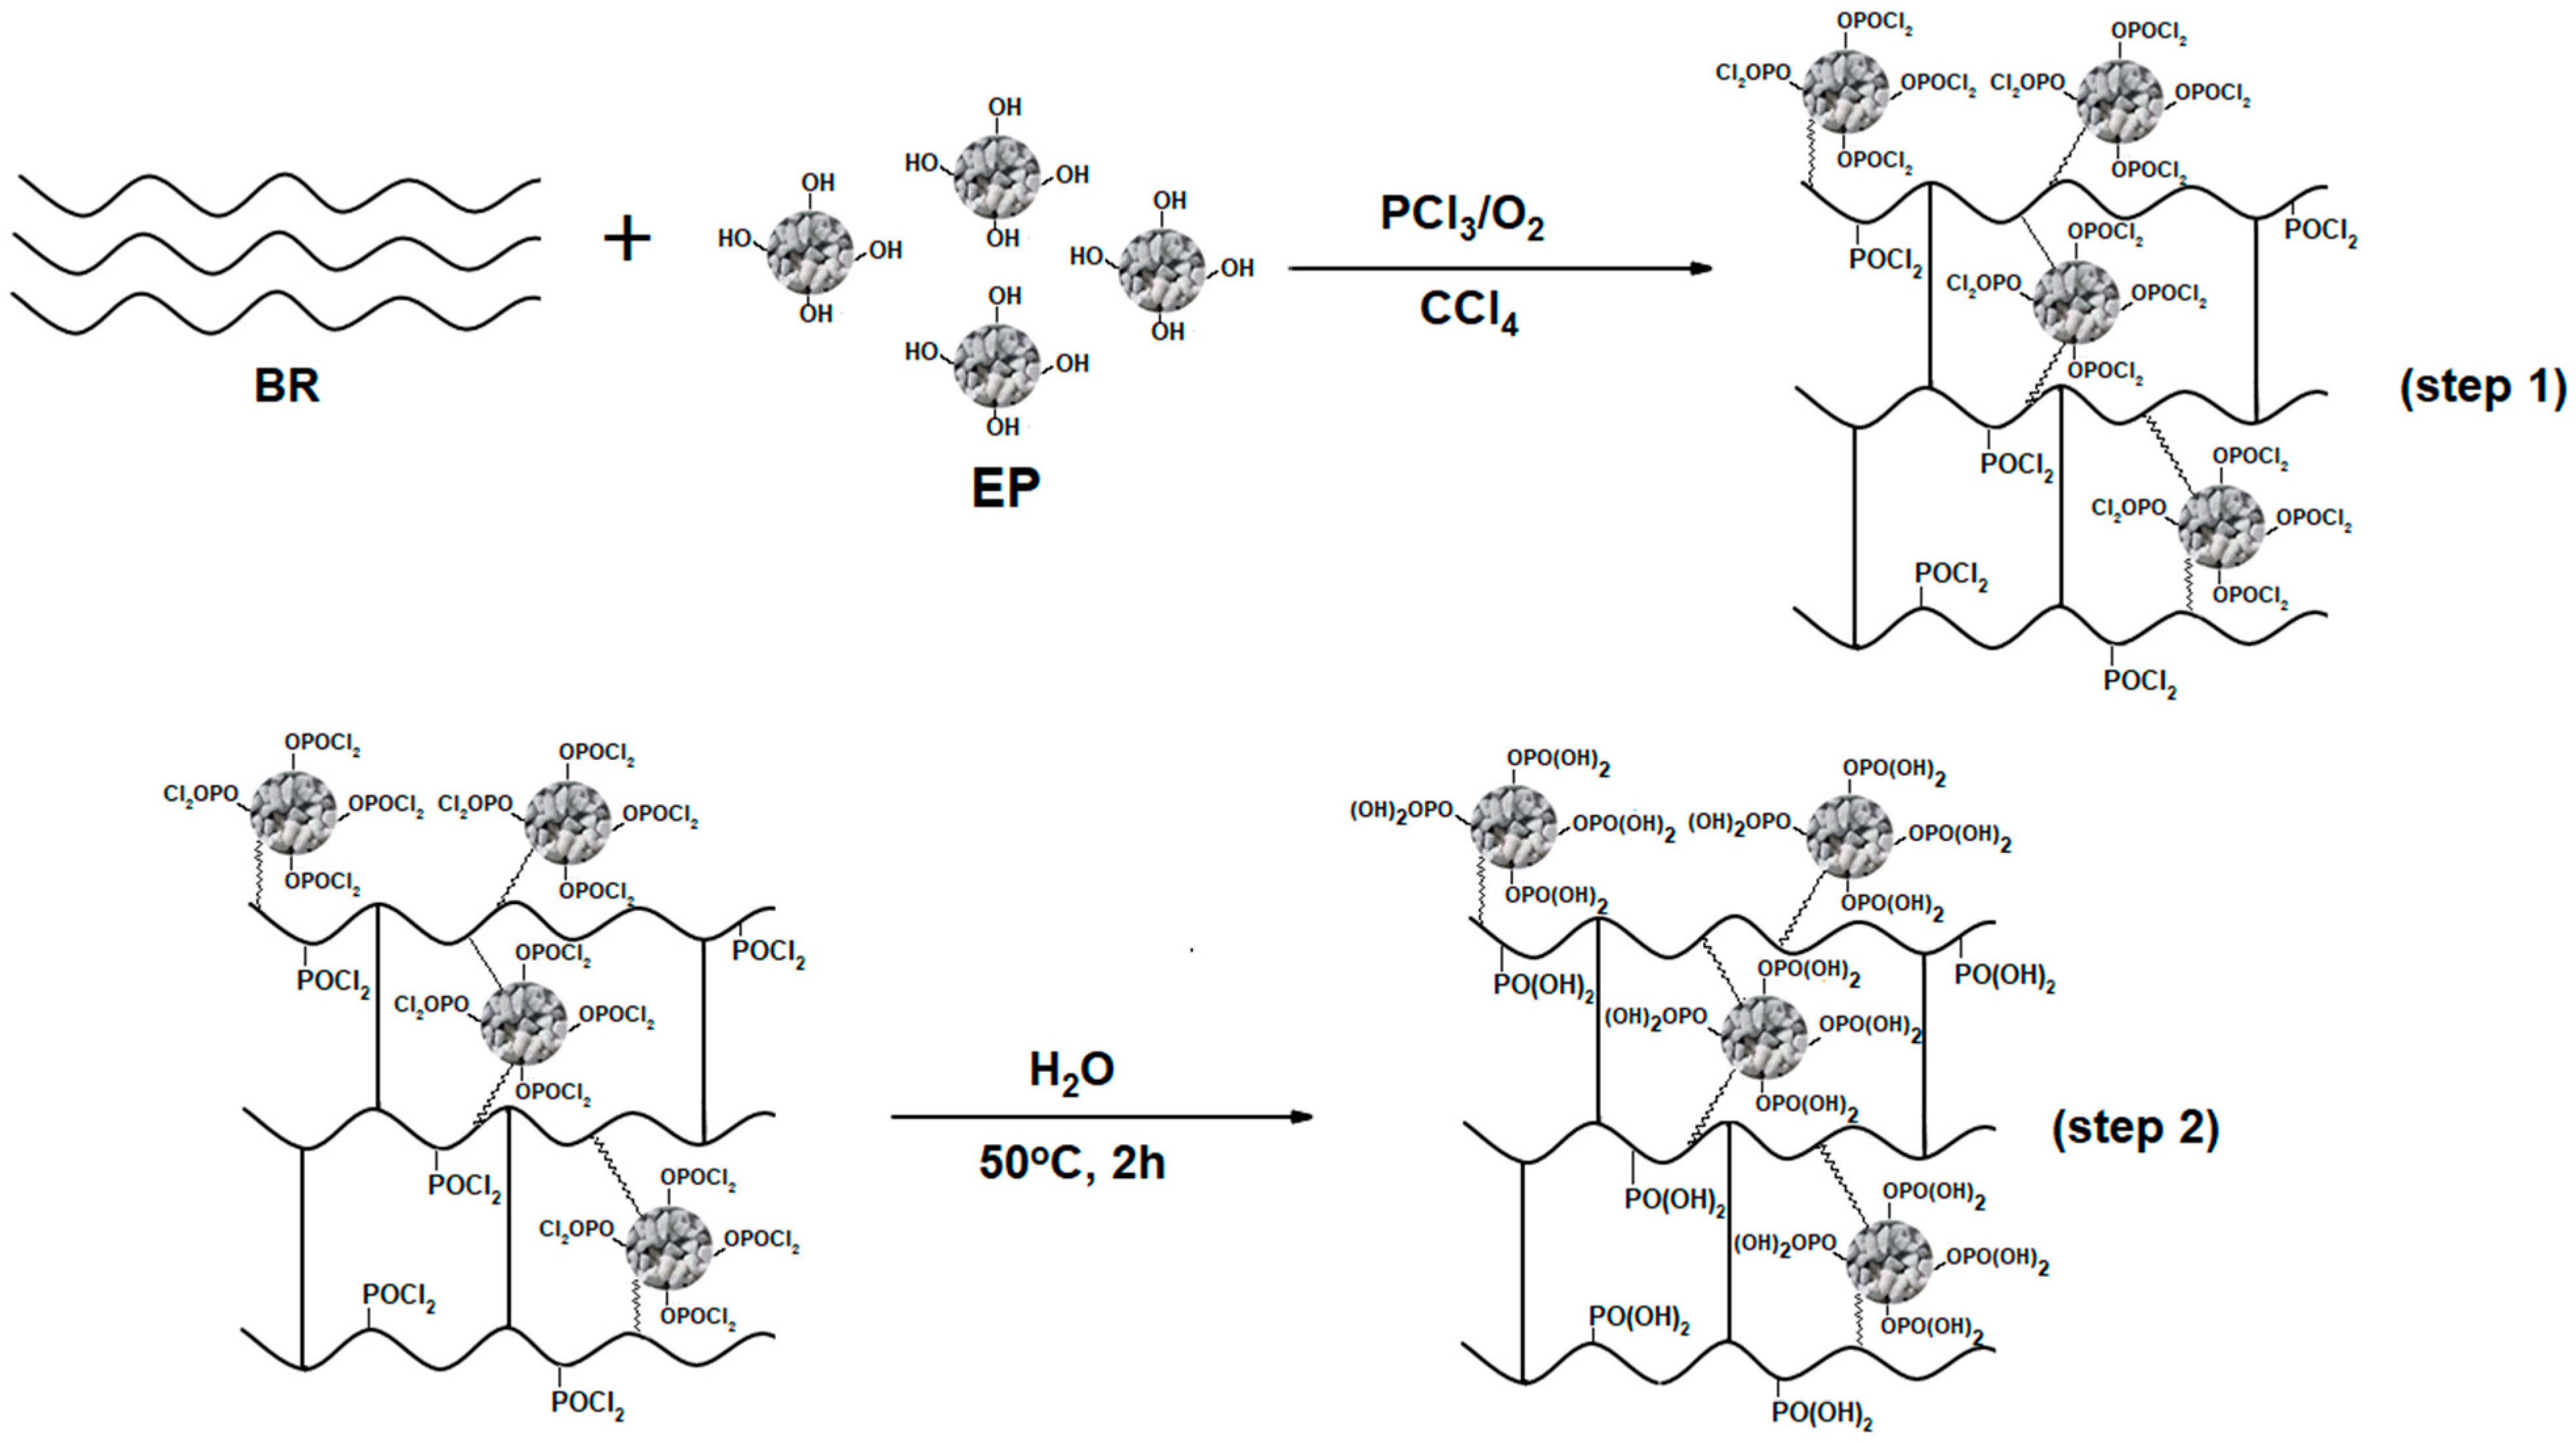
2.2.1. Synthesis of the First Type of Composite

The first type of composite was synthesized in two steps.
The first step is the OxCh reaction and was carried out as follows: A total of 5 g of BR was dissolved in 50 mL of CCl4 in a three-necked round-bottomed flask and 0.5 g of EP was added to this solution. The flask is equipped with a reflux condenser, a thermometer, and a bubbler to supply oxygen gas to the reaction zone. (Note: to carry out the OxCh reaction, the analogous reaction flask was used in all experiments). Oxygen is supplied to the reaction medium after passing through concentrated sulfuric acid to purify the gas, and then PCl3 is cautiously added in portions (the weight ratio of BR and PCl3 is equal to 1:3) to the reaction zone, and the supply of oxygen during the reaction is continuous at a rate of 7 L/h is kept. The nature of the reaction was exothermic, with the temperature rising to 50 °C. A dark-brown solid was obtained within 3 h (Figure 1, step 1) and then separated from the liquid using water-pump distillation. As a result, a composite with –P(O)(Cl)2 groups was obtained. This composite contains active P–Cl bonds that are easily hydrolyzed.
In the second step, the process of hydrolysis of the –P(O)(Cl)2 containing composite obtained in the first step was carried out with continuous stirring at 50 °C for 2 h (Figure 1, step 2). The product obtained at this step is filtered and washed with distilled water and then with acetone until the pH is neutral. The final product contained –P(O)(OH)2 groups and was dried first in air, and then in a vacuum drying oven at 50 °C for 2 h. The resulting composite is abbreviated EP/PhBR. The synthesis of the composite EP/PhBR is presented in Figure 1.

2.2.2. Synthesis of the PhEP

The PhEP was synthesized in two steps.
In the first step, EP was added to a reaction flask. The amount of added EP (g) is 2% of the volume of CCl4 (mL). The mixture in the flask was maintained with continuous stirring, and the reaction zone was enriched with oxygen at a rate of 7 L/h. PCl3 was carefully added to the reaction mixture at a mass ratio of EP to PCl3 of 1:6. The temperature rose to 38 °C; the reaction mixture turned yellowish white within 40 min; and the temperature dropped to room temperature (Figure 2, step 1). The product obtained in this stage was intermediate and was called phosphochlorinated EP (PhChEP). According to the reaction scheme, it contains –P(O)Cl2 groups. After this (Figure 2, step 2), it was hydrolyzed at 50 °C for 2 h. Finally, it was washed with deionized water until at a neutral medium, dried in air, and in a vacuum drying oven.

2.2.3. Synthesis of the Second Type of Composite

The second type of composite was synthesized in two steps.
In the first step, a suspension containing PhChEP and CCl4 was placed into the reaction flask. Then a 10% solution of pure BR in CCl4 was added to the mixture. The mixture in the flask was maintained with continuous stirring and the reaction zone was enriched with oxygen at a rate of 7 L/h. PCl3 was carefully added to the reaction mixture in a mass ratio of PhChEP/BR to PCl3 of 1:3. The temperature of the reaction medium gradually rose to 48 °C, and within 4 h a dark-brown solid was obtained in the medium. After 4 h, the temperature of the reaction medium did not increase when PCl3 was added, which indicated the completion of the reaction (Figure 3, step 1). After the first step, the solid product in the flask was separated from the liquid phase using a water pump. This solid product containing –P(O)(Cl)2 groups was then hydrolyzed at 50 °C for 2 h (Figure 3, step 2), after hydrolysis, the product was washed with deionized water, first dried in air, and then in a vacuum drying oven. The resulting composite is abbreviated PhEP/PhBR. The synthesis of the PhEP/PhBR composite is shown in Figure 3.

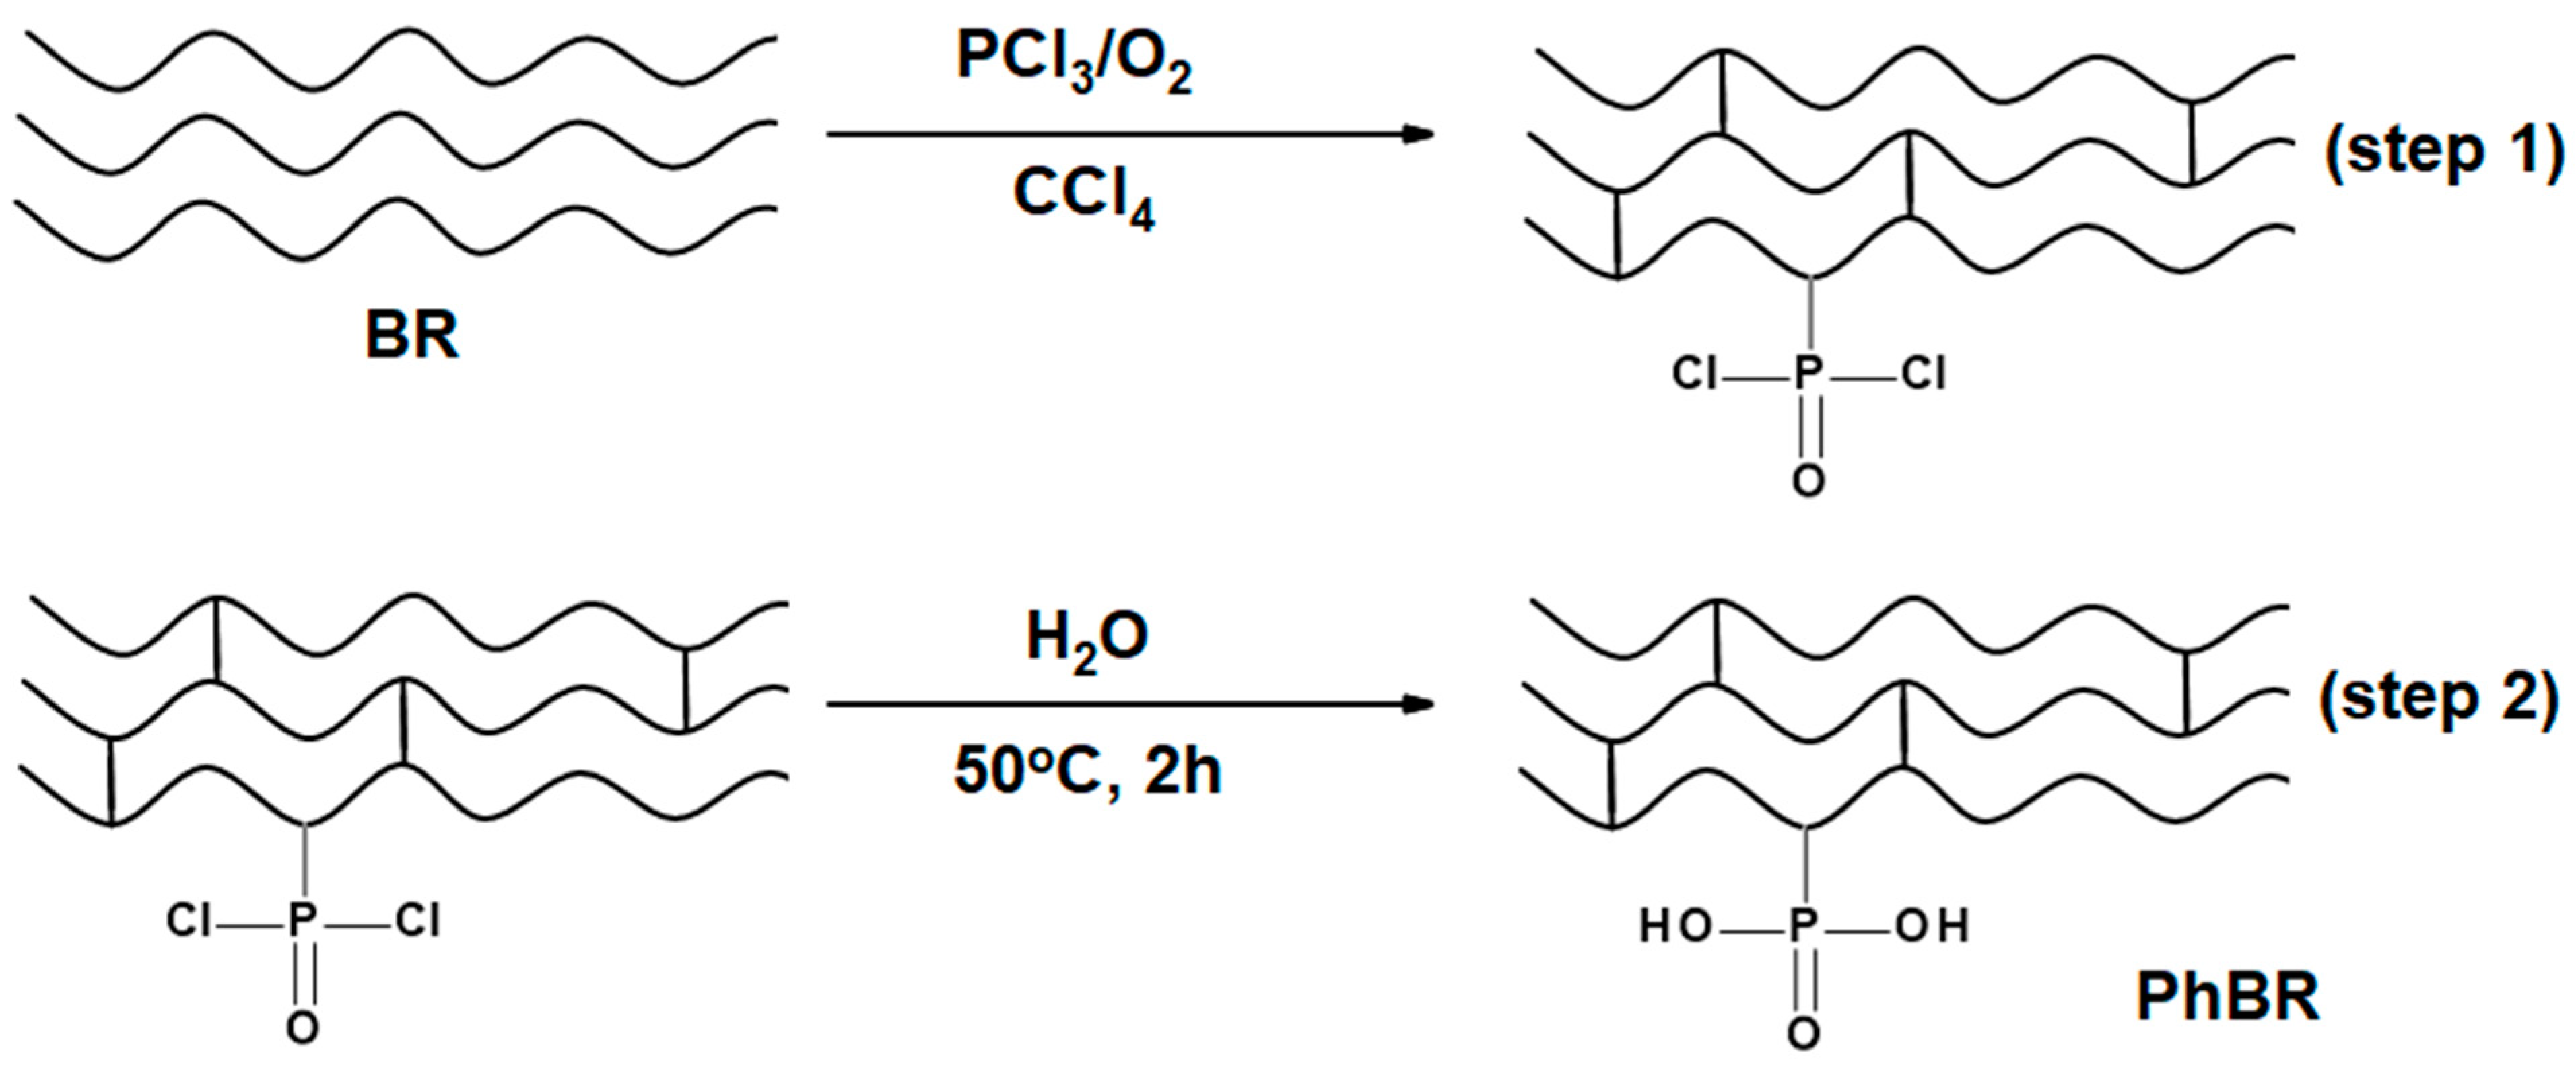
2.2.4. Synthesis of PhBR

A viscous solution of 6% BR in CCl4 was prepared in a three-necked flask equipped with a reflux condenser, a thermometer, and an oxygen-gas supplier, and kept under stirring. Gaseous oxygen was plugged into the reaction medium at a rate of 7 L per hour to purge the reaction medium. The reaction started by adding 10 mL of PCl3 dropwise to the mixture (the first step); the temperature rose to 51 °C, indicating the exothermic nature of the reaction. After 3 h, a thick-brown solid formed in the medium, and the temperature dropped to room temperature (Figure 4, step 1). Thereafter, the liquid phase containing (PCl3, CCl4, and POCl3) was separated from the solid phase by distillation connected to a vacuum pump. The solid containing –P(O)(Cl)2 groups was then hydrolyzed at 50 °C for 2 h (Figure 4, step 2), washed with deionized water, and finally dried in the air and a vacuum [16]. The synthesis of the PhBR is shown in Figure 4.
The abbreviations of all samples used and synthesized in this research work are given in Table 1.

2.2.5. Characterization Techniques

FTIR spectra of all samples were measured using a Perkin Elmer Spectrum 100 FTIR spectrophotometer in the range of 650–4000 cm−1. Its resolution value is 4 cm−1 and four standard scans were taken. Samples (without using KBr or NaCl) were clamped under the ATR disc and the measurements were taken.
UV-Vis spectroscopy studies of the samples were carried out using the Specord 210 Plus UV-Vis spectrophotometer (Analytik Jena, Jena, Germany) in the wavelength range of 190–700 nm. The measurements were carried out using a solid-sample holder, which allowed the samples to be studied in the form of powder.
XRD patterns were recorded on a Rigaku Mini Flex 600 X-ray diffractometer (λ = 1.54060 Å) using the Ni-filtered Cu Kα radiation with a step width of 0.1° and a scanning speed/duration time of 5°/min in the 2θ range from 10° to 90°.
The surface morphology of the samples was observed using a field-emission scanning electron microscope (Zeiss Gemini 500, Carl Zeiss SMT AG, Jena, Germany) after coating with gold (about five nm thick). EDX spectroscopy was used to identify the elements present in the samples.

3. Results and Discussion

It should be noted that the characterization of PhBR has been studied in detail in our previous studies [16,19]. In particular, the existence of a C–O–C bond between macromolecules was proven using the solid-phase NMR method [19]. In addition, the presence of C–Cl fragments in the polymer matrix was confirmed using thermogravimetric-mass spectrometric analysis [16]. Nevertheless, for a clearer understanding and detailed comparison of the results obtained for EP/PhBR and PhEP/PhBR composites, this paper also presents the results obtained for PhBR (since PhBR was used as a matrix for the preparation of EP/PhBR and PhEP/PhBR composites).

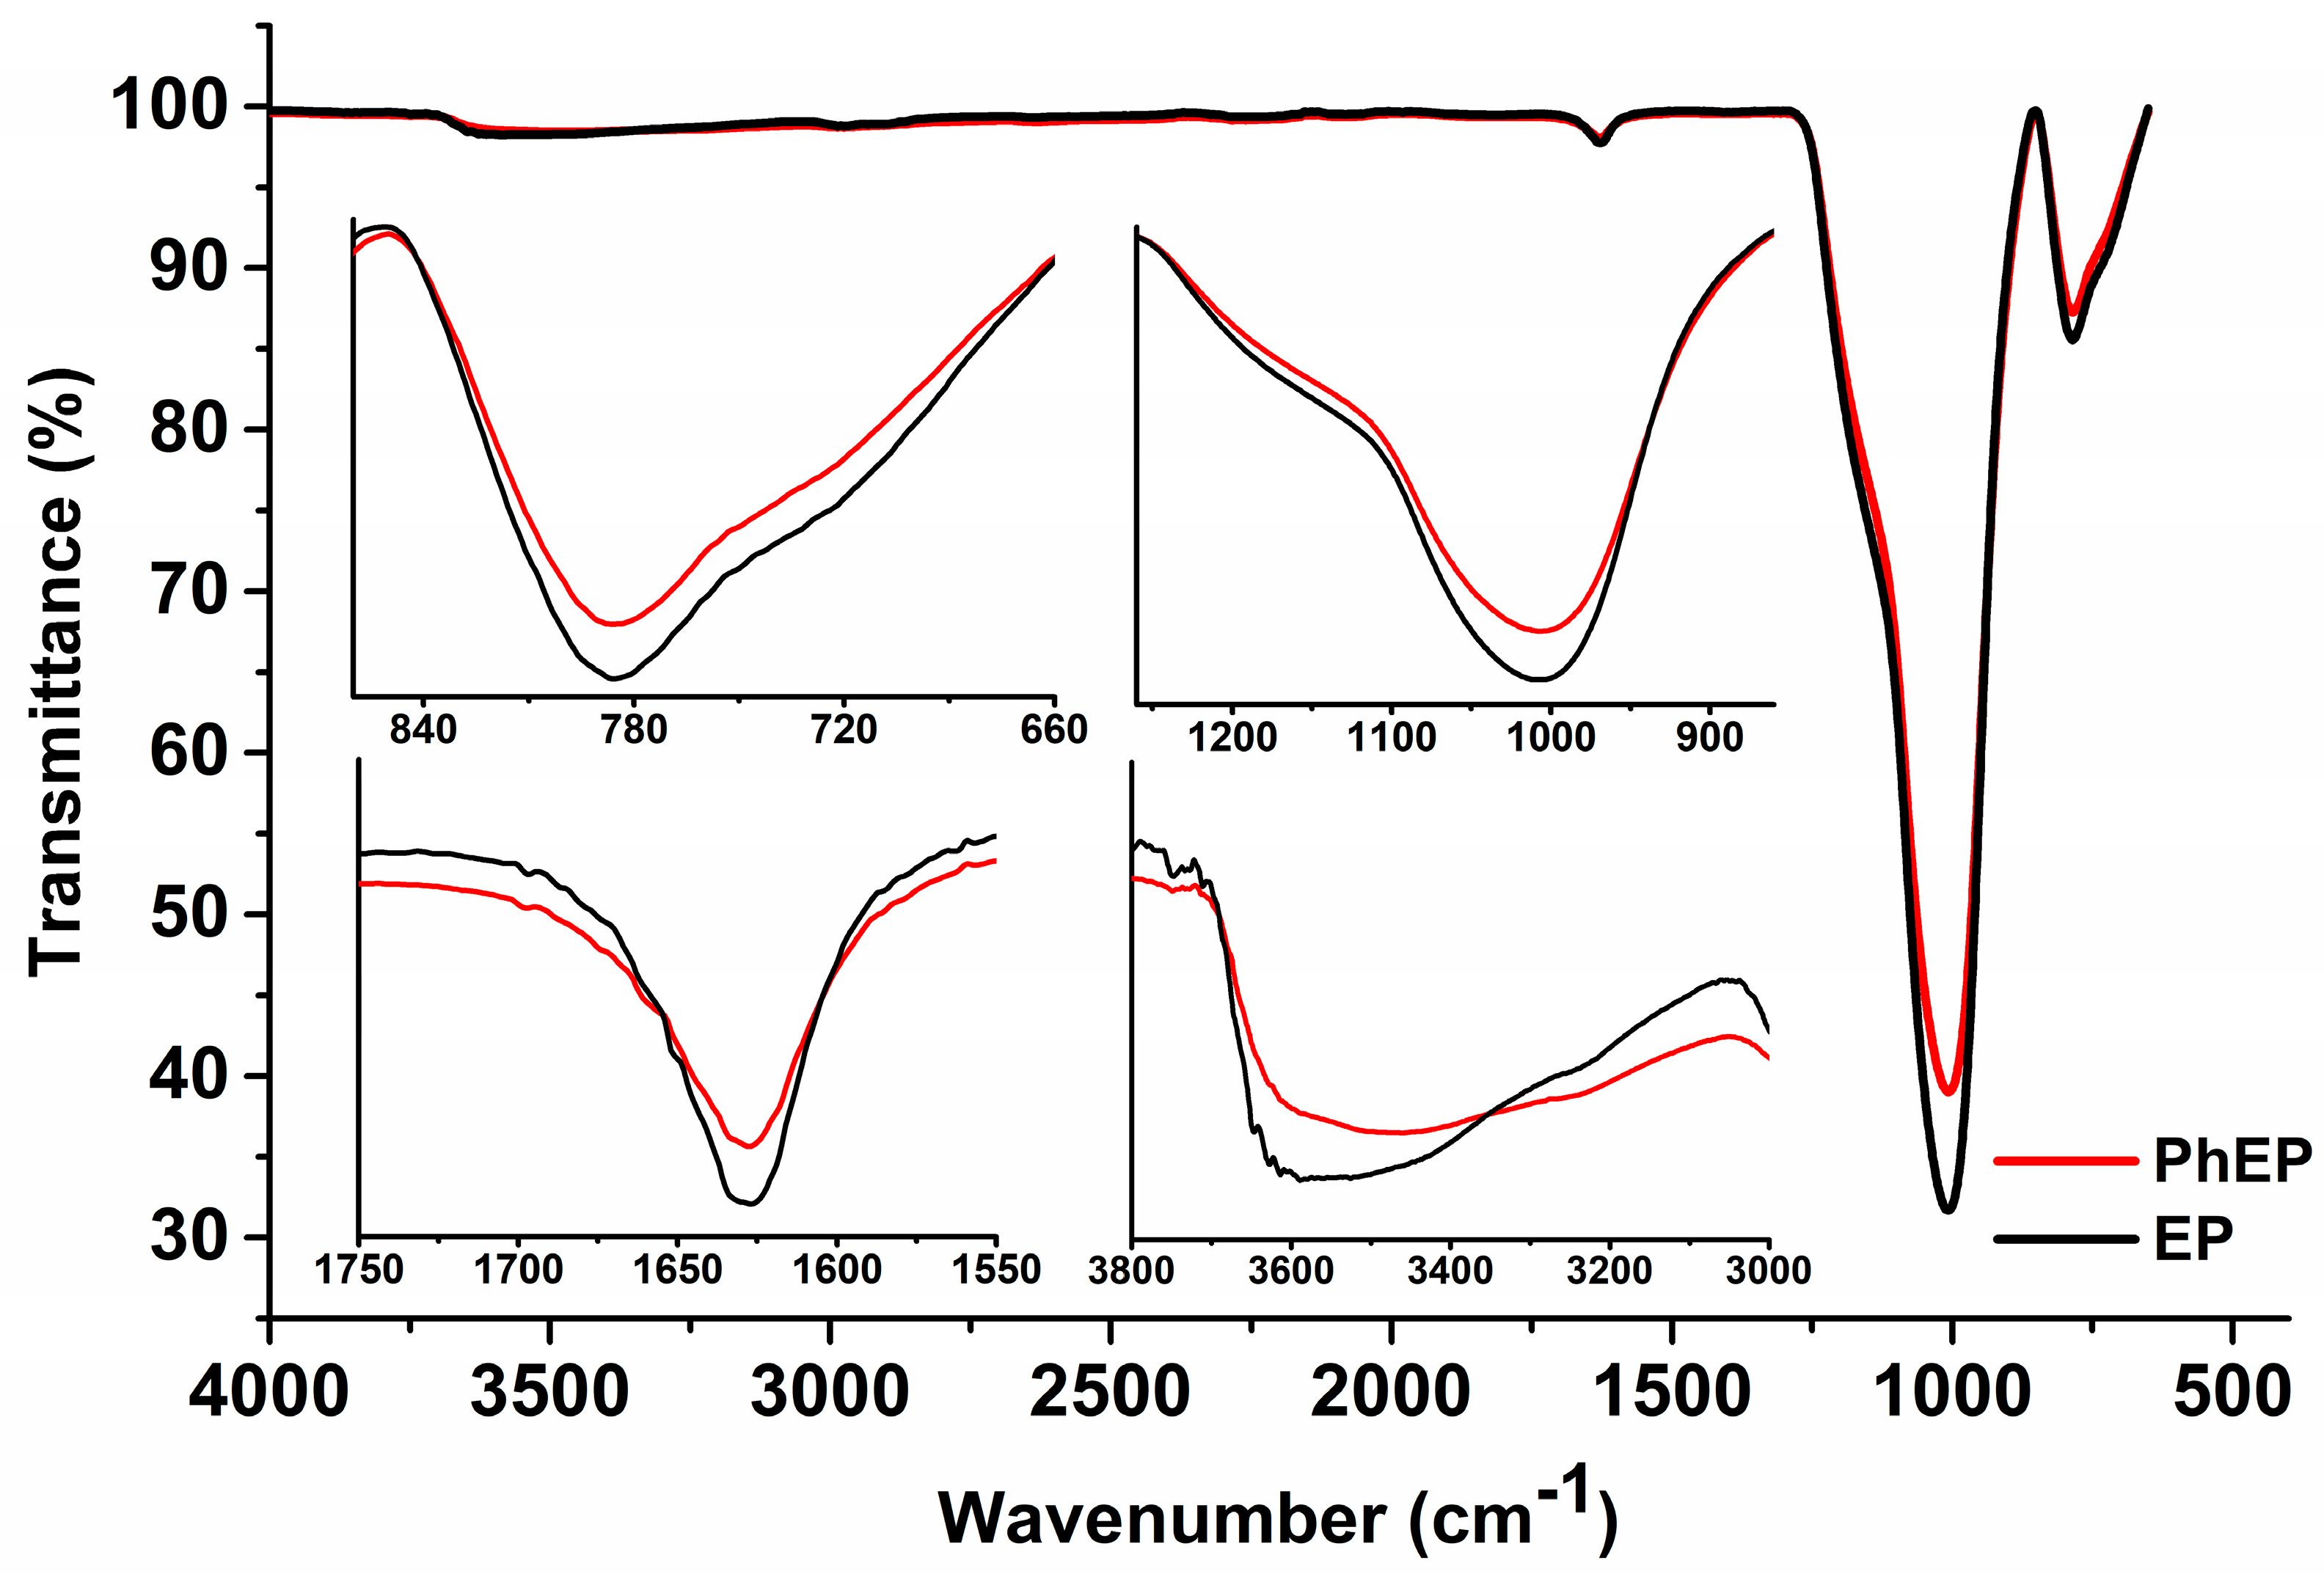
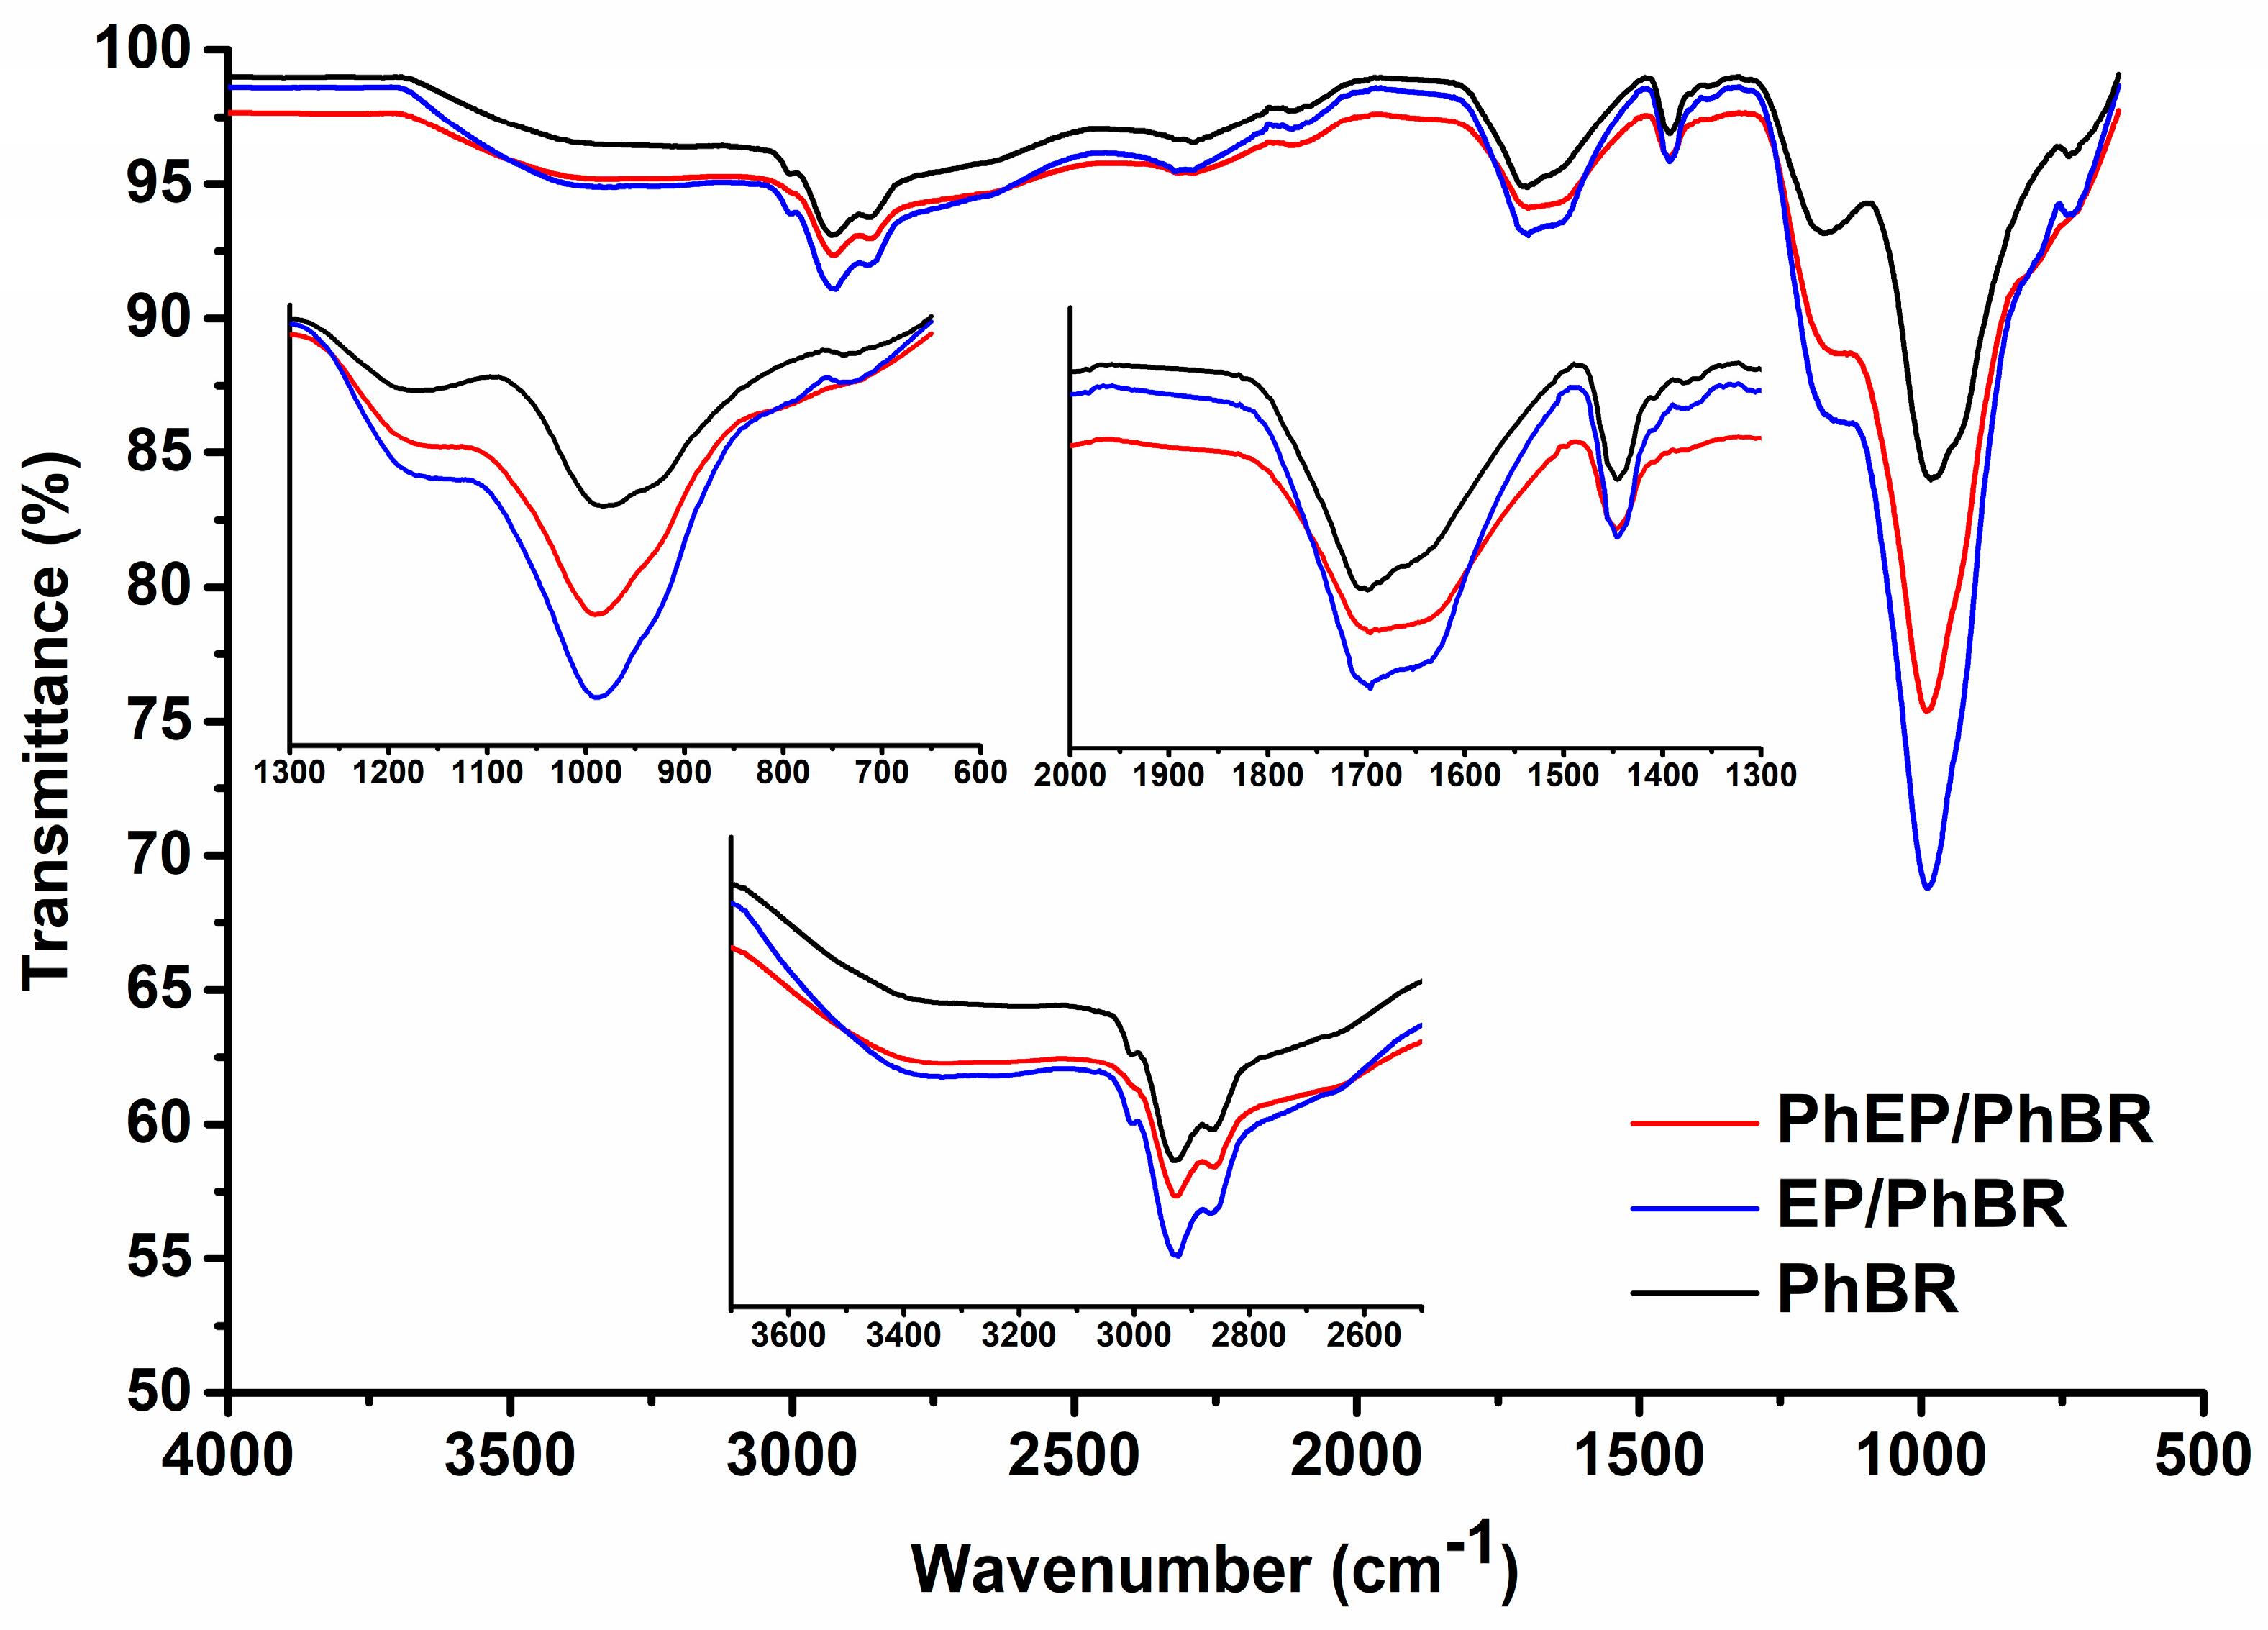
3.1. FTIR Spectroscopy

To investigate the modification of EP through the OxCh reaction, the FTIR spectra of EP and PhEP were compared (Figure 5).
The FTIR spectrum of EP (black line) contains the following main absorption bands: 1628 cm−1, 1000 cm−1, and 787 cm−1. In addition, a wide band is observed in the 3650–3350 cm−1 range. The strong band at 1000 cm−1 relates to the vibration of the Si–O bond, which is to be expected since the main constituent of the EP is silicon oxide (SiO2). A broad band in the range of 3650–3350 cm−1 indicates axial deformation of the OH of Si–OH groups of the EP. The peak located at 787 cm−1 is attributed to the Si–O stretching vibration of Si–O–Al. The peak at 1628 cm−1 is attributed to adsorbed water [20,21].
In the FTIR spectrum of PhEP (red line), it was observed that the absorption bands around 1000 and 787 cm−1 associated with the bond vibration of the Si–O groups present in the unmodified EP became more oval. In addition, small shoulders are visible in the range of 787–758 cm−1 and 1083–1000 cm−1. There was probably an overlap of bands associated with modified silanol groups and absorption bands associated with P=O and P–OH groups, which are located almost in the region of 810–1100 cm−1 [16,17,18,22]. The spectrum also shows a relatively broad band in the range from 3100 to 3600 cm−1, due to the OH stretching absorption of the –P(O)(OH)2 groups [16]. All these observations confirm that the phosphoric acid groups have functionalized the EP surface, although not deeply.
In general, over the entire interval, the PhEP absorption bands had lower intensity than the EP. These results indicate partial breaking of bonds in the Si–O–Si fragment during the OxCh reaction. These data are in good agreement with the data given in the literature. The authors noted that after treatment with alkali, the intensity of the characteristic EP bands decreases [23].
The spectra of PhBR and composites are presented in Figure 6.
As mentioned in our previous work, PhBR is characterized mainly by the following functional groups: P=O, –P(O)(OH)2, P–OH. The band appearing at 1180 cm−1 can be attributed to vibrations of the P=O groups. The IR bands at 1702, 2864, and 3394 cm−1 are attributed to the –OH vibration in –PO(OH)2 groups. An intensive band at 986 cm−1, corresponding to the C–O–P bond, indicates the attachment of the –PO(OH)2 groups to the macromolecular chain via oxygen. The absorption band of the P–OH group can also appear in the 900–950 cm−1, which is observed in the form of a shoulder at 926 cm−1. In addition, CH2 groups include clearly visible bands in the range of 1400–1500 cm−1, which is characteristic of BR [24].
As can be seen from the figure, the spectra of the composites (Figure 6, blue and red lines) contain absorption bands characteristic of both PhBR and PhEP, but of course, with some changes. This confirms that the composites consist of BR and EP.
In the spectra of composites, it was observed that the absorption band at 1000 cm−1, associated with the vibration of the Si–O bond of the group present in the unmodified EP, is shifted to a lower wavenumber; in this case, the band appears at 994 cm−1. This may be due to the formation of hydrogen bonds between the functional groups of the PhEP and the PhBR. This is also supported by the fact that the shoulder present in the PhBR spectrum (at 926 cm−1) is practically invisible in composites. This means that the P–OH groups present in the PhBR are involved in the polymer–mineral interaction in the composites. The absorption band in the range of 980–1000 cm−1 in the composites is more intense than in PhBR. There was probably an overlap between the bands of silanol groups in PhEP and the absorption bands of the C–O–P bond, which are practically in the same spectral region.
In the range of 1050–1200 cm−1, the spectra of the composites differ from the spectrum of PhBR; namely, the intensity of the absorption band present at 1180 cm−1 (related to P=O groups) is significantly reduced in the composites. This is explained by the fact that in composites a hydrogen bond is formed at the oxygen of the phosphoryl group.
In general, when comparing the spectra of the composites and PhBR, it is clear that the following pattern is observed in the intensity of absorption bands:
Intensity (PhBR) < Intensity (PhEP/PhBR) < Intensity (EP/PhBR)
Namely, over the entire range, the absorption band of the first type composite (EP/PhBR) is more intense than that of the second type composite (PhEP/PhBR). According to the synthesis conditions, EP in the PhEP/PhBR composite should be more modified. These results are in good agreement with the data presented in Figure 5. According to the FTIR spectra, the corresponding absorption bands in the PhEP have lower intensity.

3.2. UV-Vis Spectroscopy

By studying the optical properties of the samples, it is possible to form an opinion about their possible applications. For example, UV-Vis studies can provide some insight into the photocatalytic activity of materials, and UV-Vis studies have also been carried out for this purpose. Studying absorption spectra is a method for obtaining additional information about the structure of a material.
Figure 7 shows the UV-Vis spectra of EP and PhEP (a), EP/PhBR and PhEP/PhBR composites (b), and PhBR (c). In the UV-Vis spectra of both EP and PhEP samples, peaks characteristic of aluminosilicates and explaining the presence of silica were observed at wavelengths of 254 nm and 243 nm, respectively [25]. As can be seen from Figure 7a, after the OxCh reaction of EP, the observed peak at 254 nm shifted to lower wavelengths (243 nm), and visible-light absorption improved. This change can be caused by quantum size effects [26]. A similar phenomenon was also observed in g-C3N4 grafted expanded perlite [27].
As can be seen from the UV-Vis spectra of EP/PhBR and PhEP/PhBR composites (Figure 7b) and PhBR (Figure 7c), all samples exhibit strong absorption in the visible-light region. Interestingly, in contrast to PhBR, a red shift was observed in the UV-Vis spectrum of EP/PhBR, and a blue shift was observed in the UV-Vis spectrum of PhEP/PhBR. The red shift in the UV-Vis spectrum of EP/PhBR is related to the incorporation of EP into the PhBR matrix and has been observed in composite materials in many research studies [28,29]. This may also be due to the formation of an H-bond between –OH of EP and O=P– in phosphoric acid groups of PhBR. A similar situation was observed in the composites formed due to the H-bond between the amine groups of polyaniline and the hydroxyl groups of Fe3O4 [30]. It is known from the literature that when PVA is functionalized with phosphate groups, a blue shift is observed in the UV-Vis spectrum [31]. PhEP contains phosphate groups, indicating that the number of phosphate groups in PhEP/PhBR is higher than that of PhBR and EP/PhBR. Thus, the blue shift observed in PhEP/PhBR may also be due to phosphate groups. This can also be seen from the SEM results.
The optical band gap of the samples was calculated based on the Tauc formula [32]:
(αhν)n = C(hν-Eg)
where h is Planck’s constant; C is constant; ν is the frequency; Eg is the optical band gap; α absorption coefficient; and n is 1/2 in the case of indirect allowed transitions and 2 for direct allowed transitions.
It can be seen from Figure 8 that the indirect optical band gap of PhEP (3.43 eV) is smaller than the indirect optical band gap of EP (3.59 eV). That is, the effect of the acids obtained during the OxCh reaction and the hydrolysis of the intermediate product on the EP led to a decrease in its optical band gap. Reduction of the optical band gap was also observed in acid-activated bentonite under microwave irradiation with hydrochloric and sulfuric acids to obtain photocatalytic activity [33].
Different situations were observed in the two composites obtained based on PhBR. The addition of EP decreased the optical band gap to 3.00 eV in PhBR (Figure 9b). However, the optical band gap increased after combining PhEP and PhBR to 3.27 eV (Figure 9c). This phenomenon can be explained as follows. It is known from the literature that the width of the optical band of polyvinyl alcohol films modified with phosphoric acid increases with increasing acid concentration, because there is a relationship between the concentration of phosphoric acid and the amount of defects in the films. The amount of defects in films decreases with excess concentration of phosphoric acid. It is known that defects in films form localized states in the optical band gap, and these localized states overlap. If the overlap in localized states decreases, the energy band gap increases due to the increase in phosphoric acid concentration in the polymer matrix [34]. Based on the above, the following conclusions can be drawn: In the PhEP/PhBR composite, EP was initially modified by the OxCh reaction. This indicates that there is a chemical affinity between the polymer and mineral components in this type of composite and that there are fewer structural defects in the composite. As a result, an increase in the optical band gap is observed; in the EP/PhBR composite, the inclusion of EP in the PhBR matrix led to the formation of structural defects, and, as a result, reduced the optical band gap.

3.3. XRD Analysis

XRD analysis of the EP sample was usually performed to confirm the presence of ordered (e.g., zeolite) or disordered (e.g., amorphous silica) oxide materials [23]. XRD patterns of EP and PhEP samples are given in Figure 10. As can be seen from the figure, EP consists of an amorphous mineral phase (amorphous silica (SiO2)), with a glassy mass observed between 10° and 40° values of 2θ. After the OxCh reaction of EP, the diffraction peak corresponding to the amorphous phase was not changed in shape, and this indicates no change in the porous structure of the EP during modification and the phosphorus-containing groups attached to the surface of EP. However, after the OxCh reaction of EP, a new crystalline peak was observed at the value of 24.6° of 2θ [35]. The increase in the intensity of the peak at the value of 24.6° of 2θ after the OxCh reaction can be explained as follows: It is known from the literature that the composition of EP consists of SiO2, Al2O3, CaO, MgO, Fe2O3, Na2O, K2O oxides, and trace amounts of metal oxides [36]. HCl and H3PO4 acids released when hydrolyzing the modification obtained from the OxCh reaction of EP can react with amphoteric and basic oxides in expanded perlite and reduce the amount of these oxides because of washing. At this time, the amount of SiO2 acid oxide, which does not react with acids, increases compared to other oxides in the material. Based on the literature’s data, the peak observed at 2θ value of 24.6° can be attributed to amorphous SiO2 [23]. A similar phenomenon was observed in the XRD patterns of the product obtained from the modification of EP with NaOH and HCl [23]. The noted diffraction peak has also been observed by several authors [37,38] at values close to 2θ and is a good match with JCPDS data (card No. 01-086-1561) [39].
XRD patterns of PhBR, EP/PhBR, and PhEP/PhBR composite samples are given in Figure 11. As can be seen from the figure, in the XRD patterns of PhBR, EP/PhBR, and PhEP/PhBR composite samples, diffraction peaks corresponding to the amorphous phase are observed between 10° and 40° angles of 2θ. Additionally, these peaks corresponding to the amorphous phase are similar for the PhBR, EP/PhBR, and PhEP/PhBR composite samples, and no new diffraction peaks were observed. This indicates that the porous structure of EP is not changed in both EP/PhBR and PhEP/PhBR composites.
Comparing the XRD patterns of PhBR and EP/PhBR composite samples (Figure 11), it can be seen that the observed amorphous halo is broader in EP/PhBR composite than in PhBR and shifted to higher angles of 2θ. This may be due to the formation of a new amorphous phase in the PhBR matrix by the addition of EP. A similar situation was observed in the perlite and geopolymer synthesized from perlite [35].
To compare the intensity of the amorphous halo observed in the XRD patterns of the EP/PhBR and PhEP/PhBR composites, the patterns were normalized to the same baseline using OriginPro 2015 computer software.
As can be seen from the comparison of XRD patterns of EP/PhBR and PhEP/PhBR composites (Figure 12), the amorphous halo observed between 10° and 40° values of 2θ is more intense in PhEP/PhBR composite than in EP/PhBR composite. This may be related to the chemical bonding formations between the filler and the polymer matrix in the PhEP/PhBR composite, because PhEP has better dispersion and interaction with the PhBR matrix than EP, and this may be due to the presence of phosphorus-containing acidic groups on the surface of PhEP. A similar situation was obtained in the results of XRD studies of EP/acrylonitrile-butadiene-styrene composite [2].

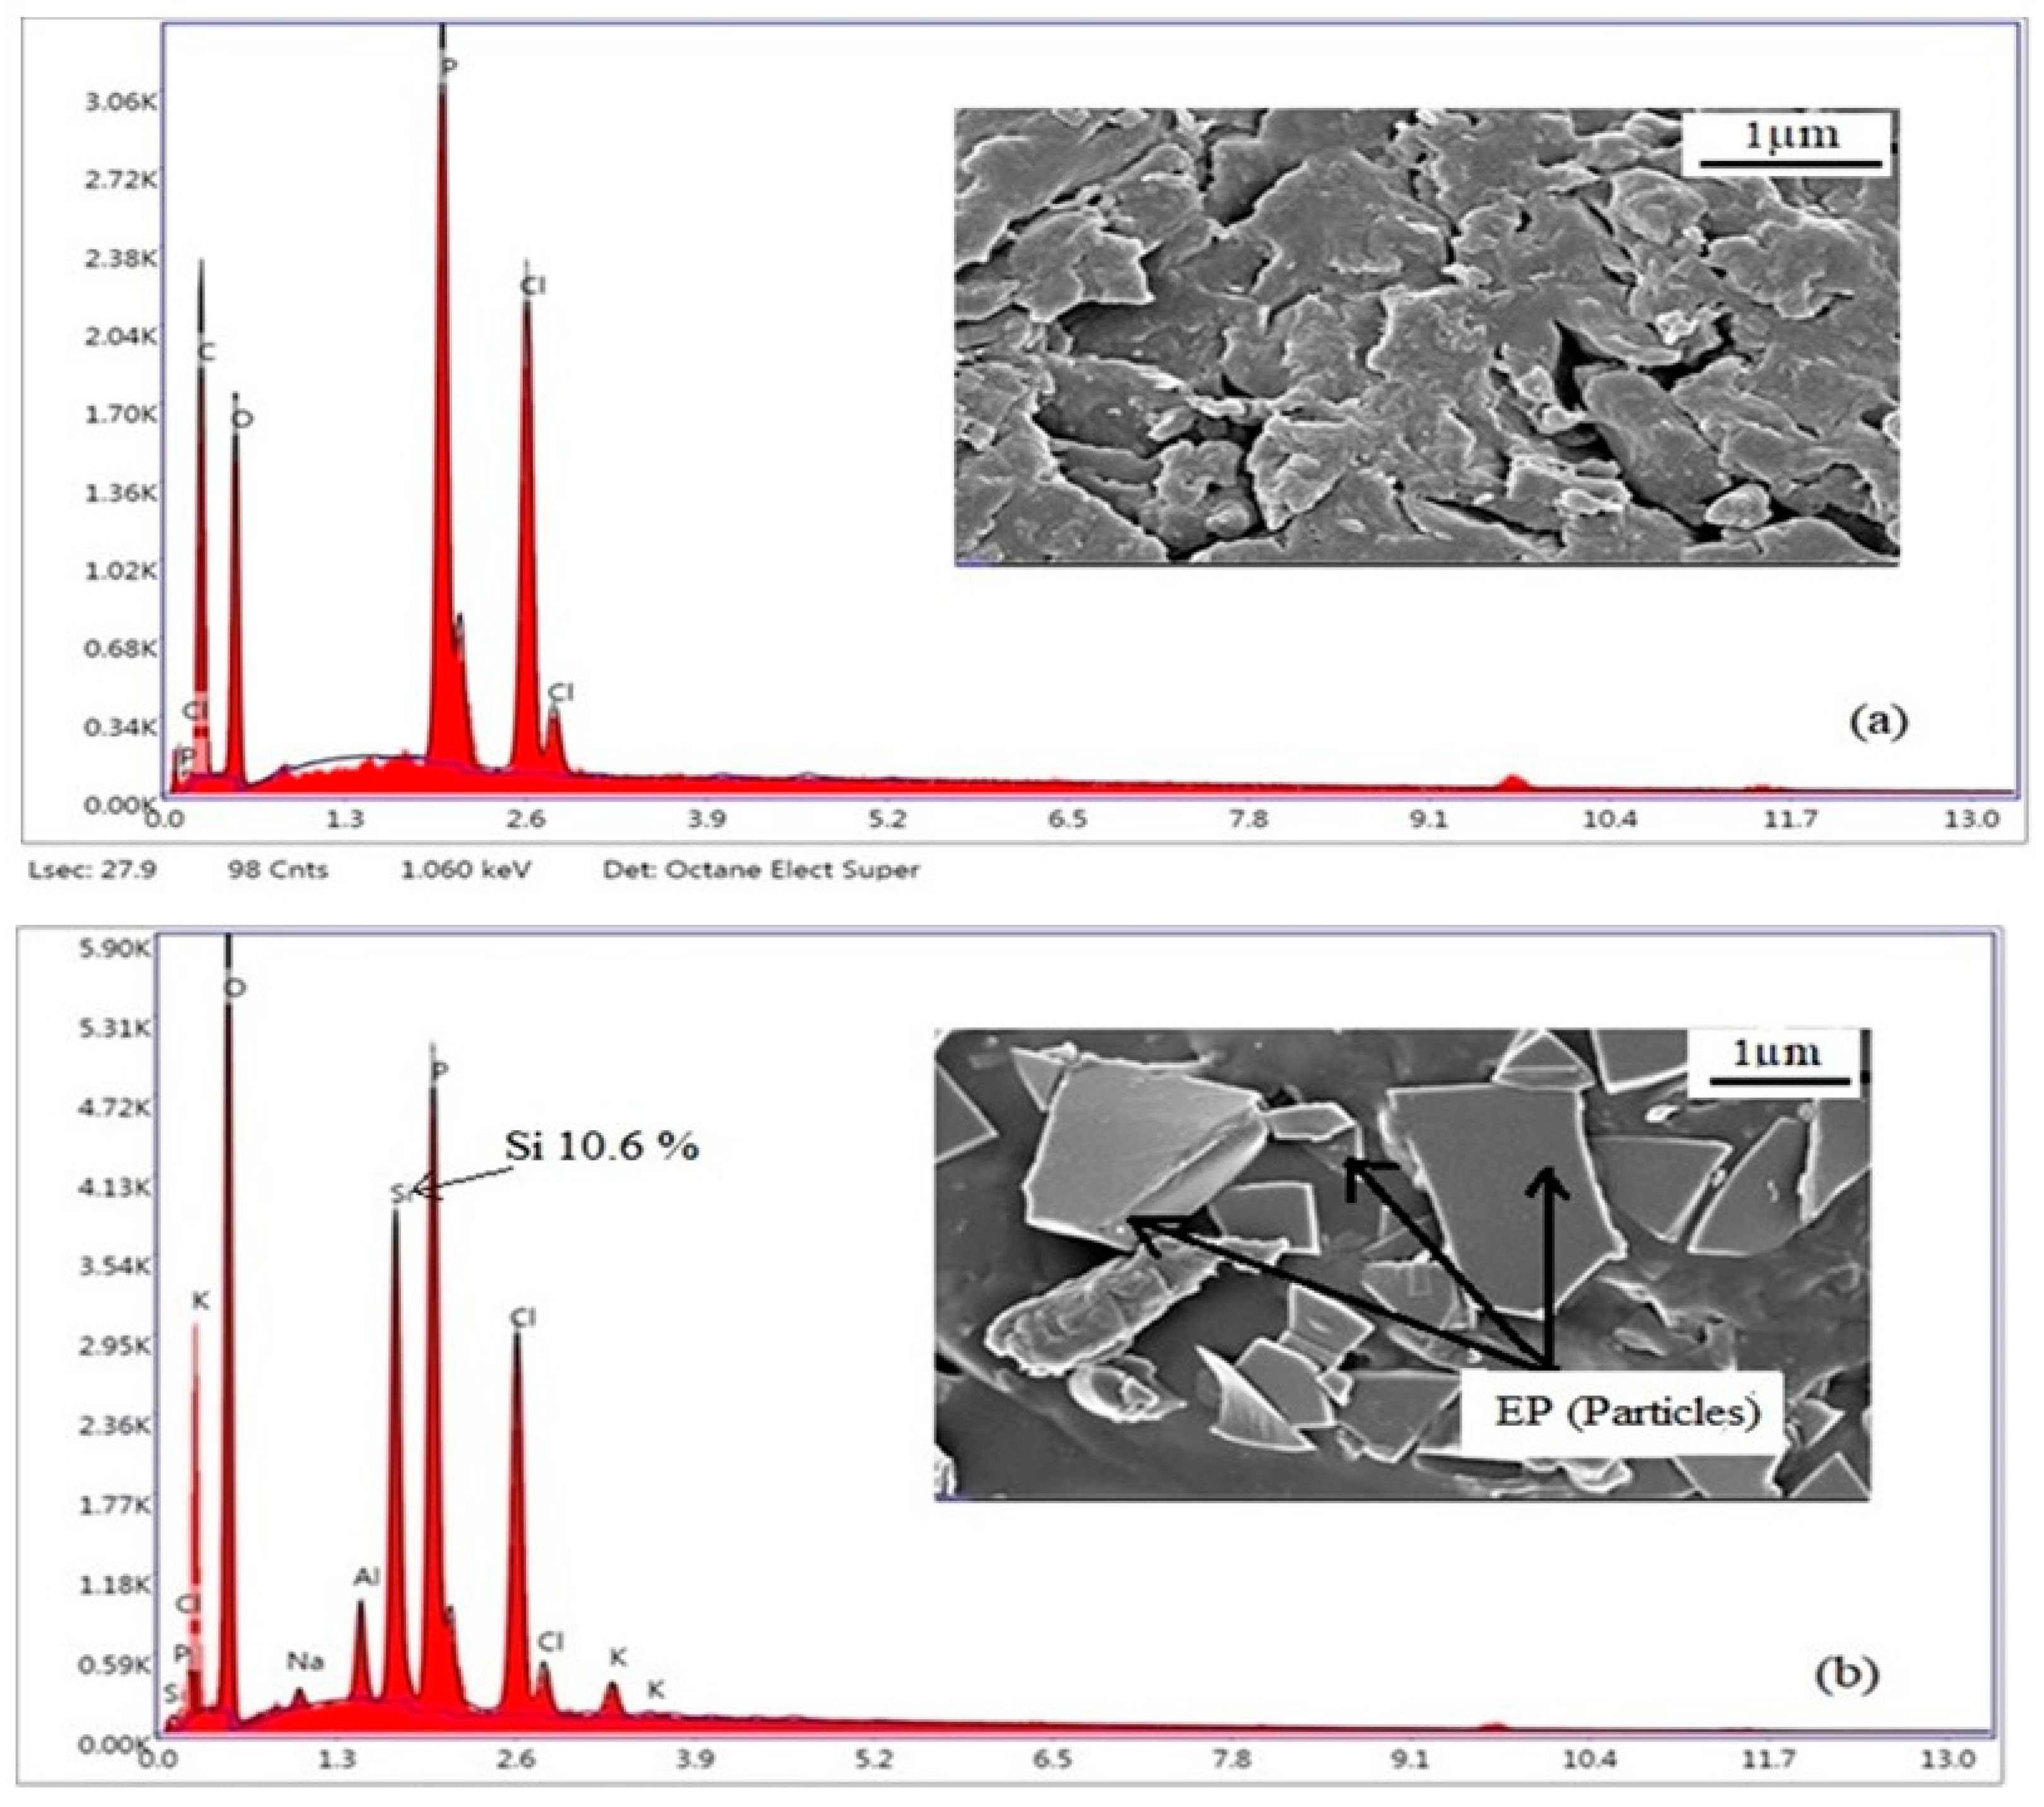
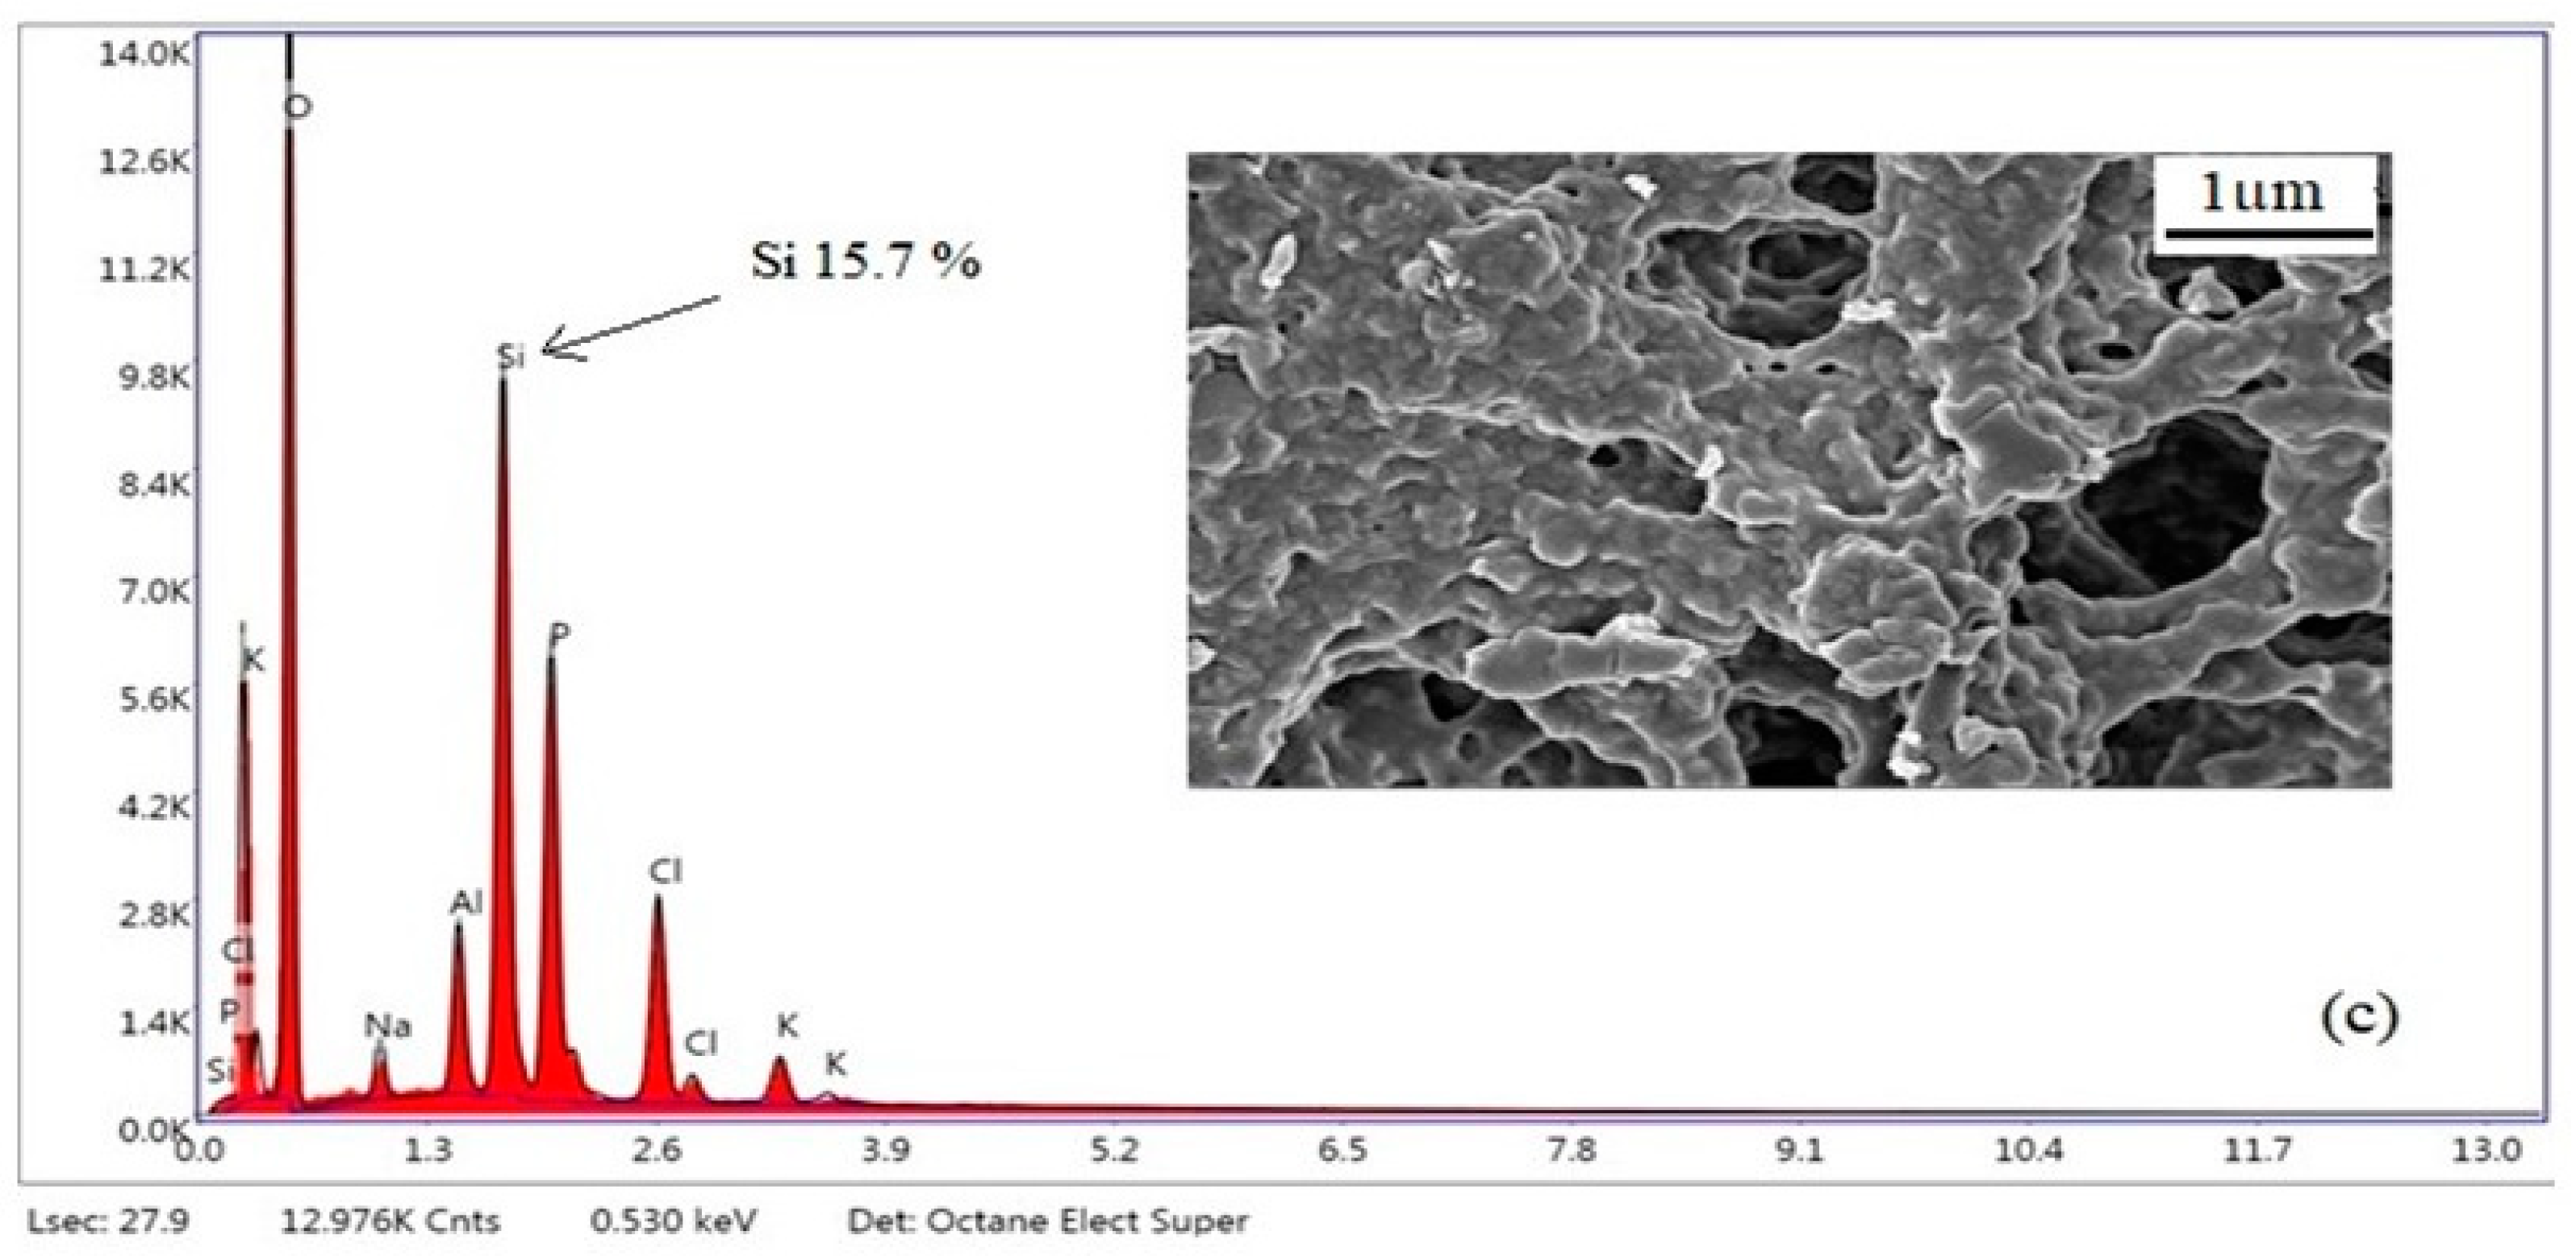
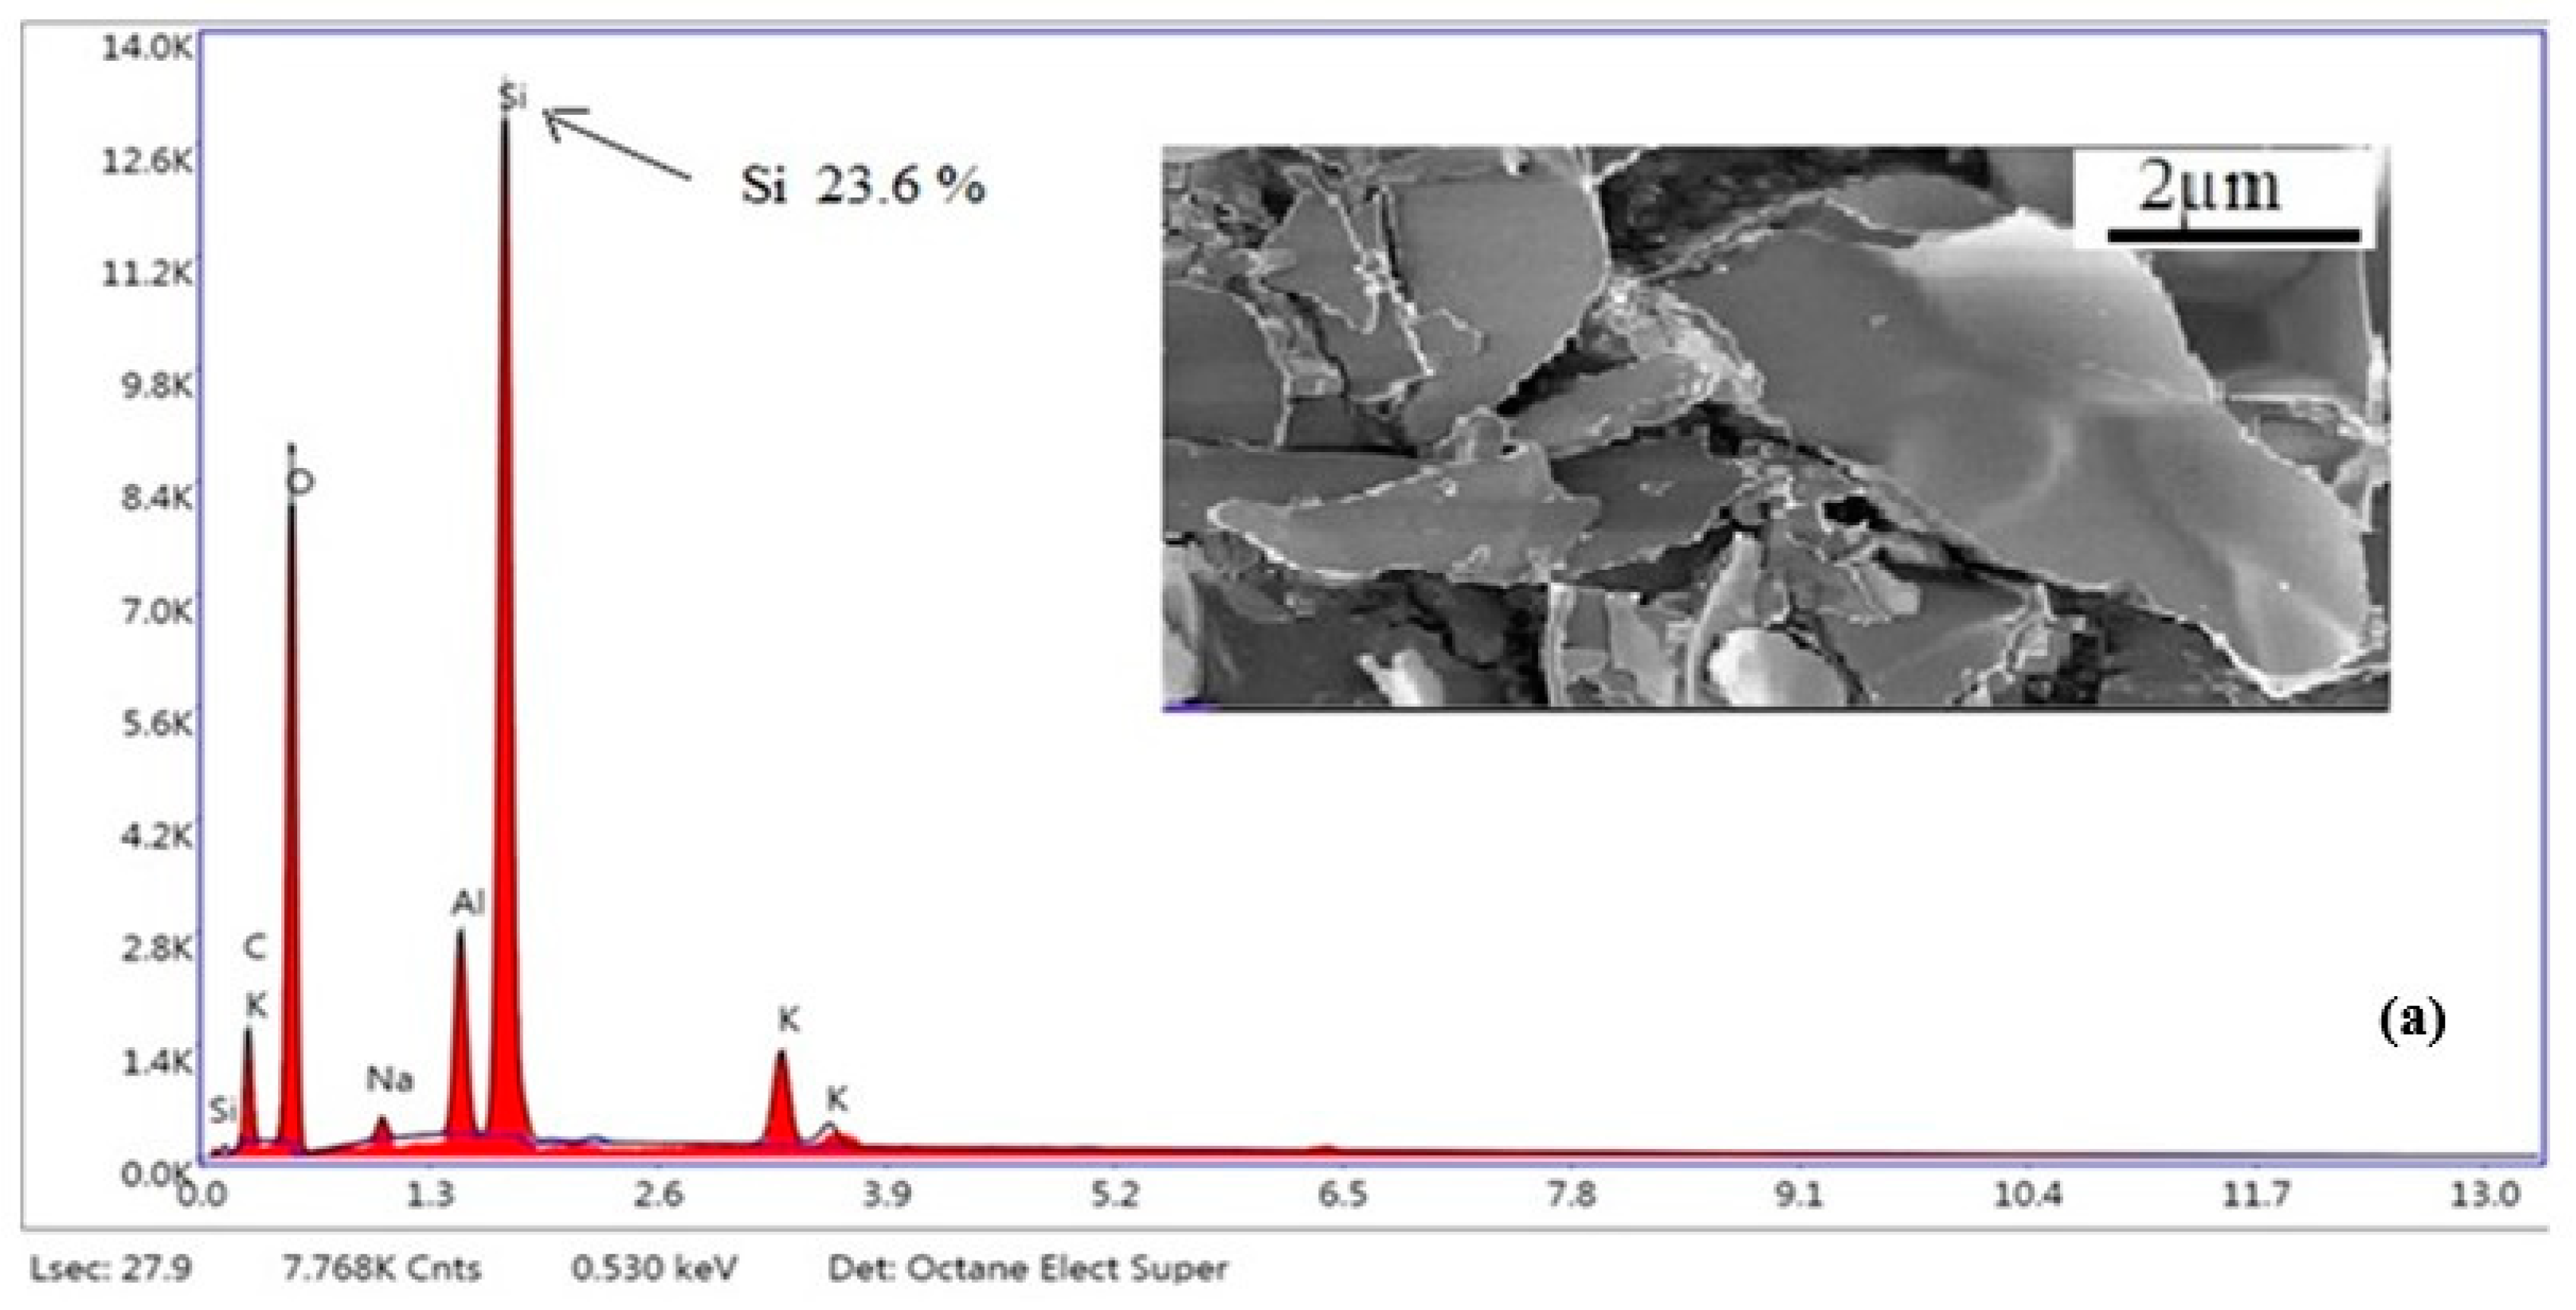
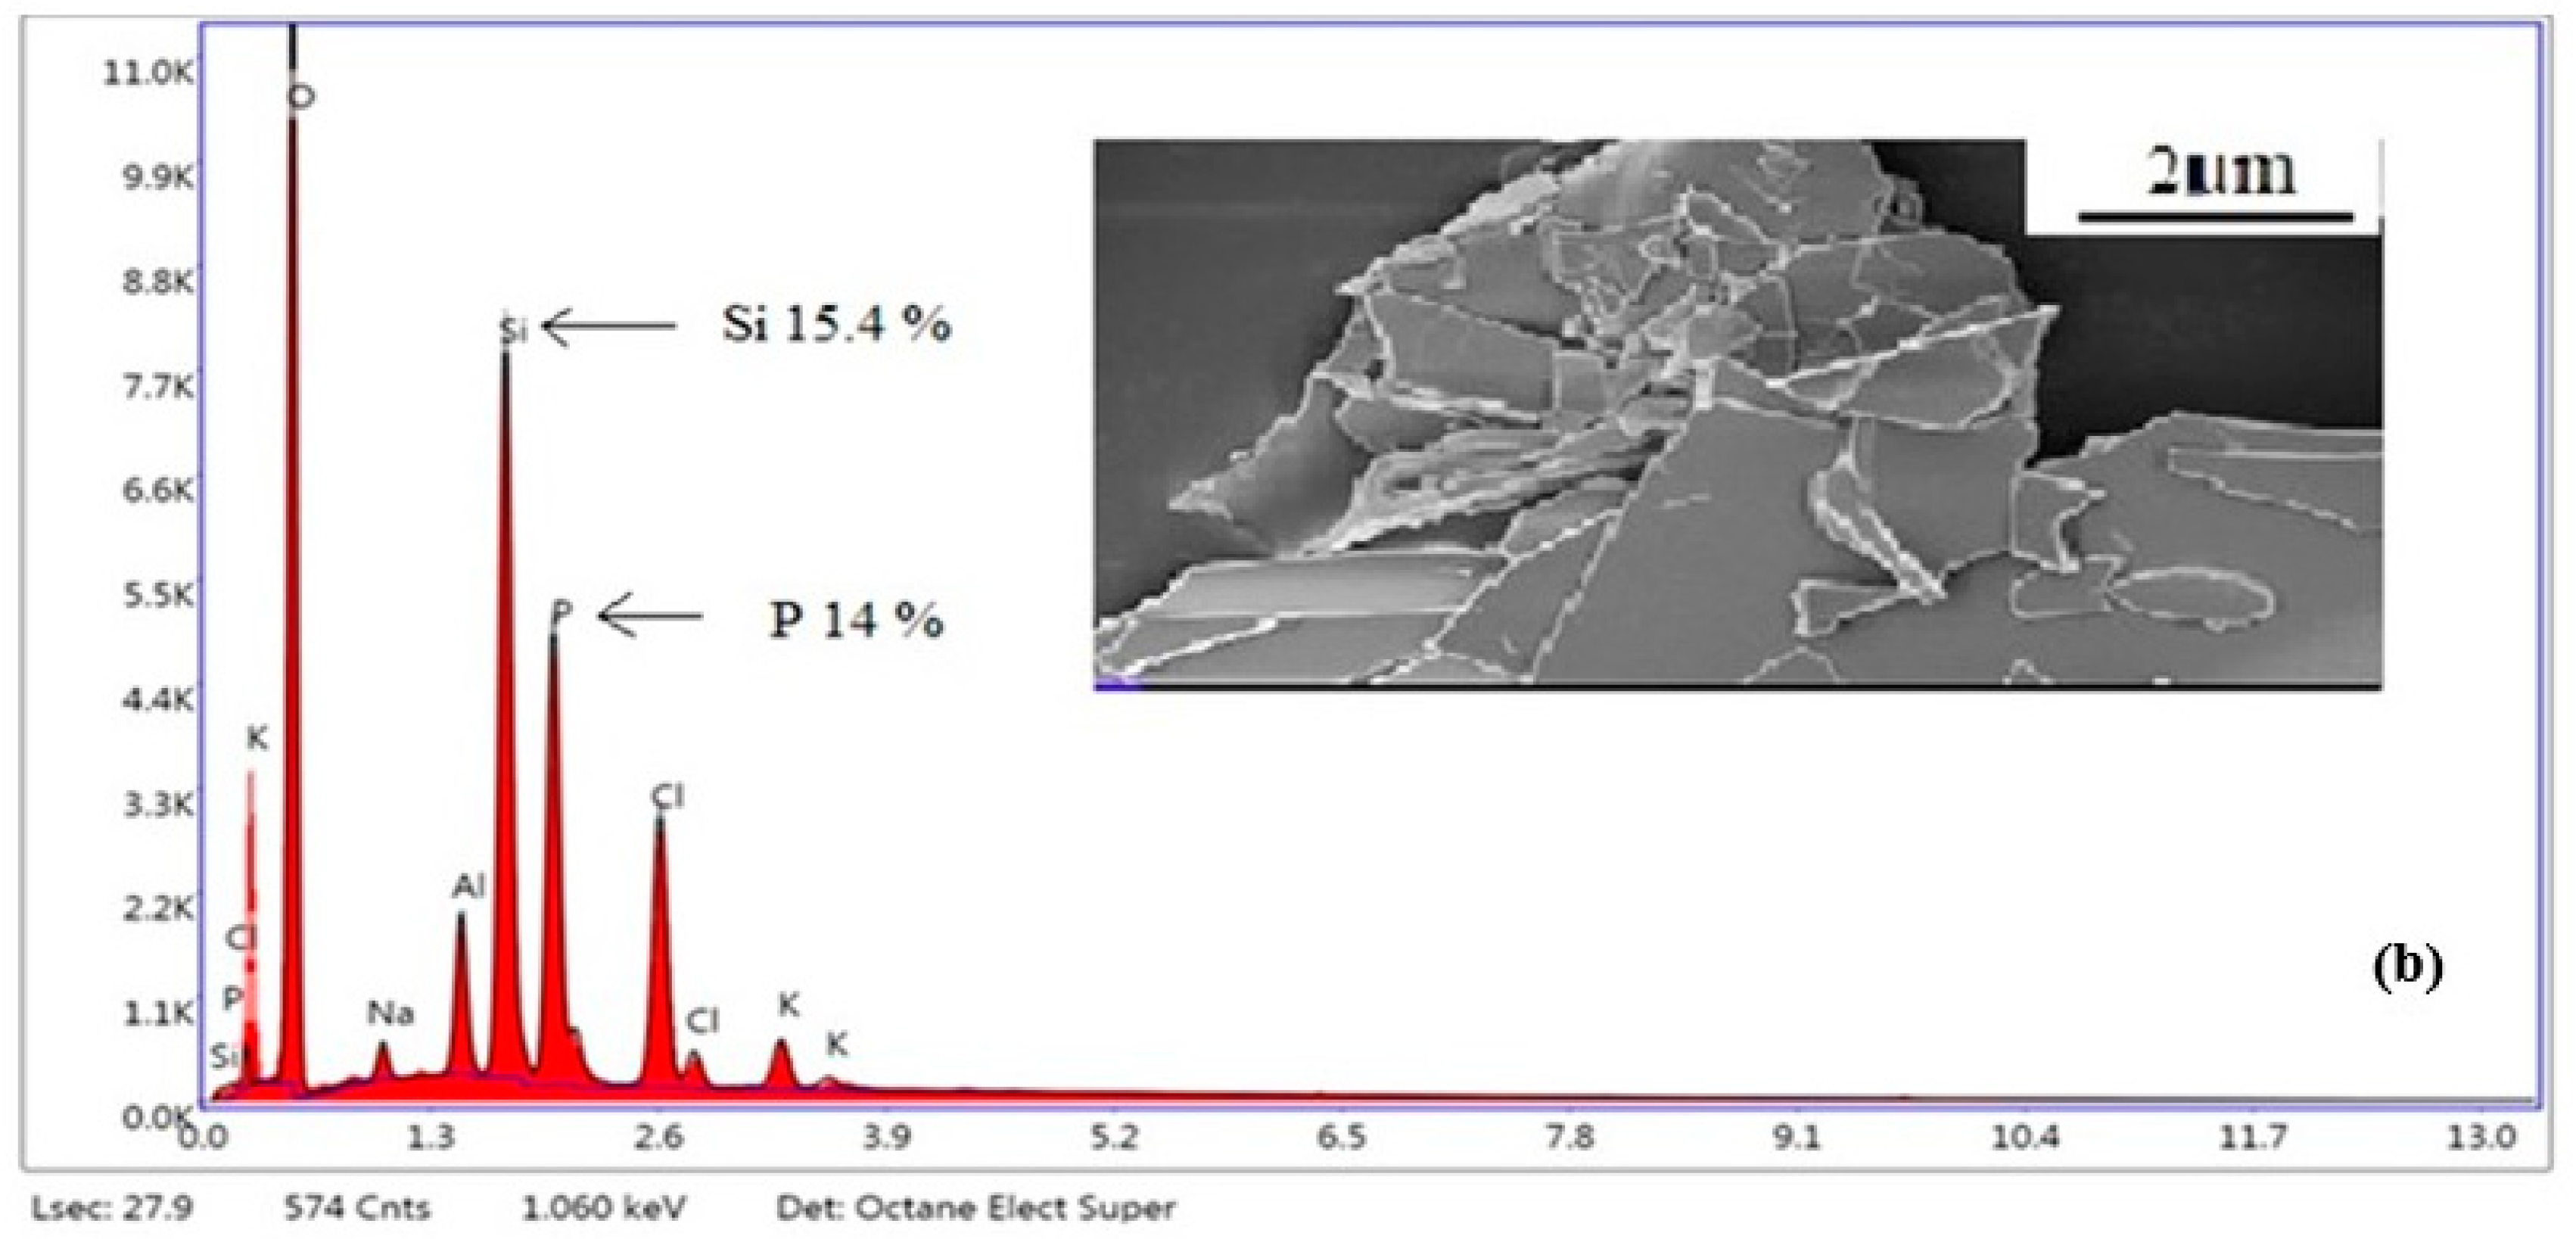
3.4. SEM-EDX Analysis

Figure 13 and Figure 14 illustrate the results of SEM-EDX analysis of samples.
As can be seen from Figure 13, compared to the EP, PhEP has a clearly defined layered structure. Apparently, during the OxCh reaction, impurities (mainly oxides of sodium, potassium, etc., which are visible in the SEM analysis as small particles) were modified, and soluble salts were removed from the EP using water treatment. According to the results of EDX analysis, the PhEP contains phosphorus and chlorine atoms, i.e., during the reaction, EP unambiguously undergoes modification. The results of the EDX analysis also shows that after modification, the amount of oxygen in the PhEP increases, which proves the presence of functional groups in this sample.
When considering the results of the SEM-EDX analysis presented in Figure 14, it is clearer that, unlike PhBR, composites contain both a polymer and a mineral phase. When comparing the morphology of composites of the first (EP/PhBR) and second (PhEP/PhBR) types, the difference can be clearly emphasized. Apparently, in the first type of composite, the EP undergoes a relatively low degree of modification; therefore, in the morphology of this sample, EP layers are clearly visible (which is in good agreement with the results of FTIR analysis), and the polymer is distributed around it. Figure 14c demonstrated an indistinct difference between the PhEP particles and the polymer matrix, indicating good dispersion of the PhEP filler into the matrix, resulting in a homogeneous PhEP/PhBR composite. This difference is related to the synthesis conditions.
In the synthesis of the first type of composite (EP/PhBR), EP and BR are added to the reaction flask simultaneously, and the OxCh reaction is carried out. Thus, it was determined that insufficient dispersion was achieved in the composite synthesized by this approach. During the preparation of the second type of composition (PhEP/PhBR), EP is first added to the reaction flask, its initial modification is carried out, then the polymer solution is added to the reaction mixture and the OxCh reaction is carried out. Therefore, premodification of EP provides a better dispersion of the mineral in the composite.

4. Conclusions

Polymer/mineral composites containing BR and EP were prepared using OxCh, and hydrolysis of the intermediate product was obtained after this reaction. In this research work, EP, its phosphorus-containing derivative (PhEP), phosphorus-containing BR (PhBR), and two types of composites based on EP, PhEP, and PhBR, namely EP/PhBR and PhEP/PhBR, were characterized by various methods. To design the first type of EP/PhBR composite, EP and BR were simultaneously modified, and to design the second type of PhEP/PhBR composite; initially, the EP was modified using the OxCh reaction, and then the modification was continued in the presence of BR. The results of FTIR spectroscopy showed the presence of P=O, P–OH, and –P(O)(OH)2 groups in PhBR, PhEP, and both composites. The results of the UV-Vis study were used to calculate the optical band gap for the samples. Based on the obtained results, the value of the Eg parameter was determined as follows: EP/PhBR < PhBR < PhEP/PhBR. These results indicate a greater chemical affinity between the polymer and mineral phases in the PhEP/PhBR composite. XRD studies have shown that both the modification of EP and the removal of contaminants using the OxCh reaction are effective. Comparison of XRD results of PhBR, EP/PhBR, and PhEP/PhBR composite showed better dispersion and interaction of the mineral phase in the polymer matrix in PhEP/PhBR. The results of SEM-EDX analysis shows that the PhEP has a more distinct layered structure. Apparently, impurities were removed from the EP during the OxCh reaction. According to the results of EDX analysis, phosphorus, and chlorine atoms are also present in PhEP. Based on the results of SEM-EDX analysis, it was established that, unlike PhBR, composites contain both a polymer and a mineral phase. In addition, preliminary modification of EP makes it possible to obtain a composite (the second type of PhEP/PhBR composite) with good mineral dispersion.
Thus, as a result of the study, the following should be noted:
-
The proposed method for the synthesis of composites can be used for designing materials based on various mineral and industrial polymers, as well as their waste;
-
The chemical structure of the synthesized composites shows that these samples can be used for water purification.

Author Contributions

N.E. and R.A. wrote the manuscript; I.B.-z., M.S., S.M.T., N.B., N.G. and S.M. conducted the experiment; and S.A. participated in the interpretation of the experimental results, writing and editing the article. All authors have read and agreed to the published version of the manuscript.

Funding

This research received no external funding.

Data Availability Statement

All data generated or analyzed during this study are included in this published article.

Acknowledgments

Nada Edres is extremely grateful to the Azerbaijan scholarship for citizens of Organisation of Islamic Cooperation member countries for financial support and for giving the chance to join the research group of Prof Rasim Alosmanov in the Department of Chemistry of High molecular compounds, Faculty of Chemistry, Baku State University.

Conflicts of Interest

The authors have no conflict of interest to declare that are relevant to the content of this article.

References

  1. Samar, M.; Saxena, D.S. Study of Chemical of and Chysical Properties of Perlite and Its Application in India. Int. J. Sci. Technol. Manag. 2016, 5, 70–80. [Google Scholar]
  2. Gül, D. Characterization and Expansion Behaviour of Perlite. Master Thesis, Izmir Institute of Technology, Urla, Turkey, 2016. [Google Scholar]
  3. Aksoy, O.; Alyamac Seydibeyoglu, E.; Mocan, M.; Sutcu, M.; Ozveren-Ucar, N.; Seydibeyoglu, M. Characterization of Perlite Powders from Izmir, Türkiye Region. Physicochem. Probl. Miner. Process. 2022, 58, 155277. [Google Scholar] [CrossRef]
  4. Różycka, A.; Pichór, W. Effect of Perlite Waste Addition on the Properties of Autoclaved Aerated Concrete. Constr. Build. Mater. 2016, 120, 65–71. [Google Scholar] [CrossRef]
  5. Kotwica, Ł.; Pichór, W.; Kapeluszna, E.; Różycka, A. Utilization of Waste Expanded Perlite as New Effective Supplementary Cementitious Material. J. Clean. Prod. 2017, 140, 1344–1352. [Google Scholar] [CrossRef]
  6. Wang, L.; Li, Z.; Jing, Q.; Liu, P. Synthesis of Composite Insulation Materials—Expanded Perlite Filled with Silica Aerogel. J. Porous Mater. 2018, 25, 373–382. [Google Scholar] [CrossRef]
  7. Xu, H.; Jia, W.; Ren, S.; Wang, J. Novel and Recyclable Demulsifier of Expanded Perlite Grafted by Magnetic Nanoparticles for Oil Separation from Emulsified Oil Wastewaters. Chem. Eng. J. 2018, 337, 10–18. [Google Scholar] [CrossRef]
  8. Guo, F.; Aryana, S.; Han, Y.; Jiao, Y. A Review of the Synthesis and Applications of Polymer–Nanoclay Composites. Appl. Sci. 2018, 8, 1696. [Google Scholar] [CrossRef]
  9. Raji, M.; Nekhlaoui, S.; El Hassani, I.-E.E.A.; Essassi, E.M.; Essabir, H.; Rodrigue, D.; Bouhfid, R.; Qaiss, A.E.K. Utilization of Volcanic Amorphous Aluminosilicate Rocks (Perlite) as Alternative Materials in Lightweight Composites. Compos. Part B Eng. 2019, 165, 47–54. [Google Scholar] [CrossRef]
  10. Krzyzak, A.; Kucharczyk, W.; Gaska, J.; Szczepaniak, R. Ablative Test of Composites with Epoxy Resin and Expanded Perlite. Compos. Struct. 2018, 202, 978–987. [Google Scholar] [CrossRef]
  11. Abir, A.; Faruk, M.; Arifuzzaman, M. Novel Expanded Perlite Based Composite Using Recycled Expanded Polystyrene for Building Material Applications. In Proceedings of the International Conference on Mechanical, Industrial and Energy Engineering 2020(ICMIEE20), Southfield, MI, USA, 19–21 December 2020. [Google Scholar]
  12. Atagür, M.; Sarikanat, M.; Uysalman, T.; Polat, O.; Elbeyli, İ.Y.; Seki, Y.; Sever, K. Mechanical, Thermal, and Viscoelastic Investigations on Expanded Perlite–Filled High-Density Polyethylene Composite. J. Elastomers Plast. 2018, 50, 747–761. [Google Scholar] [CrossRef]
  13. Ghorbankhan, A.; Nakhaei, M.R.; Safarpour, P. Fracture Behavior, Microstructure, and Mechanical Properties of PA6/NBR Nanocomposites. Polym. Compos. 2022, 43, 6696–6708. [Google Scholar] [CrossRef]
  14. Akkaya, R.; Akkaya, B. New Low-Cost Composite Adsorbent Synthesis and Characterization. Desalin. Water Treat. 2013, 51, 3497–3504. [Google Scholar] [CrossRef]
  15. Akkaya, R. Synthesis and Characterization of a New Low-Cost Composite for the Adsorption of Rare Earth Ions from Aqueous Solutions. Chem. Eng. J. 2012, 200–202, 186–191. [Google Scholar] [CrossRef]
  16. Alosmanov, R.; Wolski, K.; Matuschek, G.; Magerramov, A.; Azizov, A.; Zimmermann, R.; Aliyev, E.; Zapotoczny, S. Effect of Functional Groups on the Thermal Degradation of Phosphorus- and Phosphorus/Nitrogen-Containing Functional Polymers. J. Therm. Anal. Calorim. 2017, 130, 799–812. [Google Scholar] [CrossRef]
  17. Aliyeva, S.; Alosmanov, R.; Buniyatzadeh, I.; Eyvazova, G.; Azizov, A.; Maharramov, A. Functionalized Graphene Nanoplatelets/Modified Polybutadiene Hybrid Composite. Colloid Polym. Sci. 2019, 297, 1529–1540. [Google Scholar] [CrossRef]
  18. Aliyeva, S.; Maharramov, A.; Azizov, A.; Alosmanov, R.; Buniyatzadeh, I.; Eyvazova, G. Phosphorus-Containing Polybutadiene Rubber–Bentonite Hybrid Composite for the Removal of Rhodamine 6G from Water. Anal. Lett. 2016, 49, 2347–2364. [Google Scholar] [CrossRef]
  19. Alosmanov, R.M.; Azizov, A.A.; Magerramov, A.M. NMR Spectroscopic Study of Phosphorus-Containing Polymer Sorbent. Russ. J. Gen. Chem. 2011, 81, 1477–1479. [Google Scholar] [CrossRef]
  20. Jahanshahi, R.; Akhlaghinia, B. Expanded Perlite: An Inexpensive Natural Efficient Heterogeneous Catalyst for the Green and Highly Accelerated Solvent-Free Synthesis of 5-Substituted-1H-Tetrazoles Using [Bmim]N3 and Nitriles. RSC Adv. 2015, 5, 104087–104094. [Google Scholar] [CrossRef]
  21. Almeida, J.M.F.; Silva, I.N.; Damasceno Junior, E.; Fernandes, N.S. Modification of Expanded Perlite with Orthophenanthroline for Formation of Active Sites for Acid Dyes: Preparation and Characterization. Periód. Tchê Quím. 2018, 15, 338–346. [Google Scholar] [CrossRef]
  22. Alosmanov, R.; Buniyat-zadeh, I.; Soylak, M.; Shukurov, A.; Aliyeva, S.; Turp, S.; Guliyeva, G. Design, Structural Characteristic and Antibacterial Performance of Silver-Containing Cotton Fiber Nanocomposite. Bioengineering 2022, 9, 770. [Google Scholar] [CrossRef]
  23. Wheelwright, W.; Cooney, R.P.; Ray, S.; Zujovic, Z.; De Silva, K. Ultra-High Surface Area Nano-Porous Silica from Expanded Perlite: Formation and Characterization. Ceram. Int. 2017, 43, 11495–11504. [Google Scholar] [CrossRef]
  24. Alghadi, A.M.; Tirkes, S.; Tayfun, U. Mechanical, Thermo-Mechanical and Morphological Characterization of ABS Based Composites Loaded with Perlite Mineral. Mater. Res. Express 2020, 7, 015301. [Google Scholar] [CrossRef]
  25. Malpani, S.K.; Goyal, D.; Chinnam, S.; Sharma, S.K.; Katara, S.; Rani, A. Vapor Phase Alkylation of Isomeric Cresols with Tert-Butyl Alcohol over Perlite Supported Sulfated Zirconia Catalyst. Sustainability 2022, 14, 5149. [Google Scholar] [CrossRef]
  26. Aubert, T.; Golovatenko, A.A.; Samoli, M.; Lermusiaux, L.; Zinn, T.; Abécassis, B.; Rodina, A.V.; Hens, Z. General Expression for the Size-Dependent Optical Properties of Quantum Dots. Nano Lett. 2022, 22, 1778–1785. [Google Scholar] [CrossRef]
  27. Zhang, S.; Li, H.; Yang, Z. Synthesis, Structural Characterization and Evaluation of a Novel Floating Metal-Free Photocatalyst Based on g-C3N4 Grafted Expanded Perlite for the Degradation of Dyes. Mater. Technol. 2018, 33, 1–9. [Google Scholar] [CrossRef]
  28. Abbas, M.; Hachemaoui, A.; Yahiaoui, A.; Mourad, A.-H.I.; Belfedal, A.; Cherupurakal, N. Chemical Synthesis of Nanocomposites via In-Situ Polymerization of Aniline and Iodoaniline Using Exchanged Montmorillonite. Polym. Polym. Compos. 2021, 29, 982–991. [Google Scholar] [CrossRef]
  29. Lee, J.Y.; Cui, C.Q. Electrochemical Copolymerization of Aniline and Metanilic Acid. J. Electroanal. Chem. 1996, 403, 109–116. [Google Scholar] [CrossRef]
  30. Hsieh, T.-H.; Ho, L.-C.; Wang, Y.-Z.; Ho, K.-S.; Tsai, C.-H.; Hung, L.-F. New Inverse Emulsion-Polymerized Iron/Polyaniline Composites for Permanent, Highly Magnetic Iron Compounds via Calcination. Polymers 2021, 13, 3240. [Google Scholar] [CrossRef]
  31. Mohamed Saat, A.; Alaauldin, S.; Kamil, M.S.; Zainal Azaim, F.Z.; Johan, M.R. The Optical Properties of Polyvinyl Alcohol (PVA), Phosphorylated Polyvinyl Alcohol (PPVA), and Phosphorylated Polyvinyl Alcohol—Aluminum Phosphate (PPVA-AlPO4) Nanocomposites: Effect of Phosphate Groups. In Design in Maritime Engineering; Ismail, A., Dahalan, W.M., Öchsner, A., Eds.; Advanced Structured Materials; Springer International Publishing: Cham, Switzerland, 2022; Volume 167, pp. 179–187. ISBN 978-3-030-89987-5. [Google Scholar]
  32. Tauc, J.; Grigorovici, R.; Vancu, A. Optical Properties and Electronic Structure of Amorphous Germanium. Phys. Status Solidi B 1966, 15, 627–637. [Google Scholar] [CrossRef]
  33. Surendra, B.S.; Nagaswarupa, H.P.; Anantharaju, K.S.; Anil Kumar, M.R.; Nagabhushana, H.; Shetty, K. Acid Activation of Bentonite Clay under Microwave Irradiation: Characterization, Cyclic Voltammetry and Photocatalytic Activity. Mater. Today Proc. 2018, 5, 22643–22651. [Google Scholar] [CrossRef]
  34. Mohamed Saat, A.; Johan, M.R. Effect of Phosphoric Acid Concentration on the Optical Properties of Partially Phosphorylated PVA Complexes. Int. J. Polym. Sci. 2014, 2014, 495875. [Google Scholar] [CrossRef]
  35. Saufi, H.; El Alouani, M.; Alehyen, S.; El Achouri, M.; Aride, J.; Taibi, M. Photocatalytic Degradation of Methylene Blue from Aqueous Medium onto Perlite-Based Geopolymer. Int. J. Chem. Eng. 2020, 2020, 9498349. [Google Scholar] [CrossRef]
  36. Papadopoulos, A.P.; Bar-Tal, A.; Silber, A.; Saha, U.K.; Raviv, M. Inorganic and Synthetic Organic Components of Soilless Culture and Potting Mixes. In Soilless Culture; Elsevier: Amsterdam, The Netherlands, 2008; pp. 505–543. ISBN 978-0-444-52975-6. [Google Scholar]
  37. Buga, M.-R.; Spinu-Zaulet, A.A.; Ungureanu, C.G.; Mitran, R.-A.; Vasile, E.; Florea, M.; Neatu, F. Carbon-Coated SiO2 Composites as Promising Anode Material for Li-Ion Batteries. Molecules 2021, 26, 4531. [Google Scholar] [CrossRef]
  38. Sun, J.; Xu, Z.; Li, W.; Shen, X. Effect of Nano-SiO2 on the Early Hydration of Alite-Sulphoaluminate Cement. Nanomaterials 2017, 7, 102. [Google Scholar] [CrossRef]
  39. Matmin, J.; Affendi, I.; Endud, S. Direct-Continuous Preparation of Nanostructured Titania-Silica Using Surfactant-Free Non-Scaffold Rice Starch Template. Nanomaterials 2018, 8, 514. [Google Scholar] [CrossRef]
Figure 1. Synthesis scheme of EP/PhBR.
Jcs 07 00487 g001
Figure 2. A synthesis scheme of PhEP.
Jcs 07 00487 g002
Figure 3. Synthesis scheme of PhEP/PhBR.
Jcs 07 00487 g003
Figure 4. A synthesis scheme of modified BR.
Jcs 07 00487 g004
Figure 5. FTIR spectra of EP (black) and PhEP (red).
Jcs 07 00487 g005
Figure 6. FTIR spectra of PhBR (black), EP/PhBR (blue), and PhEP/PhBR (red) composites.
Jcs 07 00487 g006
Figure 7. UV-visible spectra of EP and PhEP (a), EP/PhBR and PhEP/PhBR composites (b) and PhBR (c).
Jcs 07 00487 g007
Figure 8. Optical band gap calculation of EP (a) and PhEP (b).
Jcs 07 00487 g008
Figure 9. The optical band gap calculations of PhBR (a), EP/PhBR (b), and PhBR/PhBR (c) composites.
Jcs 07 00487 g009
Figure 10. XRD spectra of EP and PhEP.
Jcs 07 00487 g010
Figure 11. XRD spectra of PhBR, EP/PhBR, and PhEP/PhBR composites.
Jcs 07 00487 g011
Figure 12. XRD patterns of EP/PhBR and PhEP/PhBR composites normalized to the same baseline.
Jcs 07 00487 g012
Figure 13. SEM-EDX micrographs of EP (a) and PhEP (b).
Jcs 07 00487 g013aJcs 07 00487 g013b
Figure 14. SEM-EDX micrographs of PhBR (a), EP/PhBR composite (b), and PhEP/PhBR composite (c).
Jcs 07 00487 g014aJcs 07 00487 g014b
Table 1. Synthesized and utilized samples and their abbreviations.
EPExpanded perlite
PhChEPPhosphochlorinated expanded perlite
PhEPPhosphorylated expanded perlite
BRButadiene rubber
PhBRPhosphorylated butadiene rubber
EP/PhBRExpanded perlite/phosphorylated butadiene rubber
PhEP/PhBRPhosphorylated expanded perlite/phosphorylated butadiene rubber
Disclaimer/Publisher’s Note: The statements, opinions and data contained in all publications are solely those of the individual author(s) and contributor(s) and not of MDPI and/or the editor(s). MDPI and/or the editor(s) disclaim responsibility for any injury to people or property resulting from any ideas, methods, instructions or products referred to in the content.

