
Selective Laser Sintering of High-Temperature Thermoset Polymer

 ,
,  ,
,  and
and 
Abstract
:1. Introduction
2. Experimental Methodology
2.1. Materials
2.2. Synthesis of Composite BMI/CMB Powder
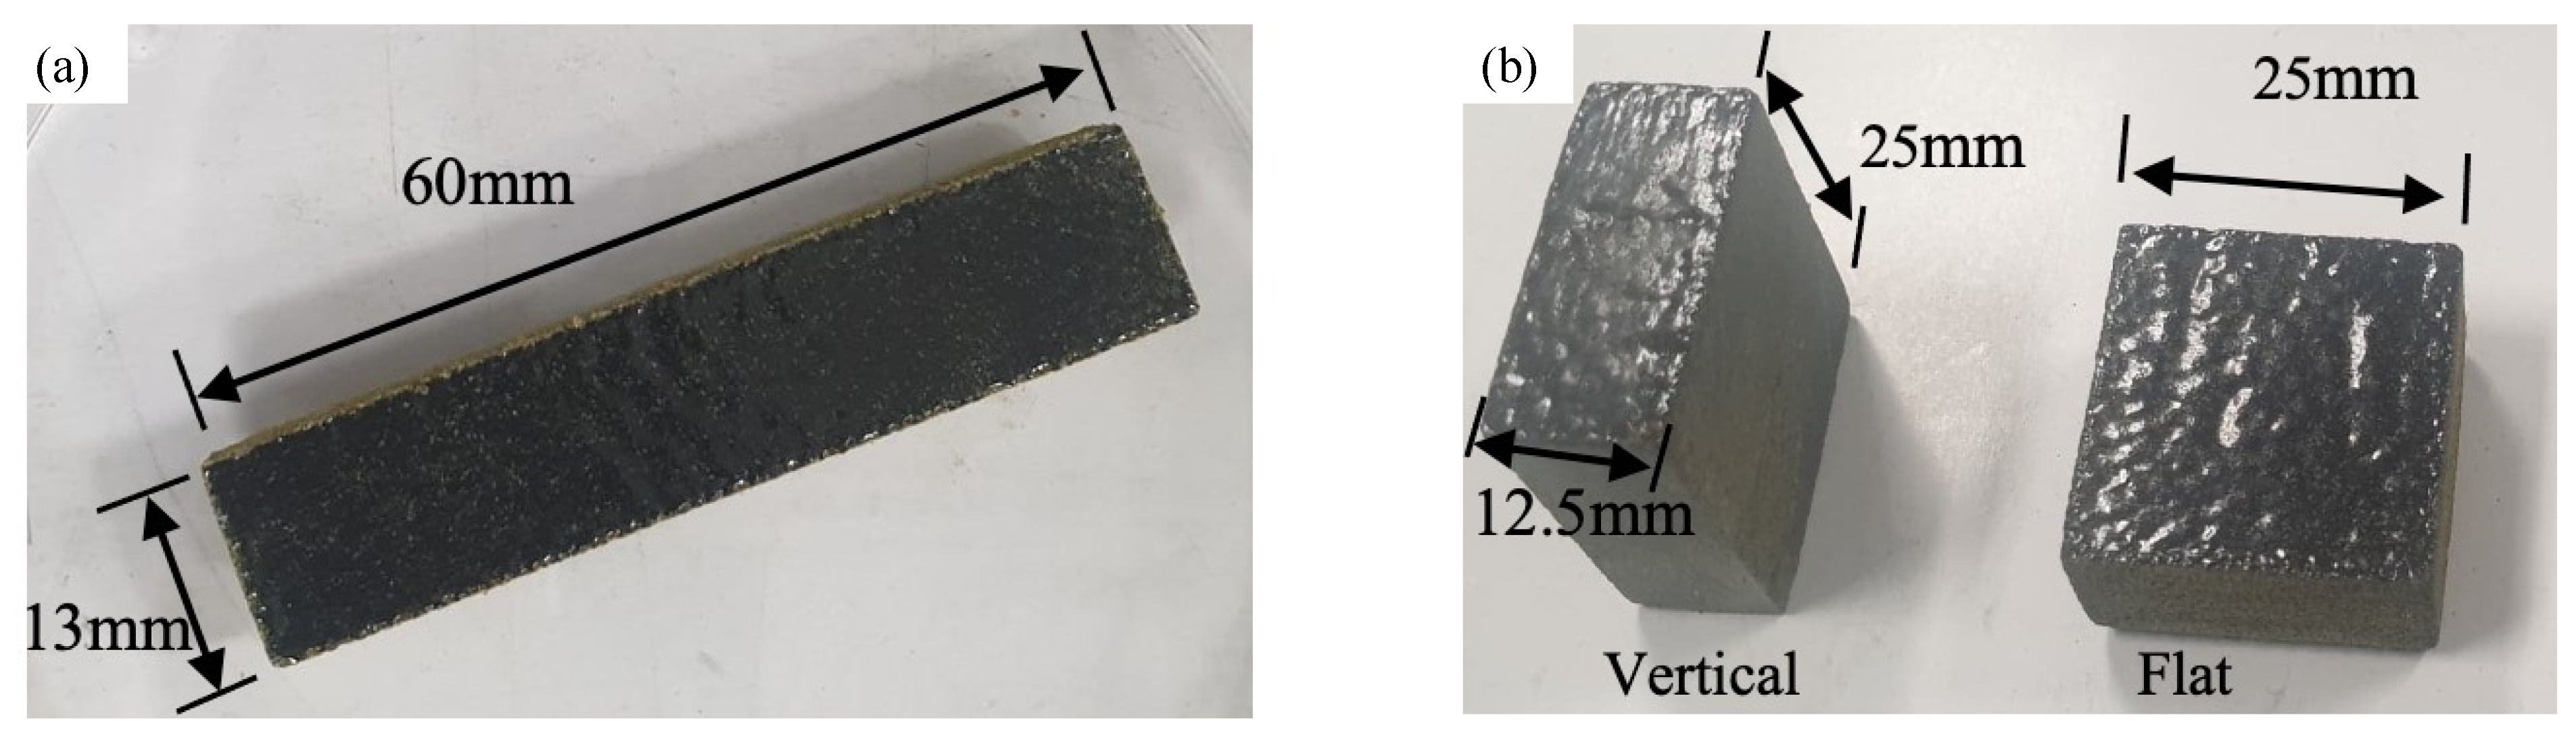
2.3. Specimen Fabrication Using the Selective Laser Sintering Process
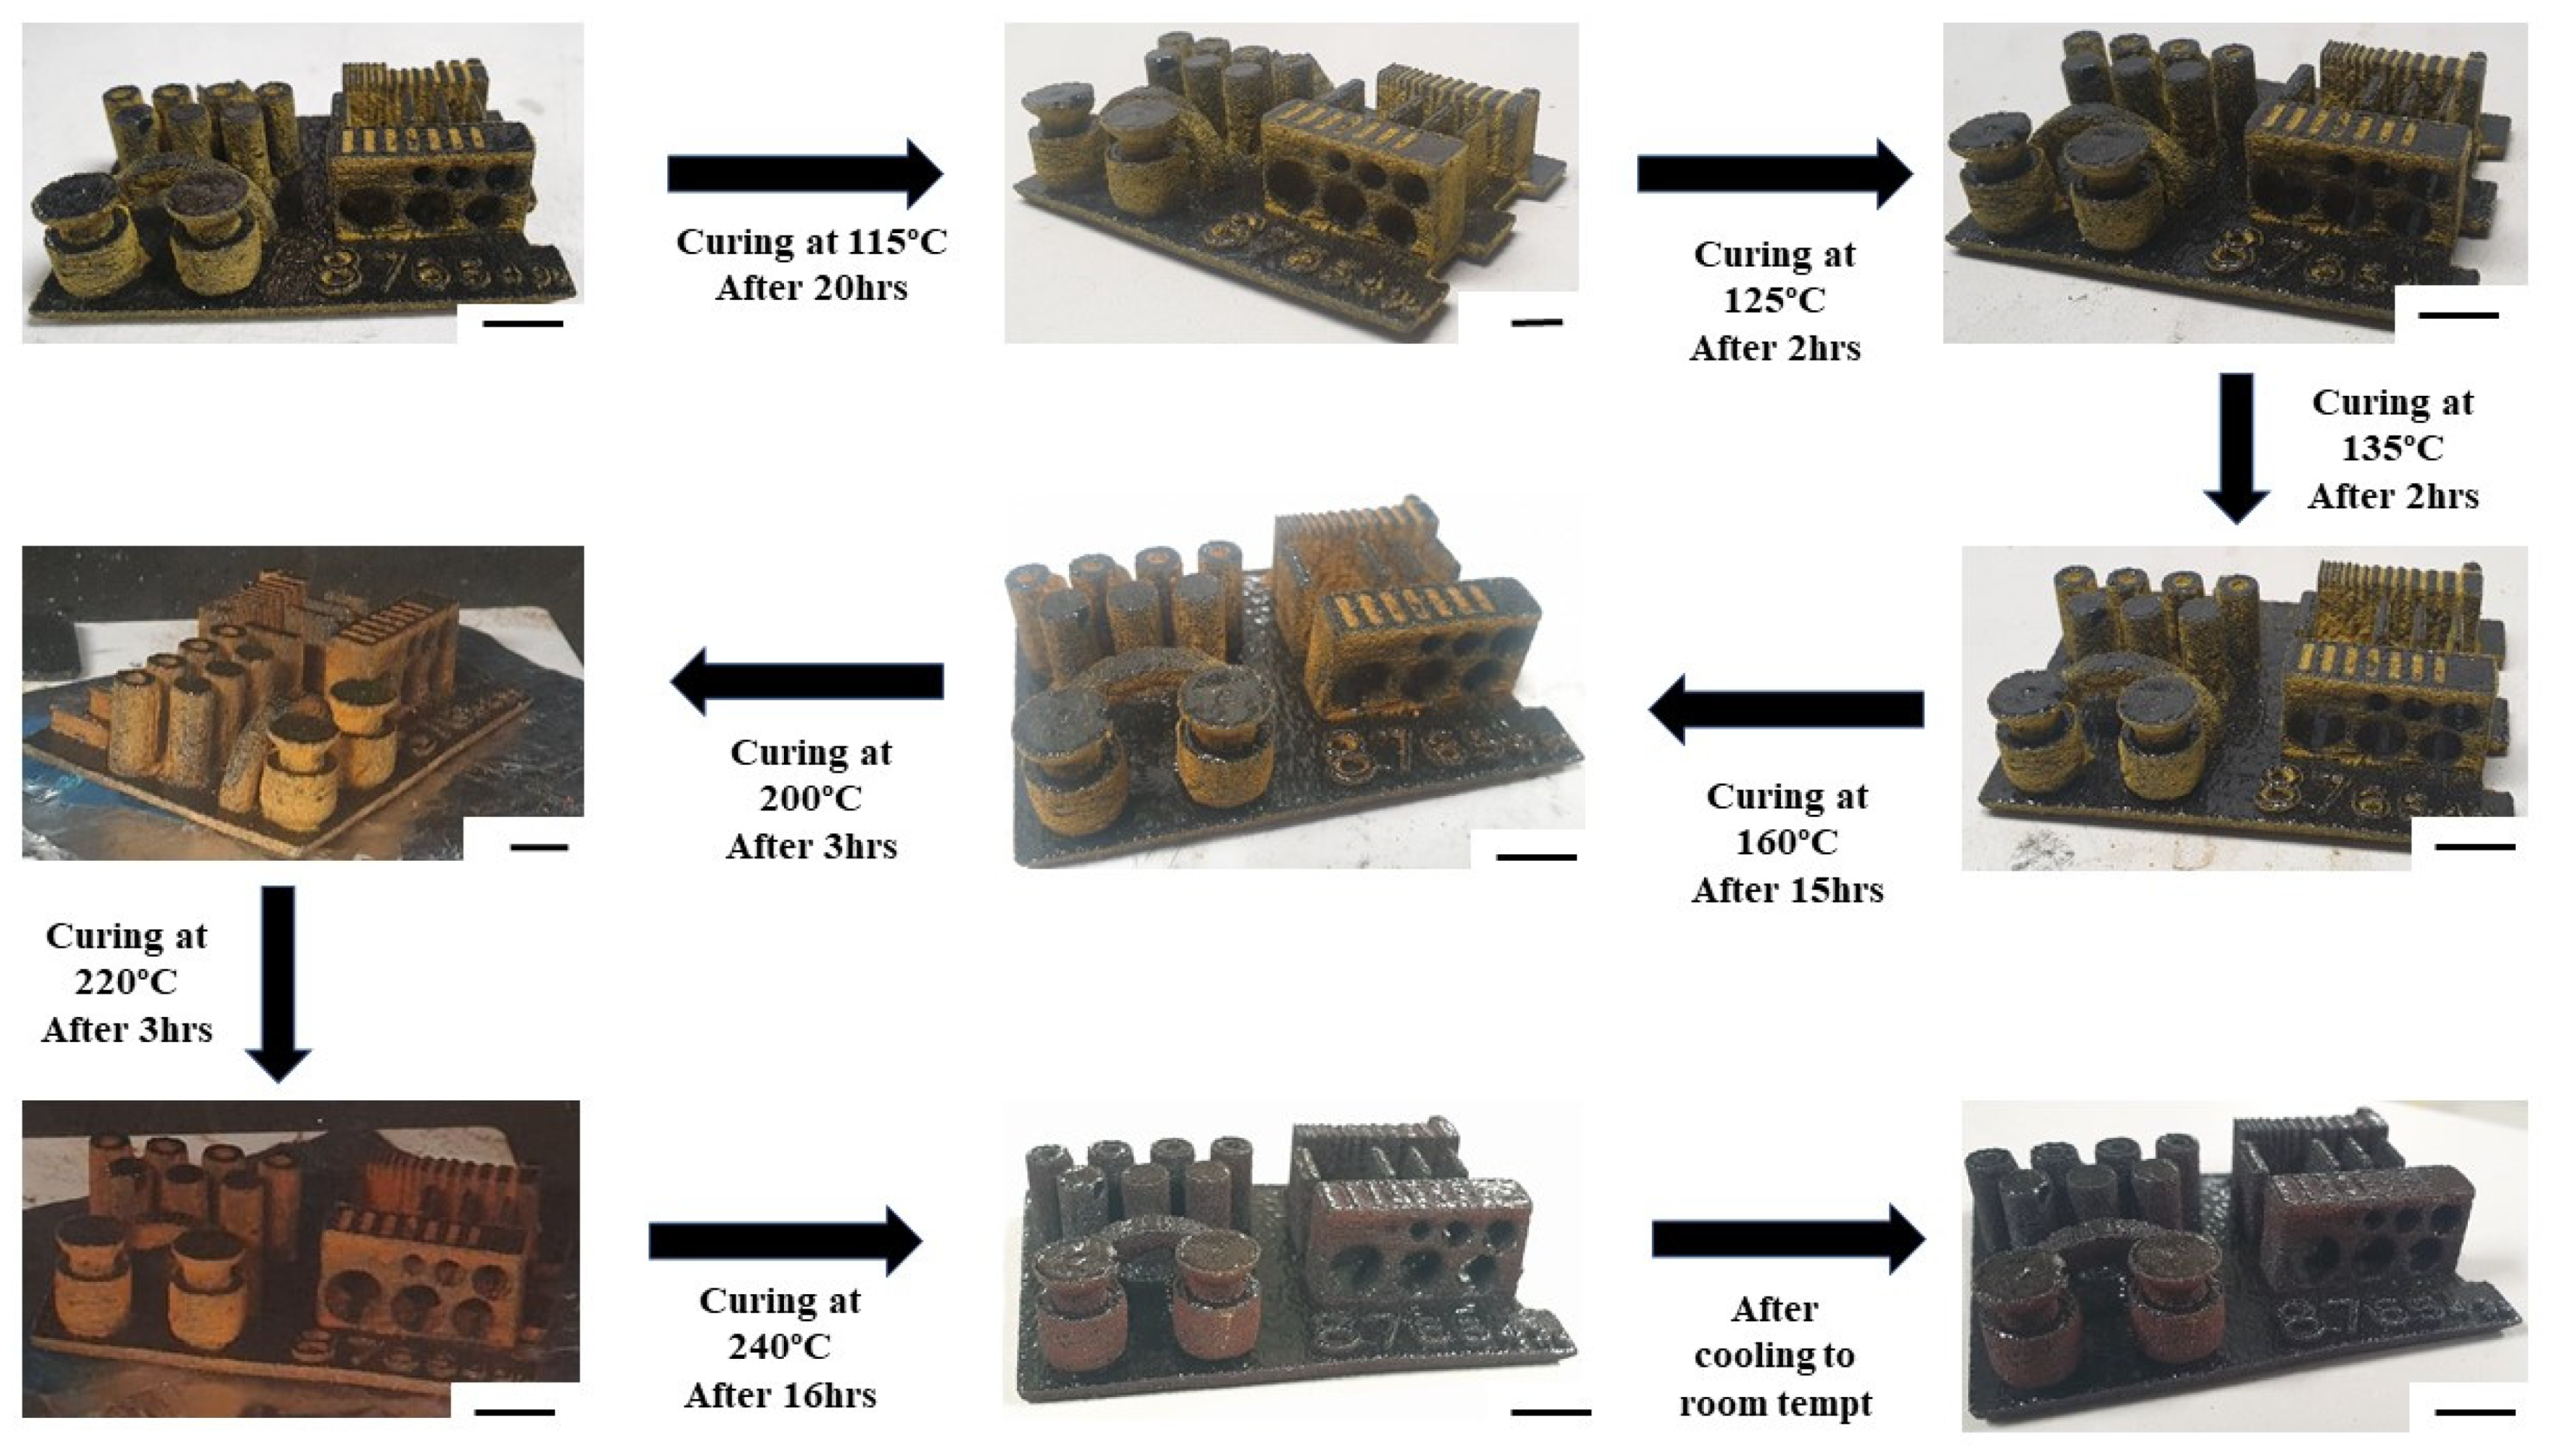
2.4. Curing of SLS 3D-Printed Specimen
2.5. Characterization
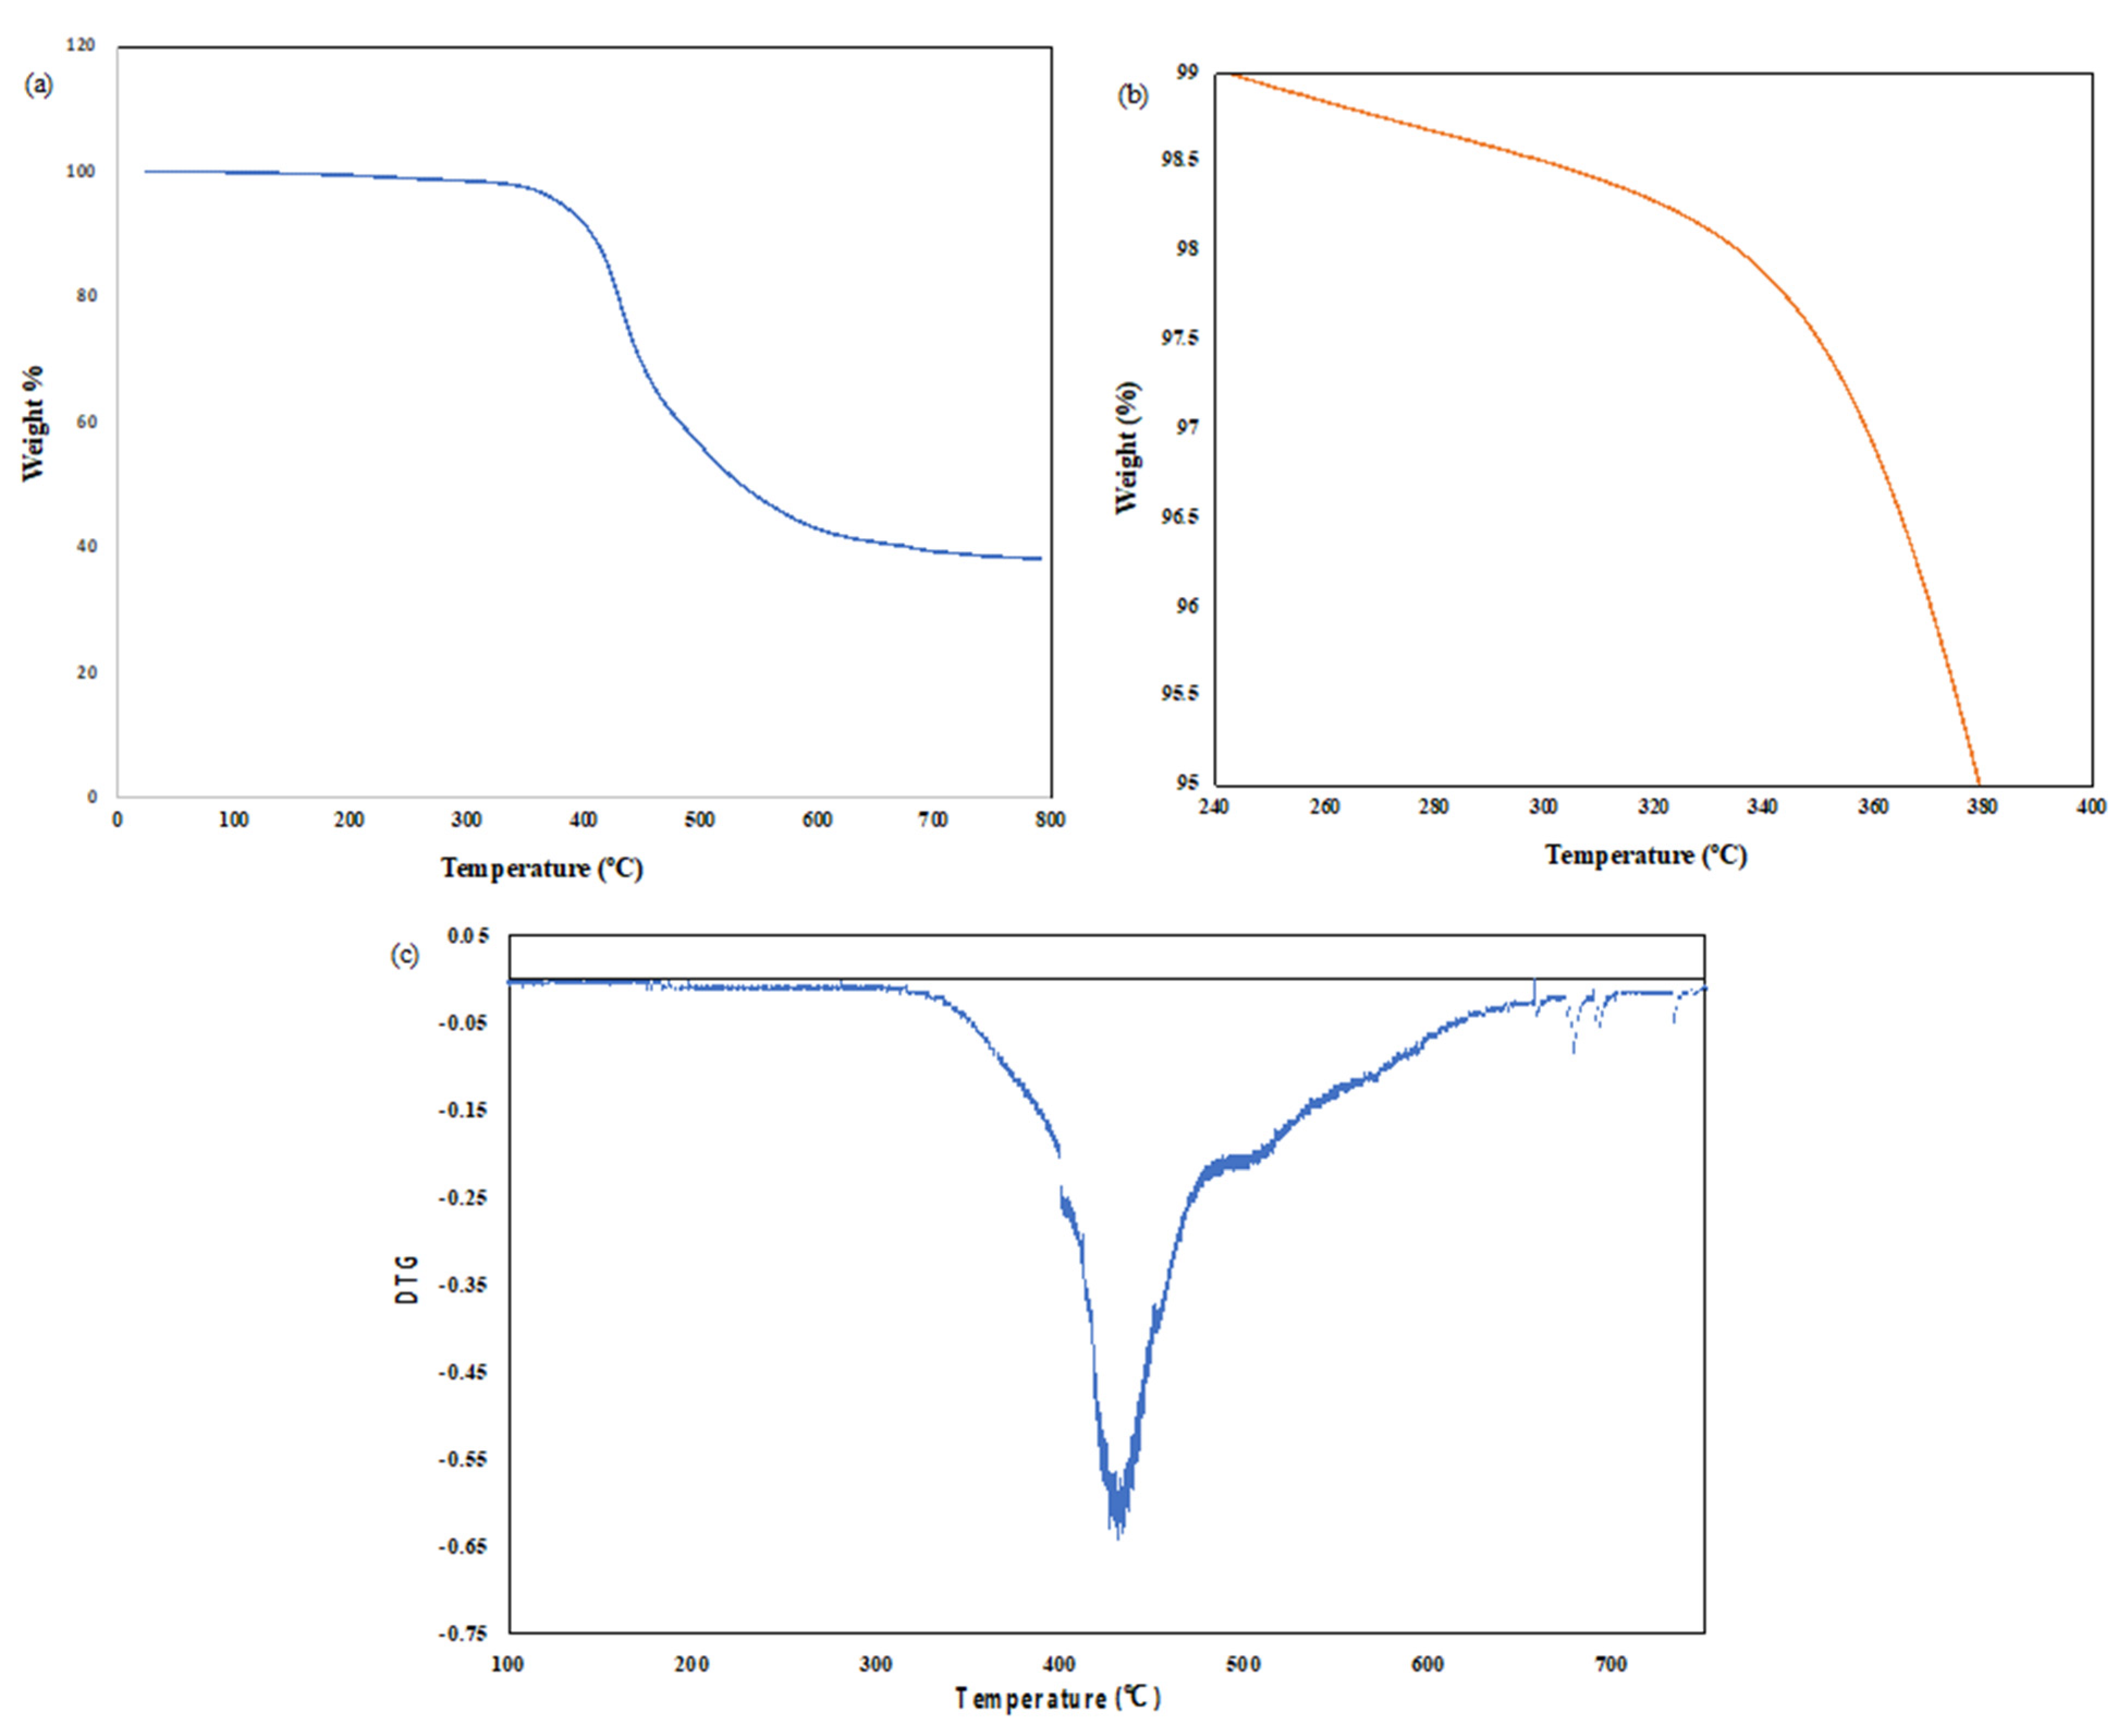
2.5.1. Thermogravimetric Analysis
2.5.2. Differential Scanning Calorimetry
2.5.3. Scanning Electron Microscopy
2.5.4. Fourier Transform Infrared Spectroscopy
2.5.5. Dynamic Mechanical Analysis
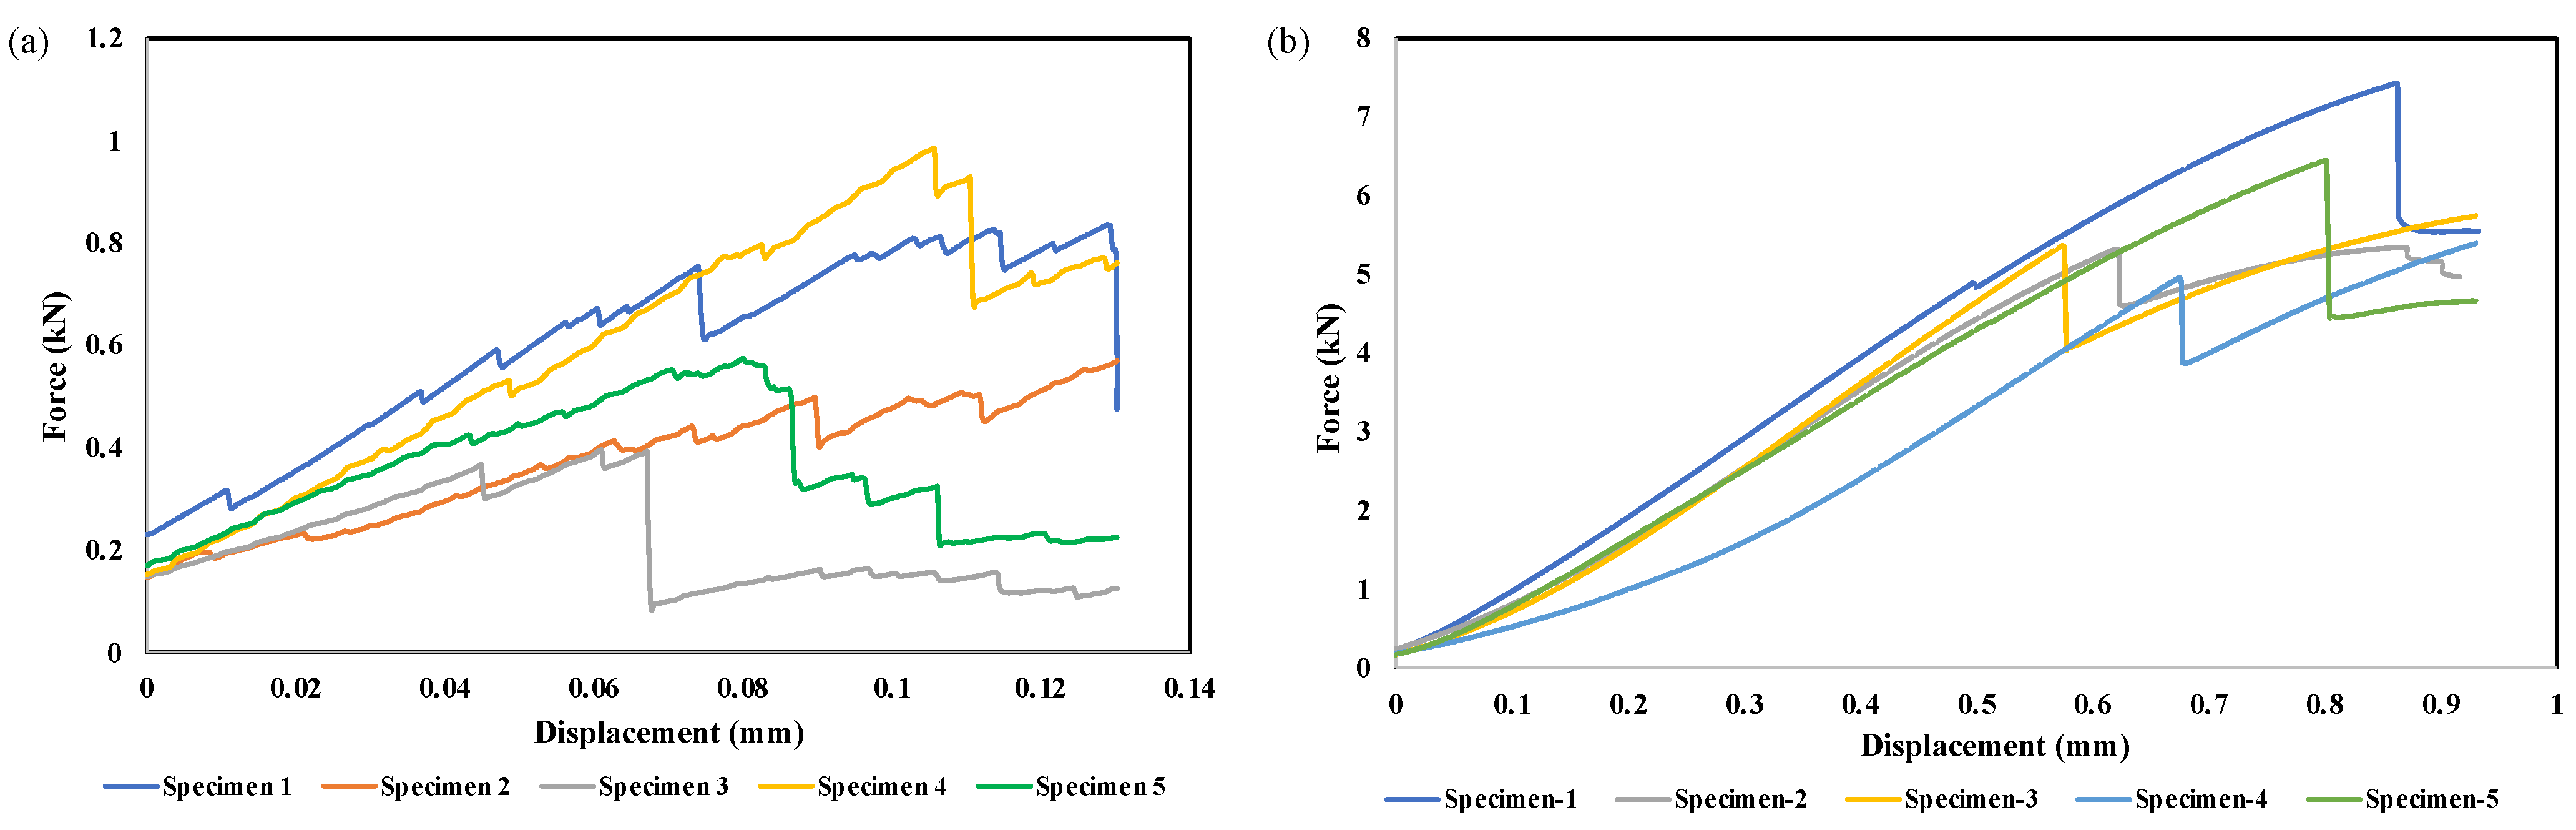
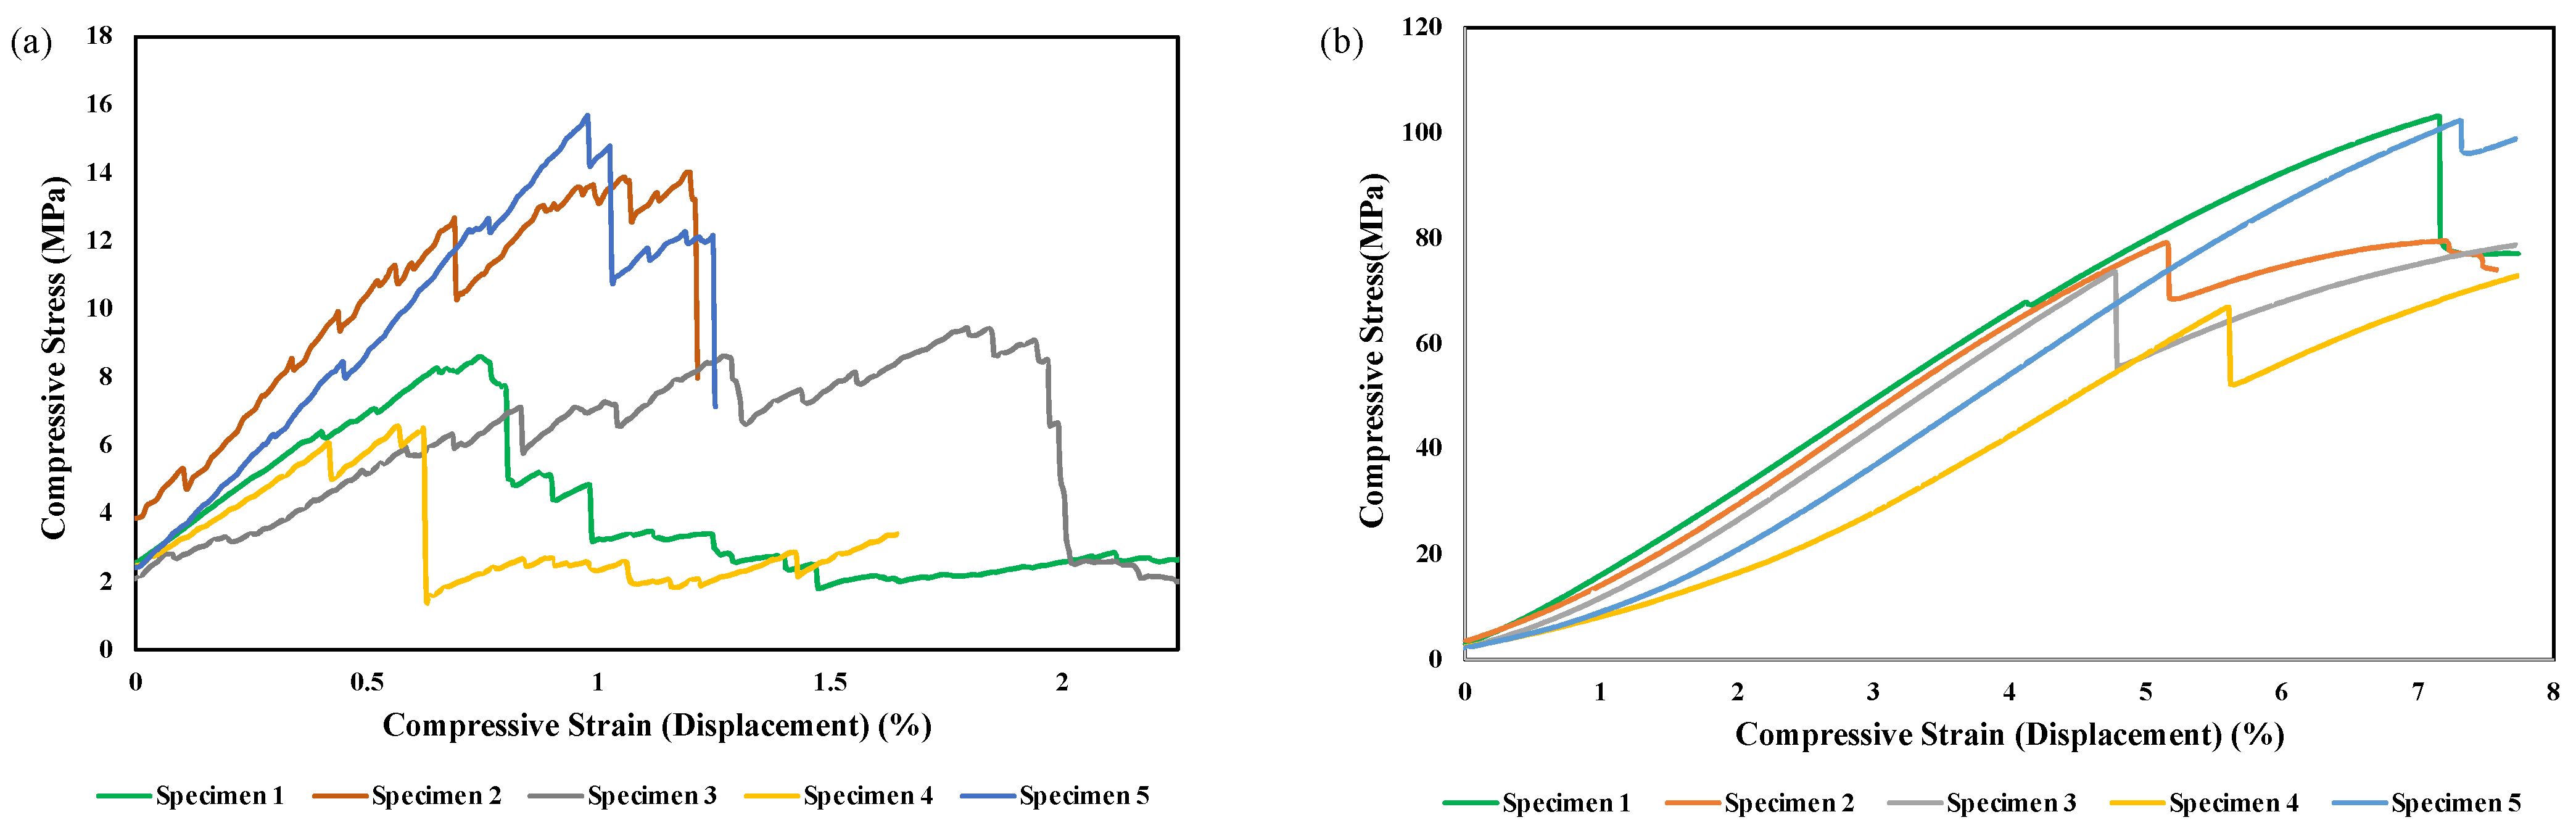
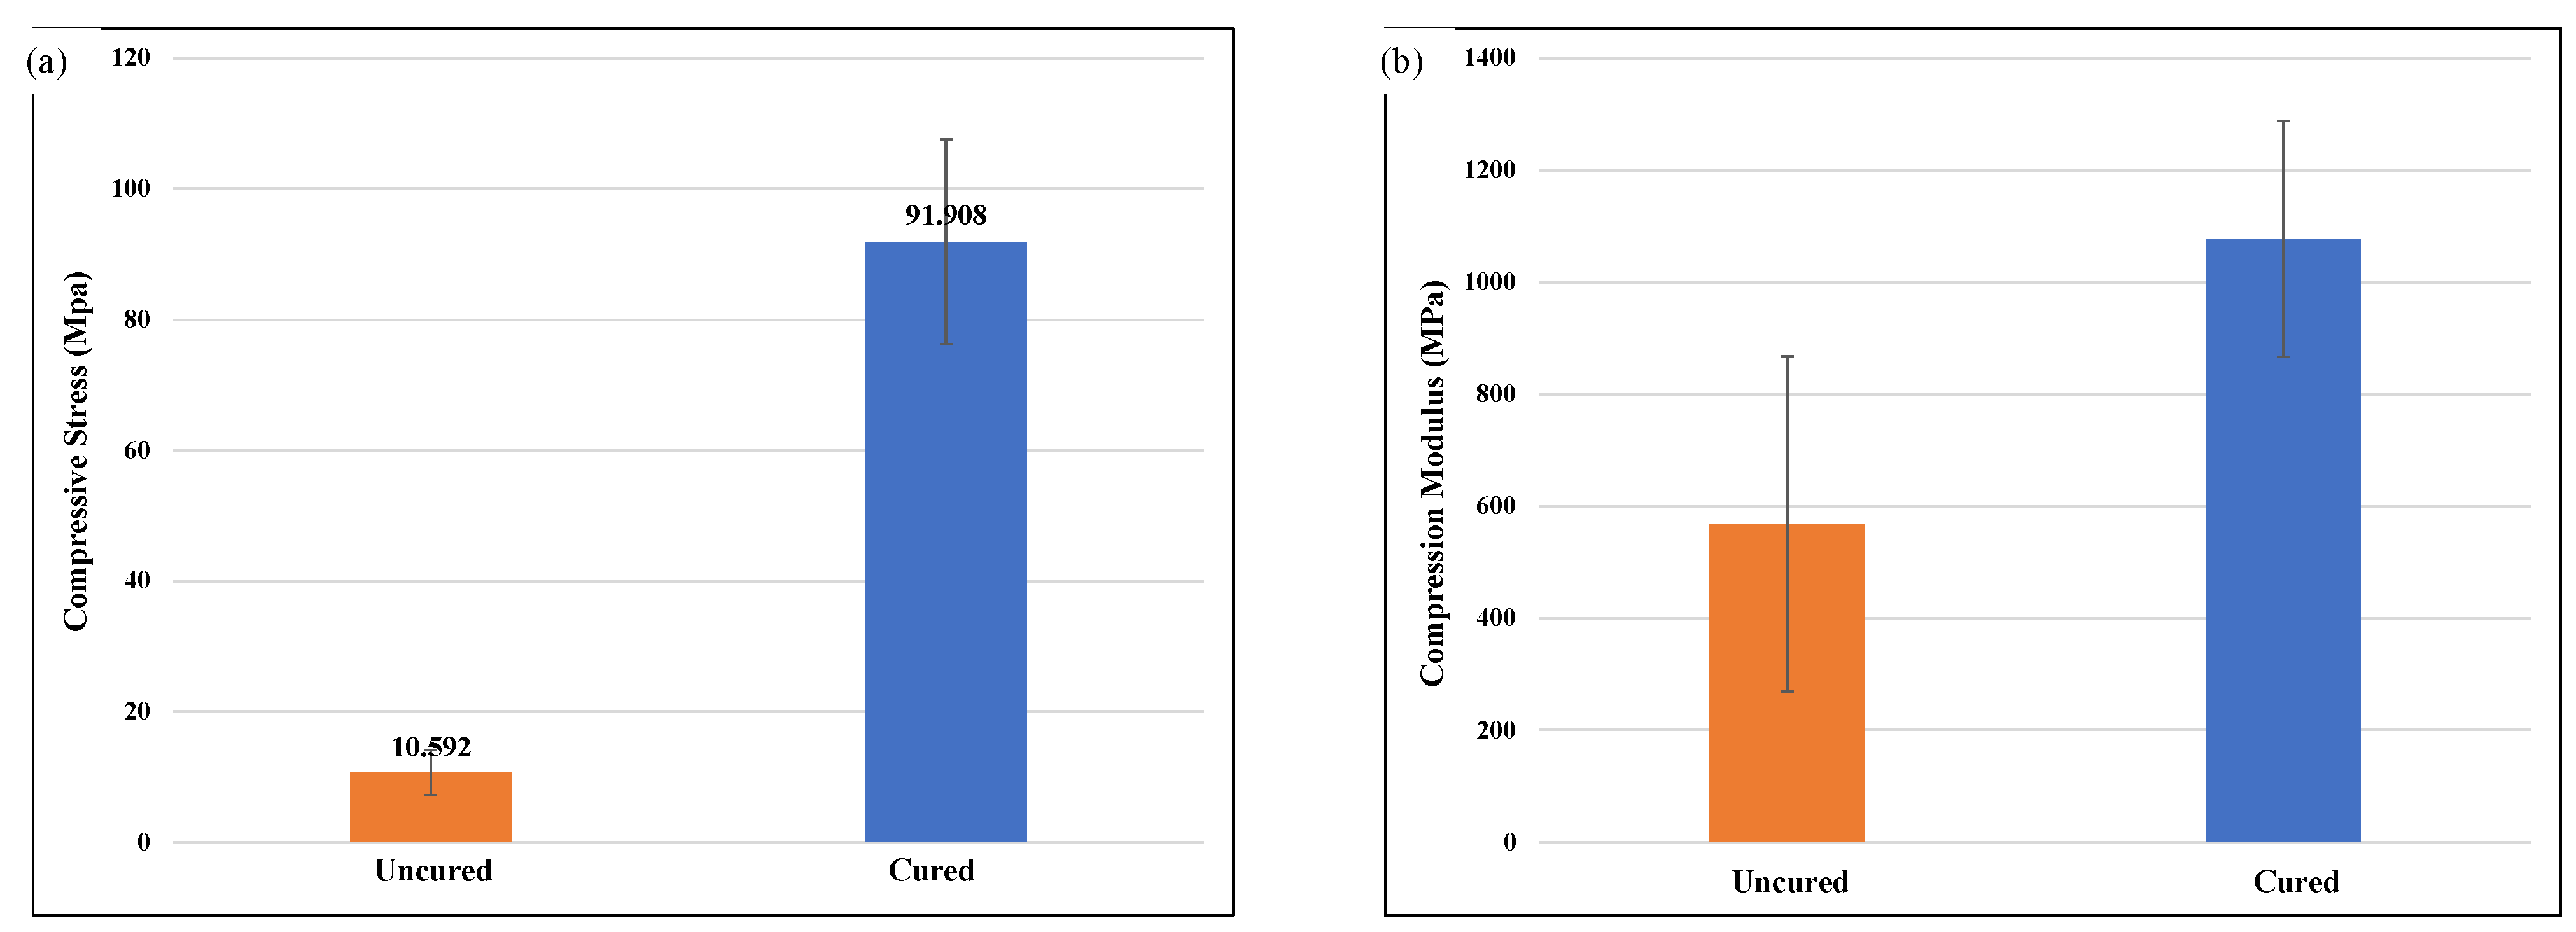
2.5.6. Compression Test
3. Results and Discussion
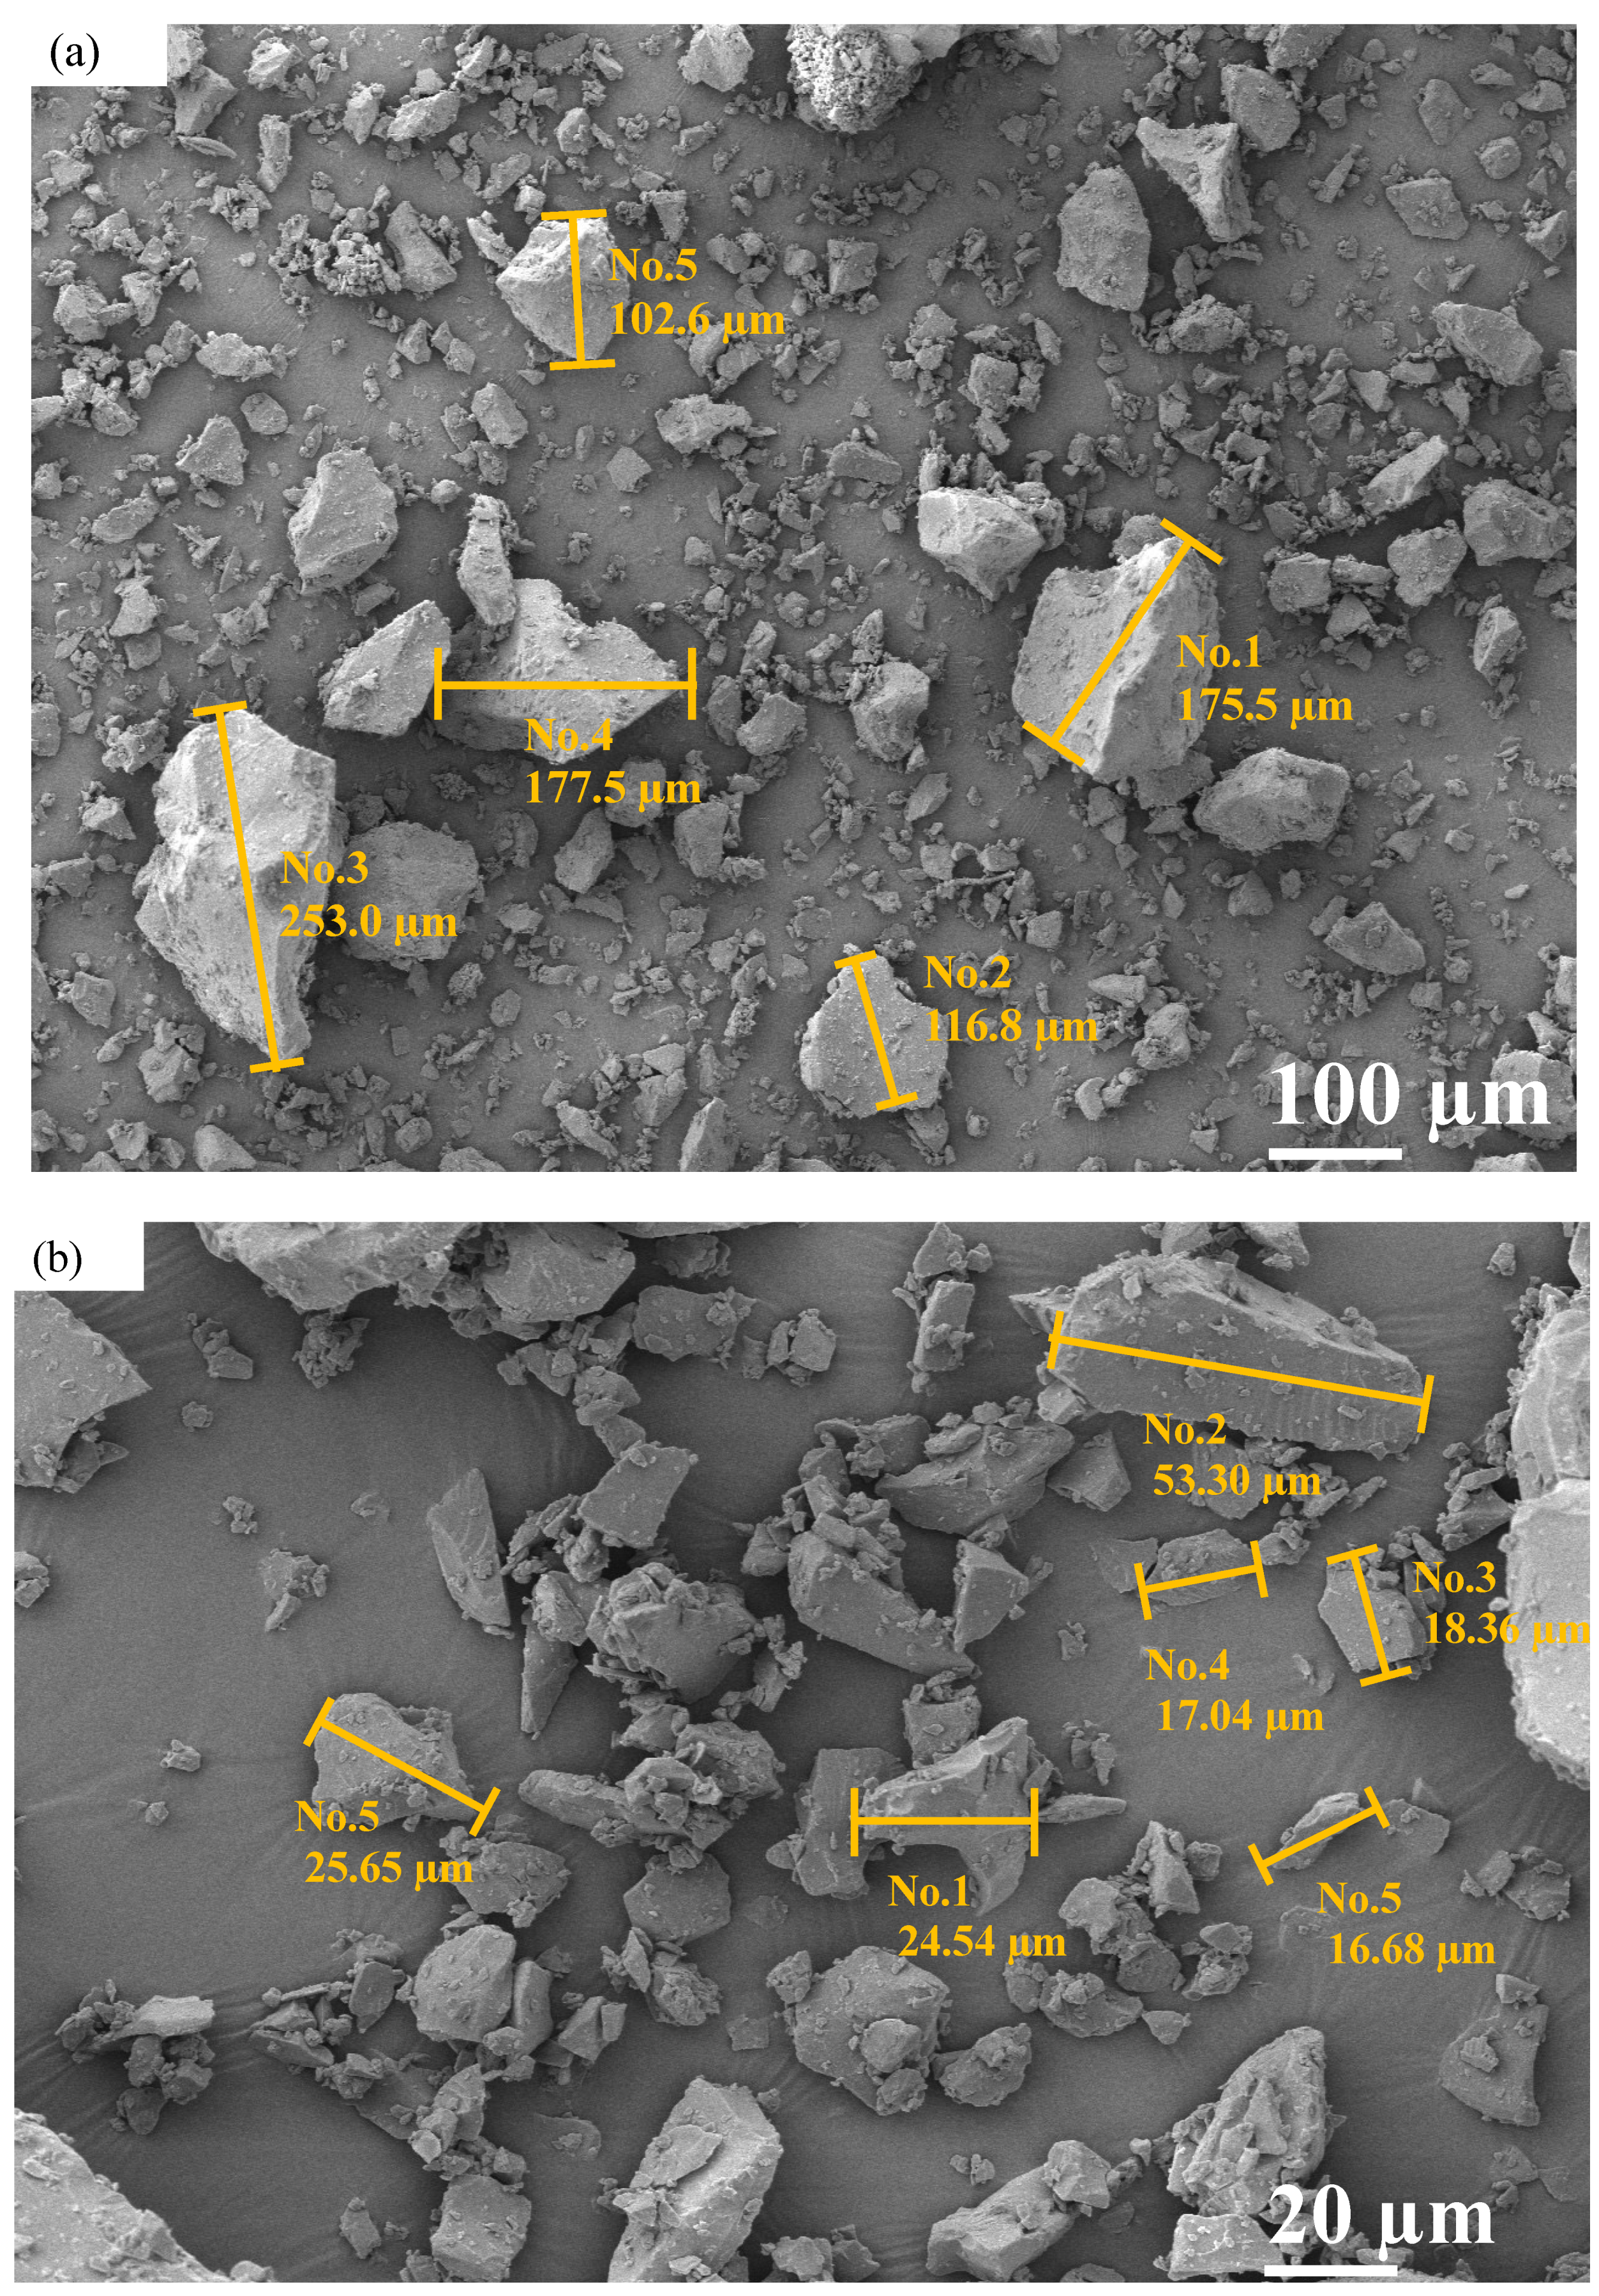
3.1. BMI Thermoset Powder Morphology
3.2. Thermogravimetric Analysis
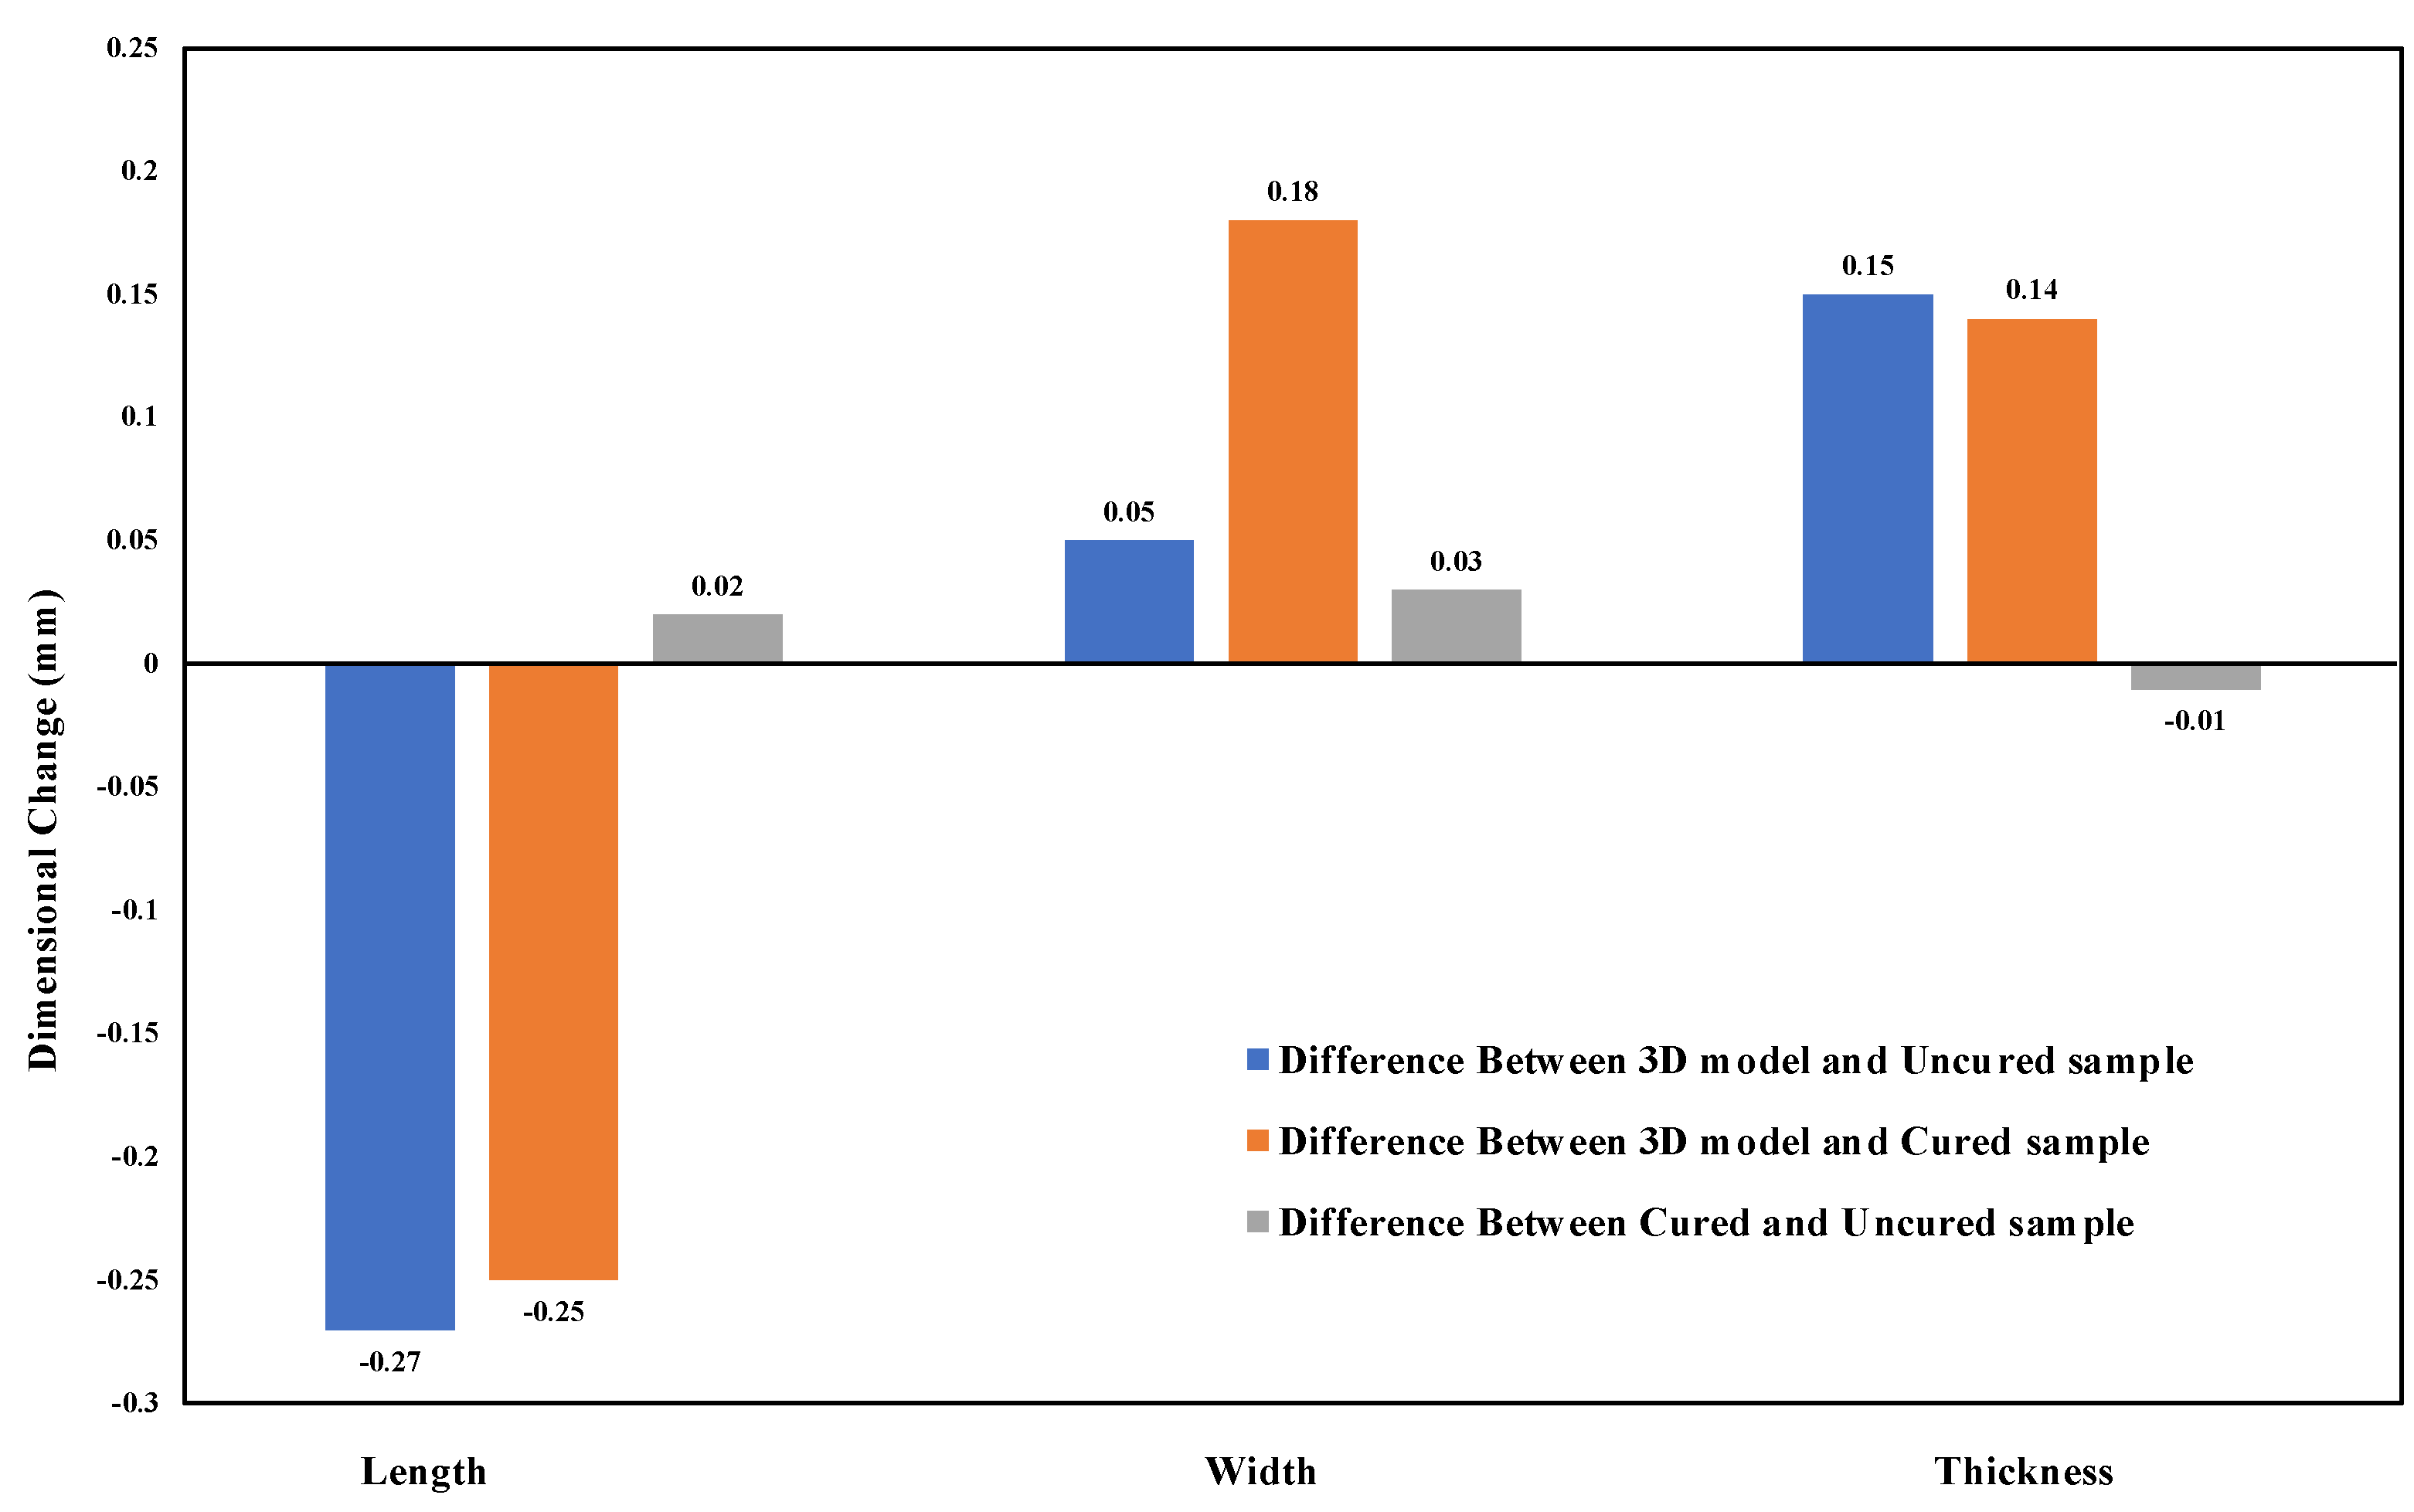
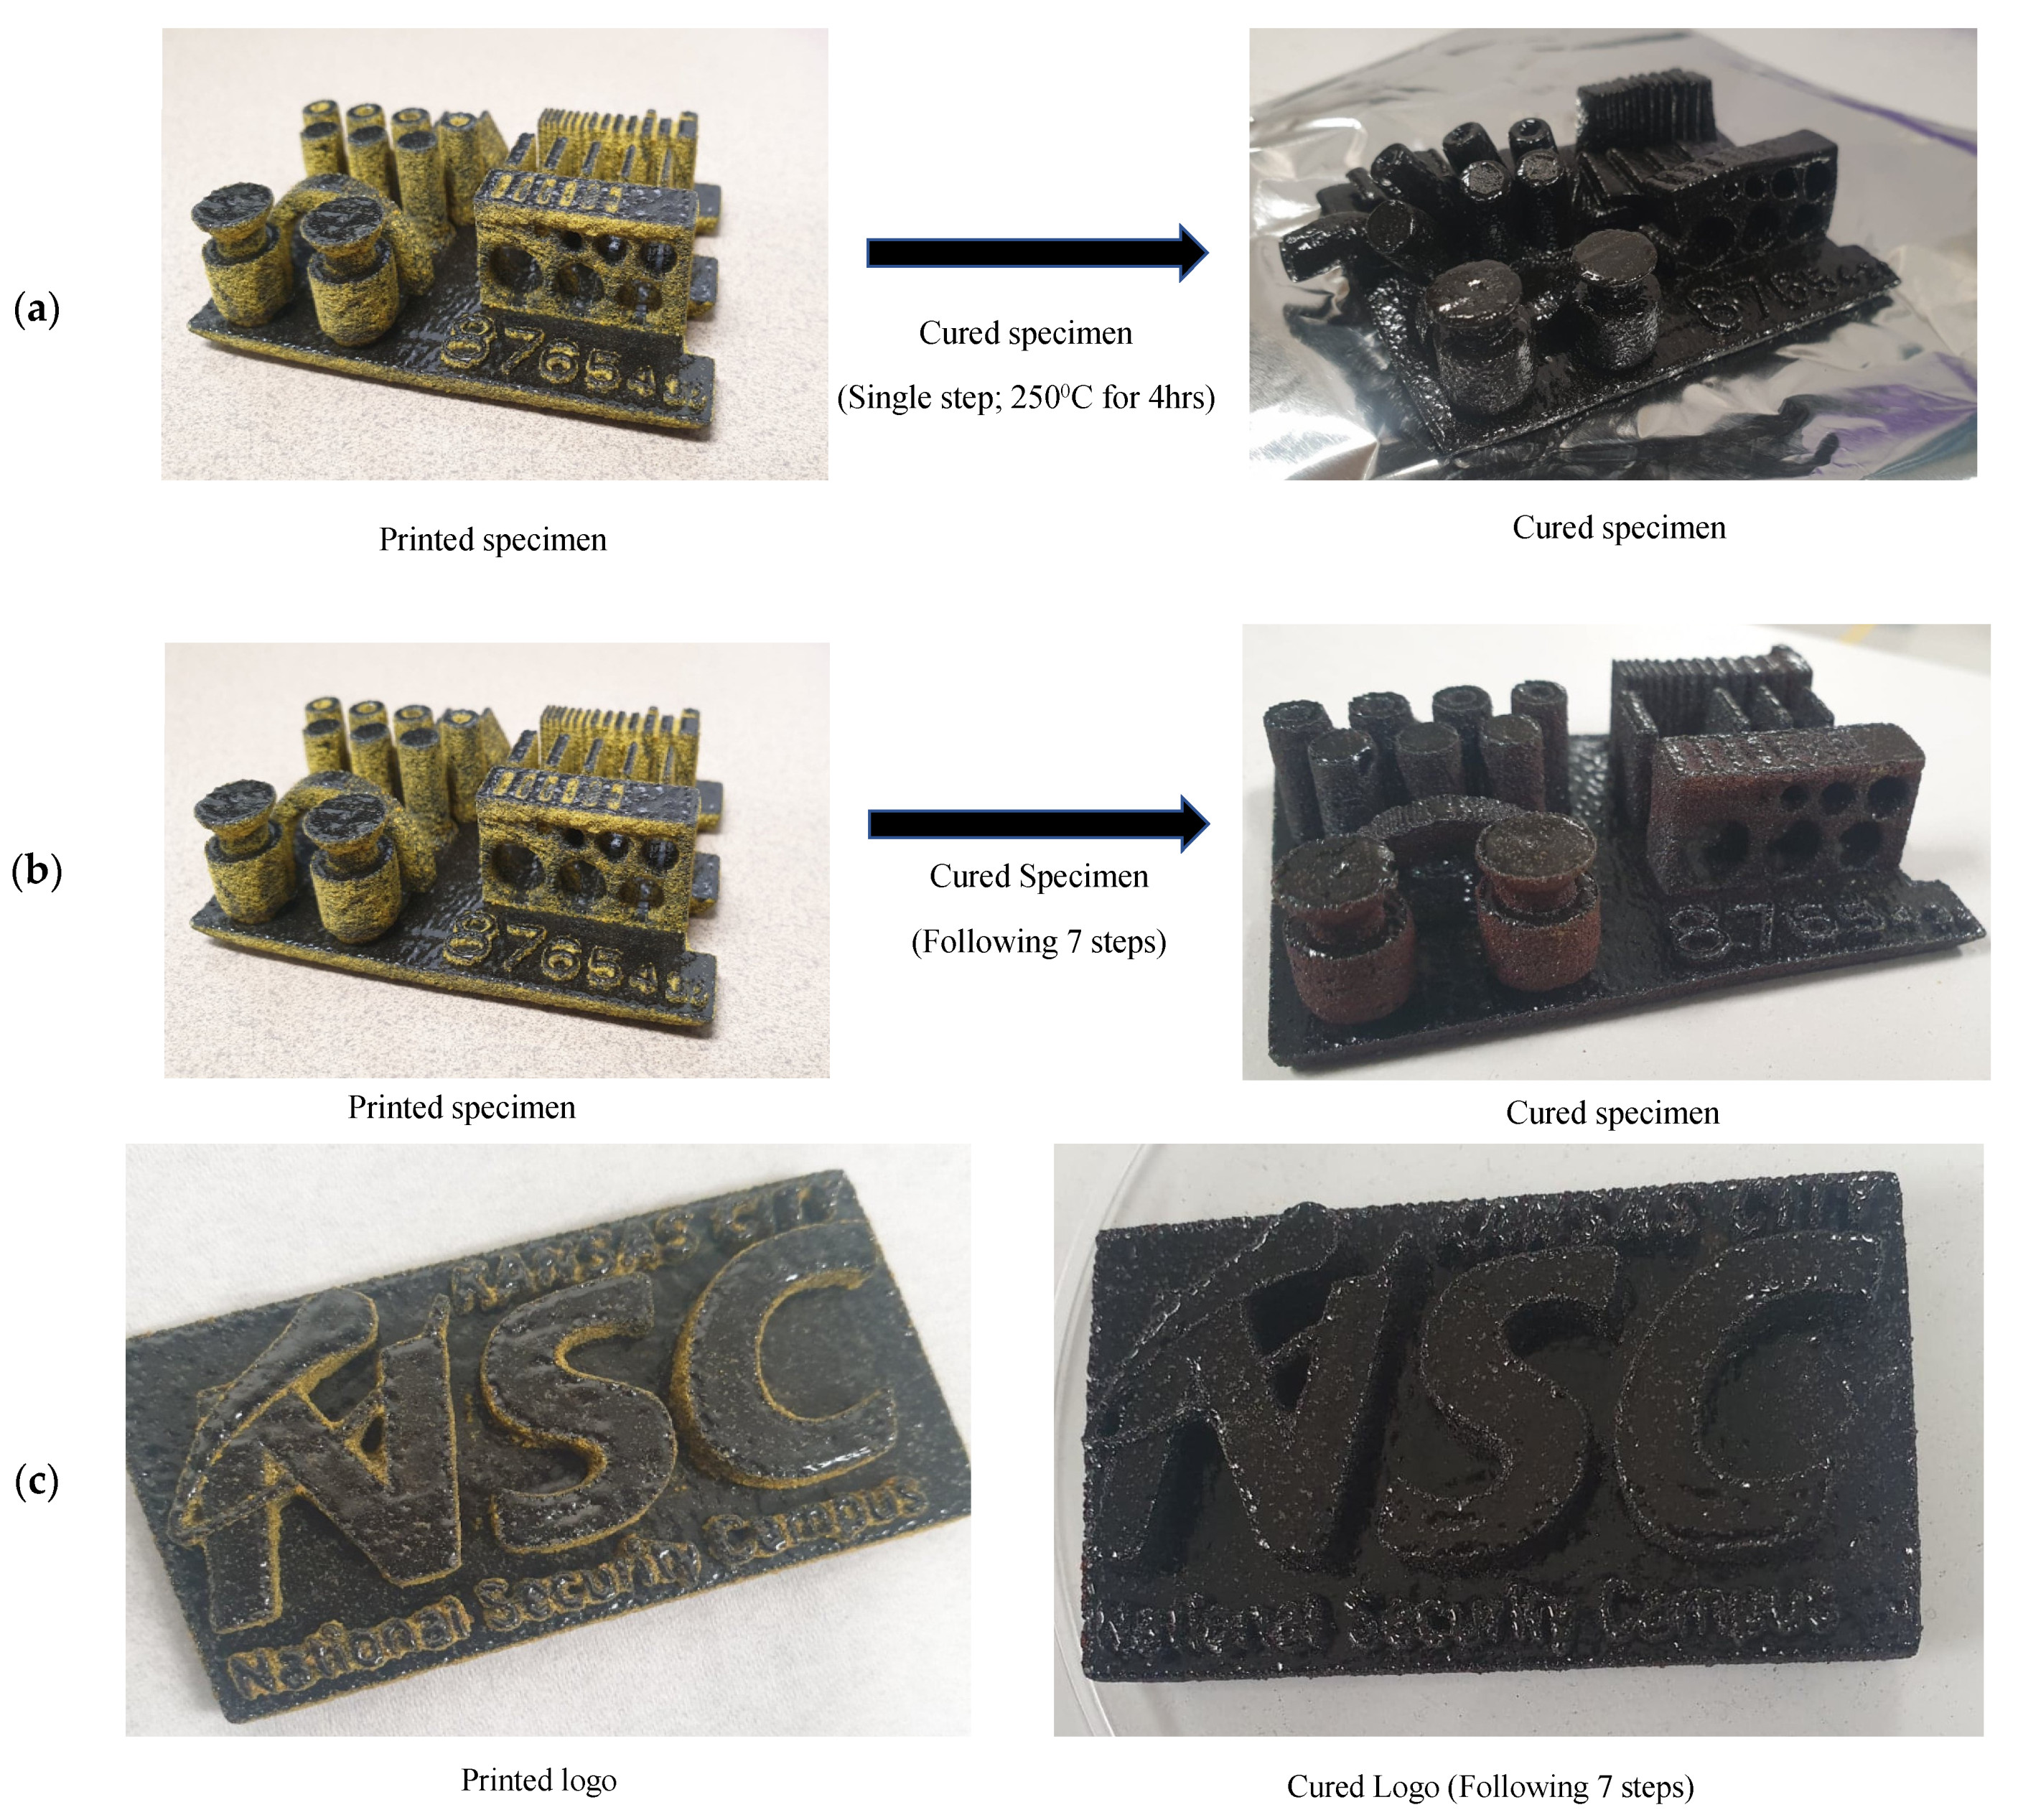
3.3. Selective Laser Sintering and Curing of BMI/10 Vol% CMB
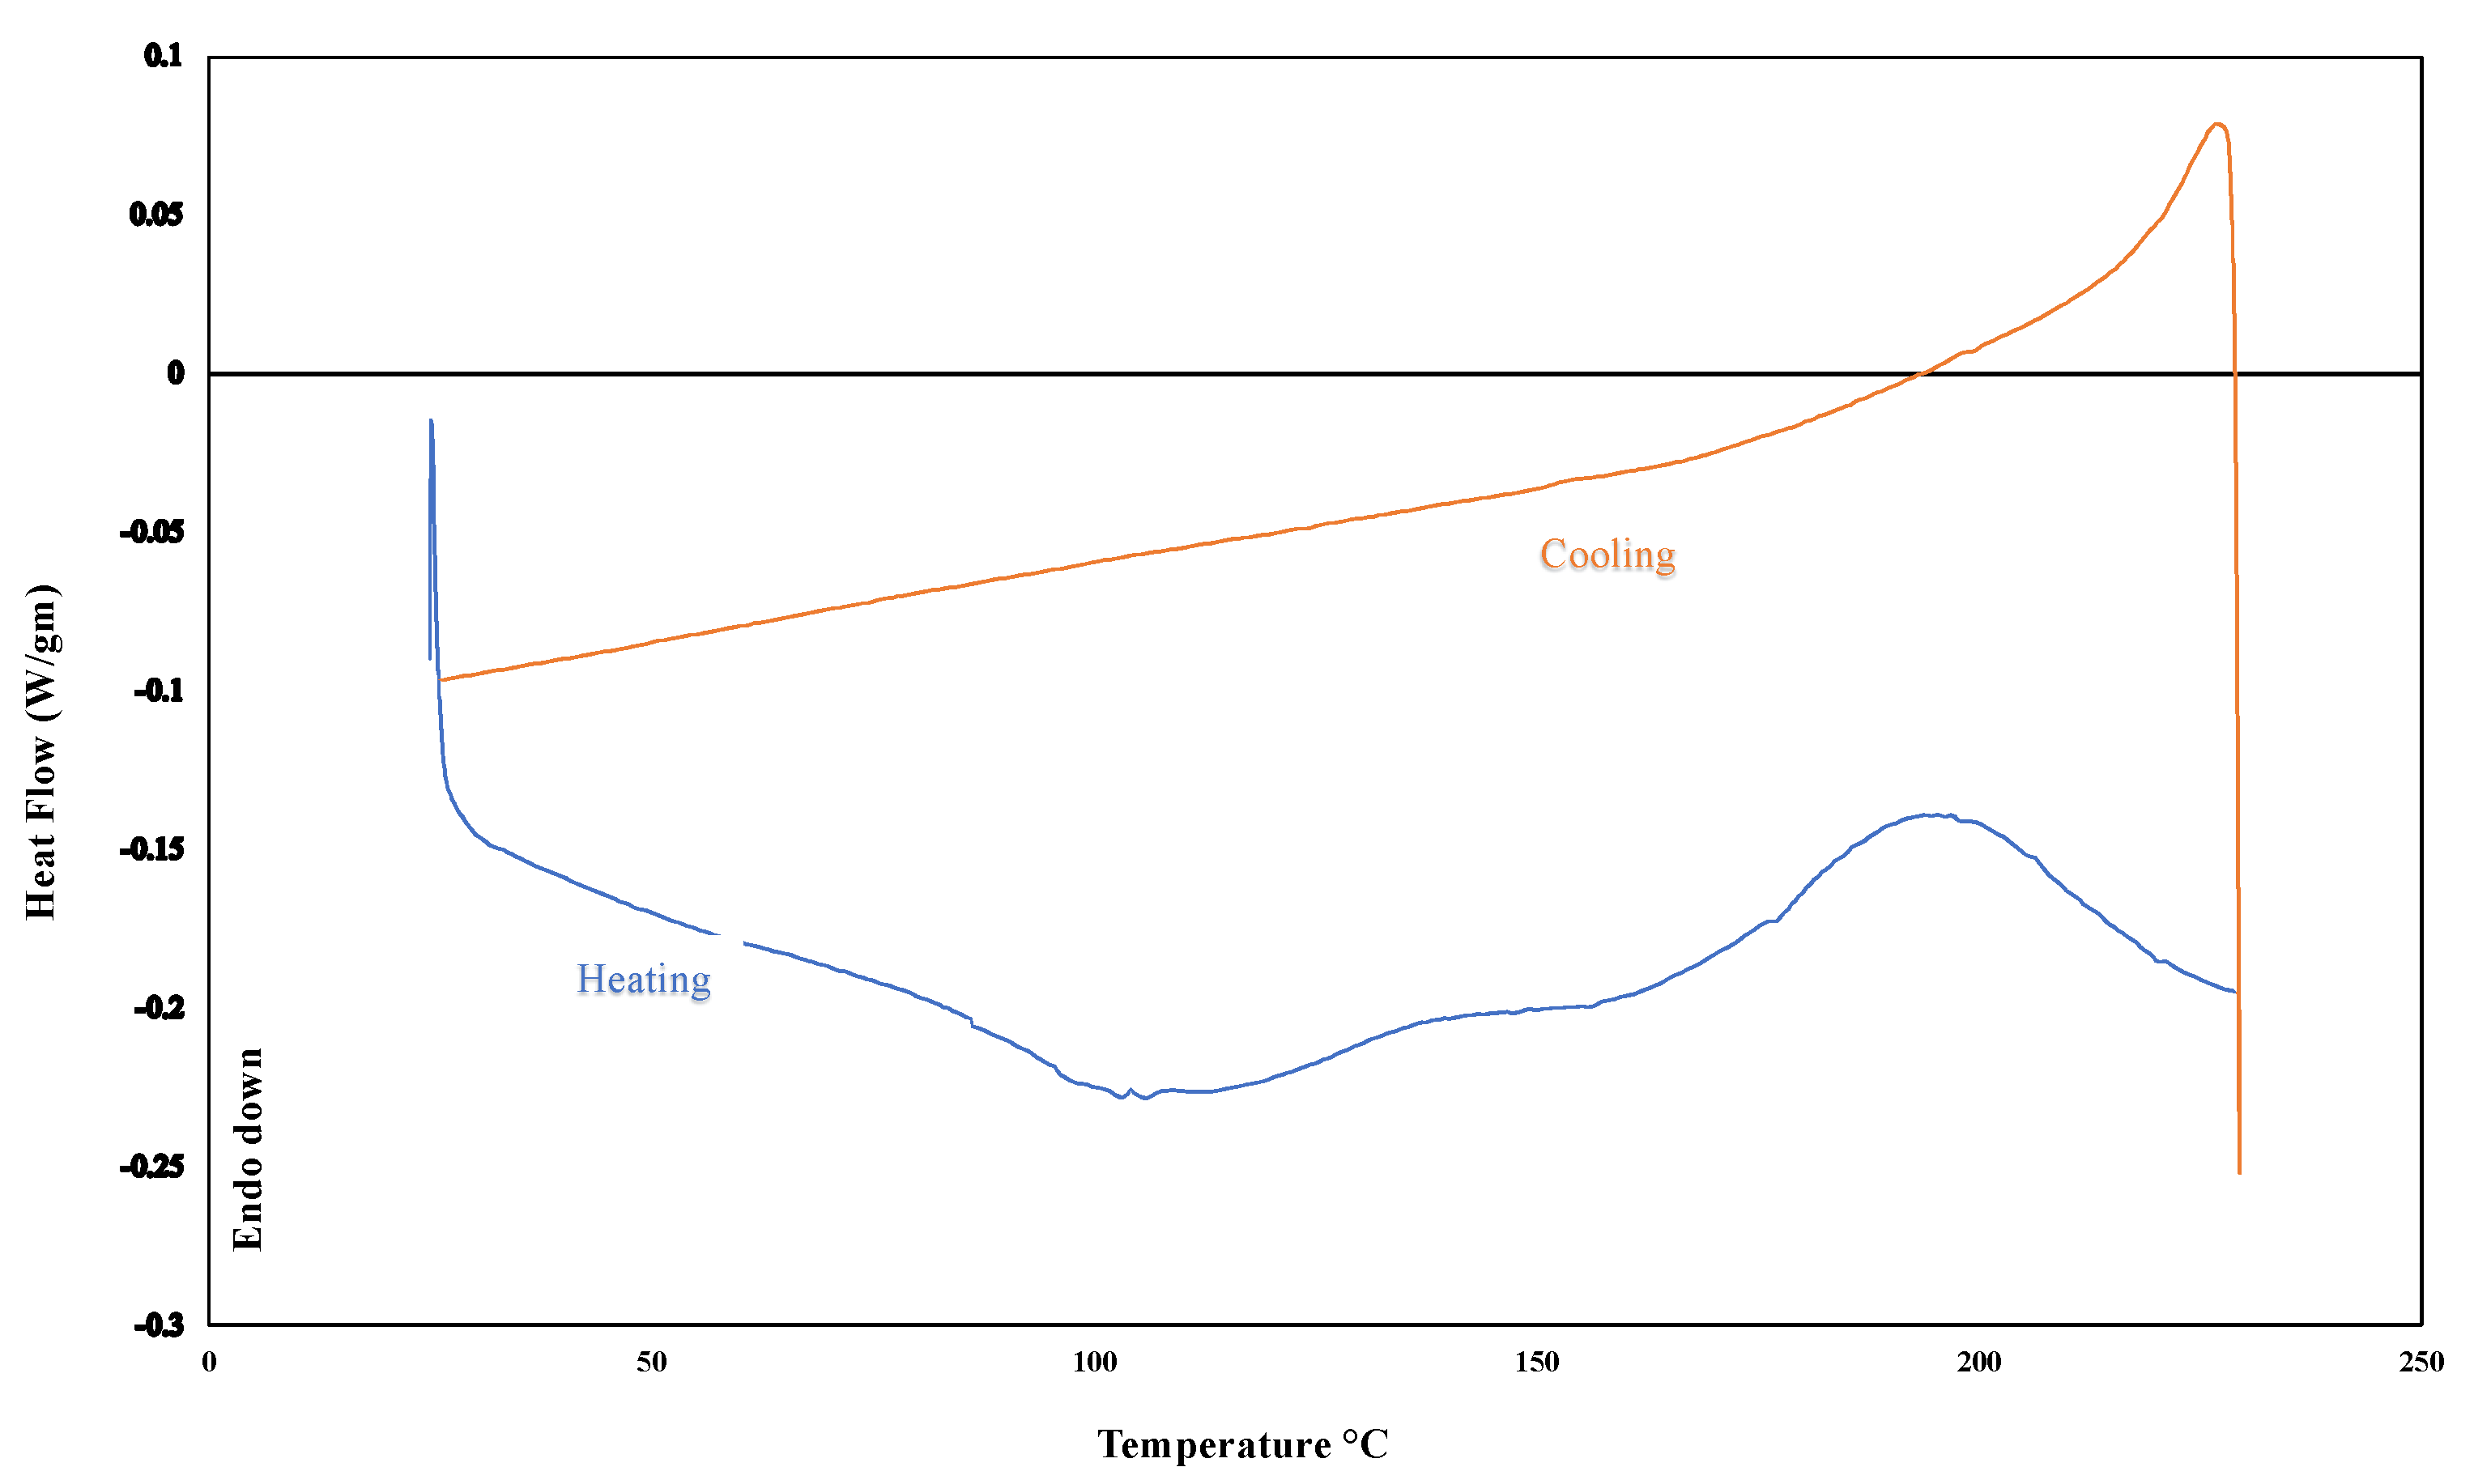
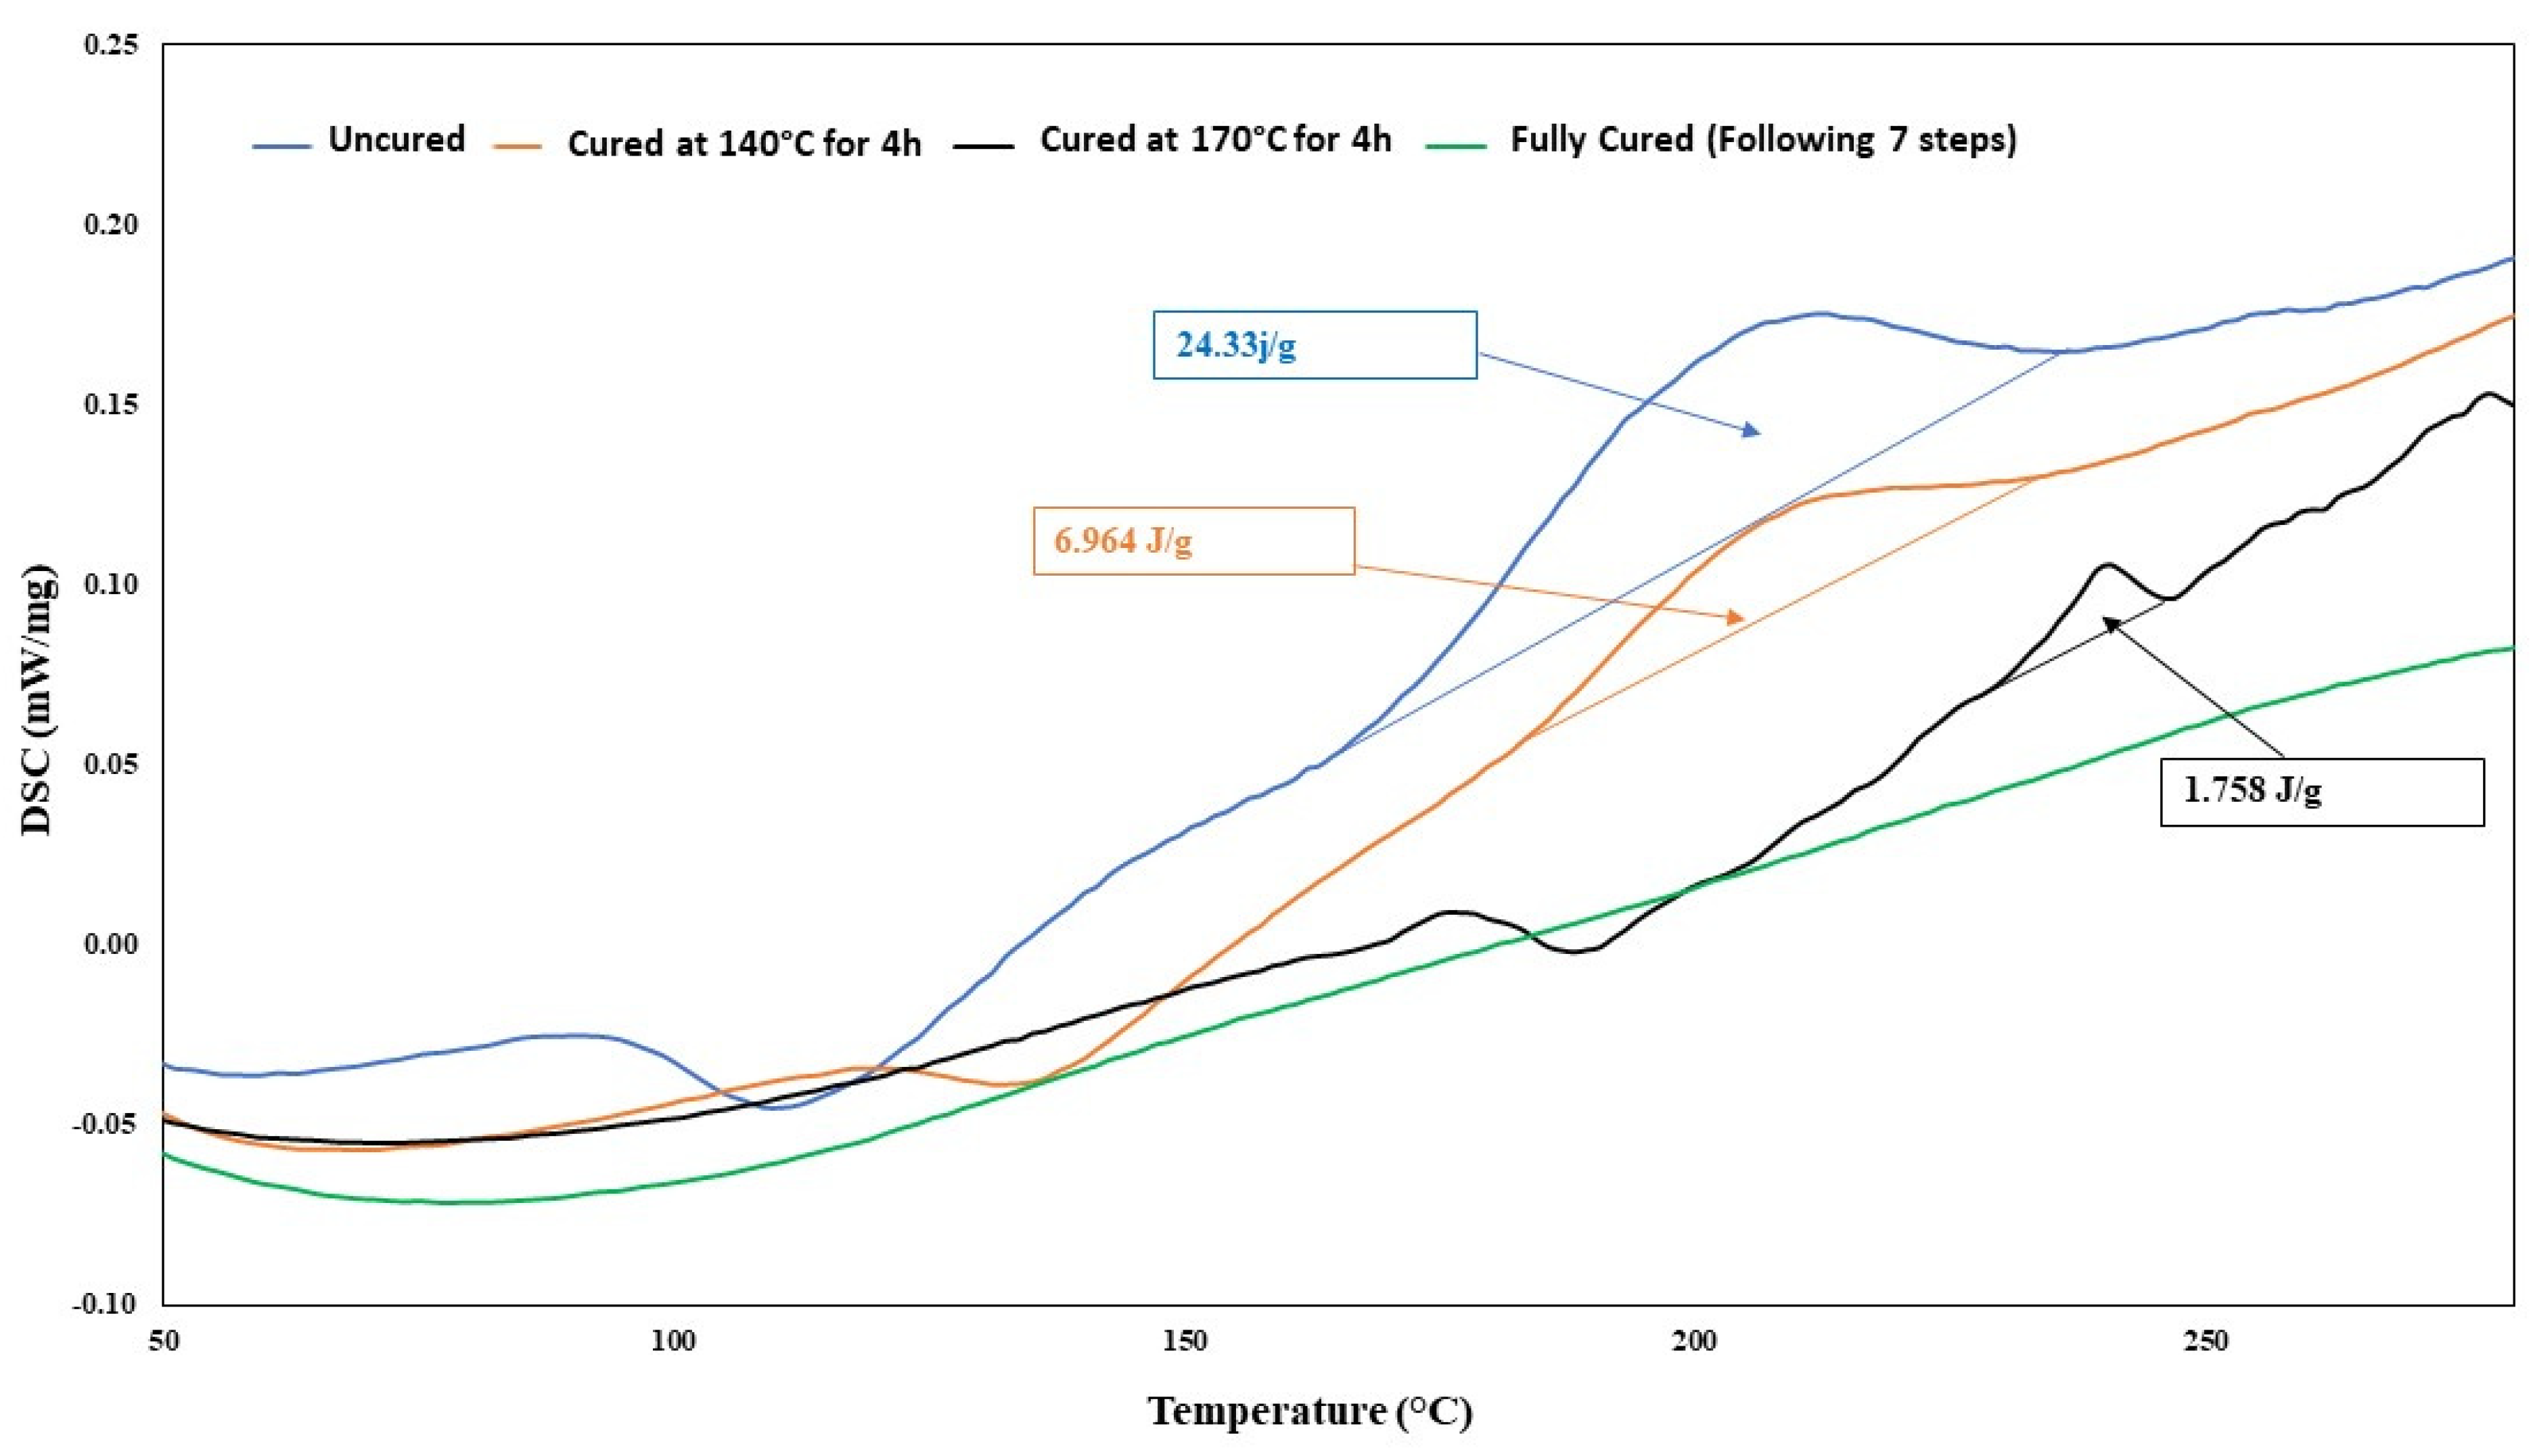
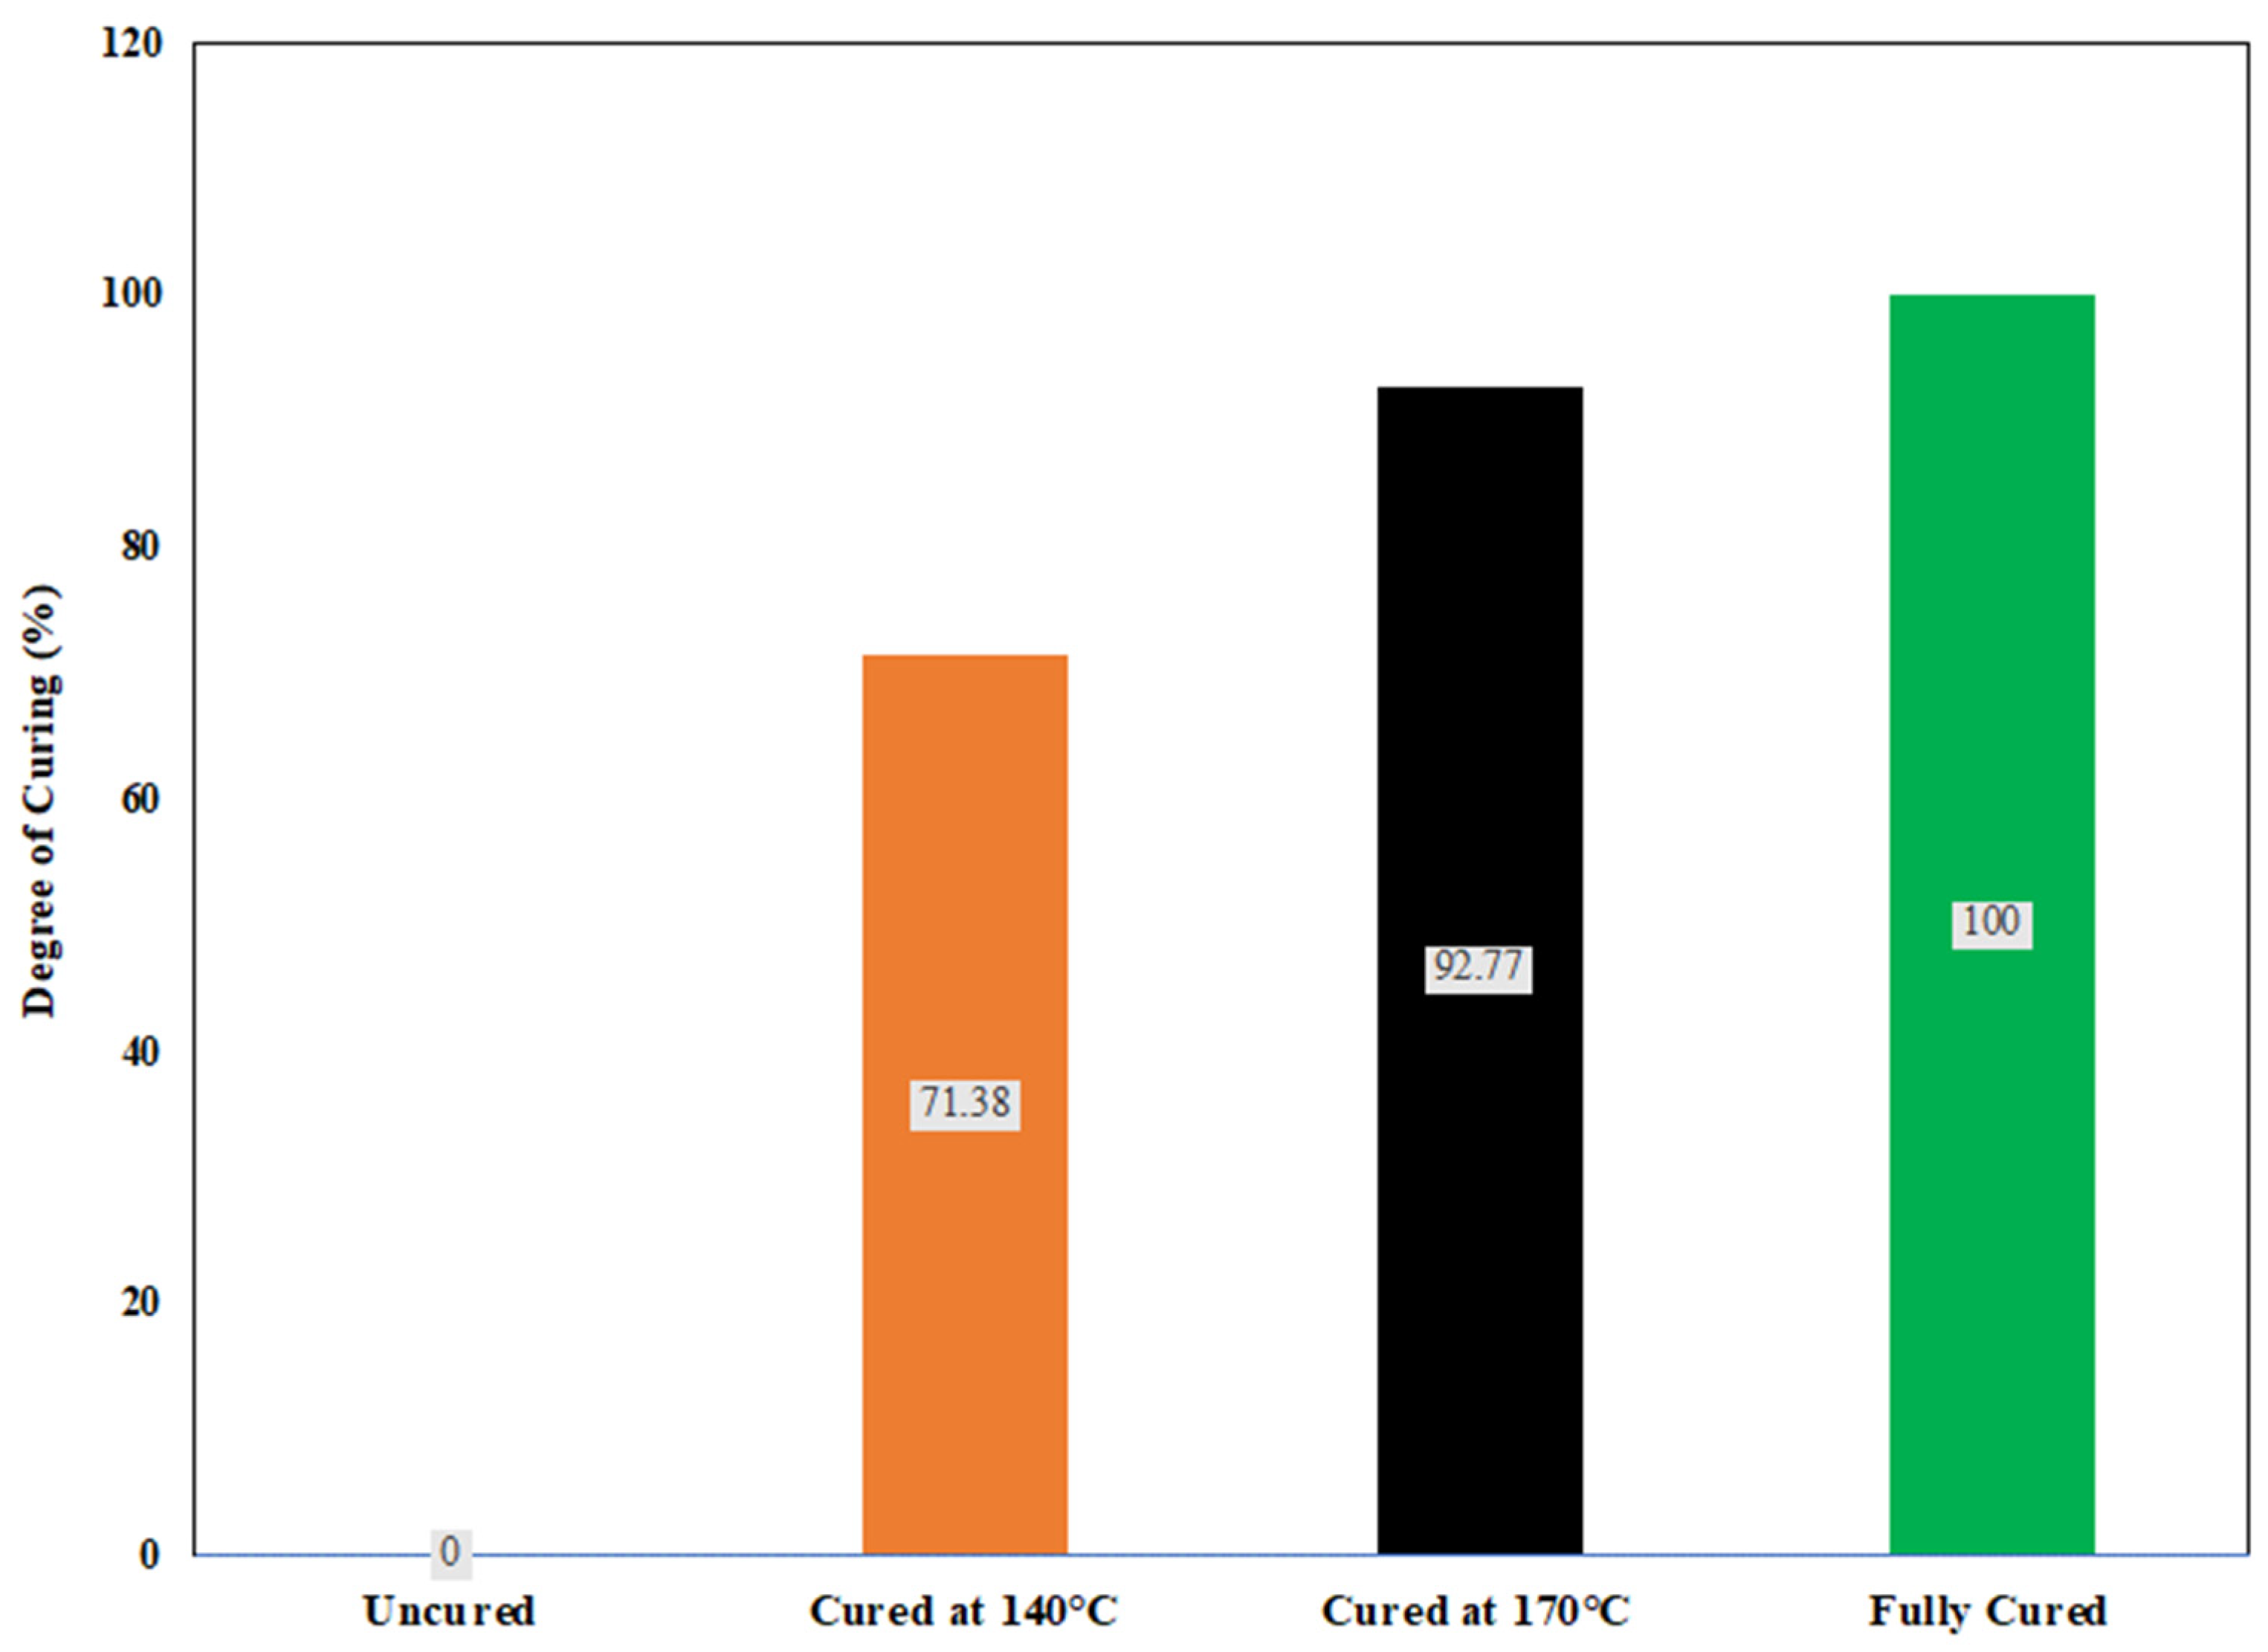
3.4. Differential Scanning Calorimetry
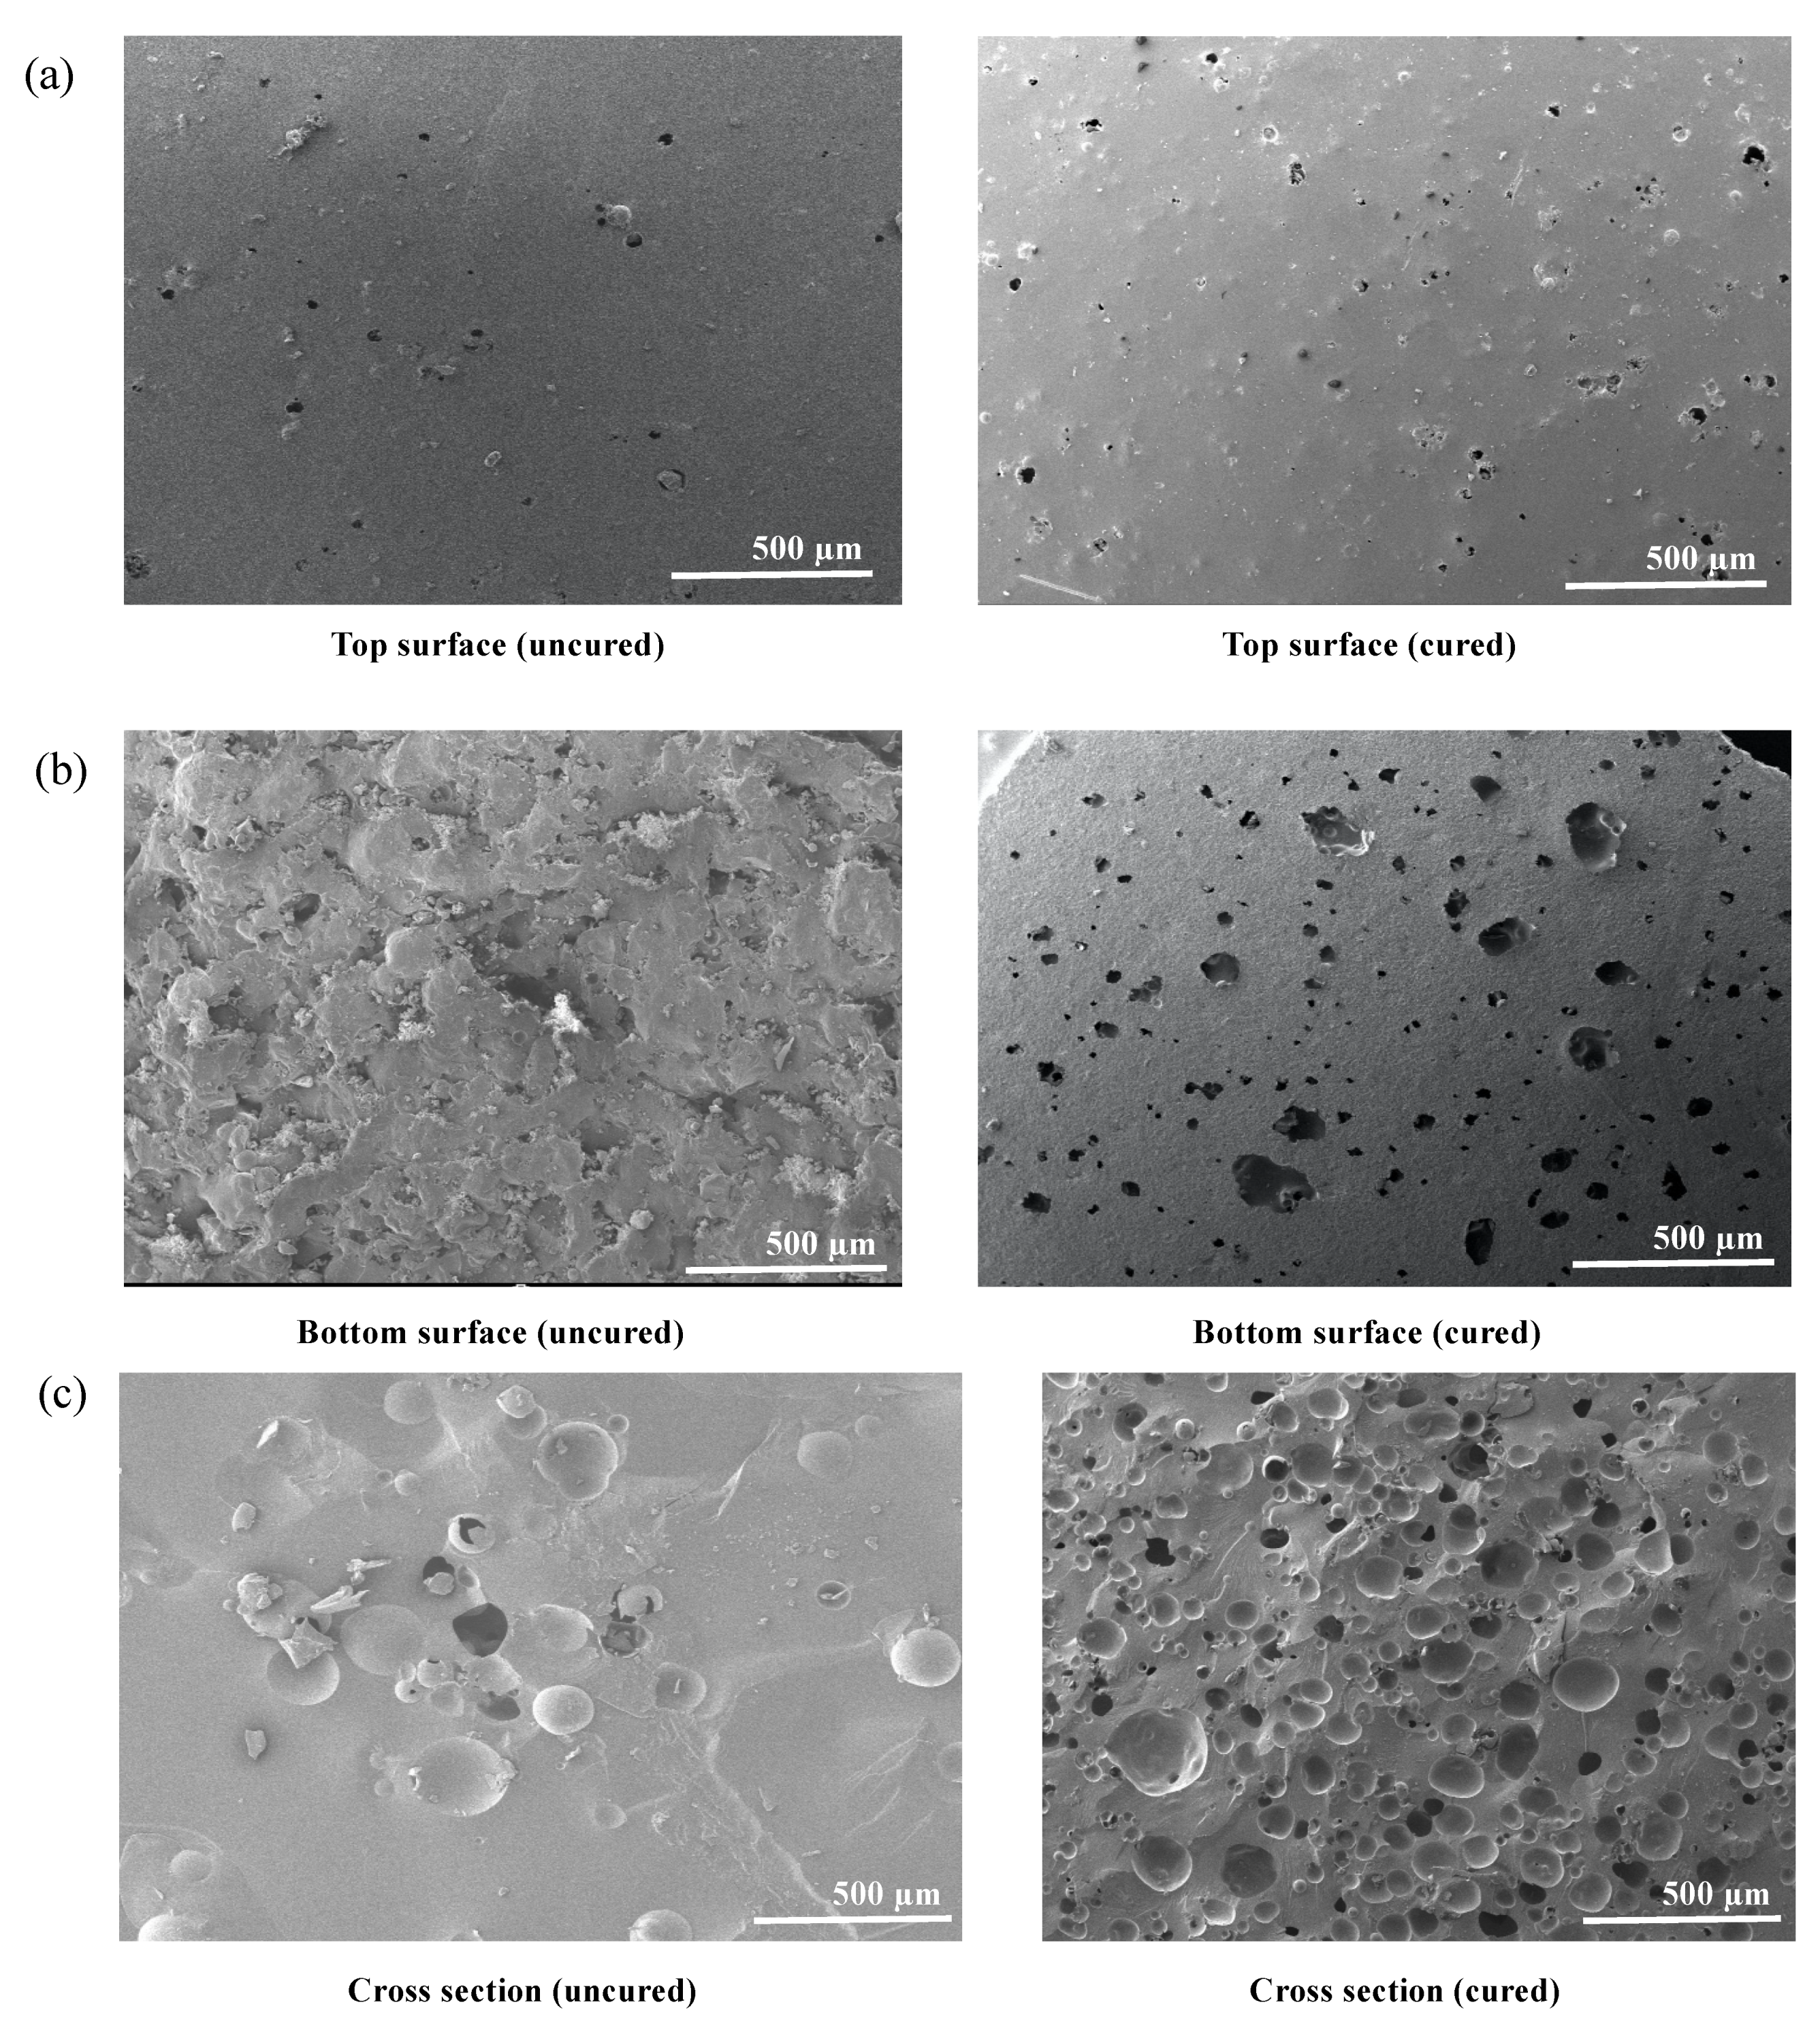
3.5. Scanning Electron Microscopy
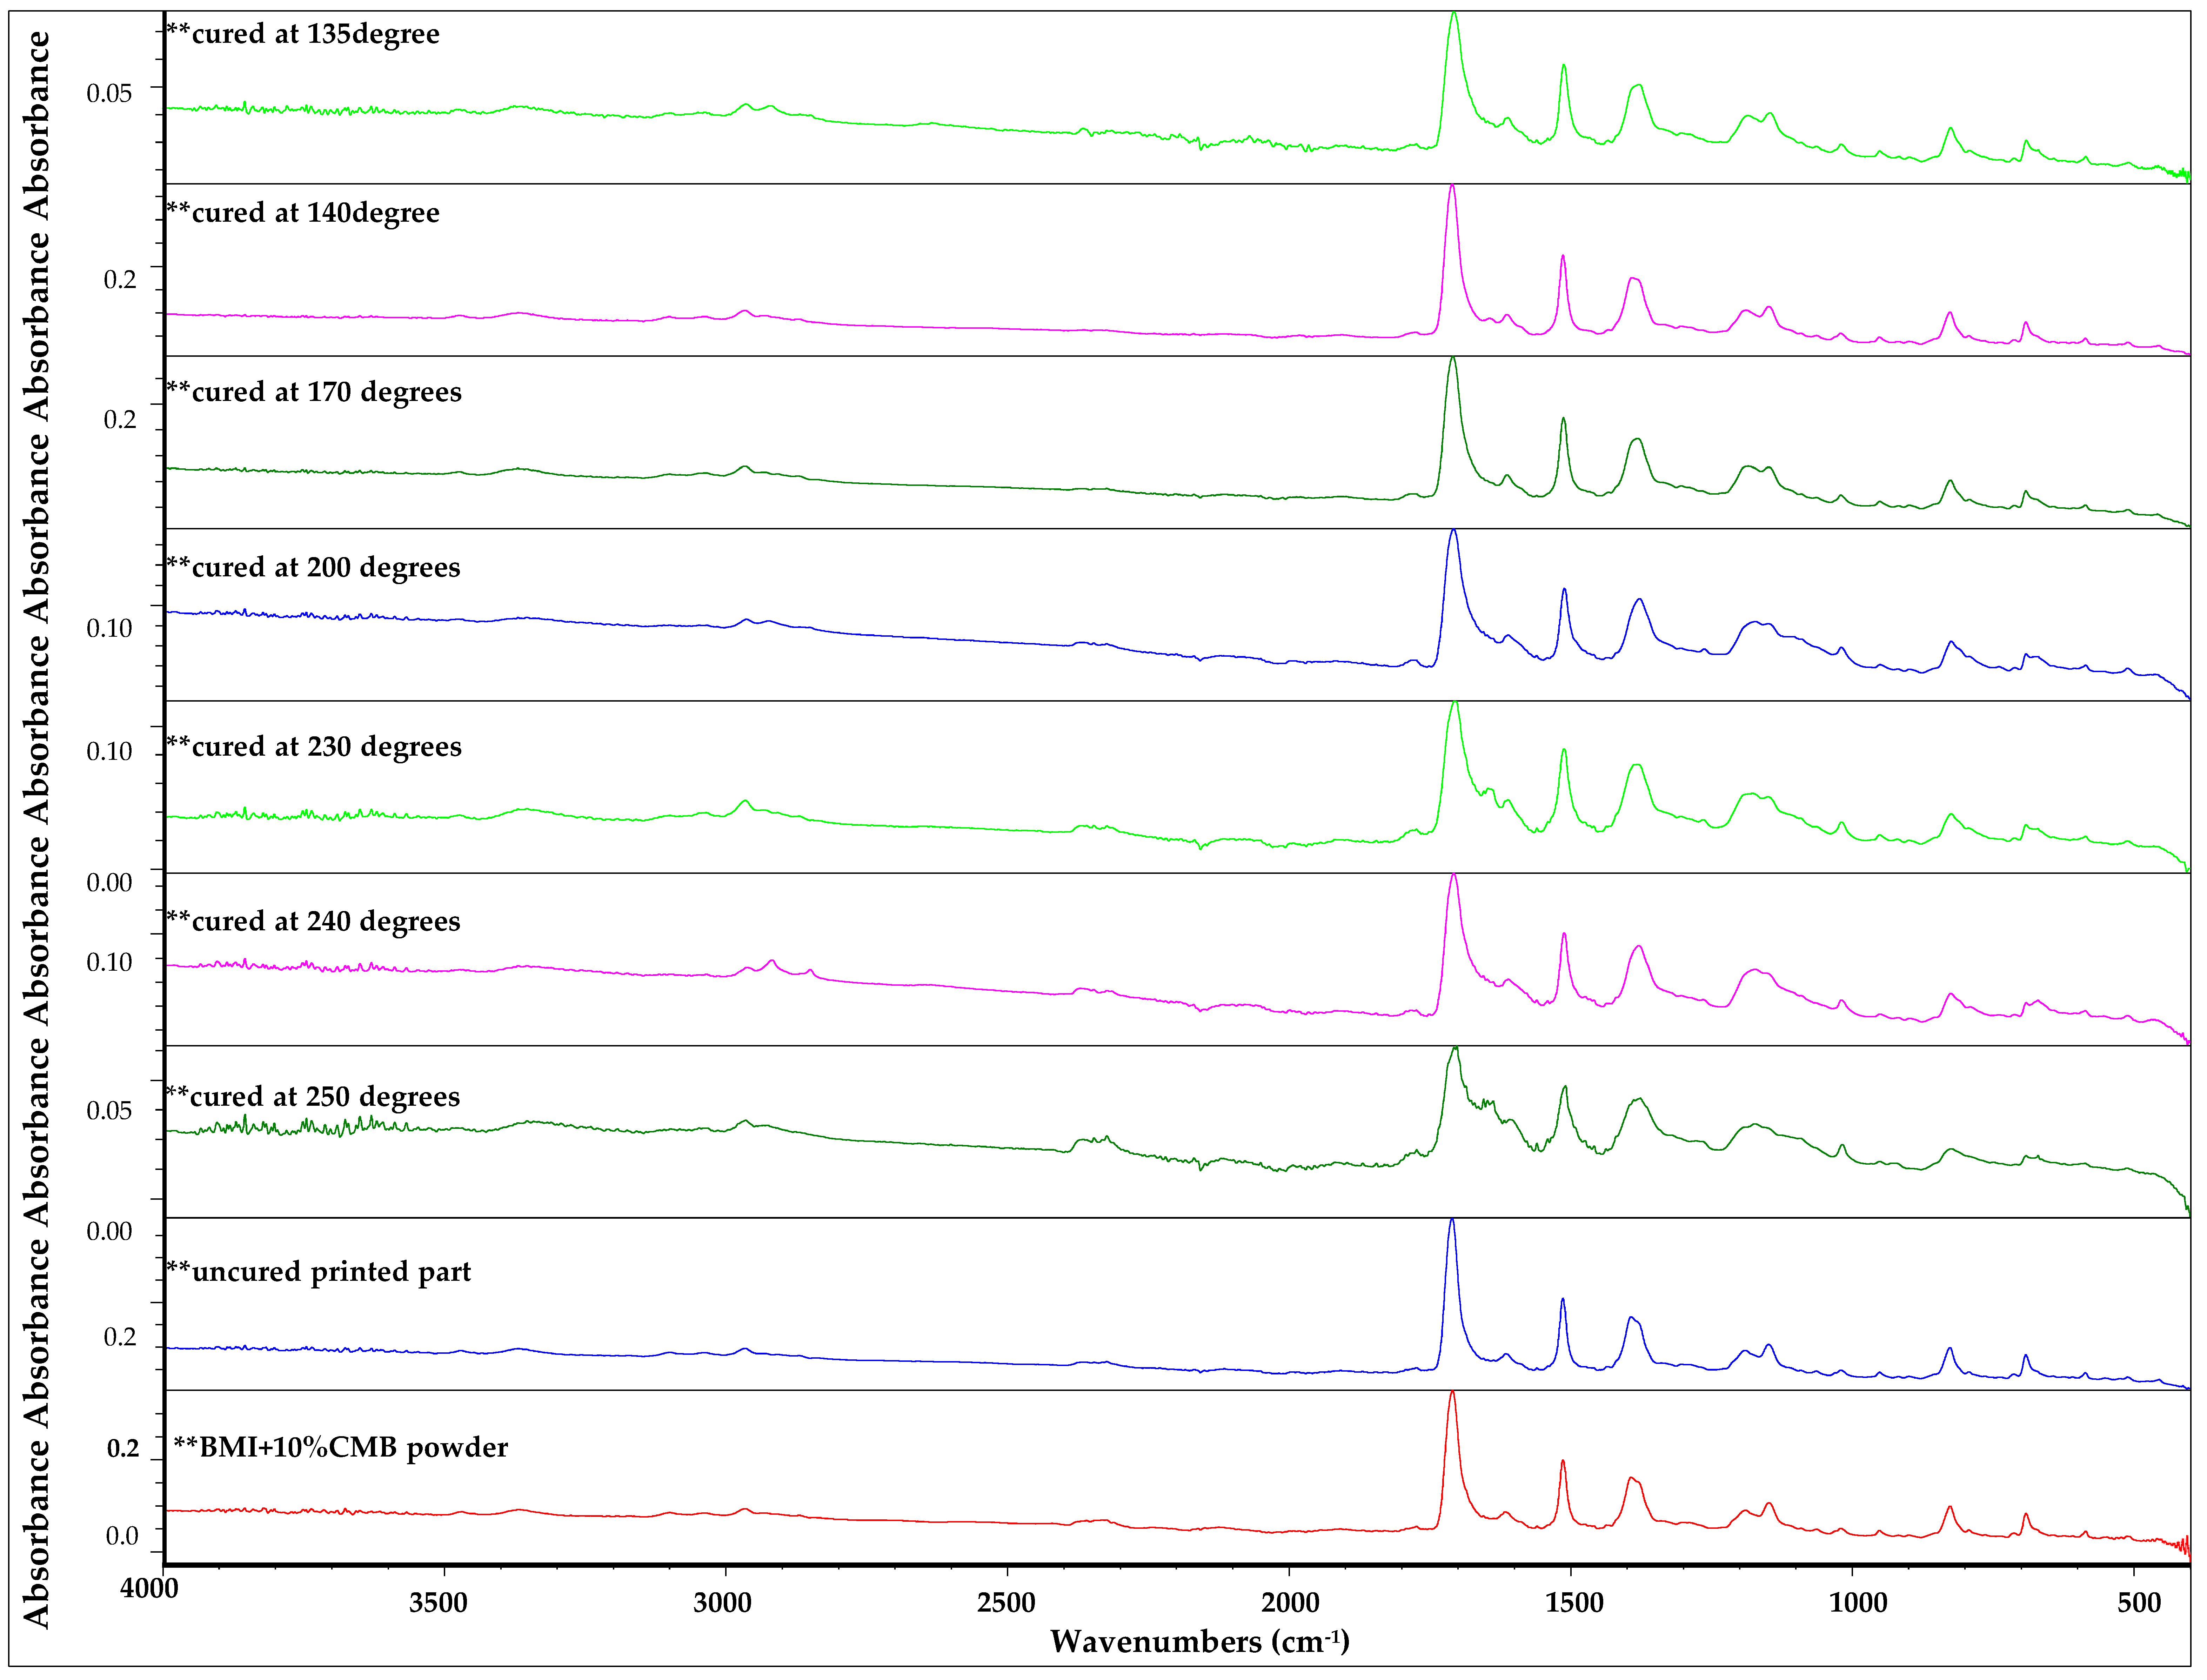
3.6. FTIR Spectroscopy
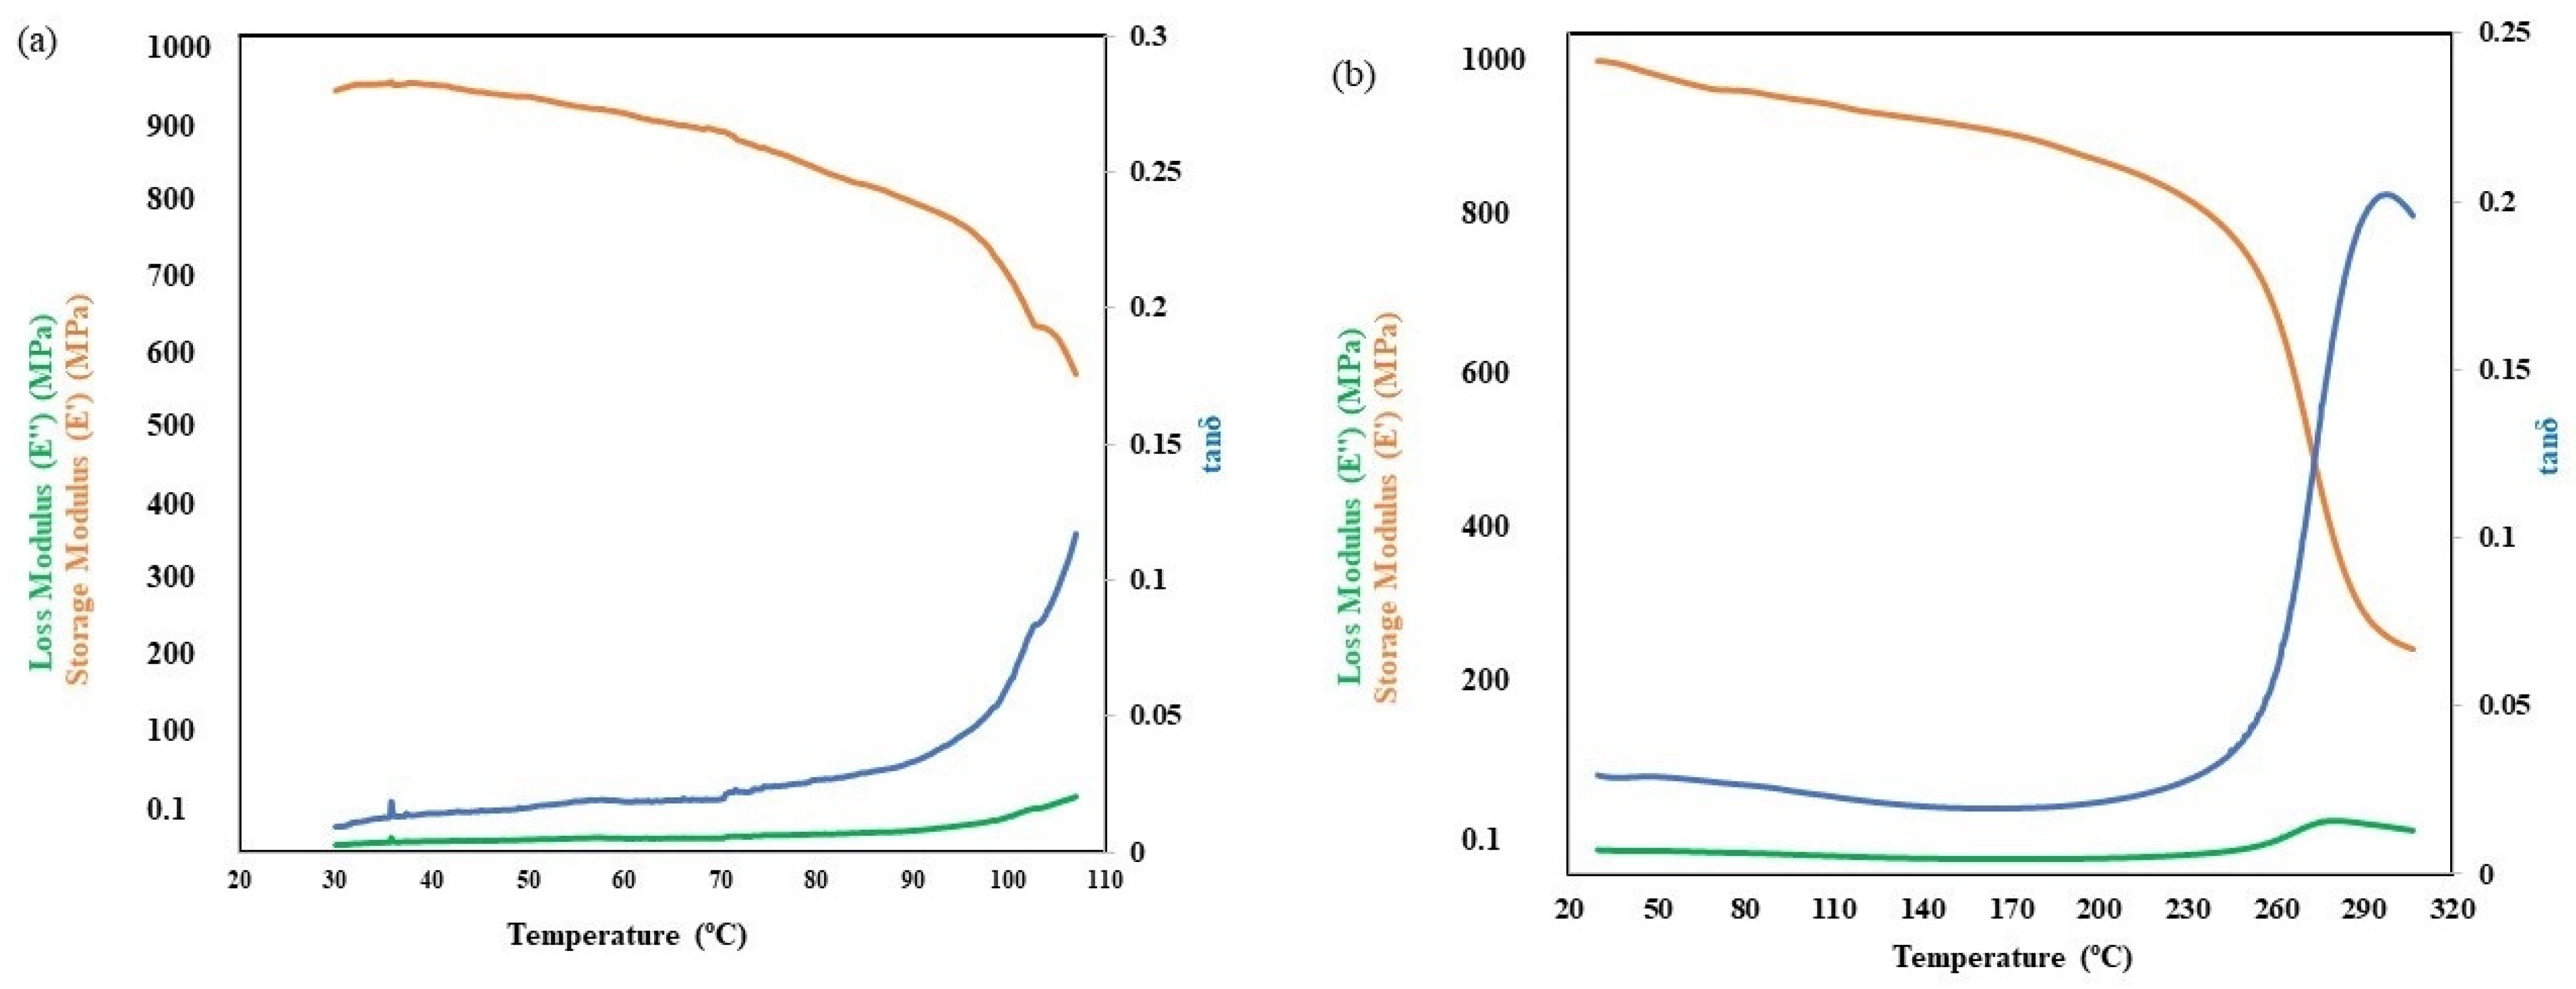
3.7. Dynamic Mechanical Analysis
3.8. Compression Test
4. Conclusions
Supplementary Materials
Author Contributions
Funding
Informed Consent Statement
Conflicts of Interest
References
- Kumar, S. Selective laser sintering: A qualitative and objective approach. JOM 2003, 55, 10. [Google Scholar] [CrossRef]
- Goodridge, R.D.; Tuck, C.J.; Hague, R.J.M. Laser sintering of polyamides and other polymers. Prog. Mater. Sci. 2012, 57, 229–267. [Google Scholar] [CrossRef]
- Laser Sintering of Polyamides and Other Polymers|Elsevier Enhanced Reader. 2021. Available online: https://reader.elsevier.com/reader/sd/pii/S0079642511000648?token=2AF4224CA07860CC2ED9D3559337E73C77BAE4048FFBDE9769C24F3BCA0134B2527F910EACF094284CB1B23C1E27A8DDoriginRegion=us-east-1originCreation=20210710050507 (accessed on 10 July 2021).
- Salmoria, G.V.; Klauss, P.; Paggi, R.A.; Kanis, L.A.; Lago, A. Structure and mechanical properties of cellulose based scaffolds fabricated by selective laser sintering. Polym. Test. 2009, 6, 28. [Google Scholar] [CrossRef]
- Microstructural Origin of Physical and Mechanical Properties of Polyamide 12 Processed by Laser Sintering|Elsevier Enhanced Reader. 2021. Available online: https://reader.elsevier.com/reader/sd/pii/S0014305712001954?token=2B8C2A0A53E837322DC692D7F4A55C9482100ECBE4E1CBE58C2F6E53414A5D557D770A0C6C103C9D9FD712D8BB8C67EBoriginRegion=us-east-1originCreation=20210711180038 (accessed on 11 July 2021).
- Lakshminarayan, U.; Ogrydiziak, S.; Marcus, H.L. Selective Laser Sintering of Ceramic Materials. Mech. Eng. 1990. [Google Scholar] [CrossRef]
- Lakshminarayan, U.; Marcus, H.L. Microstructural and Mechanical Properties of Al2O3/P2O5 AND Al2O3/B2O3 Composties Fabricated by Selective Laser Sintering. Mech. Eng. 1991. [Google Scholar] [CrossRef]
- Ligon, S.C.; Liska, R.; Stampfl, J.; Gurr, M.; Mülhaupt, R. Polymers for 3D Printing and Customized Additive Manufacturing. Chem. Rev. 2017, 117, 10212–10290. [Google Scholar] [CrossRef] [PubMed] [Green Version]
- Mazzoli, A. Selective laser sintering in biomedical engineering. Med. Biol. Eng. Comput. 2012, 51, 245–256. [Google Scholar] [CrossRef] [PubMed]
- Wudy, K.; Drummer, D. Infiltration Behavior of Thermosets for Use in a Combined Selective Laser Sintering Process of Polymers. JOM 2019, 71, 920–927. [Google Scholar] [CrossRef] [Green Version]
- Chuang, K.C.; Gornet, T.J.; Schneidau, K.; Koerner, H. Laser Sintering of Thermoset Polyimide Composites. In Proceedings of the CAMX—The Composites and Advanced Materials Expo, Anaheim, CA, USA, 23–26 September 2019; p. 10. [Google Scholar]
- Chuang, K.C.; Gornet, T.; Koerner, H. Challenges in Laser Sintering of Melt-Processable Thermoset Imide Resin. In Proceedings of the CAMX—The Composites and Advanced Materials Expo, Anaheim, CA, USA, 23–26 September 2019; p. 12. [Google Scholar]
- Campbell, C.G.; Astorga, D.J.; Martinez, E.; Celina, M. Selective laser sintering (SLS)-printable thermosetting resins via controlled conversion. MRS Commun. 2021, 11, 173–178. [Google Scholar] [CrossRef]
- Additive Manufacturing: Polymers Applicable for Laser Sintering (LS)—ScienceDirect. Available online: https://www.sciencedirect.com/science/article/pii/S1877705816312073 (accessed on 4 August 2021).
- Lee, D.-H.; Joo, J.-Y.; Lee, S.-K. Modeling of reflection-type laser-driven white lighting considering phosphor particles and surface topography. Opt. Express 2015, 23, 18872–18887. [Google Scholar] [CrossRef] [PubMed]
- SINTERIT-STUDIO_User-Manual_04_2021_EN.pdf. Available online: https://www.sinterit.com/wp-content/uploads/2020/12/SINTERIT-STUDIO_User-Manual_04_2021_EN.pdf (accessed on 2 August 2021).
- 3D Printing Challenge|3D CAD Model Library|GrabCAD. Available online: https://grabcad.com/library/3d-printing-challenge-1 (accessed on 22 September 2021).
- E37 Committee. Test Method for Compositional Analysis by Thermogravimetry. ASTM Int. 2021. [Google Scholar] [CrossRef]
- Pascault, J.-P.; Sautereau, H.; Verdu, J.; Williams, R.J.J. Thermosetting Polymers; CRC Press: Boca Raton, FL, USA, 2002. [Google Scholar]
- D20 Committee. Practice for Plastics: Dynamic Mechanical Properties: Determination and Report of Procedures. ASTM Int. 2021. [Google Scholar] [CrossRef]
- D30 Committee. Test Method for Flatwise Compressive Properties of Sandwich Cores. ASTM Int. 2021. [Google Scholar] [CrossRef]
- Specific Properties and Fracture Toughness of Syntactic Foam: Effect of Foam Microstructures—ScienceDirect. Available online: https://www.sciencedirect.com/science/article/pii/S0266353805000837 (accessed on 23 September 2021).
- Yan, C.; Hao, L.; Xu, L.; Shi, Y. Preparation, characterisation and processing of carbon fibre/polyamide-12 composites for selective laser sintering. Compos. Sci. Technol. 2011. [Google Scholar] [CrossRef]
- di Giulio, C.; Gautier, M.; Jasse, B. Fourier transform infrared spectroscopic characterization of aromatic bismaleimide resin cure states. J. Appl. Polym. Sci. 1984, 29, 5. [Google Scholar] [CrossRef]
- Mijović, J.; Andjelić, S. Study of the Mechanism and Rate of Bismaleimide Cure by Remote in-Situ Real Time Fiber Optic Near-Infrared Spectroscopy. Macromolecules 1996, 29, 1. [Google Scholar] [CrossRef]
- Zainol, I.; Day, R.; Heatley, F. Comparison between the thermal and microwave curing of bismaleimide resin. J. Appl. Polym. Sci. 2003, 90, 10. [Google Scholar] [CrossRef]
- Thermoset Characterization Part 16: Applications of Dynamic Mechanical Analysis (DMA). Polymer Innovation Blog. 2014. Available online: https://polymerinnovationblog.com/thermoset-characterization-part-16-applications-dynamic-mechanical-analysis-dma/ (accessed on 5 August 2021).
- Gupta, N.; Kishore; Woldesenbet, E.; Sankaran, S. Studies on compressive failure features in syntactic foam material. J. Mater. Sci. 2001, 36, 4485–4491. [Google Scholar] [CrossRef]


| Process Parameter | Value |
|---|---|
| Laser Power | 5 W |
| Layer height (LH) | 0.150 mm |
| Hatch spacing (HS) | 0.36 mm |
| Full layer feed ratio (FLFR) | 2.0 |
| Energy scale (ES) | 1.0 |
| Max energy per (MEP) cm3, infill | 700 |
| Constant energy (CE), infill | 0.8 |
| Max power depth (MPD), infill | 2.5 |
| Max energy per (MEP) cm3, perimeters | 700 |
| Constant energy (CE), perimeters | 0.8 |
| Max power depth (MPD), perimeters | 2.5 |
| ES | MEP | CE | LH (mm) | HS (mm) | Specimen Appearance | Figure |
|---|---|---|---|---|---|---|
| 10 | 400 | 0.5 | 0.125 | 0.36 | No shifting but curling occurred, strong but oversized printed part. |  |
| 3 | 200 | 0.5 | 0.125 | 0.36 | Fragile, no shifting or curling occurred, dimensional increment. | 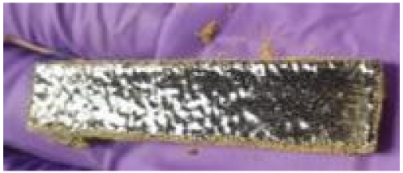 |
| 3 | 200 | 0.5 | 0.175 | 0.1 | Lower part was severely damaged, deformation occurred, dimensional increment due to high ES values. (Built in on-edge direction) |  |
| 3 | 200 | 0.5 | 0.125 | 0.5 | No layer shifting, slightly increased in thickness due to high ES value. | 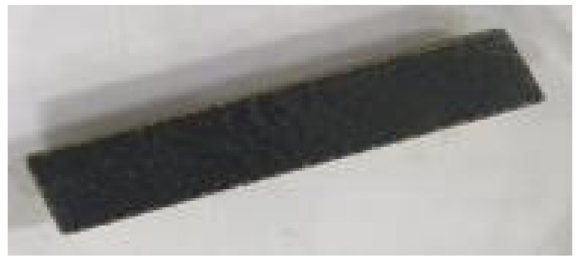 |
| 3 | 200 | 0.5 | 0.125 | 0.36 | No layer shifting, slightly increased in thickness due to high ES value, more stable. | 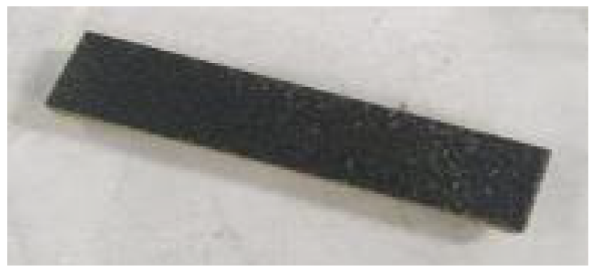 |
| 2 | 200 | 0.5 | 0.175 | 0.2 | Lower portion was damaged, slightly dimensional increment due to higher ES values. (Built in-on edge direction) |  |
| 2 | 400 | 0.2 | 0.150 | 0.36 | No layer shifting, dimensional increment in thickness. |  |
| 1 | 800 | 0.2 | 0.150 | 0.36 | Oversized in thickness. | 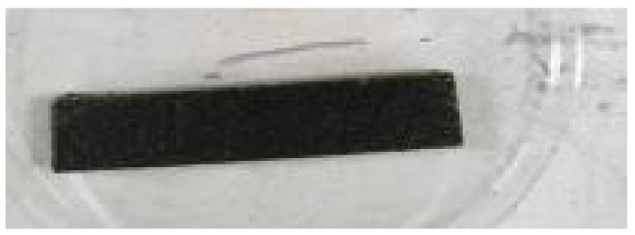 |
| 1 | 700 | 0.8 | 0.150 | 0.36 | Stable with accurate dimensions, best surface finishing. | 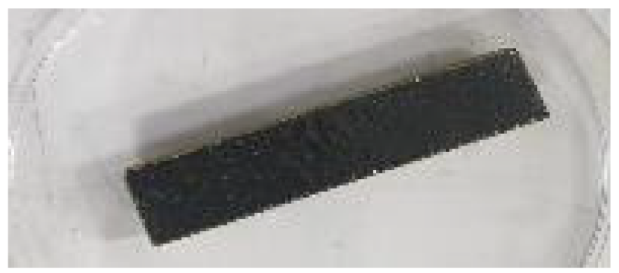 |
Publisher’s Note: MDPI stays neutral with regard to jurisdictional claims in published maps and institutional affiliations. |
© 2022 by the authors. Licensee MDPI, Basel, Switzerland. This article is an open access article distributed under the terms and conditions of the Creative Commons Attribution (CC BY) license (https://creativecommons.org/licenses/by/4.0/).
Share and Cite
Hassan, M.S.; Billah, K.M.M.; Hall, S.E.; Sepulveda, S.; Regis, J.E.; Marquez, C.; Cordova, S.; Whitaker, J.; Robison, T.; Keating, J.; et al. Selective Laser Sintering of High-Temperature Thermoset Polymer. J. Compos. Sci. 2022, 6, 41. https://doi.org/10.3390/jcs6020041
Hassan MS, Billah KMM, Hall SE, Sepulveda S, Regis JE, Marquez C, Cordova S, Whitaker J, Robison T, Keating J, et al. Selective Laser Sintering of High-Temperature Thermoset Polymer. Journal of Composites Science. 2022; 6(2):41. https://doi.org/10.3390/jcs6020041
Chicago/Turabian StyleHassan, Md Sahid, Kazi Md Masum Billah, Samuel Ernesto Hall, Sergio Sepulveda, Jaime Eduardo Regis, Cory Marquez, Sergio Cordova, Jasmine Whitaker, Thomas Robison, James Keating, and et al. 2022. "Selective Laser Sintering of High-Temperature Thermoset Polymer" Journal of Composites Science 6, no. 2: 41. https://doi.org/10.3390/jcs6020041
APA StyleHassan, M. S., Billah, K. M. M., Hall, S. E., Sepulveda, S., Regis, J. E., Marquez, C., Cordova, S., Whitaker, J., Robison, T., Keating, J., Shafirovich, E., & Lin, Y. (2022). Selective Laser Sintering of High-Temperature Thermoset Polymer. Journal of Composites Science, 6(2), 41. https://doi.org/10.3390/jcs6020041