1. Introduction
The deposition of dry fiber materials in the Dry Fiber Placement process (DFP) is becoming increasingly interesting for the aerospace industry [
1,
2,
3]. Examples of this are the wings of the Irkut MS 21 and the Airbus A220 [
4]. In the case of the A220, unlike the MS 21, multiaxial fabrics are used to manufacture the wings [
5,
6]. In the case of the MS 21, however, Dry Fiber Placement (DFP) materials are used [
6,
7]. In the DFP process, several narrow tows are placed parallel to each other on a mold. If wider tows are used, there is a risk that wrinkles would quickly form when deposited in a curved mold. In addition, waste is minimized. A good overview of the DFP process is given in [
8,
9].
Following the deposition of the dry fiber material, it must be impregnated with resin. In real components, such as wing covers, the laminate thicknesses are rarely homogeneous. Depending on the load on the component, there are areas that are subjected to higher stresses than other areas and therefore entail a change in the layer structure. This affects the infusion strategy, as thicker laminate areas take longer to impregnate [
10]. The behavior is obvious and is taken into account in the simulation of gating strategies. It is known that variations in the areal weight of fabrics and non-crimp fabrics affect permeability [
11]. For fiber composite components produced by the DFP process, there is no research on the variation of permeability within a preform. Therefore, the research questions (RQ1 and RQ2) are:
- RQ1
How homogeneous is the deposit actually in terms of infusion properties?
- RQ2
How do deposition parameters affect infusion characteristics?
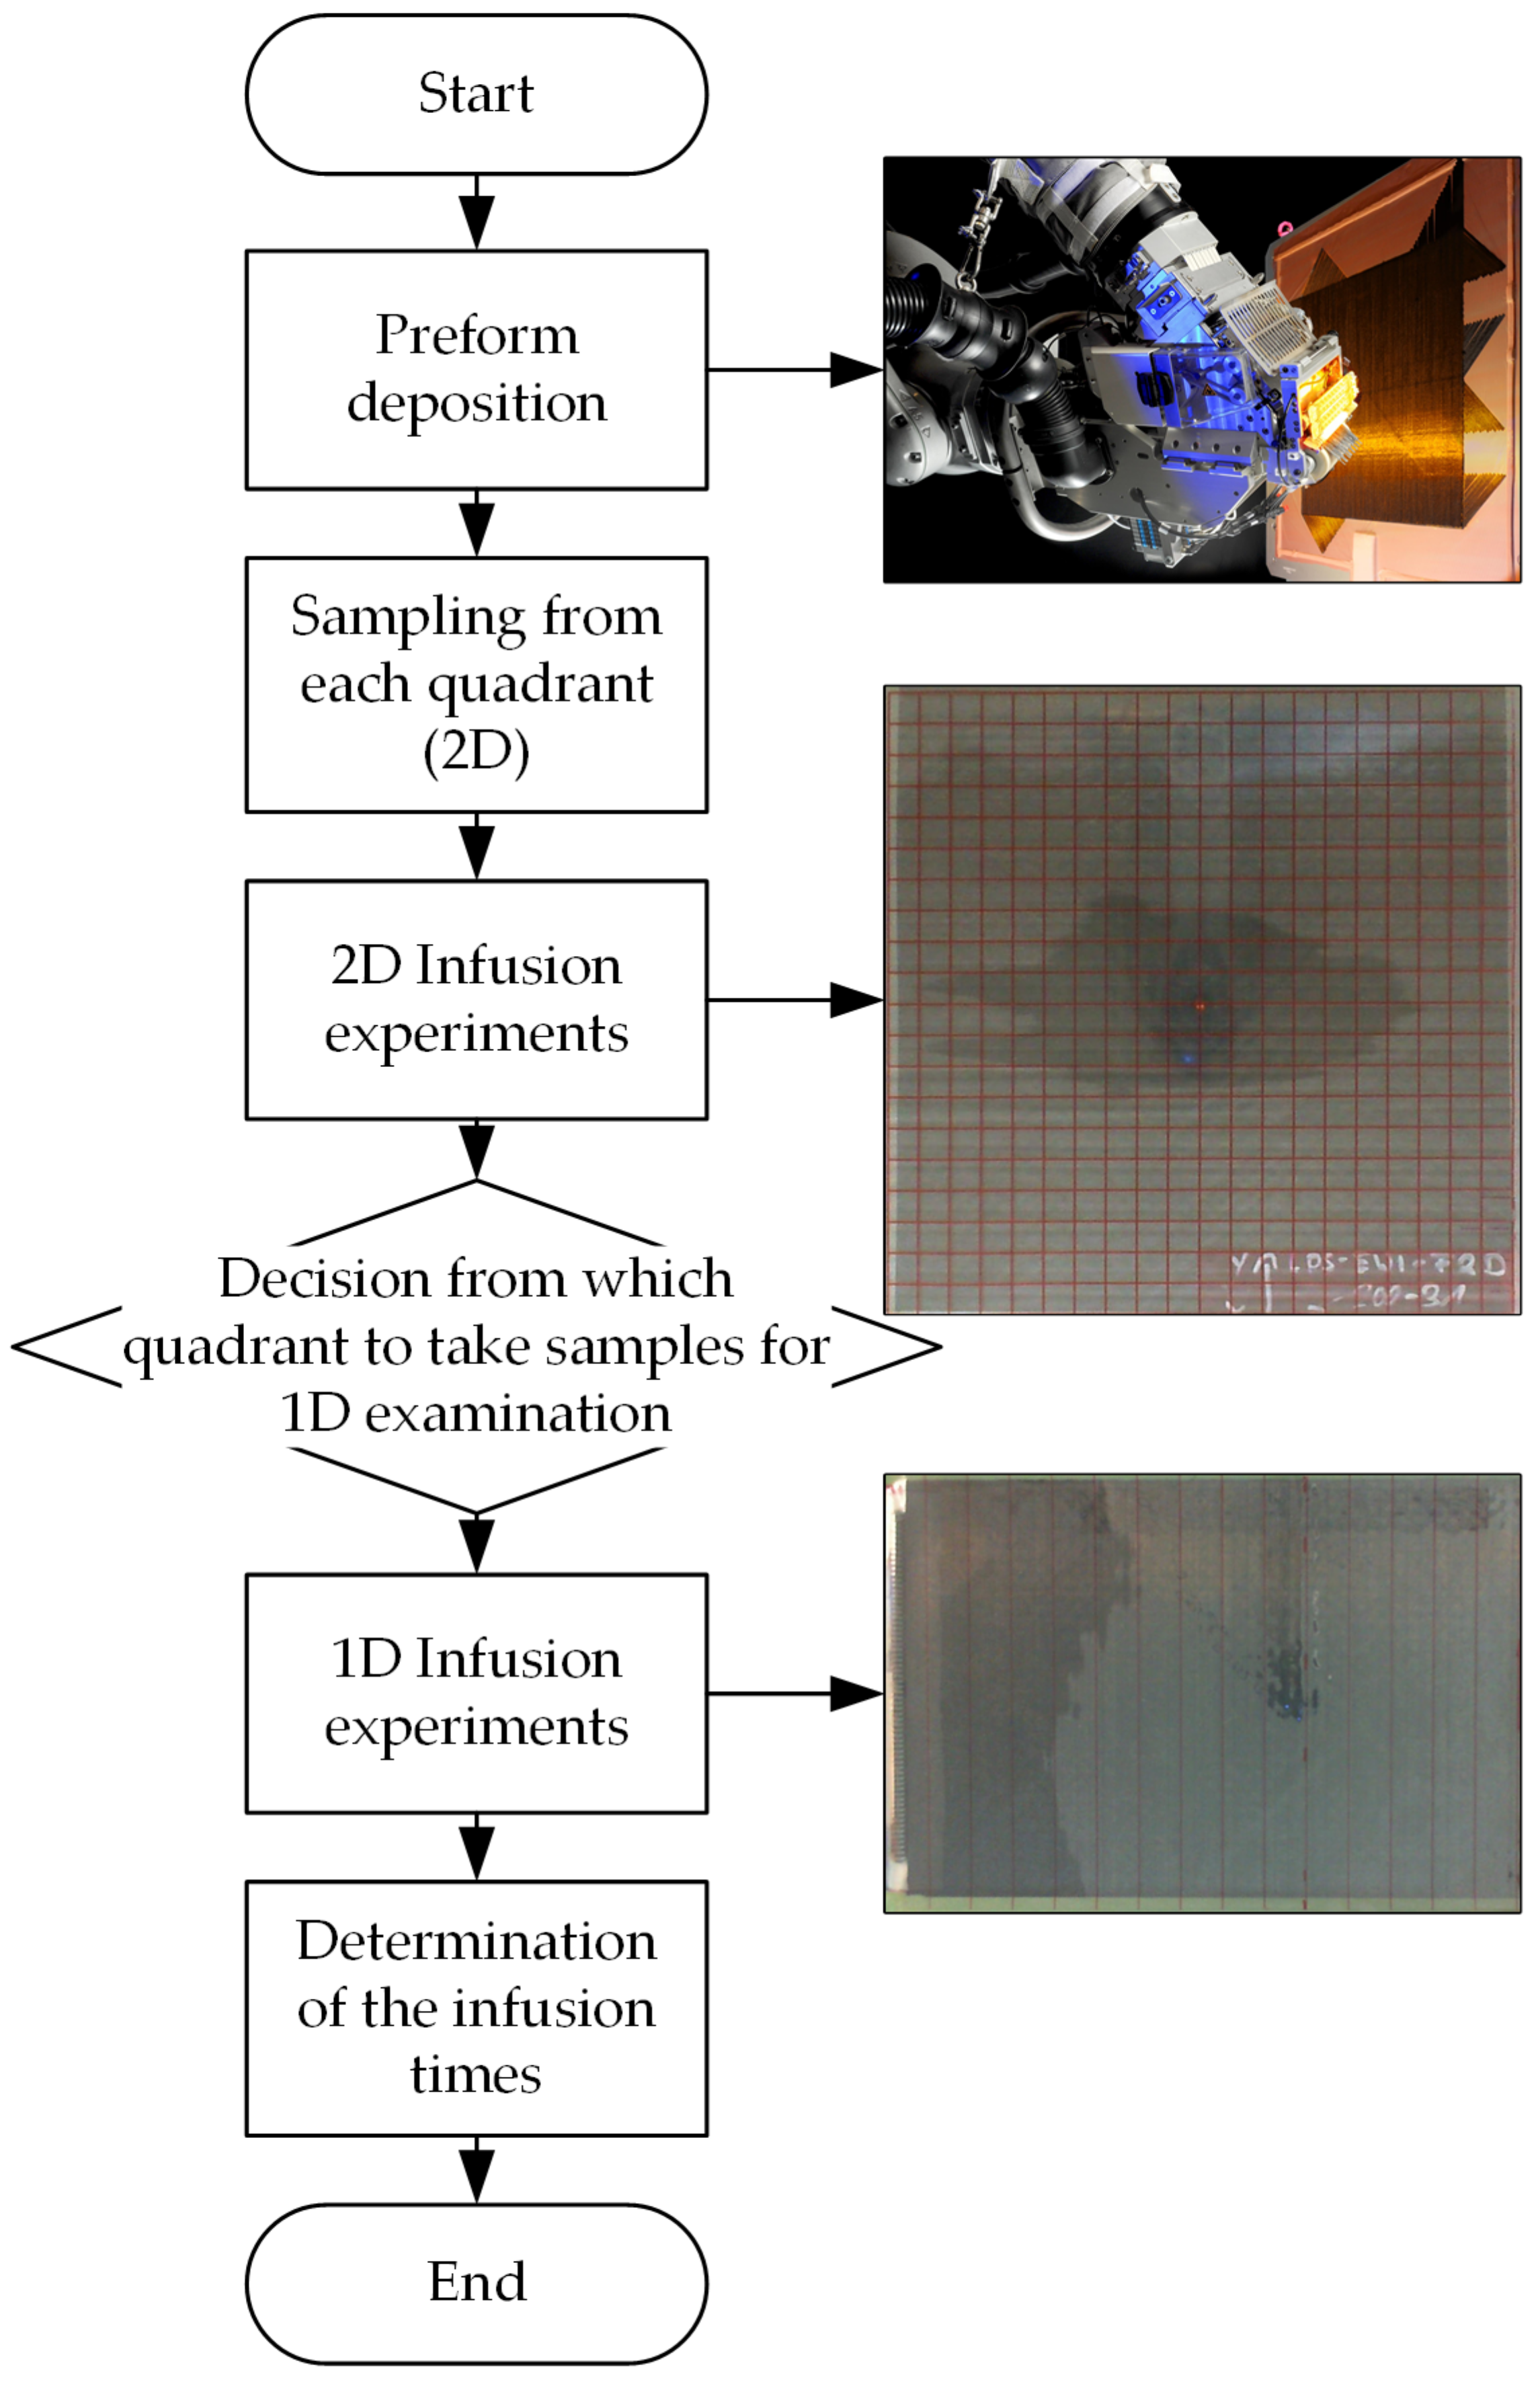
In the evaluation of various tests on the deposition of dry fiber materials, an influence on the infiltrability was observed. A square preform plate has been divided into four quadrants for this purpose. A square sample was taken from each quadrant and the propagation of the flow front was analyzed for each sample using the vacuum infusion method. As a result, significant differences in flow front propagation have been identified. The behavior occurs regardless of the deposition temperature and pressure.
As already mentioned, the vacuum infusion method has been used for the comparison. With this method, qualitative comparison results between the individual quadrants of a preform plate can be obtained quickly. However, it is difficult to determine permeability with vacuum infusion because permeability depends on the fiber volume content and this varies during the infusion process [
12,
13,
14]. Therefore, the area impregnated per quadrant on the one hand and the infusion times on the other hand are used as comparative variables. The impregnated area is investigated with two-dimensional (2D) flow tests in the plane and the infusion times are determined in one-dimensional (1D) flow tests.
Figure 1 shows the methodological approach graphically.
Furthermore, the permeabilities are not measured because a process similar to resin transfer molding (RTM) is required for this and the infusion properties caused by the different deposition parameters are probably lost in this process. The RTM process should not be confused with the vacuum assisted resin transfer molding (VARTM) process, as described in Khalid et al. [
15,
16,
17], for example. According to [
18], the difference between RTM and infusion lies in the mold design. In the RTM process, rigid mold halves are required to withstand the injection pressure above ambient pressure. In the infusion process, a rigid mold half is replaced by a flexible film or membrane. This limits the maximum infusion pressure to the ambient pressure. In summary, the RTM or permeability determination process is very different from the subsequent infusion process, which actually follows the DFP deposition of large preforms. As described in [
19,
20,
21], the comparison and determination of permeabilities is strongly dependent on the permeameter and the procedure.
There are studies looking at improving the infusion properties of DFP preforms with good results [
10,
22,
23]. However, the focus is on improving the infusion properties while having little effect on the mechanical properties. Investigating the homogeneity of an entire plate, which is the objective of this work, is not the aim of the studies.
2. Materials and Methods
2.1. Experimental Setup for Preform Deposition and Test Rack for Flow Tests
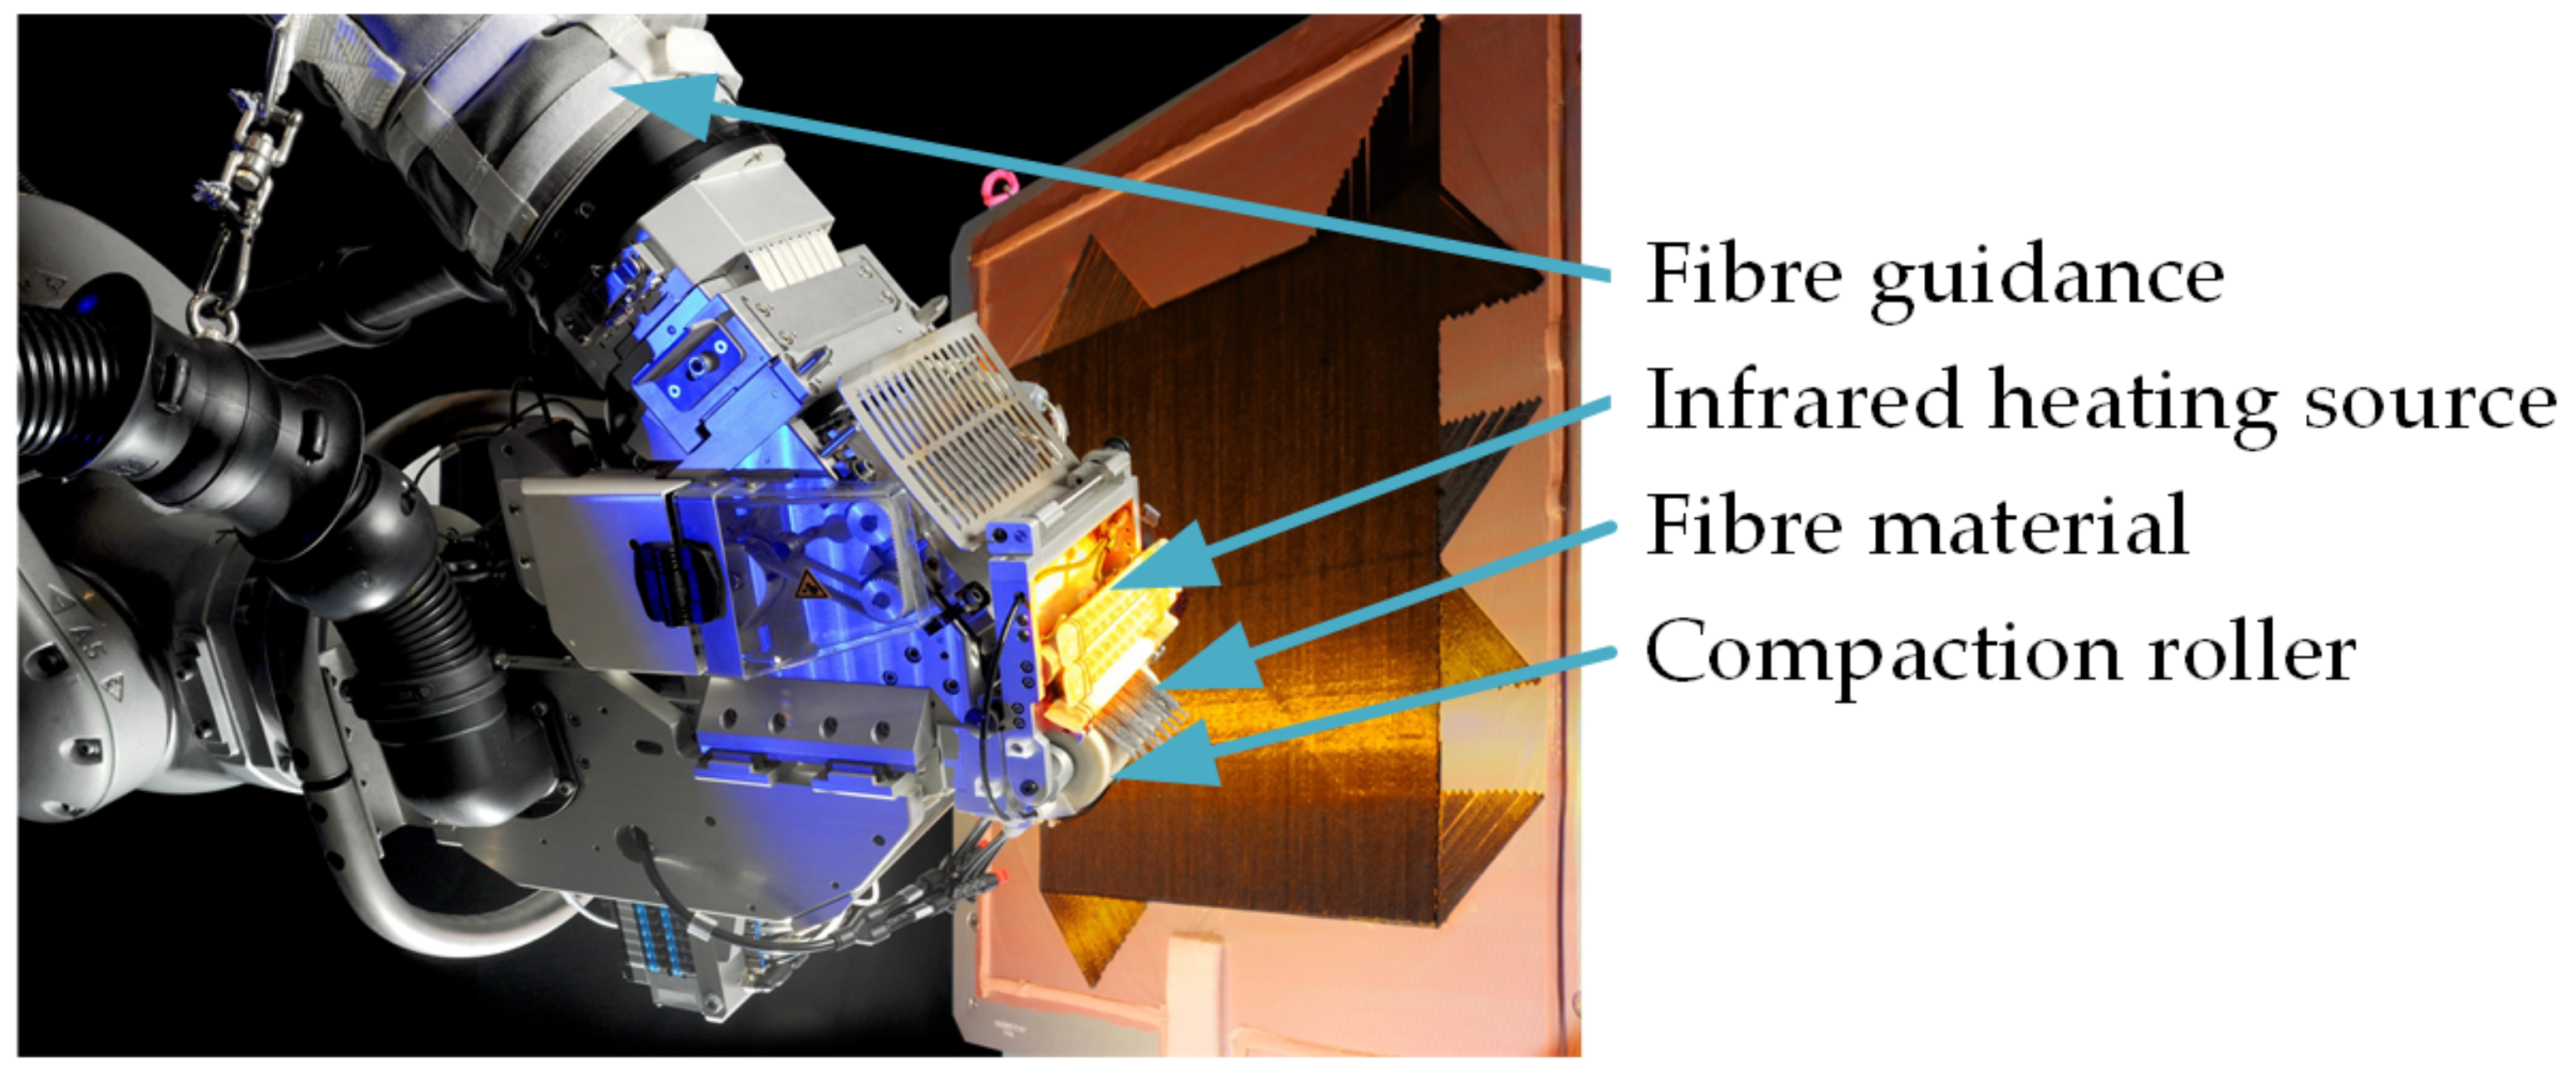
The fiber materials are deposited using a Coriolis DFP system. In contrast to other systems, the placement head is not mounted on a portal system, but on a Kuka KR500 robotic arm. As illustrated in
Figure 2, the deposit is not made on a horizontally positioned mold. The mold is arranged vertically to increase accessibility.
The use of a heat source is particularly important for the processing of dry fiber materials, since the laying speed is influenced by good heating of the binder. The Coriolis system used has an infrared heating source. To adjust the temperature, the surface temperature at the deposition point is determined by an infrared camera and the power of the infrared heating source is adjusted accordingly.
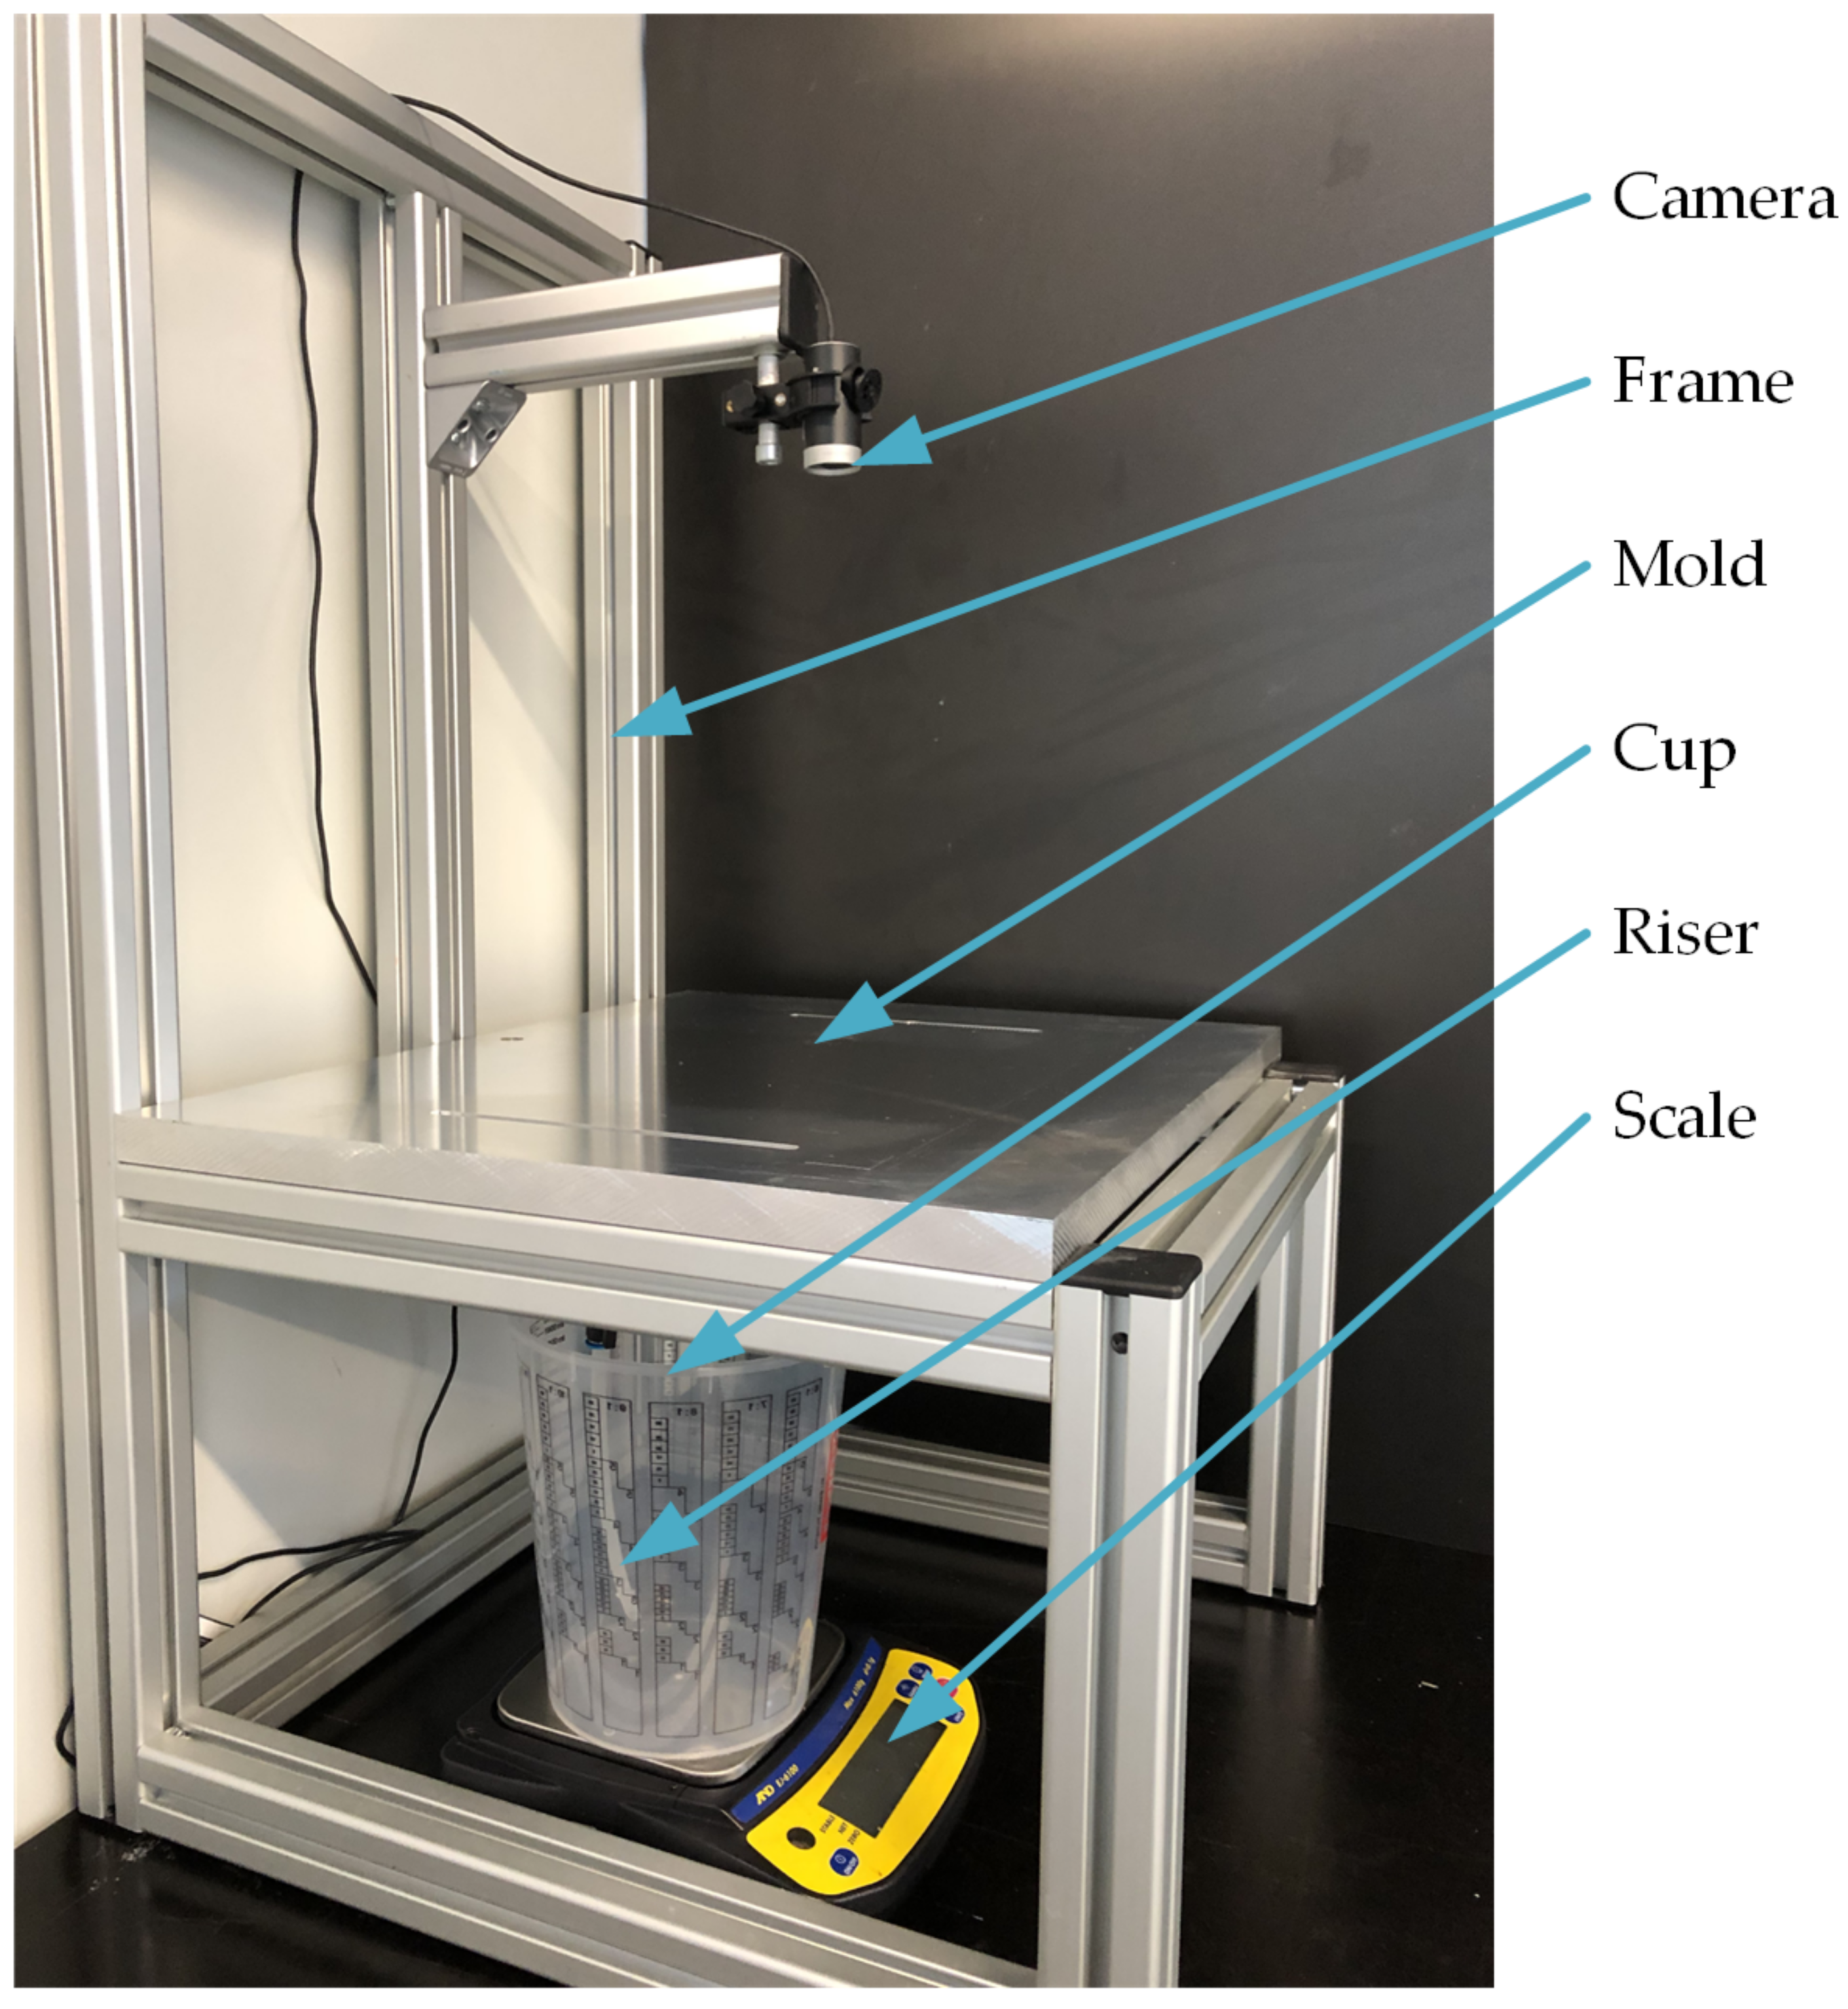
For the comparison of the infusion times, a test rack is used, with which different infusion configurations can be observed. As shown in
Figure 3, the test rack consists of a frame, a camera (Microsoft Webcam) and a scale (A&D EJ6100). The various molds for the infusion experiments can be positioned on the frame. For recording the flow front progress, the camera is mounted at a height of 300 mm above the mold. In order to determine the mass flow, a scale with the measuring cup is placed below the mold.
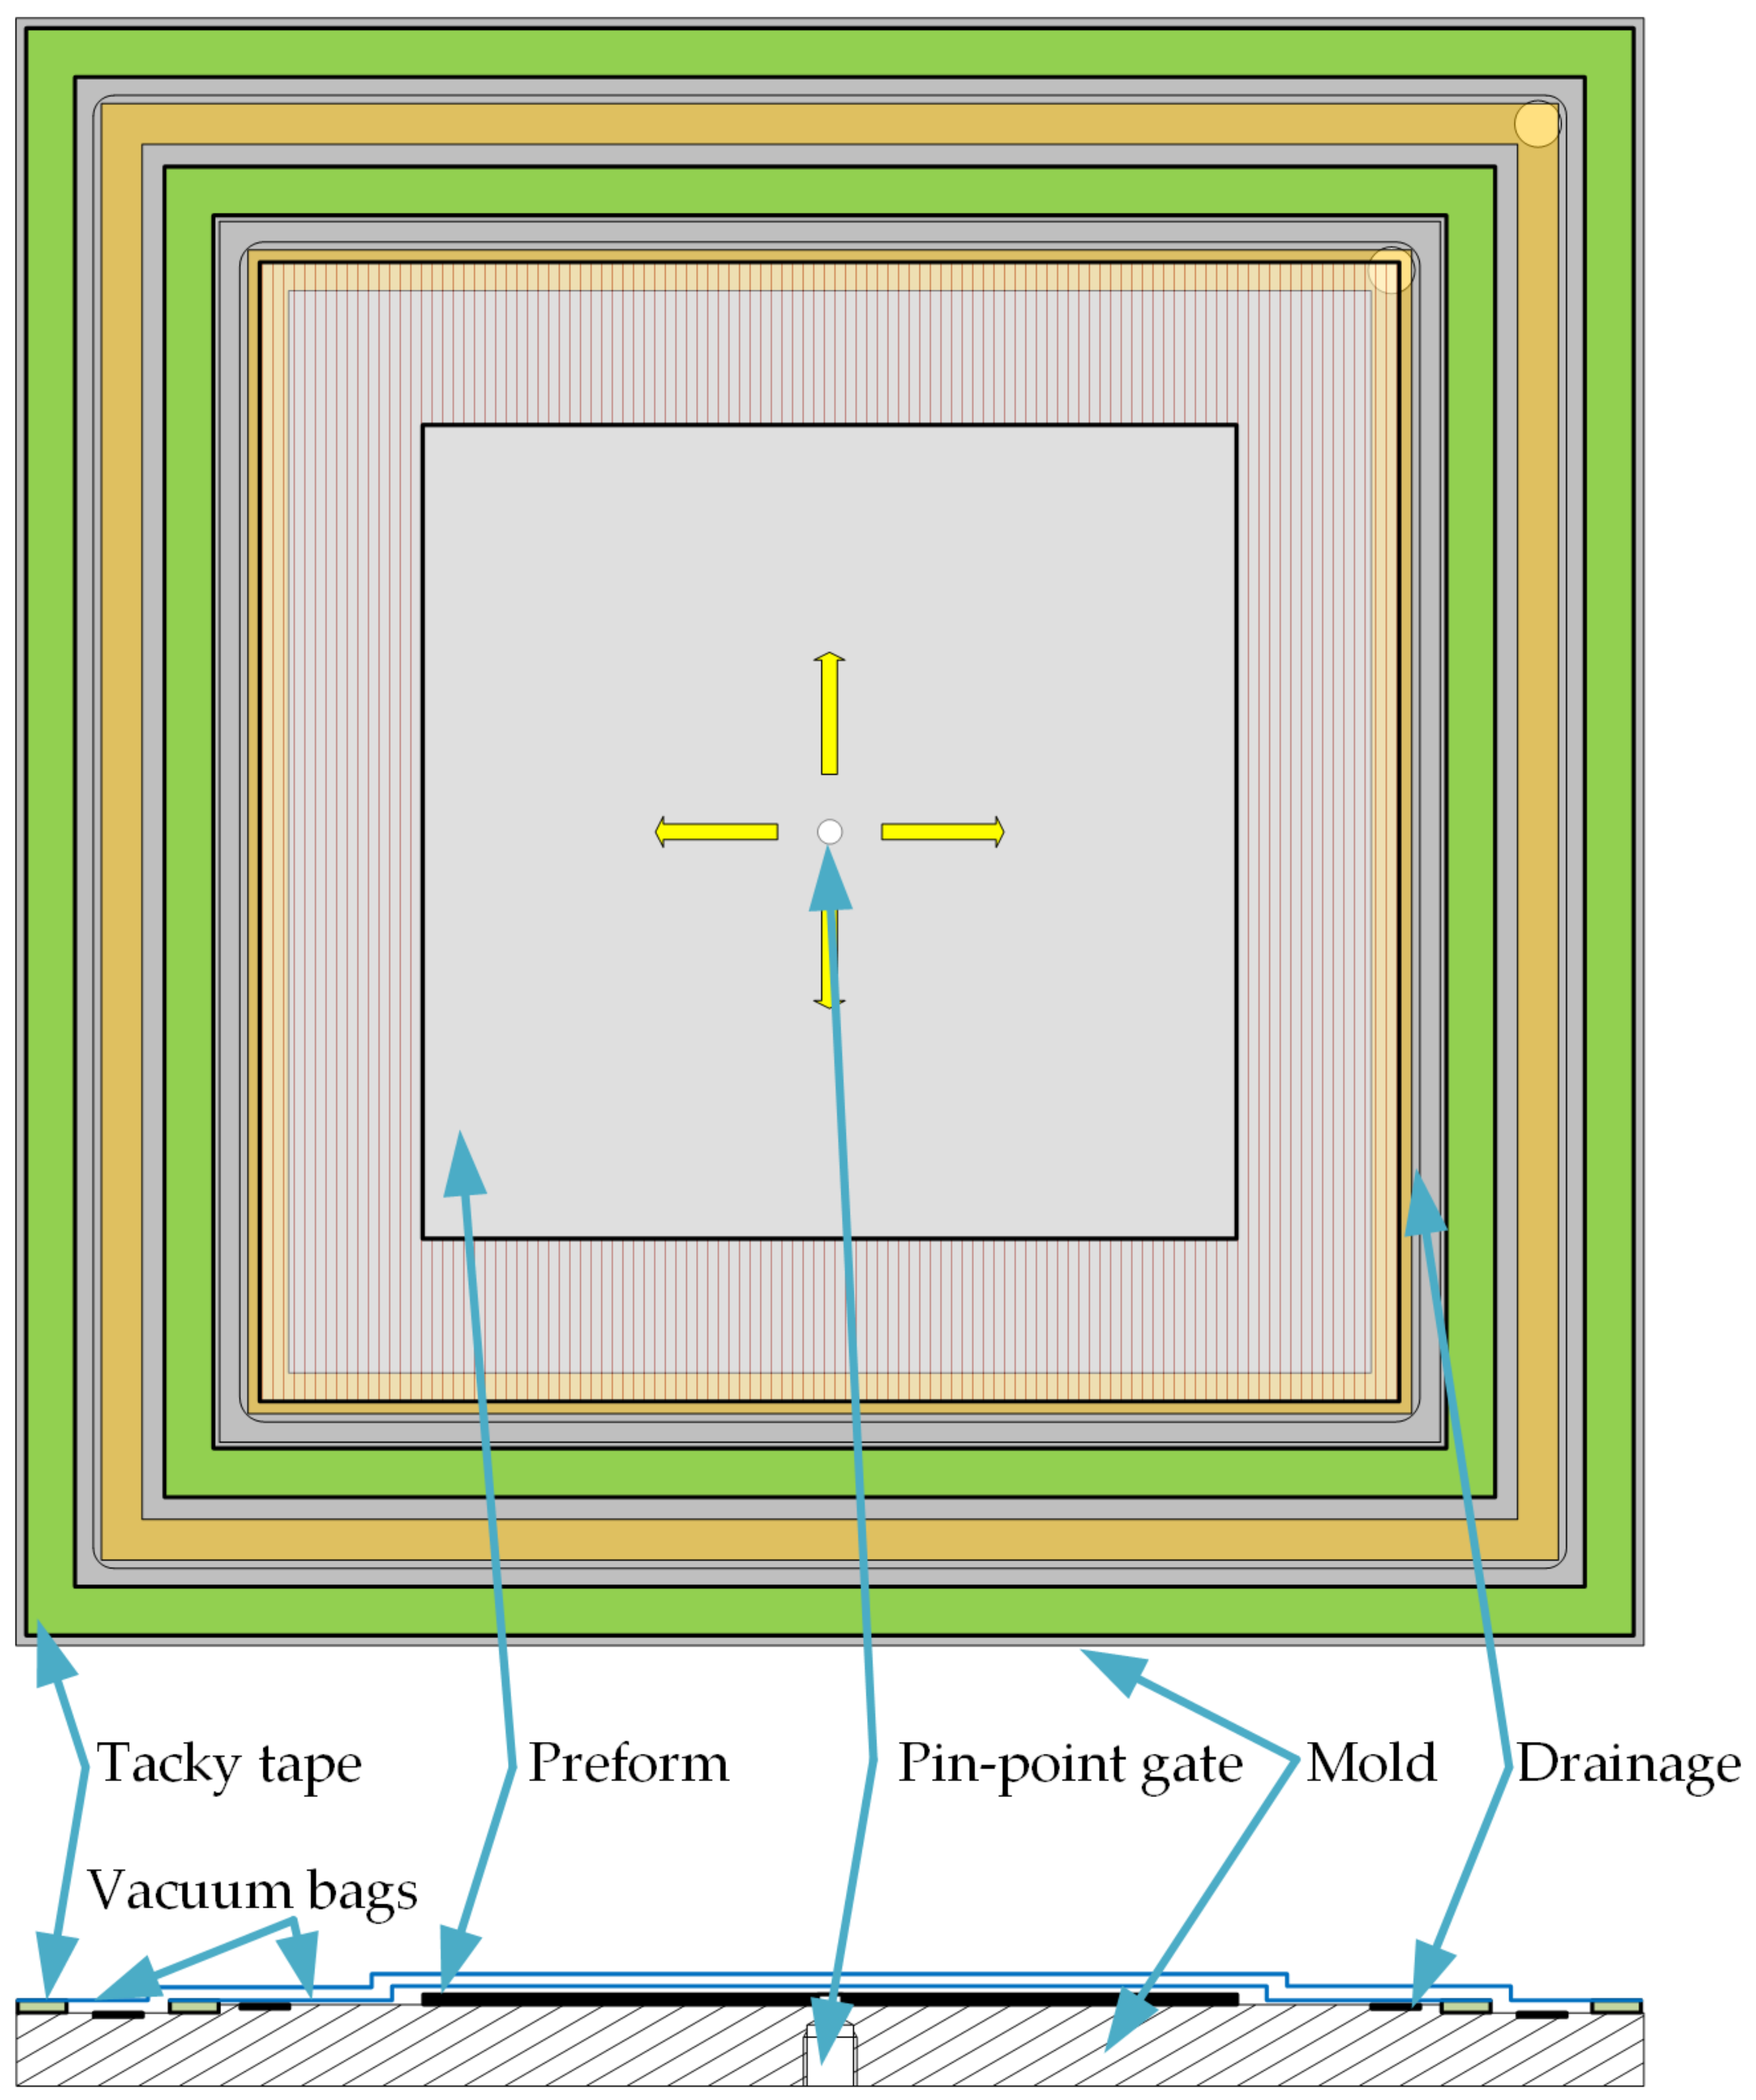
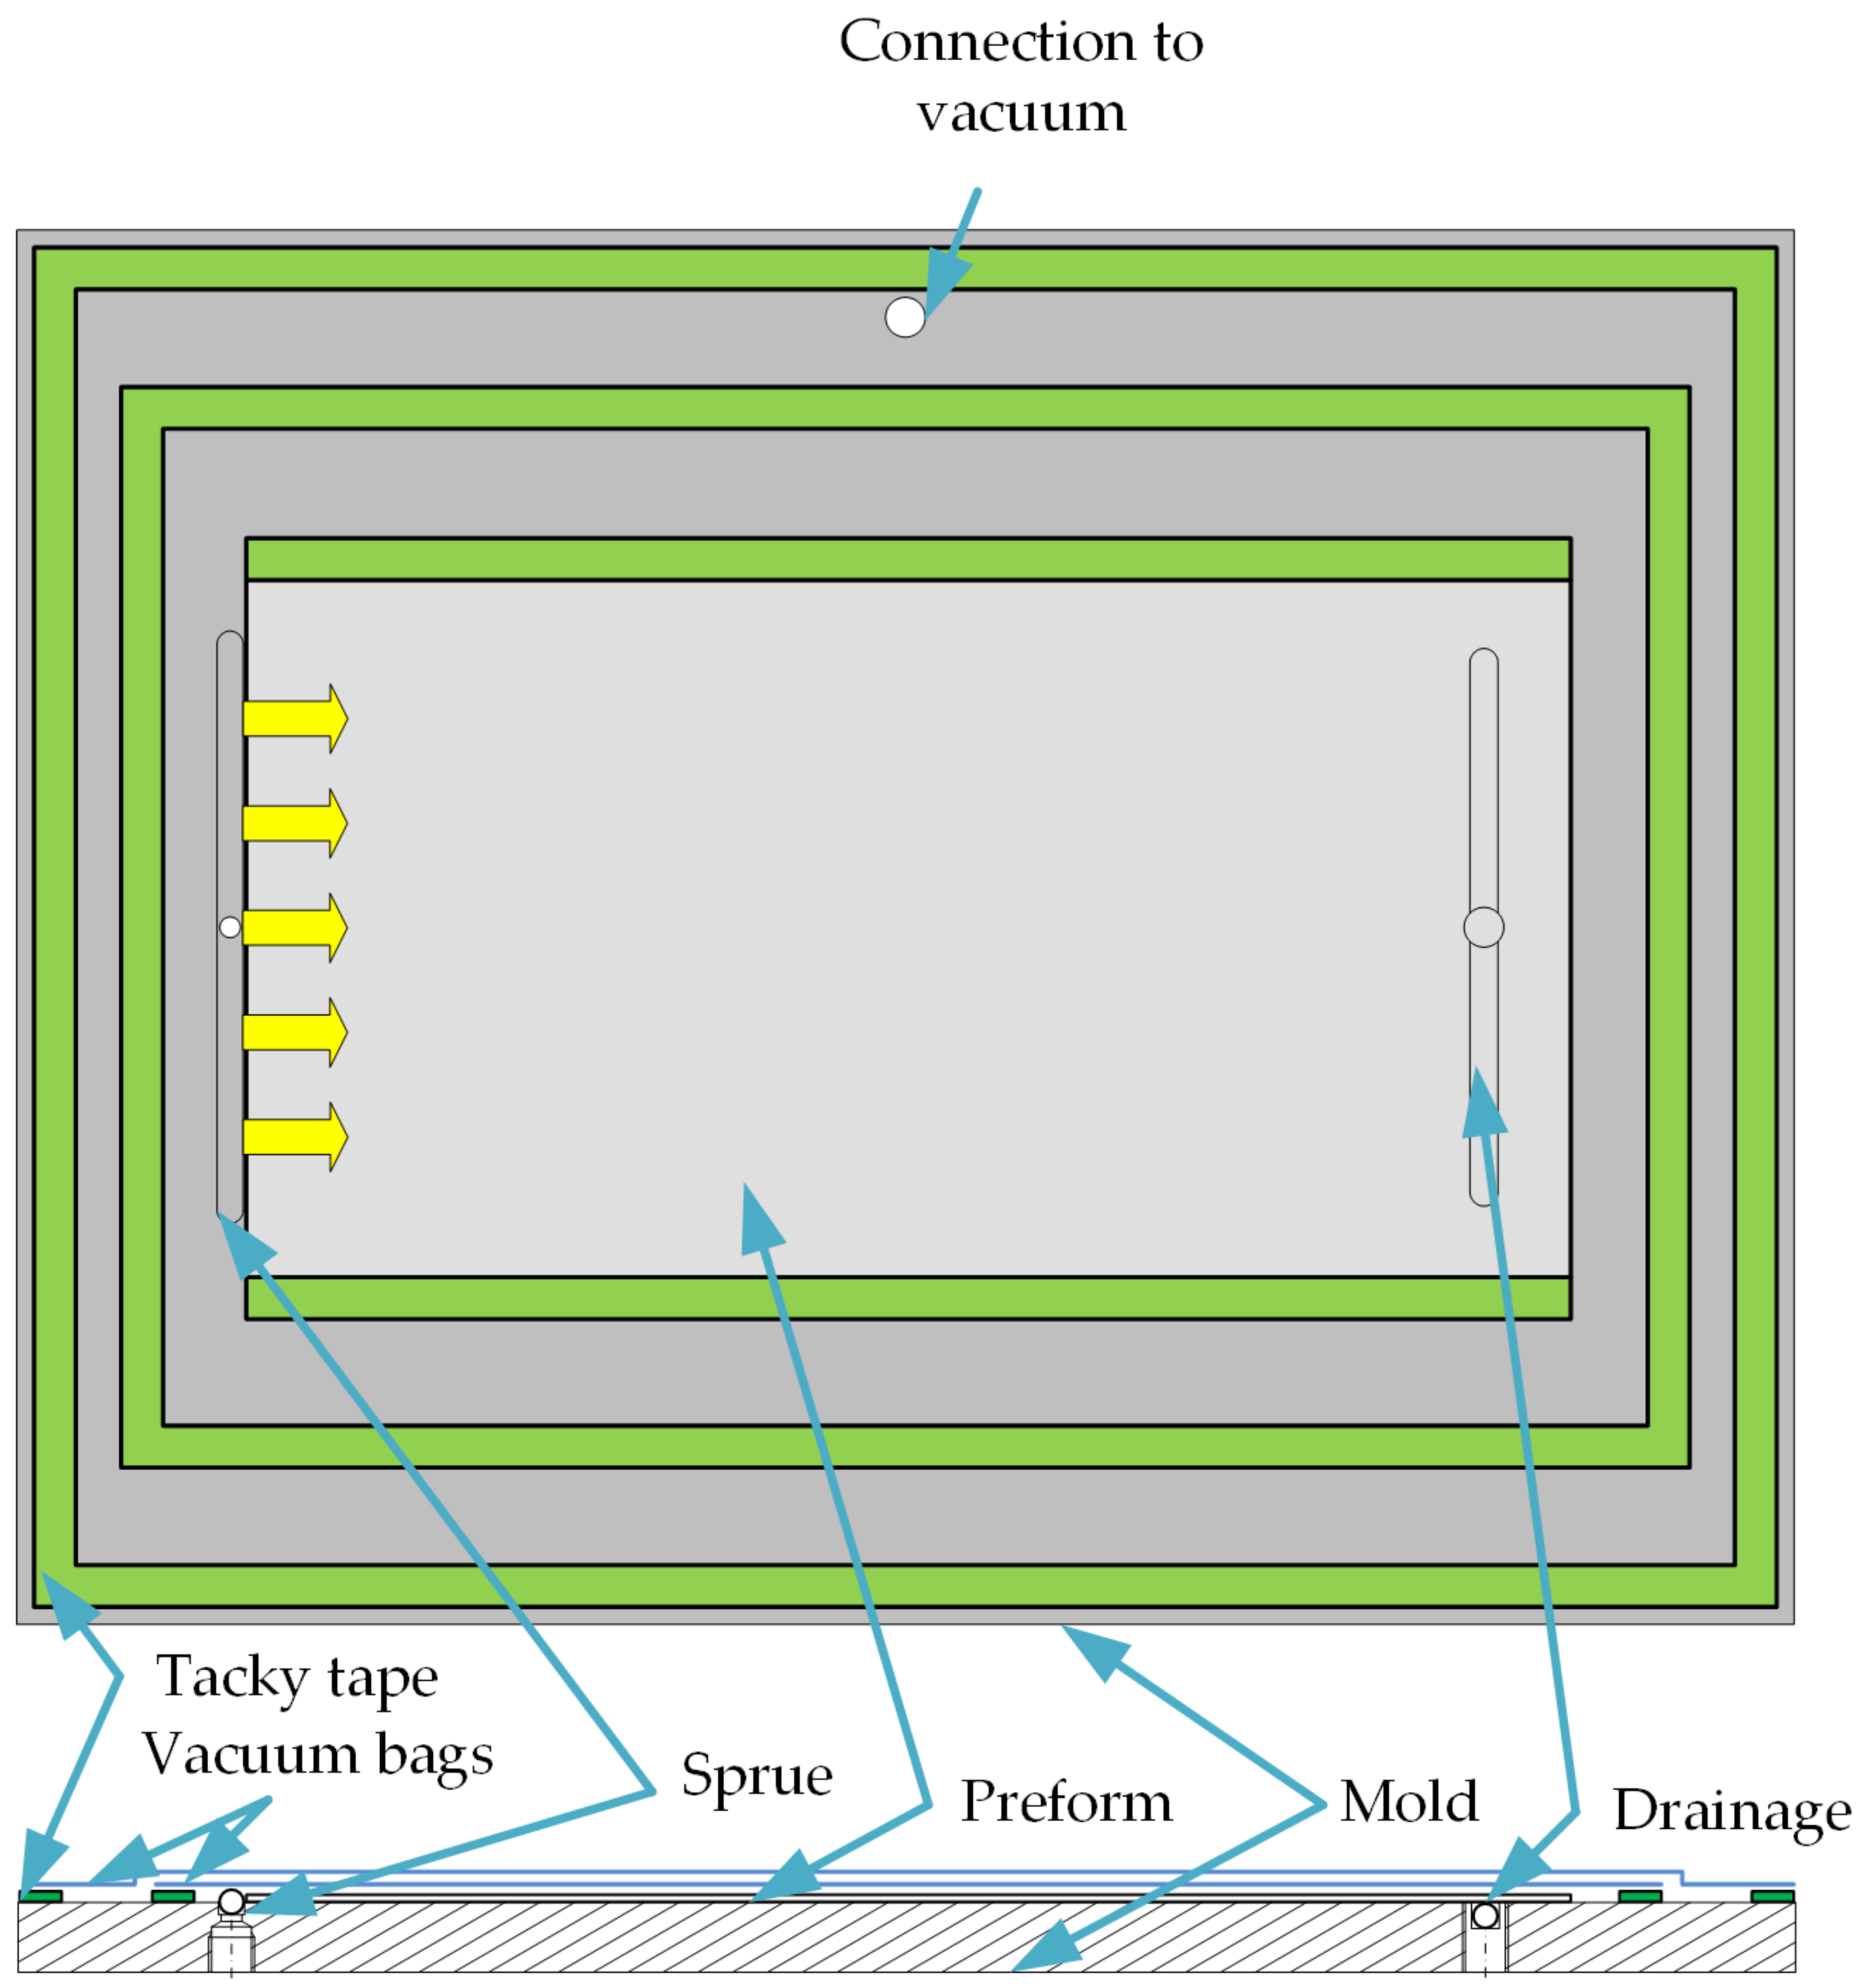
For the investigations made in this publication, two different molds are utilized for two infusion configurations. Both configurations use the vacuum infusion method. In this process, the cavity filled with fiber material is crated with a rigid mold and a flexible vacuum bag. The two-dimensional propagation of the flow front is realized with a pinpoint gate (see
Figure 4). For this purpose, the mold has a central hole with a diameter of 6 mm. Outside of the measuring area, there are two circumferential grooves that are each filled with a flow medium as drainage for the first and second vacuum bag. In the corners there are holes for connecting to the vacuum pump. The first and second vacuum bag are each sealed with tacky tape. For a better evaluation of the flow front, a transparent grid (10 mm × 10 mm) is positioned between the first and second vacuum bag.
In the 1D tests, a mold is used that has a line sprue (see
Figure 5). A groove arranged opposite the sprue serves as drainage. The grooves are filled with a steel spiral so that the vacuum bag cannot be pressed into the sprue or drainage groove during evacuation.
2.2. Materials Used
To investigate the effects of deposition temperature and compaction force, various preforms are deposited with the DFP system described. The different parameter pairings can be found in the
Table 1.
The minimum temperature of 125 °C cannot be fallen below when depositing, otherwise the binder will not be activated and the individual layers cannot be connected. If the maximum temperature of 225 °C is exceeded, the binder evaporates. The compaction force must be in the range of 400 N to 800 N. Falling below this will result in poor adhesion between the layers and exceeding it will damage the material. The stacking for all preforms is [0/90/45/–45]s and preforms 1–5 have the dimensions 1800 mm × 1800 mm. Deviating from this, the preform 6 has the dimensions 1200 mm × 2100 mm.
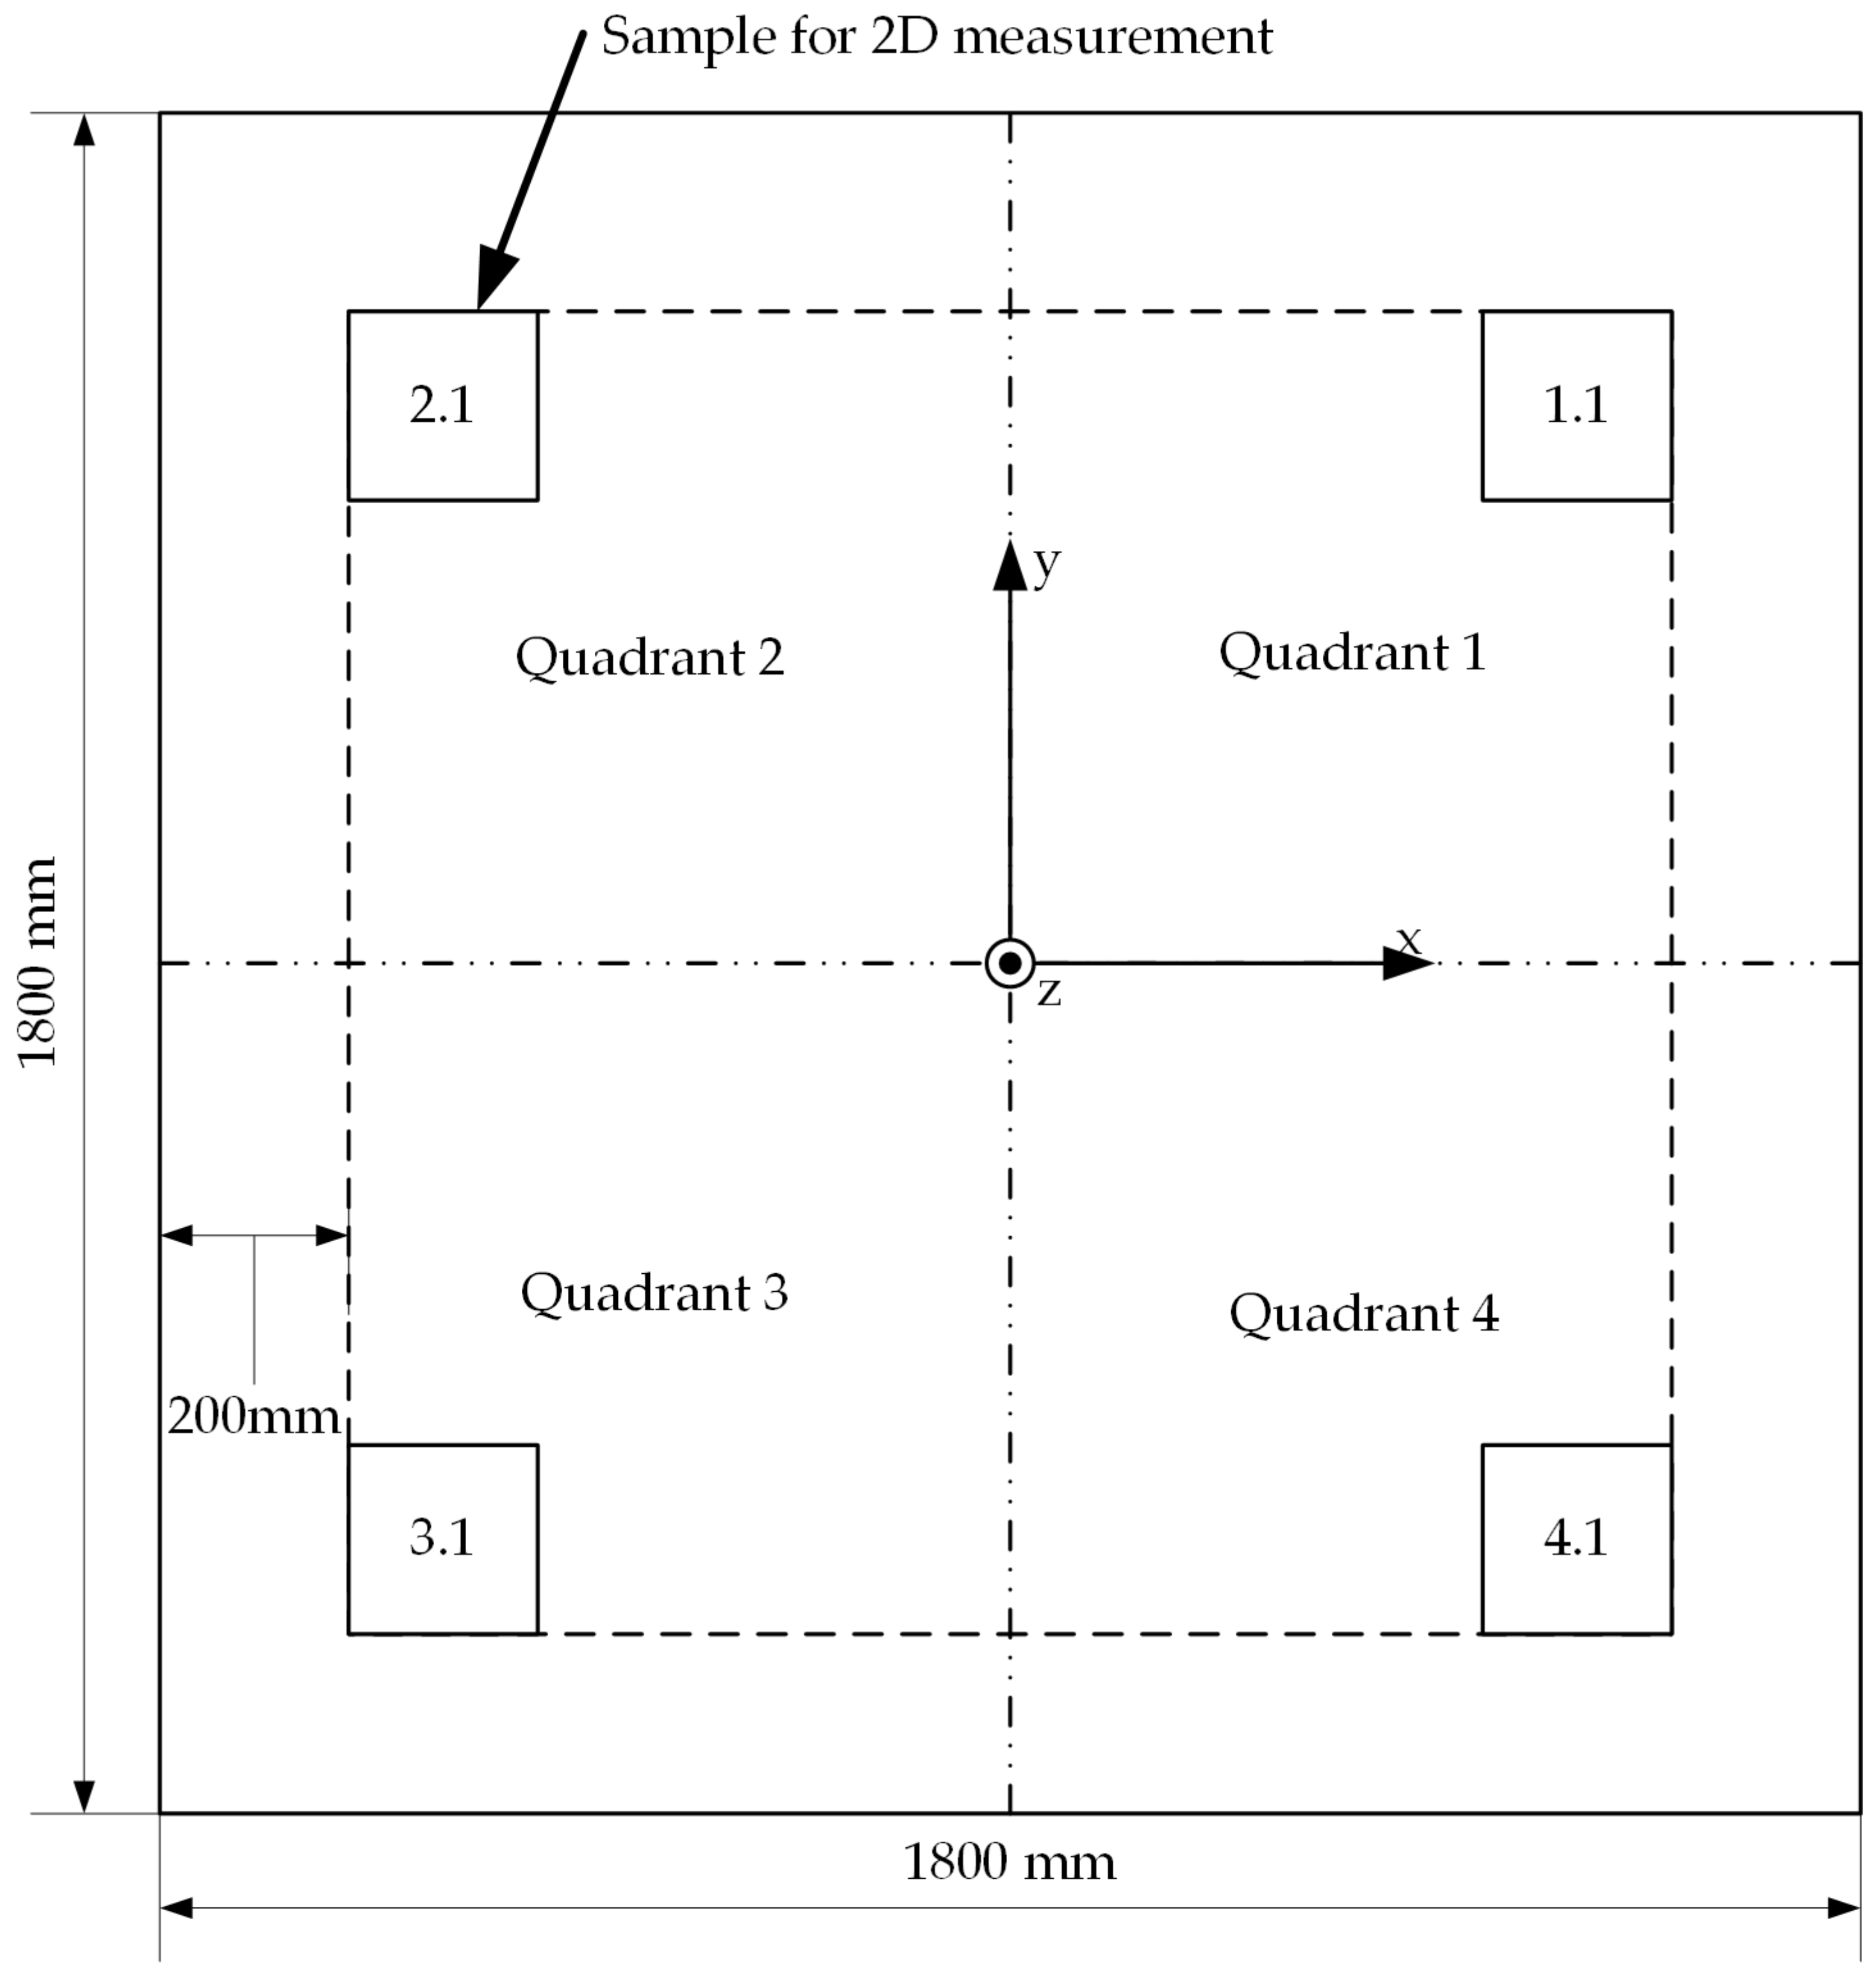
A sample measuring 200 mm × 200 mm is taken from each quadrant of the preform plates for the 2D investigations.
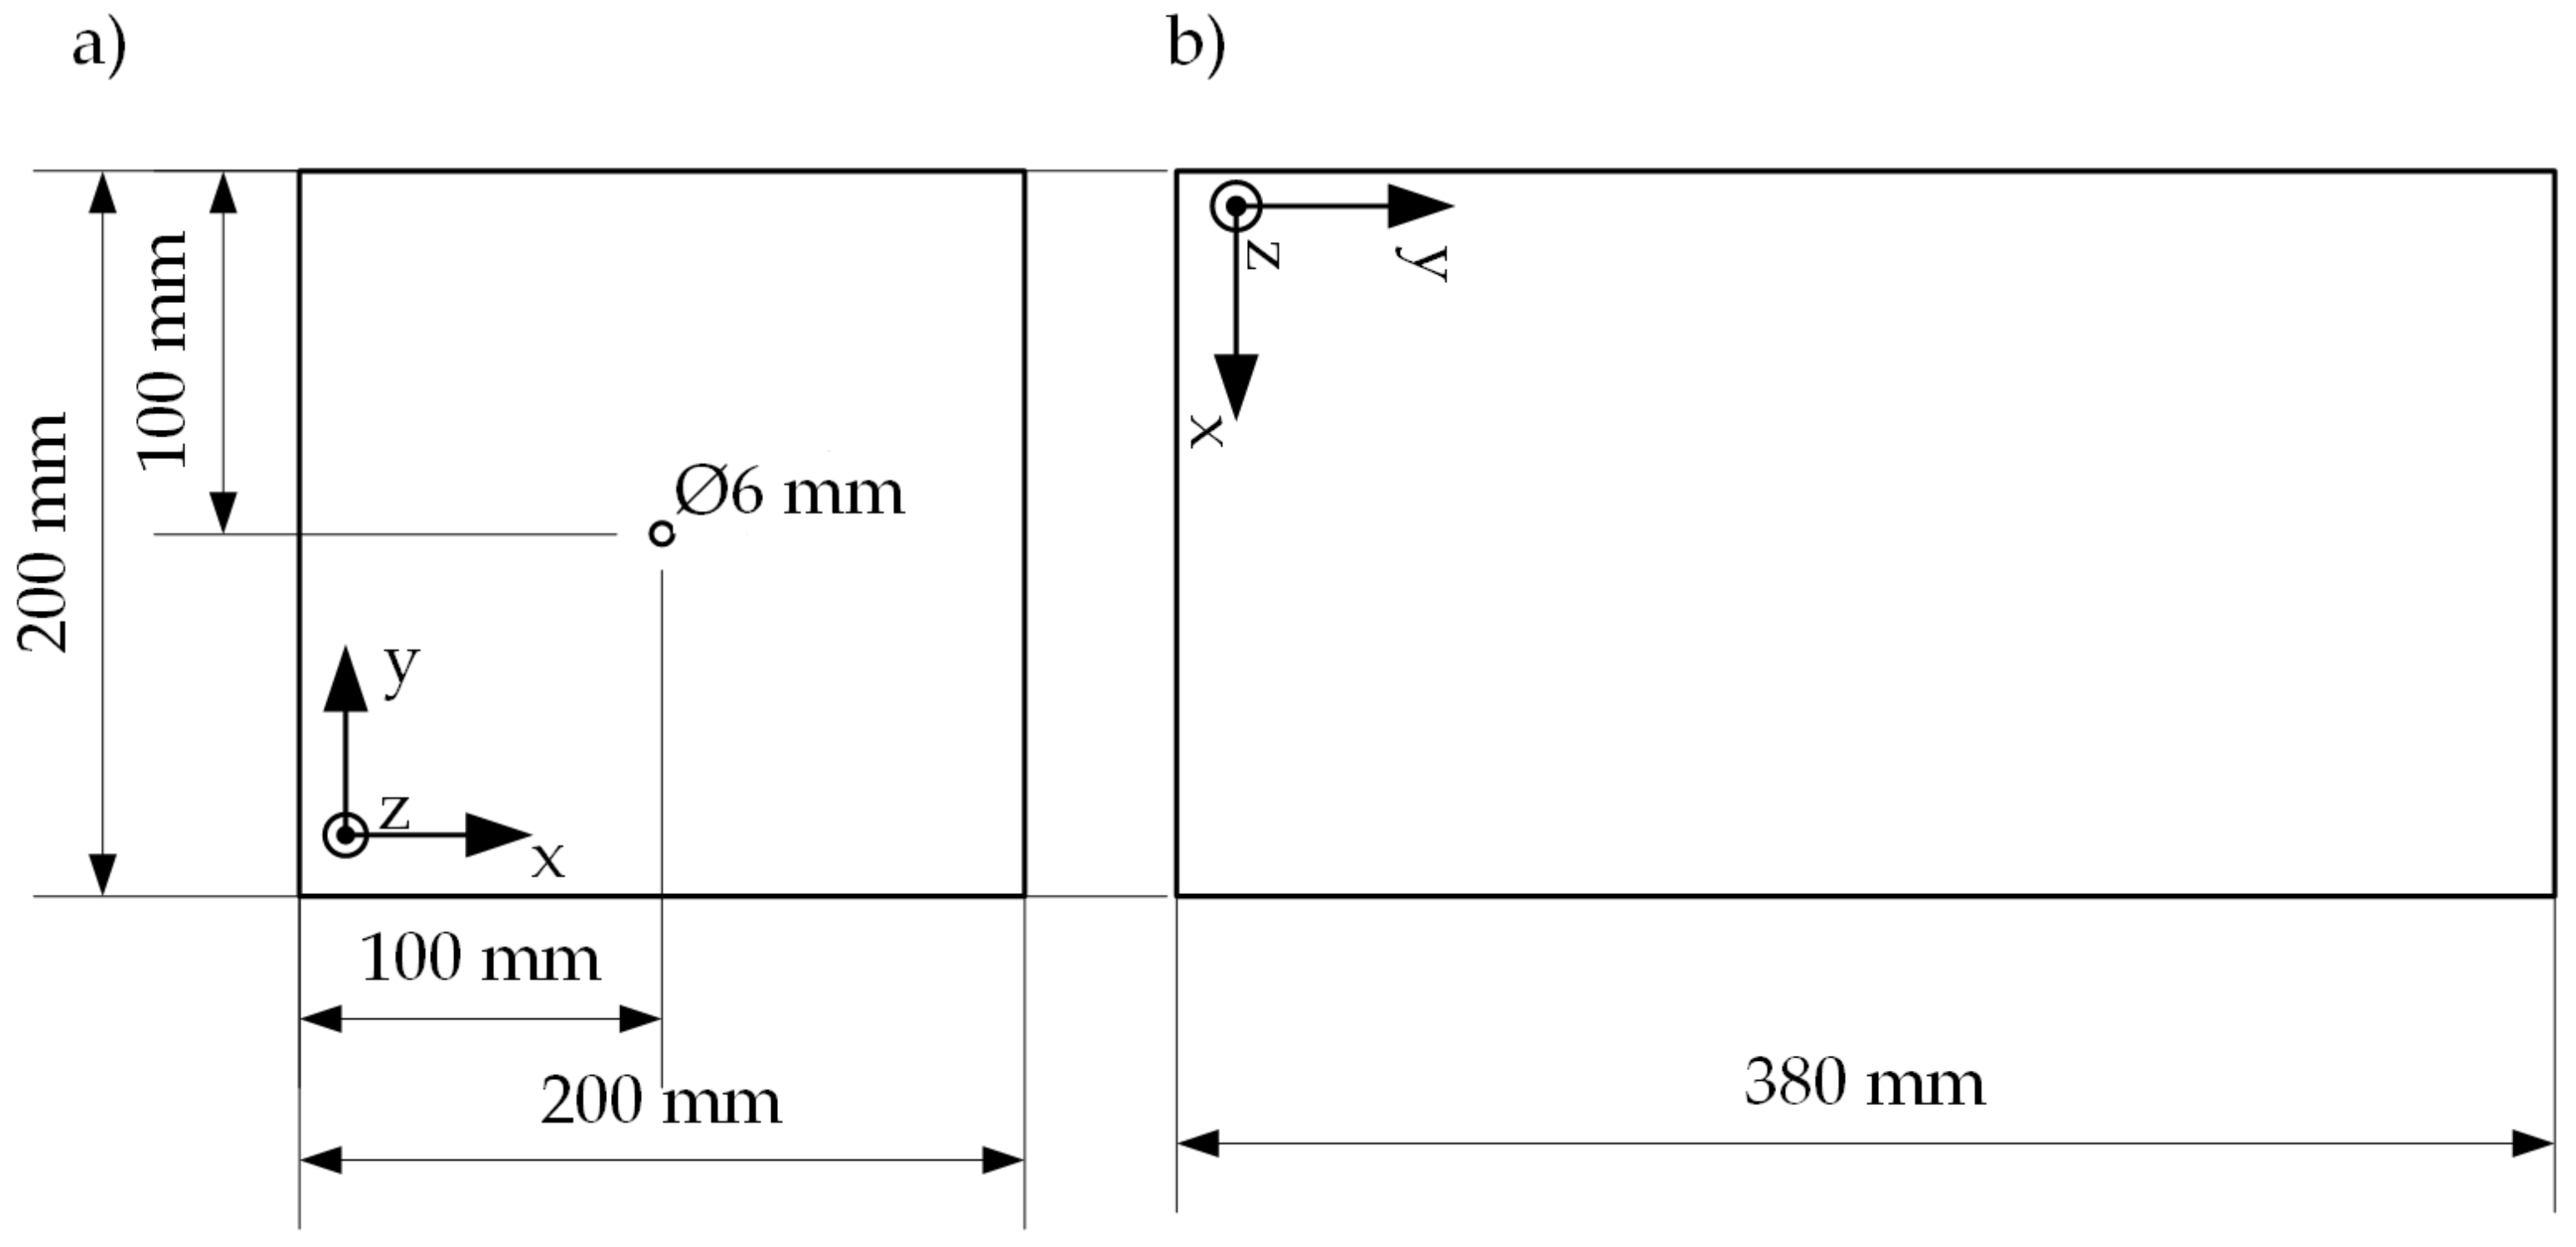
Figure 6 shows that a distance of 200 mm from the edges of the preform plate to the specimens is maintained and thus edge effects from the preform deposit do not influence the specimens (This applies in the same way to Preform 6). In addition, each sample has a central hole with a diameter of 6 mm, which ensures that each individual layer is evenly supplied with the test liquid (see
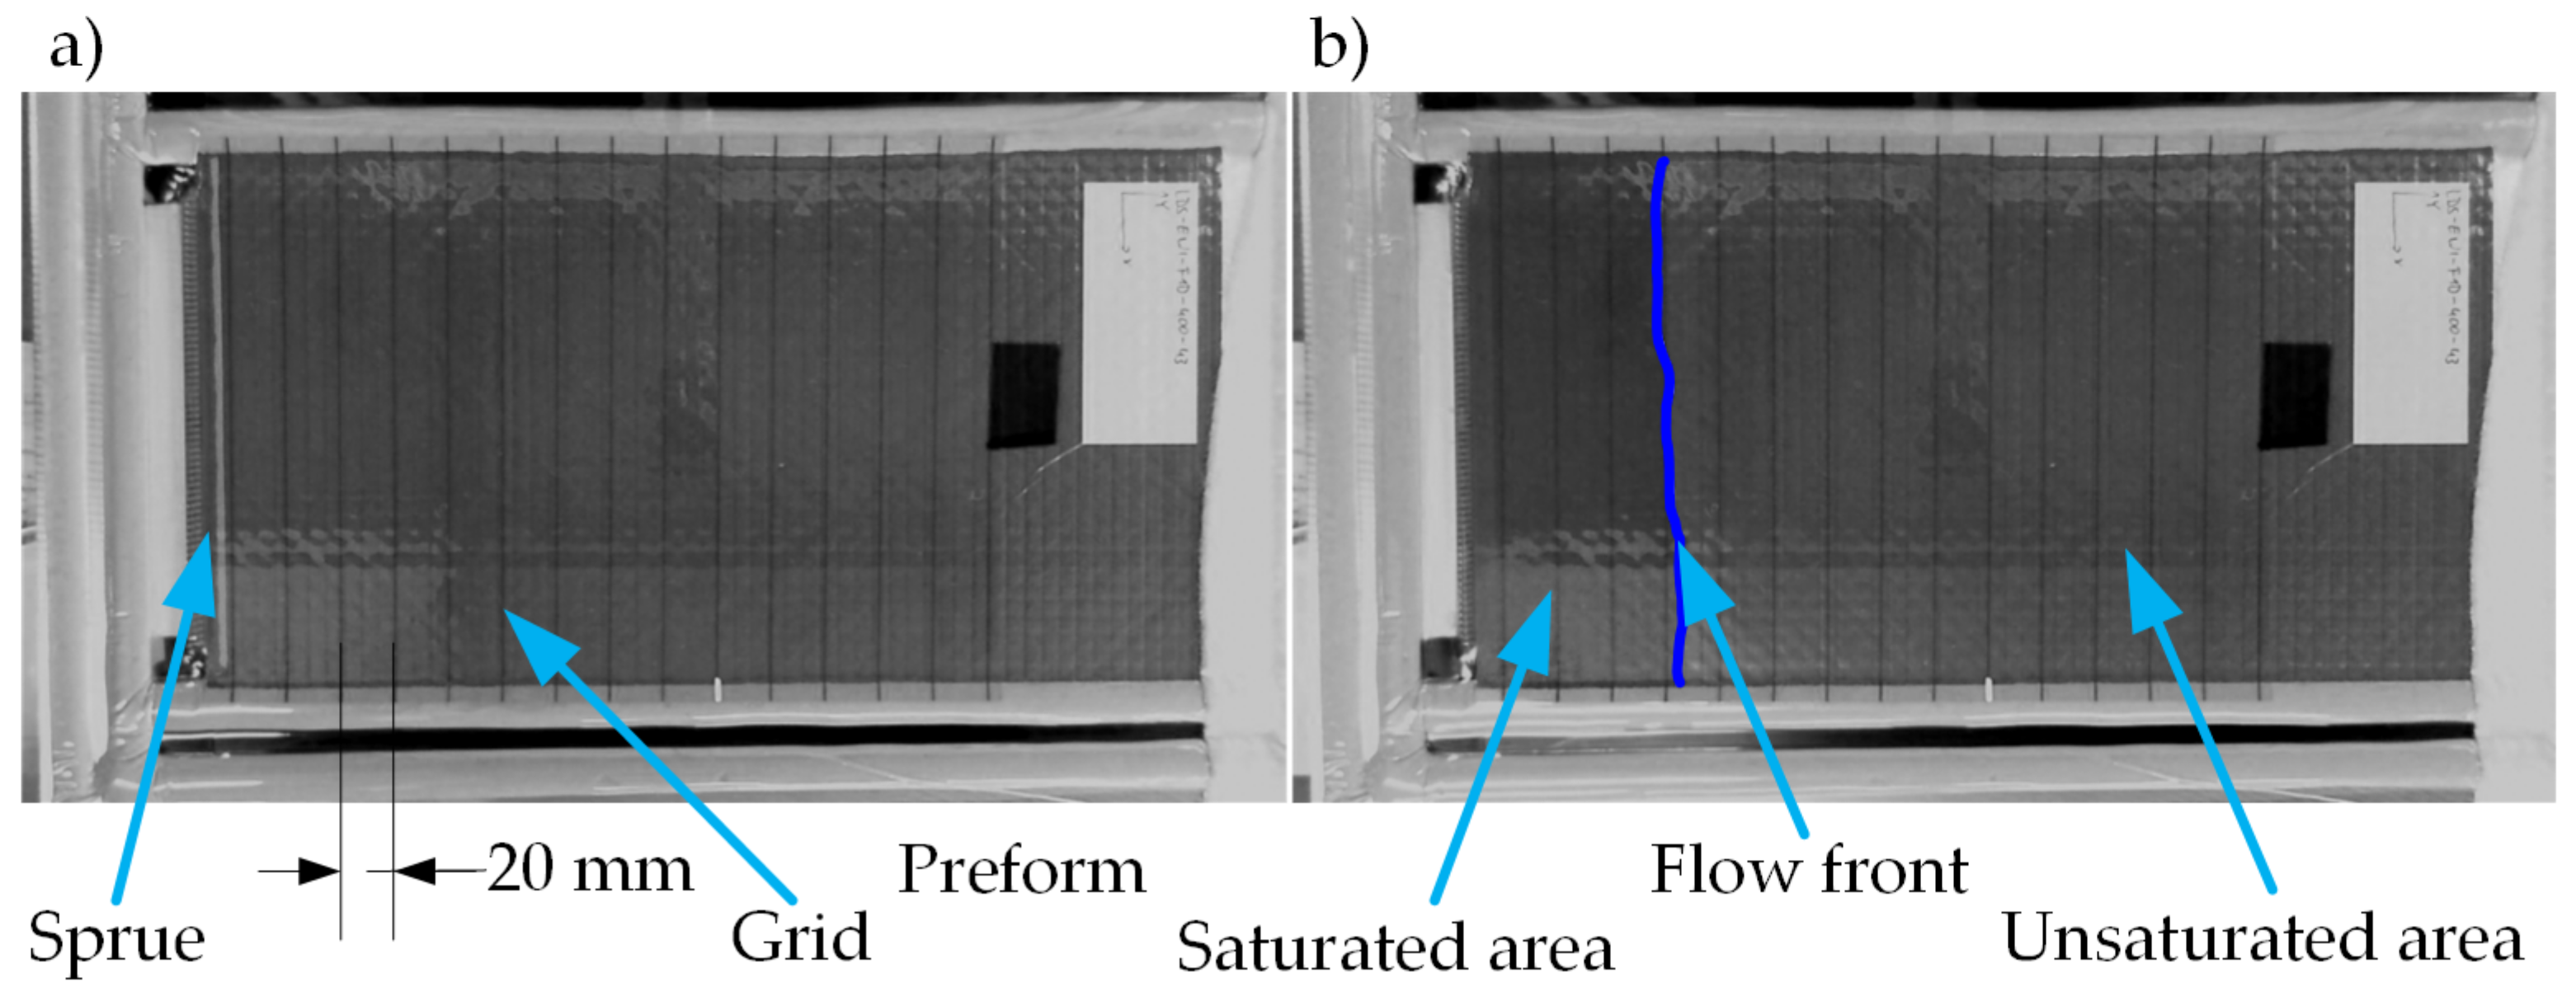
Figure 7a). The samples for the 1D tests are rectangular and have the dimensions 200 mm × 380 mm (see
Figure 7b). The longer extension of the sample is positioned in the direction of flow so that the longest possible flow path is created. By infiltrating the 2D samples, the main directions of permeability can be determined and the samples for the 1D tests are oriented in the direction of greatest permeability. The 1D samples are not shown in the
Figure 6 because the samples are taken from the two quadrants that are most likely to be isotropic.
The Hexcel HiTape material used consists of an IMA fiber (filament diameter 5
m) and has a basis weight of 280 g/m². A thermoplastic veil (V800E) holds the individual filaments of a tow together and acts as a binder through thermal activation. In addition, the veil improves the damage tolerance of the cured component [
24,
25,
26,
27]. Material with a tow width of 6.35 mm is used to manufacture the preforms, and 16 tows are laid down in parallel.
The Solvay TX 1100 material is made from a Tenax IMS65 fiber. The filament diameter is 5
m and the tows are coated with the Cycom 7720 binder (powder binder) for tacking the individual layers together [
28].
The two materials are summarized in the
Table 2 for comparison.
By dividing the preforms into four quadrants (see
Figure 6), a statement can be made about the homogeneity of the deposit. With the help of preforms 1–5, the effects of the different placement parameters on the infusion properties are examined. Preform 6 is used to show the influence of a different material or the spacing of the tows on the homogeneity of the preform. Differences in the materials relate to the fibers, binders and tow width.
The silicone oils Roth M20 [
29] and M50 [
30] are used as the test liquid for the infusion tests. Due to the lower viscosity, the M20 silicone oil is infiltrated in the 1D tests and thus reduces the time for impregnation. The 2D specimens, on the other hand, are impregnated with the M50 silicone oil. Silicone oils are used for the study of infusion properties because the viscosity does not change at the same temperature. In contrast, the viscosity of epoxy resin changes as a function of time and would influence the test results. Silicone oil is often used as a test liquid for the experimental determination of permeability [
20,
31]. The
Table 3 lists the properties of the two oils.
2.3. Procedure
The samples are cut with an NC-controlled cutter (Zünd G3 Digital Cutter). With the 2D samples, the main axes in the four quadrants are examined and thus the orientation of the samples for the 1D test is determined. After the evaluation of the 2D samples, the samples for the 1D tests are also cut out of the preform plate with the NC-controlled cutter. Aerospace applications often use latent resin systems, such as Hexcel RTM6, that require preheating of the preform. Typical temperatures are in the range of 120 °C to 140 °C [
32]. In order to comply with this process step, all samples are preheated in an oven (Binder FP 240) at 120 °C in a vacuum setup for 2 h before measurement.
The procedure for the infusion experiments is similar for 1D and 2D examinations. Only the gating concept differs. A line gate is used for the 1D tests and a pin-point gate for the 2D tests. In contrast to the 2D tests, race-tracking effects at the preform edges must be avoided in the 1D tests. The edges of the preform are sealed with tacky tape, filling the cavity that forms at the edges. This means that no test liquid can overflow at the edges. The line gate is located on the short side of the respective preform sample.
The preform sample is sealed airtight on the mold with a vacuum bag and tacky tape. A second vacuum bag is sealed in the same way as the first vacuum bag and ensures greater security against leaks [
18]. Between the first and second vacuum bag there is a foil with a grid (10 mm × 10 mm) and is used for later comparison of the flow front propagation.
After both cavities have been evacuated, a leak test is carried out in the first cavity. To do this, a stable pressure reading is awaited and then the vacuum line to the vacuum pump is disconnected. A pressure increase of 10 mbar within 5 min is permitted to ensure adequate tightness. This increase in pressure has been determined in preliminary tests and has proven to be practicable for this test arrangement. If the pressure increase is higher, the vacuum bags and the tacky tape must be replaced. A measuring cup with test liquid is placed on a scale below the mold. The test liquid is fed into the cavity through a riser (internal diameter 4 mm) and opened and closed via a ball valve. With the mentioned camera, which is mounted above the mold (see
Figure 3), an image of the flow front progress is taken and documented every 2 s. Image recording and the measurement of the weight with the scale each begin shortly before the ball valve in the riser opens and ends shortly after the ball valve closes.
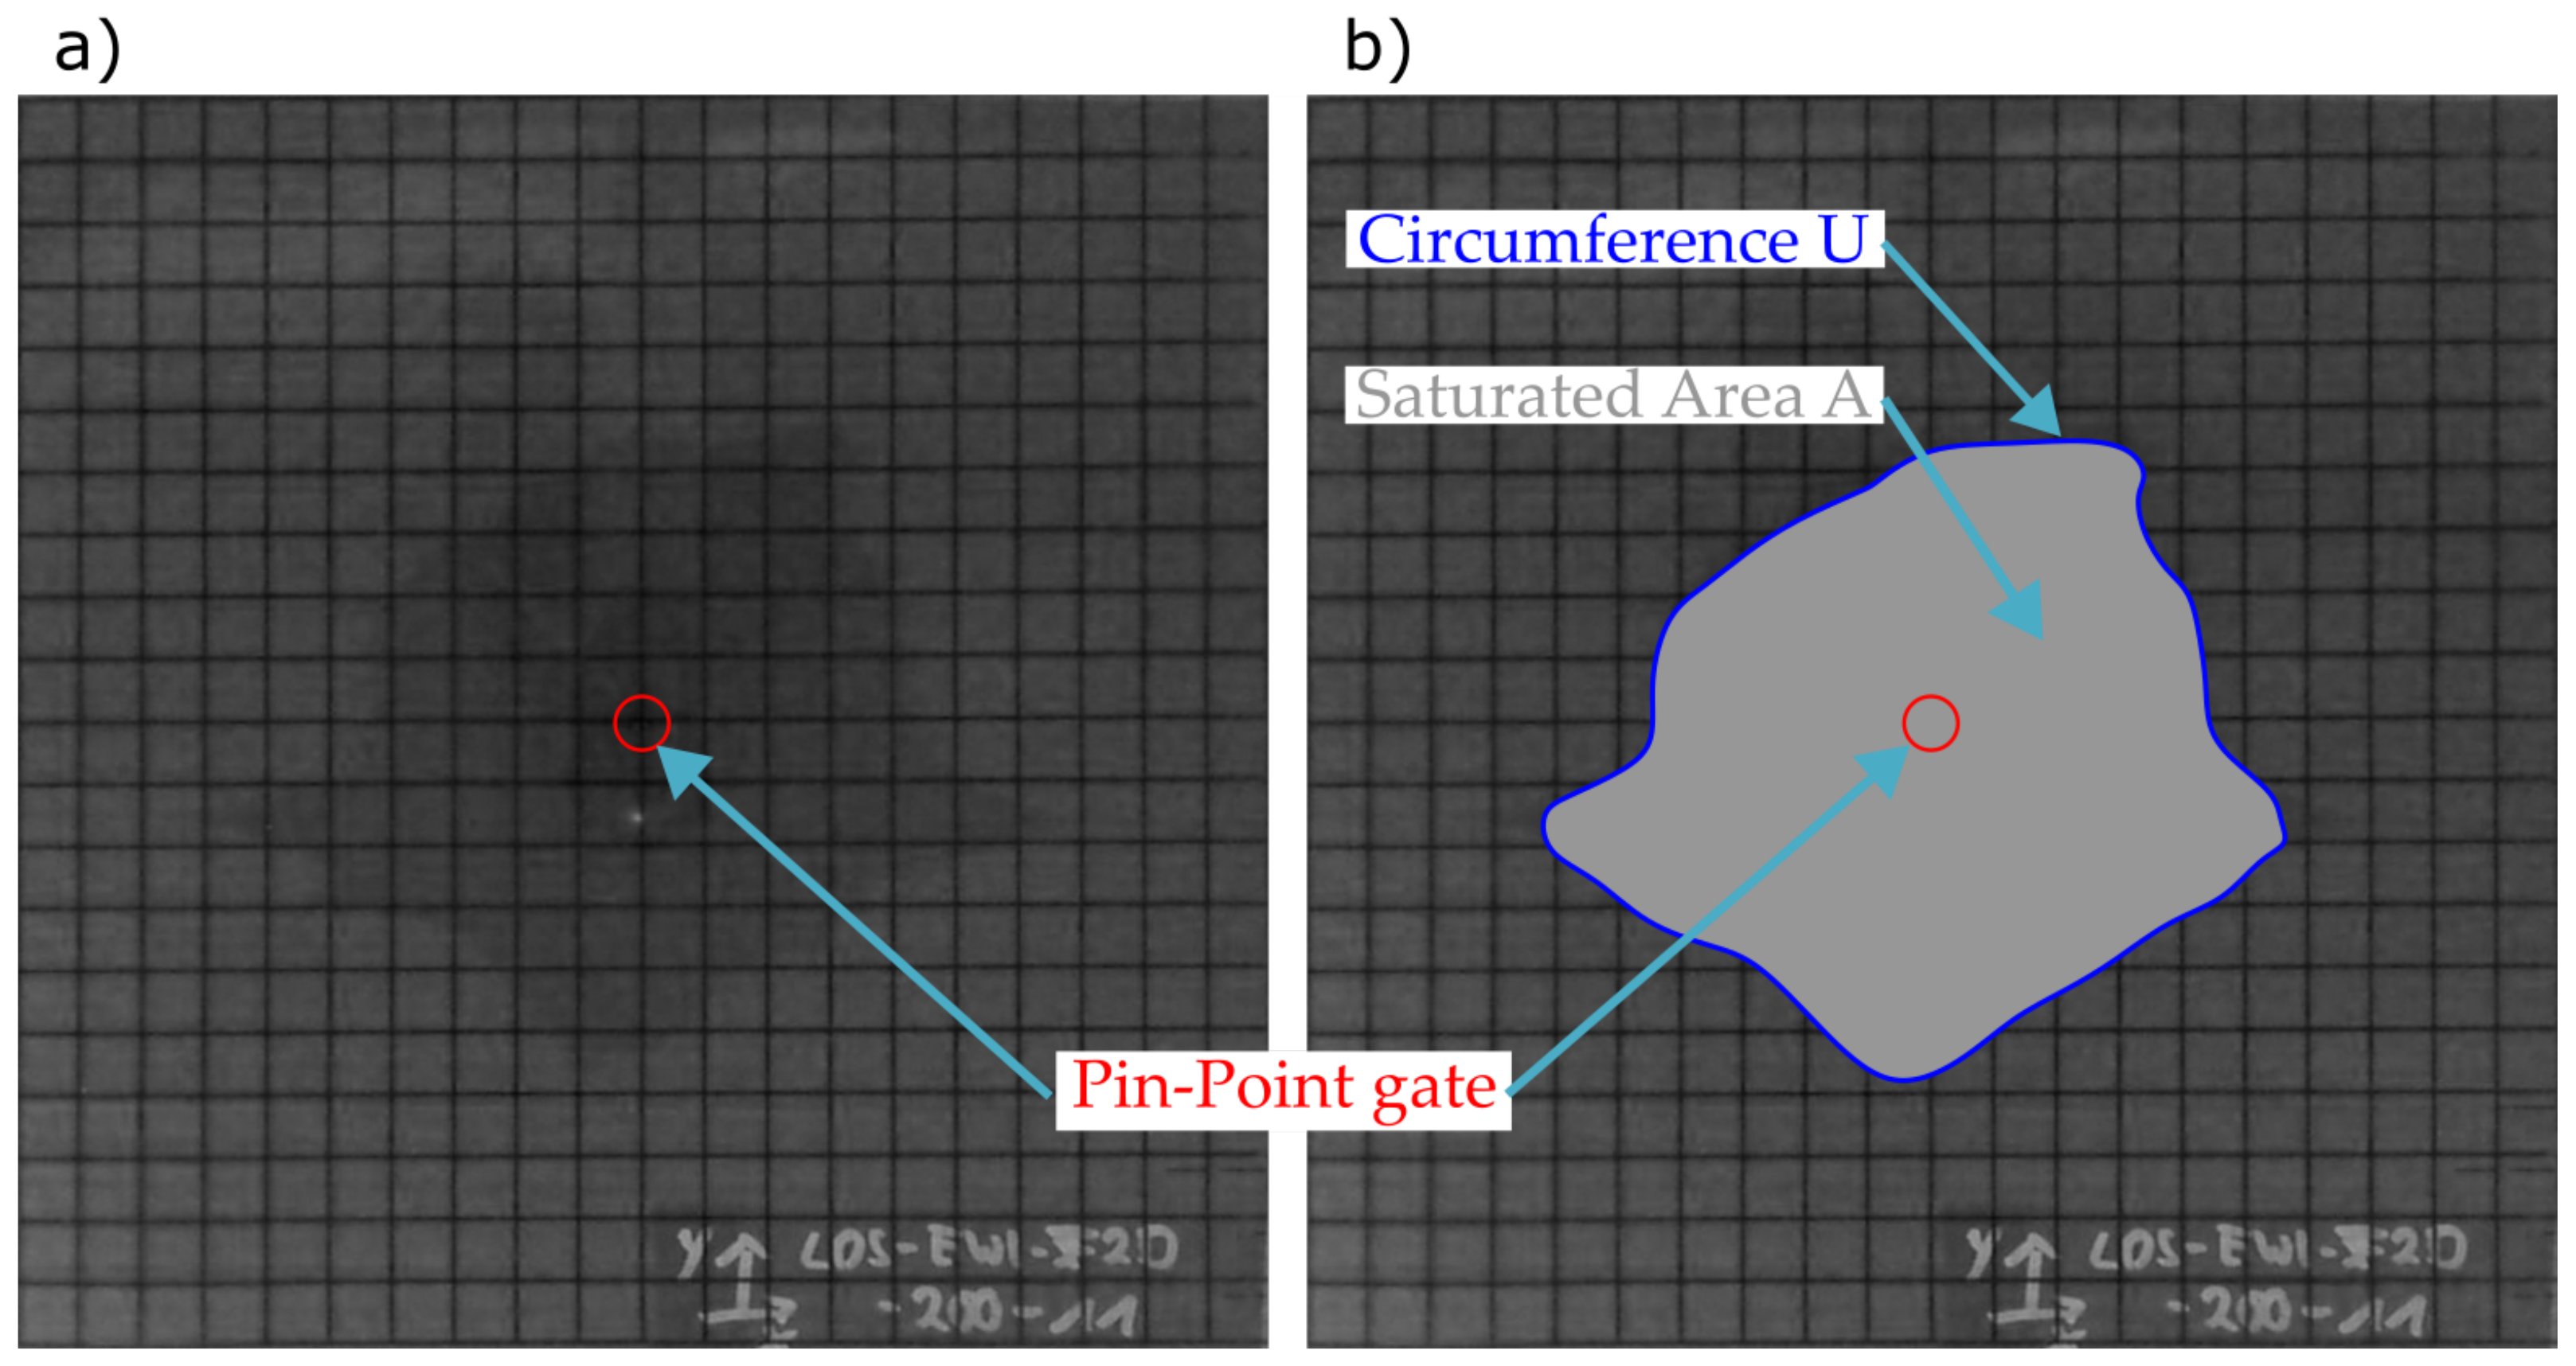
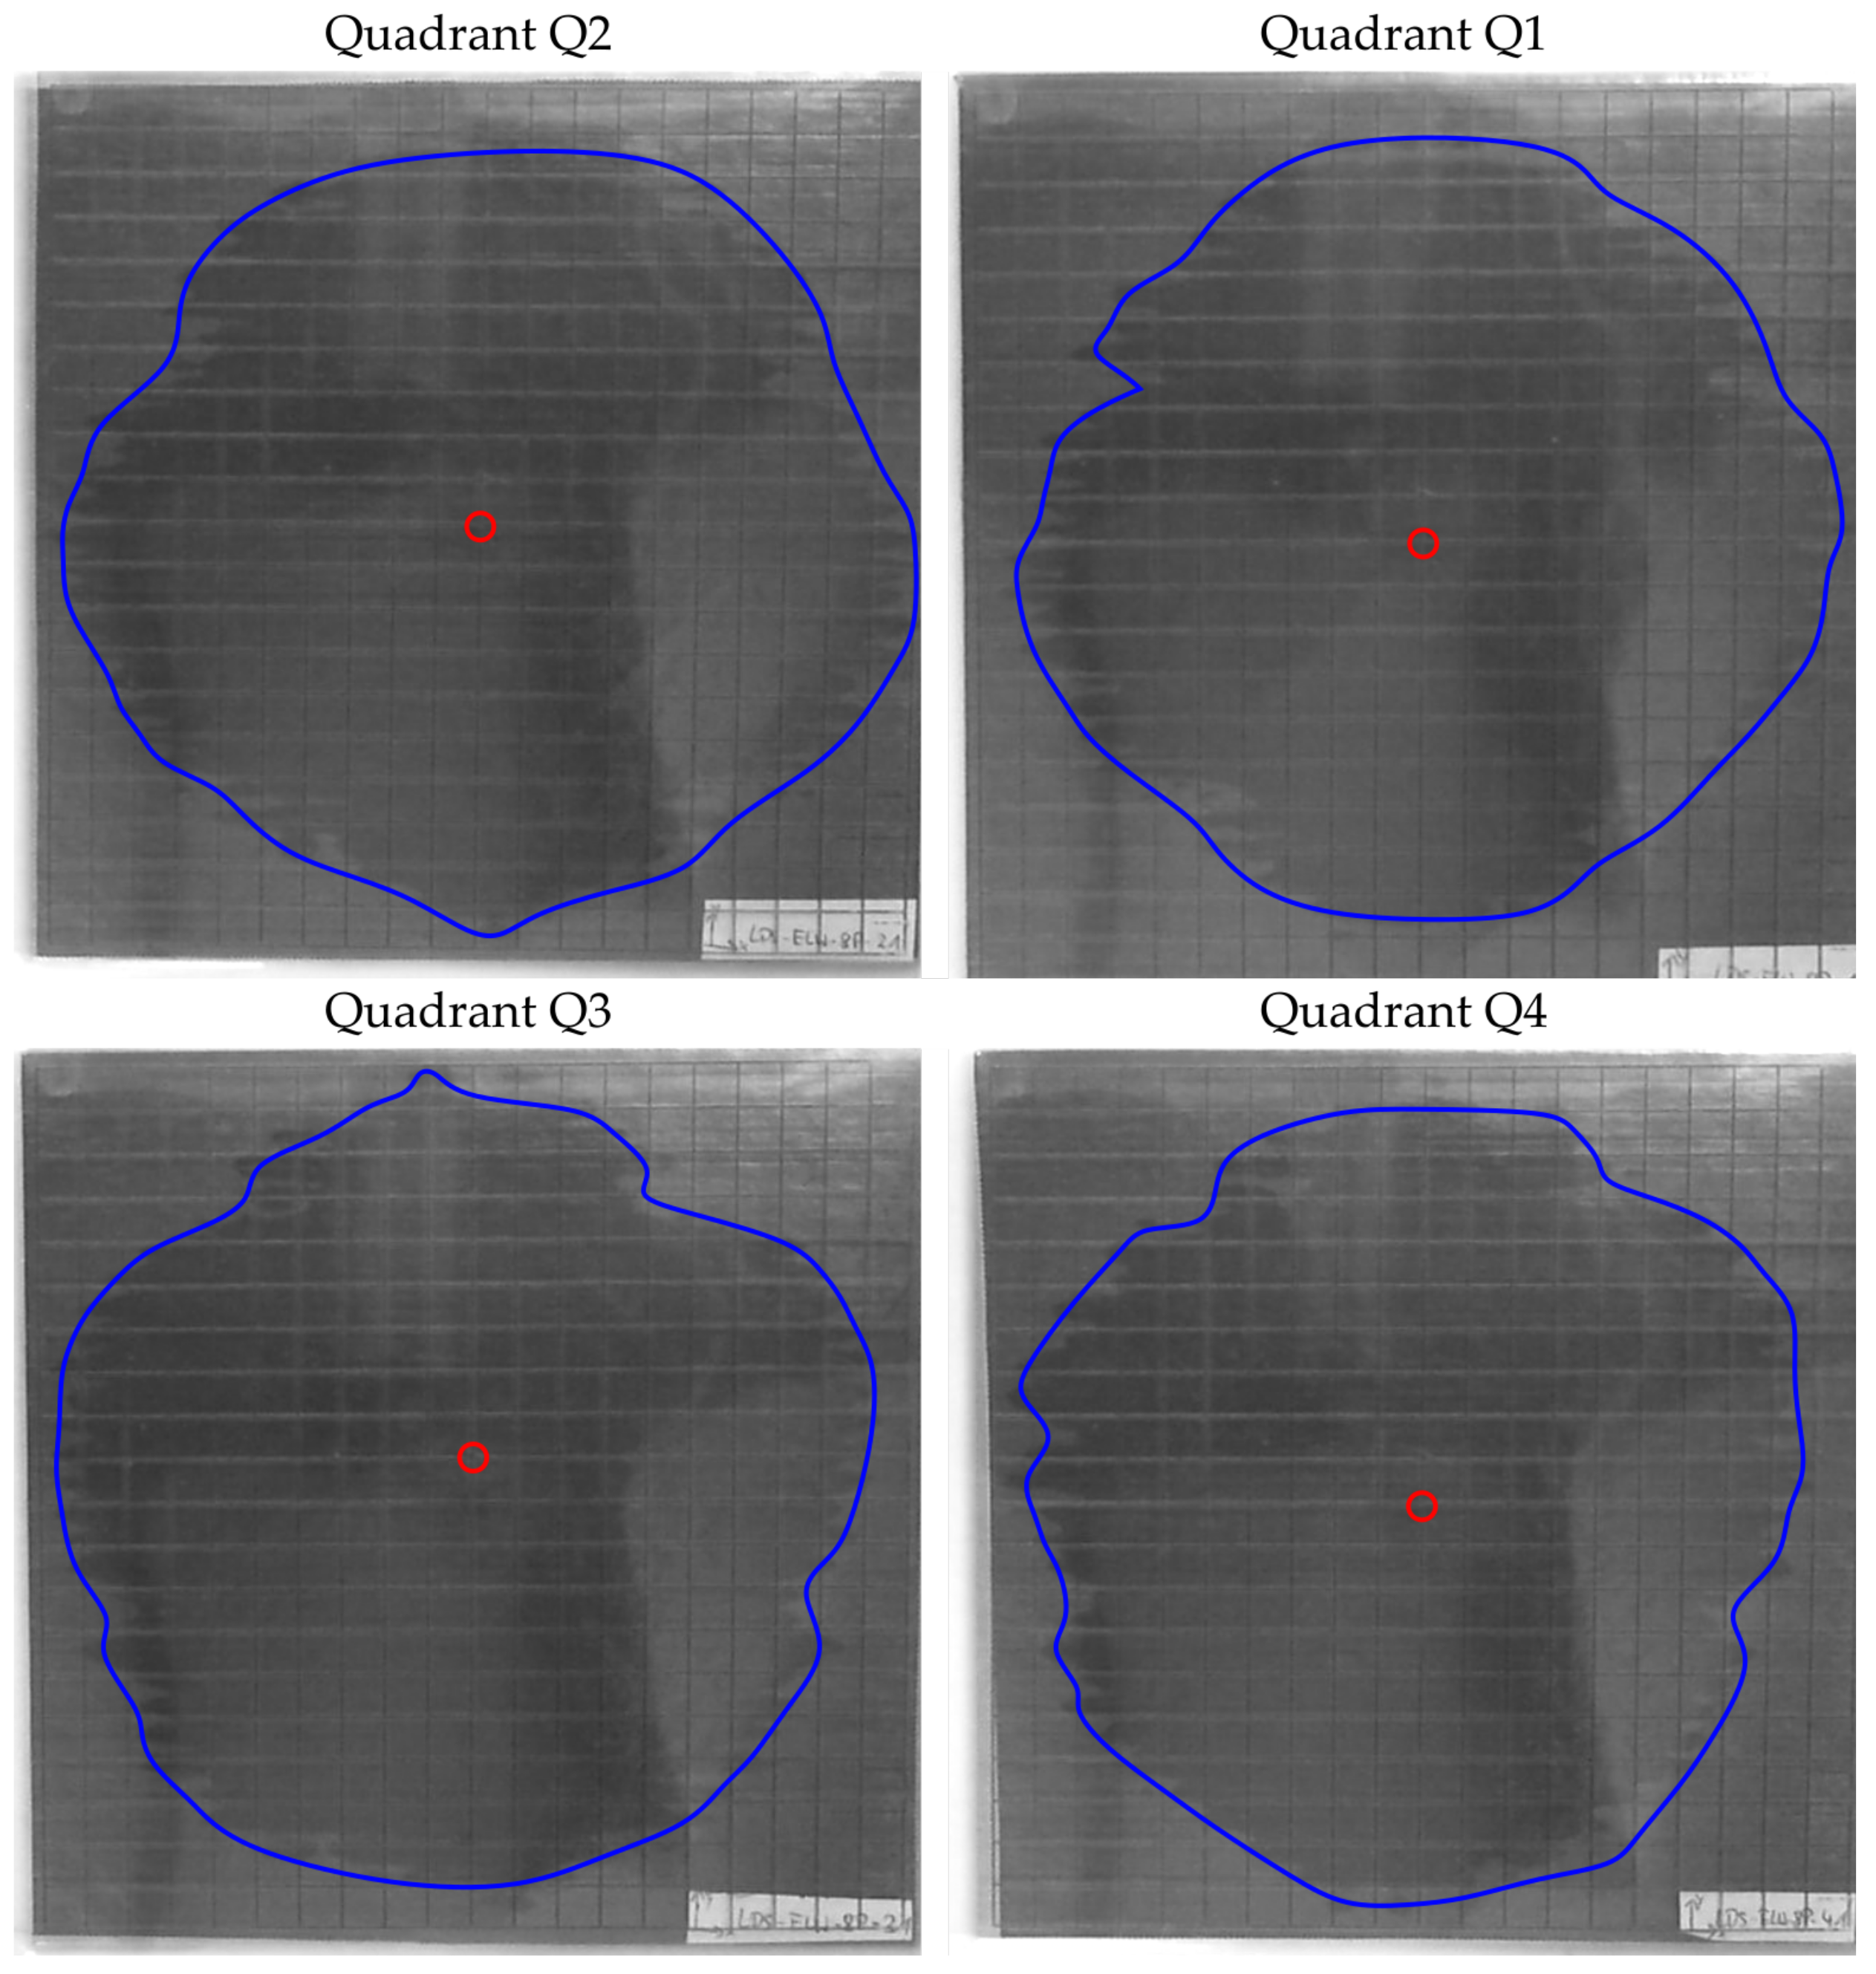
After the 2D infusion tests, the images are evaluated. It is not necessary to analyze each image individually, but the start of the respective infusion attempt is determined using the images and the associated time stamp. In order to be able to determine the main axes, a second image is evaluated manually after 10 min infusion time. For an objective evaluation of the flow front propagation, the circumference U (blue line) and the saturated area A (gray area) is determined from the images (see
Figure 8). The deviation from the circular shape is calculated with a shape factor FF (Equation (
1)) that relates the area A and the circumference U [
33]. If the flow front forms a perfect circle, the preform is isotropic and the shape factor is 1. If the geometry deviates from the circular shape, the shape factor becomes less than 1.
The masses recorded by the scale are presented in a diagram with the axes mass and time and allow a comparison of the mass flows per sample. Since the level in the test liquid cup decreases with increasing infusion time, the filling level in the container is restored before each test.
In the 1D infusion tests, the times at which the flow front has reached a certain distance from the base of the line are determined from the images (see
Figure 9).
3. Results
The images of the 2D tests are shown in the
Figure 10,
Figure 11,
Figure 12,
Figure 13,
Figure 14 and
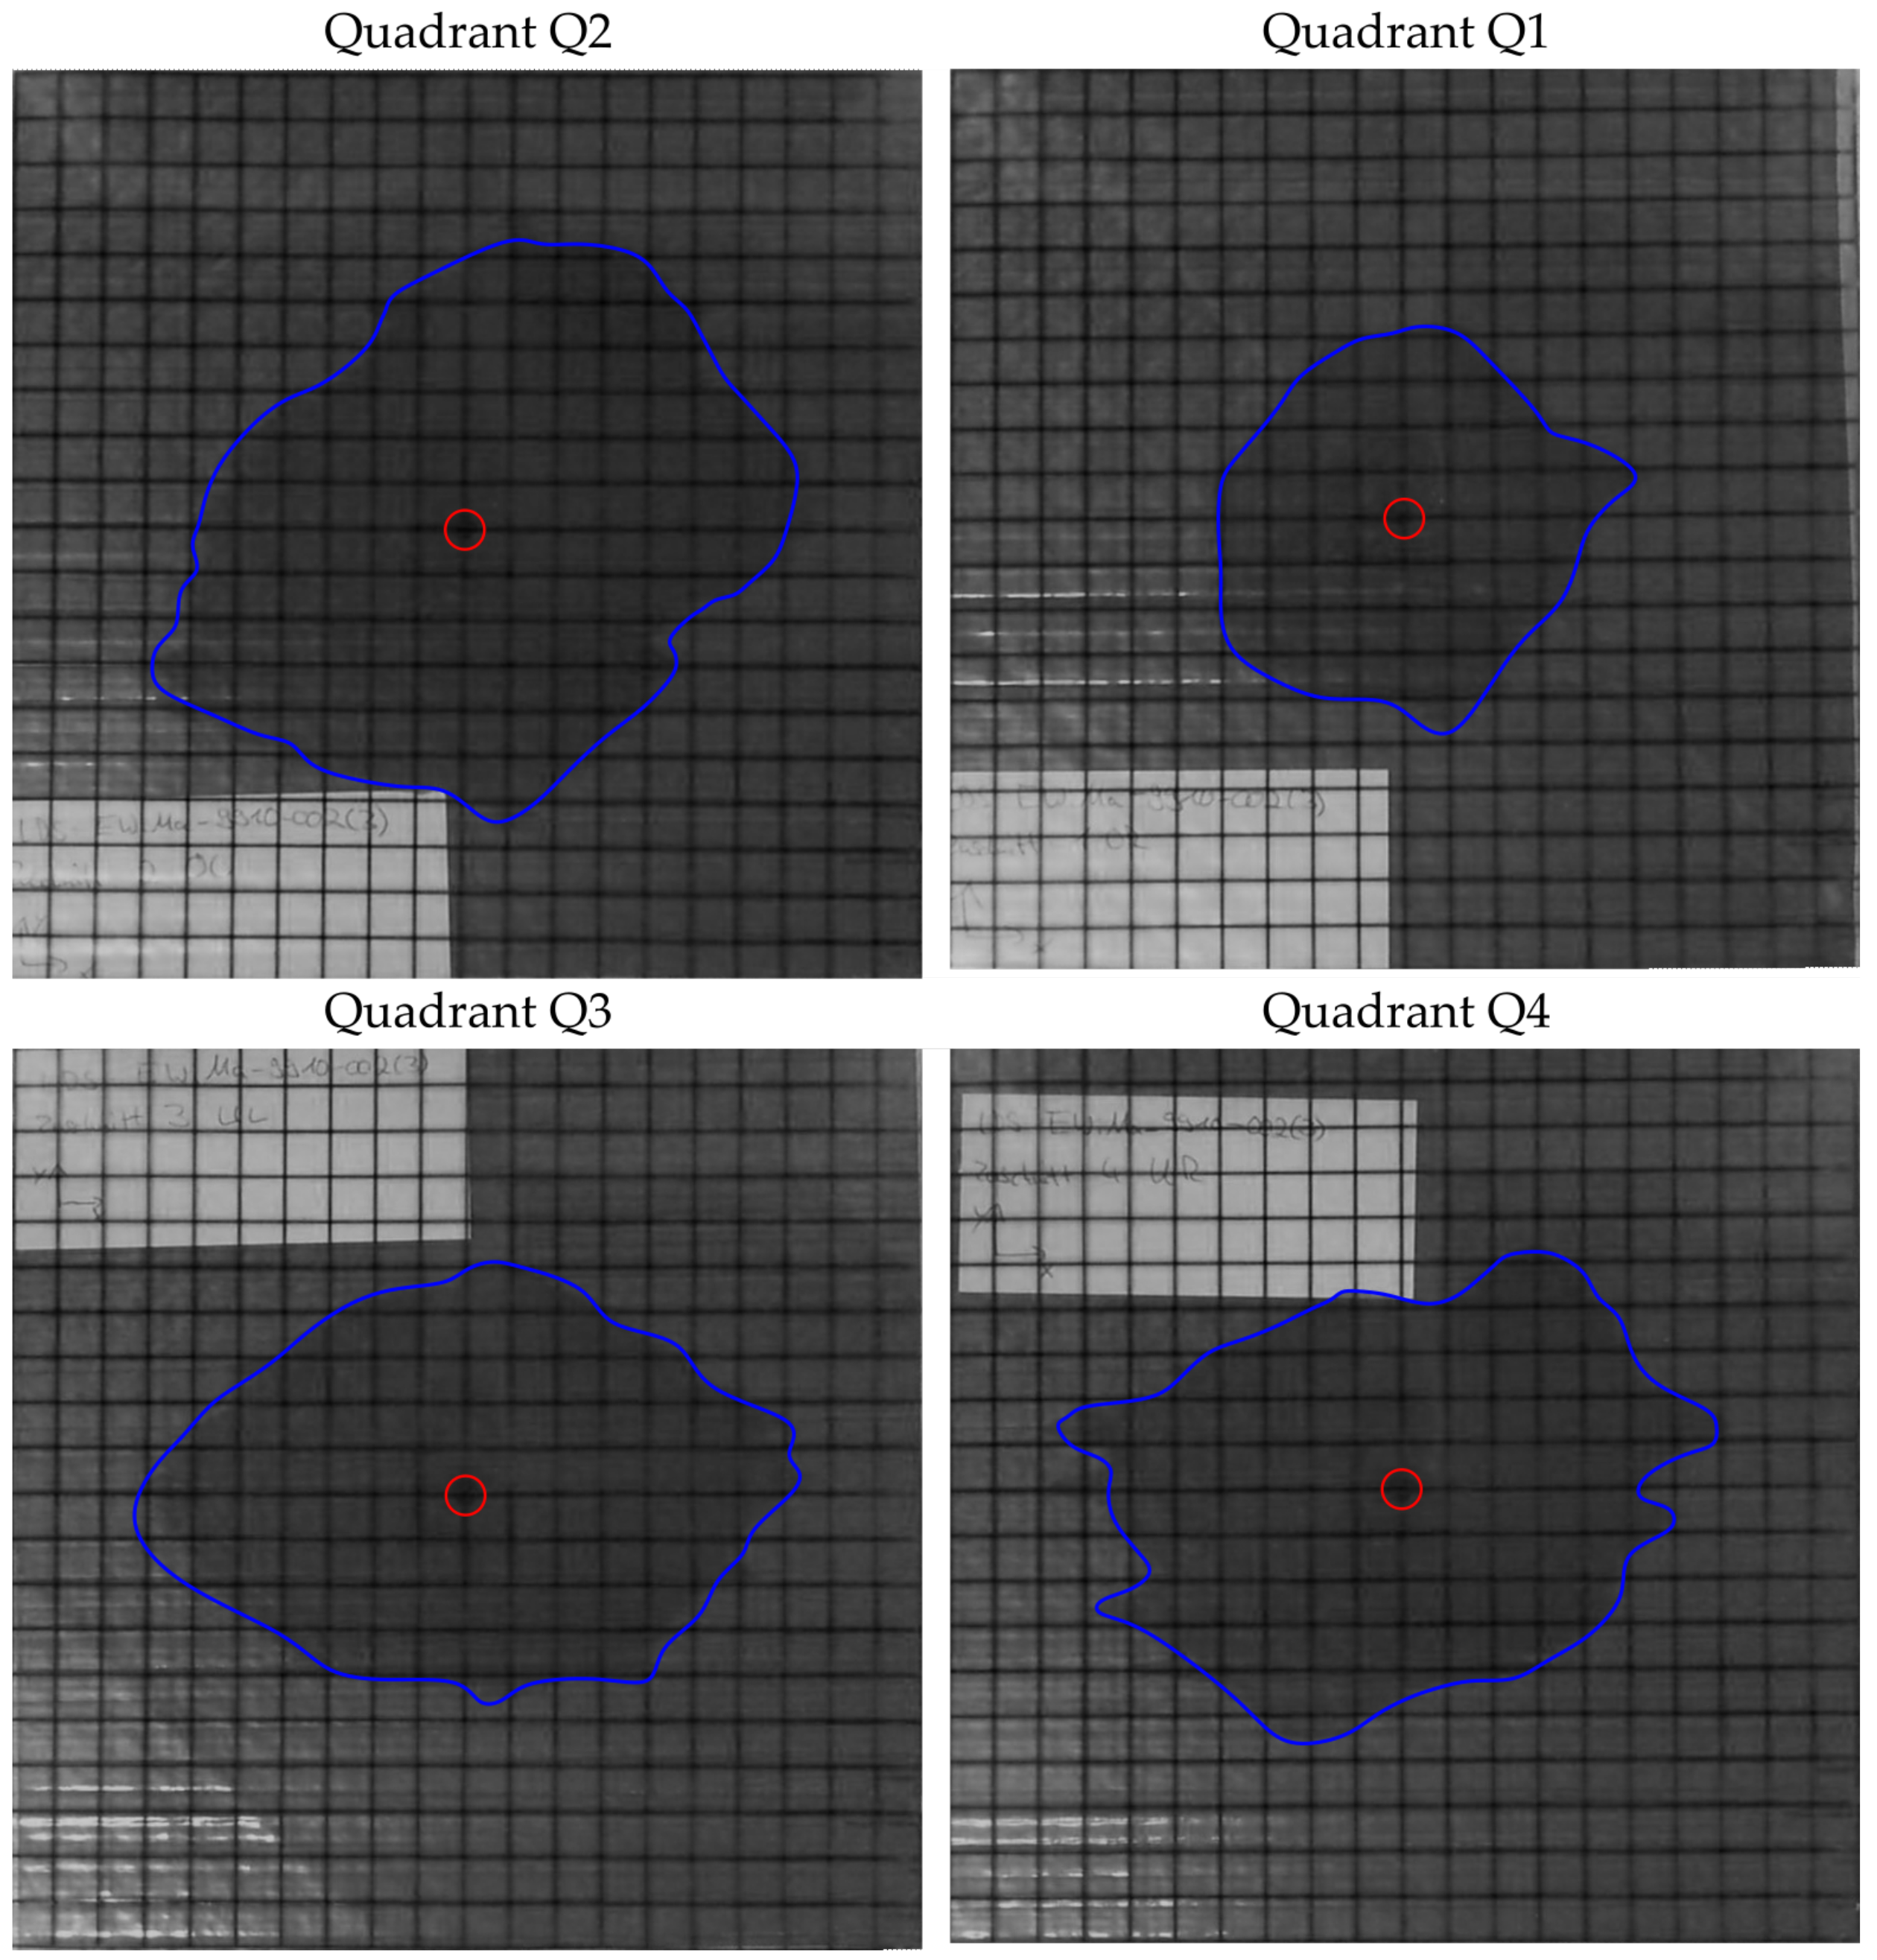
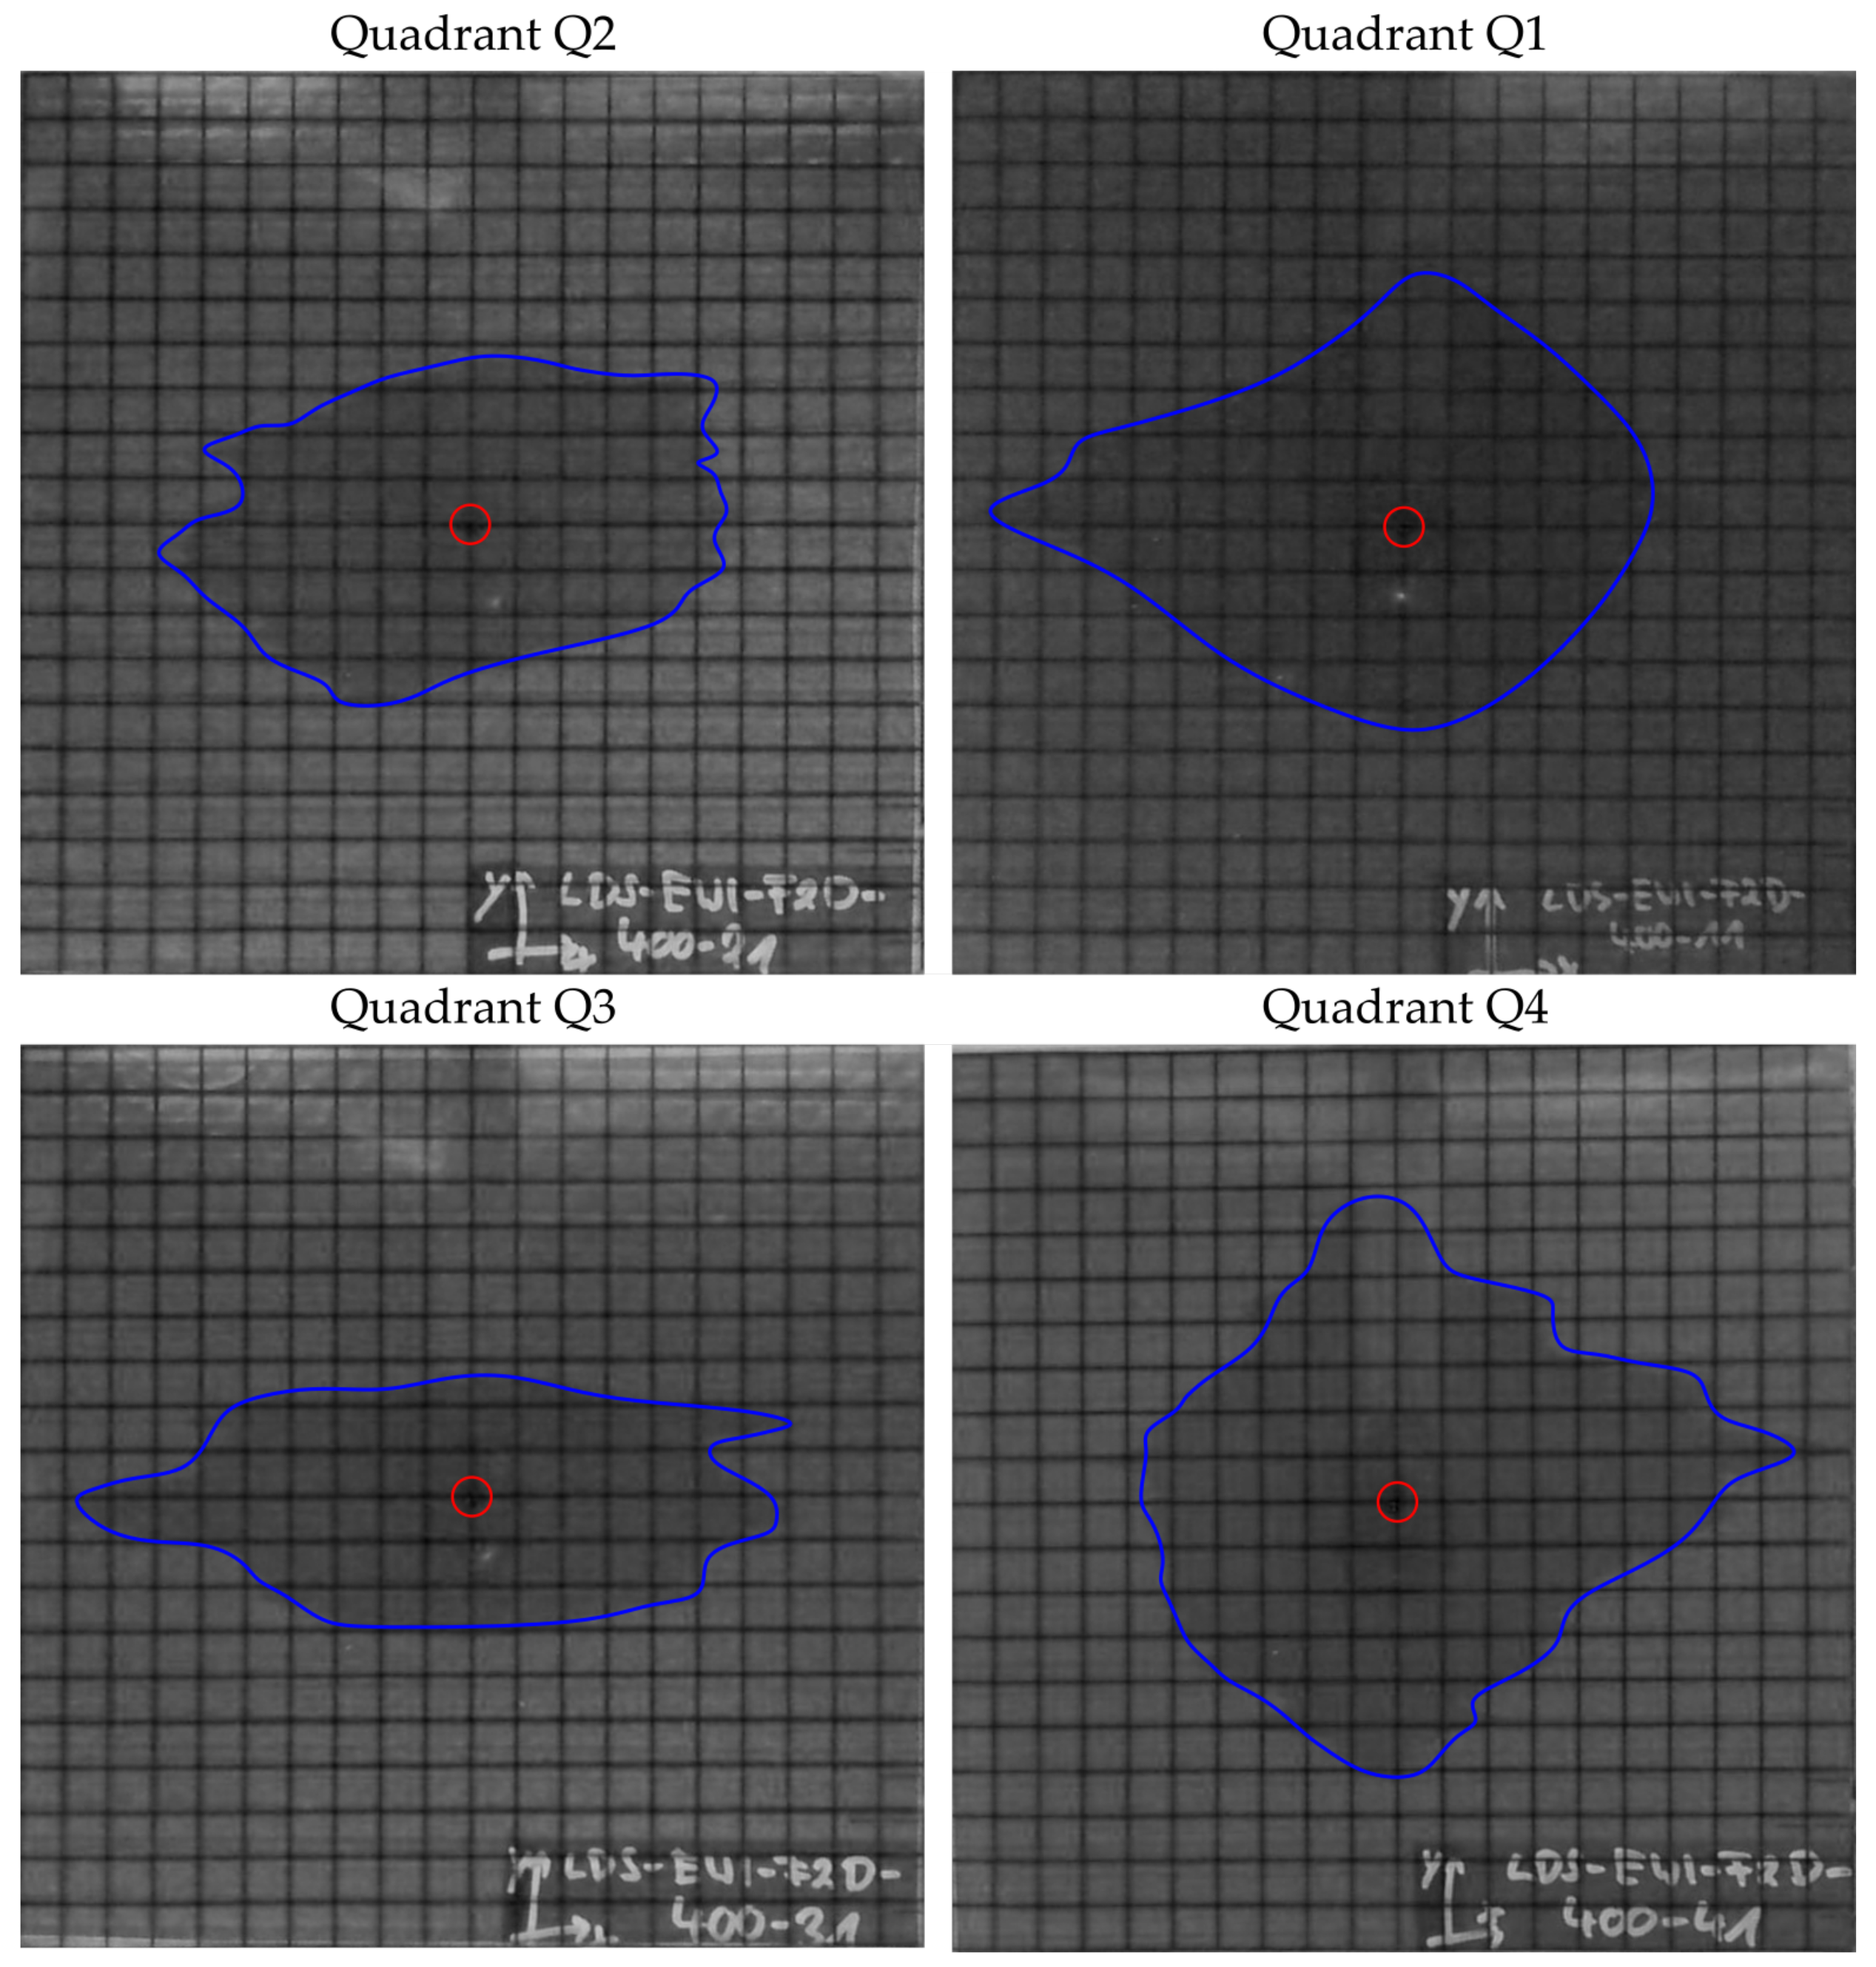
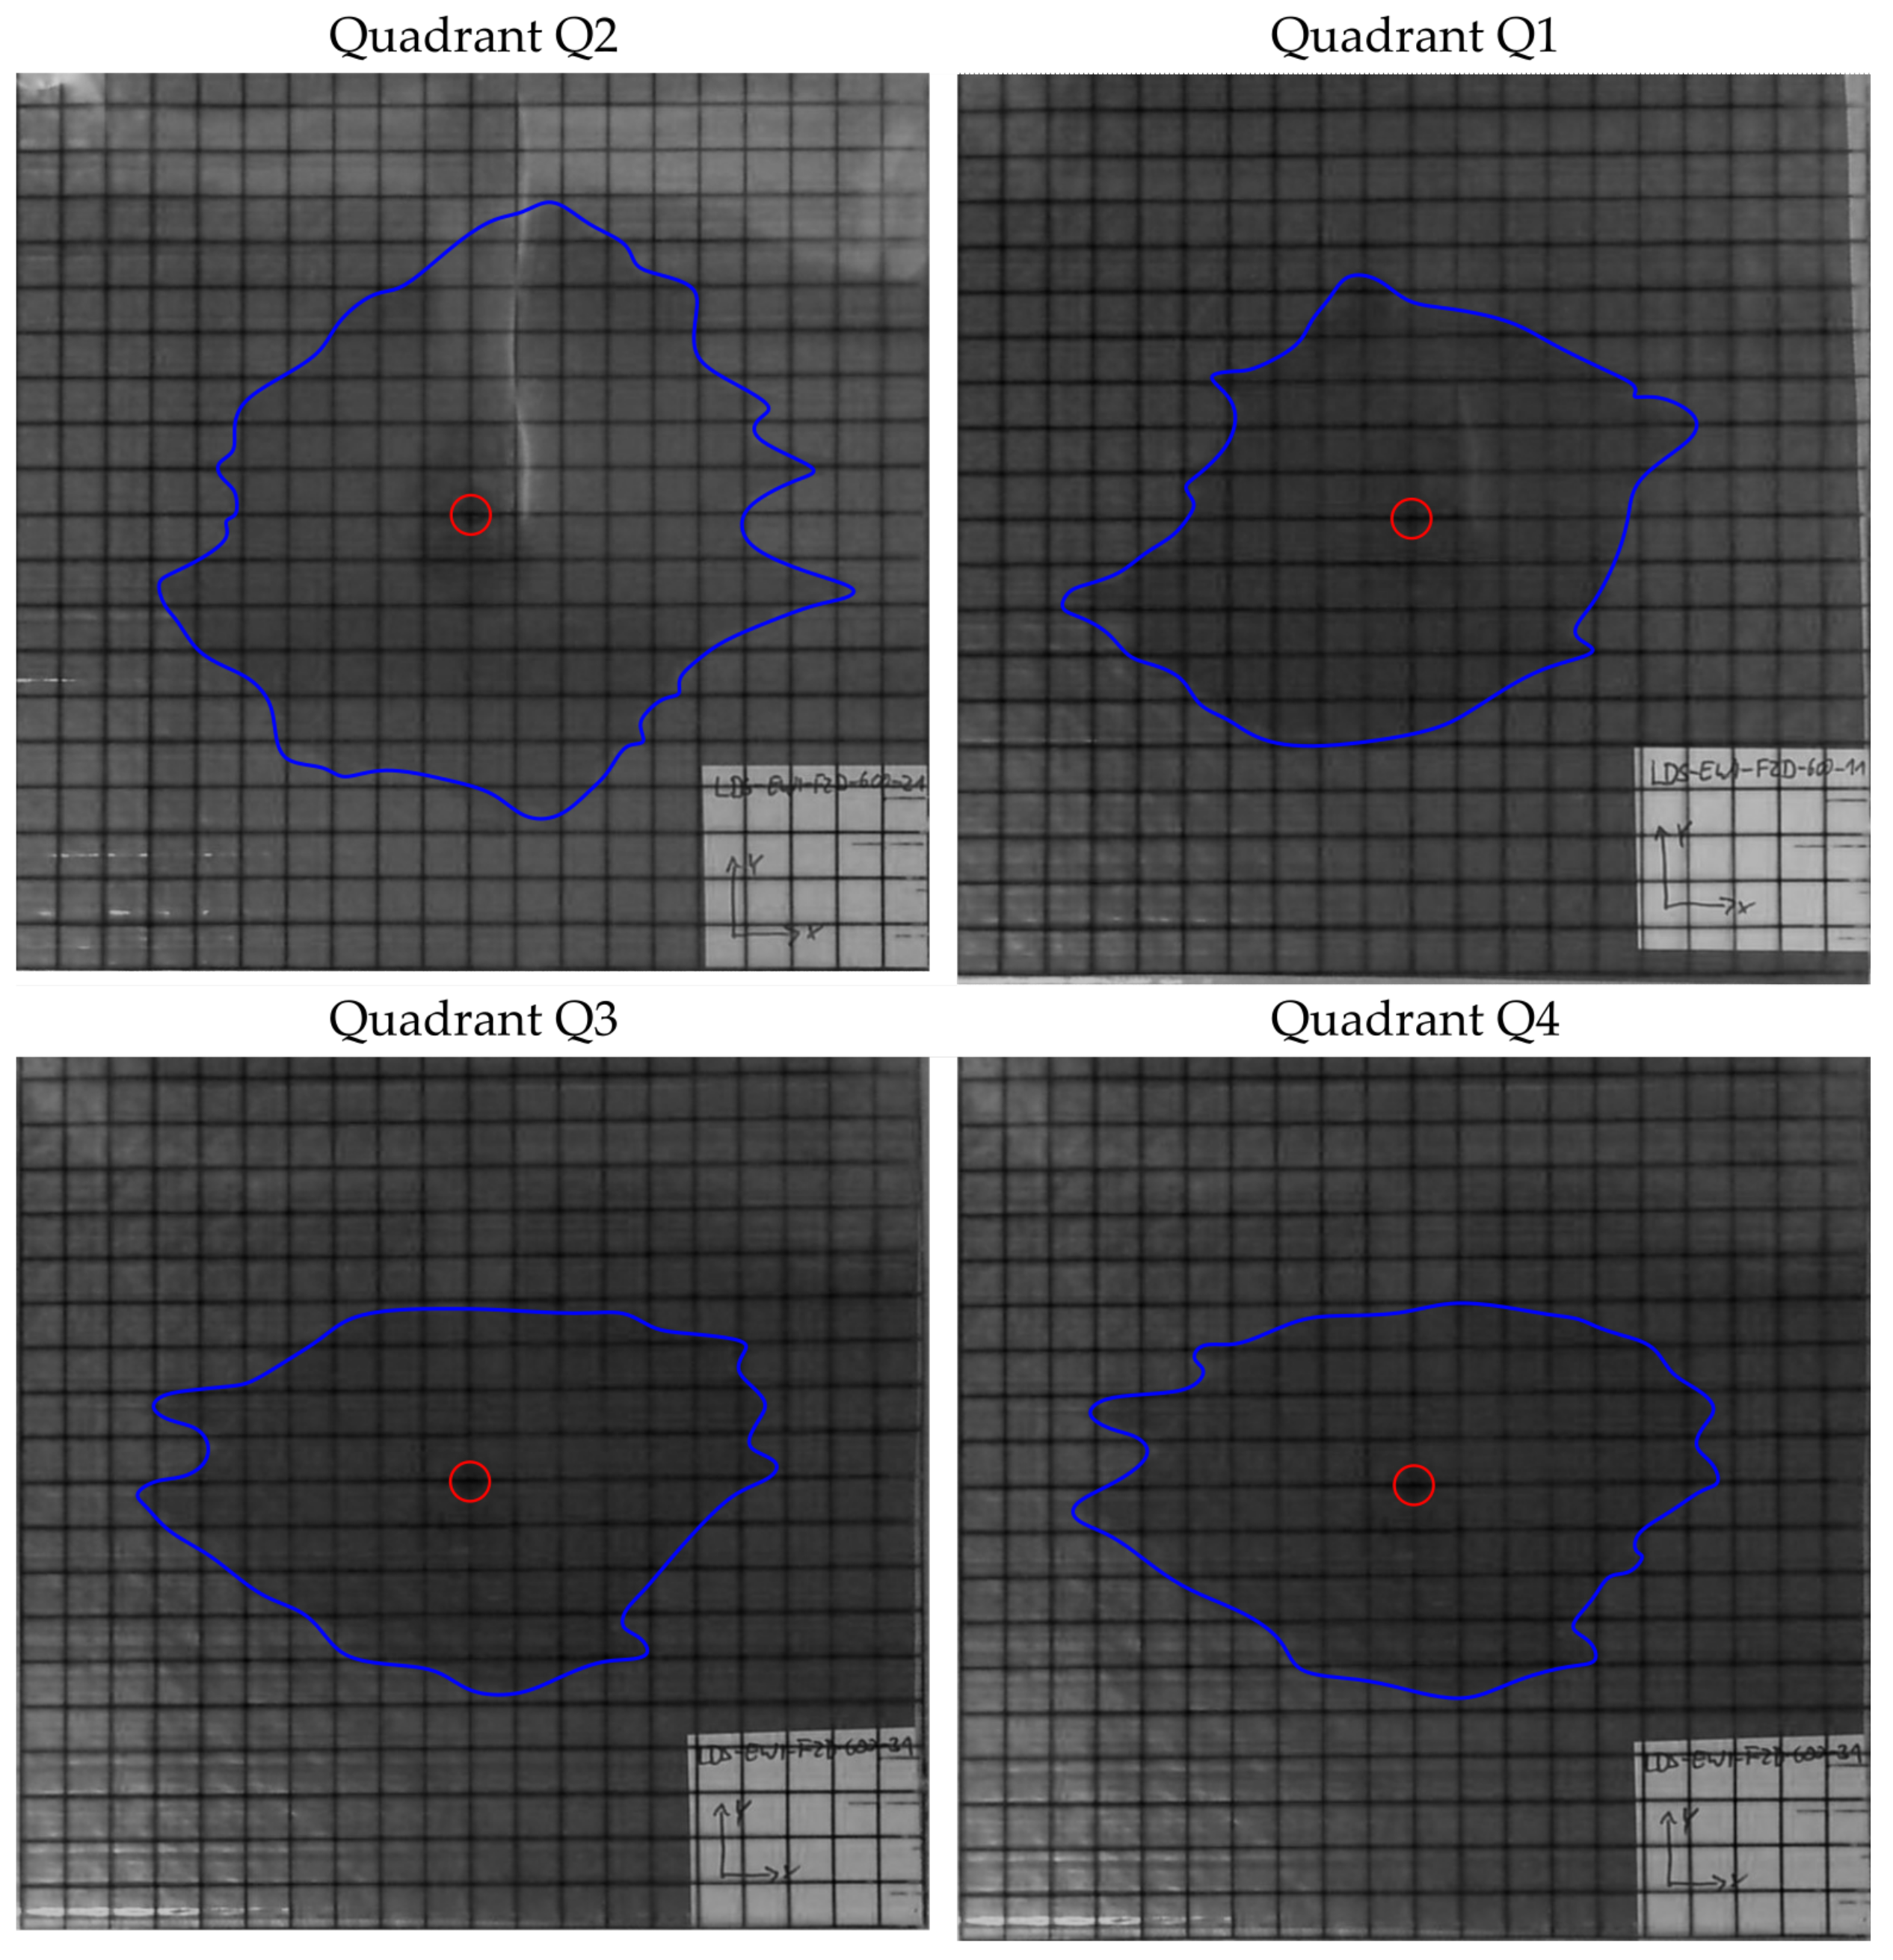
Figure 15. For each preform, the images were evaluated after 10 min of infusion time with the exception of the preform 6 and presented individually for each quadrant. In the case of preform 6, the permeability is so high that the infusion experiments were stopped at 90 s. The blue line marks the flow front and the red circle indicates the position of the pin-point gate.
In addition, the mass flow is shown in the
Figure 16. During the measurement, the mass flows for each quadrant have been determined with a scale. For the Quadrant Q4 at preform 1, the recording did not work and therefore the data are missing. The mass in the diagrams is negative because the removal of the test liquid from the measuring cup is recorded.
In order for an objective comparison of the 2D experiments to take place, the saturated area A and circumference U has been determined for each image (cf.
Table 4). The image processing program Inkscape (Inkscape 1.2.1) was used for this purpose. Since the circumference U and the area A are known, the shape factor FF is calculated according to Equation (
1) (cf.
Table 5).
In preform 1, the results of the mass flow are close to each othern (see
Figure 16). The largest saturated area is measured in quadrant Q3, but the circumference due to race tracking of the test liquid between the tows is also the largest (see
Figure 10).
For preform 2, there is a discrepancy between the determined saturated area (
Table 4) and the mass of the test liquid (
Figure 16). The area in quadrant Q4 is larger than the area in quadrant Q3. On the other hand, the mass in quadrant Q3 is approx. 0.2 g greater than in quadrant Q4.
The situation is similar for preform 3, where it affects quadrants Q1 and Q4. The area in quadrant Q4 is larger than the area in quadrant Q1 and for the masses it is the other way round.
Also for preform 4, the area in quadrant Q3 is smaller than in quadrant Q4, but the determined mass is larger in quadrant Q3 after 10 min.
The results of the area determination and the mass determination for the preform 5 are consistent. The area and mass are largest in quadrant Q2 and smallest in quadrant Q3.
Due to the deposition parameters of the preforms, preform 5 and preform 6 are comparable with each other. It is notable that preform 6 has a much larger saturated area after 90 s than preform 5 after 10 min. This is also shown by the measured test liquid quantity in
Figure 16. With preform 6, this is approx. 20 g after 90 s and thus approx. 10 times greater than with preform 5 at the same time.
Samples for the 1D infusion experiments are taken from the quadrants with the two largest shape factors FF. The closer the form factor is to 1, the more likely isotropic material behavior is present. This is due to the fact that an isotropic material forms a circular flow front around the pin- point gate. In the case of anisotropic or orthotropic behavior, an elliptical flow front is formed. In addition to the objective determination with the shape factor, all images are also visually inspected. This subjective inspection protects against orthotropic material behavior being overlooked by the shape factor FF. In the
Figure 5, the quadrants from which the samples for the 1D tests are taken are marked in bold. No 1D samples are examined for preform 6.
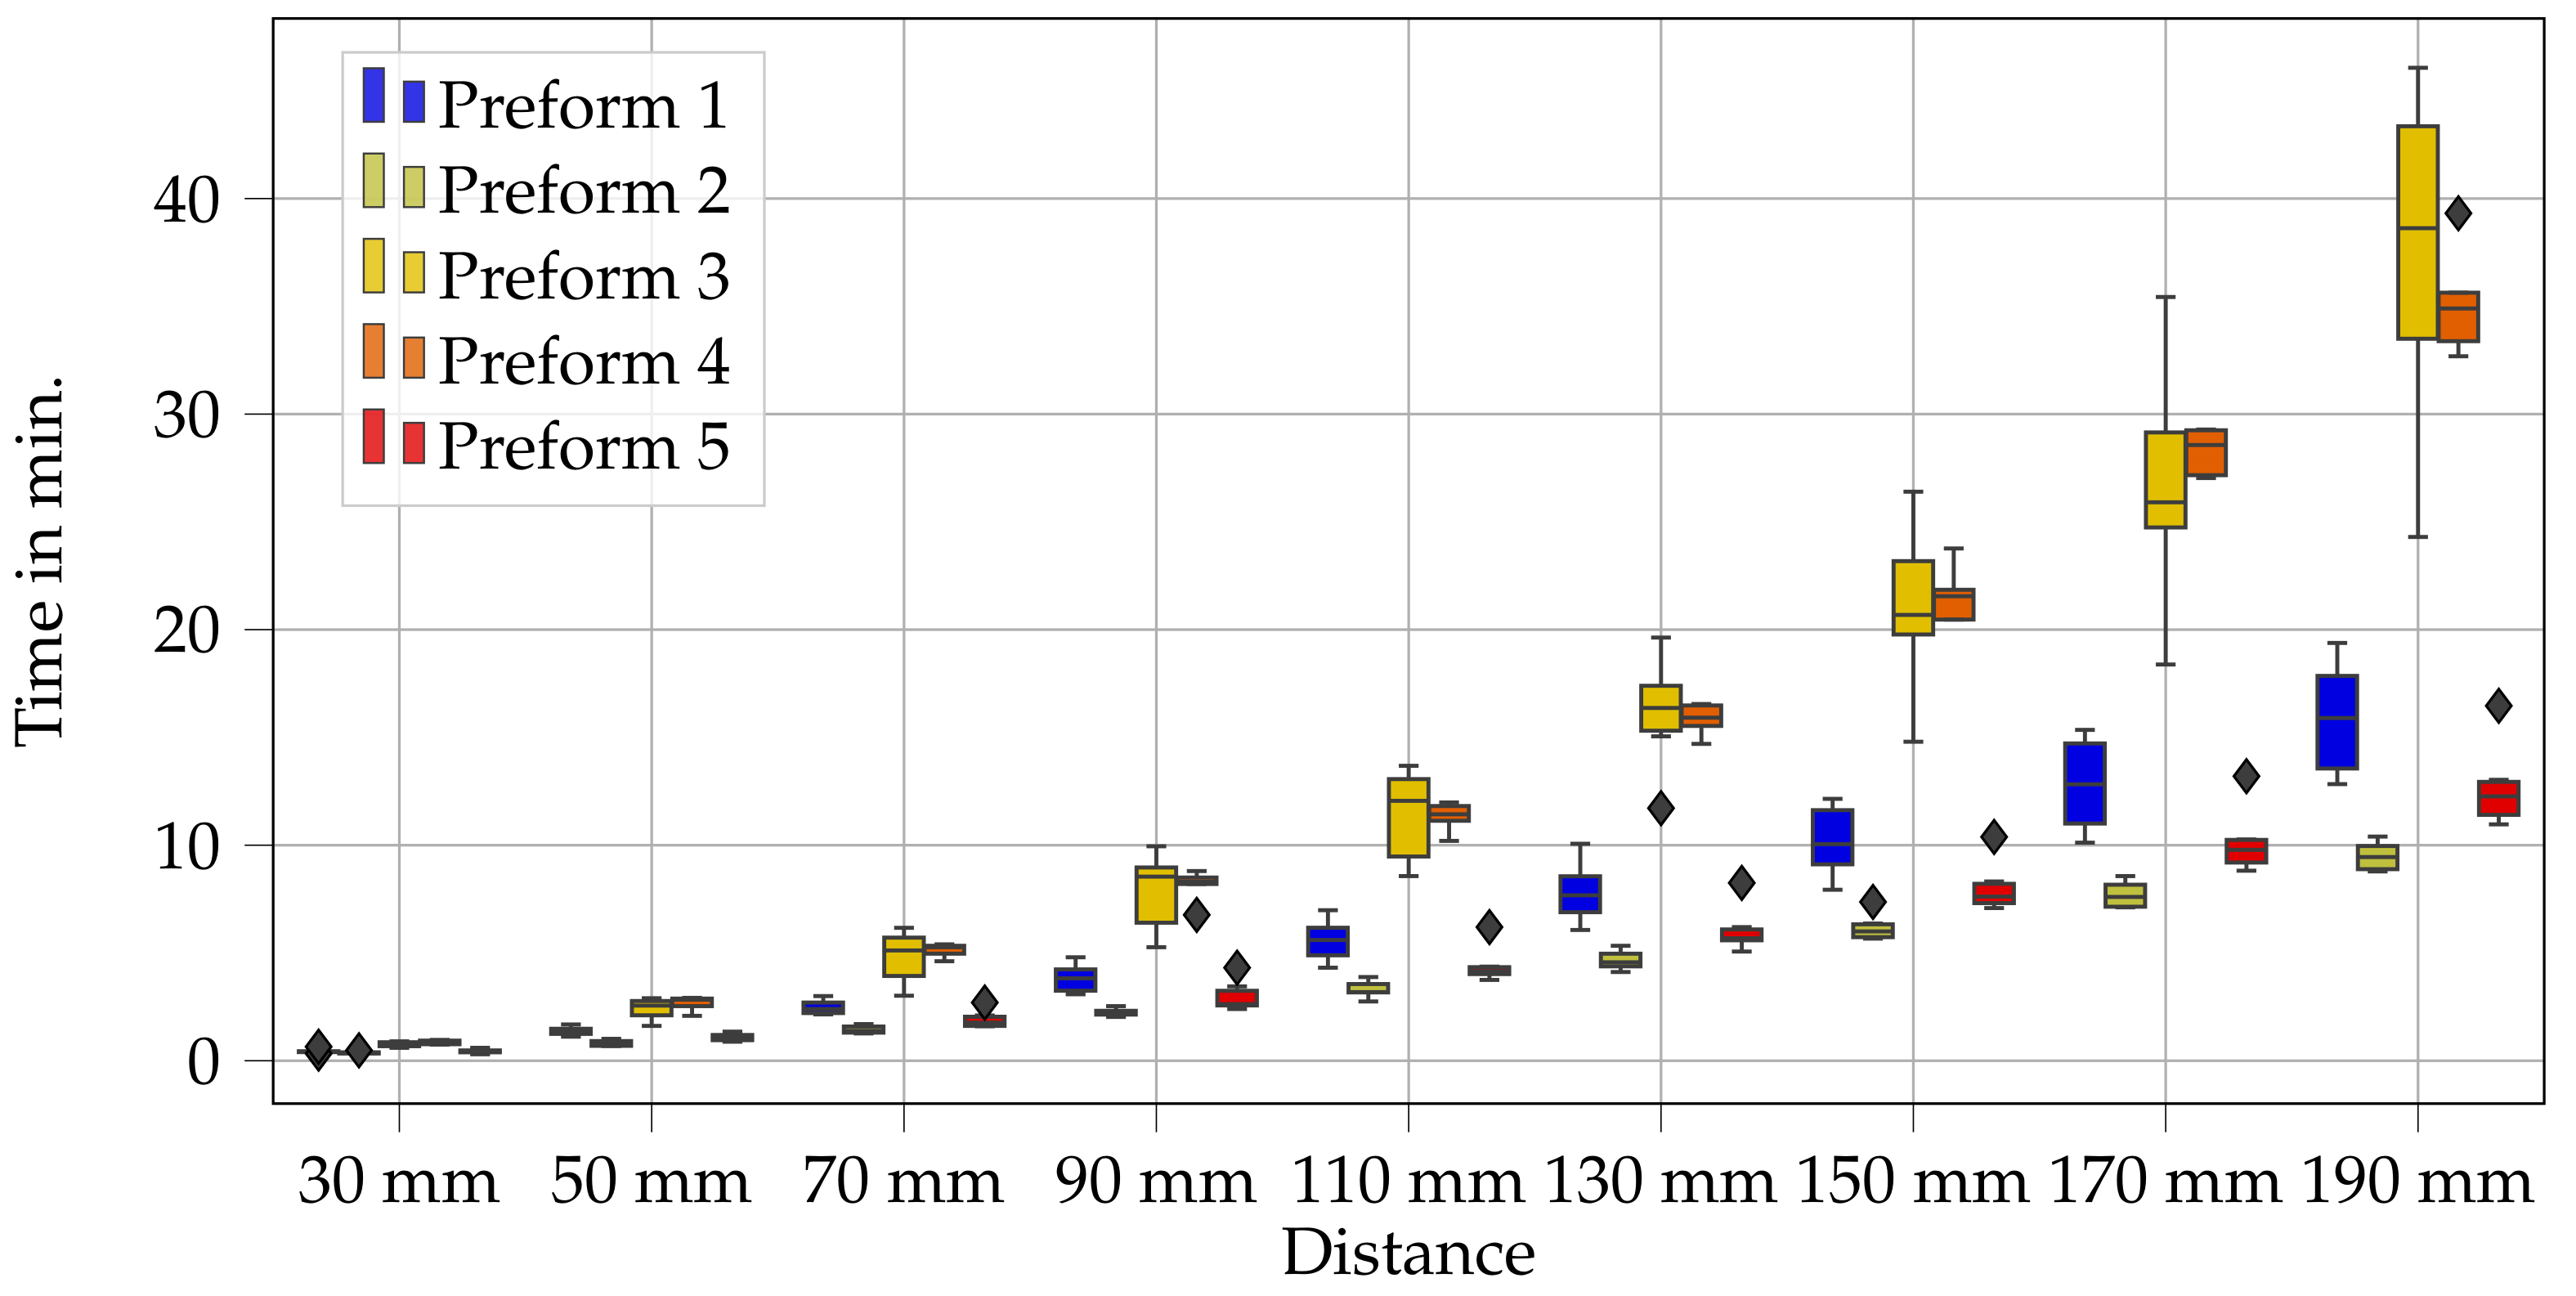
A total of six samples were taken from the almost isotropic area for the 1D investigations. The measured infusion times are shown in
Figure 17.
It can be seen that the same infusion time tendencies occur at all distances to the line gate. Preform 2 (lowest deposition temperature) has the lowest infusion time and preforms 3 and 4 have the longest infusion times (highest deposition temperature). At the highest deposition temperature, no influence of the compaction force can be seen because the infusion times overlap.
On the other hand, if the deposition temperature is low, the compaction force influences the infusion time (preform 1 and preform 2 (blue and light green)). A higher compaction force reduces the infusion time. It can also be seen that the scatter of the measured values decreases as the compaction force increases.
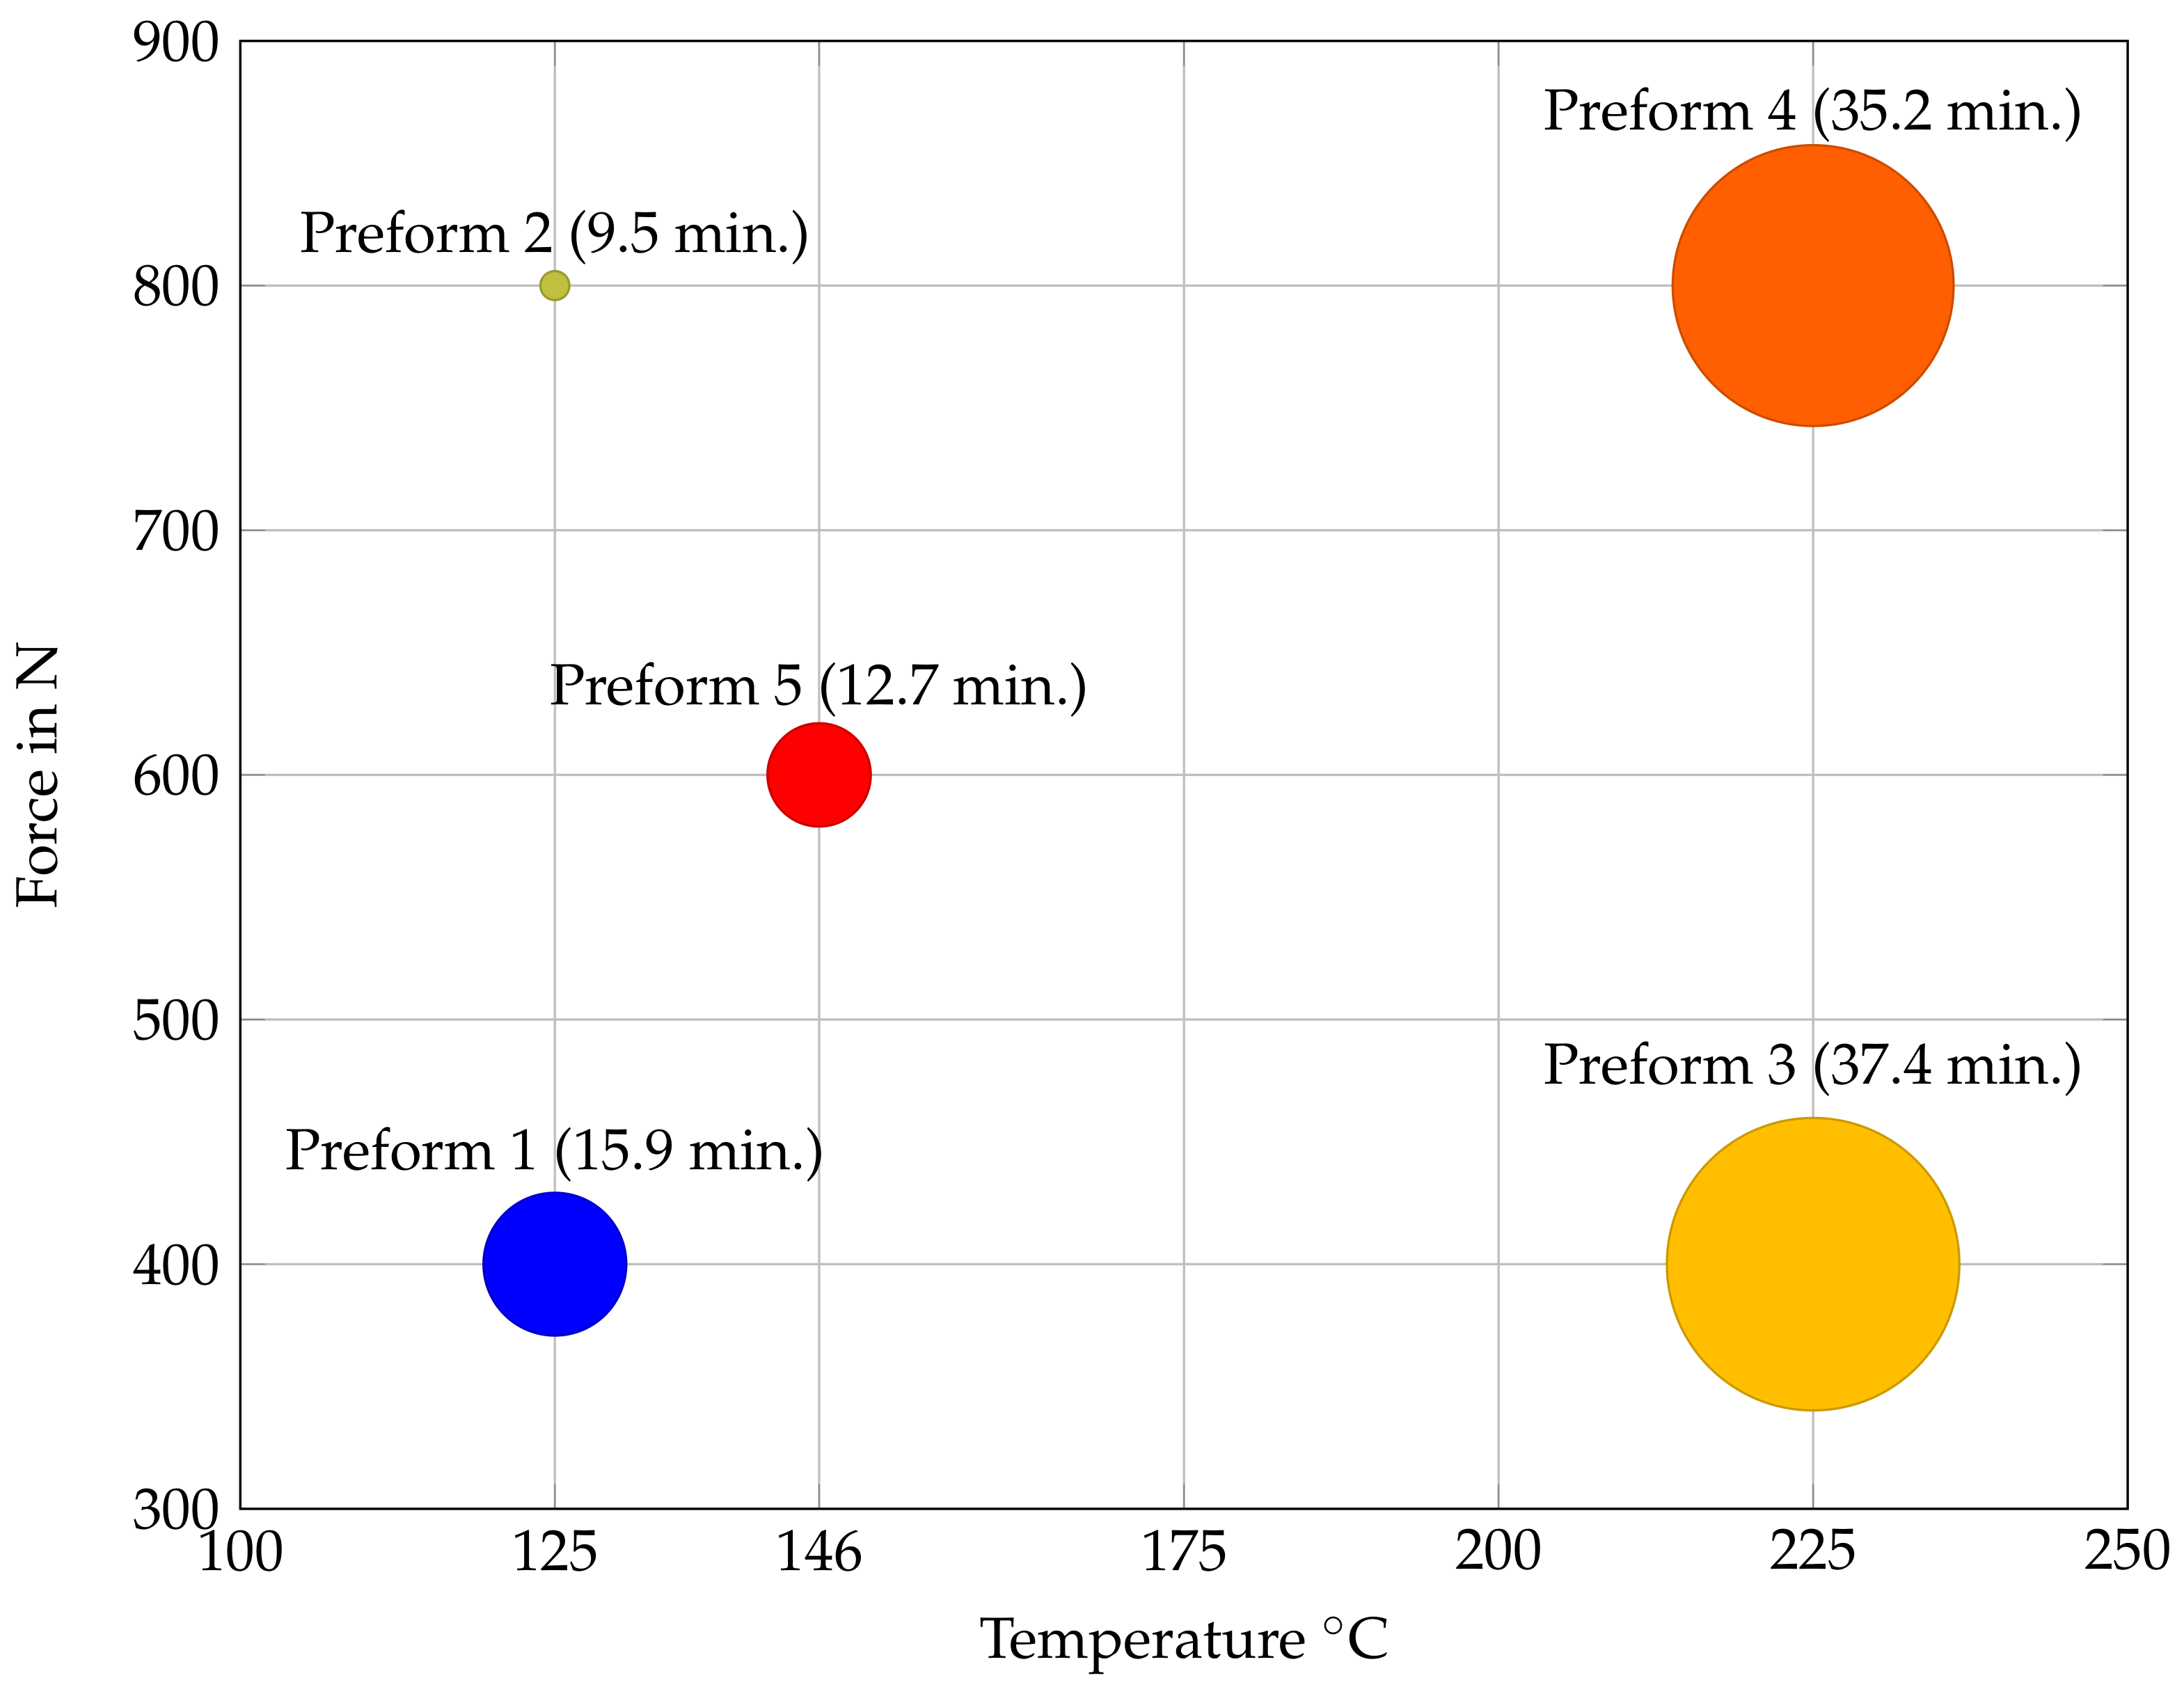
The described results of the infusion time determination are summarized in
Figure 18 for a distance of 190 mm. For each preform, the infusion time is represented by the size of the bubbles. On the
x-axis is the deposition temperature and on the
y-axis the compaction force.
4. Discussion
One aim of the studies is to determine the influence of deposition temperature and compaction force on the infusion properties. The permeabilities of the fiber material were not determined, but the infusion times were measured. The comparison of infusion times has two advantages over permeability determination. Depositioning in the DFP process is aimed at the production of large components, which are mostly produced in the vacuum infusion process and not in resin transfer molding (RTM). Thus, the data are closer to the real process. In addition, the experimental devices for determining infusion time are not as complex as permeameters and thus easier to replicate. The permeability determination is also not a standardized procedure and the deviations of the determined permeabilities are sometimes enormous [
20,
21,
31].
In principle, permeability could also be determined from the investigations carried out, but for this either the fiber volume content or the preform thickness would have to be known. Both variables are difficult to determine with the selected procedure, since the preform thickness changes during infusion as a function of the flow front position. This effect is due to the pressure equalization that takes place and the flexible vacuum bag. Therefore, for the permeability determination, molds with a given cavity are used [
12,
34,
35,
36].
For the tests, silicone oil was used, which, unlike epoxy resin, has the advantage of constant viscosity at constant temperature. Amico and Lekakou [
37] used both epoxy resin and silicone oil in determining permeabilities and found no difference in permeabilities. However, the investigations in current study were only carried out at room temperature. In particular, the binder could undergo a chemical reaction with the epoxy resin and behave differently at higher temperature. Studies do not show consistent results on this point [
38,
39].
When comparing preform 5 and 6, which have the same deposition parameters but are made of different fiber materials, there is a clear difference in the flow front propagation. For preform 6, the fiber material Solvay TX 1100 is used. The big difference to the fiber material Hexcel HiTape is the tow width. This is 6.15 mm for the Solvay material and 6.35 mm for the Hexcel material. This results in larger distances between tows with the Solvay material and the infusion behavior is positively influenced. In addition, the shape factors (
Table 5) and the (
Figure 15) show that the spread of the flow front in the four quadrants is much more homogeneous than with the other preforms.
This influence is also known from literature. Effects on the mechanical properties follow from literature [
10].
It should be noted that the preform 1 (lowest temperature, lowest compaction force) does not have the shortest infusion time and thus highest permeability. Rather, it can be seen that in the low-temperature range, an increase in the compaction force also leads to an increase in permeability.
It is known from [
40] that the binder between the individual layers can create channels for the flow of liquids and prevent nesting effects. At the same time, however, the binder also reduces the pore space available for the fluid. Permeability depends strongly on the porosity of the fiber material. Here, not only the size of the pores plays a role, but also the distribution and the network that is formed [
40] When depositing with a higher force, the heat transfer from the deposited layer to the layers below is higher than with a lower force. This is due to the increased compaction. Thus, the thermoplastic veil of the HiTape material is melted differently than with lower force. As a result, a different network is formed, which in this case influences the impregnation of the test fluid. If the temperature at deposit is at a higher level, the force at deposit has a lower influence. This formulated hypothesis must be proven in further experiments.
However, this effect is much smaller than, for example, the enlargement of the gaps [
23].
5. Conclusions
The presented method and results show that it makes sense to divide a large preform into quadrants and to do 2D infusion experiments with samples from the quadrants first. Thus, on the one hand, a statement can be made about the homogeneity of the deposit and, on the other hand, samples can be specifically evaluated for 1D infusion tests. Above all, the results of the 1D tests show that the influence of the temperature is greater than the influence of the contact force. Thus, the results represent a benefit for future studies. However, with the 2D studies it is also shown that with larger gaps between the tows the permeability is significantly increased and at the same time more homogeneous infusion properties are present. The adjustment of the gap width should be pursued for the future design of structures. Here, it is particularly interesting in what proportion the permeability can be increased as a function of the gap width and what effects on the mechanical properties arise. In the discussion of results, the hypothesis has been formulated that the distribution of porosity and the size of individual pores influence permeability. Thus, the question arises whether a few large pores or many small pores lead to higher permeability. This question will be answered in future studies.


