Article

Dielectric Properties of Wood-Polymer Composites: Effects of Frequency, Fiber Nature, Proportion, and Chemical Composition

1
Centre de Recherche sur les Matériaux Renouvelables (CRMR), Université Laval, Québec, QC G1V 0A6, Canada
2
Forest Research Institute, Université du Québec en Abitibi-Témiscamingue (UQAT), 445 Boulevard de l’Université, Rouyn-Noranda, QC J9X 5E4, Canada
3
École Nationale d’Ingénieurs de Sfax (ENIS), Laboratoire des Systèmes Électromécaniques (LASEM), Cité el Habib BP 29, Sfax 3052, Tunisia
*
Author to whom correspondence should be addressed.
J. Compos. Sci. 2021, 5(6), 141; https://doi.org/10.3390/jcs5060141
Submission received: 30 April 2021 / Revised: 19 May 2021 / Accepted: 21 May 2021 / Published: 24 May 2021
(This article belongs to the Special Issue Sustainable Biocomposites)

Abstract

:
The characterization of the dielectric properties of wood–polymer composites (WPCs) is essential to understand their interaction with electromagnetic fields and evaluate their potential use for new applications. Thus, dielectric spectroscopy monitored the evolution of the dielectric properties of WPCs over a wide frequency range of 1 MHz to 1 GHz. WPCs were prepared using mixtures of different proportions (40%, 50%, and 60%) of wood and bark fibers from various species, high-density polyethylene, and maleated polyethylene (3%) by a two-step process, extrusion and compression molding. Results indicated that wood fibers modify the resistivity of polyethylene at low frequencies but have no effect at microwave frequencies. Increasing the fiber content increases the composites’ dielectric properties. The fibers’ cellulose content explains the variation in the dielectric properties of composites reinforced with fibers from different wood species. Indeed, composites with high cellulose content show higher dielectric constants.

1. Introduction

The production and application of thermoplastic polymers reinforced with wood and natural fibers have increased considerably [1,2,3]. The application fields for these materials are practically unlimited. Among others, wood–polymer composites (WPC) are used in window and door profiles, decking, garden furniture, and the automotive industry [4]. Wood or natural fibers are interesting for WPC manufacturing, considering their low production cost, ease of processing, biodegradability, and availability. Wood fibers can be added to commodity thermoplastic matrices in considerable amounts, offering economically advantageous solutions [1,2,3,5,6,7,8,9] and environmental benefits [10]. However, WPCs are not commonly used in electrical engineering due to a lack of knowledge of their behavior in electrical fields of various intensities and frequencies and at different temperatures [11]. Only a few reports have investigated the variation in the electric and dielectric properties of WPCs [11,12,13]. The dielectric properties of WPCs are influenced by several factors such as the frequency, the matrix, the nature of the fiber (wood species), and the mass concentration of the reinforcements dispersed in the polymeric matrix. A comprehensive analysis of various factors influencing the dielectric properties of WPCs would be helpful to determine their suitability for electromagnetic applications such as insulators, embedding materials, and substrates for antenna design [14,15].
The WPC dielectric properties strongly depend on the frequency of the applied electric field. The dielectric constant (ε′) and the loss factor (ε″) decrease with increasing frequency from 0.01 Hz to 100 MHz [13]. These properties also vary depending on the nature of the matrix. Comparing the results obtained on samples containing the same proportion of wood fibers but with different matrices, the differences in the values of ε′, ε″, and tan δ are greater in the low-frequency range. Notingher et al. [11] found that WPCs from polypropylene have higher dielectric properties than polyethylene. The more the compatibility between the polymer and the wood fiber, the more efficient the interaction between the polymer and the wood fiber. The filler particle size is also an influential factor in WPC dielectric properties. Azlan et al. [14] found that composites with a particle size of 150 µM present a suitable material to be used as a substrate for antenna fabrication with low permittivity and constant low tangent loss on all frequencies in the X band spectrum from 2.08 to 3.7 GHz.
Wood fiber reinforcement has a significant effect on WPC dielectric properties [11,12,13,16]. Cellulose hygroscopic polar groups explain the increase in the dielectric constant with the rise in wood fiber content. Porebska et al. [16] also reported that the presence of cellulose fibers within the WPC material leads to an increase in the dielectric constant and the loss tangent. However, only a few studies have investigated the impact of fiber variability on the variation in the dielectric properties of WPCs. Therefore, the objective of this study was to examine the variation in the dielectric properties of high-density polyethylene reinforced by wood fibers, according to the microwave frequency and the wood and bark proportion.

2. Theoretical Background

Dielectric spectroscopy measurement consists of placing a dielectric between two electrodes, then applying a sinusoidal voltage of fixed frequency to the terminals of the two electrodes, and measuring the resulting impedance and phase shift of the induced current.
The electrical voltage u(t) applied to the dielectric material has a low amplitude U1 and a pulsation equal to 2πf (Equation (1)).
(t) = Re (U*(iωt)),
where U* = U1.
This voltage induces a current i(t) of the same pulse ω. Since the material is not a perfect dielectric (purely capacitive), there is a phase shift φ ≠ π/2 between u(t) and i(t) (Figure 1). Thus, the current is given by the following Equation (2):
(t) = Re (I*(iωt)),
where I* = I1 exp(−iφ).
The ratio of voltage/current amplitudes defines the modulus of the series impedance |Z*(ω)|; the phase shift between voltage and current determines the real and imaginary parts of the complex impedance Z*. The complex impedance is then given by the following Equation (3):
Z*(ω) = U*(ω)/I*(ω) = U1/I1·()
Complex capacitance C*(ω) and complex permittivity ε*(ω) are then calculated from Z*(ω) (Equations (4) and (5)).
C* = 1/iωZ*·(ω),
ε*(ω) = C*/C0,
where C0 is the empty cell capacity (C0 = ε0S/e) and S and e are the surface and thickness of the sample, respectively.
The complex permittivity ε* is a two-component number (Equation (6)), in which the real component ε′ represents the ability of a material to store energy and the imaginary component ε″ represents the rate of energy loss in the material. The loss tangent (tan δ) is defined as the ratio of the loss factor (ε″) to the dielectric constant (ε′) (Equation (7)) and is an important measure to express how well the absorbed energy is converted into heat.
ε* = ε′ − i ε
tan δ = ε′/ε
The insulation resistance of a material depends on its resistance; thus, the resistivity (ρ) can be calculated using Equation (8).
ρ = R·A/t,
where R is the resistance (Ω), A is the area of the cross section, and t is the thickness of the sample.

3. Materials and Methods

Wood particles from aspen (Populus tremuloides Michx.), and Jackpine (Pinus banksiana Lamb.), along with aspen bark particles, were used for WPC preparation (Table 1). The particles were fragmented using a Thomas Wiley Mill Model 4 (Swedesboro, NJ, USA). Fibers were classified using an M.S. Tylor classifier. Fibers passing through the 300–150 µm class, oven-dried at 103 °C for 24 h, were used for WPC manufacturing.
The cellulose contents of the studied wood and bark fibers, reported previously by Migneault et al. [18], were used to estimate the cellulose content of the manufactured composites (Table 1). High-density polyethylene (HDPE) DOW DMDA-8007 NT 7 (density = 0.965; melting temperature = 133 °C) was used. Maleated polyethylene (MAPE) E226 from fusabond (density = 0.93; melting temperature = 120 °C) served as a coupling agent. The MAPE proportion was maintained constant at 3%.
Composites were prepared in two stages: compounding for pelletizing, followed by compression molding. A counter-rotating intermeshing conical twin-screw extruder (Thermo Scientific HAAKE PolyLab OS Rheodrive 7 with a Rheomex OS extruding module; Thermo Electron GmbH, Karlsruhe, Germany) was used to compound fibers, HDPE, and MAPE. The screws were 30 mm in diameter at the large end and 340 mm long. The screw speed was 30 rpm, and the barrel and die temperature was 155 °C. A 3-mm-diameter die was used. The extruded material was cooled in a water bath and ground into 3-mm-long pellets.
The pellets served for WPC manufacturing. Briefly, 1 mm plates of 25 cm × 25 cm were prepared by compression molding according to ASTM D4703-03 [19] using a Carver press (3012-NE, HC Press; Wabash, Indiana, USA) with two heated platens at 195 °C. A mold filled with pellets was preheated for 5 min; the pellets were then compressed for another 5 min under a constant load of 7000 lb. (Figure 2). The plates were then cooled at a cooling rate of 15 °C/min. The obtained plates served to extract disc samples of 9.5 mm diameter and 1 mm thickness for dielectric property measurements.
A broadband dielectric spectrometer (BDS) supplied by Novocontrol GmbH (Montabaur, Germany) measured the dielectric properties. The experimental setup is associated with an Agilent E4991 impedance analyzer that operates over a frequency range between 1 MHz and 3 GHz. It includes a sampling cell in which the sample is inserted between two electrodes. A Quatro system controlled the temperature and allowed measurements according to isotherms ranging from −160 to 250 °C. A PC with WinDETA and WinFit software controlled the entire system, enabled the execution of the test data, and identified the various parameters. The obtained results were handled by setting the frequency and varying the temperature or by producing isothermal spectra by fixing the temperature and changing the frequency.
The dielectric property measurement accesses several dielectric electrical properties, in particular the dielectric constant ε′, the loss factor ε″, the loss tangent tanδ, the loss angle δ, the electrical conductivity σ, and the electrical resistivity ρ. For each formulation, measurements were conducted in three replicates. Standard errors for the estimated parameters were lower than 10%, indicating excellent precision and replication of the obtained measurements.
The dielectric properties (ε′, ε″, tanδ, ρ) were subjected to the ANOVA procedure and a customized factorial model using IBM SPSS Statistics version 27. The factors studied were fiber type (aspen wood, aspen bark, and jack pine wood), fiber proportion (40%, 50%, and 60%), and selected frequency (from 1 MHz to 1 GHz). All factors were fixed. Effects and differences between means were considered statistically significant at p < 0.05. We verified the ANOVA assumptions using graphical diagnostics (i.e., residual vs. predicted, distribution of observed values) and the Levene test for equality of variances.

4. Results and Discussion

Univariate analysis of variance for dielectric properties was performed to study the effect of frequency, fiber proportion, and fiber type. ANOVA showed that these variables had a significant effect on the dielectric constant ε′, the loss factor ε″, the loss tangent tanδ, and the electrical resistivity ρ. A significant fiber type × proportion interaction suggests that the effect of fiber proportion on ε′ and tan δ varies from one fiber type to another. The results also showed that the dielectric constant and resistivity are significantly affected by the interaction between fiber type and frequency. Moreover, a statistically small but significant second-way interaction affected ε′ and ρ, indicating that the effect of fiber content varies depending on the frequency (Table 2).

4.1. Effects of Frequency and Fiber Content

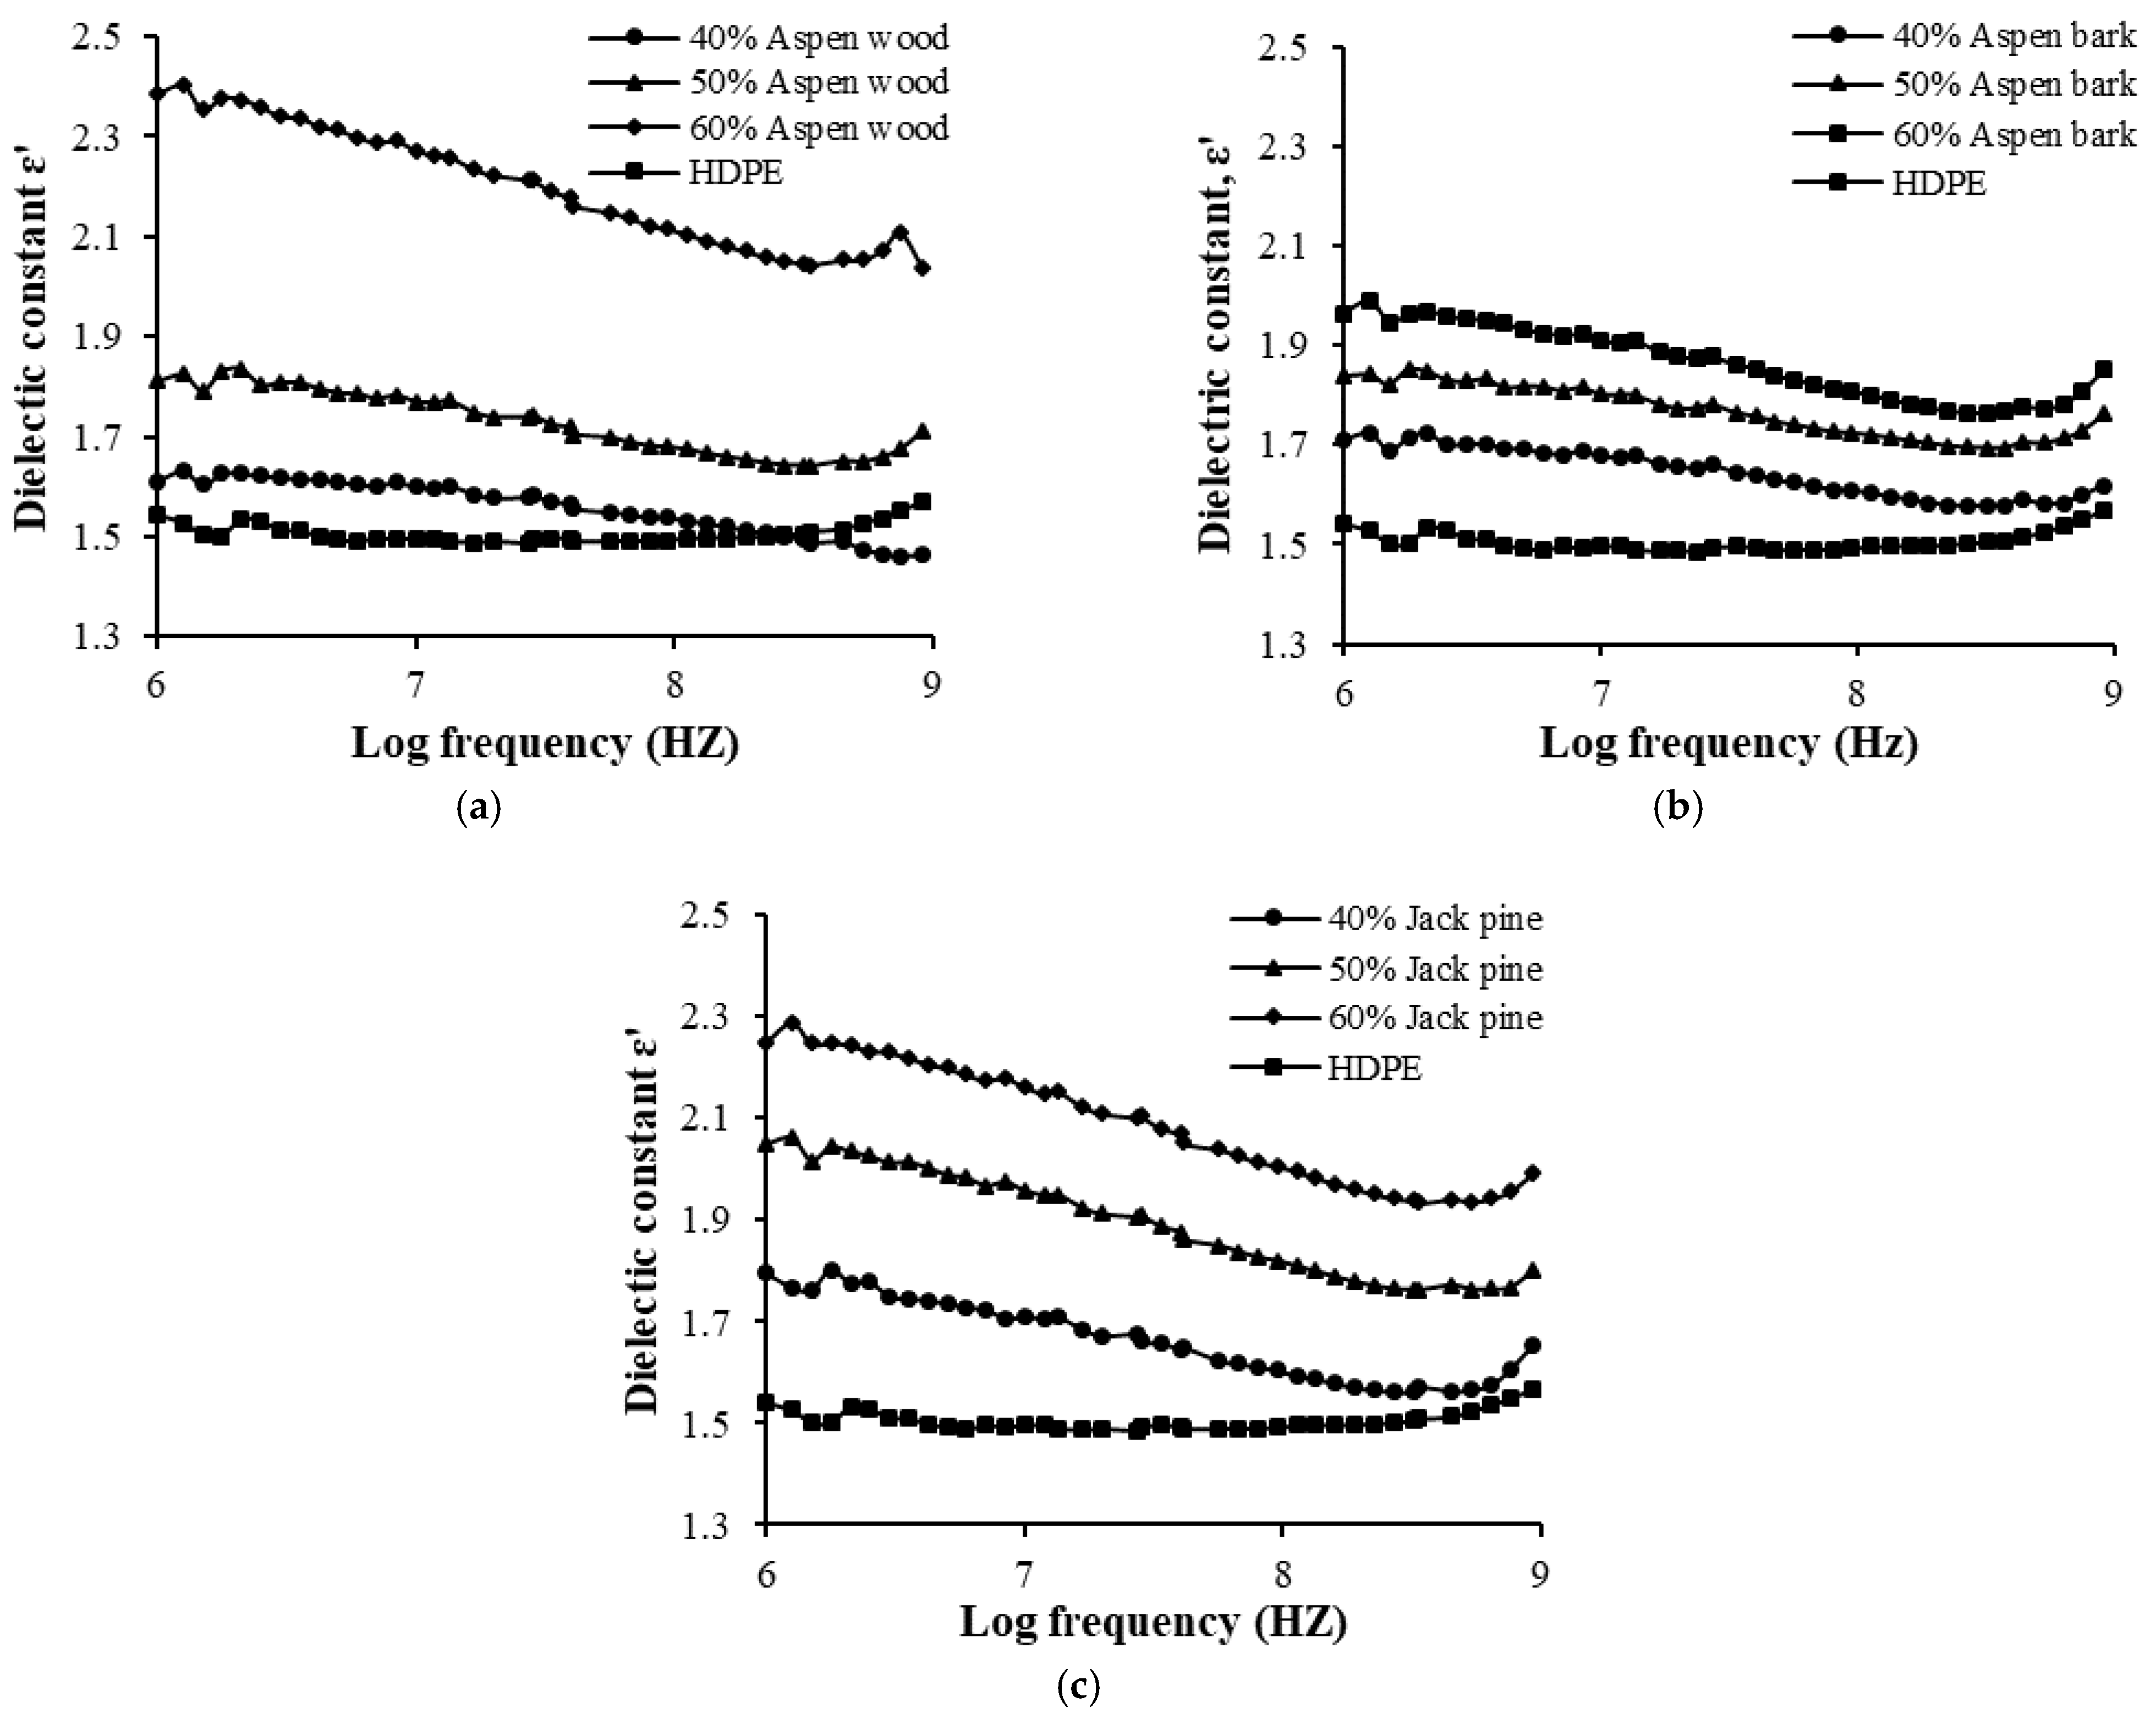
Figure 3a–c shows the evolution of the dielectric constant as a function of frequency for polyethylene composites reinforced with various lignocellulosic fibers, measured at constant temperature (23 °C). The dielectric constant (ε′) increased with a decrease in the frequency for all composites. This result is similar to that obtained for low-density polyethylene composites reinforced with glass and sisal fibers [15,20]. The presence of the fibers induces the appearance of a plateau in the form of a decreasing profile at high frequencies, characteristic of a dipole relaxation. The decrease in the dielectric constant is due to the damping of the high-frequency dipolar polarization. At low frequencies, the orientation of the molecule is possible. However, at high frequencies, the rotational motion of the polar molecules in the composite is not fast enough to reach equilibrium with the applied field. Accordingly, the dielectric constant seems to be decreasing with increasing frequency [21].
Figure 3a–c shows that the dielectric constant increased with the addition of wood fiber in high-density polyethylene resin. These results are consistent with ANOVA, indicating that the proportion of fiber affects ε′ significantly. This behavior can be explained by the higher dielectric constant of lignocellulosic fibers than the base polyethylene resin, resulting in the higher dielectric constant of the composites. Indeed, pure polyethylene is a non-polar hydrophobic material, which shows ionic and electronic polarization. As shown in Figure 3, its dielectric constant remained almost constant over the entire frequency range, with a slight increase at high frequencies. The filling of the hydrophilic wood fibers with a polymer involves introducing polar groups into the non-polar material, giving rise to dipolar polarization. Therefore, the overall WPC polarization is the sum of the electronic, ionic, and dipole polarization, which results in a higher dielectric constant compared to pure polyethylene.
Moreover, the water absorption factor can contribute to the increase in the dielectric constant of WPCs with fiber content. Guo et al. [22] reported that the water uptake of HDPE composites with wood fiber increases significantly with the fiber content because of the interfacial voids between the fiber and the polymer matrix. The wood particles at the surface absorb water, resulting in a greater dielectric constant, as the dielectric constant of water is high. Similar results were obtained by Porebska et al. [16]. The authors reported that the increase in the dielectric constant of polyester is more pronounced than that of polypropylene due to the higher water uptake of polyester at room temperature. These results confirm the important relationship between water absorption and the dielectric behavior of WPC materials.
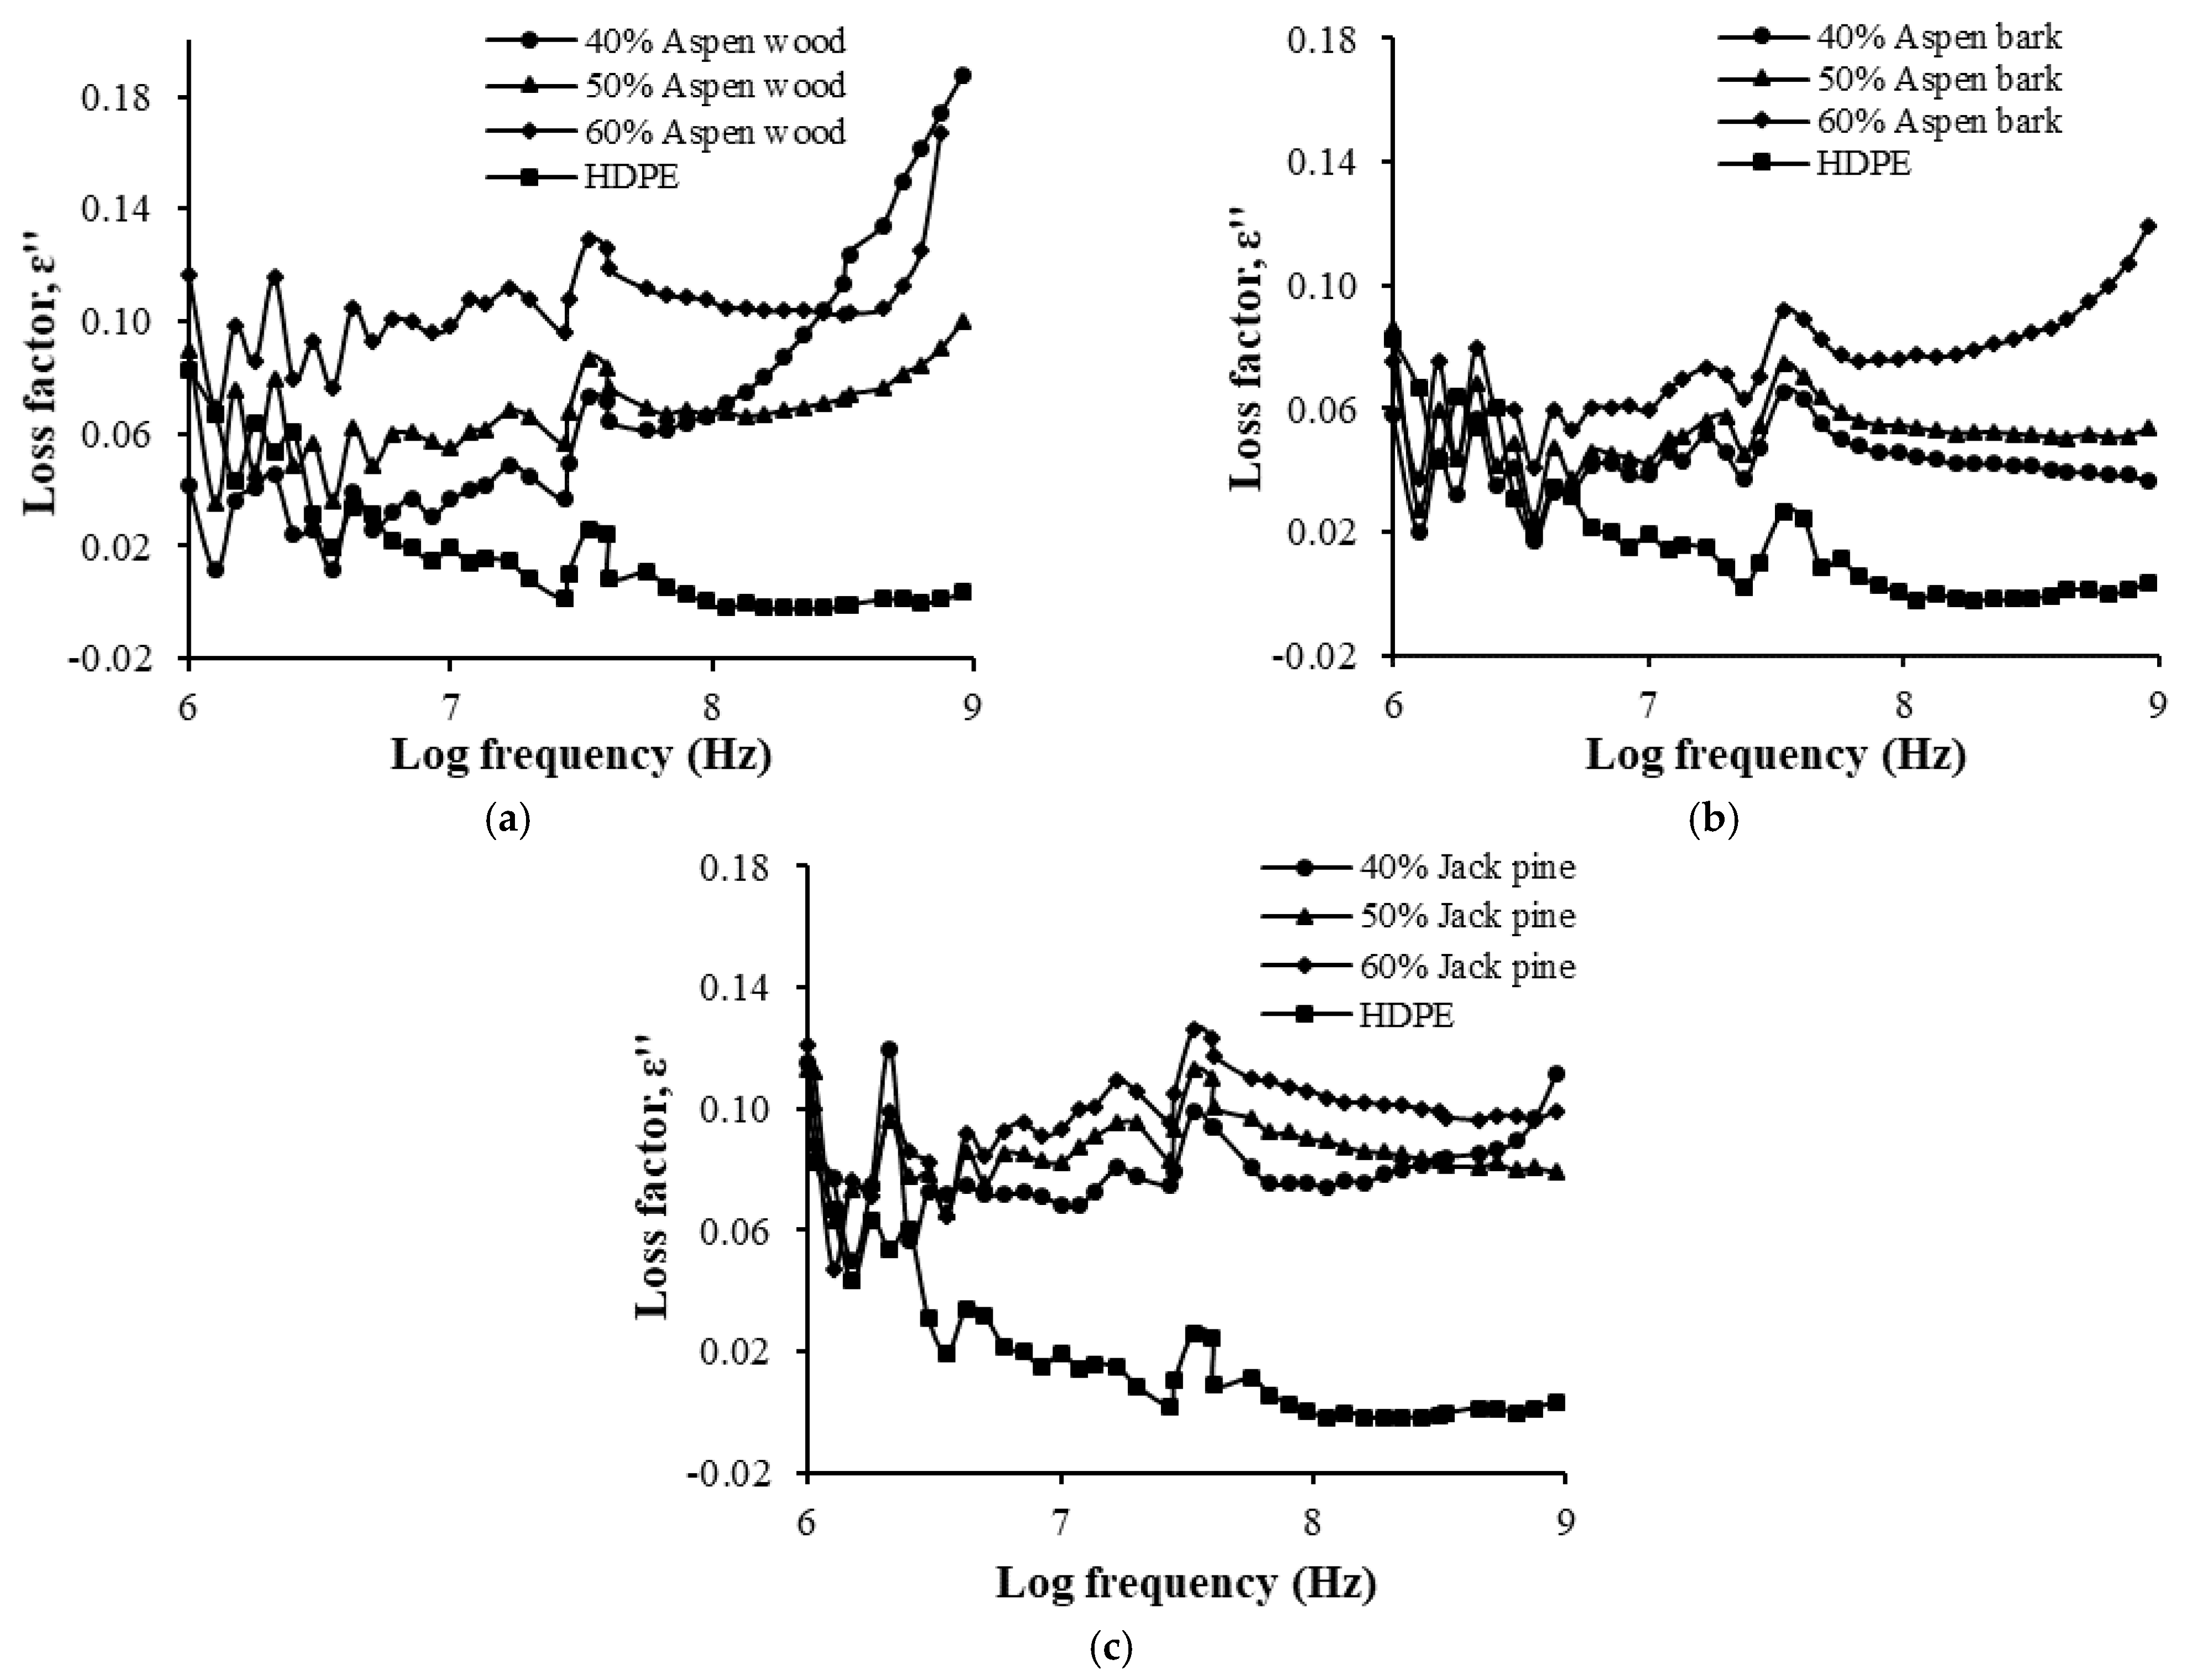
Figure 4a–c illustrates the variation of ε″ with frequency with different contents of lignocellulosic fibers in the composite. The peak at 107.5 Hz showed a relaxation. This peak was found for all composites in the same region. Increasing the fiber content from 40% to 60% increased the loss factor. The incorporation of fibers increased the polarizability of the material by adding polar groups, which led to an increase in the energy stored in the composite, accompanied by a high-energy dissipation. In addition, the crystallinity of pure HDPE resulted in high resistivity and low energy dissipation. The addition of fibers to the HDPE matrix induces the disruption of the arrangement of molecules, and the amorphous region becomes more conductive due to its ability to absorb water. Therefore, the incorporation of fibers increases the conductivity, leading to a higher loss associated with relaxation of the amorphous phase [23].
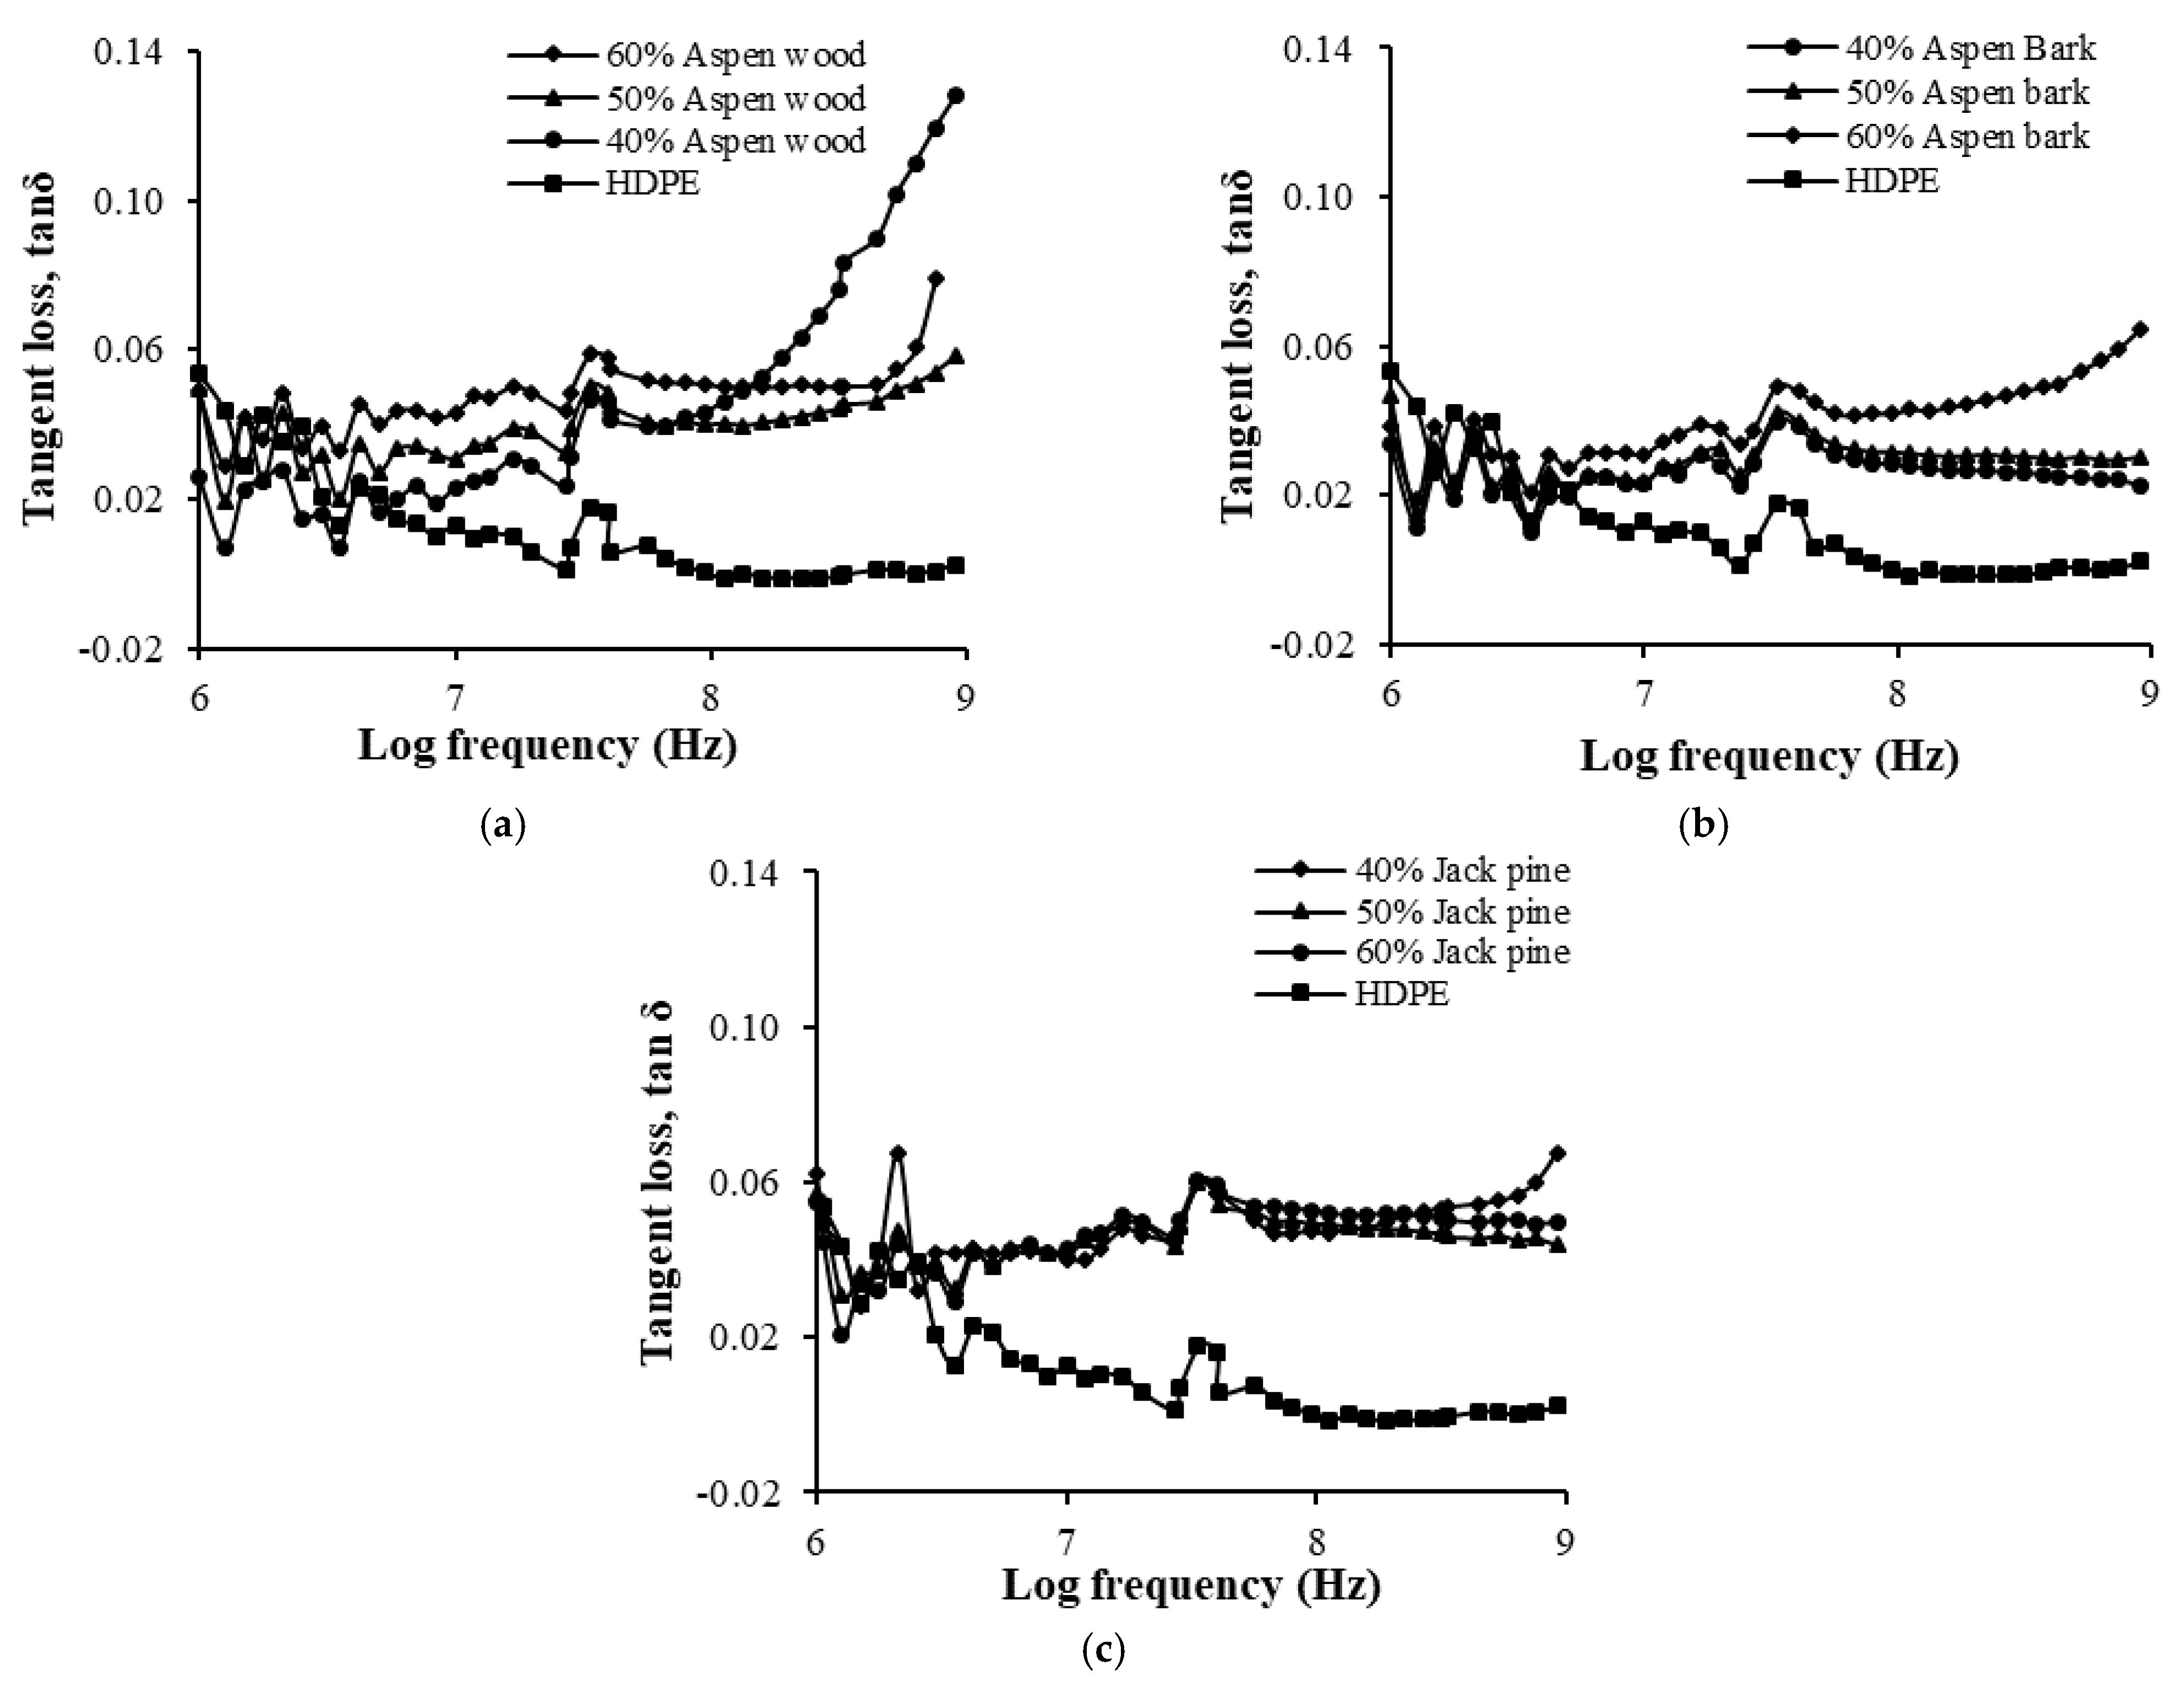
The variation in tangent loss with frequency as a function of fiber content is presented in Figure 5a–c. The addition of fiber to the polyethylene matrix increased the loss tangent. The study of the loss factor and loss tangent is important to assess the insulation capability of WPCs. The loss tangent is a measure of electrical energy converted to heat. This heat increases the temperature of the insulating material and accelerates its deterioration. Dipolar polarization and ionic conduction are the main factors in increasing the loss factor [11].
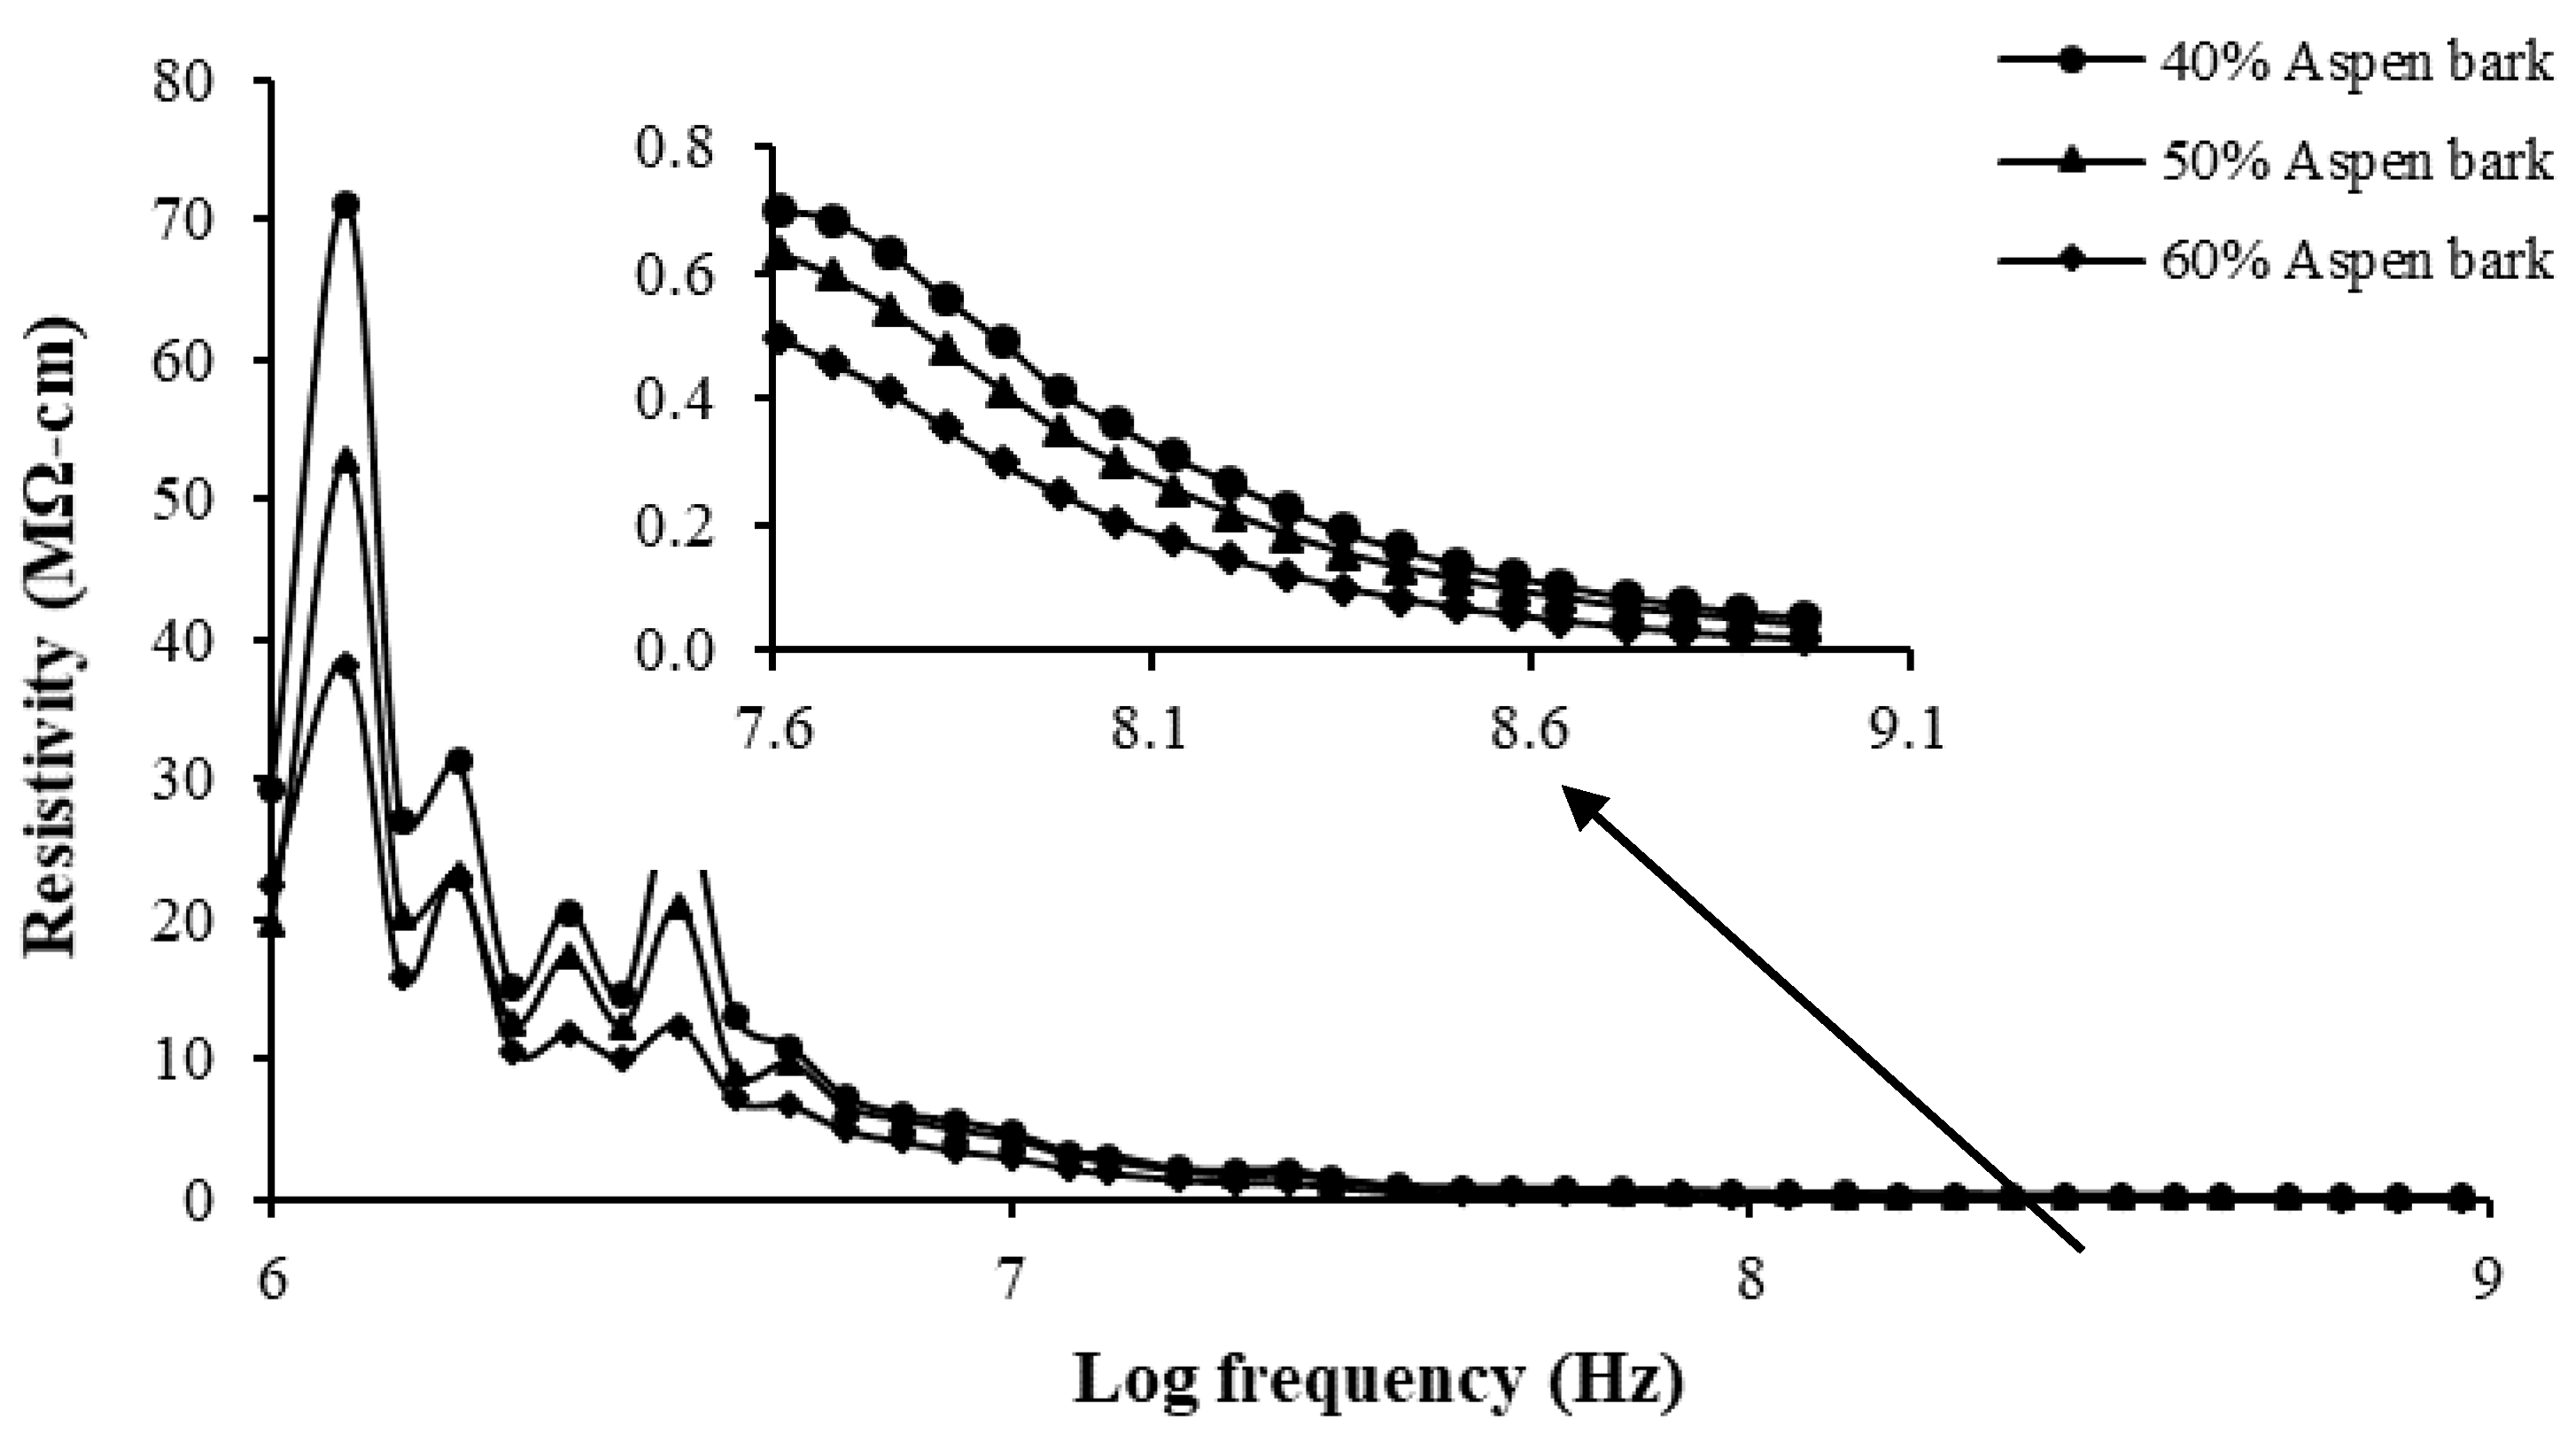
Figure 6 shows the effect of fiber content and frequency on resistivity. A decrease in WPC resistivity was observed with increasing frequency. The increase in fiber content in polyethylene also lowered its resistivity regardless of frequency. This implies that the conductivity increases when lignocellulosic fibers are added to the matrix. These results are in good agreement with previous findings [11,24] and are explained by the presence of polar groups that improve the passage of current. In polymers, the conductivity increases rapidly in the amorphous regions as the moisture content increases. Due to the complex structure of the wood fibers, the OH-hydroxyl groups in cellulose, hemicellulose, and lignin can absorb moisture. Hence, the presence of wood fibers increases the conductivity of the composite.

4.2. Effect of the Fiber Chemical Composition on the WPC Chemical Composition

The effect of different lignocellulosic materials on the dielectric properties of WPCs is shown in Figure 7. The WPC dielectric constant ε′ decreased with an increase in the frequency, independent of the nature of the reinforcing wood or bark fibers in the HDPE. For the same fiber content, the incorporation of aspen and jack pine fibers led to higher dielectric constants than that of bark. These variations can be explained by the differences in the cellulose content present in the fibers of each composite (Table 1). The higher the cellulose content, the higher the dielectric constant. Thus, the variation in the dielectric constant with wood species is explained by the WPC cellulose content.
As shown in Figure 7b, the loss factor was affected by the nature of reinforcing fibers in the matrix. Composites reinforced with wood fibers had higher dielectric losses than those reinforced with bark fibers. The lower water absorption of bark fibers explains this result [25]. The hydrophilic wood fibers can accommodate additional water, resulting in more water dipole contribution in the composite. The presence of a water dipole contributes to the WPC polarization and dielectric loss. In addition, higher amounts of lignin in wood increase dielectric losses [26].
Thus, the differences in chemical and physical properties between bark and wood fibers affect the dielectric behavior of the WPC.

5. Practical Implications

The present paper explored the suitability of the investigated composites for use in electrical applications. Compared with HDPE, the higher dielectric constant of WPCs promotes their use as capacitors and storage devices to achieve good energy accumulation in the presence of an electric field. However, the moisture absorption of composites reinforced by wood fibers can affect their long-term performance [16]. Chemical treatments of fibers could improve the moisture absorption of natural fibers. A few studies have reported the effect of chemical treatment of natural fibers on composites [16,20].
WPCs can also be used as anti-static materials to dissipate static charges [27,28]. The electric charges accumulate on the material with low conductivity, such as HDPE, and create static electricity that harms the performance of devices. Anti-static materials are conductive materials widely used in electronic packaging and storage devices. However, the present materials have some disadvantages: they are toxic to humans and costly. In this context, many studies have investigated the possibility of making conductive polymers by incorporating lignocellulosic fillers [13,23,28,29]. The present data showed that the resistivity of WCPs decreases with increasing fiber content. A high-fiber-content (60%) WPC exhibits conductivity on the order of 10−5 S/cm, indicating its potential for electrostatic-discharge-shielding applications [28]. Hence, WPCs guarantee the best anti-static properties because of their improved electrical conductivity at high frequencies.

6. Conclusions

This study investigated the dielectric properties of HDPE composites reinforced with wood and bark fibers. The following conclusions are drawn:
  • Increasing the proportion of fibers in WPCs increases the dielectric constant, the loss factor, and the loss tangent.
  • The variation in WPC resistivity as a function of frequency is not significant beyond 10 MHz. Thus, the addition of wood fibers does not modify the resistive nature of HDPE. Therefore, WPCs have the potential for electrical insulation applications in the high-frequency range.
  • The difference in the chemical properties of fibers explains the variations in the dielectric constant of composites reinforced with wood fibers from different species. Indeed, fibers with high cellulose contents have higher dielectric constant values.

Author Contributions

Conceptualization, A.K. and I.E.; methodology A.K. and I.E.; validation, A.K., C.B. and A.E.; formal analysis, I.E. and W.K.; investigation, A.K. and I.E.; resources, A.K.; data curation, I.E. and W.K.; writing—original draft preparation, I.E.; writing—review and editing, A.K., W.K., C.B. and A.E.; visualization, I.E., W.K. and A.K.; supervision, A.K., C.B. and A.E.; project administration, A.K.; funding acquisition, A.K. All authors have read and agreed to the published version of the manuscript.

Funding

This research was funded by the Natural Sciences and Engineering Research Council of Canada (NSERC; grant no. 567663) and the Canada Research Chair Program (grant no. 557752).

Acknowledgments

The authors wish to thank Williams Belhadef and Gilles Villeneuve for technical assistance and Joachim Vinson for training and support for dielectric measurements.

Conflicts of Interest

The authors declare no conflict of interest.

References

  1. Bledzki, A.K.; Gassan, J. Composites reinforced with cellulose based fibers. Prog. Polym. Sci. 1999, 24, 221–274. [Google Scholar] [CrossRef]
  2. Bledzki, A.K.; Gassan, J.; Theis, S. Wood-filled thermoplastic composites. Mech. Comp. Mat. 1998, 34, 563–568. [Google Scholar] [CrossRef]
  3. Bledzki, A.K.; Reihmane, S.; Gassan, J. Thermoplastics reinforced with wood fillers: A literature review. Polym. Plas. Technol. Eng. 1998, 37, 451–468. [Google Scholar] [CrossRef]
  4. Ashori, A. Wood-plastic composites as promising green-composites for automotive industries! Biores. Technol. 2008, 99, 4661–4667. [Google Scholar] [CrossRef]
  5. El-Meligy, M.G.; El-Zawawy, W.K.; Ibrahim, M.M. Lignocellulosic composite. Polym. Adv. Technol. 2004, 15, 738–745. [Google Scholar] [CrossRef]
  6. Maldas, D.; Kokta, B.V.; Raj, R.G.; Sean, S.T. Use of wood fibers as reinforcing fillers for polystyrene. Mat. Sci. Eng. 1988, A104, 235–244. [Google Scholar] [CrossRef]
  7. Raj, R.G.; Kokta, B.V.; Daneault, C. Wood flour as a low-cost reinforcing filler for polyethylene: Studies on mechanical properties. J. Mat. Sci. 1990, 25, 1851–1855. [Google Scholar] [CrossRef]
  8. Stokke, D.D.; Gardner, D.J. Fundamental aspects of wood as a component of thermoplastic composites. J. Vinyl Addit. Technol. 2003, 9, 96–104. [Google Scholar] [CrossRef]
  9. Takatani, M.; Ito, H.; Ohsugi, S.; Kitayama, T.; Saegusa, M.; Kawai, S.; Okamoto, T. Effect of lignocellulosic materials on the properties of thermoplastic polymer/wood composites. Holzforschung 2000, 54, 197–200. [Google Scholar] [CrossRef]
  10. Bogoeva-Gaceva, G.; Avella, G.; Malinconico, M.; Buzarovska, M.; Grozdanov, A.; Gentile, G.; Errico, M.E. Natural fiber eco-composites. Polym. Comp. 2007, 28, 98–107. [Google Scholar] [CrossRef]
  11. Notingher, P.V.; Stancu, C.; Enescu, I.; Enescu, A. Dielectric Properties of Wood-Polymer Composites. Mater. Plast. 2010, 47, 393–398. [Google Scholar]
  12. Dhal, J.P.; Mishra, S.C. Processing and Properties of Natural Fiber-Reinforced Polymer Composite. J. Mater. 2013, 1–6. [Google Scholar] [CrossRef] [Green Version]
  13. Markiewicz, E.; Paukszta, D.; Borysiak, S. Acoustic and Dielectric Properties of Polypropylene-Lignocellulosic Materials Composites, Polypropylene, Fatih Dogan, IntechOpen. 2012. Available online: https://www.intechopen.com/books/polypropylene/acoustic-and-dielectric-properties-of-polypropylene-lignocellulosic-materials-composites (accessed on 24 May 2021).
  14. Azlan, A.A.; Badrun, M.K.A.; Ali, M.T.; Awang, M.Z. A study of dielectric constant and loss tangent of leucaena leucocephala wood plastic composite (WPC) substrate. In Proceedings of the 2013 IEEE Symposium on Wireless Technology and Applications (ISWTA), Kuching, Malaysia, 22–25 September 2013; pp. 176–181. [Google Scholar] [CrossRef]
  15. Akram, M.; Javed, A.; Rizvi, T.Z. Dielectric properties of industrial polymer composite materials. Turk. J. Phys. 2005, 29, 355–362. [Google Scholar]
  16. Porebska, R.; Rybac, A.; Kozub, B.; Sekula, R. Polymer matrix influence on stability of wood polymer composites. Polym. Adv. Technol. 2015, 26, 1076–1082. [Google Scholar] [CrossRef]
  17. Impedance Measurement. Available online: https://www.novocontrol.de/php/intro_imp_spectr.php (accessed on 23 May 2021).
  18. Migneault, S.; Koubaa, A.; Perré, P. Effect of Fiber Origin, Proportion, and Chemical Composition on the Mechanical and Physical Properties of Wood-Plastic Composites. J. Wood Chem. Technol. 2014, 34, 241–261. [Google Scholar] [CrossRef]
  19. ASTM D4703-03. Standard Practice for Compression Molding Thermoplastic Materials into Test Specimens, Plaques, or Sheets; ASTM International: West Conshohocken, PA, USA, 2003. [Google Scholar]
  20. Augustine, P.; Kuruvilla, J.; Sabu, T. Effect of surface treatments on the electrical properties of low-density polyethylene composites reinforced with short sisal fibers. Comp. Sci. Technol. 1997, 57, 67–79. [Google Scholar] [CrossRef]
  21. Smyth, C.P. Dielectric Behavior and Structure; McGraw Hill: New York, NY, USA, 1955; p. 53. [Google Scholar]
  22. Guo, G.; Finkenstadt, V.L.; Nimmagadda, Y. Mechanical properties and water absorption behavior of injection-molded wood fiber/carbon fiber high-density polyethylene hybrid composites. Adv. Compos. Hybrid Mater. 2019, 2, 690–700. [Google Scholar] [CrossRef]
  23. Jacob, M.; Varughese, K.T.; Thomas, S. Dielectric characteristics of sisal–oil palm hybrid biofiber reinforced natural rubber biocomposites. J. Mat. Sci. 2006, 41, 5538–5547. [Google Scholar] [CrossRef]
  24. Pathania, D.; Singh, D.; Sharma, D. Electrical properties of natural fiber graft co-polymer reinforced phenol formaldehyde composites. Optoelectron. Adv. Mater. Rapid Commun. 2010, 4, 1048–1051. [Google Scholar]
  25. Kazemi Najefi, S.; Kiaefar, A.; Tajvidi, M. Effect of bark flour content on the hygroscopic characteristics of wood-polypropylene composites. J. Appl. Polym. Sci. 2008, 110, 3116–3120. [Google Scholar] [CrossRef]
  26. Hollertz, R. Dielectric Properties of Wood Fiber Components Relevant for Electrical Insulation Applications. Ph.D. Thesis, KTH Royal Institute of Technology, Stockholm, Sweden, 2014. [Google Scholar]
  27. Li, Y.; Mai, Y.W.; Ye, L. Sisal fibre and its composites: A review of recent developments. Comp. Sci. Technol. 2000, 60, 2037–2055. [Google Scholar] [CrossRef]
  28. Abdel Aal, N.; El-Tantawy, F.; Al-Hajry, A.; Bououdina, M. New Antistatic Charge and Electromagnetic Shielding Effectiveness from Conductive Epoxy Resin/Plasticized Carbon Black Composites. Polym. Compos. 2008, 29, 125–132. [Google Scholar] [CrossRef]
  29. Hasanin, M.; Labeeb, A.M. Dielectric properties of nicotinic acid/methyl cellulose composite via “green” method for anti-static charge applications. Mater. Sci. Eng. B 2021, 263, 1–9. [Google Scholar] [CrossRef]
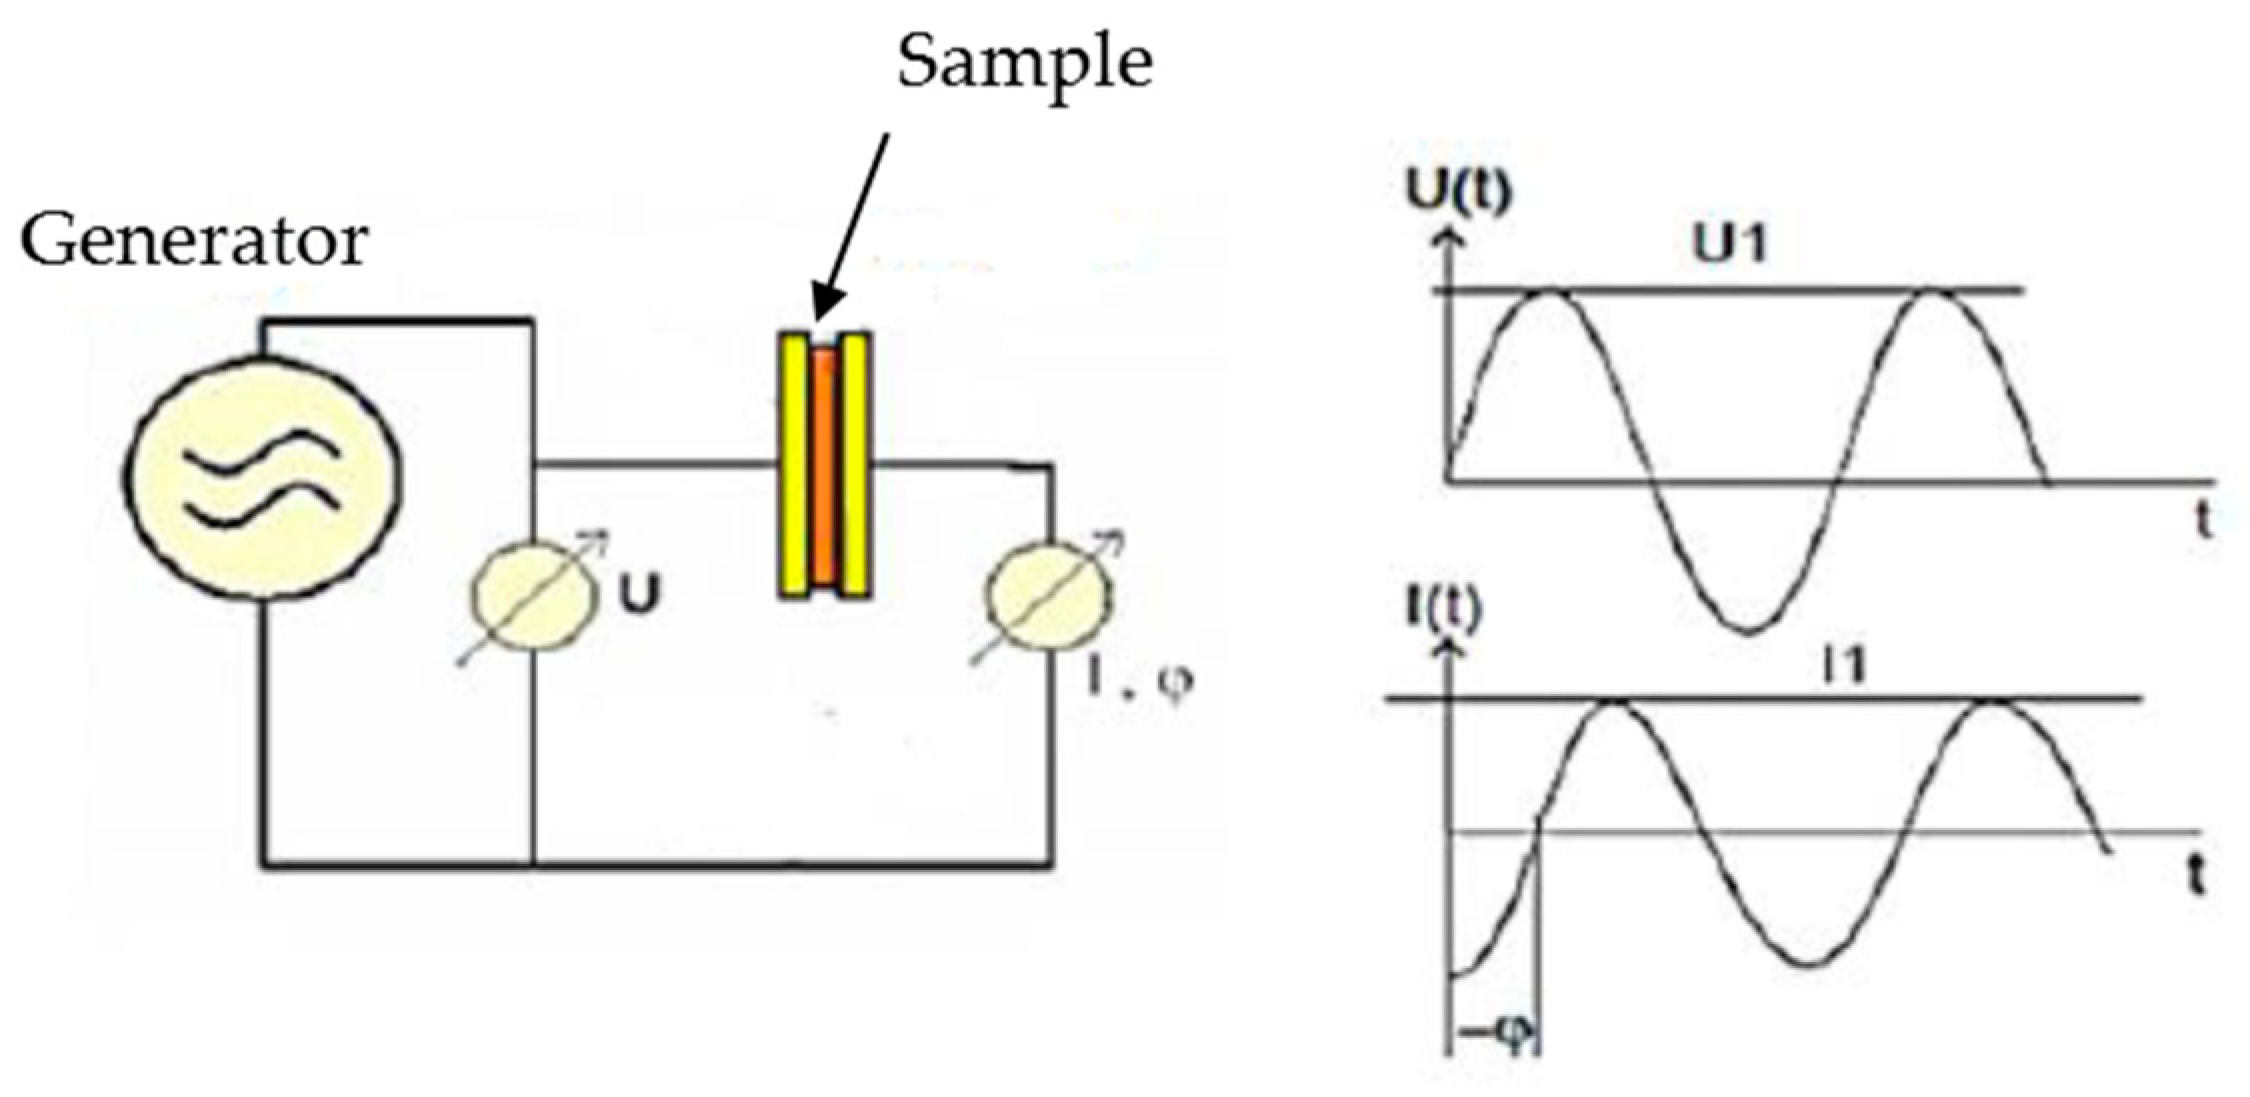
Figure 1. Diagram of the principle of measurement of dielectric spectroscopy [17].
Jcs 05 00141 g001
Figure 2. Composite manufacturing processes.
Jcs 05 00141 g002
Figure 3. Variation in dielectric constant (ε′) with frequency as a function of fiber loading: (a) aspen wood, (b) aspen bark, and (c) jack pine wood.
Jcs 05 00141 g003
Figure 4. Variation in loss factor (ε″) with frequency as a function of fiber loading: (a) aspen wood, (b) aspen bark, and (c) jack pine wood.
Jcs 05 00141 g004
Figure 5. Variation in loss tangent (tan δ) with frequency as a function of fiber loading: (a) aspen wood, (b) aspen bark, and (c) jack pine wood.
Jcs 05 00141 g005
Figure 6. Effect of frequency and fiber contents on WPC resistivity.
Jcs 05 00141 g006
Figure 7. Effect of frequency, wood species, and fiber nature on WPCs’ (a) dielectric constant (ε′) and (b) loss factor (ε″).
Jcs 05 00141 g007
Table 1. Wood–polymer composites (WPC) formulations studied and computed cellulose content.
Particle TypeContent (%)Cellulose (%)
FiberHDPEMAPE
HDPE010000.0
Jackpine wood4057 20.8
5047326.0
6037 31.2
Aspen wood4057 20.3
5047325.4
6037 30.4
Aspen bark4057 12.80
5047316.00
6037 19.20
Table 2. Results of the analysis of variance (F-value) for dielectric properties of WPCs.
Source of Variationεεtan δρ
Fiber type (T)74.3 **22.0 **23.3 **14.4 **
Proportion (P)1031.6 **18.8 **8.6 **4.98 *
Frequency (F)72.6 **3.5 *5.6 **101.4 **
T × P104.3 **2.6 n.s.3.4 *1.6 n.s.
T × F3.1 *1.8 n.s.2.0 n.s.8.98 **
P × F2.4 *0.76 n.s.0.9 n.s.2.9*
* Significant at 0.05; ** significant at 0.01; n.s.: non-significant.
Publisher’s Note: MDPI stays neutral with regard to jurisdictional claims in published maps and institutional affiliations.