1. Introduction
High strength to weight ratios, good fatigue performance and excellent environmental and corrosion resistance are some of the features that have resulted in laminated composites being increasingly used in primary structural applications in many transport, mechanical and civil engineering fields. However, because of their anisotropic properties and layered configuration, composite laminates are highly sensitive to out-of-plane impact loads that inevitably occur during the manufacturing and assembly stages or throughout the service life of the structure. As opposed to metals, in which the quota of the impact energy exceeding the elastic limit of the material is absorbed by plastic deformation, composite materials exhibit a much more brittle response and usually dissipate a large amount of impact energy by the creation of new failure surfaces, such as those associated to matrix cracks, delaminations, fibre/matrix debonding and fibre fracture [
1].
These forms of damage, which are often invisible to the naked eye and difficult to identify by on-field non-destructive techniques, are extremely dangerous since they may propagate undetected under service loads, leading to the unforeseen collapse of the structure [
2].
Monitoring for early detection of internal damage in composite materials is, therefore, of crucial importance to ensure the integrity and safety of critical load-bearing engineering structures. In recent years, a wide range of Structural Health Monitoring (SHM) techniques based on integrated sensors and optimized signal processing algorithms have been developed to assess the presence of impact damage in composite structures. In this context, guided ultrasonic waves can offer a valuable solution, making it possible to inspect large structures and components with relatively few sensors [
3,
4,
5]. Coherence function drops, harmonic distortion, and singularities in the Holder exponent were also applied to identify the damage signature in the system response [
6]. Moreover, nonlinear acoustic and vibration-based methods have been widely used for damage detection [
7,
8,
9,
10,
11,
12]. To identify damage in composite materials some techniques focused on specific features of the elastic system response such as wave modulation and cross-modulation [
13,
14,
15,
16], sidebands [
7,
17], higher and sub-harmonic generation, hysteretic behavior and nonlinear slow dynamics [
18].
Among those methods in which damage detection goes through the identification of the nonlinear features of the elastic system response lies the Scaling Subtraction Method (SSM) [
19,
20]. The principle behind SSM is that the higher the amplitude of the excitation applied to the system, the larger the non-linear effects in the response of the material due to the presence of damage or defects. By gradually increasing the amplitude of the excitation and taking the system response to low-amplitude excitation as a reference signal, the SSM infers the presence of damage from the difference between the acquired response and the linearly scaled reference signal. As reported in 0, one of the benefits of the SSM is that the amplitude of this subtracted signal is large enough to be easily distinguished from the background noise. The SSM has been proven to be effective when applied to granular materials, such as concrete, mortar and masonry [
20,
21], whilst it appeared less sensitive to the nonlinear signature of damage when metallic samples (steel and lead) were tested [
20].
Recently, it was shown that the SSM can be effective in assessing the presence of impact damage in composite laminates [
22,
23,
24]. The sensitivity of the method was found, however, to strongly depend on the excitation frequency. According to the standard SSM procedure, in fact, a purely harmonic excitation is applied to the system, the frequency of which should be tuned to one of the natural frequencies of the system, in order to benefit from resonance amplification effects. This implies firstly a preliminary modal analysis to identify the eigenfrequencies of the system and then a tentative selection of the most suitable excitation frequency. It lengthens the execution time of the tests and makes the success of the method uncertain.
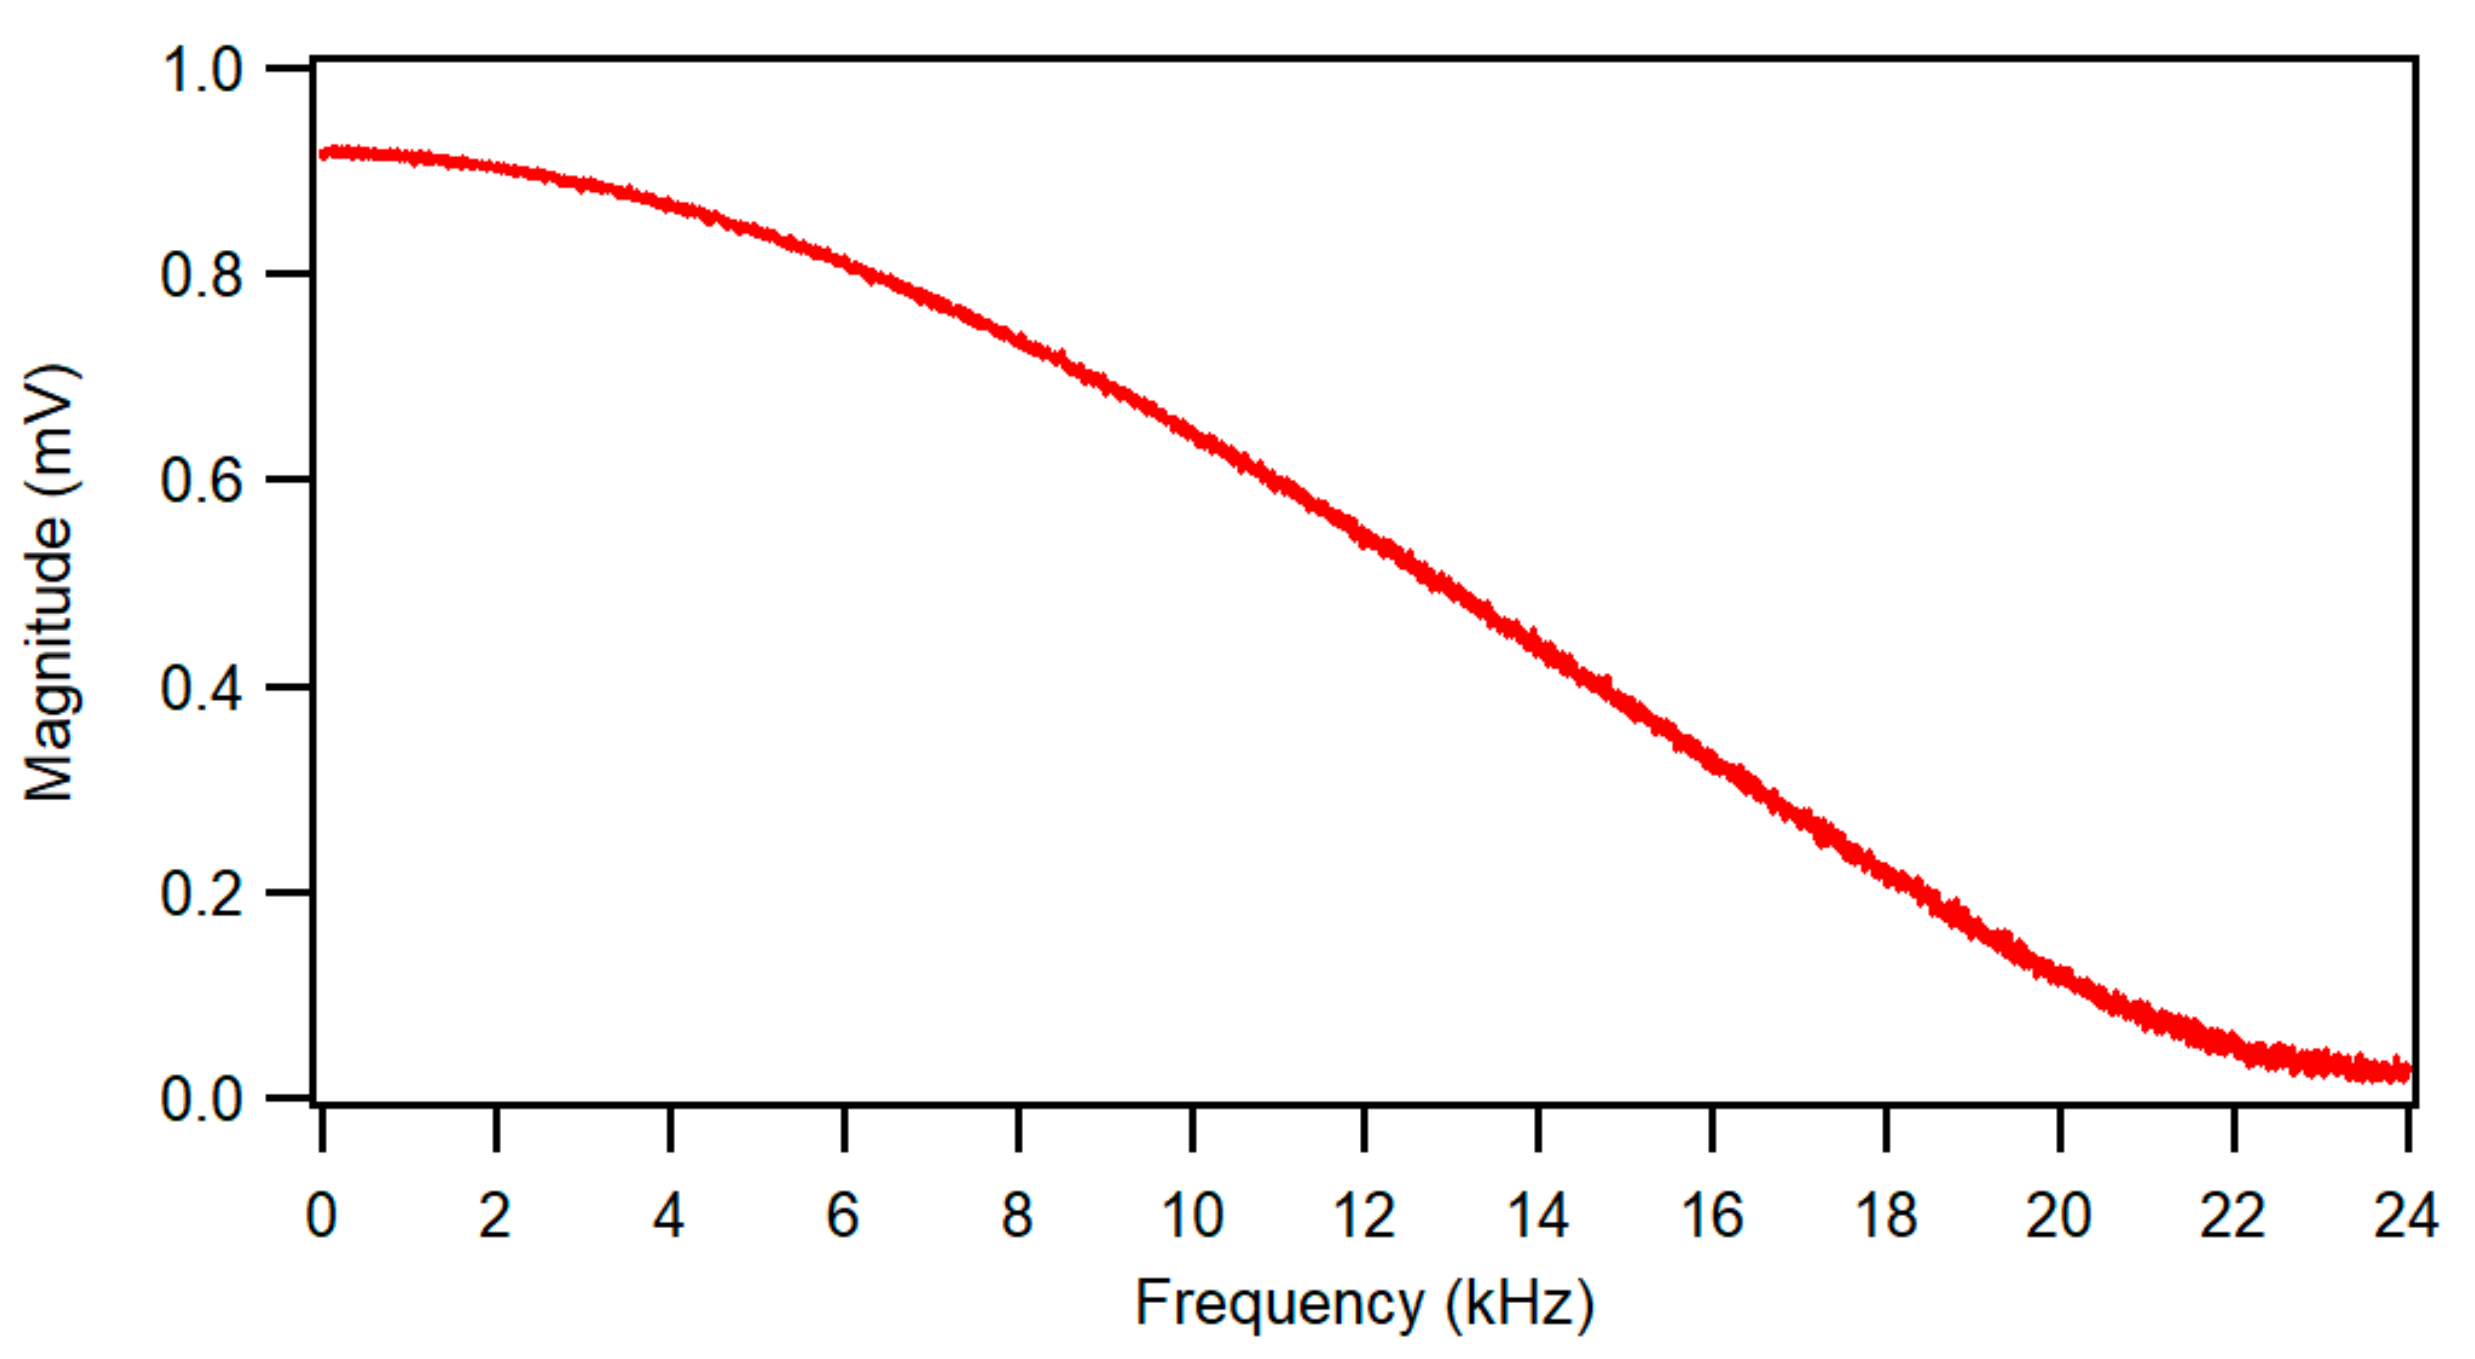
To overcome the need of a preliminary modal analysis and to address the issue of a proper selection of the excitation frequency, a broadband impulsive excitation could be exploited. Rectangular pulse excitations at various amplitudes were used in [
25] when applying the SSM to analyze the behavior of a cracked cementitious mortar in the presence of a thin layer of sodium silicate solution. The damage indicators adopted in [
25] were the classical ones of the method, defined in the time domain.
A first attempt to apply the SSM to detect barely visible impact damage in composite beams excited by impulsive loads was presented in [
24]. In that study, an extension of the SSM, based on damage indicators defined in the frequency domain, was proposed. Encouraged by the promising preliminary results found in [
24], the present paper aims to carry out a more detailed investigation of the possibility of adopting broadband impulsive excitations and damage indicators based on the analysis of signal magnitudes at selected frequencies, to make the SSM more effective for the detection of low-velocity impact damage in laminated composite materials.
For this purpose, two series of experimental tests have been conducted on a laminate composite beam, the first one carried out with pure harmonic excitations tuned in turn at three natural frequencies of the system and the second one performed with broadband impulsive inputs. The response was recorded at two sensors, both before and after the introduction of impact damage by means of a low-velocity impactor. Three different levels of damage were considered, while excitations of increasing scaled amplitude were applied, according to the SSM approach. Similar in principle to the SSM indicators but working on the data extracted from the frequency domain instead of the time domain, two different damage indicators were introduced in this study. Since a wide range of frequencies is excited by a broadband impulse, damage detection analysis may be carried out by comparing the magnitudes of the measured and reference signals at the selected frequency, to evaluate the deviation from linearity of the system response. For comparison, the same natural frequencies adopted for the harmonic excitations were considered to check the indications of the damage index. The results obtained under impulsive and harmonic excitations are finally compared and discussed.
2. Scaling Subtraction Method
The Scaling Subtraction Method (SSM) is a damage detection technique based on the assumption that the presence of defects introduces significant nonlinear contributions to the response of the material only when the amplitude of the excitation is high enough to activate the role of internal damage and discontinuities [
19]. According to the literature [
26], different features of the response signal may indicate a loss of linearity in the system response. These features include the appearance of higher and sub-harmonics, i.e., the occurrence of additional frequency components at multiples or fractions of the driving frequency; phase distortions due to the dependence of the wave speed on the elastic constants of the material, which are strictly correlated with the characteristics and the size of the damaged area; changes in the response amplitude, which may be associated with the width and shift of the resonance peaks.
Since nonlinear effects are only triggered when the excitation energy is high enough, a damaged system subjected to a low amplitude excitation may be expected to respond as a linear system. The stationary response of a damaged structure subjected to a purely harmonic excitation of small amplitude is, therefore, linear and can be written as
where
and
are the amplitude and the frequency of the exciting vibration, while
is the phase delay.
On the other hand, should the material be perfectly linear, the response of the system to the harmonic excitation with amplitude scaled by a factor
k would be
The difference between the response
of the damaged structure when subjected to a high amplitude excitation
and the reference signal
provides a measure of the amount of nonlinearity of the structure and may be thus used to detect the presence of damage and possibly quantify its severity [
20]. Some damage indicators have been proposed in [
20] to quantify the global level of nonlinearity of the examined systems at the specific excitation and the contributions of the different sources of nonlinearity.
Previous investigations by the authors on the application of the SSM technique for damage detection in composite materials showed that the sensitivity of the method depends on the frequency of the harmonic excitation [
23,
24]. With the latter usually chosen among the resonance frequencies of the system, a preliminary modal analysis for the identification of the natural frequencies of the system is, therefore, needed. To address the issues related to the proper selection of the excitation frequency, a series of experimental tests have been conducted in this study to investigate the damage detection capabilities of an SSM technique that makes use of a broadband pulse to excite the structure in place of a stationary harmonic signal. Preliminary tests recently conducted by this approach [
24] provided promising indications and suggest further investigations on the efficacy of the pulse excitation strategy. A testing methodology employing an impulsive signal to excite the structure offers the advantage of not requiring the preliminary choice of the frequency of the harmonic excitation, thus eliminating the need for the characterization of the modal response of the structure and overcoming the risk of selecting an interrogating frequency with a low damage detection sensitivity. When a broadband input is used, a wide range of frequencies is excited, and the damage detection analysis may be carried out in the frequency domain, by comparing the spectral magnitudes at the selected frequency of the measured and reference signals, to evaluate the deviation from linearity of the system response.
Based on the approaches described above, the following damage indices were used in this study
where
and
are the amplitudes of the response signal, respectively, acquired at the maximum (
and minimum
) excitation levels, while
are the amplitudes measured at the generic excitation level
applied to the system. The response measured at the minimum excitation level
is assumed as the reference value to define the linear response of the system.
To summarize, DI characterizes the deviation from the linearity of the response signal acquired at the maximum applied excitation level , while represents the sum of the relative distances from linearity calculated for any of the applied excitation levels higher than . The B amplitudes are obtained as the peak-to-peak values of the acquired response signals for SSM tests with harmonic excitation and evaluated from the magnitudes of the frequency spectrum at the chosen frequency for tests with pulse excitation.
4. Damage Detection Results and Discussion
The graphs if
Figure 5 show, as an example, the values of the signal amplitude recorded at a sensor for the pristine and the impacted (Damage 1) beam as a function of the corresponding excitation level for a test with a harmonic excitation of 3915 Hz. Analogous trends were observed for the tests at the other two frequencies and for the other damage levels. We may notice that while the data acquired on the pristine sample are almost linear up to the maximum excitation level, the curve representing the response of the damaged beam start to depart from the linear behavior at an excitation of about 4 V
pp.
The values of the damage indices
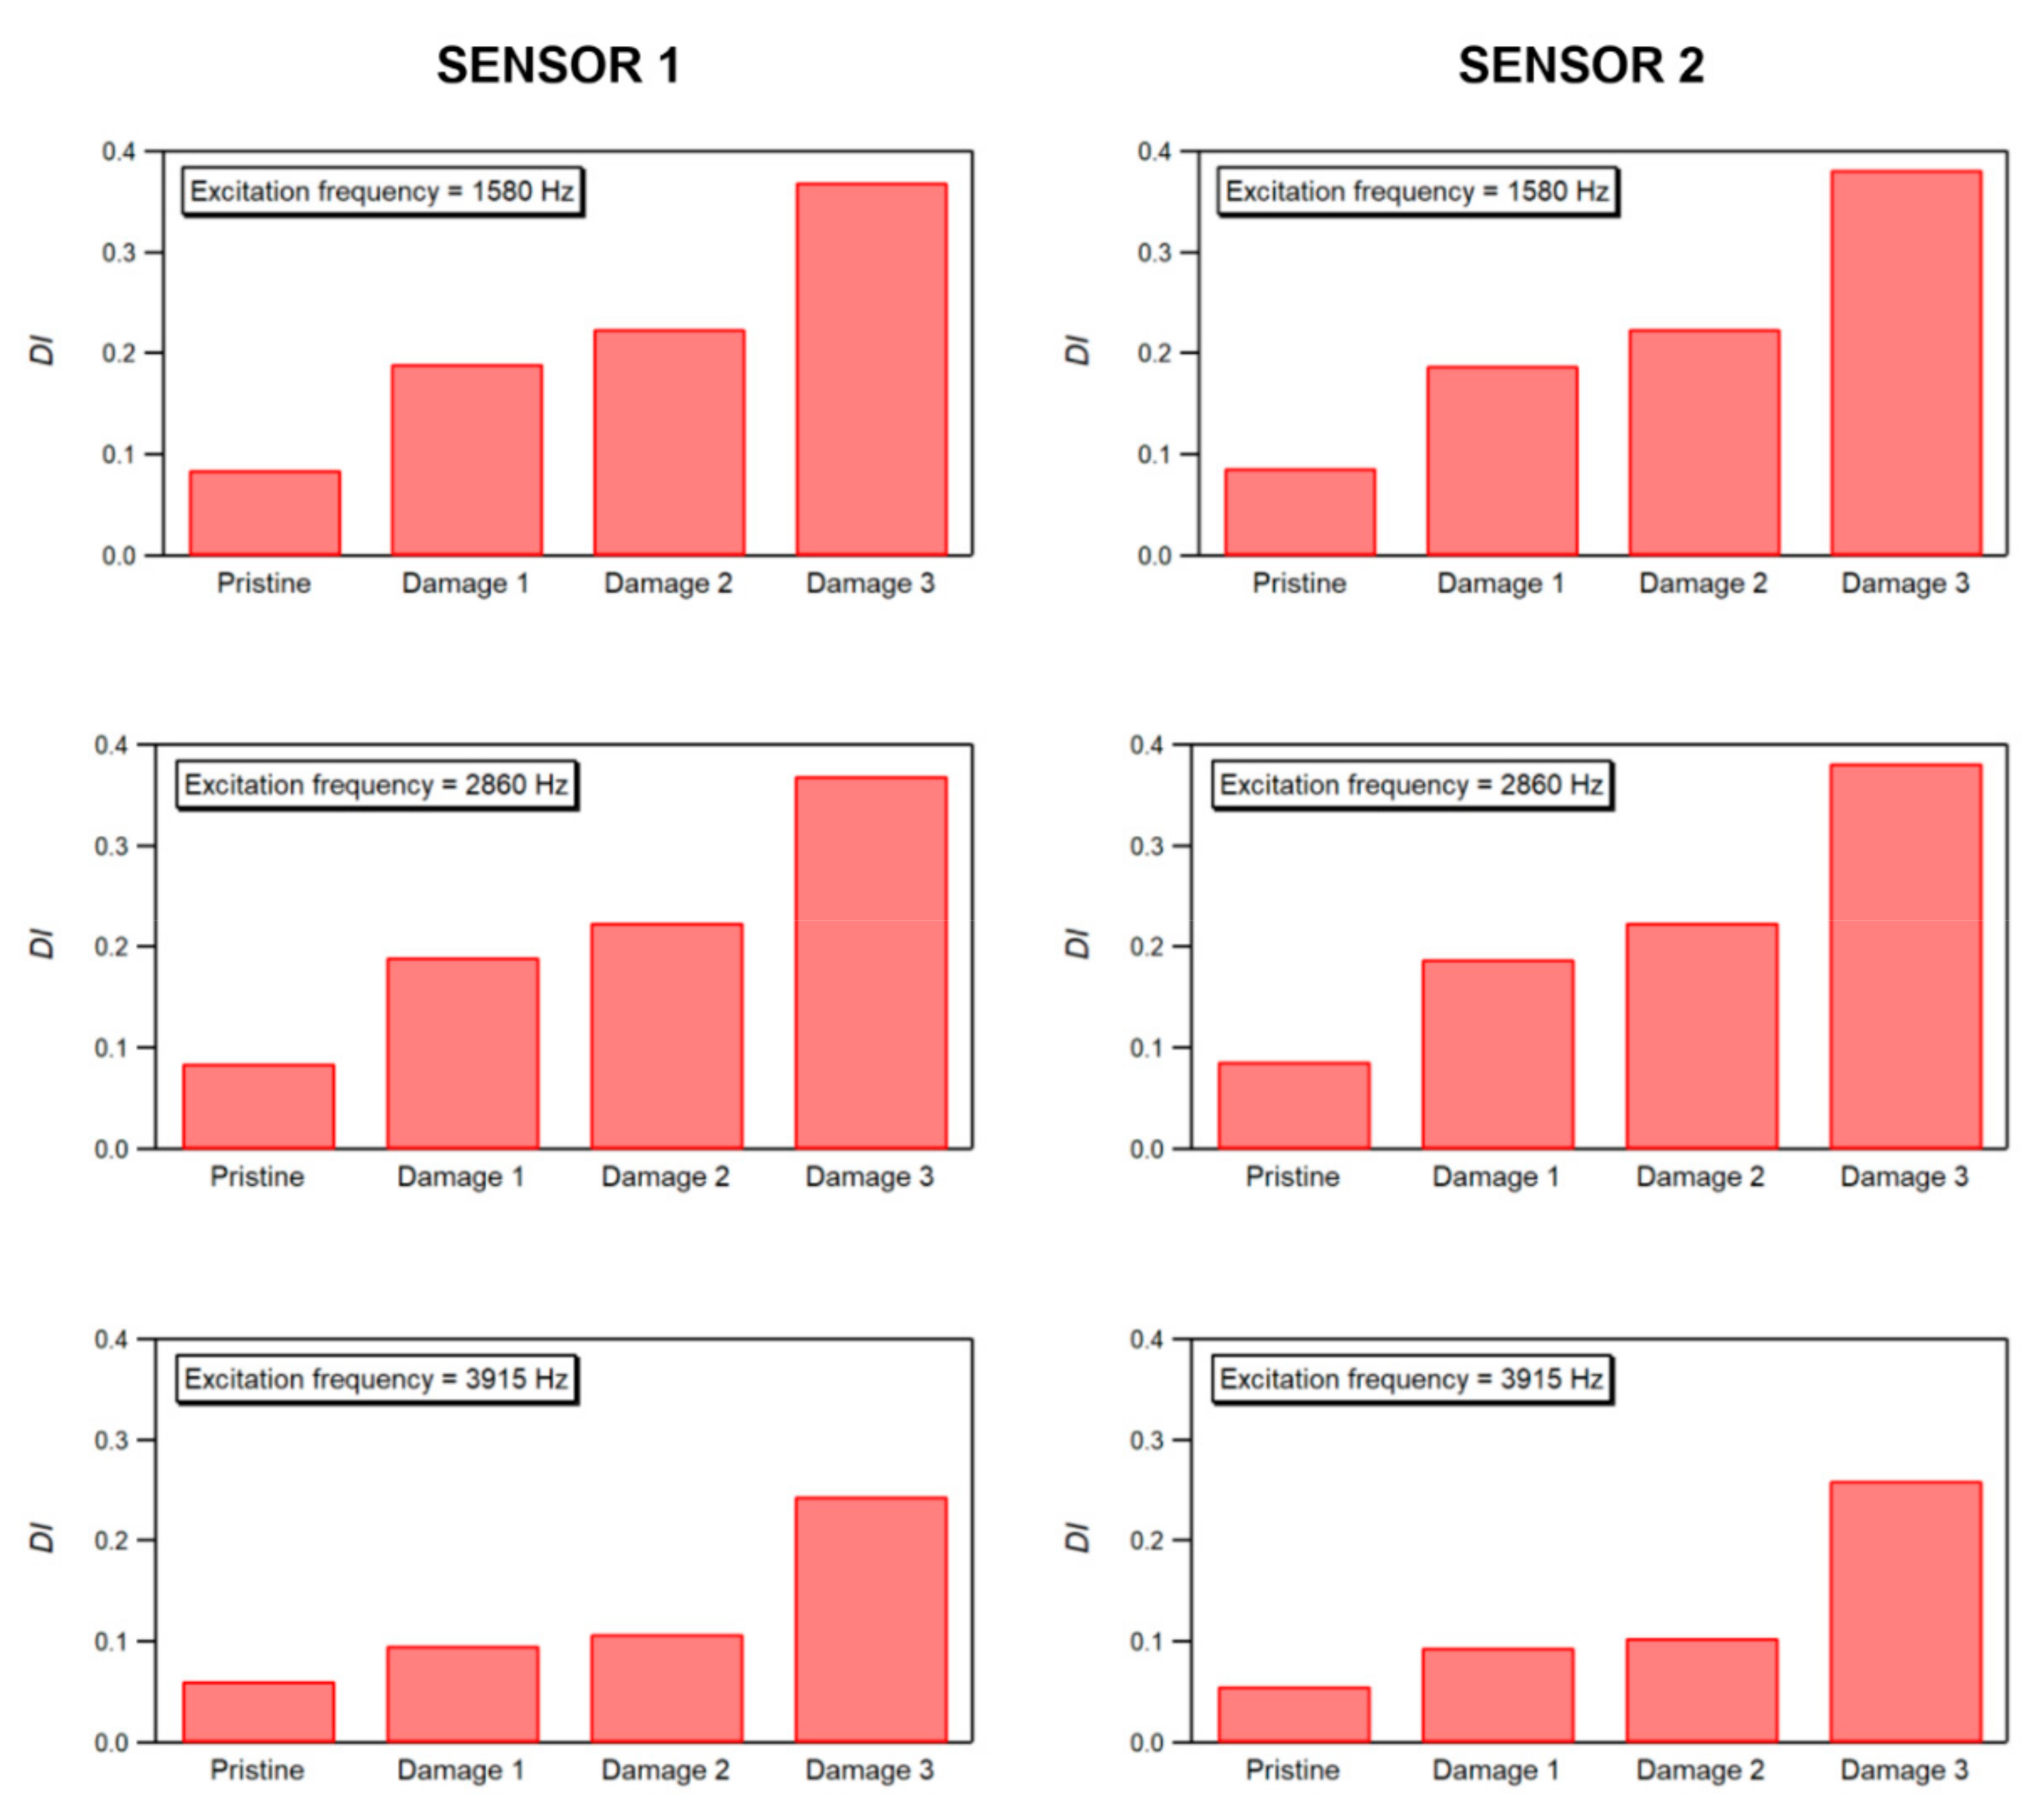
, cf. Equation (3), evaluated from the response of the two sensors at the harmonic excitations of 1580, 2860 and 3915 Hz are plotted as a function the damage severity in
Figure 6. It may be worth recalling that the damage index
is a parameter that quantifies the distance of the amplitude measured at the maximum excitation of 6 V
pp from that evaluated in the hypothesis of a perfectly linear trend. It is immediately noticed that the damage indicator assumes non-zero values even for the undamaged sample (pristine case in diagrams of
Figure 6). This effect, which has been reported in a number of previous investigations of the nonlinear response of a material to acoustic or ultrasonic waves [
22,
23], may be related to nonlinearities of the instrumentation as well as to inherent nonlinearities of the material or to the presence of small manufacturing defects with a size below the detection threshold of ultrasonic scanning.
We may also observe from
Figure 6 that the damage index
increases with increasing damage for all the three excitation frequencies used for excitation and for both sensors S1 and S2. In particular, very low differences were observed between the
values obtained from by the analyses of the response of the two sensors, even though they were positioned on opposite sides of the impact location, thus showing that the presence of damage can be detected even though the path between the actuator and the sensor does not run through the damaged region.
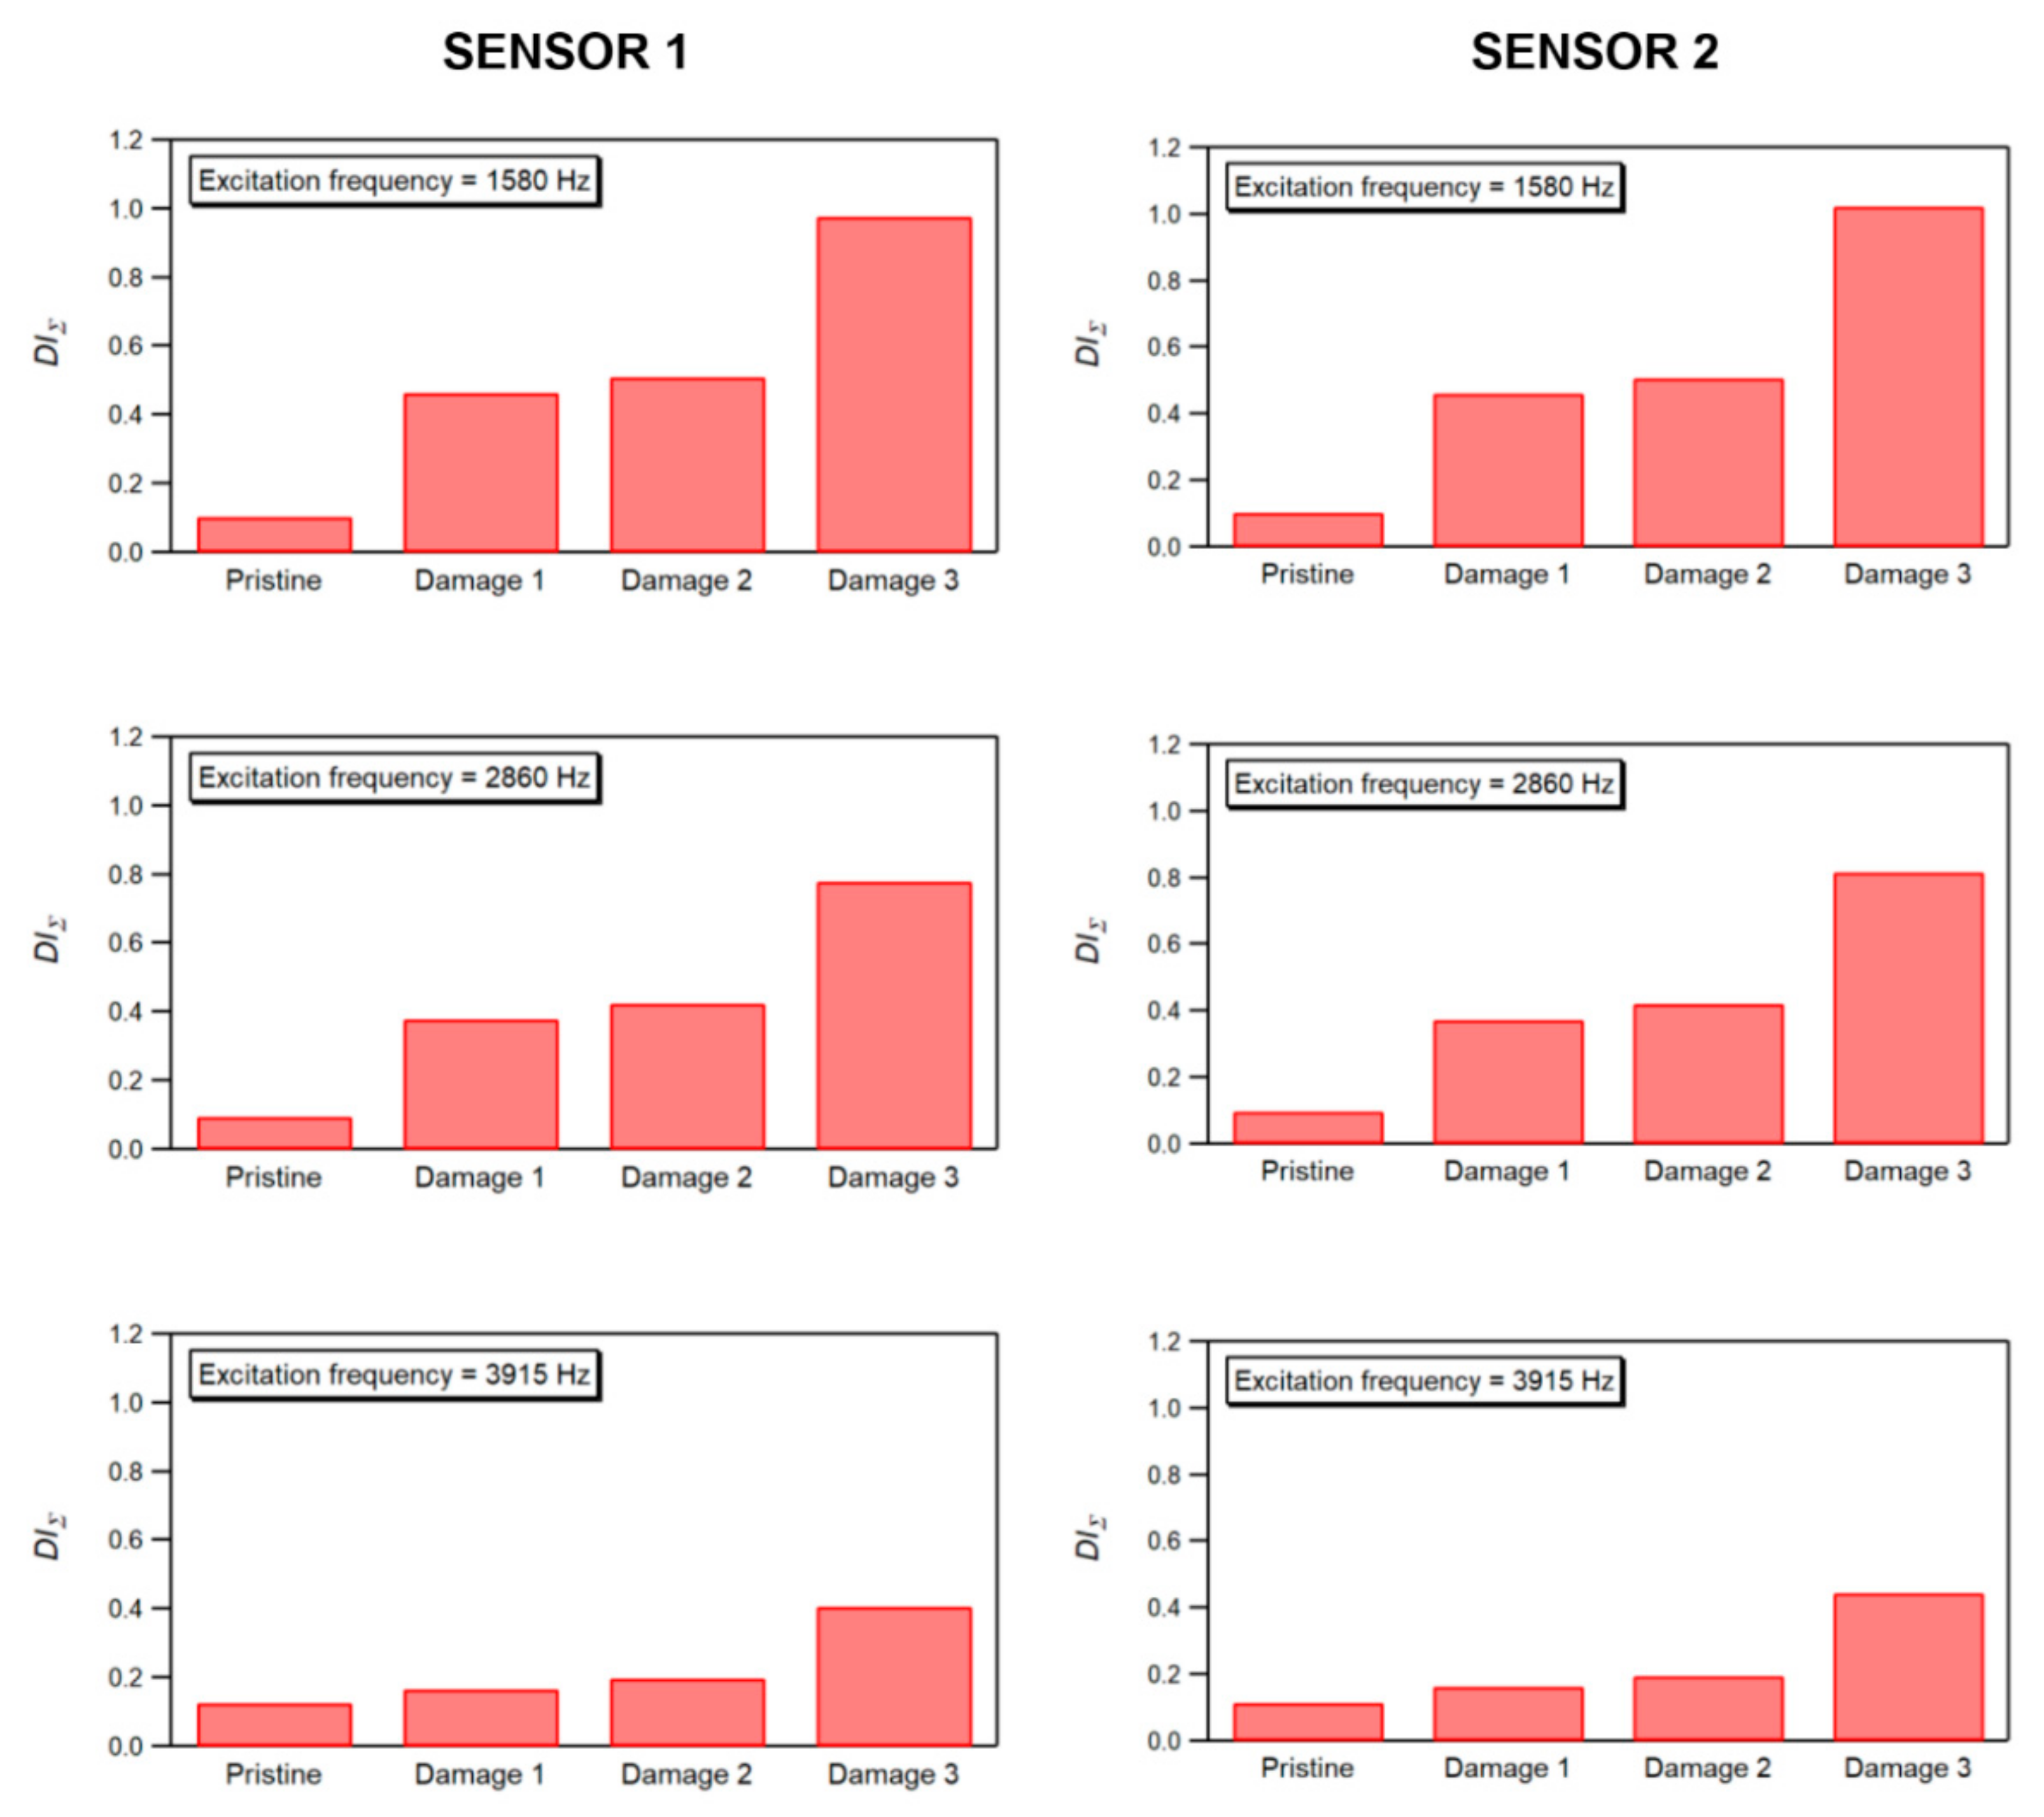
It is also worth remarking that while the adopted damage index
DI provides a reliable indication of the presence of damage for all the examined frequencies, the sensitivity of the technique appears to depend on the excitation frequency. As an example, while the damage index for the smallest damage severity (Damage 1) more than doubled with respect to the pristine condition when the 1580 and 2860 Hz frequencies were used to excite the system, an increase of only about 60% was measured from the undamaged to the early damaged condition (Damage 1) for the 3915 Hz excitation, see
Figure 6. Similar remarks are valid if we examine the trend of the damage index
, see Equation (4), which represents the cumulative effect of the nonlinear contributions evaluated over all excitation amplitudes applied in the experiments (
Figure 7). We may see that this index provides an enhanced sensitivity to damage for the tests that employ 1580 and 2860 Hz excitations, but do not appear to improve the efficiency for detecting the presence of the smaller damage for the 3915 Hz excitation, thus confirming the significant influence of the excitation frequency on the damage identification capabilities of the SSM technique.
Because of the good indications provided by the
index with harmonic excitation, the damage detection performance of the pulse-based SSM technique was analyzed by means of this index. The
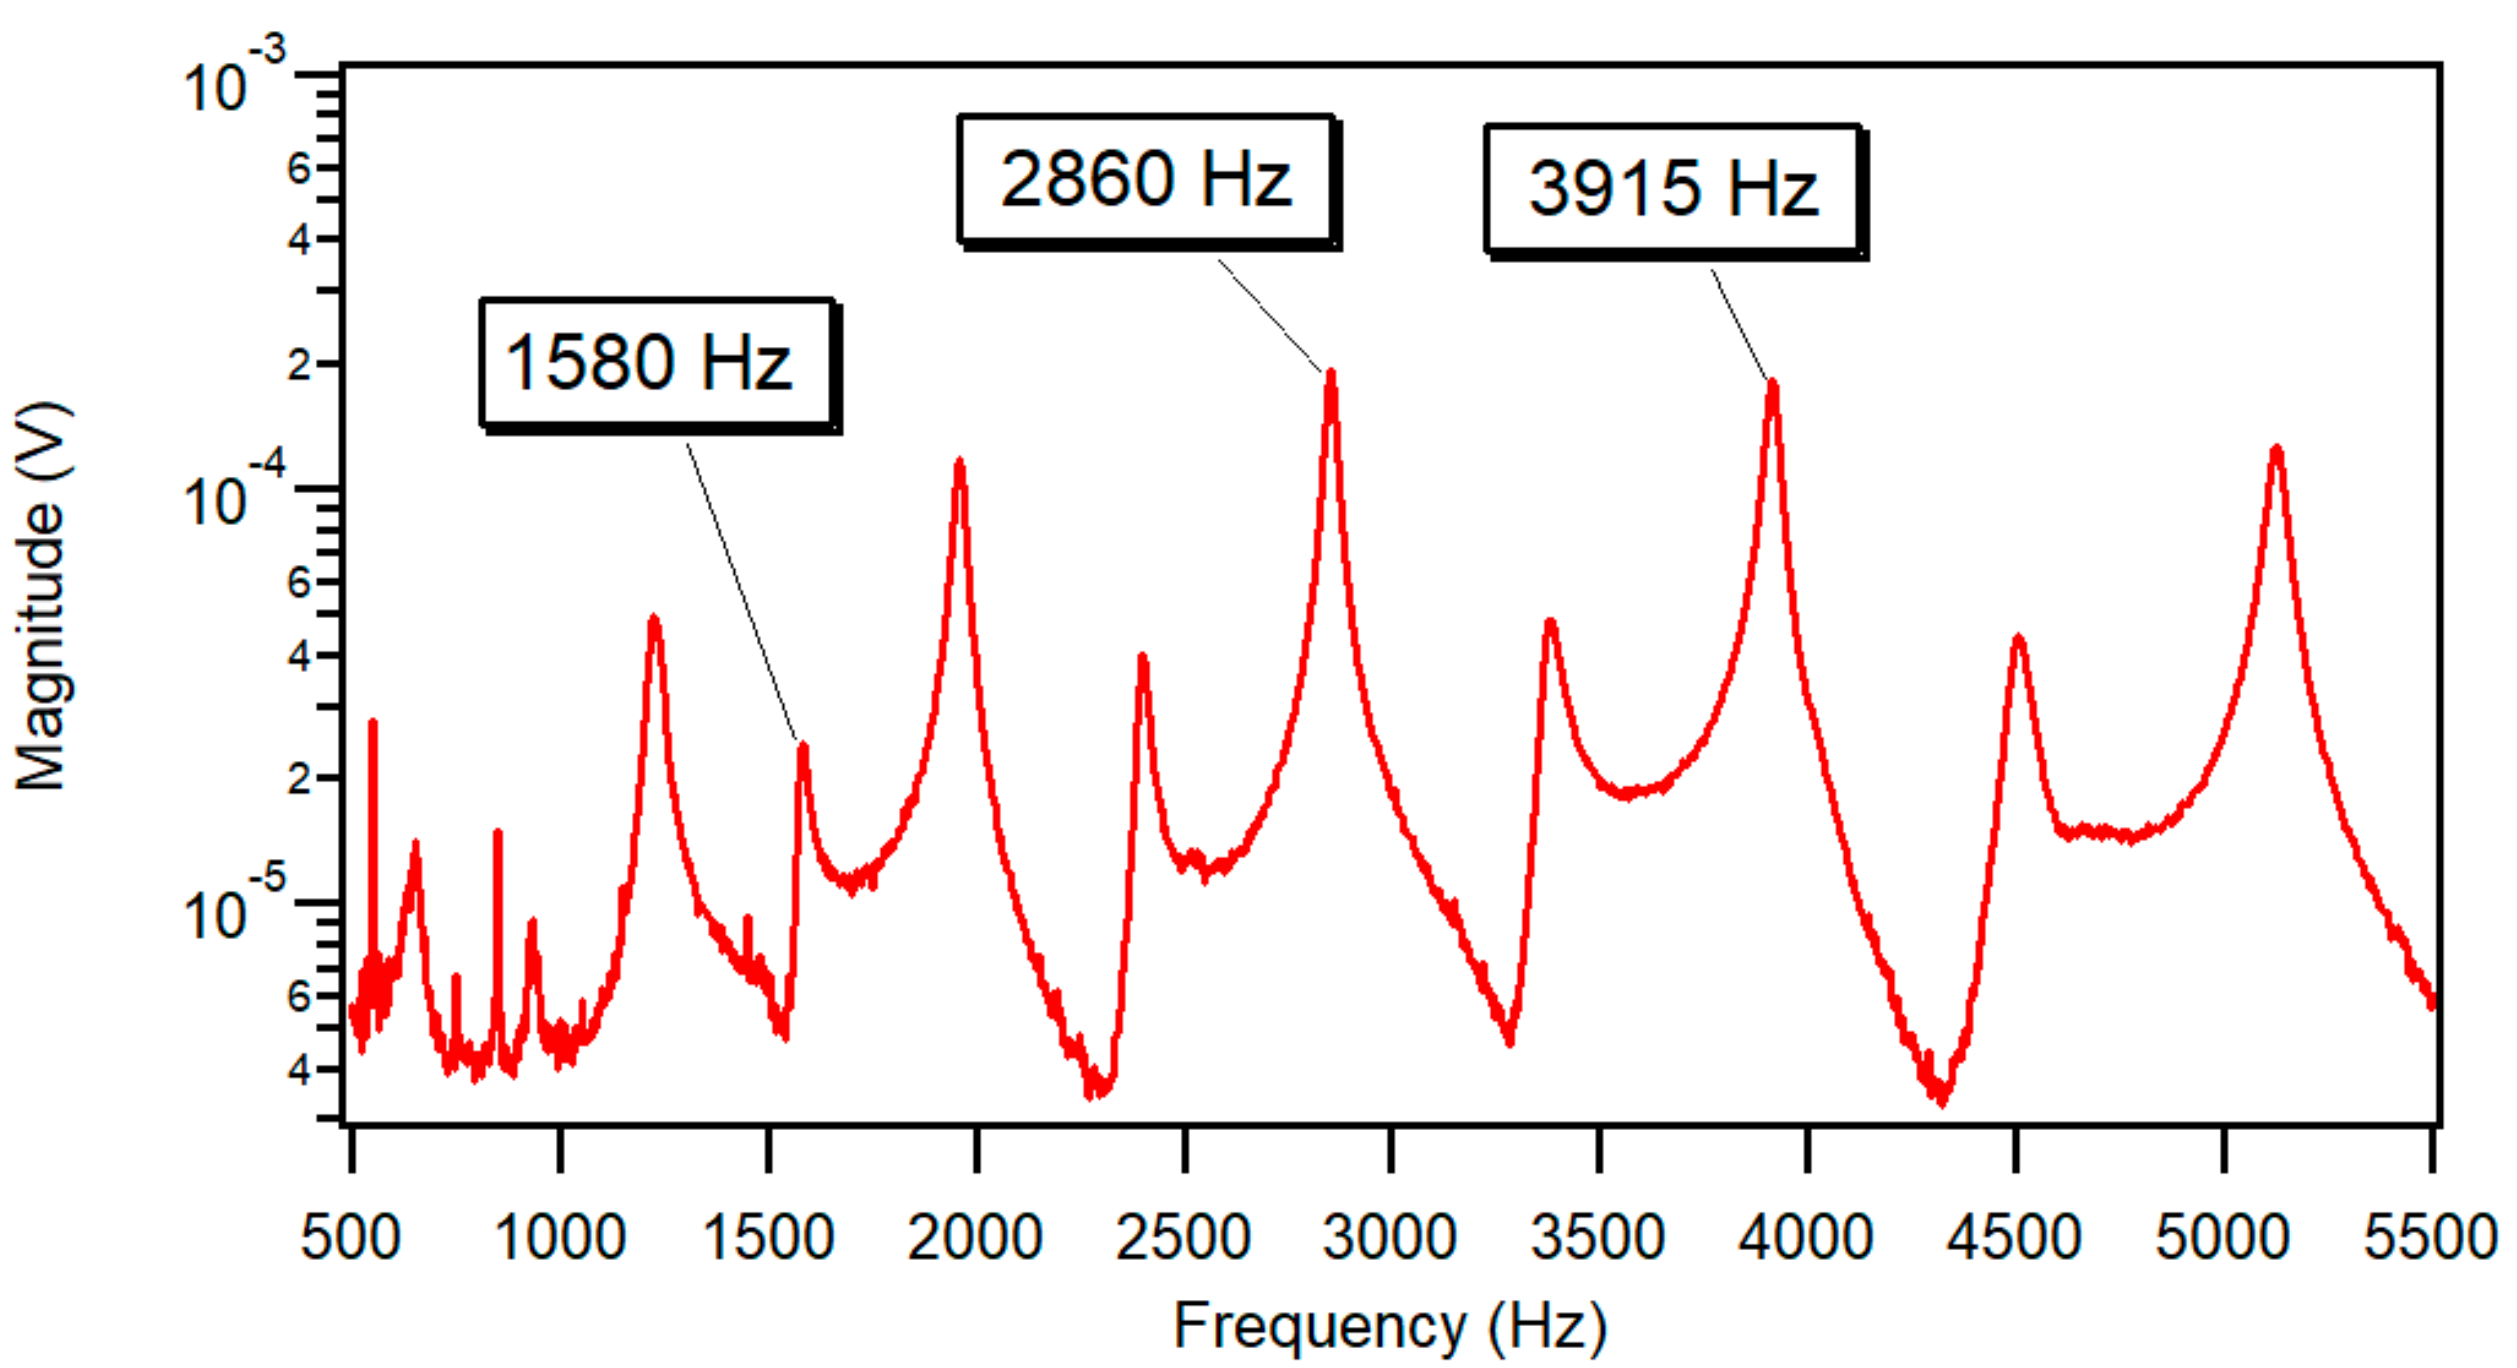
indices were calculated using the magnitudes extracted from the frequency spectra of the acquired signals at the same three frequencies employed in the harmonic excitation tests (1580, 2860 and 3915 Hz). The plots of
Figure 8 report the values of
evaluated from the response taken at sensors S1 and S2, while the composite beam was subjected to impulsive excitation in pristine and damaged conditions. They show that the damage index
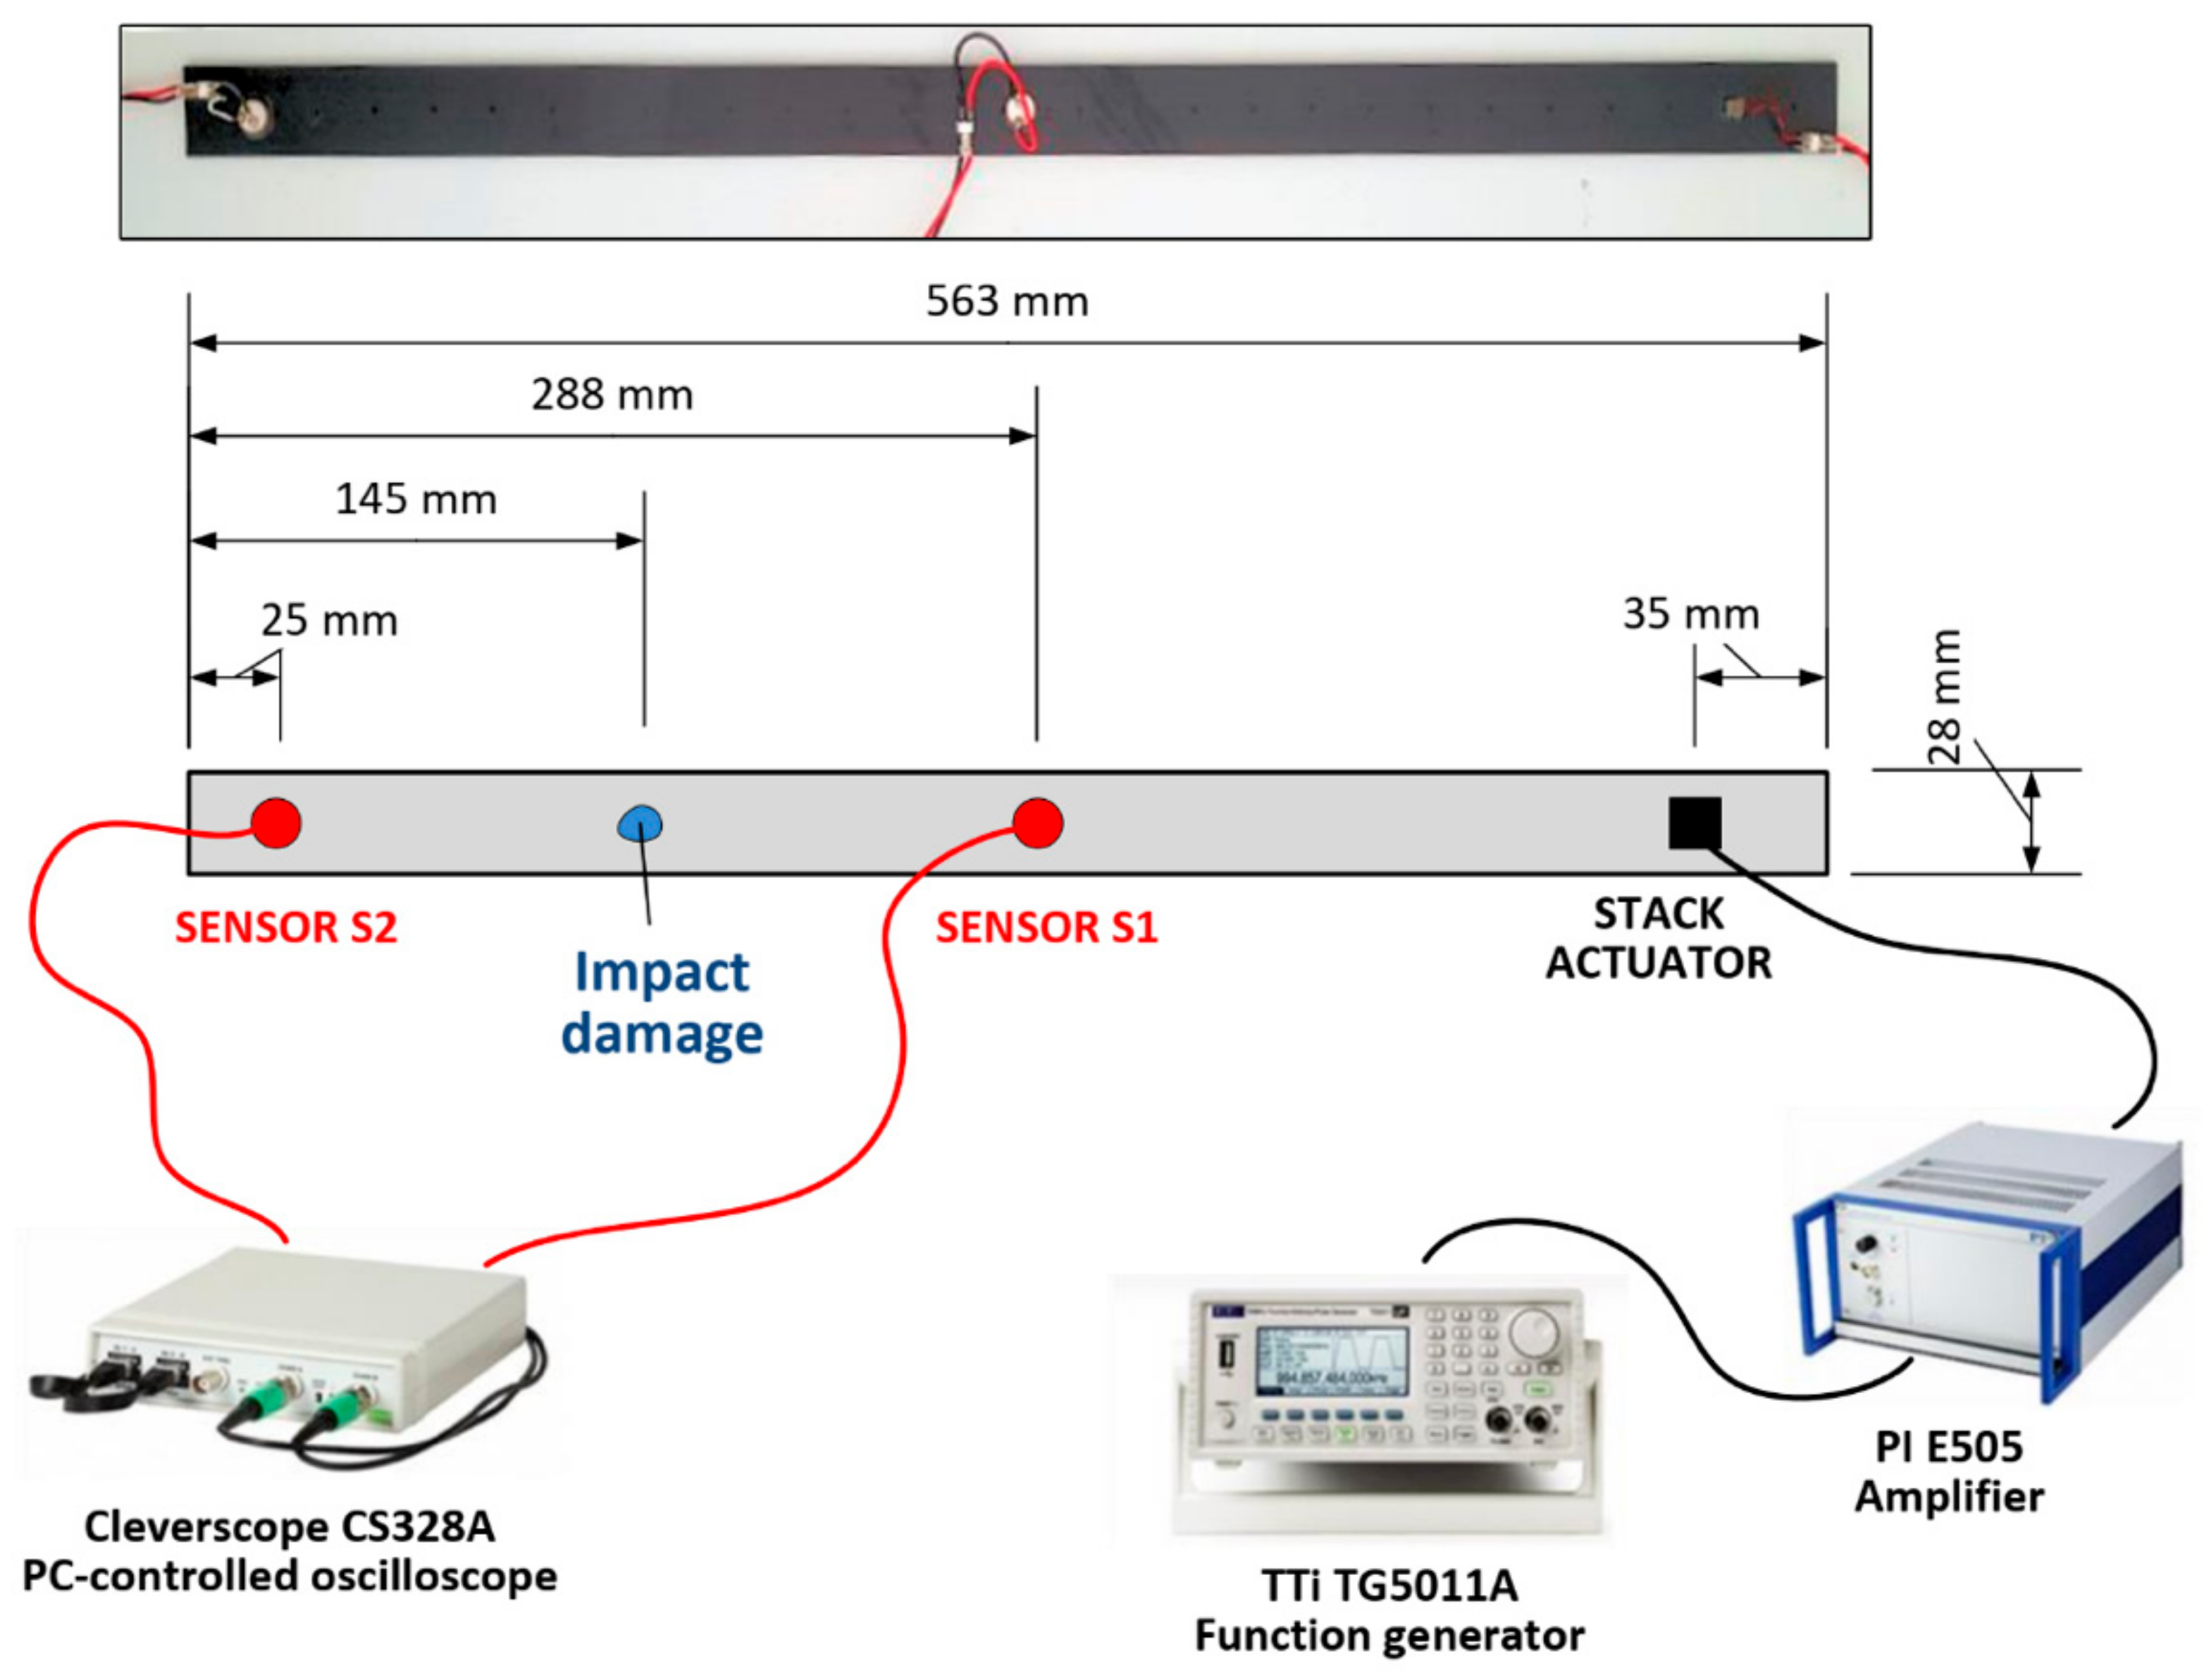
evaluated at the spectral frequency of 1580 Hz provides, for both sensor S1 and sensor S2, a clear identification of the presence of impact damage and also correctly ranks the damage conditions in order of increasing severity. It is seen, however, that the degree of nonlinearity indicated by sensor S1 (i.e., the sensor closer to the actuator) is significantly higher than that evaluated from data acquired at sensor S2. A possible explanation of the influence of the sensor position may be found in the much larger distance of sensor S2 from the actuator (see
Figure 1) and on the transient nature of the pulse wave travelling through the material (as opposed to the stationary propagation occurring during harmonic excitations).
On the other hand, the data acquired at 2860 and 3915 Hz do not provide consistent and reliable evidence of the presence of damage and of its degree of severity, thus indicating a significant influence not only of the sensor position, but also of the frequency chosen for the evaluation of the damage index, as already observed for the harmonic excitation. It can be noted, however, that the values of the damage indices calculated for the frequency of 1580 Hz (at which the technique shows a good sensitivity to the presence of damage) are much higher than those evaluated at the other two spectral frequencies (2860 Hz and 3915 Hz). This suggests that a practical way to improve the effectiveness and robustness of the pulse-based SSM method could be that of calculating the damage indices for different frequencies and then averaging to obtain a global damage indicator. A similar strategy has been used to enhance the visibility of nonlinear effects in damage detection analyses based on ultrasonic wave modulation [
27].
The graphs of
Figure 9, which reports the values of the damage index
obtained by averaging the damage indices
DIS corresponding to the 1580, 2860 and 3915 Hz spectral frequencies, show, for this specific case, the effectiveness of this approach for reliable damage identification using a pulse-based SSM data series.
5. Conclusions
An experimental investigation is presented to assess the efficacy of applying the Scaling Subtraction Method (SSM) through a broadband impulsive excitation to detect impact damage in laminated composite beams. When applied according to its original procedure, the SSM technique can be rather sensitive to the choice of the frequency for the harmonic excitation, which is typically selected among the natural frequencies of the system. A testing methodology based on a pulse excitation would avoid the need of a preliminary modal analysis and would overcome the risk of selecting an interrogating frequency characterized by a low damage detection sensitivity.
To verify the feasibility of a pulse-based SSM approach, two series of tests were carried out on a laminated composite beam. Three levels of damage were introduced on the beam by means of low-velocity impacts. The first series of tests was performed by applying, in turn, three pure harmonic excitations tuned at different natural frequencies of the system (1580 Hz, 2860 Hz and 3915 Hz), while impulsive excitations were applied in the second series of tests. Two nondimensional indices of nonlinearity were used to detect the presence of damage. The first one () measures the difference between the spectral amplitudes of the recorded signal and those of the scaled reference signal at the selected frequency; the second one () represents the cumulative effect of the nonlinear contributions evaluated over all the excitation amplitudes considered in the experiment.
The results of the harmonic-based tests confirm the dependence of the SSM approach on the excitation frequency, since the method was much less sensitive to the presence and level of damage when the higher of the three selected frequencies was adopted. The results of the experiments also show that the presence of damage can be detected regardless of the sensor position.
In view of its good performance, the damage index was adopted to assess the effectiveness of the pulse-based SSM approach, by summing up the magnitudes extracted from the frequency spectra of the acquired signals at the same three frequencies employed in the harmonic excitation tests. The results of the pulse-based analyses show that this index can provide a clear identification of the presence of damage, and correctly grade its severity, when reference to the first frequency (1580 Hz) is made. On the contrary, the indices evaluated at 2860 and 3915 Hz do not provide consistent and reliable indications on the presence and degree of damage.
These findings show that the damage detection quality of the pulse-based SSM depends on the frequency chosen for the analysis, similarly to what was observed for the harmonic-based SSM. To address this issue, a global damage indicator, obtained by averaging the damage indices taken at different frequencies, may be used to improve the robustness of the pulse-based SSM approach.
Although the results presented here are rather promising, further investigations, including the assessment of the influence of the operating and environmental conditions, the estimation of measurement errors, the quantification of the role of uncertainties on the quality of the damage identification, should be conducted to confirm the effectiveness of the pulse-based SSM approach to detect and characterize damage in composite materials in real-case scenarios.
