Article

Automated Identification of Defect Morphology and Spatial Distribution in Woven Composites

1
Department of Civil and Environmental Engineering, The Pennsylvania State University, 212 Sackett Building, University Park, PA 16802, USA
2
Department of Chemical Engineering, Can-Tho University, Campus II, 3/2 Street, Ninh Kieu District, Can Tho City 900 000, Vietnam
3
Department of Automation Engineering, Can-Tho University, Campus II, 3/2 Street, Ninh Kieu District, Can Tho City 900 000, Vietnam
4
Laboratoire Roberval, FRE UTC-CNRS 2012, Université de Technologie de Compiègne, Centre de Recherches de Royallieu, CEDEX 60203 Compiègne, France
5
Mechanical Engineering Department, Center of Research on Polymers and Composites (CREPEC), École Polytechnique de Montréal, Montréal, QC H3C 3A7, Canada
*
Author to whom correspondence should be addressed.
J. Compos. Sci. 2020, 4(4), 178; https://doi.org/10.3390/jcs4040178
Submission received: 12 October 2020 / Revised: 17 November 2020 / Accepted: 20 November 2020 / Published: 27 November 2020
(This article belongs to the Special Issue Feature Papers in Journal of Composites Science in 2020)

Abstract

:
The performance of heterogeneous materials, for example, woven composites, does not always reach the predicted theoretical potential. This is caused by defects, such as residual voids introduced during the manufacturing process. A machine learning-based methodology is proposed to determine the morphology and spatial distribution of defects in composites based on X-ray microtomographic scans of the microstructure. A concept of defect "genome" is introduced as an indicator of the overall state of defects in the material, enabling a quick comparison of specimens manufactured under different conditions. The approach is illustrated for thermoplastic composites with unidirectional banana fiber reinforcement.

1. Introduction

Compared to conventional materials, composites often require complex processes to manufacture. The multitude of parameters makes it harder to optimize manufacture and reach the theoretical potential of material performance. In effect, the microstructure of composites consists not only of the matrix and the reinforcement but also includes residual air, mainly in the form of voids and delaminations. The presence of these defects can significantly influence mechanical performance and failure behavior of materials. In [1], large voids were observed to be the origins of crack formation, while smaller voids distributed through the laminate coalesced and caused the failure at lower applied stress than the nominal strength. These two stages are summarized in [2] as the non-interactive and interactive. The non-interactive stage consists of crack initiation at the largest defects, most favorable in orientation and shape; i.e., is more dependent on the specific defect morphology. The interactive stage, leading to ultimate failure, was more concerned with the distribution of voids rather than their individual shapes and sizes. The Finite Element Method (FEM) study in [3] explored further the influence of defect distribution, showing that distance between voids and the crack tip has a significant influence on fracture toughness of the material, outweighing the impact of larger voids, located further away from the crack. Similarly, [4] showed that both location—closer to the particulate reinforcement and aligned with loading direction—and shape of defects—elongated—negatively influenced mechanical performance of Metal Matrix Composites. Experimental evidence relating changes in mechanical performance to particular morphology and distribution of defects has been provided by [5,6,7]. In [8], Teflon layers were used to force the creation of delaminations that lowered compressive and tensile strength. The study included defects of varying width-to-length ratios and showed changes in failure mode depending on this parameter.
The study in [8] is a good example of an attempt to establish a relationship between mechanical performance, defect morphology, and specific manufacturing parameters. As described in [2], defect—void—formation in Resin Transfer Molding can be controlled with vacuum pressure, resin viscosity, cure temperature, and consolidation pressure. Depending on these parameters, voids can appear between composite layers, inside the layers, or in both locations. However, some aspects of the process, such as removing the air before consolidation, though effective at reducing the air volume trapped inside the composite, are costly. The standard procedure for the analysis of defects in ASTM D 3171 [9] measures bulk content of phases in composite materials but does not provide data on morphology nor distribution of defects. As evidenced, rather than the bulk volume, the voids’ spatio-morphological characteristics are crucial to failure behavior, especially for the aerospace-grade high-performance composites.
Methods relying on 2D imaging, such as optical microscopy and Scanning Electron Microscopy (SEM), lead to more insights into the morphology and distribution of defects. In [1], void content, cross-section area, radius of curvature, and maximum dimensions were determined from optical micrographs processed with image analysis software. The study showed lower shear strength for RTM composites with voids of lower radii of curvature, which led to higher stress concentrations. In [10], E-glass epoxy composite was also studied using optical microscopy, with measurements of the area, largest length of voids, and derived features: equivalent diameter and shape ratio. Based on these values, voids were classified into small, medium, and large, with either non-convex or regular shapes. While accessible, the 2D imaging studies are destructive, limiting their applicability, especially when establishing relationships between defects in the material prior to and after loading. Also, they are time-consuming, difficult to process automatically due to intensity variations; and mostly restricted to the planar characteristics of defects.
The alternative is 3D imaging, e.g., X-ray micro-CT that provides a non-destructive view of the volume of material at resolutions reaching less than a micrometer, allowing detection of defects as small as the preexisting cracks and microvoids. A study in [11] made use of X-ray micro-CT measured defect volume to identify damage mechanisms in CFRP laminate after low-velocity impact. The work [7] studied the void volume measured on X-ray microtomographic scans of glass fiber reinforced polymer composite used for wind turbine blades. No connection was observed between the global volume of voids and fatigue behavior, but a significant correlation was found between crack formation and large volume voids. In [12], an approach was proposed to identify automatically and classify defects in polymeric composites after water-jet cutting. The methodology relies on applying the wavelet transform to extract information about the size, orientation, and location of defects, followed by a classification based on geometric features. Despite the originality of this approach, the information retrieved served mostly to identify pre-determined classes of defects rather than to explore their morphological types. In [5] the complex geometry of individual pores retrieved from X-ray microtomographic scans of carbon/carbon composites has been used to study their impact on the elastic modulus. The authors of [13] went further by exploring the impact of selected pore conglomerates on the mechanical properties of a unidirectional carbon fiber epoxy composite. In both cases, the selection of pores and clusters was made manually based on an arbitrary choice of the operator, hence limiting the scope of the analyzed geometry.
The introduction of arbitrary criteria is present in other aspects of tomographic analysis. For example, in [13], the pores in a unidirectional carbon fiber reinforced polymer are divided into three groups based on volume. The threshold values for each group are selected arbitrarily by the user. Another type of defects, microcracks, and delamination due to fatigue damage in carbon-epoxy laminate were identified by setting arbitrary thresholds during the X-ray micro-CT scan segmentation. Similarly, arbitrary criteria have been used in [14,15] to observe the distribution of defects by looking at defect volume in layers of constant thickness. In both cases, the use of arbitrary criteria brings two major drawbacks in the analysis. Firstly, it is less probable that such classification will comply with the “natural” categories of a subdivision, as suggested by Friedman in [16] in his mathematical analysis of clustering. Secondly, the use of arbitrary division may induce skew if new data is added to the analysis.
In the present work, we propose a solution to this problem based on a range of clustering algorithms. Various clustering methods have already found their place in data segmentation in the medical field [17,18]. In composites, they are predominantly used to identify damage mechanisms from the results of Acoustic Emission tests [19,20,21]. Their application to the study of microstructure morphology is scarce. In a previous publication [22], we have proposed a clustering method to identify morphological types of natural fibers and determine the extent of fiber damage introduced during manufacture. The approach presented was general but limited to the morphological analysis of only one specimen. Here, we would like to extend this methodology by developing features to describe the spatial distribution of defects within a specimen. This approach simplifies the process of quantitative analysis of defects by combining a reduced-order representation of defects, based on the classification of morphological features and then using this representation to determine regions in the specimen or entire specimens with similar spatio-morphological characteristics, characterized by the proposed higher-order feature: “defect genome”.
The structure of the article stands as follows: we begin by describing the experimental procedure of specimen manufacture and X-ray micro-CT scans, image processing, and mesh reconstruction. From the 3D mesh, we extract geometric features and identify morphological types of defects. Then we propose spatial descriptors and show how hierarchical clustering can be used to identify conglomerates of defects within the specimen. Finally, based on this morphological and spatial classification, a defect “genome” is proposed. To illustrate this methodology, we chose a unidirectional banana fiber-reinforced thermoplastic composite, which is highly susceptible to manufacturing conditions. Thus, even with a reduced sample size, it offers a wide range of observable defects.

2. Materials and Methods

2.1. Material

The material in this study is a thermoplastic composite reinforced with unidirectional banana fibers. The fibers were extracted from the chopped stems of the banana that were subjected to retting (Figure 1) at the Department of Chemical Engineering, Can-Tho University, Vietnam [23]. The fibers were then dried and compacted with acrylonitrile butadiene styrene (ABS) thermoplastic films in a column-type compression molding machine from Pan Stone Hydraulics Indus. Co. Ltd. (Taichung Hsien, China). The intended weight fraction of fibers was 40%. Seven specimens were manufactured for different compression time, temperature, and pressure (Table 1). Three of the specimens (a3, a4, a5) were manufactured with the same parameters to determine the process variability. Other specimens served for exploratory analysis. The samples for X-ray microtomography were cut out from the central part of the specimens with nominal dimensions 8 × 12 × 30 mm 3 . These dimensions were selected to measure the largest volume of material possible while maintaining a resolution of ∼ 20 μ m, permitting observation of defects in the material, including cracks.

2.2. X-ray Microtomography

The specimens were scanned at the Kyoto Institute of Technology, in Kyoto, Japan on a FLEX-M863-CT laboratory-scale X-ray microtomograph from Beamsense Co. Ltd. (Osaka, Japan). The acceleration voltage of 117 kV was used for the scans. A similar resolution was selected for each specimen (Table 2) to provide consistent results during image processing. The reconstruction of tomograms was done with the BeamsenseCT Ver. 1.5 software from Kyoto Institute of Technology. The speckle artifacts and illumination fluctuations were removed by software correction. The reconstructed tomograms were stored as stacks of 1500 two-dimensional images of 1000 × 1000 pixel in size. Each tomogram image represented the coefficient of X-ray attenuation μ using values from the 16-bit grayscale spectrum (Figure 2a).
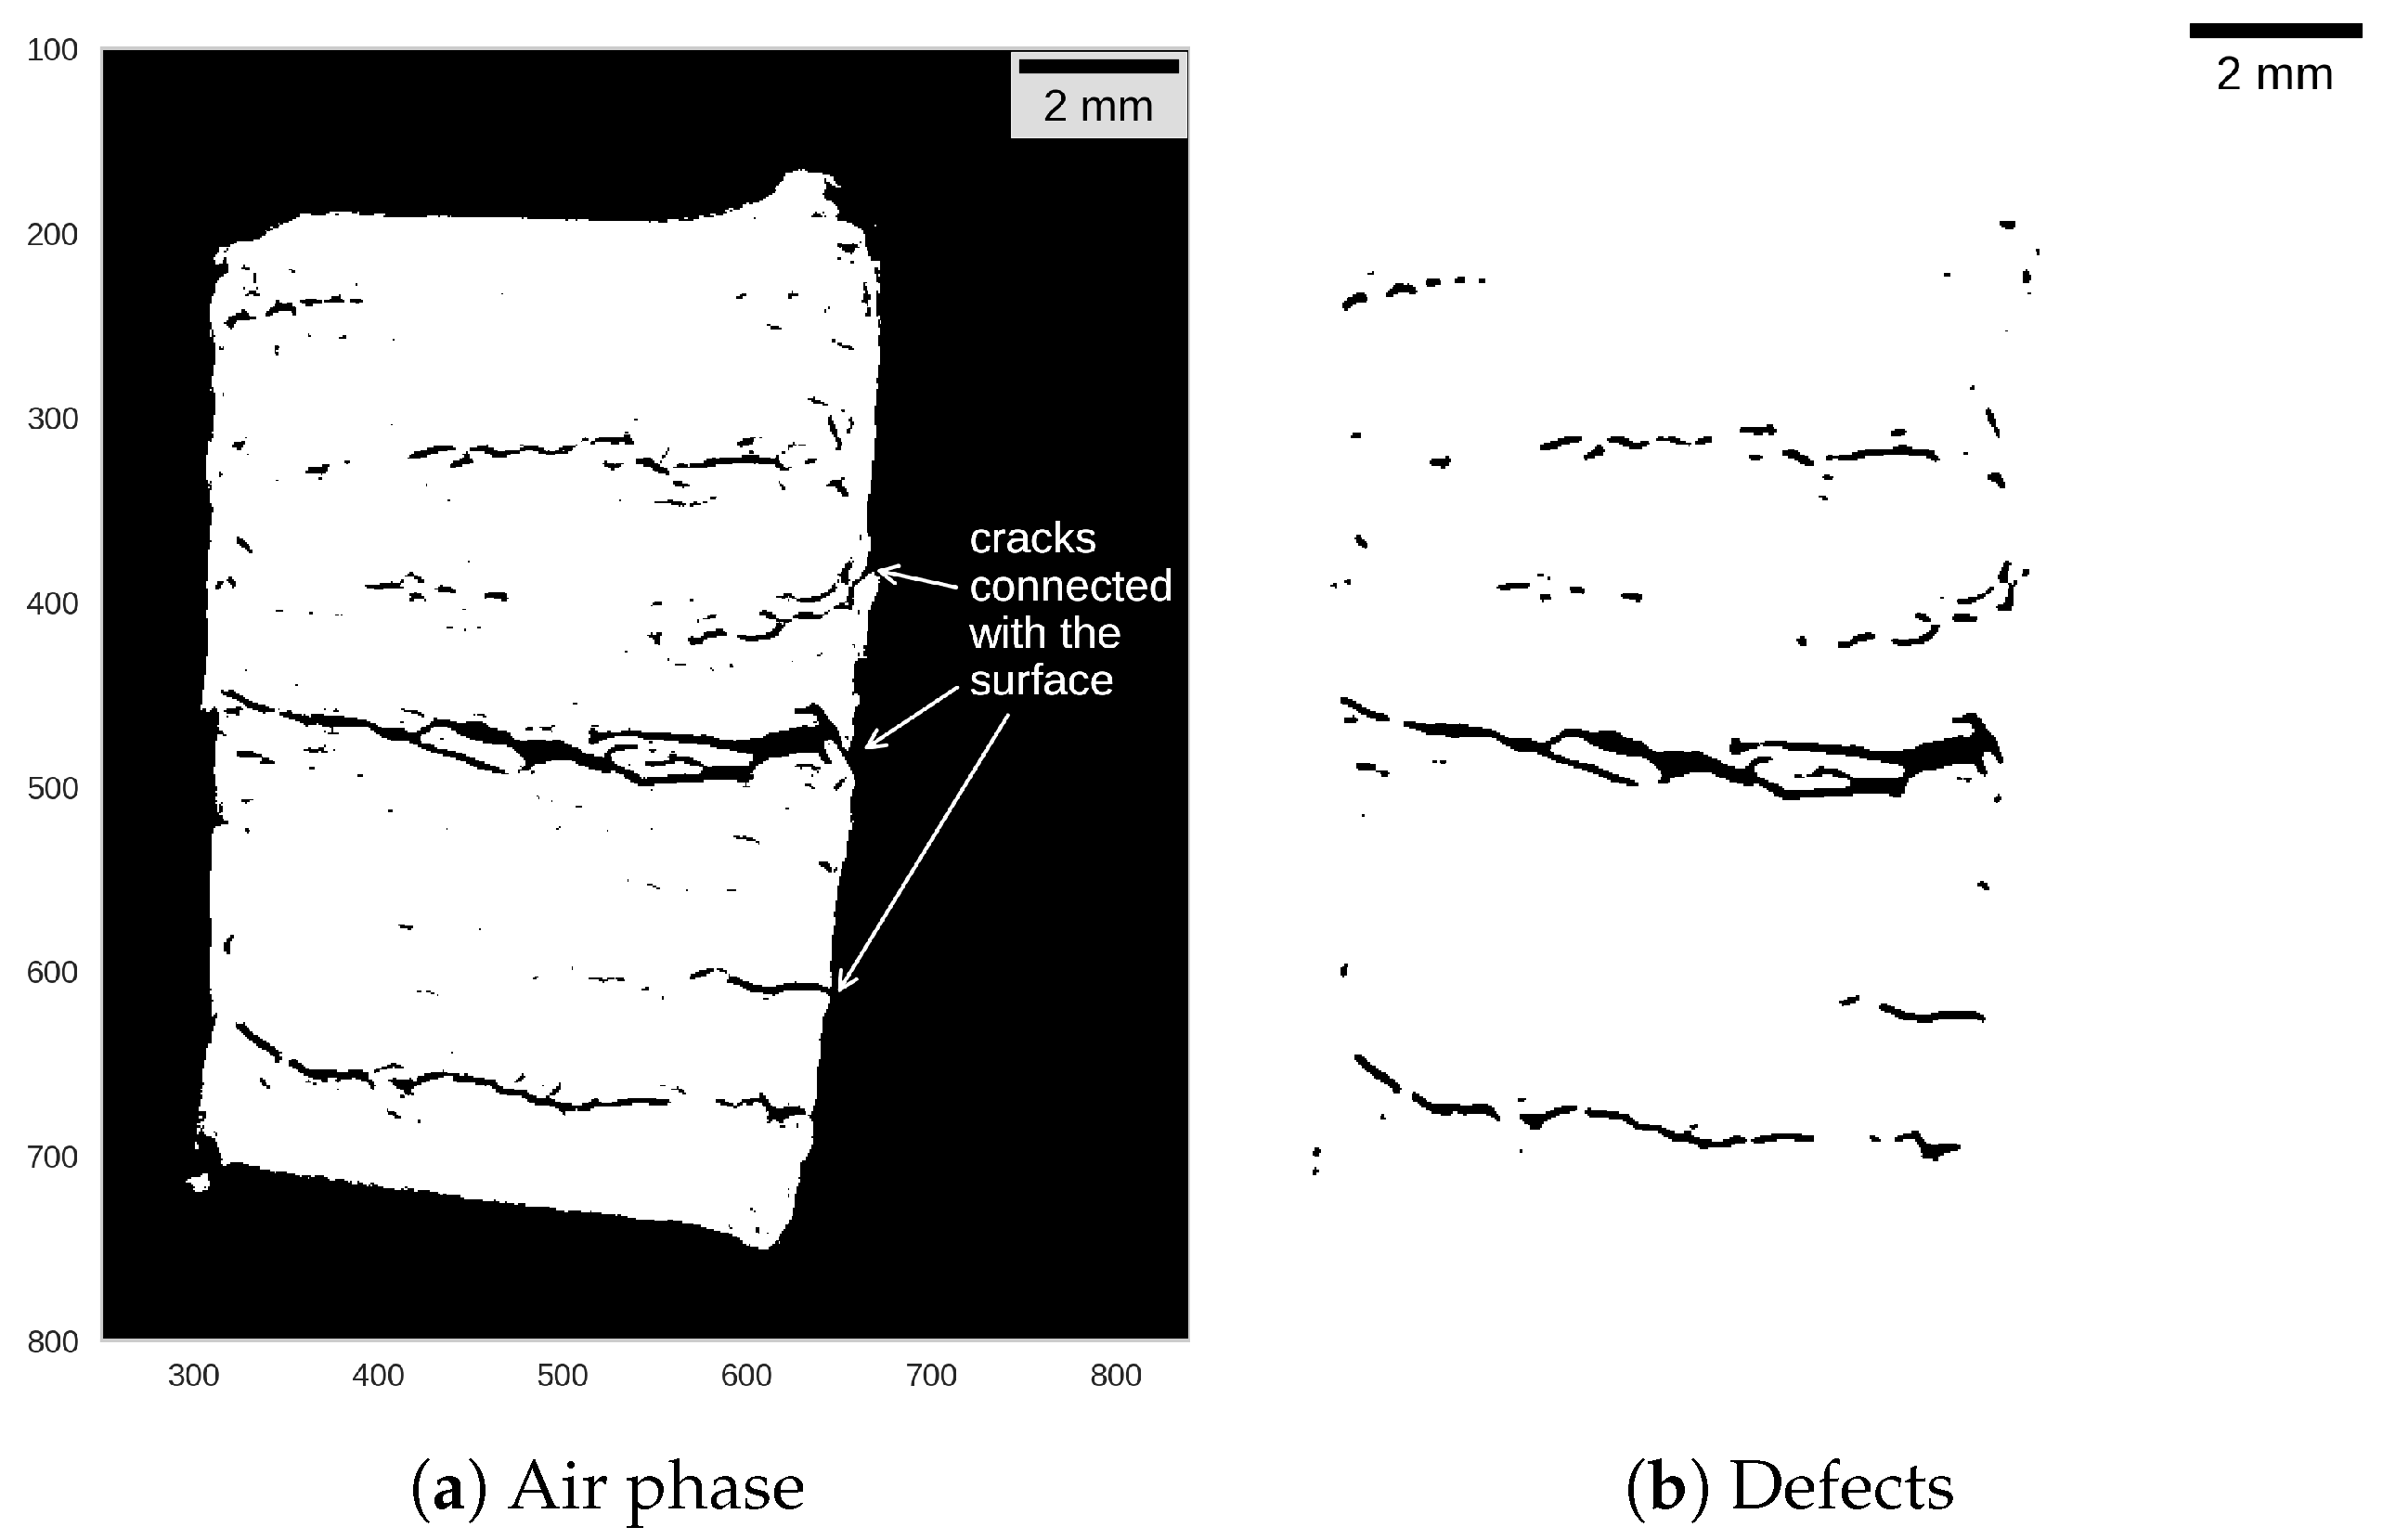
The rest of the image processing was performed with a custom Python 3.7 software following the procedure developed by the authors in [22]. The tomograms were segmented automatically based on criteria determined by a k-means algorithm with manually adjusted cluster origins. The segmentation yielded a partition of voxels into three subsets corresponding to air, polymer matrix, and fibers (Figure 2b). Note, that the air fully encompasses the specimen (Figure A1a). The cracks reaching the specimen’s surface were thus merged with the geometry of the air surrounding the specimen. To isolate these cracks, a masking algorithm was developed, further described in Appendix A.

2.3. Mesh Reconstruction

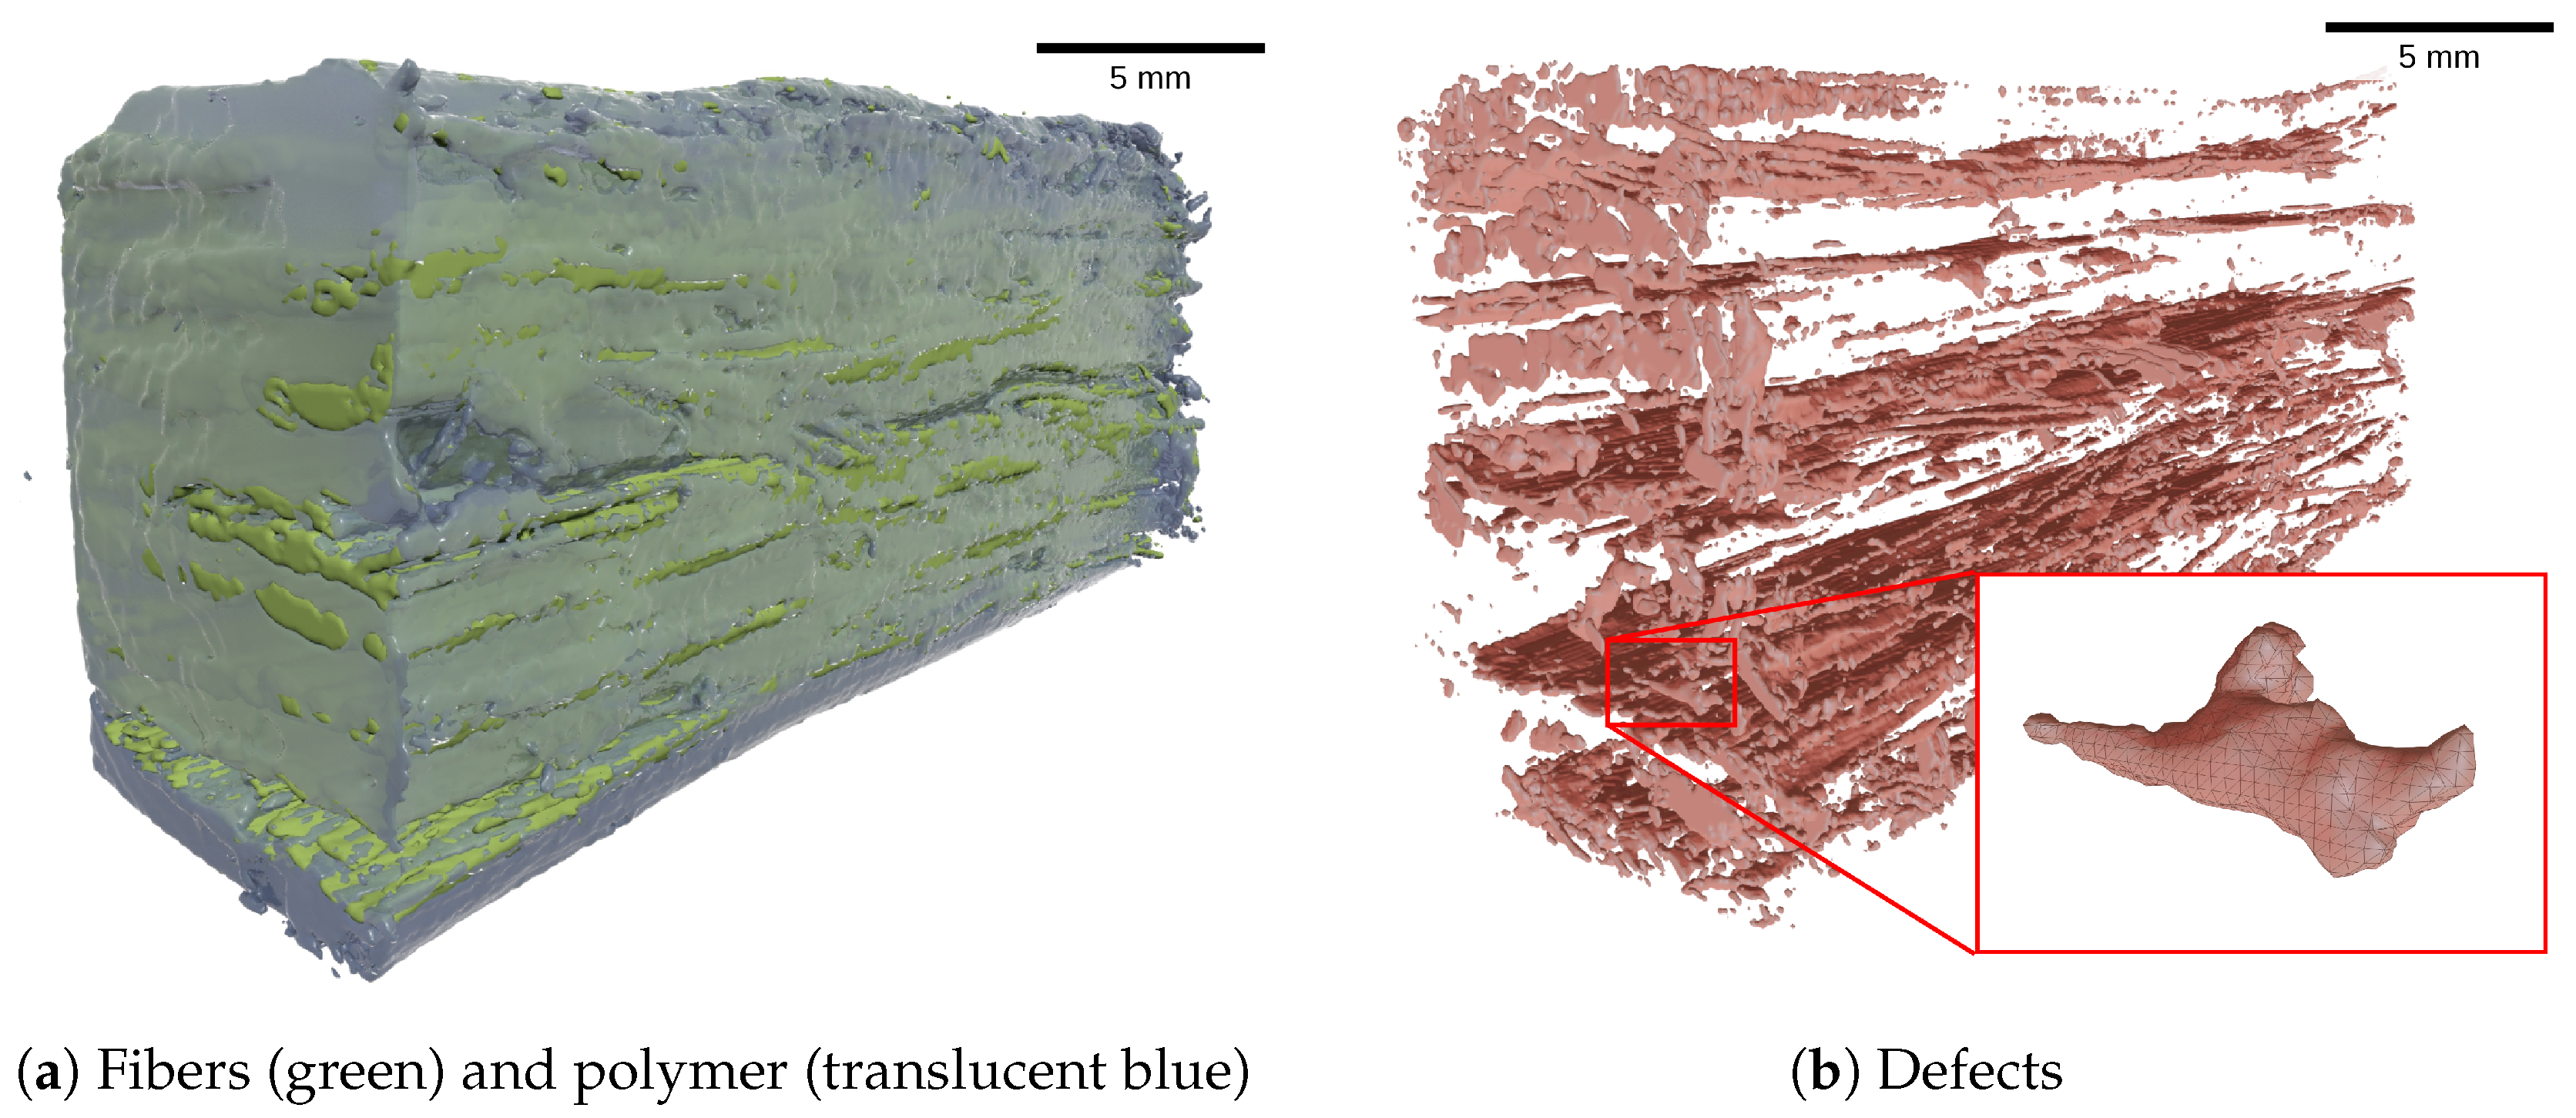
The 3D surface mesh of each phase in the material has been extracted from segmented tomograms with the marching cubes algorithm described in [24,25]. A view of the reconstructed geometry of fibers and polymer matrix is shown in Figure 3a. This study focuses on the mesh corresponding to defects (Figure 3b).

3. Characterization of Defects

The geometry and spatial distribution of defects can be characterized by extracting features from the generated surface mesh. To achieve this, we propose a methodology divided into the following three main parts: characterization of the morphology of defects, identification of spatial clusters, and definition of higher-order features. While the extraction of lower-order features gives a quantitative overview of the microstructure, their interpretation can be challenging, especially when the number of features becomes large. By combining lower-order features into a higher-order one, a more succinct characterization becomes possible, with one feature codifying an array of co-existing features. The defect genome introduced in Section 3.4 is such a higher-order feature, enabling comparisons between the type and distribution of combined defects in different parts of a particular specimen, or between different specimens.

3.1. Geometric Features

Each phase object was characterized following the procedure described in [22]. The following geometric features were measured:
  • surface S,
  • volume V,
  • sphericity S,
  • box dimensions b 1 , b 2 , b 3 ,
  • aspect ratio A R = min ( b 1 , b 2 , b 3 ) max ( b 1 , b 2 , b 3 ) .
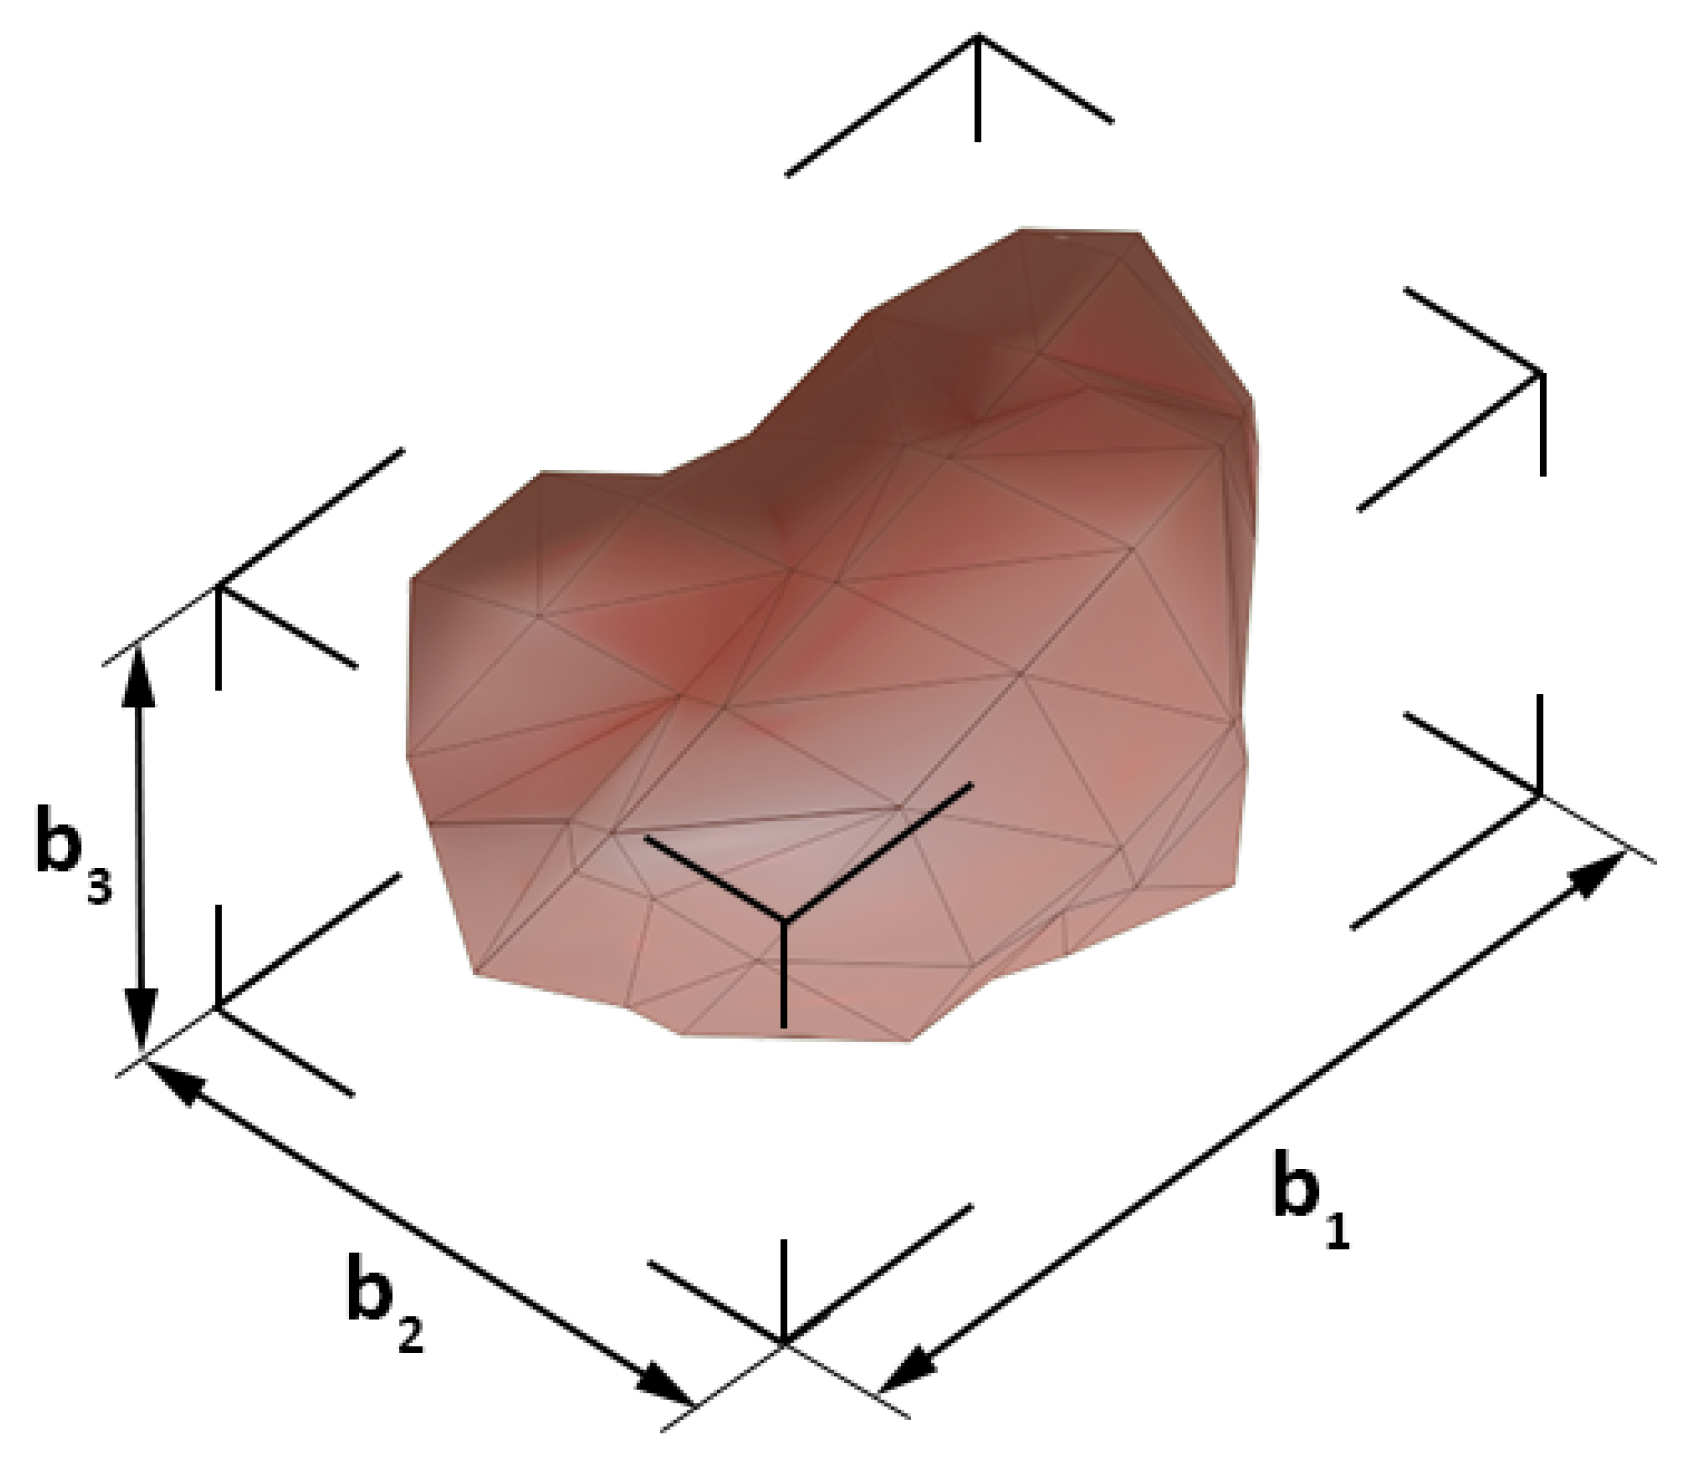
The box dimensions of a defect are the dimensions of the smallest rectangular box encompassing its geometry (Figure 4), where the orientation of the box matches the principal axes of inertia of the defect. The dimensions are ordered from the largest to the smallest and can be interpreted as length, width, and thickness of the object, but to avoid confusion with the geometric descriptors defined in [22], we will keep referring to them as box dimensions b 1 , b 2 , and b 3 . This geometric descriptor replaces the diameter and length measured for fibers, as the geometry of observed defects was too complex for these measurements to be unambiguous. The aspect ratio A R is the ratio of the first ( b 1 ) to the average of the two other box dimensions. Sphericity is a geometric feature used to characterize the complexity of an object independently of its size [7,26]. It is defined as
S = 6 π 1 2 V S 3 2 .
The sphericity of a sphere is equal to 1 with decreasing values implying an elongation or flattening of a geometry. Prior to classification, the features are centered and normalized in the 0–1 range. Each set of measurements is labeled with a unique name to retain a connection to the original defect.

3.2. Morphological Classes

The set of geometric features of a defect is a descriptor of its morphology. Based on the variability of features for all defects, morphological classes can be automatically identified following [22]. A hierarchical agglomerative clustering algorithm is used to find clusters of objects that are close to each other in the n-dimensional space of the n geometric features considered. The clusters are determined hierarchically, i.e., the Euclidean n-dimensional distances between objects are measured in each step of the algorithm, and then those objects and clusters closest to each other are grouped. The algorithm continues until all objects form one single cluster. The information about cluster membership is retained, and all intermediary steps can be explored on a dendrogram graph. The choice of a threshold distance d t , which is the maximal distance between objects (or clusters) for a grouping to occur, determines the final division into classes.
The selection of d t is an open problem in classification. It can be chosen manually or set to an arbitrary value. The groups determined with the clustering algorithm correspond to the defects which have similar geometric parameters, i.e., a comparable morphology. The smaller the value of d t , the more similar are the objects in a class. Here, we use Davies-Bouldin index [27]
D B = 1 k i = 1 k max i k e i + e h d i h ,
where e i is the average Euclidean feature distance of the objects in class i to the centroid of class i, and d i h is the distance between the clusters i and h. Smaller values of D B indicate compact clusters, far from each other in the feature space, indicating significant differences in defect morphology.

3.3. Spatial Features and Conglomerates

The spatial distribution of defects can be analyzed qualitatively by plotting their positions as a function of their distance from a selected point of reference. This could be a distance from the mold inlet/outlet, or a position relative to the top surface of the manufactured part. We will characterize the position of a defect by determining the coordinates of its centroid c = { x c , y c , z c } where
x c = 1 M i = 1 M x i , y c = 1 M i = 1 M y i , z c = 1 M i = 1 M z i ,
where x i , y i , z i are the coordinates of M nodes making up the surface mesh of a given defect. If we consider the values of x c , y c and z c as spatial features, then a classification can be performed with the same hierarchical clustering algorithm that was used to identify morphological types. While the clustering of geometric features informs about the different morphologies of defects, the clustering of spatial features identifies conglomerates of defects within the specimen. The threshold distance d t now has a physical interpretation of the maximal distance between the centroids of defects for them to be considered a part of the same spatial group. In other words, all defects whose centroids are within a d t distance from each other belong to the same group, further referred to as the “conglomerate”.

3.4. Defect Genome

The preceding sections have provided methods to group the defects of similar morphology or located in the same region of the specimen. These two types of information can be combined into a higher-order feature to identify conglomerates with a similar morphological buildup. We propose a defect “genome” which represents the relative volume percentage of each type of defect in a conglomerate. The genome G is a tuple of length P, equal to the number of all identified morphological classes m p , p = 1 , , P
G = [ V m 1 * , V m 2 * , , V m p * , , V m P * ]
where V m p * is a relative volume of all defects belonging to a class m p in reference to the total volume of all defects. If we index the set of defects in a conglomerate h by I and the defects belonging to the morphology class m p by J, then
V m p * = k I J v k k I v k = volume of all defects of class m p in conglomerate h volume of all defects in conglomerate h
where v k is the volume of a given defect. Vector G can be evaluated for the entire specimen, informing us about the volume contribution of each type of defect and thus enabling fast comparisons of the state of defects between specimens or between regions of interest in a single specimen. For example, if a conglomerate contains a crack, its complexity can be evaluated by checking the volume fraction of accompanying defects, usually the elements of a larger fracture that appear disconnected at higher scan resolutions.

4. Results and Discussion

The proposed methodology of defect characterization has been applied to specimens a1–a7 described in Section 2.1. The results of each step of the treatment are discussed in the sections below.

4.1. Phase Composition

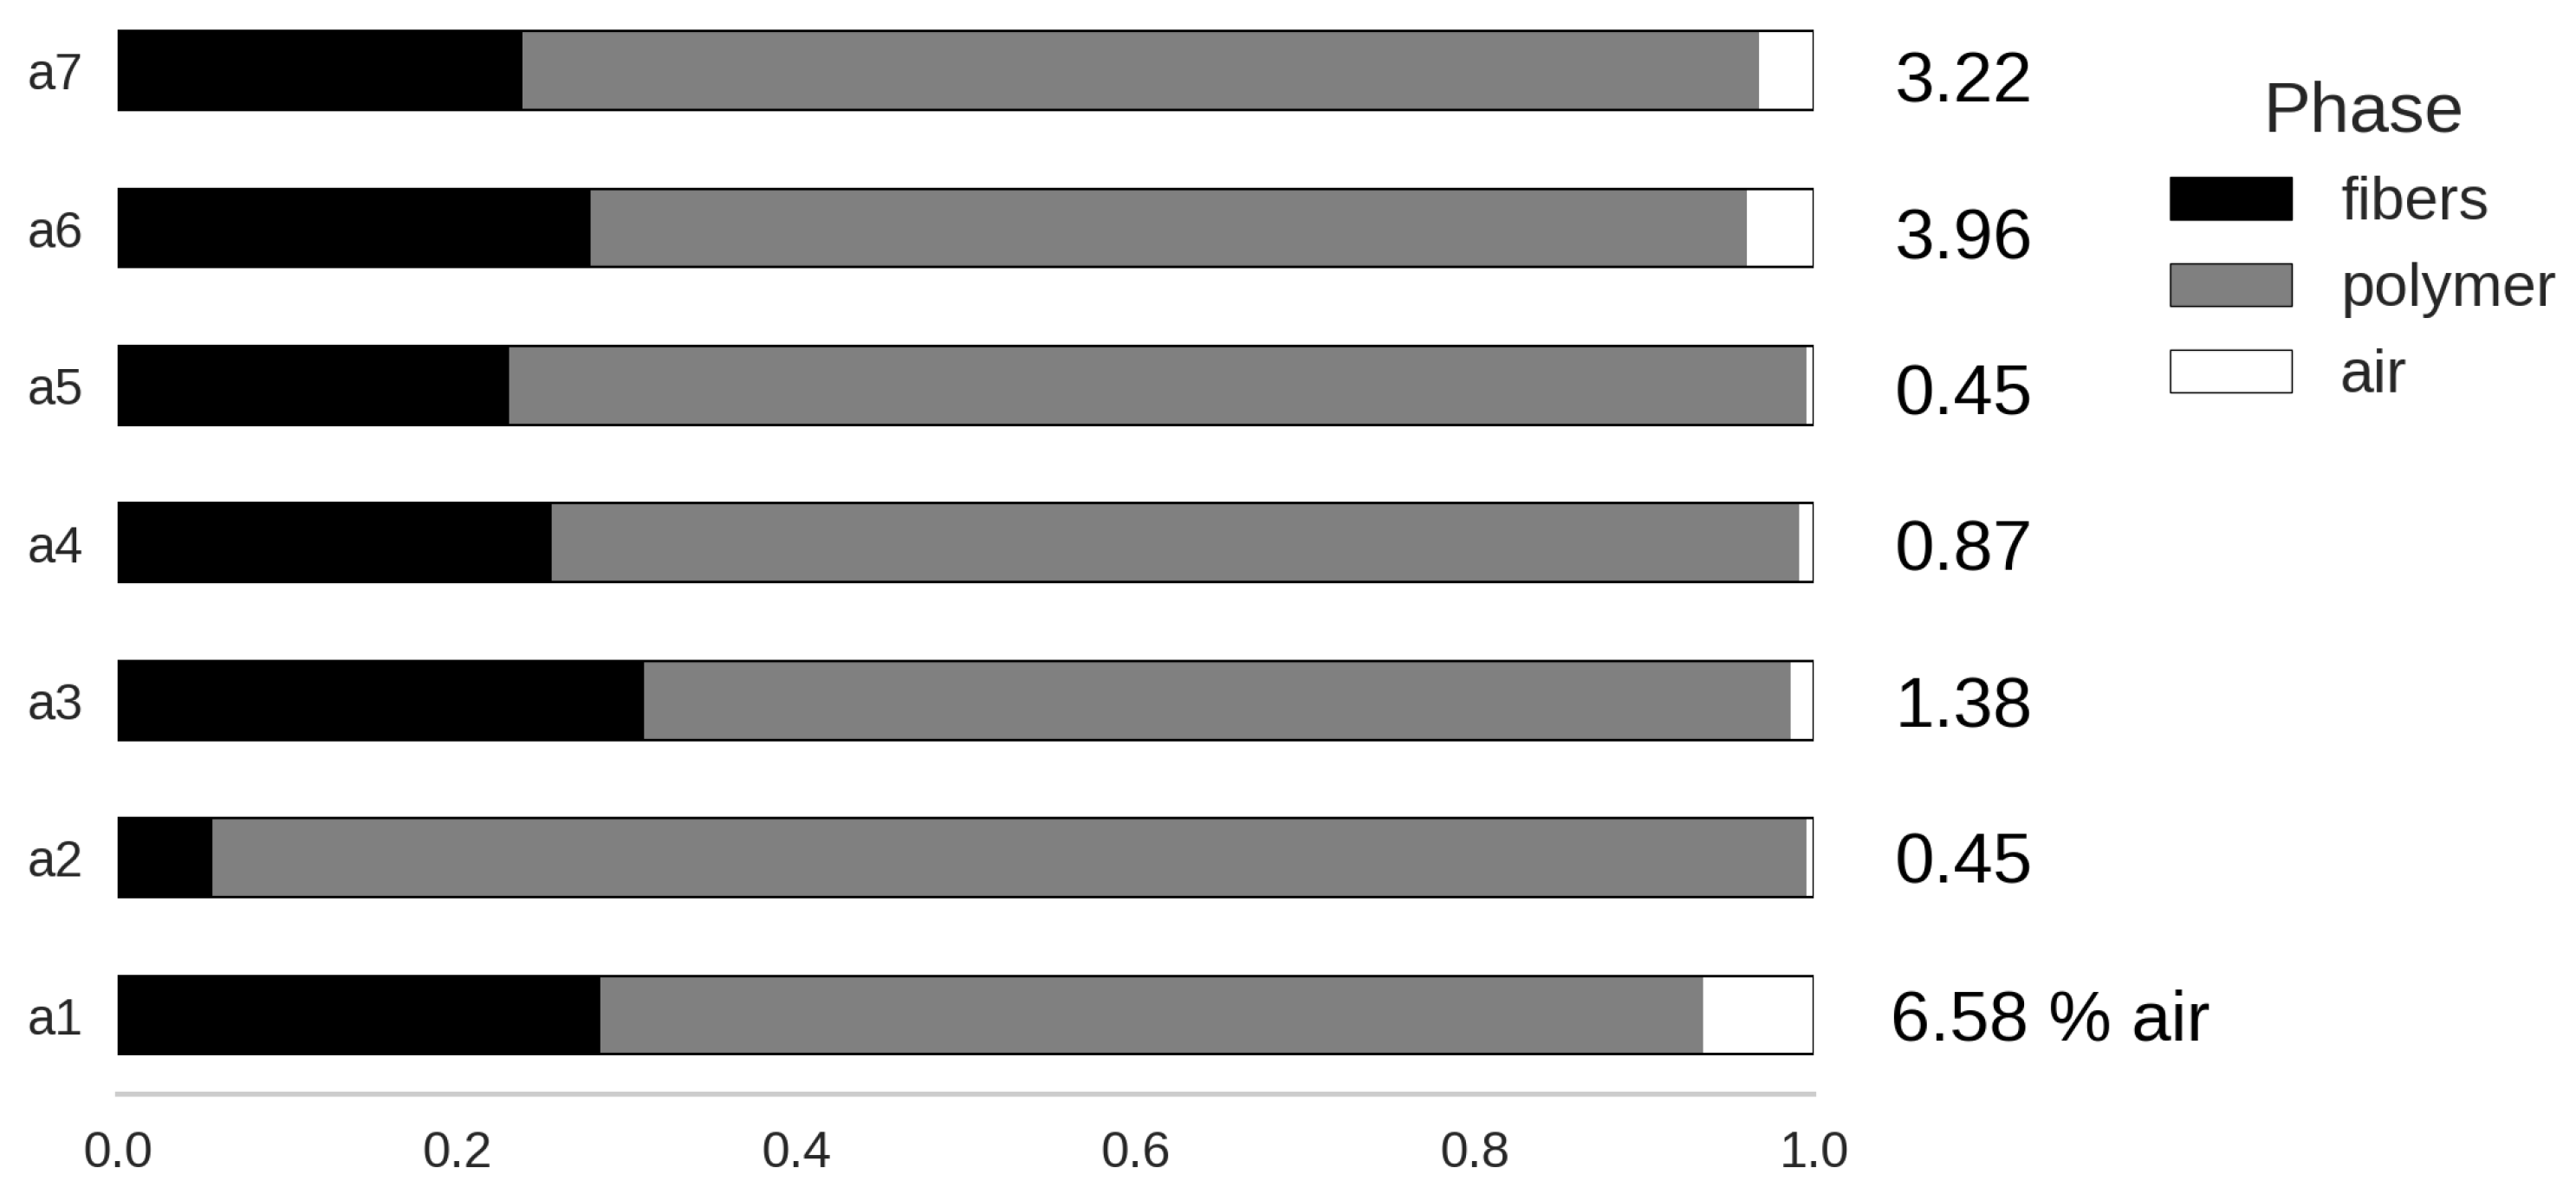
The intended weight fraction of fibers was 40% for all specimens. The density of composite constituents was measured giving 1.35 g cm 3 for banana fibers and 1.03 g cm 3 for ABS. Thus, the intended fiber volume fraction was 33.7%. The phase volume fractions of fibers, polymer, and air for all specimens obtained from the X-ray microtomographic study are shown in Figure 5. The average fiber volume fraction was of 26.6 ± 3.0% relative to all phases in the material, and 27.4 ± 3.4% in relation to the polymeric matrix only. The discrepancy between this average value and the intended one may be explained by the small size of the examined specimens, where local variability could cause substantial deviations. This is evident for specimen a2, which contains one ply of reinforcement less than the other specimens.
The volume percentage of defects has shown considerable variation. Specimen a1 processed at the lowest temperature of 150 °C had as much as 7% residual air. A probable cause of bad impregnation is the high viscosity at this temperature, that decreased polymer mobility, and thus the fibrous reinforcement was not wholly impregnated. Specimens a6 and a7 were processed for the longest time, namely 20 min, resulting in 4 and 3% of voids, respectively. It is possible that a high temperature combined with a long compression time may have resulted in the expansion of volatiles from degrading fibers. The rest of the specimens were fabricated in similar conditions, but with a shorter time, so the variations in the measured void content were less pronounced, with an average of 1%.

4.2. Defect Morphology

The reconstruction of the air phase yielded meshes with the parameters described in Table 3. From the initial set of 75 thousand objects, 10 thousand were removed on account of noise and reconstruction artifacts. The geometric features were extracted and analyzed from the remaining set of 65 thousand defects.
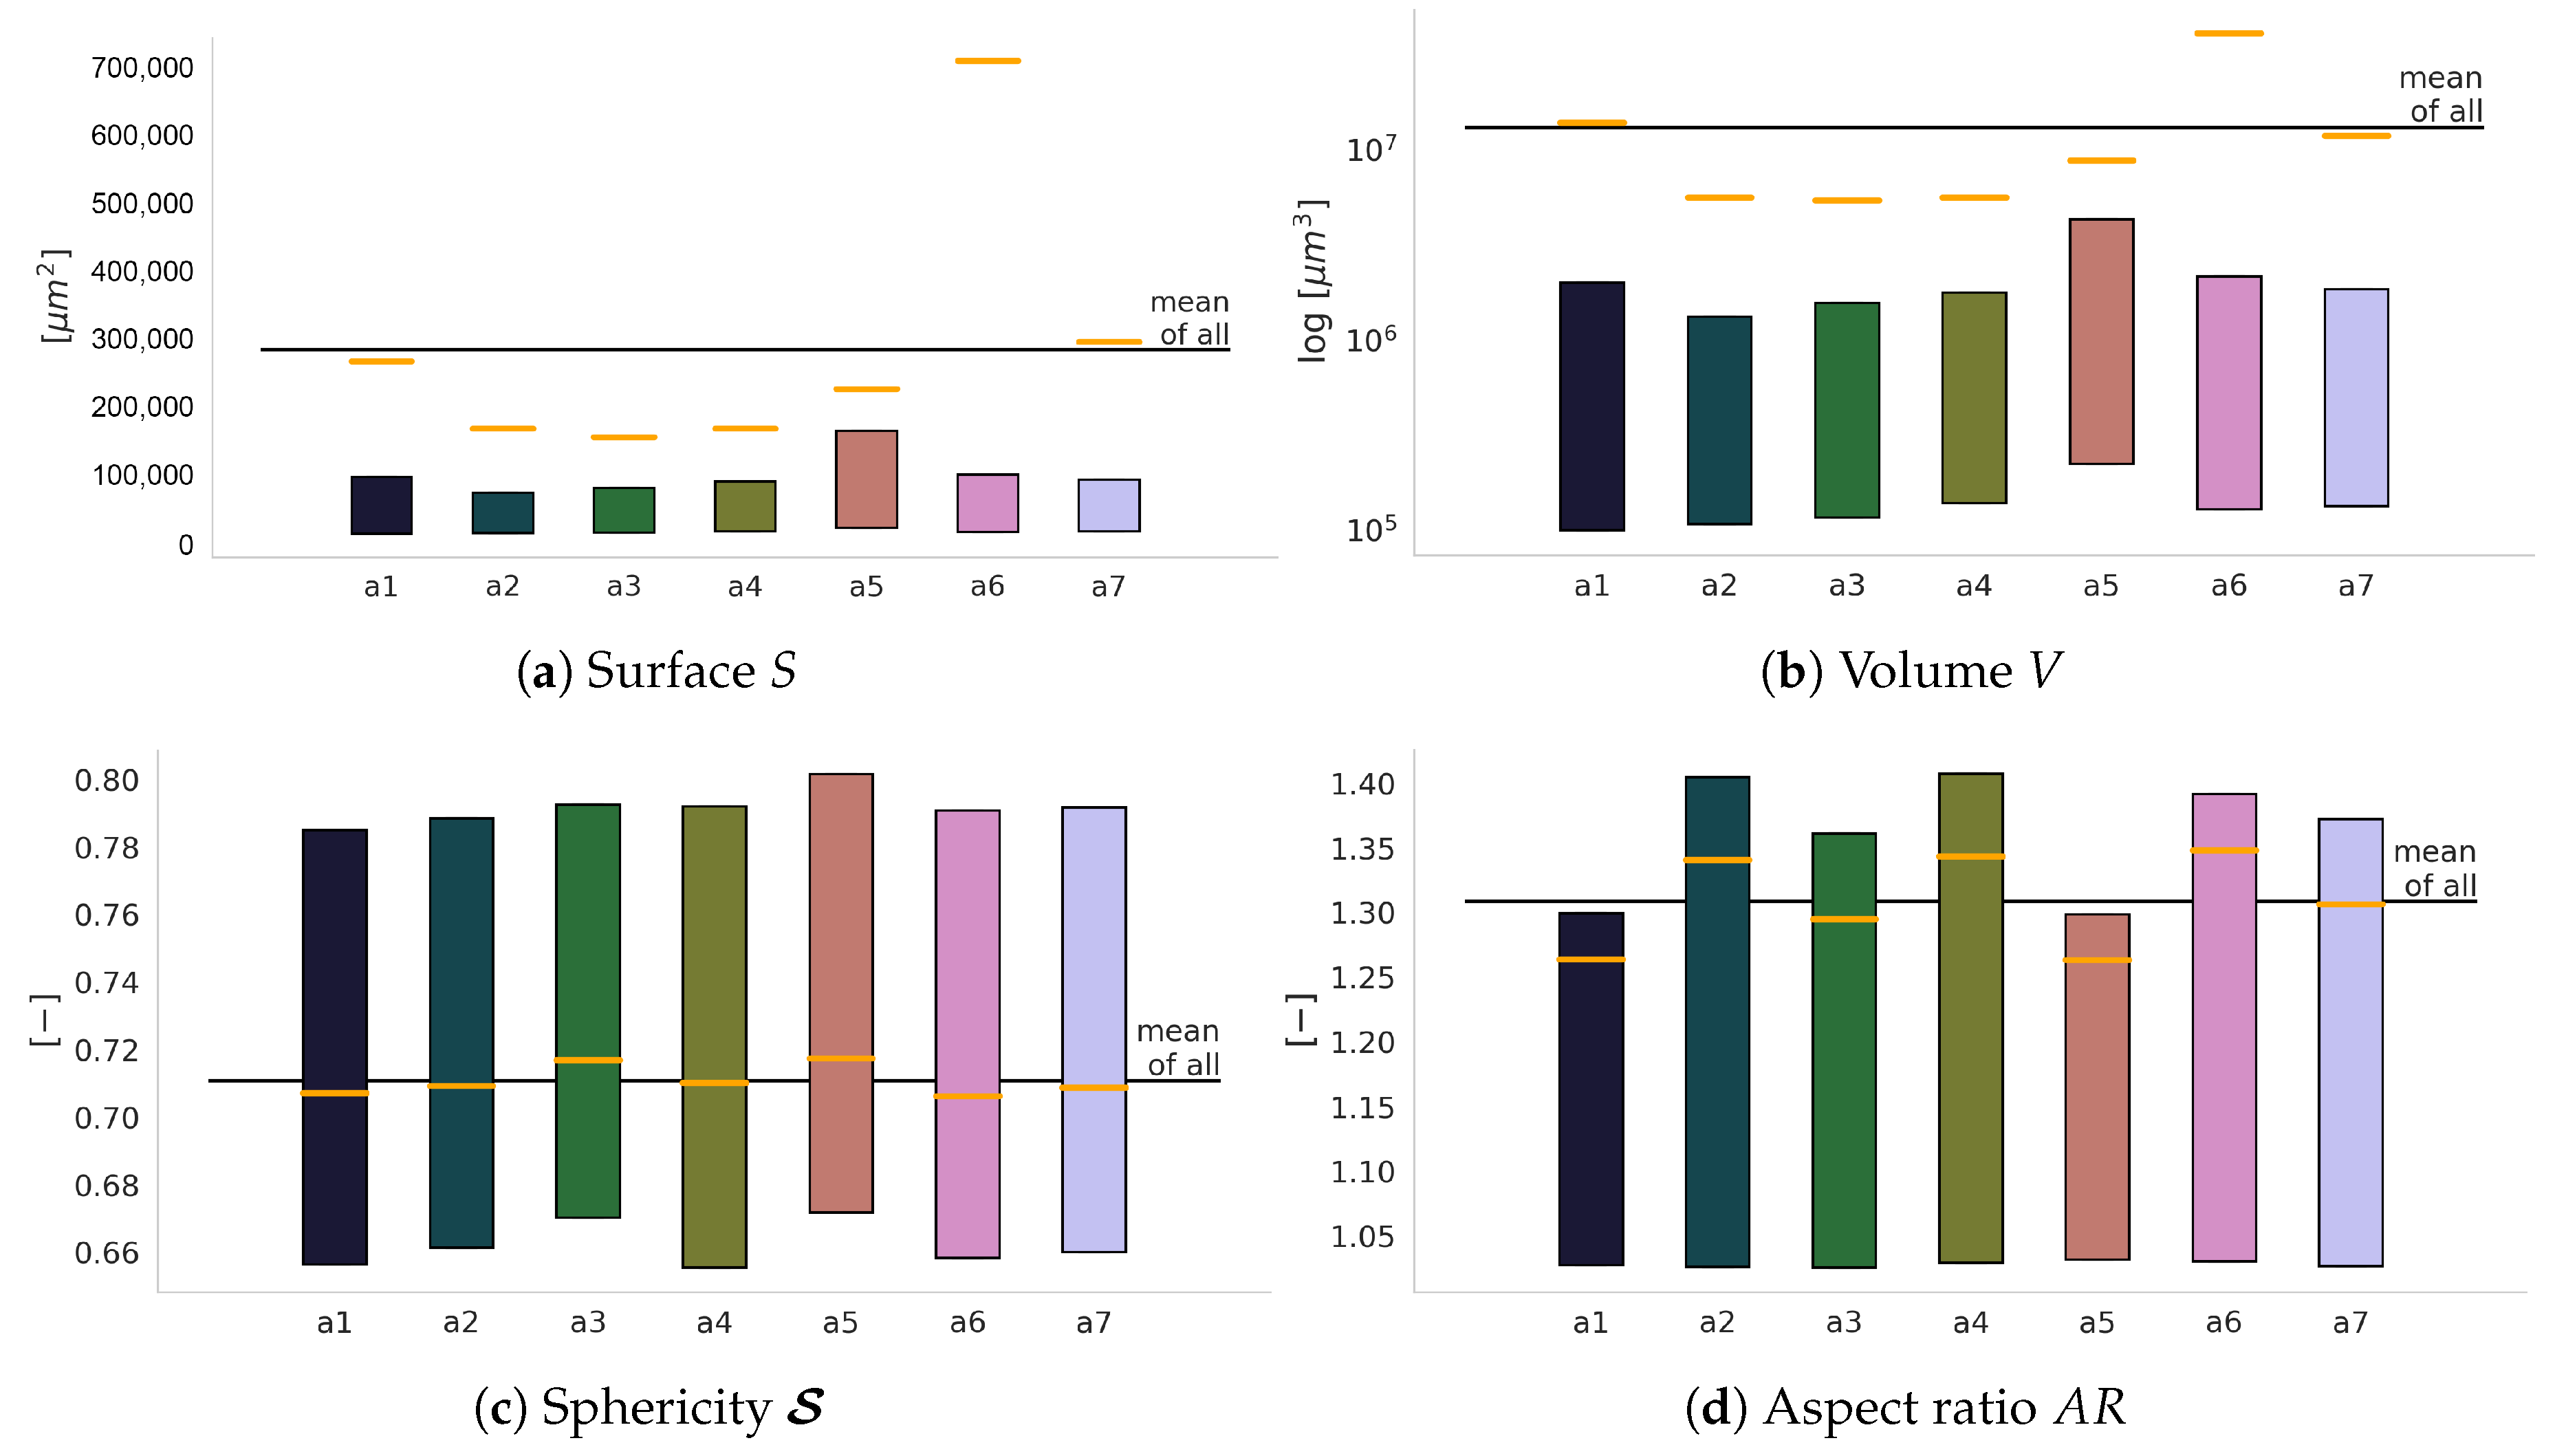
Graphs in Figure 6 show mean values of the surface, volume, sphericity, and aspect ratio for all the defects in the specimens, compared to the average values for all the characterized defects. On the graphs showing the average surface (Figure 6a) and volume (Figure 6b), the values for specimen a6 are distinctly larger than for all the other studied materials. Such a difference indicates the domination of a distinct type of defect. Low sphericity and high aspect ratio of defects in specimen a6 appear to support this hypothesis.
The average size of defects is comparable in specimens a2, a3, and a4, occupying the lower end of the spectrum. The average sphericity and aspect ratio of defects did not vary significantly, which disqualifies them as descriptors of the manufacturing process.
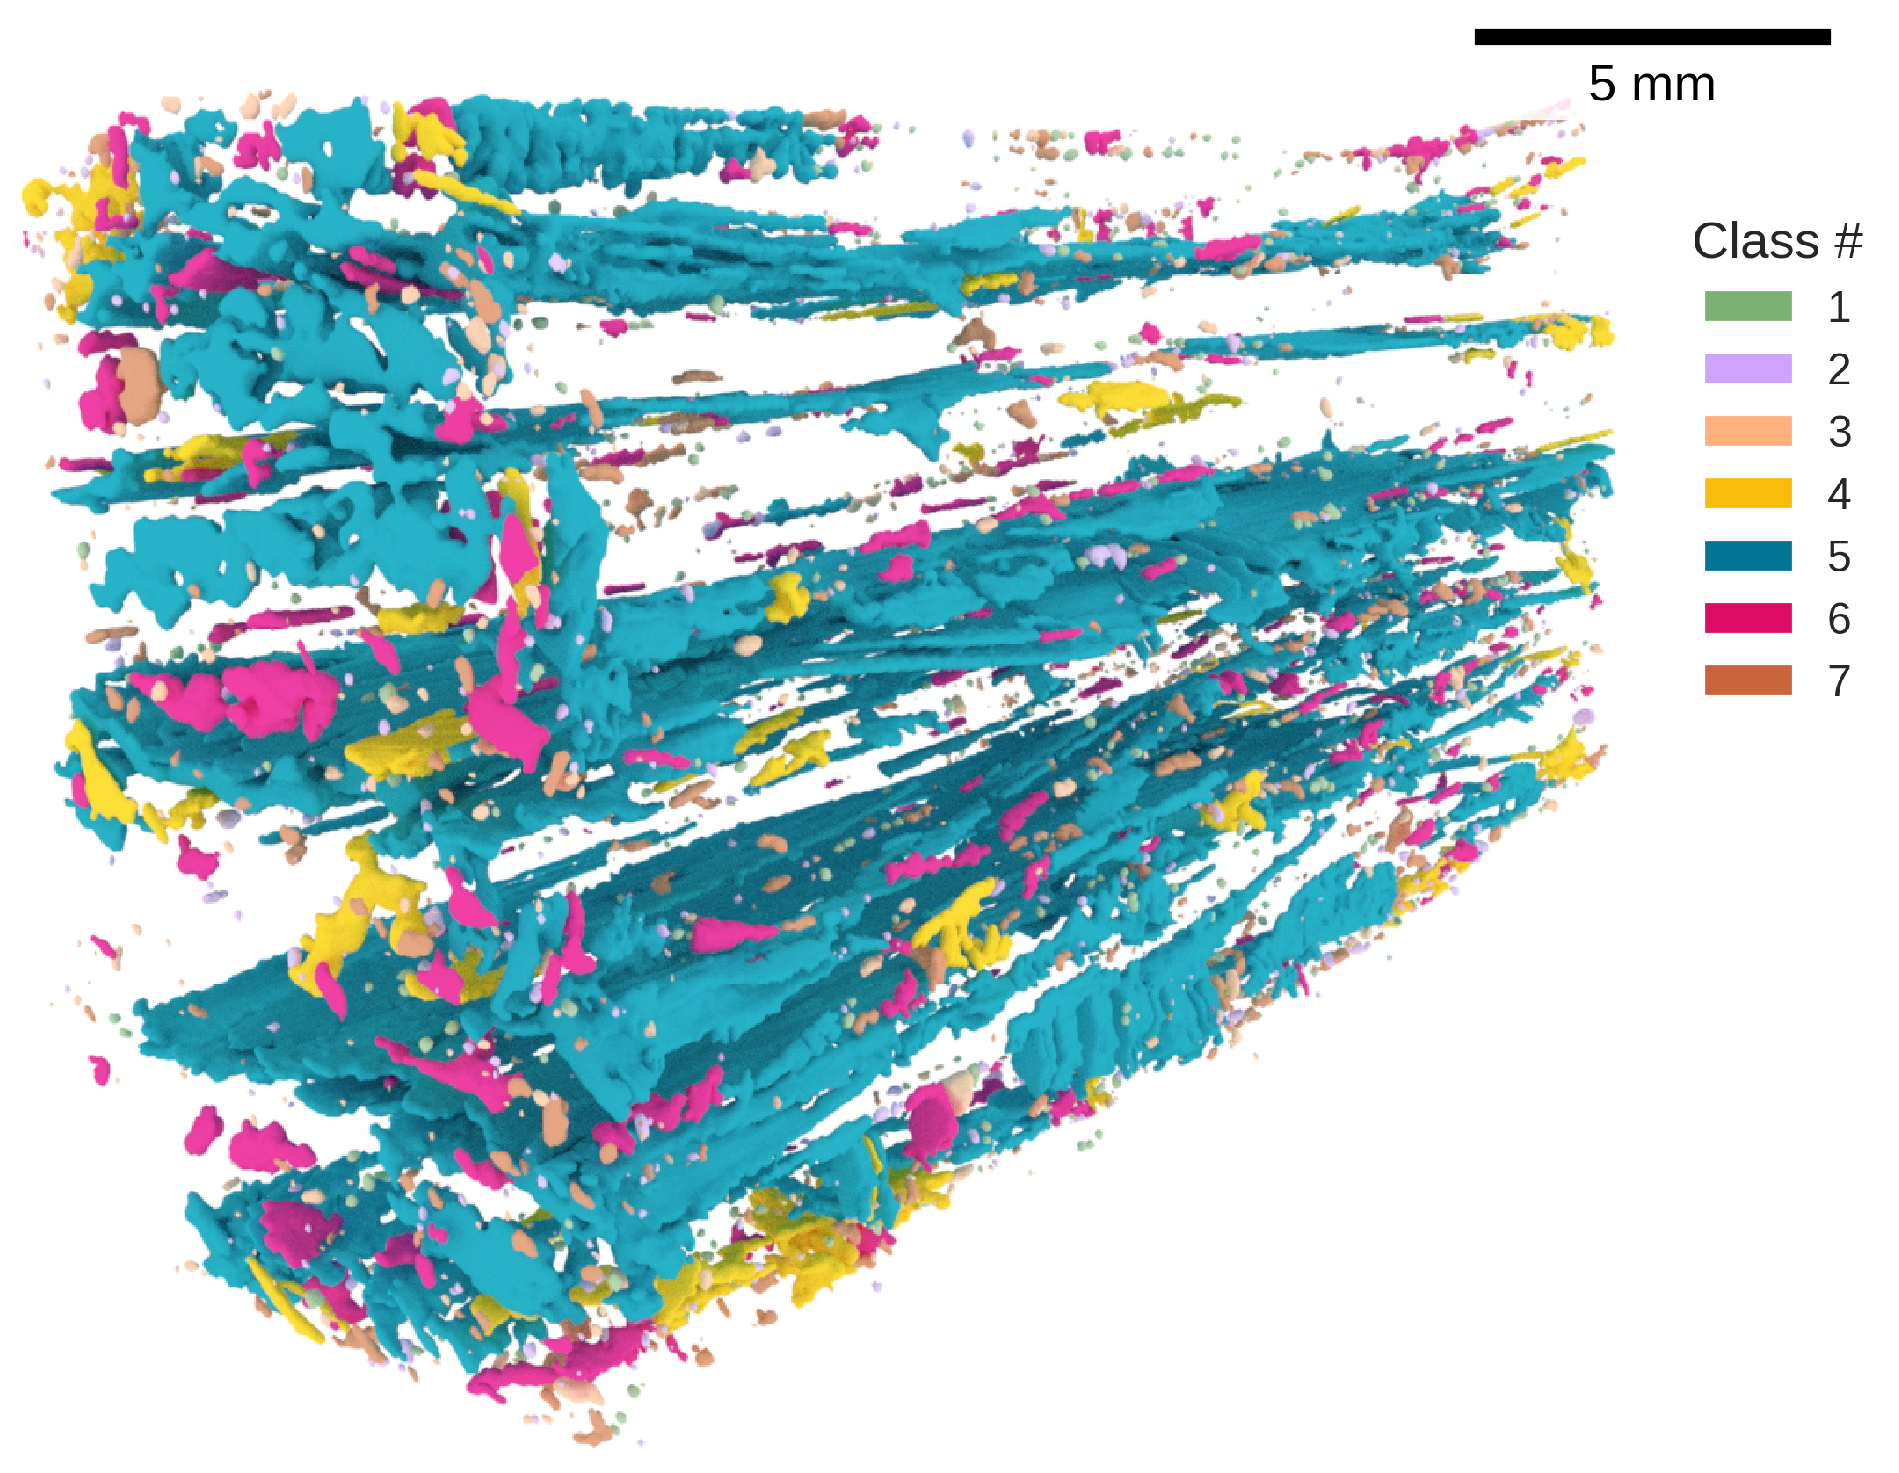
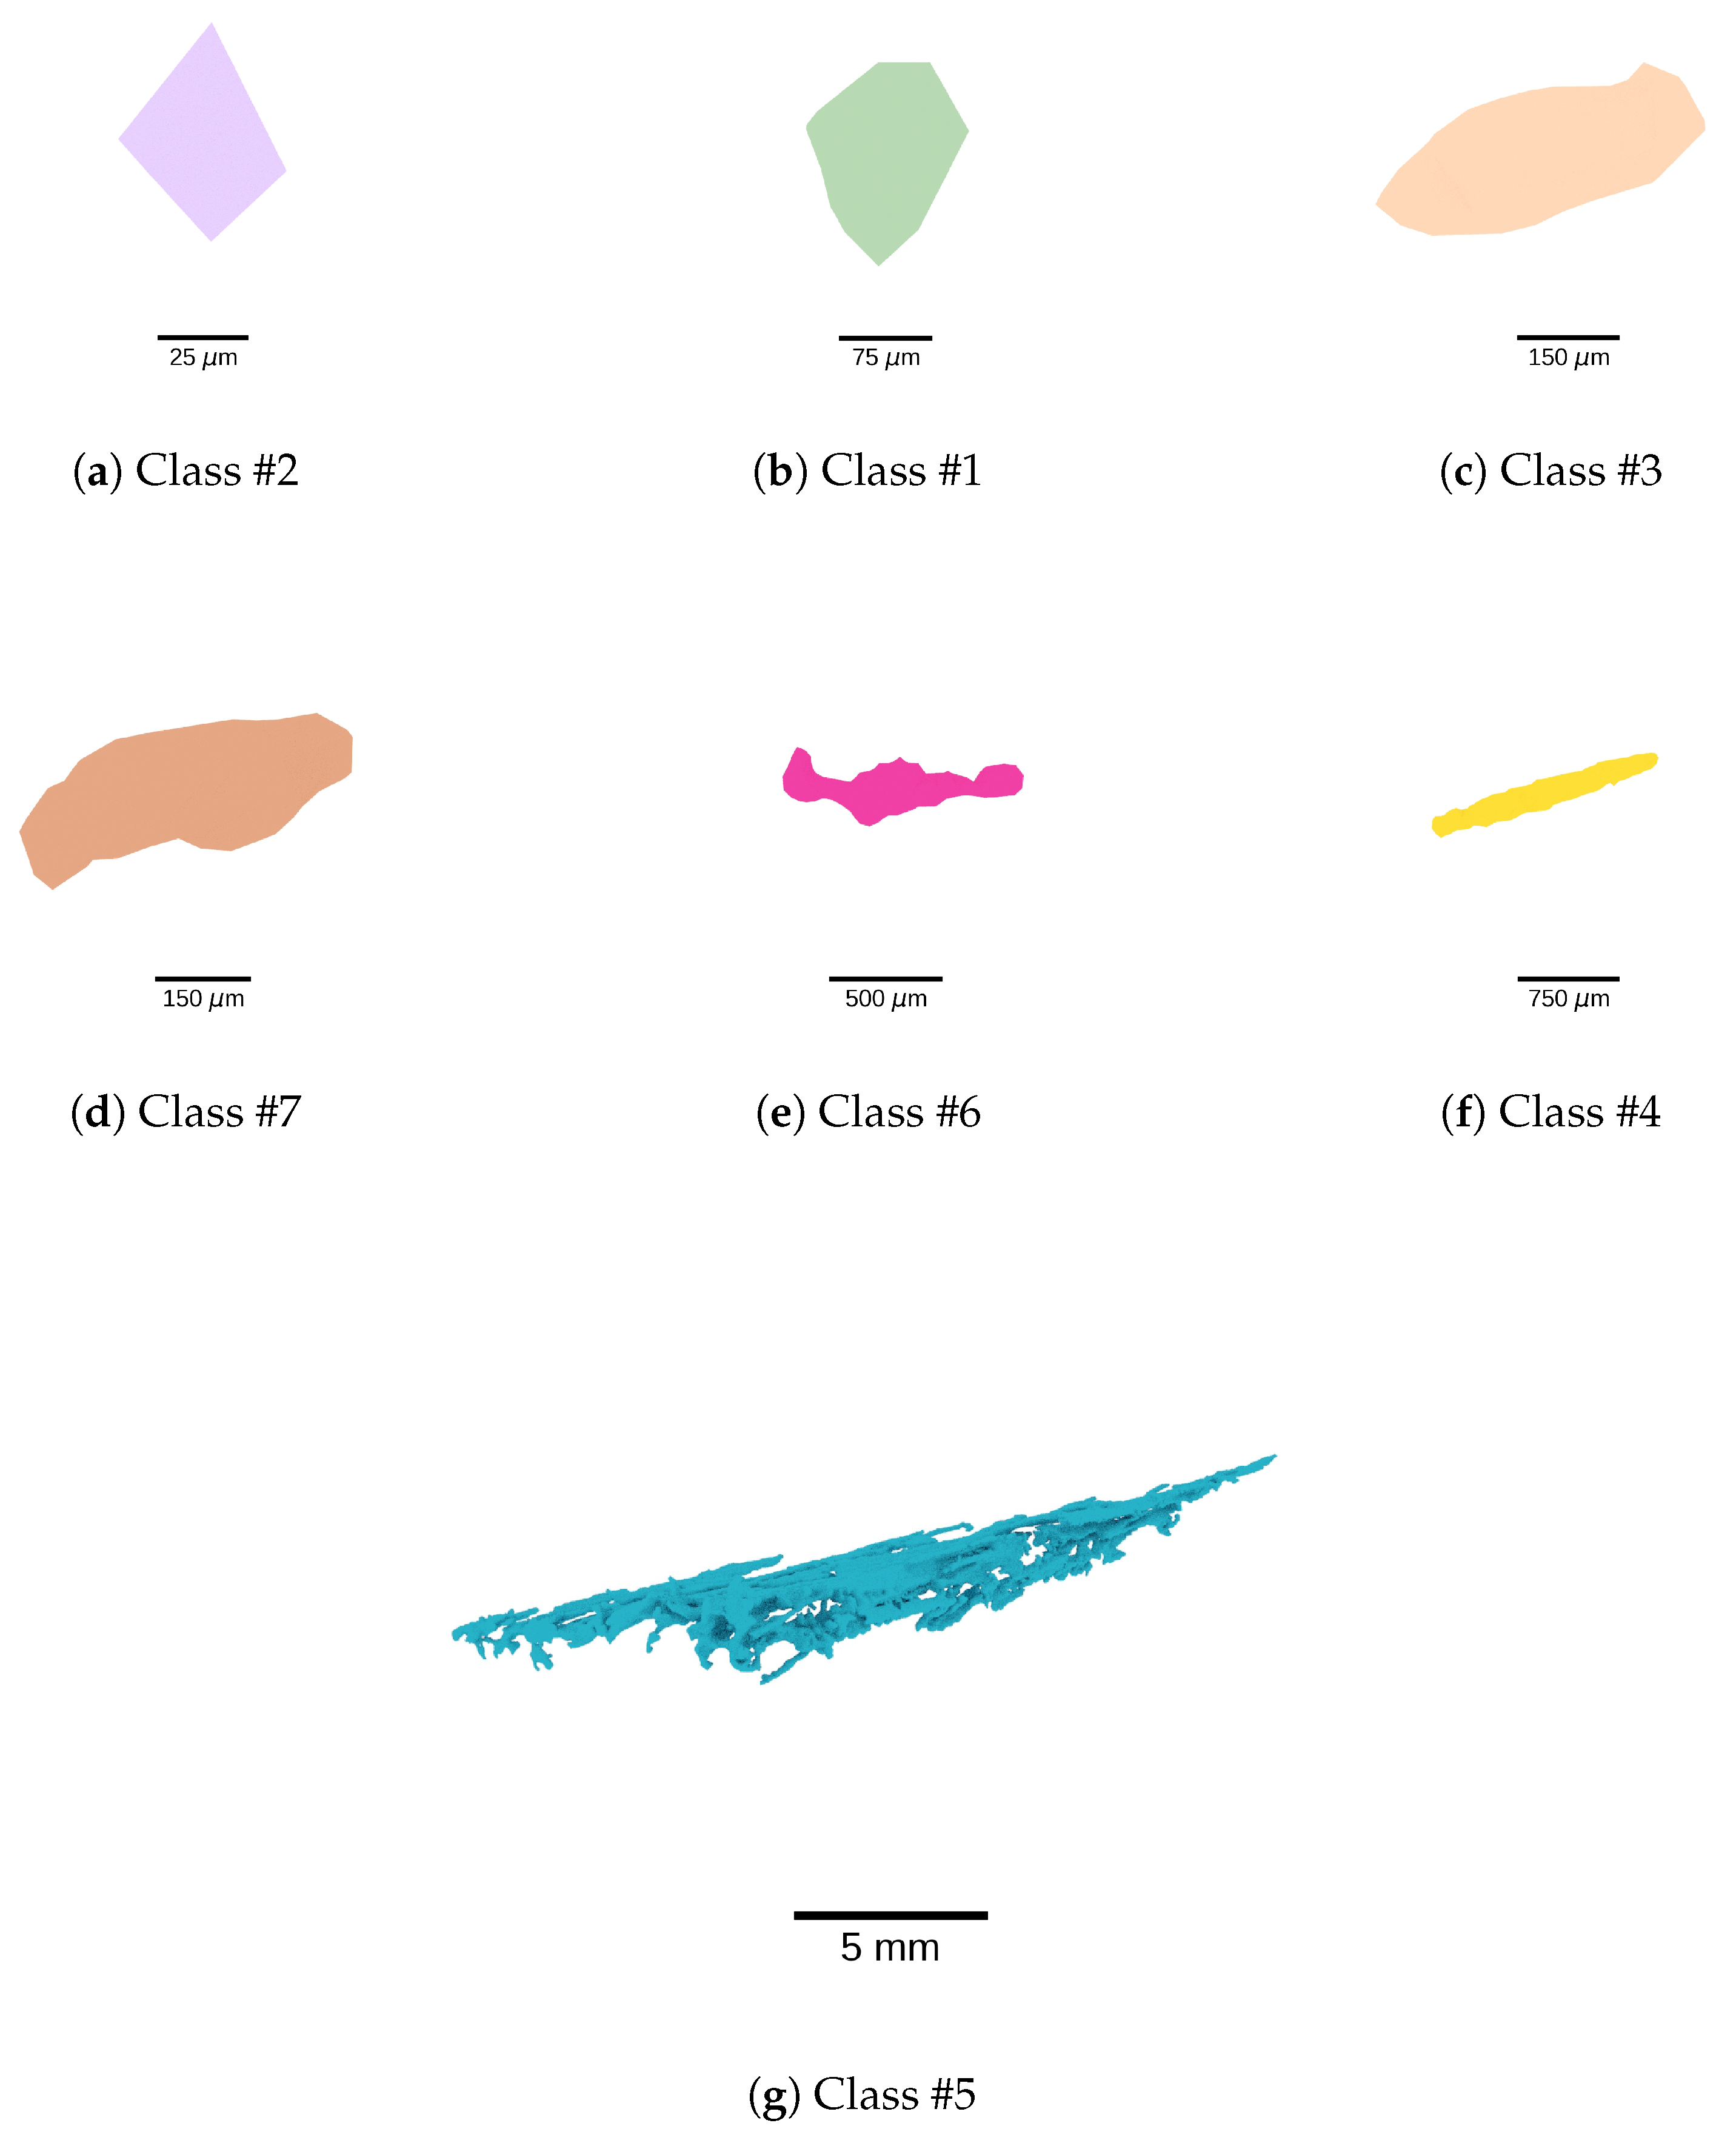
The identification of morphological classes was performed on the geometric features of defects from all specimens. This ensured consistency during the comparison of morphological types. The dendrogram in Figure 7 shows seven clusters, determined at a threshold distance d t = 6.3 . An example of 3D visualization of defects in specimen a6 with their classes is shown in Figure 8. Some defects in this specimen belong to class #5, i.e., represent cracks. Figure 9 shows an overview of all the types of defect morphology. We see that the representative defect of class #5 is larger than those of all the other classes. The characteristic morphology of the elongated voids of class #4 represents resin deficiency in the spaces between fibers. Classes #1 and #2 are microvoids, although the small dimensions of class #2 may almost qualify as noise. Classes #3 and #7 have a very similar morphology of slightly elongated air bubbles. Finally, the defects in class #6 exhibit a complex geometry, unlike that of voids or air bubbles. Their proximity to cracks indicates that they may be part of the damage, although scans at a higher resolution would be necessary to confirm this hypothesis.

4.3. Defect Conglomerates

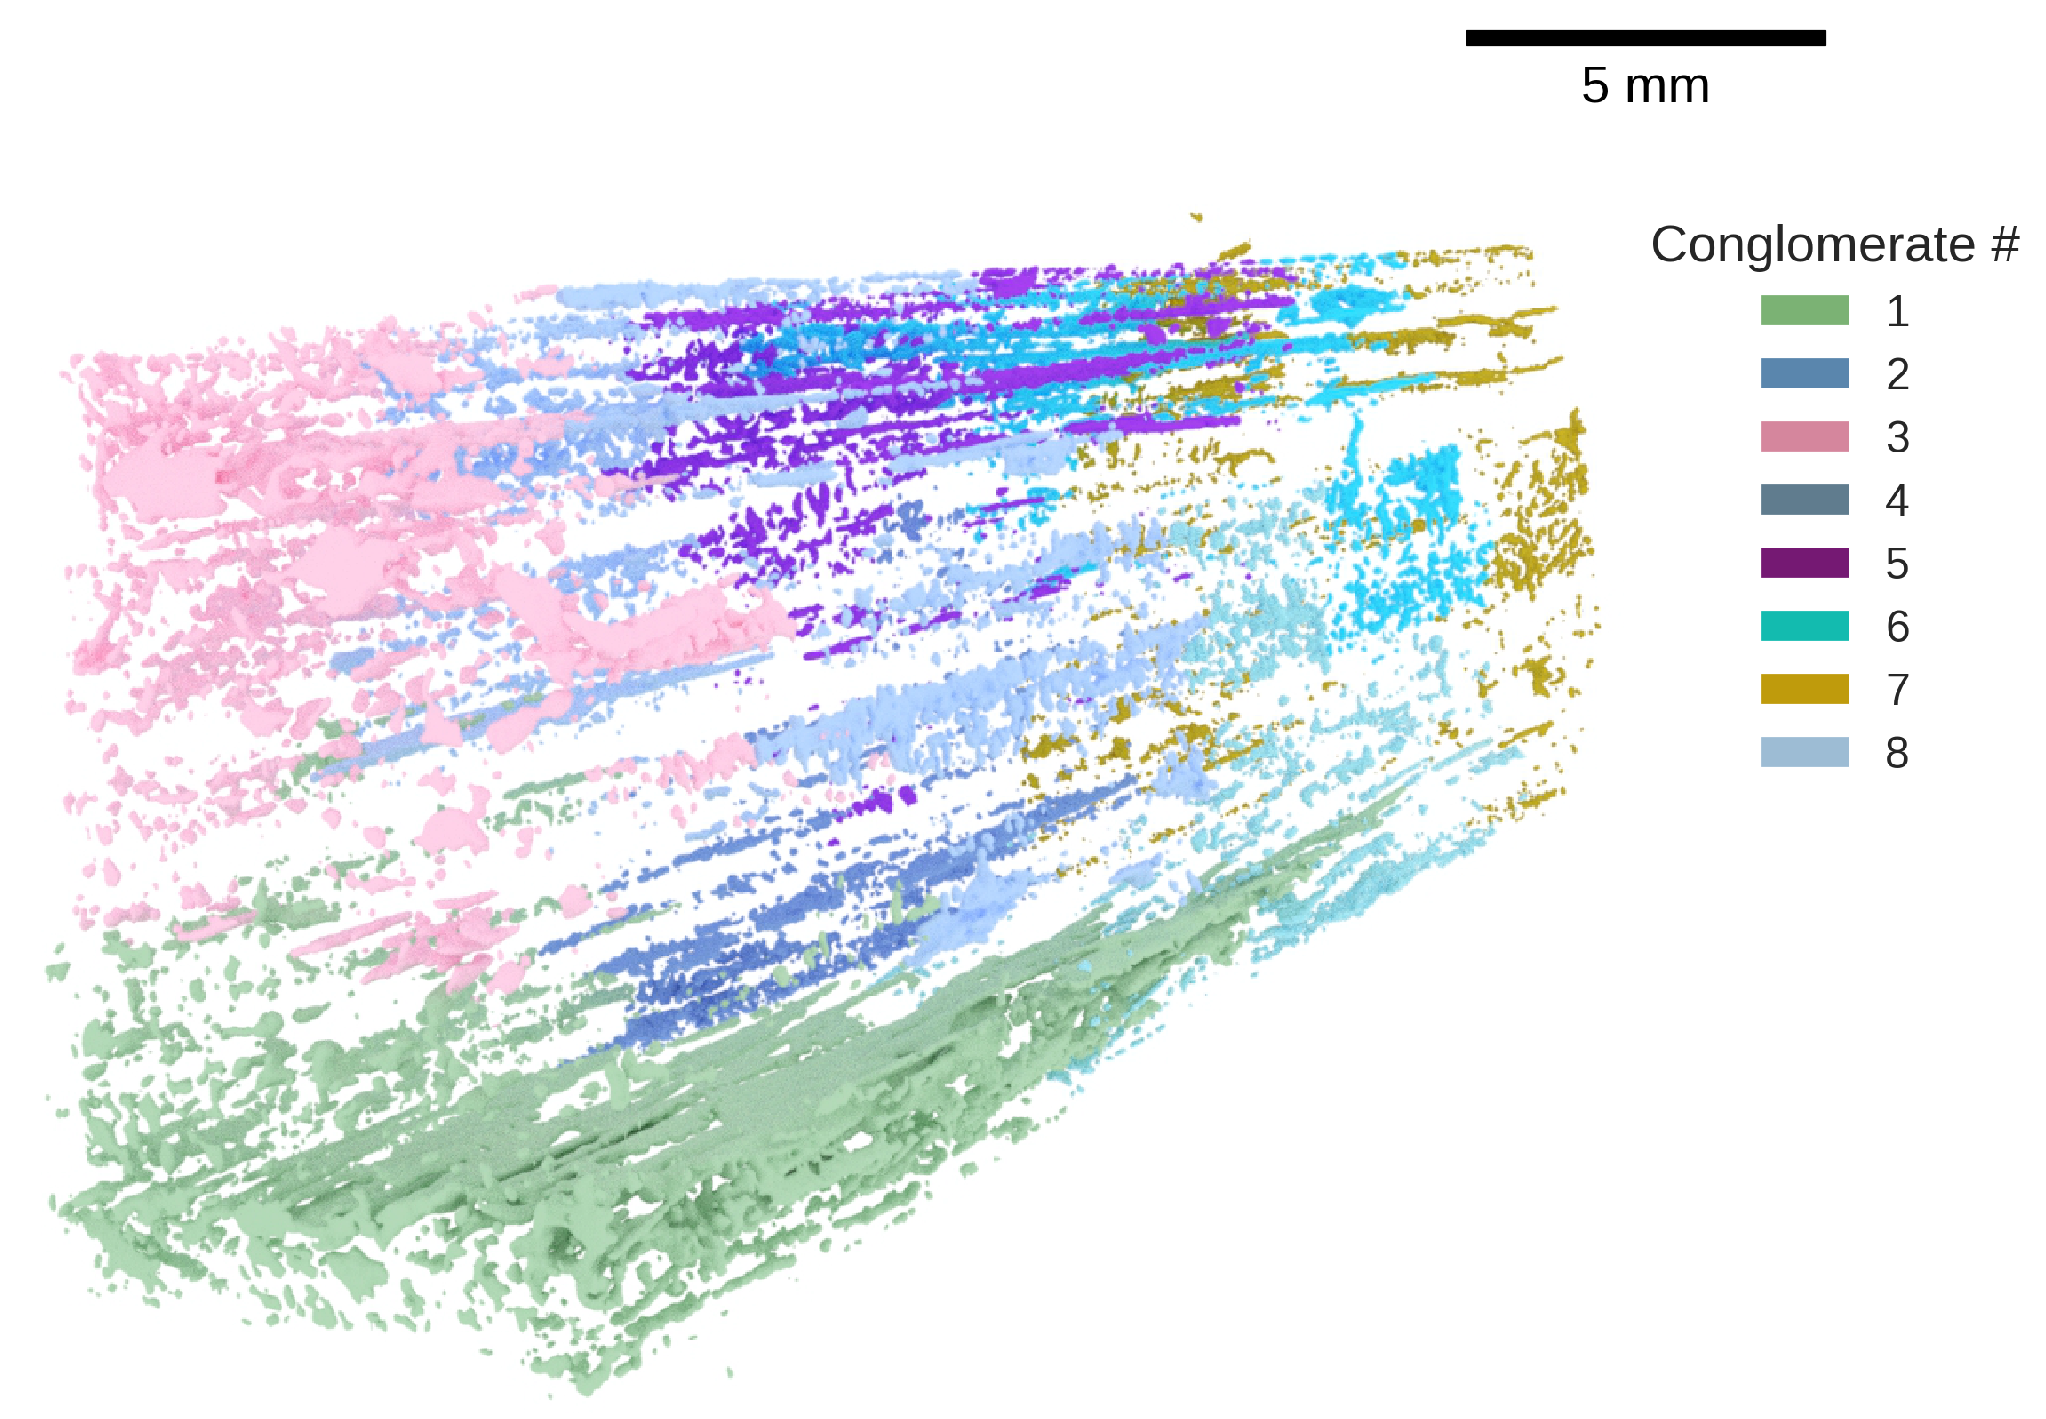
The hierarchical clustering operation was performed for the unscaled centroid coordinates of defects, separately for each specimen. The same threshold distance d t was used to identify conglomerates of the same size. An example of the results for specimen a3 is shown in Figure 10, where eight large conglomerates were identified. Conglomerate #1 (Figure 11a), in particular, contains a large crack and the accompanying defects, mostly from classes #4 (elongated voids between fibers) and #5 (voids with complex geometry) as observed in Figure 11b. Some defects in the conglomerate are further away from the main crack due to a large value of d t , indicating a loose structure. Smaller values of d t would cause the identification of a greater number of more compact conglomerates.

4.4. Defect Genomes

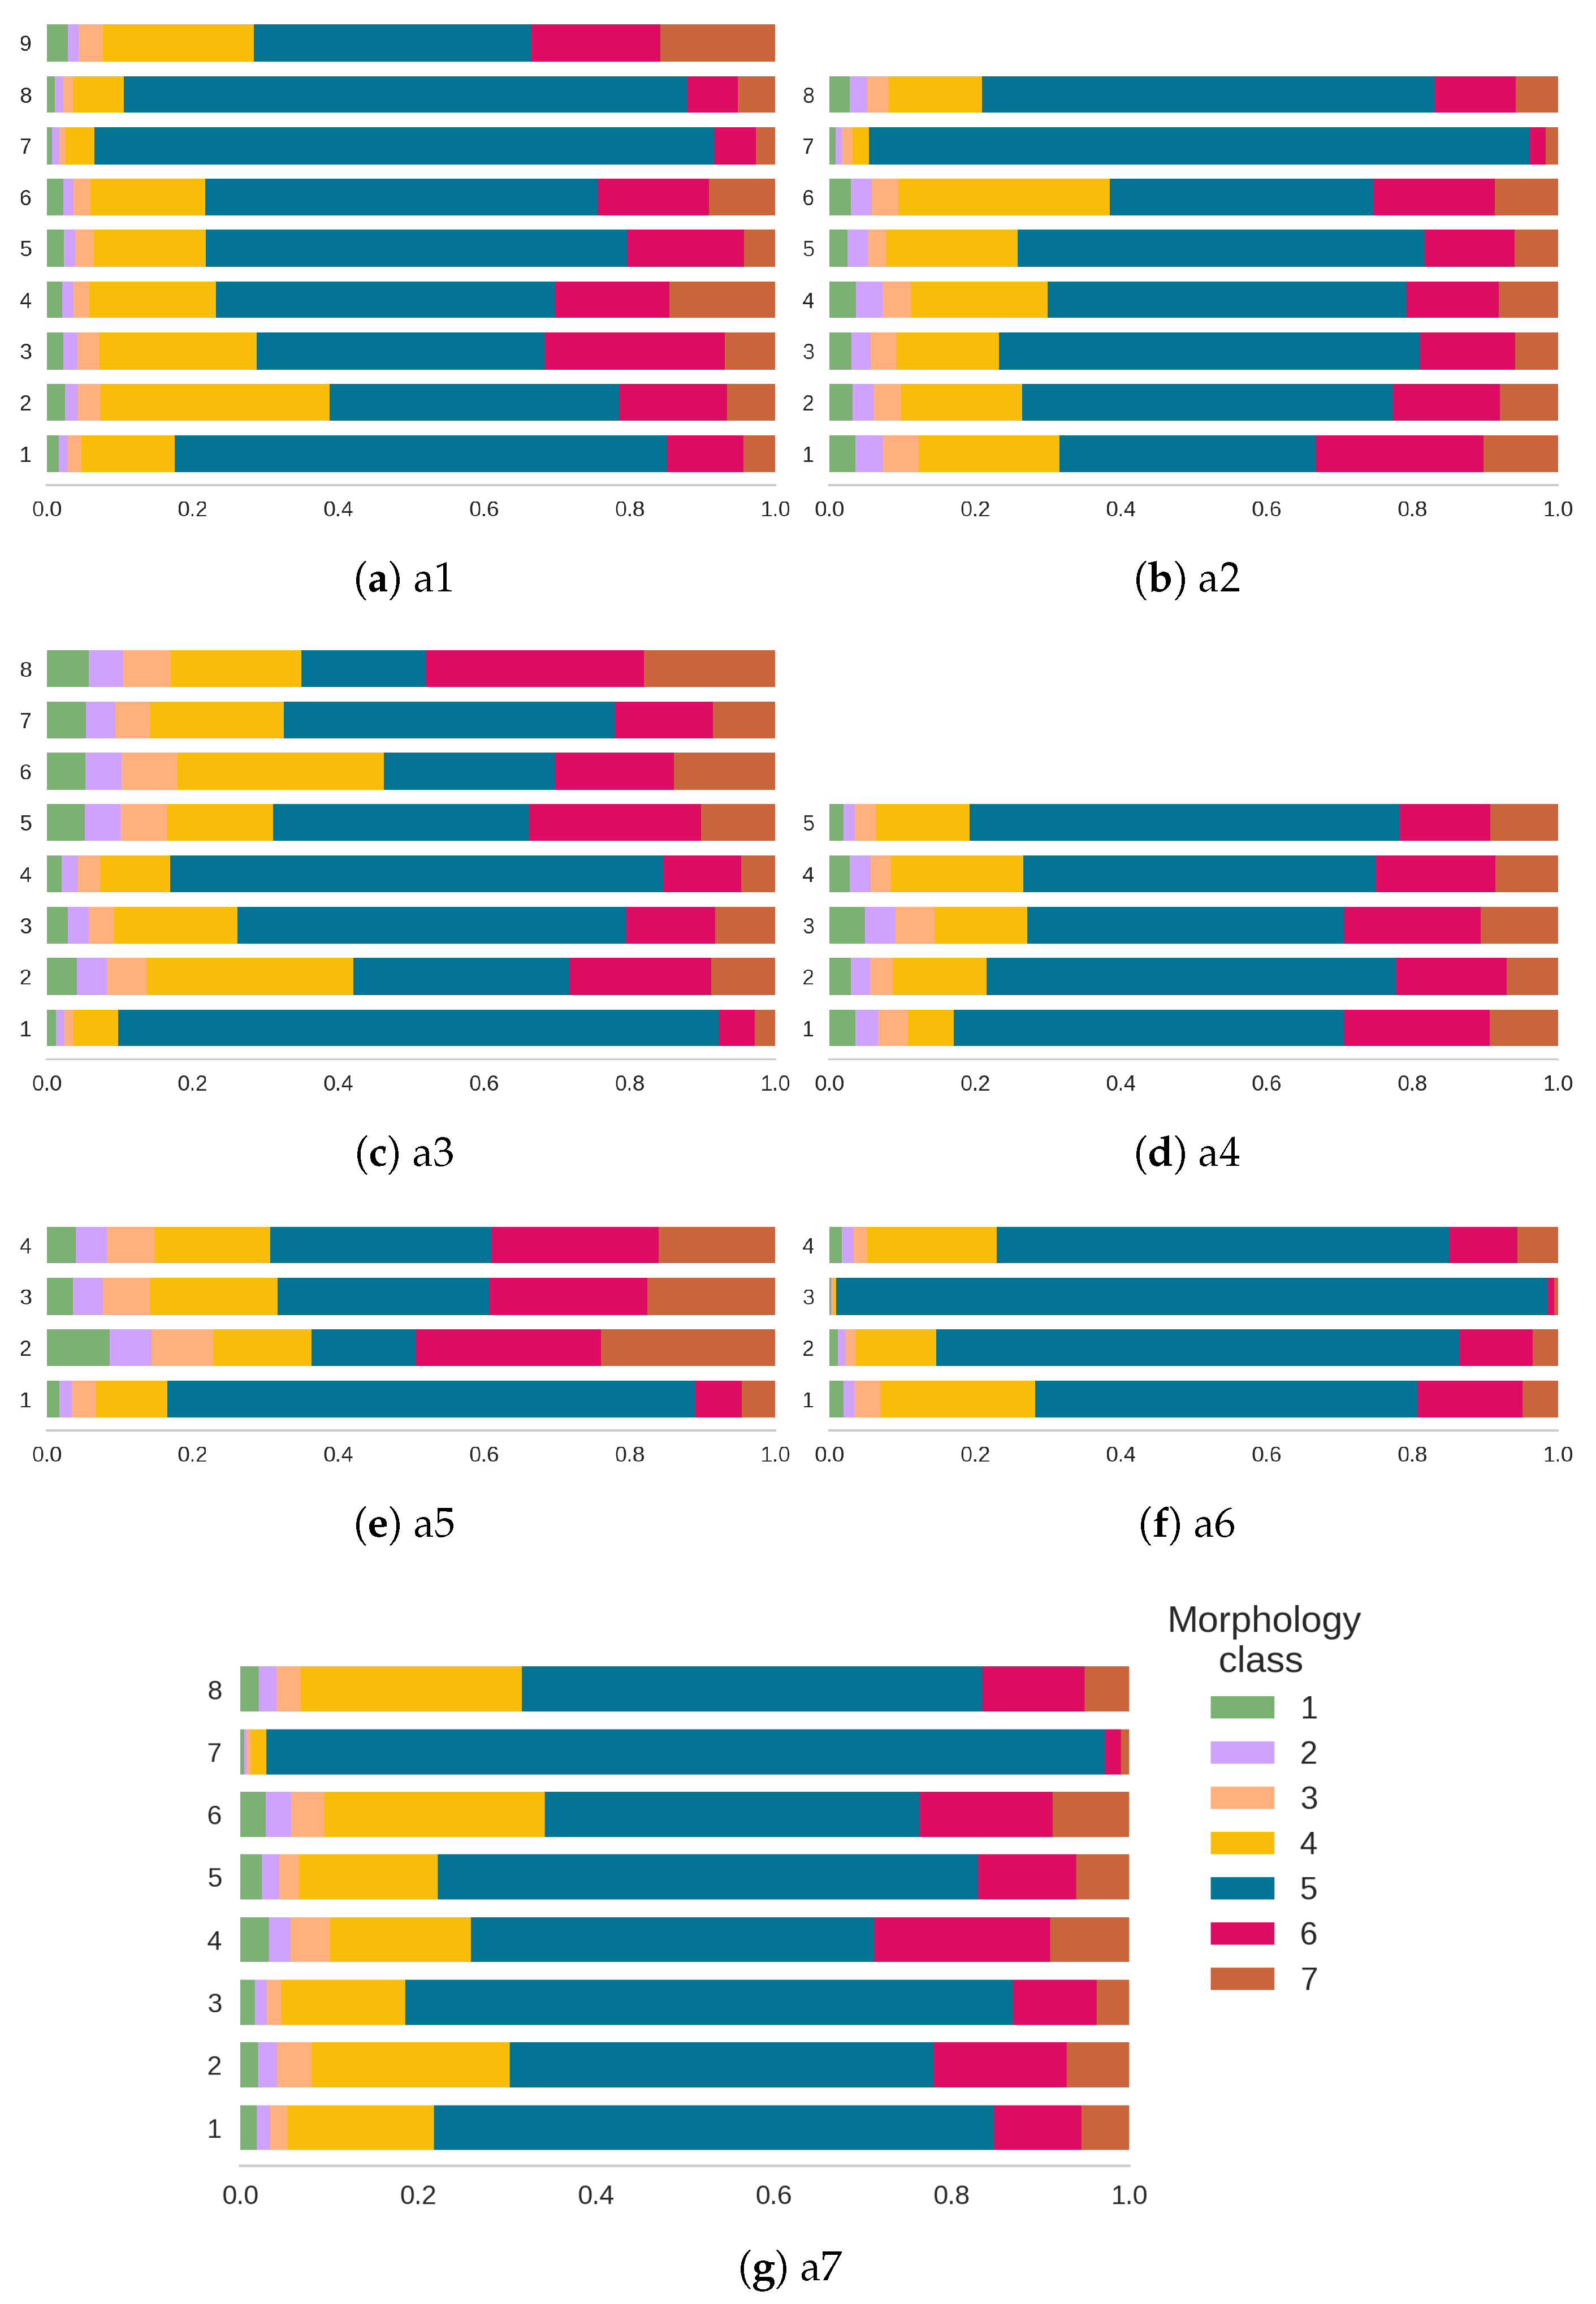
The defect genome has been evaluated at two scales. Firstly, at the specimen’s scale this allows comparing the overall morphological composition (Figure 12). All of the specimens contained cracks that contributed to at least one third (specimen a5) up to over 90% (specimen a6) of the total volume of the air phase. Apart from specimens a5 and a6, the other defect genomes were similar.
More variability was captured by exploring genomes of conglomerates identified in individual specimens (Figure 13). In particular, conglomerates consisting of large cracks are automatically discernible, such as clusters 7 and 8 in specimen a1 (Figure 13a), 7 in a2 (Figure 13b), 1 in a3 (Figure 13c), 3 in a6 (Figure 13f) and 7 in a7 (Figure 13g). The percentage of morphological classes #4 and #6 gives a further indication if the crack is complex and discontinuous or consists largely of a single entity. Particularly interesting is the case of specimen a1 (Figure 13a) that had the highest volume fraction of the air phase at 7%. Multiple complex cracks with a large percentage of elongated voids between the fibers (class #4) have been observed. This is the specimen treated at the lowest temperature of 150 °C. We have speculated in Section 4.1 that the high volume fraction of air could be the result of the lack of impregnation of the fibers. Specimen a2 shows a similar defect profile (Figure 13b) at a processing temperature of 160 °C. The low percentage of residual air in this specimen is related to the very small fraction of observed fibers. From all of the specimens, only a3 (Figure 13c), a4 (Figure 13d) and a5 (Figure 13e) manufactured under the same conditions showed a substantial percentage of microvoids. Coupled with the low volume fraction of residual air, they seem to be manufactured with the best choice of parameters, although further validation is needed to support this claim.

5. Conclusions

We have presented an automated approach to identify the morphological types and spatial conglomerates of defects from X-ray microtomographic scans of composites with fibrous reinforcement. The use of hierarchical clustering algorithms enabled the comparison of multiple geometric parameters of defects, which are otherwise difficult to ascertain, given the complexity of defect geometry. By applying clustering to both geometric and spatial features of defects, the morphological type and grouping of defects were determined. This information was then used to compute a defect “genome”. This indicator was proposed to rapidly compare the morphological composition of defect conglomerates. The defect genome can be computed for different regions of interest within a specimen to assess the physical phenomena associated with given process parameters. Alternatively, when computed for several specimens, it can help in identifying defects associated with different manufacturing conditions. Note that the purpose of this work was to demonstrate the feasibility of the methodology. Claims about the influence of manufacturing parameters require a further study that can now be realized using the proposed automated characterization. In particular, the importance of each feature as a morphological descriptor, as well as their cross-correlation will be a subject of a wider study to establish weighing factors for specific materials and manufacturing methods. The presented methodology is general and could also be employed to analyze X-ray microtomographic scans of other materials, for example, of in situ scans of tensile testing to identify the origins and evolution of damage mechanisms.
The major drawback of the presented approach lies in the performance of the hierarchical clustering algorithm, which required 12 GB of random-access memory (RAM) for the processed dataset. Although the time of execution was limited to 56 s on the 8 × 2.80 GH CPU Intel ® CoreTM i7-7700HQ processors, the memory requirement increases quadratically ( O ( N 2 ) ), which poses problems for non-sparse, complete-linkage datasets. Apart from program optimization, future work will include developing new spatial descriptors, as the centroid feature tends to detect conglomerates only around defects of larger volume. A careful study of the impact of the choice of distance threshold d t must also be considered for more extensive analysis.

Author Contributions

Conceptualization, A.M., P.B., and F.T.; methodology, A.M.; software, A.M.; validation, A.M.; material processing, specimen preparation, D.-T.V.-P., M.-T.N., C.-N.N.; writing–original draft preparation, A.M.; writing–review and editing, A.M., D.-T.V.-P., P.B., F.T. All authors have read and agreed to the published version of the manuscript.

Funding

This research received the financial contribution of the National Science and Engineering Research Council of Canada (NSERC) and of the Research Center for High-Performance Polymer and Composite Systems (CREPEC).

Acknowledgments

Authors would like to acknowledge the help of Yukihiro Nishikawa from the Department of Macromolecular Science and Engineering, Graduate School of Science and Technology, Kyoto Institute of Technology, Japan in the realization of X-ray microtomographic scans.

Conflicts of Interest

The authors declare no conflict of interest.

Appendix A

The majority of currently available laboratory X-ray microtomographs require the specimen to remain entirely within the field of view during the scan, i.e., for its maximal diameter to be smaller than the width of the CCD camera (it can extend beyond its height though). The reason for this limitation is to eliminate errors during the reconstruction. For this technical reason, the resulting scan contains the air around the specimen (Figure A1a), which during mesh reconstruction remains connected with the cracks reaching the surface. To analyze them as separate entities, we propose a masking algorithm (Algorithm A1) that performs binary operations on the segmented scan to separate the defects inside the specimen from the outside air.
Algorithm A1: Processing of segmented tomograms to separate defects from the air around the specimen.
Input: Segmented tomogram (air phase only)
   Output: Two-dimensional image with defects and eliminated outside air

   copy t o m o g r a m as m a s k ;
   fill holes in m a s k ;
   dilate m a s k ;
   fill holes in m a s k ;
   erode m a s k ;
   get t o m o g r a m XOR m a s k as d e f e c t s ;
   median filter (2 px kernel) on d e f e c t s ;
   return d e f e c t s ;
The algorithm creates a copy of the segmented tomogram, which is then subject to a sequence of binary operations [28] of hole filling, dilation, and erosion. The result is a mask, which is a silhouette of the specimen, including the cracks. By performing an XOR (“exclusive or” binary operation) on the original segmented tomogram and the mask, a new image is created that contains only the defects inside the silhouette (Figure A1b). This image is then used to calculate the volume fraction of the residual voids and cracks, and reconstruct the surface mesh of individual defects.
Figure A1. Segmented X-ray tomogram showing (a) air phase; (b) isolated defects after masking.
Jcs 04 00178 g0a1

References

  1. Goodwin, A.A.; Howe, C.A.; Paton, R.J. The Role of Voids in Reducing the Interlaminar Shear Strength of RTM Laminates. In Proceedings of the Eleventh International Conference on Composite Materials, Gold Coast, QLD, Australia, 14–18 July 1997; pp. 11–19. [Google Scholar]
  2. Talreja, R. Manufacturing Defects in Composites and Their Effects on Performance; Elsevier: Amsterdam, The Netherlands, 2015; pp. 99–113. [Google Scholar] [CrossRef]
  3. Ricotta, M.; Quaresimin, M.; Talreja, R. Mode I Strain Energy Release Rate in composite laminates in the presence of voids. Compos. Sci. Technol. 2008, 68, 2616–2623. [Google Scholar] [CrossRef] [Green Version]
  4. Suo, Y.; Wang, B.; Jia, P.; Gong, Y. The effect of fabrication defects on the mechanical behaviors of metal matrix composites. Mater. Today Commun. 2020, 25, 101663. [Google Scholar] [CrossRef]
  5. Drach, B.; Tsukrov, I.; Gross, T.; Dietrich, S.; Weidenmann, K.; Piat, R.; Böhlke, T. Numerical modeling of carbon/carbon composites with nanotextured matrix and 3D pores of irregular shapes. Int. J. Solids Struct. 2011, 48, 2447–2457. [Google Scholar] [CrossRef] [Green Version]
  6. Liotier, P.J.; Alain, V.; Christine, D. Characterization of 3D morphology and microcracks in composites reinforced by multi-axial multi-ply stitched preforms. Compos. Part Appl. Sci. Manuf. 2010, 41, 653–662. [Google Scholar] [CrossRef]
  7. Lambert, J.; Chambers, A.R.; Sinclair, I.; Spearing, S.M. 3D damage characterisation and the role of voids in the fatigue of wind turbine blade materials. Compos. Sci. Technol. 2012, 72, 337–343. [Google Scholar] [CrossRef]
  8. Mei, H.; Tan, Y.; Zhang, D.; Cheng, L. A novel delamination defects designed for understanding mechanical degradation in a laminated C/SiC composites. J. Alloys Compd. 2019, 770, 1138–1146. [Google Scholar] [CrossRef]
  9. ASTM D3171-2015 Standard Test Methods for Constituent Content of Composite Materials. Available online: https://www.astm.org/Standards/D3171.htm (accessed on 24 November 2020).
  10. Hamidi, Y.K.; Aktas, L.; Altan, M.C. Formation of microscopic voids in resin transfer molded composites. J. Eng. Mater. Technol. 2004, 126, 420–426. [Google Scholar] [CrossRef]
  11. McCombe, G.P.; Rouse, J.; Trask, R.S.; Withers, P.J.; Bond, I.P. X-ray damage characterisation in self-healing fibre reinforced polymers. Compos. Part Appl. Sci. Manuf. 2012, 43, 613–620. [Google Scholar] [CrossRef]
  12. Katunin, A.; Dańczak, M.; Kostka, P. Automated identification and classification of internal defects in composite structures using computed tomography and 3D wavelet analysis. Arch. Civ. Mech. Eng. 2015, 15, 436–448. [Google Scholar] [CrossRef]
  13. Tserpes, K.I.; Stamopoulos, A.G.; Pantelakis, S.G. A numerical methodology for simulating the mechanical behavior of CFRP laminates containing pores using X-ray computed tomography data. Compos. Part Eng. 2016, 102, 122–133. [Google Scholar] [CrossRef]
  14. Madra, A.; Hajj, N.; Benzeggagh, M. X-ray microtomography applications for quantitative and qualitative analysis of porosity in woven glass fiber reinforced thermoplastic. Compos. Part Appl. Sci. Manuf. 2014, 95. [Google Scholar] [CrossRef]
  15. Wang, P.; Lei, H.; Zhu, X.; Chen, H.; Wang, C.; Fang, D. Effect of manufacturing defect on mechanical performance of plain weave carbon/epoxy composite based on 3D geometrical reconstruction. Compos. Struct. 2018, 199, 38–52. [Google Scholar] [CrossRef]
  16. Friedman, H.P.; Rubin, J. On Some Invariant Criteria for Grouping Data. Source J. Am. Stat. Assoc. 1967, 62, 1159–1178. [Google Scholar] [CrossRef]
  17. Prodanov, D.; Feirabend, H.K. Automated characterization of nerve fibers labeled fluorescently: Determination of size, class and spatial distribution. Brain Res. 2008, 1233, 35–50. [Google Scholar] [CrossRef] [PubMed]
  18. Elbischger, P.J.; Bischof, H.; Regitnig, P.; Holzapfel, G.A. Automatic analysis of collagen fiber orientation in the outermost layer of human arteries. Pattern Anal. Appl. 2004, 7, 269–284. [Google Scholar] [CrossRef]
  19. Godin, N.; Huguet, S.; Gaertner, R.; Salmon, L. Clustering of acoustic emission signals collected during tensile tests on unidirectional glass/polyester composite using supervised and unsupervised classifiers. NDT Int. 2004, 37, 253–264. [Google Scholar] [CrossRef]
  20. Godin, N.; Huguet, S.; Gaertner, R. Integration of the Kohonen’s self-organising map and k-means algorithm for the segmentation of the AE data collected during tensile tests on cross-ply composites. NDT Int. 2005, 38, 299–309. [Google Scholar] [CrossRef]
  21. Doan, D.D.; Ramasso, E.; Placet, V.; Zhang, S.; Boubakar, L.; Zerhouni, N. An unsupervised pattern recognition approach for AE data originating from fatigue tests on polymer-composite materials. Mech. Syst. Signal Process. 2015, 64–65, 465–478. [Google Scholar] [CrossRef] [Green Version]
  22. Madra, A.; Adrien, J.; Breitkopf, P.; Maire, E.; Trochu, F. A clustering method for analysis of morphology of short natural fibers in composites based on X-ray microtomography. Compos. Part Appl. Sci. Manuf. 2017, 102. [Google Scholar] [CrossRef]
  23. Van-Pham, D.T.; Nguyen, M.T.; Nguyen, C.N.; Le, T.T.D.; Pham, T.Y.N.; Nguyen, K.T.; Nishikawa, Y.; Tran-Cong-miyata, Q. Effects of processing parameters on mechanical properties and structure of banana fiber-reinforced composites. J. Renew. Mater. 2018, 6, 662–670. [Google Scholar] [CrossRef]
  24. Breitkopf, P.; Touzot, G.; Villon, P. Consistency Approach and Diffuse Derivation in Element Free Methods Based on Moving Least Squares Approximation. Comput. Assist. Mech. Eng. Sci. 1998, 5, 479–501. [Google Scholar]
  25. Lewiner, T.; Lopes, H.; Vieira, A.W.; Tavares, G. Efficient Implementation of Marching Cubes’ Cases with Topological Guarantees. J. Graph. Tools 2003, 8, 1–15. [Google Scholar] [CrossRef]
  26. Wildenschild, D.; Sheppard, A.P. X-ray imaging and analysis techniques for quantifying pore-scale structure and processes in subsurface porous medium systems. Adv. Water Resour. 2013, 51, 217–246. [Google Scholar] [CrossRef]
  27. Sibil, A.; Godin, N.; R’Mili, M.; Maillet, E.; Fantozzi, G. Optimization of Acoustic Emission Data Clustering by a Genetic Algorithm Method. J. Nondestruct. Eval. 2012, 31, 1573–4862. [Google Scholar] [CrossRef]
  28. Schindelin, J.; Arganda-Carreras, I.; Frise, E.; Kaynig, V.; Longair, M.; Pietzsch, T.; Preibisch, S.; Rueden, C.; Saalfeld, S.; Schmid, B.; et al. Fiji: An open-source platform for biological-image analysis. Nat. Methods 2012, 9, 676–682. [Google Scholar] [CrossRef] [Green Version]
Sample Availability: The X-ray tomographic scans of the data are currently subject to a follow-up publication. Hence, they will be released for publication at a later date.
Figure 1. Extraction of fibers from the banana plant and the final composite laminate.
Jcs 04 00178 g001
Figure 2. X-ray tomogram (a) untreated; (b) after μ and convolution-based segmentation.
Jcs 04 00178 g002
Figure 3. 3D reconstruction of phase geometry for specimen a6: (a) fibers and polymer; (b) defect phase only. A detail of the reconstructed 3D surface mesh is also shown here. (For references to color, please refer to the on-line version of this paper.)
Jcs 04 00178 g003
Figure 4. Definition of box dimensions.
Jcs 04 00178 g004
Figure 5. Relative phase volume fractions determined from segmented tomograms of specimens a1 to a7.
Jcs 04 00178 g005
Figure 6. Comparison of the mean values of the geometric features of defects in specimens a1–a7: (a) Surface S; (b) Volume V; (c) Sphericity S; (d) Aspect ratio AR. The mean values for all the characterized defects are also included for reference.
Jcs 04 00178 g006
Figure 7. Dendrogram of hierarchical clustering of the geometric features of defects. The threshold distance d t is marked by a dotted line.
Jcs 04 00178 g007
Figure 8. Three-dimensional visualization of defects in specimen a6 with the seven morphological classes indicated.
Jcs 04 00178 g008
Figure 9. Representative defect morphology from all classes ordered by size. Note that the scale differs between classes.
Jcs 04 00178 g009
Figure 10. Conglomerates identified in specimen a3.
Jcs 04 00178 g010
Figure 11. Conglomerate #1 in specimen a3: (a) overall view of the conglomerate; (b) conglomerate with the morphological types indicated.
Jcs 04 00178 g011
Figure 12. Comparison of defect genomes of specimens a1 to a7. The relative volume fractions of defects are calculated with respect to the volume of all defects in the specimen. The total volume percentage of the defect phase in the specimen is shown on the right.
Jcs 04 00178 g012
Figure 13. Genomes of defect conglomerates within individual specimens a1 to a7.
Jcs 04 00178 g013
Table 1. Manufacturing conditions of the analyzed specimens.
SpecimenTime [min]Temperature [°C]Pressure [kg/cm 2 ]
a110150100
a210160100
a315170100
a415170100
a515170100
a62017075
a720170125
Table 2. Scan resolution of imaged specimens.
Namea1a2a3a4a5a6a7
resolution [ μ m]21.7622.4323.4923.0722.8823.0423.36
Table 3. Comparison of memory requirements and parameters of the surface meshes of defects identified in different specimens. The size of the voxel file was 3 GB for each specimen.
SpecimenMesh Size [MB]No. of ObjectsNo. of NodesNo. of Triangles
a132115,148 2.58 · 10 6 5.11 · 10 6
a215621,779 2.16 · 10 6 4.25 · 10 6
a38810,134 0.88 · 10 6 1.72 · 10 6
a4436506 0.62 · 10 6 1.22 · 10 6
a5302671 0.37 · 10 6 0.72 · 10 6
a61264527 1.74 · 10 6 3.46 · 10 6
a716313,873 2.23 · 10 6 4.41 · 10 6
Publisher’s Note: MDPI stays neutral with regard to jurisdictional claims in published maps and institutional affiliations.