Article

Photocatalytic Degradation of Organic Micropollutants in Water by Zr-MOF/GO Composites

1
Department of Civil and Environmental Engineering, Tokyo Institute of Technology, 2-12-1-M1-4 Ookayama, Tokyo 152-8552, Japan
2
Faculty of Hydrology and Water Resources Engineering, Institute of Technology of Cambodia, Phnom Penh 12156, Cambodia
3
Department of Chemistry, Northwestern University, Evanston, IL 60208, USA
4
Water and Wastewater Engineering Research Group, Institut Teknologi Bandung (ITB), Ganesha 10, Bandung 40132, Indonesia
5
Department of Environmental Engineering, Faculty of Engineering, Chulalongkorn University, Bangkok 10330, Thailand
6
Center of Excellence on Hazardous Substance Management, Chulalongkorn University, Bangkok 10330, Thailand
*
Author to whom correspondence should be addressed.
J. Compos. Sci. 2020, 4(2), 54; https://doi.org/10.3390/jcs4020054
Submission received: 26 April 2020 / Revised: 4 May 2020 / Accepted: 7 May 2020 / Published: 12 May 2020
(This article belongs to the Special Issue Graphene Oxide Composites)

Abstract

:
Nanocomposites of UiO-66 and graphene oxide (UiO-66_GO) were prepared with different GO contents by a one-step hydrothermal method, and their photocatalytic activities for the degradation of carbamazepine (CBZ) were investigated under ranges of GO loading, catalyst dose, initial pollutant concentration, and solution pH. The UiO-66_GO nanocomposites showed photocatalytic rate constant up to 0.0136 min−1 for CBZ degradation and its high overall removal efficiency (>90%) in 2 h. The photocatalytic rate constant over the UiO-66_GO nanocomposite was about 2.8 and 1.7 times higher than those over pristine GO and UiO-66, respectively. The enhancement of photocatalytic activity by GO was attributed to increased surface area and porosity, improved light absorption, and narrowed band gap. The composite also showed substantial recyclability and stability over five consecutive cycles of photocatalytic degradation. The experimental results indicated that O2●− and OH are the responsible radicals for photocatalytic degradation, which helped us propose a photocatalytic mechanism for the enhanced CBZ photodegradation. This work provides a reference for the development of GO-based composite photocatalysts and expands the application of UiO-66 as a photocatalyst for the degradation of persistent micropollutants in water.

1. Introduction

Heterogeneous photocatalysis is one of the so-called advanced oxidation processes (AOPs) and has attracted a great deal of attention over the past few decades for water purification and disinfection due to its advantages of being non-selective, chemical-free, cost-effective, and simple to operate [1,2,3,4]. New semiconductor photocatalysts have been developed with the aim of achieving improved photocatalytic performance [5,6]. In this regard, metal–organic frameworks (MOFs), as crystalline porous materials, have attracted extensive interest as emerging metal complex photocatalysts and semiconductor photocatalysts in recent years [7,8].
MOFs are composed of inorganic metal ions as connecting centers and organic moieties as linkers and offer two significant advantages in photocatalysis. First, their high surface areas (up to 3000 m2/g), high porosity (up to 1 cm3/g), and abundance of functional groups increase the number of active sorption sites, while also providing additional pathways for photo-induced electron migration, facilitating charge carrier separation [9,10]. Second, the organic linkers and metal nodes of MOFs can be integrated with, or replaced by, other linkers and metal ions, making MOFs chemically and structurally diverse materials [11,12,13]. However, low chemical, thermal and hydrothermal stabilities are one of the main weaknesses of MOF materials [4], limiting their application for photocatalytic processes in actual treatment plants.
UiO-66, a zirconium-based MOF, has been proposed as a potential photocatalyst due to its thermal and chemical stability, modifiability, high surface area, and photoactivity [14,15,16]. Nevertheless, photodegradation rates over UiO-66 are limited by its low adsorption capacity and wide band gap (3.7 eV) [16,17]. A few studies have demonstrated that graphene oxide (GO) enhances the photocatalytic activity of UiO-66 by increasing its adsorption capacity, reducing charge recombination, and acting as a light sensitizer [18,19,20]. As summarized in Table S1, previous studies on UiO-66_GO composites have solely been focused on hydrogen production, CO2 adsorption and membrane filtration.
In this study, we present a facile hydrothermal method for preparing UiO-66_GO nanocomposites, and report, for the first time, its application for the photodegradation of an organic micropollutant (OMP). Carbamazepine (CBZ), which is one of the most persistent and frequently detected pharmaceuticals in aquatic environments [21], was selected as a model OMP due to its high potential risk to the environment [22,23,24] and resistance to biological degradation and under UV irradiation [25,26,27]. The specific objectives of this study were: (1) to investigate the enhancing effect of GO on the photocatalytic activity of UiO-66, (2) to test the photodegradation of CBZ with different GO contents in the composites under ranges of catalyst doses and solution pH, (3) to elucidate the photocatalytic mechanism of UiO-66_GO composites under UV irradiation, and (4) to test the recyclability and stability of the prepared photocatalyst.

2. Materials and Methods

2.1. Material

Carbamazepine (>98%), hydrochloric acid (35–37%), hydrogen peroxide (30–35.5%), methanol (99.9%), p-benzoquinone (≥98%), potassium permanganate (>99.0%), sulfuric acid (≥95%), terephthalic acid (≥98%), and zirconium(IV) chloride (>99.5%) were purchased from Sigma-Aldrich (Tokyo, Japan). N,N’-Dimethylformamide (DMF; 99.5%) and potassium peroxodisulfate (≥98%) were purchased from Kanto Chemical (Tokyo, Japan). Graphite flakes (325 mesh, 99.8%), isopropanol (≥100%), and sodium oxalate (≥99.5%) were obtained from Wako Chemical (Tokyo, Japan). All chemical reagents were of analytical grade and were used immediately after purchase without further purification. Milli-Q water was used as a solvent for all experiments. A GLK8MQ UVC lamp (254 nm) was purchased from Sankyo Denki Co., Ltd. (Kanagawa, Japan).

2.2. Material Synthesis

GO and UiO-66 were synthesized according to the methods of Abdolhosseinzadeh et al. [28] and Ma et al. [29], respectively, with some modifications (see the Supporting Information). To prepare composites of UiO-66 and GO (Figure S1), different amounts of GO (0.1, 0.5, 1, and 5 wt% with respect to the total amount of ZrCl4 and H2BDC) were dispersed in DMF (150 mL) with the aid of sonication for 8 h. Each GO solution was then mixed with ZrCl4 (1.16 g) and stirred overnight. H2BDC (0.83 g) was then added, and the mixture was stirred until complete dissolution and transferred to the reaction vessel. After hydrothermal reaction for 24 h at 120 °C, the obtained composite material was allowed to cool to room temperature, centrifuged (4500 rpm for 15 min), and repeatedly washed with DMF and methanol. Finally, the product was dried in a freeze-dryer overnight and kept dry until use. Due to the hydrothermal condition during the preparation, GO could be partially reduced [30]. The obtained composites with different GO contents are designated as UiO66_GO-0.1, UiO66_GO-0.5, UiO66_GO-1, and UiO66_GO-5, respectively.

2.3. Analytical Methods

The crystalline structures of UiO-66, GO, and UiO-66_GO composites were confirmed by X-ray diffraction (XRD) analysis (Miniflex 600, Rigaku, Japan) in the 2θ range 5−50° employing Cu-Kα radiation (λ = 0.15406 nm). The surface morphologies, microstructures, and elemental compositions of the prepared catalysts were examined by means of both a scanning electron microscope (SEM; SU9000, Hitachi, Japan) and a transmission electron microscope equipped with an energy-dispersive X-ray spectroscopy attachment (TEM-EDS; JEM-2010 F, JEOL, Japan). Fourier-transform infrared (FTIR) spectra were recorded from samples in KBr pellets in the range ν = 400–4000 cm−1 to identify the functional groups present (FTIR 4600, JASCO, Japan). Specific surface areas, principal pore sizes, and pore volumes were determined by recording N2 adsorption–desorption isotherms on an Autosorb-iQ analyzer (Quantachrome, USA) at 77 K. UV/Vis absorption spectra were measured with a UV-2600 spectrophotometer (Shimadzu, Japan). For further investigation of the optical properties of the materials, their indirect band gaps were calculated by the Tauc plot method as described in Wang et al. (2016) [9]. The mineralization of CBZ was determined by dissolved organic carbon (DOC) using total organic carbon analyzer (TOC-VCPH, Shimadzu, Japan).

2.4. Adsorption and Photodegradation Experiments

The photocatalytic activities of the prepared photocatalysts were evaluated by the photodegradation of CBZ under irradiation with UVC light of wavelength 254 nm and intensity 0.16 W/cm2. The prepared photocatalysts were mixed in a 100 mL glass beaker containing CBZ solution (50 mL) at an initial concentration of 5 mg/L. The pH of the solutions was adjusted using 0.1 m HCl or 0.1 m NaOH solutions. The mixture was stirred in the dark at room temperature (25 °C) for 1 h until the CBZ adsorption–desorption reached equilibrium. The adsorption capacity of CBZ was then calculated according to Equation (1) [31]:
q t = ( C 0 C t M ) × V
where qt is the adsorption capacity at equilibrium (mg/g), C0 is the initial concentration of CBZ (mg/L), Ct is the concentration of CBZ at time t (mg/L), M is the mass of absorbent (g), and V is the total volume of solution (L).
After adsorption–desorption equilibrium had been attained, the UVC light was turned on and samples were collected at different time intervals: 20, 40, 60, 90, 120, and 180 min. After the irradiation, the solution was passed through a syringe filter (0.22 µm PES filter, Membrane Solution, Japan) to remove the photocatalyst, and then 100 µL of the filtrate was used for CBZ analysis. The analysis was carried out by injecting the sample into a high-performance liquid chromatography (HPLC) system (Prominence UFLC, Shimadzu, Japan) equipped with a UV/Vis absorbance detector (SPD-20 UFLC, Shimadzu, Japan). A C18 column of dimensions 4.6 mm × 250 mm × 5 µm (Kinetex Phenomenex, USA) was used. The UV/Vis detector was operated at 285 nm and the oven temperature was set at 40 °C. The mobile phase consisted of methanol (60%) and water (40%) at a flow rate of 0.6 mL/min. The degradation rate was determined according to a pseudo-first-order kinetic model (Equation (2)) [32]:
l n C t C e q = k t
where k is degradation rate (mn−1), Ceq is the concentration of CBZ at equilibrium adsorption (mg/L), Ct is the concentration of CBZ at time t (mg/L), and t is photodegradation time (min). Coefficient of determination ranged from 0.75 to 0.97 in this study.
The scavenger experiments were conducted by adding 1mM of the individual scavenger such as p-benzoquinone (BQ), sodium oxalate (SO), isopropanol (IPA), and potassium persulfate (K2S2O8) to quench superoxide radicals (O2●−), holes (h+), hydroxyl radicals (OH), and electrons (e), respectively [31,33].
A recycling experiment involving five runs was conducted under optimal conditions based on the above-mentioned experiments to investigate the stability and recyclability of the catalyst. After each run, the catalyst was collected, sonicated, and freeze-dried prior to reuse under identical conditions. Correlation analysis were applied to examine the relationship of adsorption equilibrium (q) and photocatalytic rate (k) with specific surface area, porosity and band gap of composite catalyst by using R software (version 3.4.1).

3. Results and Discussion

3.1. Material Characteristics

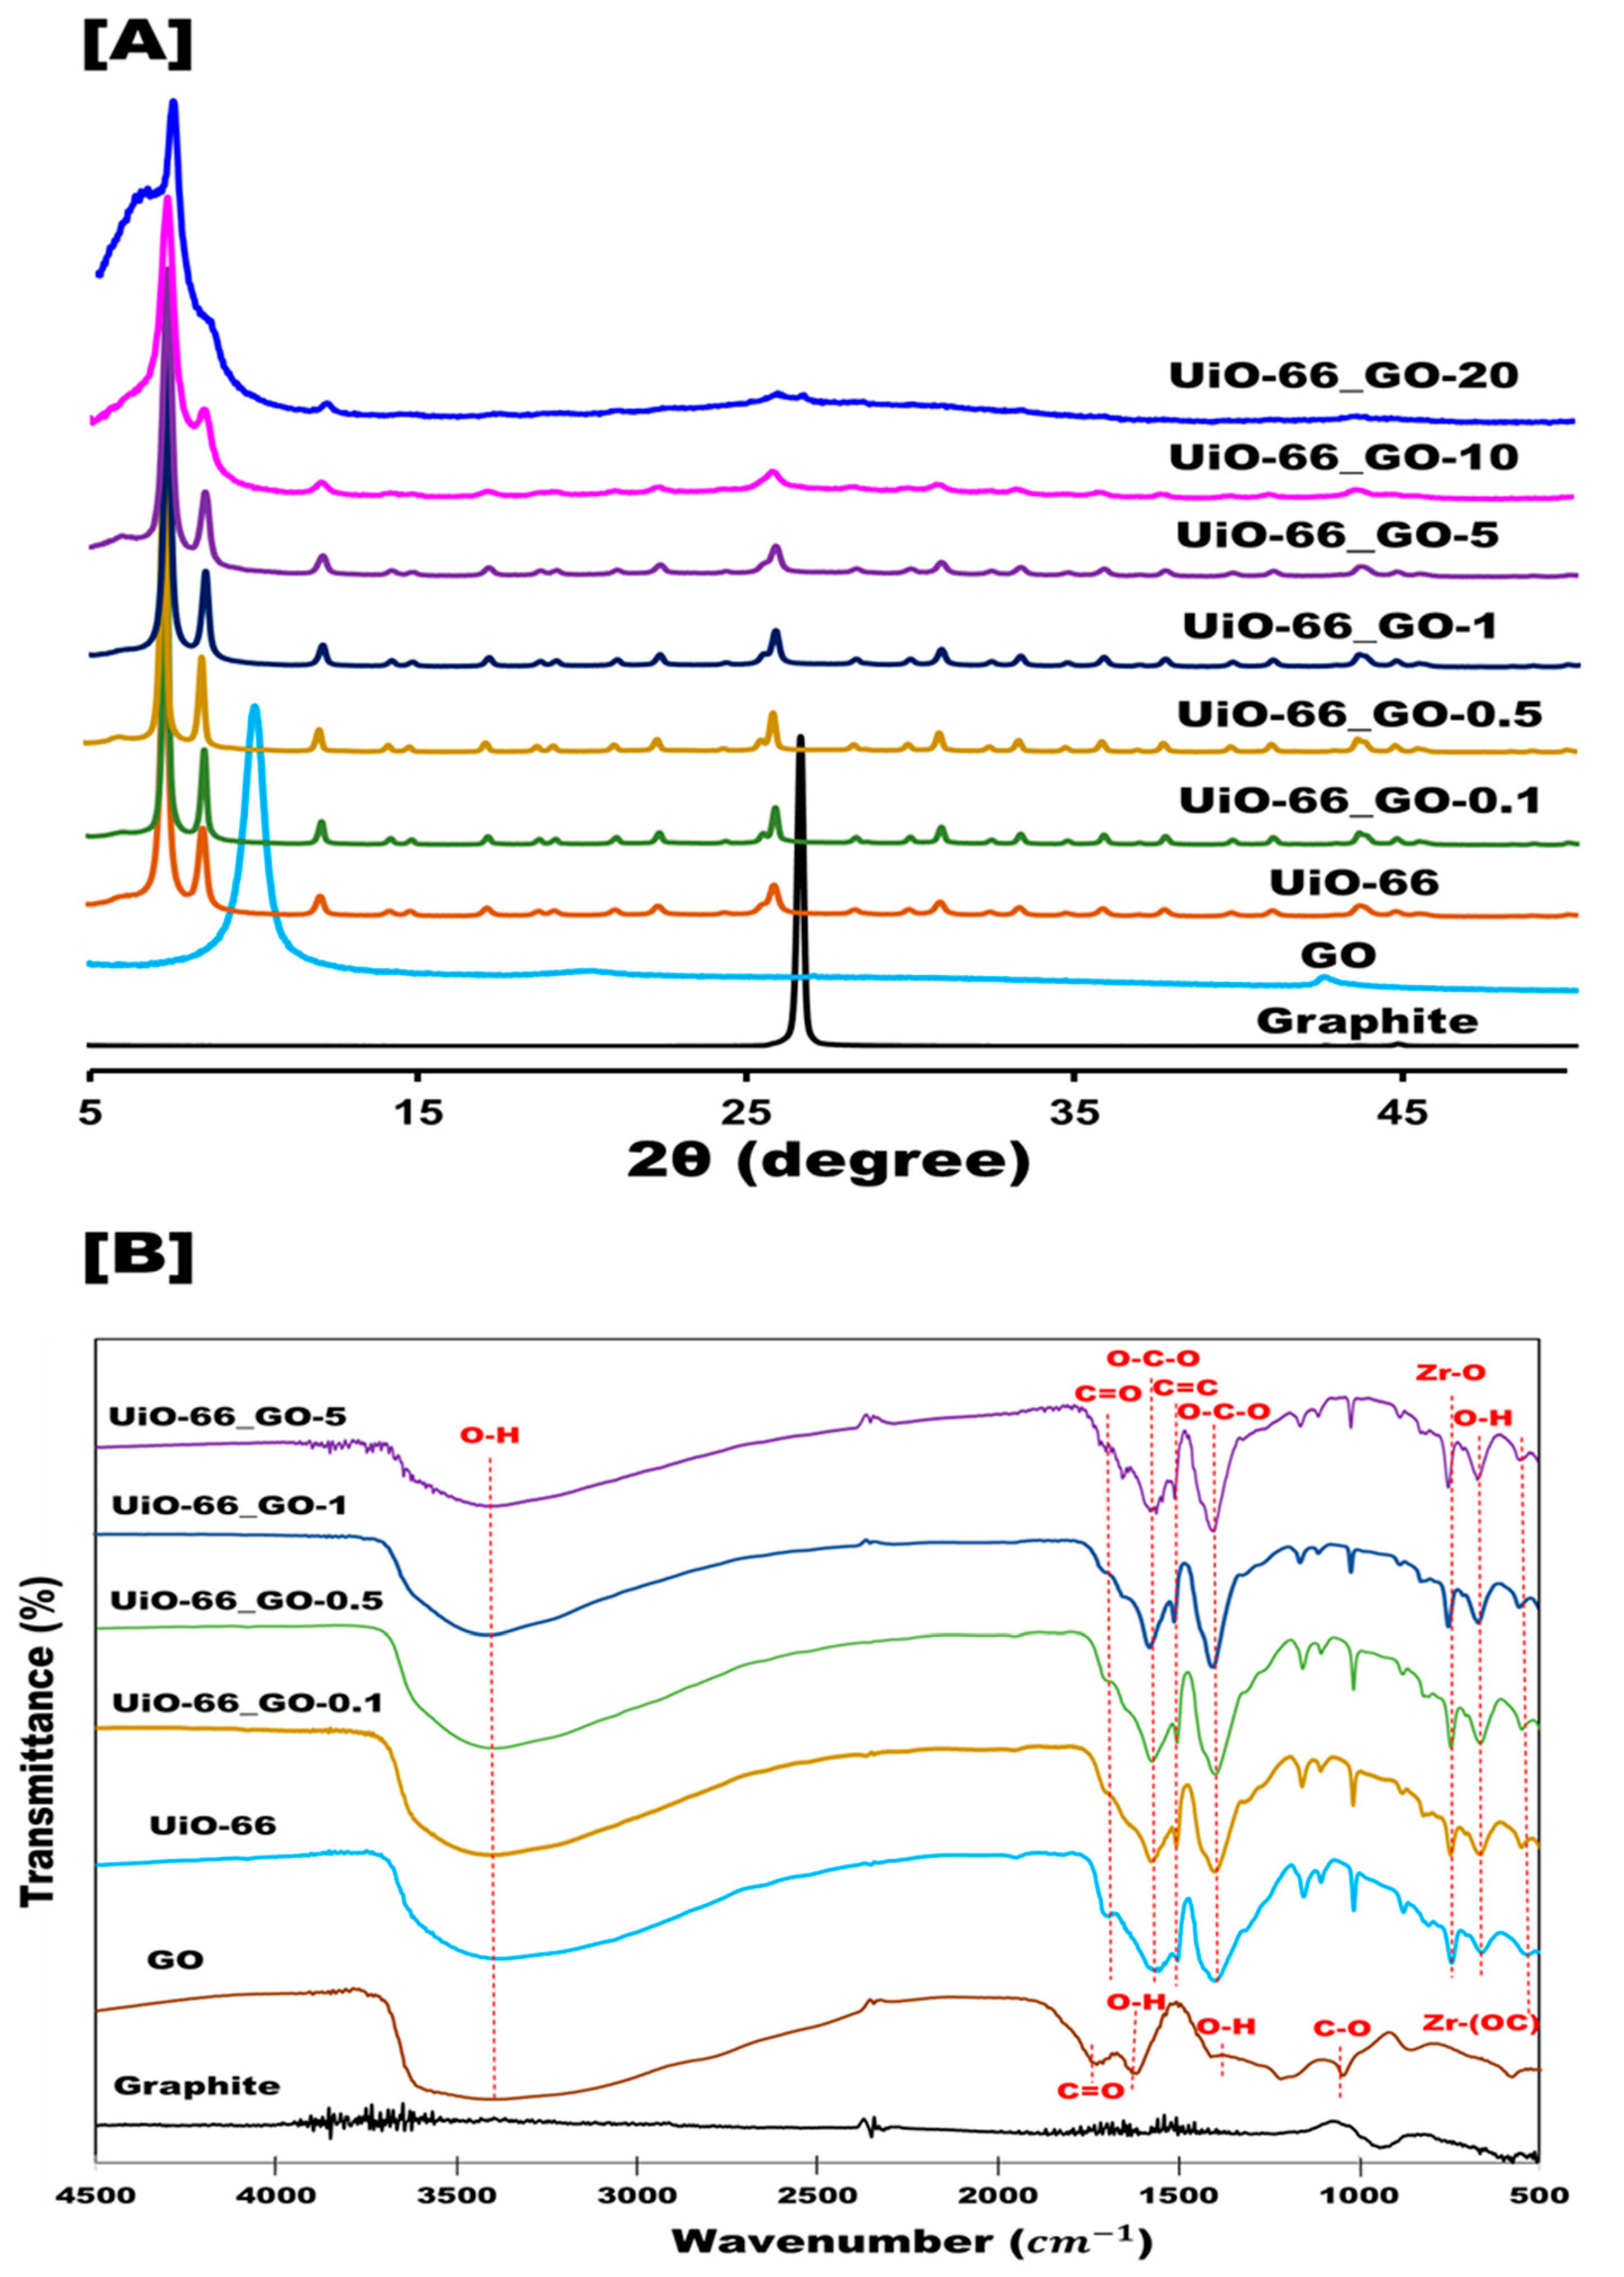
3.1.1. Crystalline Structure

The pristine graphite used showed a peak at 2θ ≈ 26.52° in XRD patterns, corresponding to an interlayer spacing of 0.34 nm, whereas the most intense peak of GO appeared at 2θ ≈ 10.08°, corresponding to an interlayer spacing of 0.88 nm (Figure 1A). The increase in interlayer spacing after oxidation was due to the presence of oxygen functional groups on each carbon layer, as could be confirmed by FTIR, indicating that graphite was oxidized to GO. The XRD pattern of UiO-66 was in good agreement with that reported in the literature [14,15], demonstrating its successful synthesis. Similar peaks to those of UiO-66 were observed in the diffraction patterns of the UiO-66_GO composites ranging from 0.1 to 5 wt%, but the crystalline peak of GO was not observed due to its low loadings in the composites and its good dispersion in DMF [34,35]. However, when increasing GO loading to more than 5 wt%, the number of peaks were reduced as clearly seen in the profile of UiO-66_GO-10 and 20 wt%. These observations suggest that the small amount of GO (0.1%–5%) did not interfere with crystalline structure of UiO-66 in the composite.

3.1.2. Surface Functional Groups

The FTIR spectrum of GO (Figure 1B) featured absorption peaks at ν = 1734 cm−1 due to the C=O bonds of carboxyl and carbonyl groups, 3365, 1625, and 1409 cm−1 due to the O−H bonds of hydroxyl groups, and 1050 cm−1 due to the C−O bonds of epoxy and alkoxy groups [36,37], confirming the presence of oxygen functional groups. The absorption peaks of UiO-66 showed the fingerprint groups, including the C=O bond of carboxylate groups in the 1,4-benzenedicarboxylic acid (BDC) ligand (1670 cm−1), the O−C−O unit of BDC (1585 and 1395 cm−1), C=C of the benzene ring (1506 cm−1), the O−H bonds of hydroxyl groups (3365 and 746 cm−1), a Zr−O mode (659 cm−1), and Zr−O−C symmetric stretching [10,29]. However, no significant absorption bands of GO were observed in the spectra of the UiO-66_GO composites, which suggests that the oxygen atoms of carboxyl groups (-COO-) on the GO layer are bonded with the coordinatively unsaturated metal complex (Zr-OH/OH2+) of UiO-66, similarly to the bonding between the H2BDC linker and the metal complex in pristine UiO-66 as confirmed by previous studies [35,38]. However, the occupation of sites on the coordinatively unsaturated metal complex (Zr-OH/OH2+) of UiO-66 by GO might interfere with the adsorption capacity of CBZ, which would be expected to bind at the same site and X-ray photoelectron spectroscopy (XPS) analysis may be useful for further confirmation.

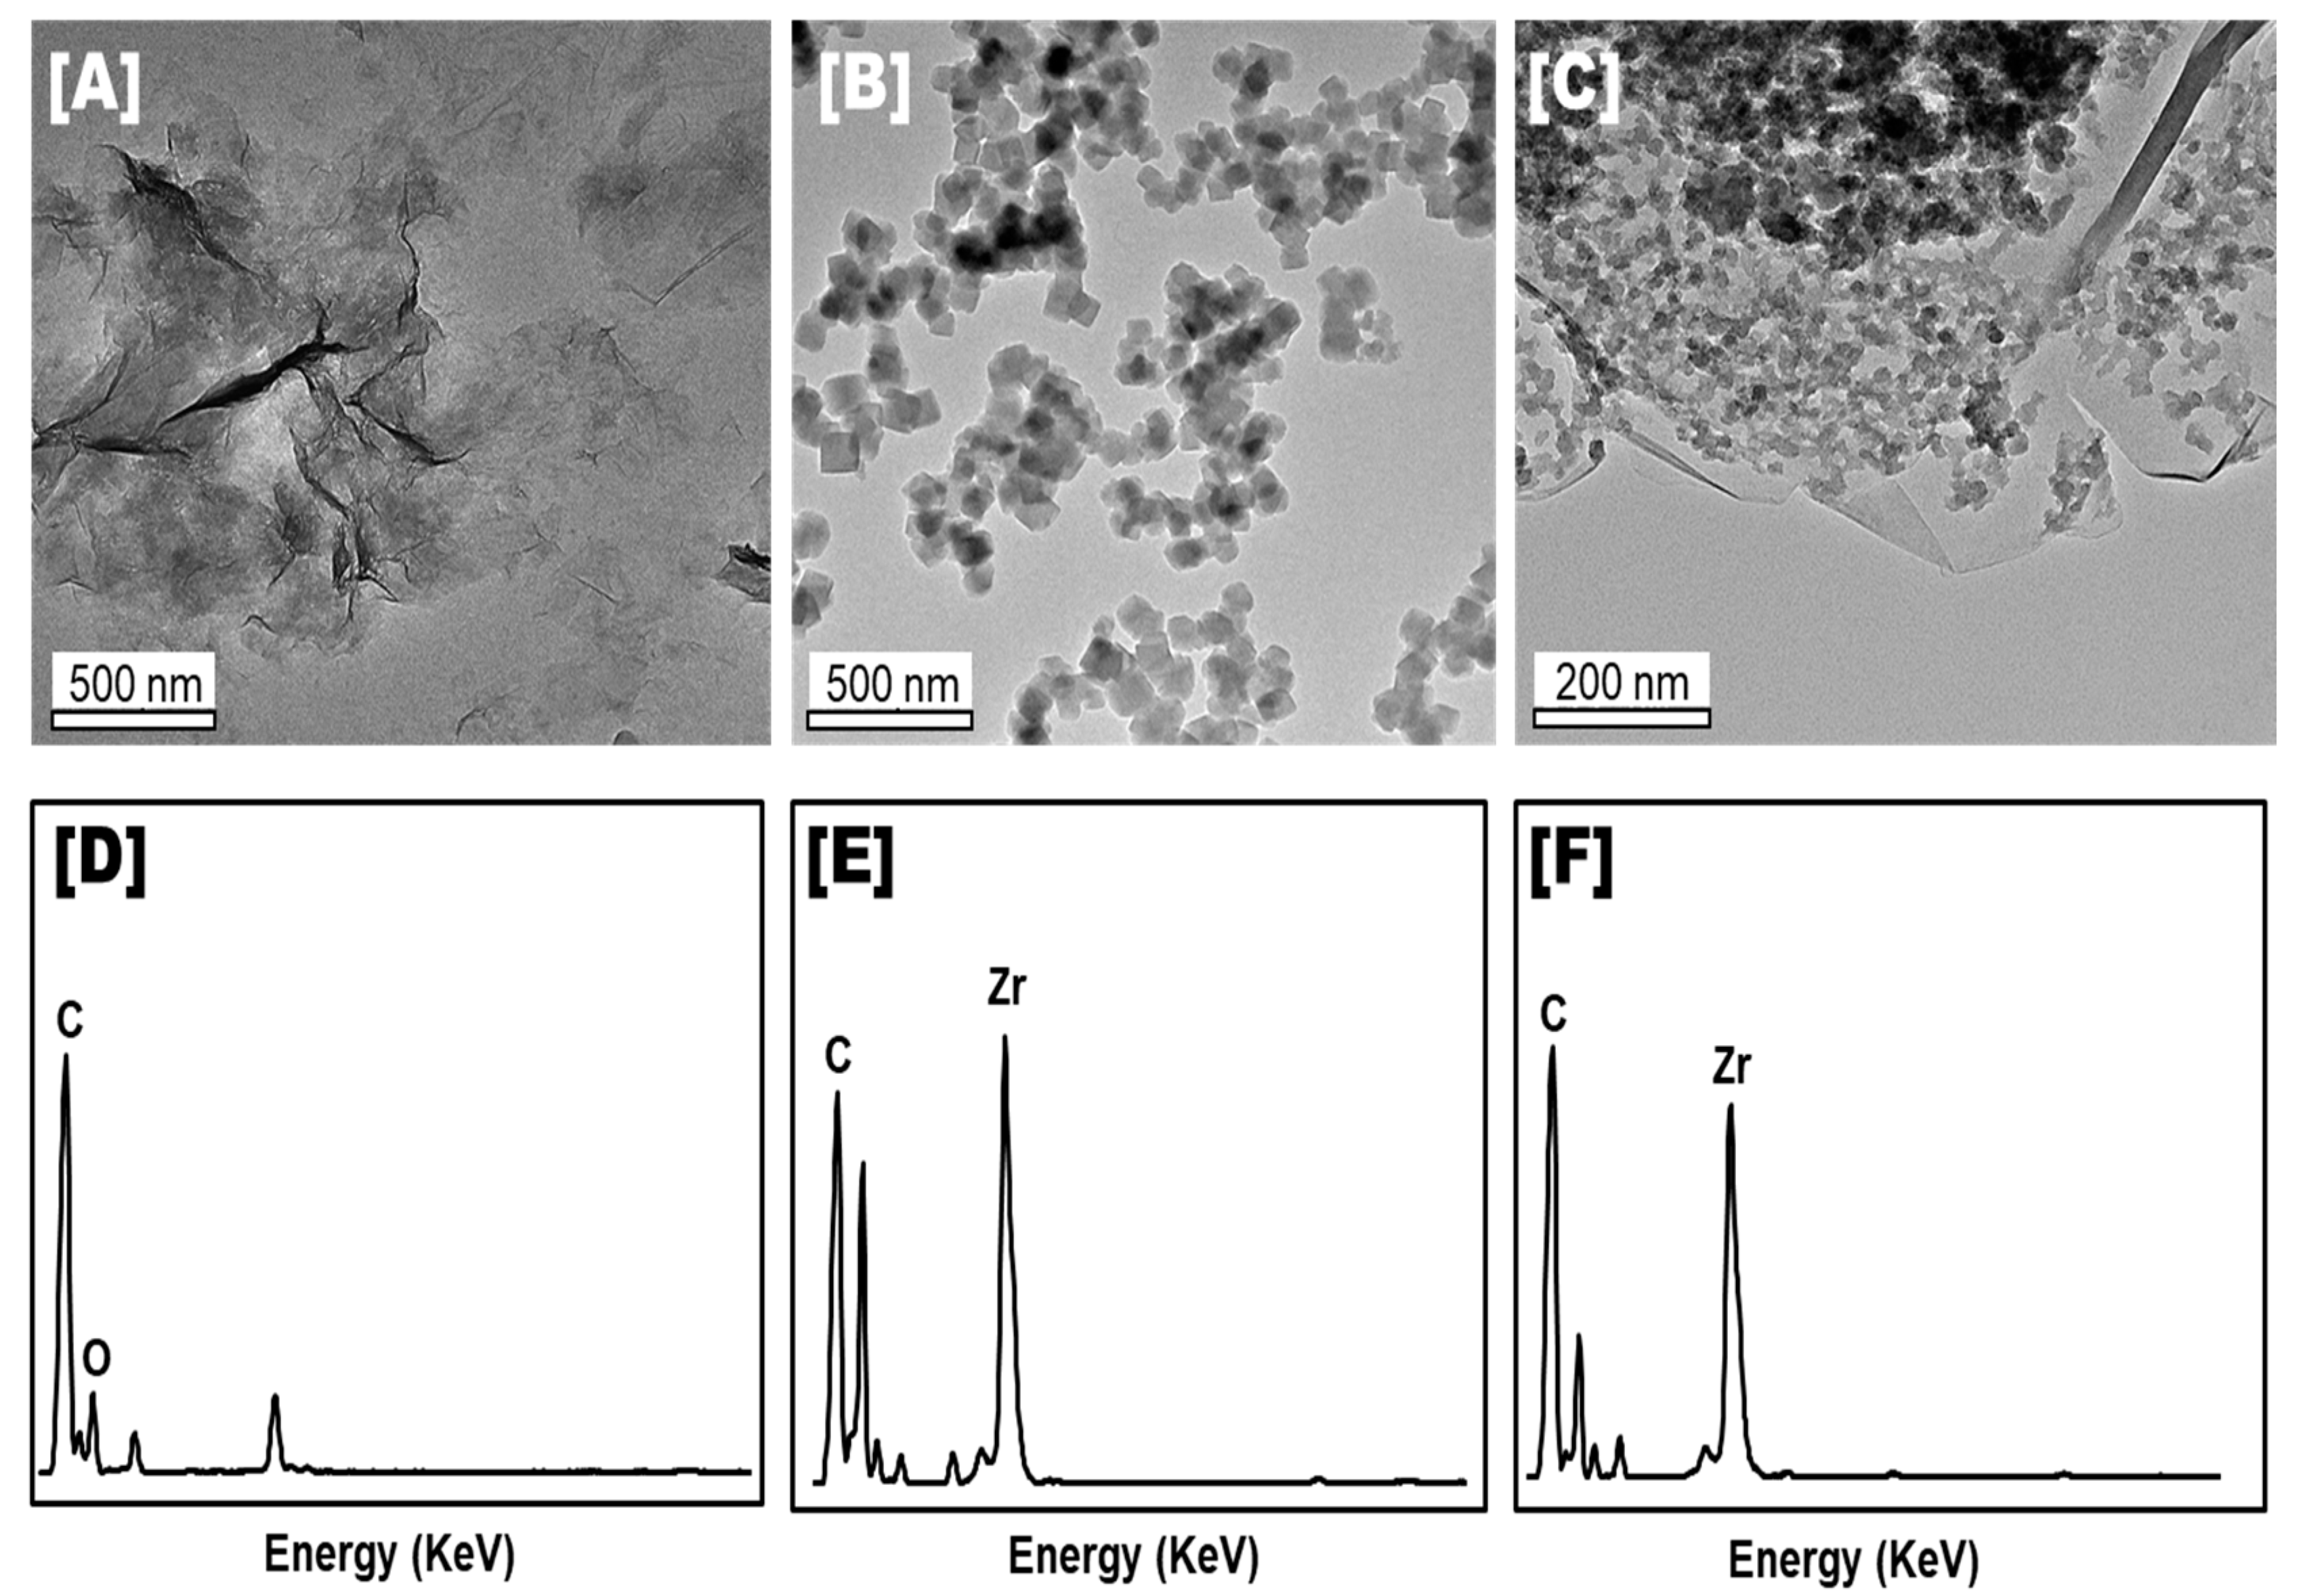
3.1.3. Morphology and Element Compositions

SEM images revealed dense layered sheets of GO (Figure S2A) and cubic crystalline particles of UiO-66 (Figure S2B), the size of the latter (120 nm) was in a similar range (100–150 nm) to that reported in the literature [29,31]. The different particle size is probably due to the different ratio of ZrCl4, H2BDC, and DMF used in the synthetic process. Moreover, the UiO-66 particle size in the composites decreased with increasing GO content, as shown in Figure S2, which may be related to the limited growth space on the GO layers [29]. This may be regarded as further evidence for successful loading of UiO-66 on the GO layers.
Differences in microstructure and elemental composition among the composites could be discerned from their TEM images and EDS patterns, respectively (Figure 2). A uniform distribution of UiO-66 particles on a large GO sheet could clearly be observed (Figure 2C). It can be envisaged that the Zr4+ metal nodes in UiO-66 are coordinated by oxygen functional groups (C=O, O-H and C-O) on the GO layer, thus preventing the aggregation of UiO-66 and improving its dispersion, as suggested previously [39]. Additionally, the EDS pattern from a TEM image of GO (Figure 2D) showed C and O as the main elements, whereas UiO-66 and the composites showed C and Zr (Figure 2E,F).

3.1.4. Specific Surface Area and Pore Volume

The specific surface area of UiO-66 was determined to be 420 m2/g (Table 1), which falls within a similar range (400–600 m2/g) as that reported in some previous studies [40,41,42], but lower than that in other reports (800–1200 m2/g) [9,18,43]. The different specific surface areas may be associated with the completeness of solvent removal during the preparation of the material [41]. The micropores of UiO-66 were predominantly in the size range of 0.4–1 nm, although some pores in the range of 1–2.45 nm were also discerned. The specific surface area and pore volume of GO were evaluated as 56 m2/g and 0.23 cm3/g, respectively. The former is higher than those reported in previous studies (7–30 m2/g) [44,45,46]. This might be attributed to different degrees of exfoliation of GO during preparation of the material [47,48].
Although the specific surface area of GO is low, its presence in the respective composites significantly increases their surface areas, total pore volumes, and micropore volumes compared to those of the pristine UiO-66 (Table 1). The increase in the porosity of UiO-66_GO is apparent at both the micro- and macropore levels (as shown in Table 1). The enhancement of the macroporosity of the composite surface can be attributed to a new porous structure produced at the interface between the GO layer and the UiO-66 “block,” as seen in the N2 adsorption and pore size distribution (PSD) plot (Figure S3). Meanwhile, the microporosity might be improved by the enhancement of crystalline structure dispersion along with the GO layer inducing smaller particle size. At high GO contents, as in UiO-66_GO-1 and UiO-66_GO-5, the surface area and total pore volume were significantly decreased as a result of GO sheet stacking and cubic UiO-66 particles being enveloped by the GO sheets. These observations imply that the introduction of GO markedly affects the pore structure of the composites, but that a continuous increase in GO content (> 0.5 wt%) does not have a beneficial effect. Nonetheless, the large surface area and pore volume of UiO-66_GO composites likely provide more active sites for adsorption and photocatalytic performance. Conversely, the accessibility of CBZ into the micropore structure of UiO-66 might be impaired by the presence of GO layers and the rigid 3D structure of the composite, which will be less accessible than an MOF with a 1D flexible structure.

3.1.5. Light Absorption and Band Gap

The pristine GO showed light absorption in the wavelength range of 200–800 nm (Figure S4a), in agreement with previous reports by Peng et al. [49] and Yang et al. [20]. The absorption spectrum of UiO-66 featured a peak due to the Zr-O clusters at 255 nm and a ligand-based absorption at 290 nm (Figure S4a) [9,50]. After adding GO, all the UiO-66_GO composites showed higher light absorption in the UV region (200–400 nm) and extended absorption in the visible region (400–700 nm) compared to the pristine UiO-66 (Figure S4a). Increased GO content evidently decreased the band gap of UiO-66, as previously observed for MOF_GO, TiO2_GO, and other GO-based semiconductor composites [19,51,52]. The band gap of UiO-66 was measured as 3.55 eV, corresponding to a wavelength of 350 nm, whereas that of the composite UiO-66_GO-5 was only 3.2 eV, corresponding to a wavelength of 390 nm (Figure S4b). The enhancement of light adsorption and narrowed bandgap of composite materials were attributable most likely to the presence of GO, which plays the role of electron acceptor and enhances carrier separation of photogenerated electron and holes in the MOF [20]. This modified light absorption and band gap serves to enhance the photocatalytic activity of UiO-66_GO composites.

3.2. Photocatalytic Performance

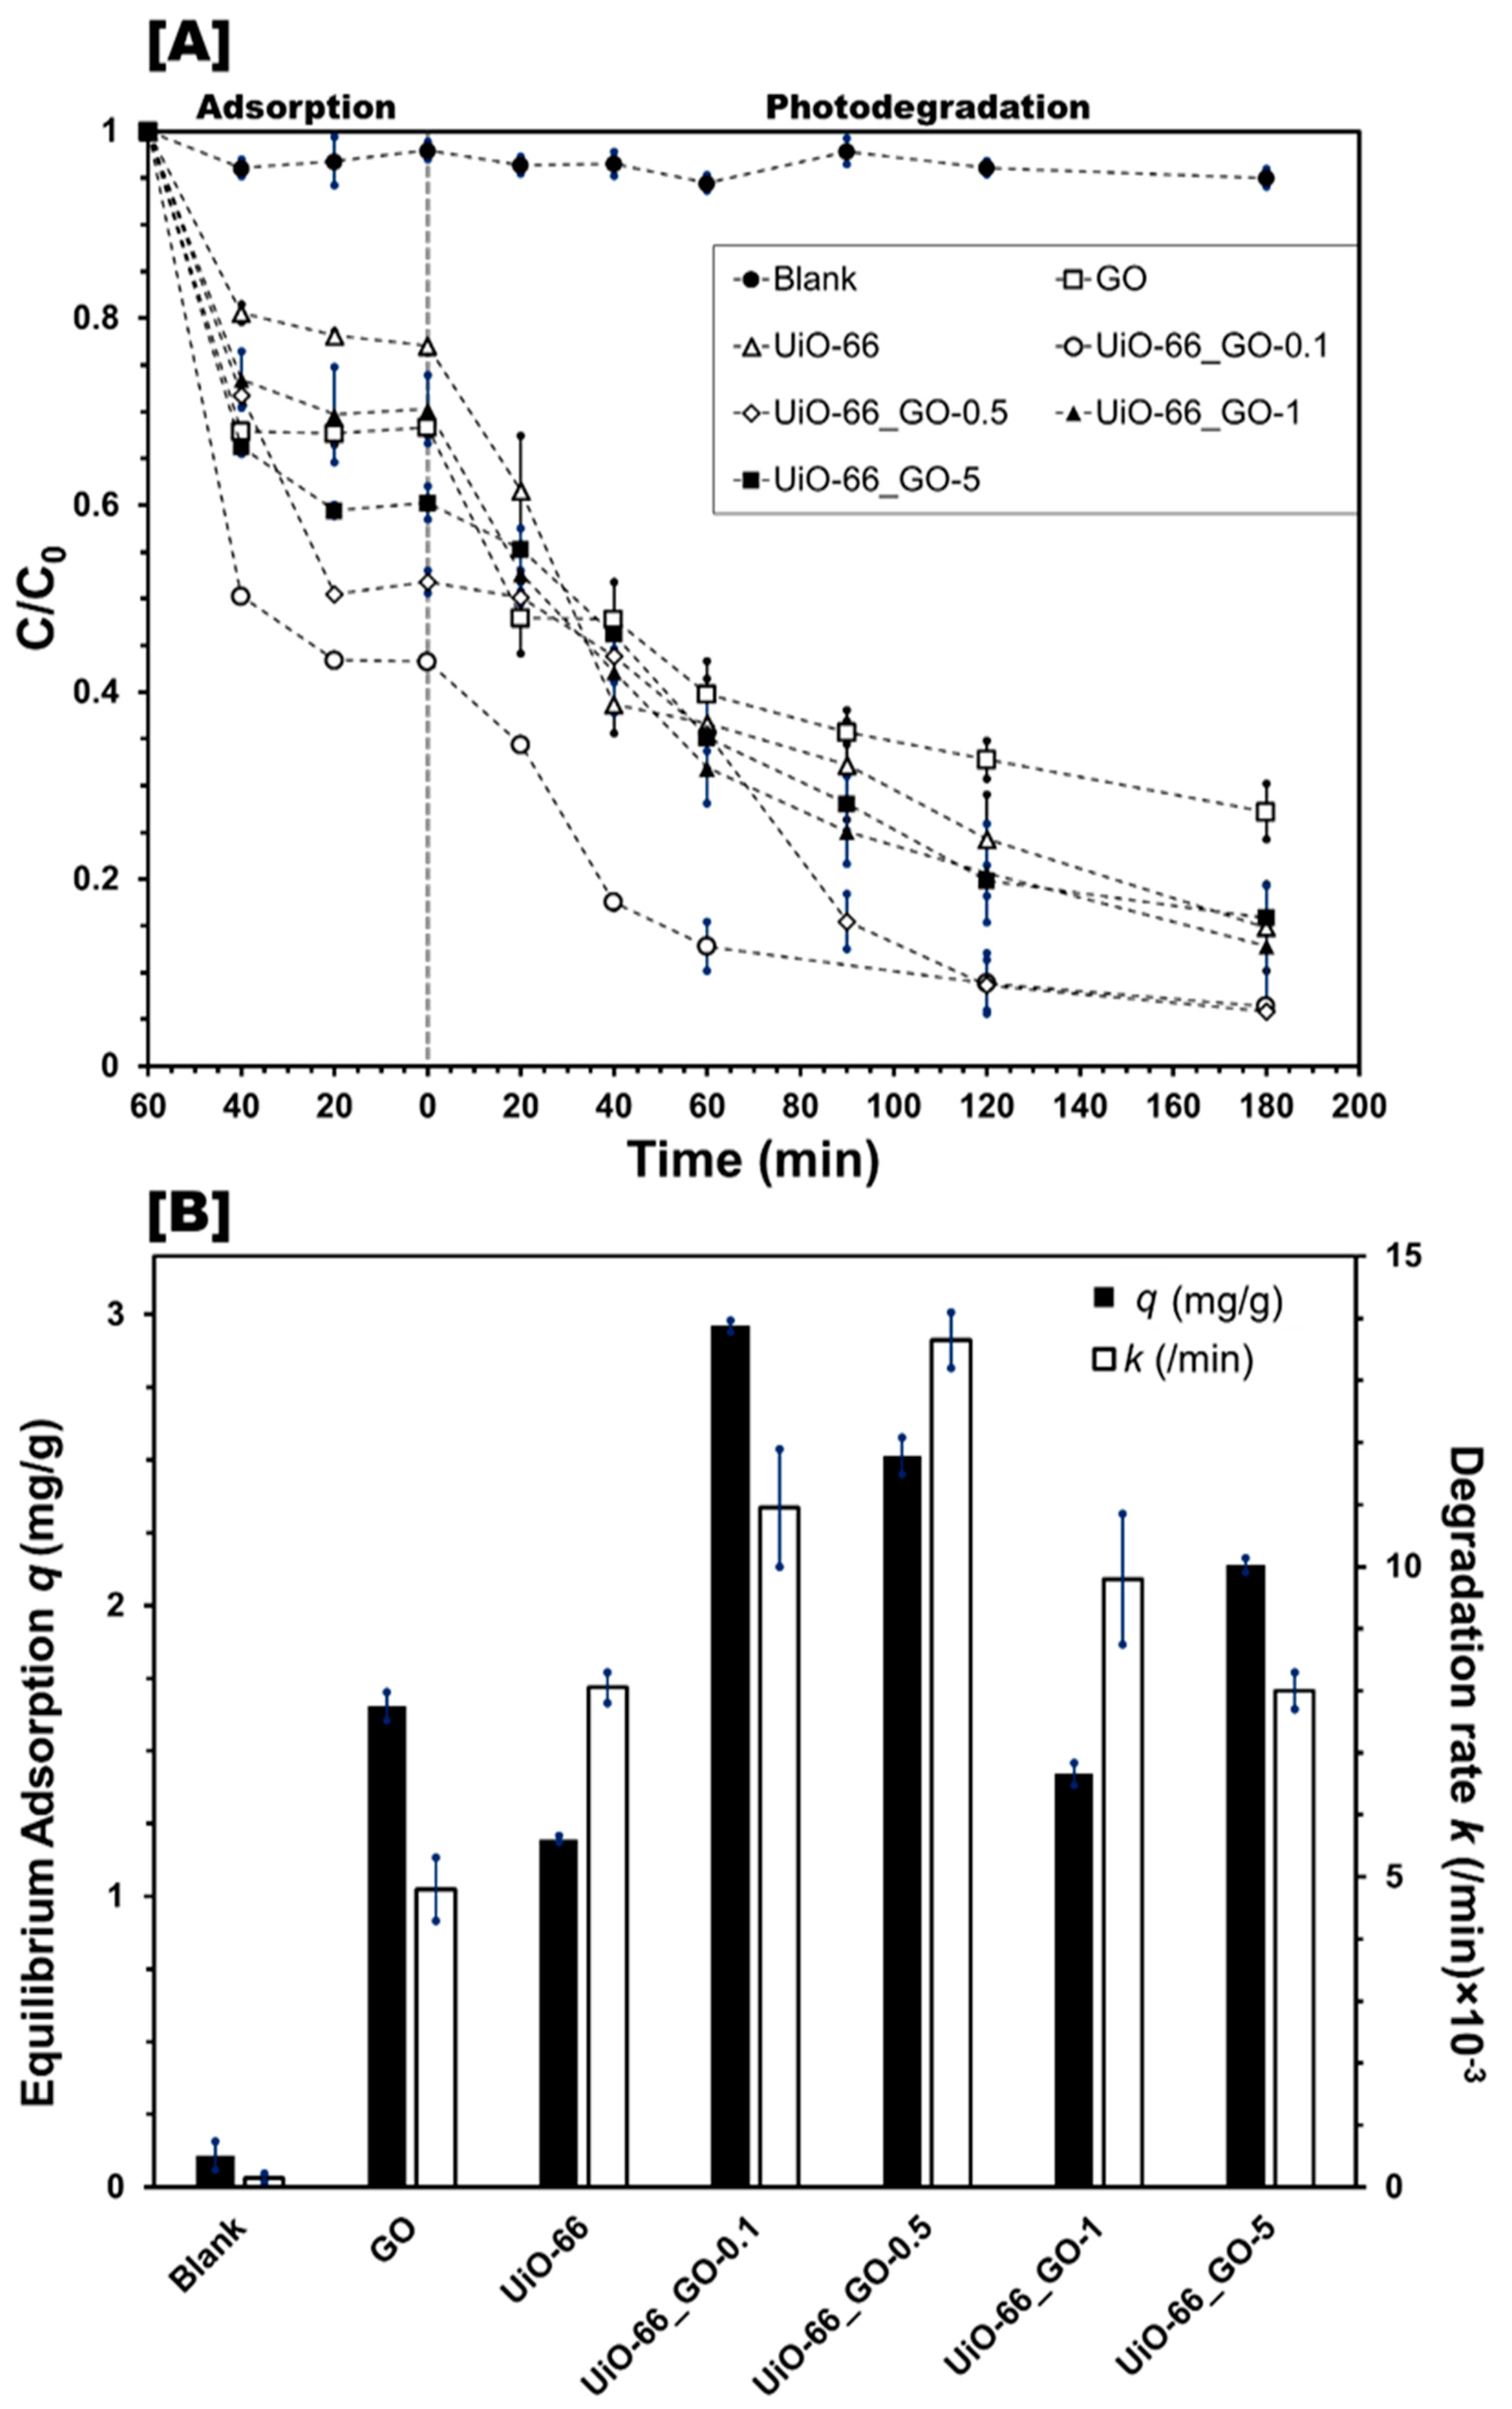
3.2.1. Effect of Photocatalyst Composite

This modified light absorption and band gap serves to enhance the photocatalytic activity of UiO-66_GO composites. Negative control experiments showed that hydrolysis and photolysis had no significant effect on CBZ concentration, and in the adsorption phase all photocatalysts reached equilibrium within 1 h (Figure 3). At equilibrium (Figure 3B), each of the UiO-66_GO composites showed an adsorption capacity up to 2.5 times higher than that of pristine UiO-66, attributable to the larger surface areas (correlation coefficient R = 0.77, n = 5, p = 0.13) and pore volumes (R = 0.53, n = 5, p = 0.35) (Table 1). The adsorption of CBZ on UiO-66 is principally through Van der Waals interactions with metal clusters [40], whereas its adsorption on GO is mainly through π-π electron donor–acceptor interactions [53,54]. Among the composite materials, UiO-66_GO-0.1 showed the highest adsorption capacity of approximately 2.96 mg/g, which corresponds to its highest surface area and porosity. Higher GO content resulted in lower adsorption capacity because of its lower surface area and porosity. These results further imply that excessive GO wrapped around the UiO-66 reduces the number of adsorption sites, being consistent with the results from BET analysis and SEM observation.
Under UVC irradiation, the presence of GO increased the photodegradation rate of CBZ over UiO-66 (Figure 3B), except in the case of UiO-66_GO-5. The improvement of photodegradation rate can be attributed to the increased photocatalyst surface area (R = 0.93, n = 5, p = 0.02), and porosity (R = 0.77, n = 5, p = 0.13) and the narrower band gap (R = 0.31, n = 5, p = 0.62), as indicated by the BET analysis and UV/Vis absorption spectra, respectively. The maximum degradation rate (k = 0.0135 min–1) was obtained over UiO-66_GO-0.5. However, the CBZ degradation rate was lower at GO contents of less than 0.5 wt% (as seen for UiO-66_GO-0.1), probably because the GO content was too low to narrow the band gap of UiO-66. When the GO content exceeded 0.5 wt% (UiO-66_GO-1 and UiO-66_GO-5), the degradation rate sharply decreased. This was because the excessive GO reduced the number of catalyst active sites, as shown by the BET analysis (Table 1), and shielded the UiO-66 by absorbing light, which resulted in far fewer photogenerated charges [19,52]. Moreover, compared to TiO2, which is one of most frequently used semiconductor materials [55], UiO-66/GO composite (in case of 0.5%) showed a higher degradation rate of CBZ by about 6.4 times [56] and 16.9 times [57].

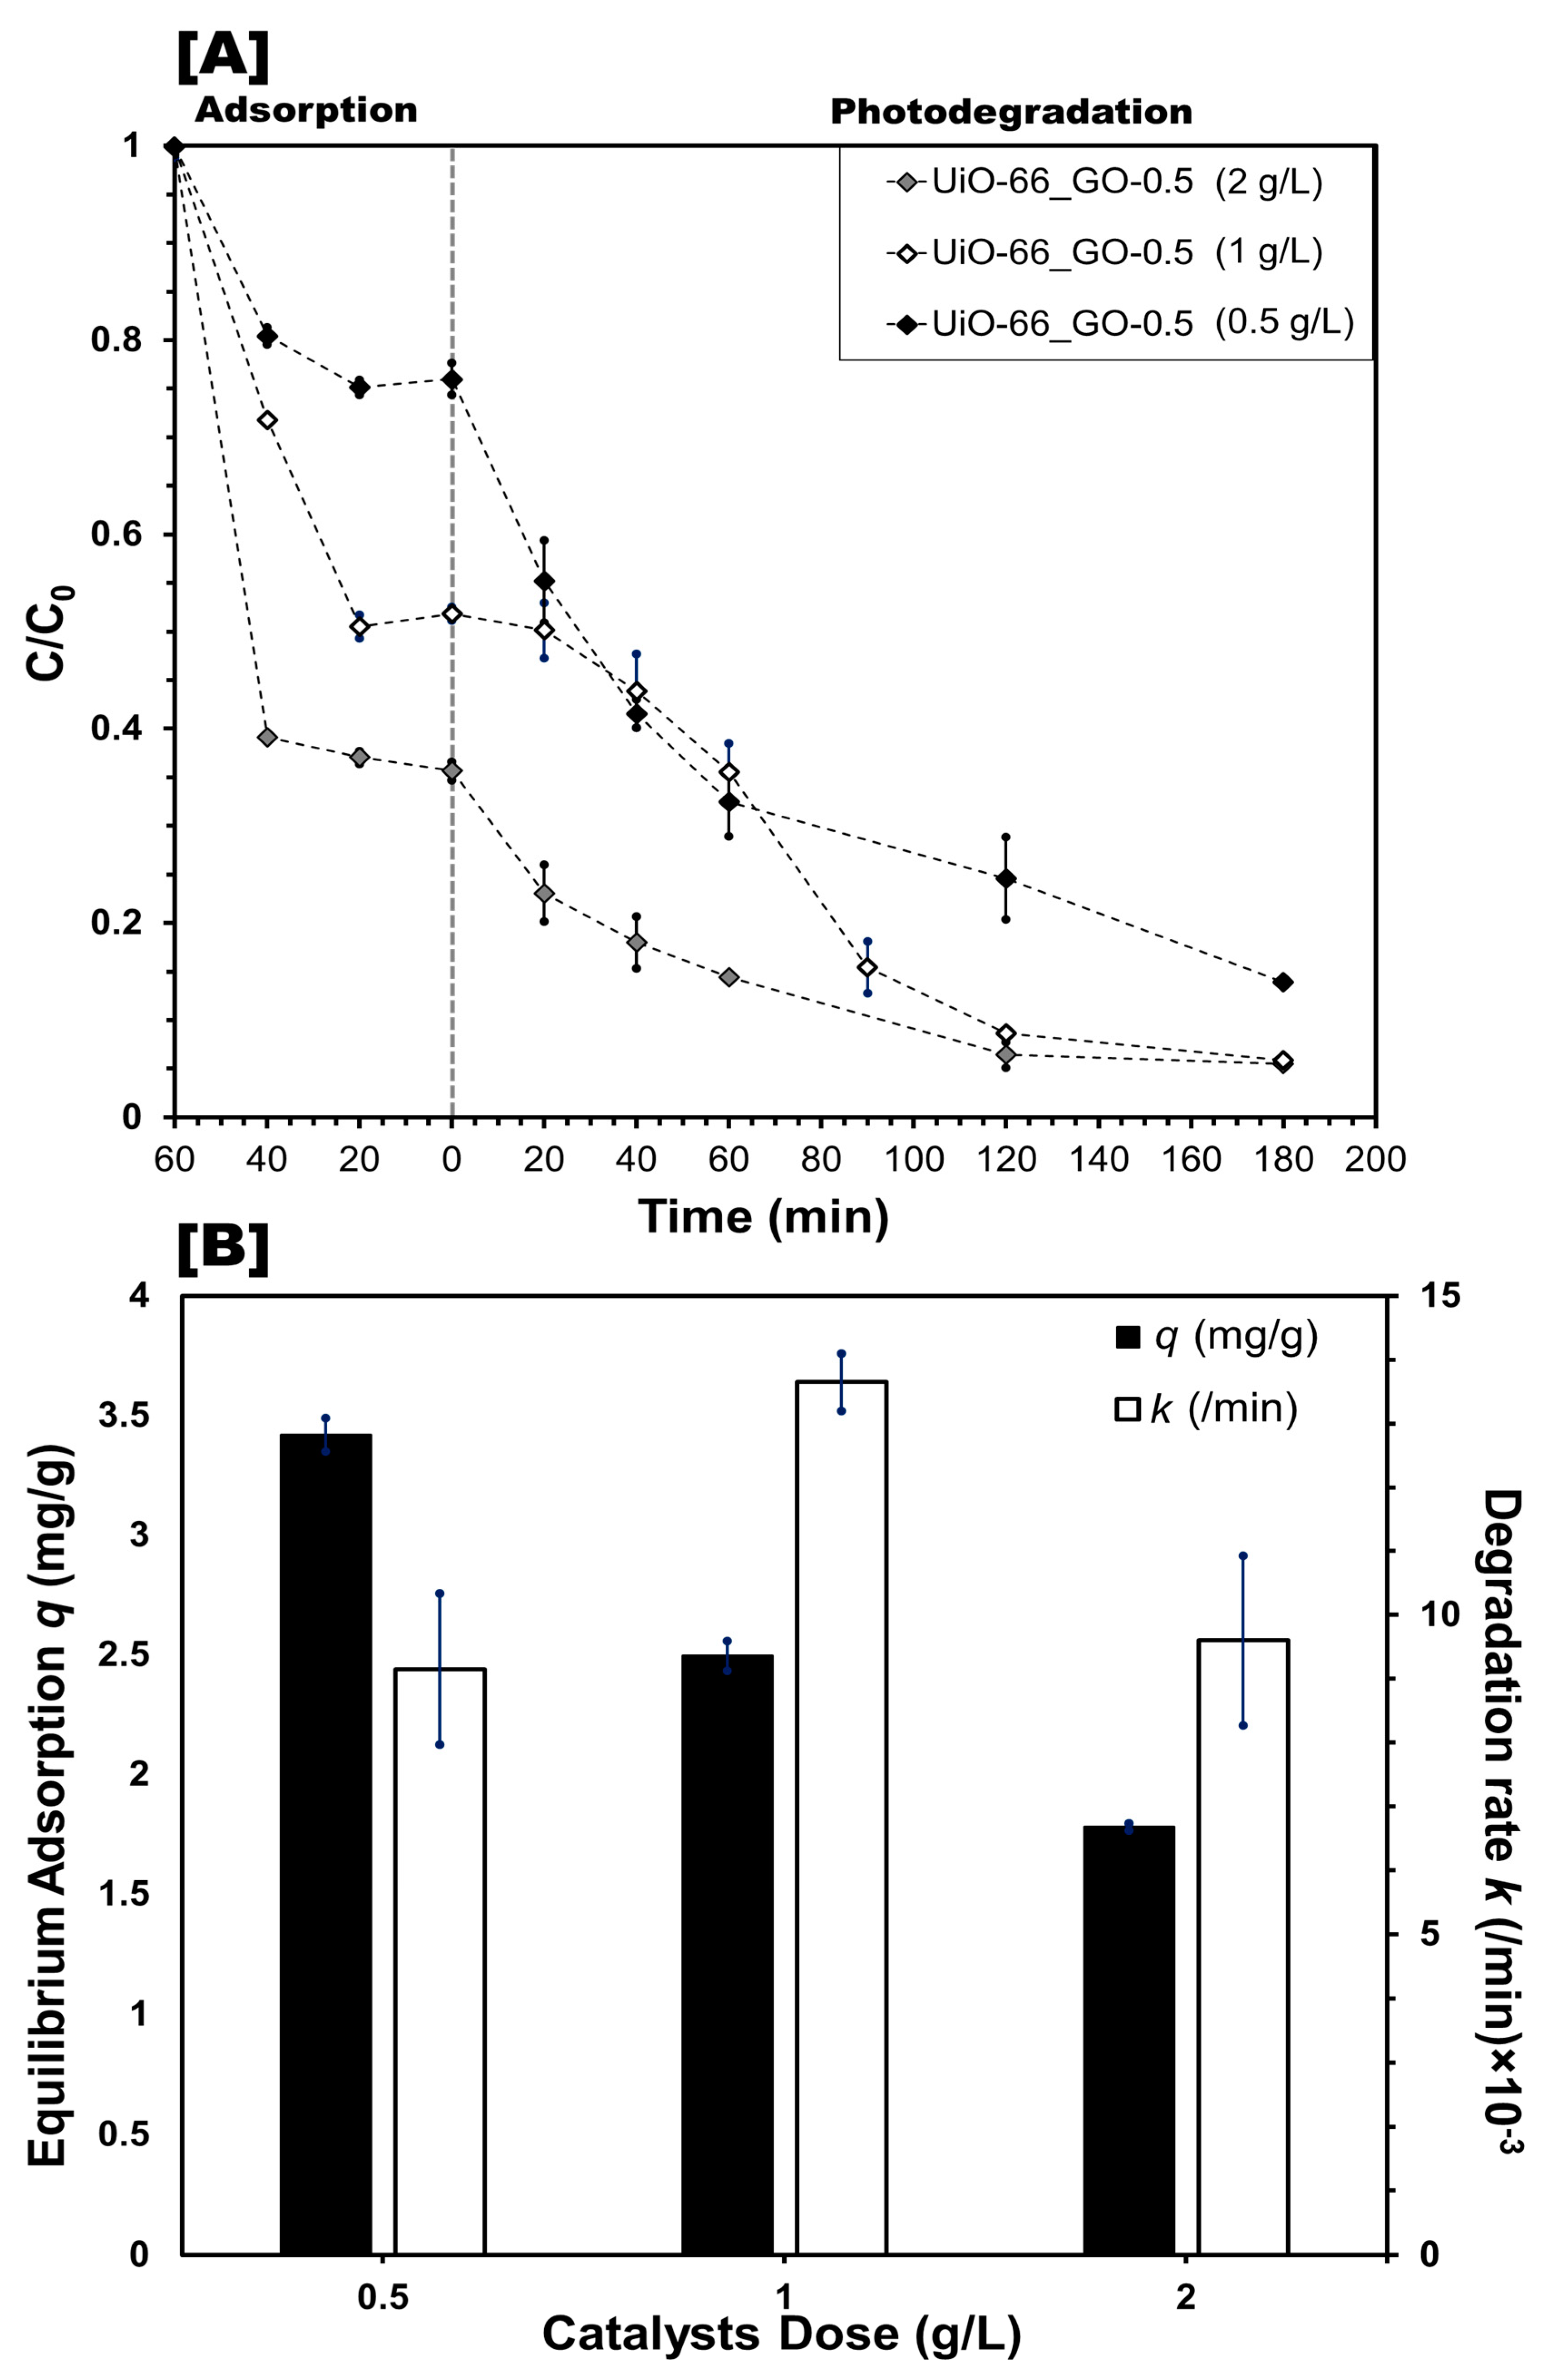
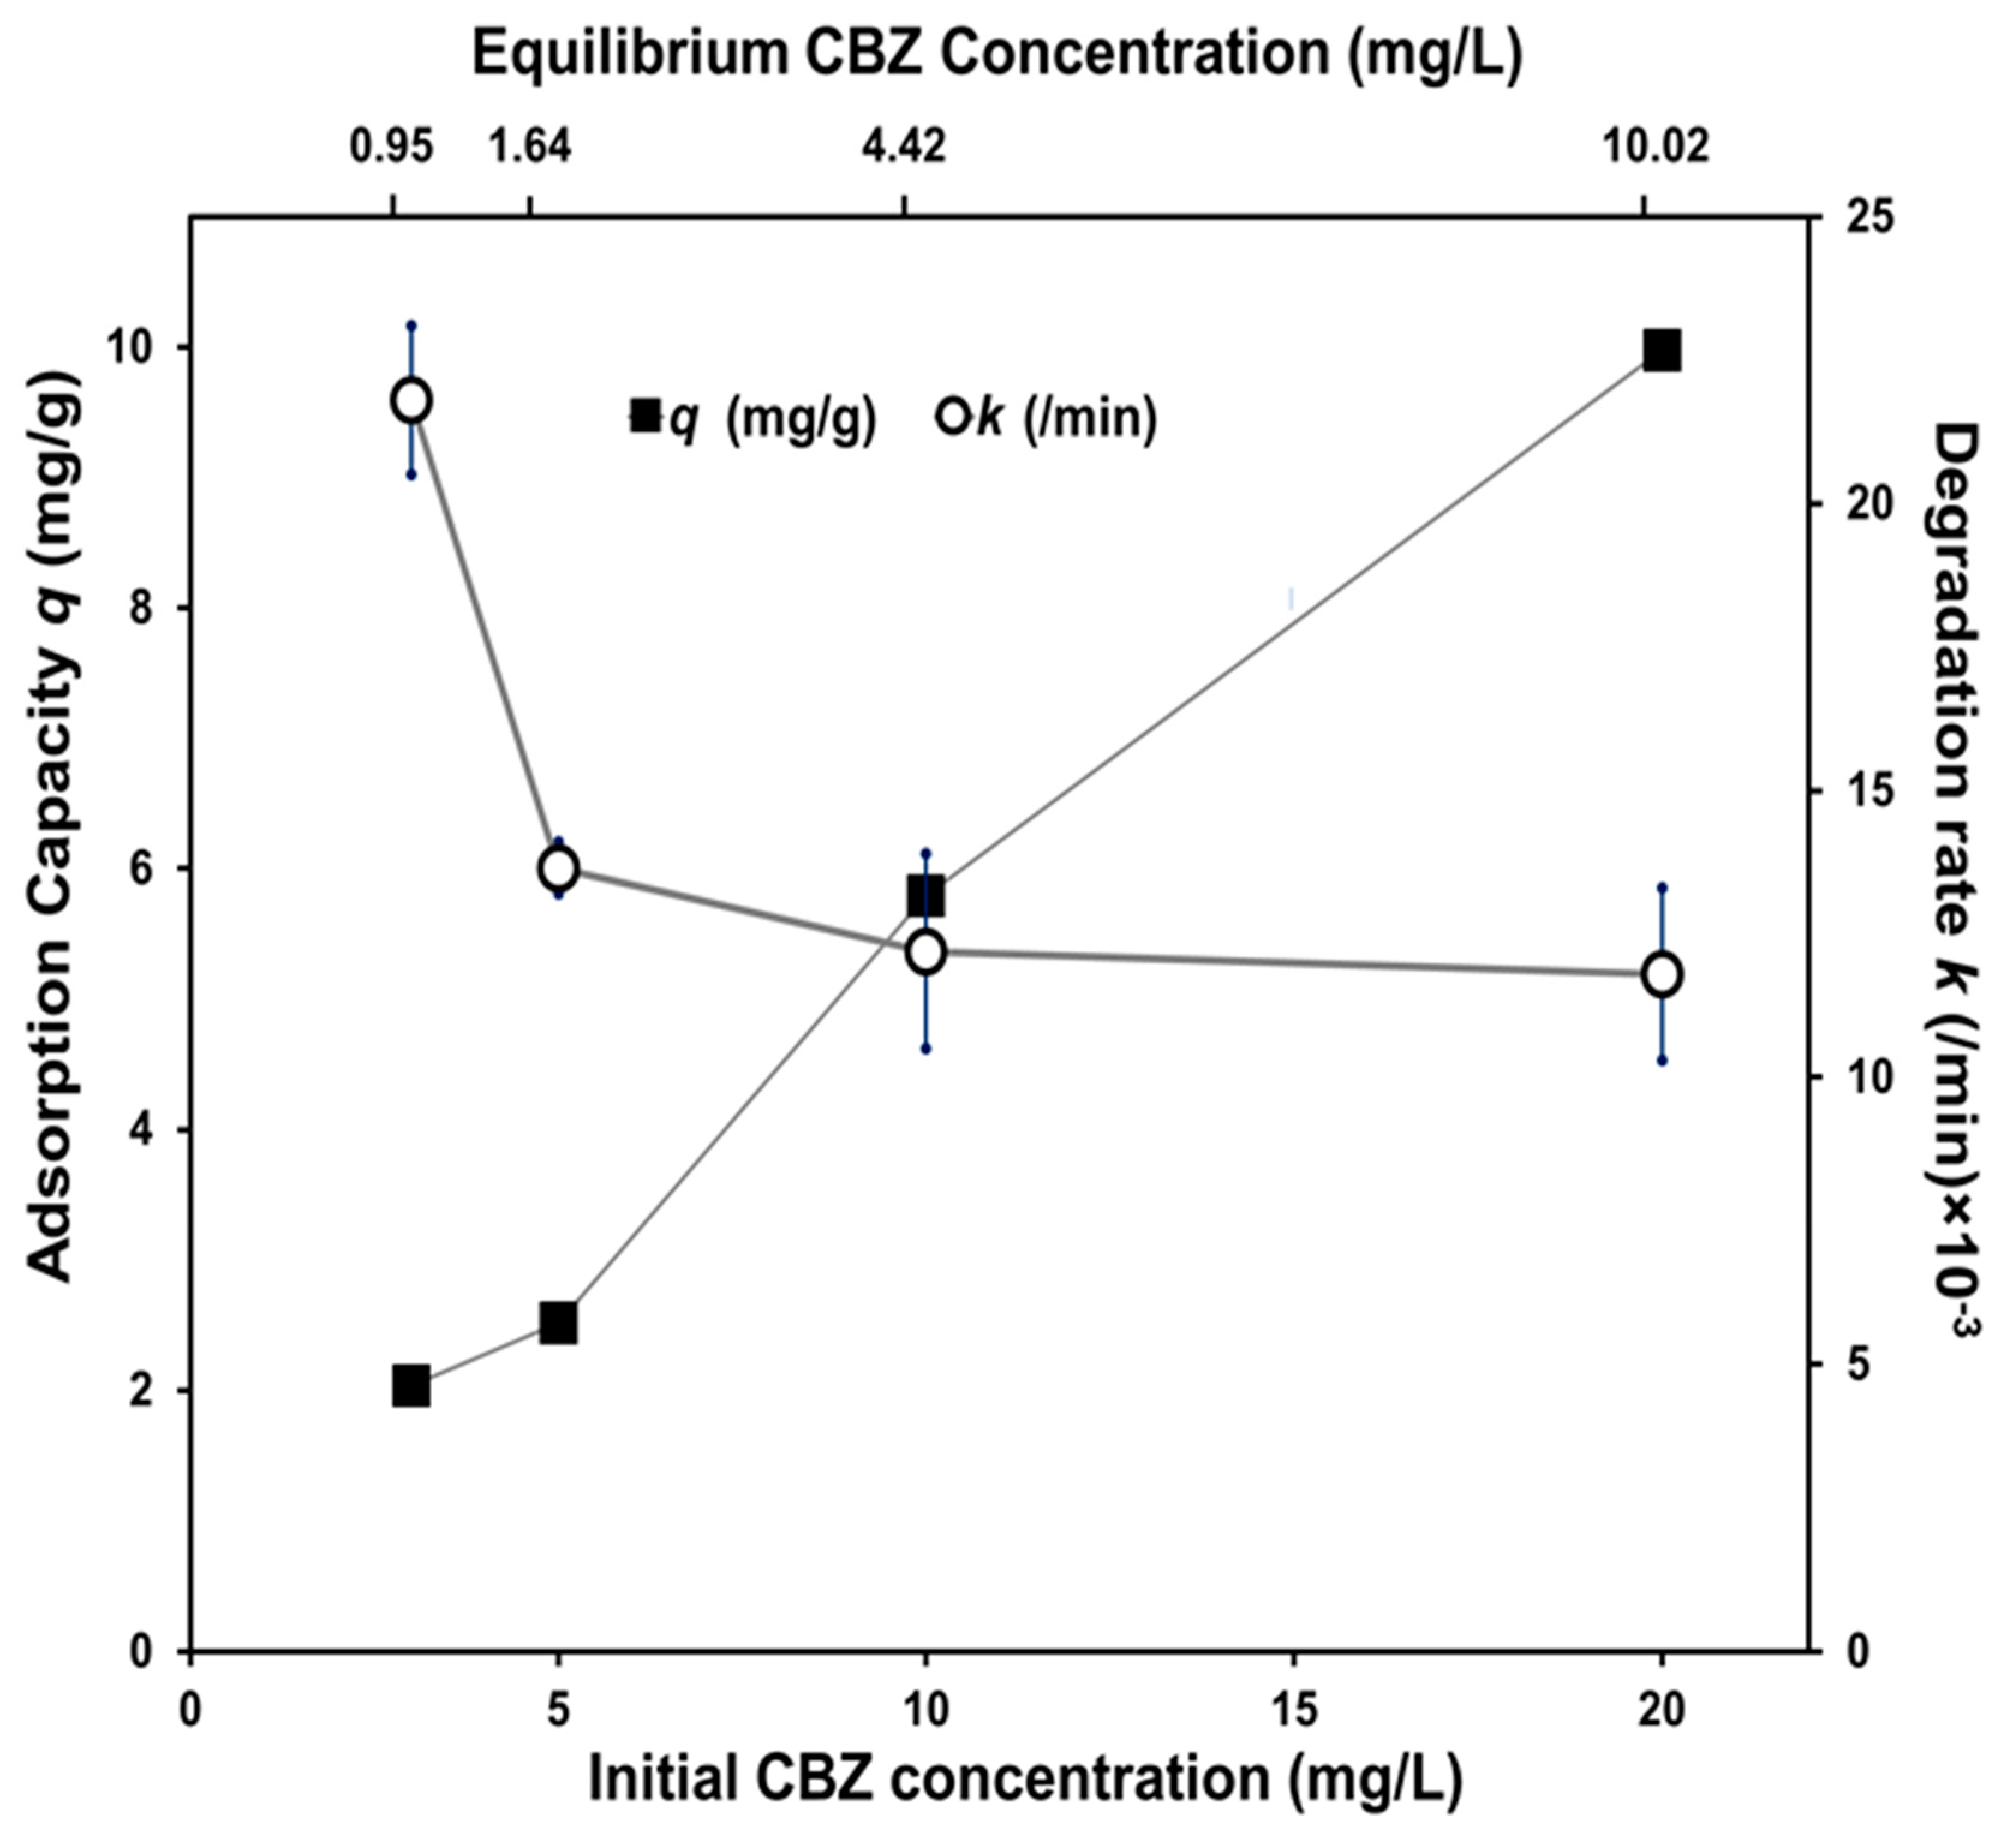
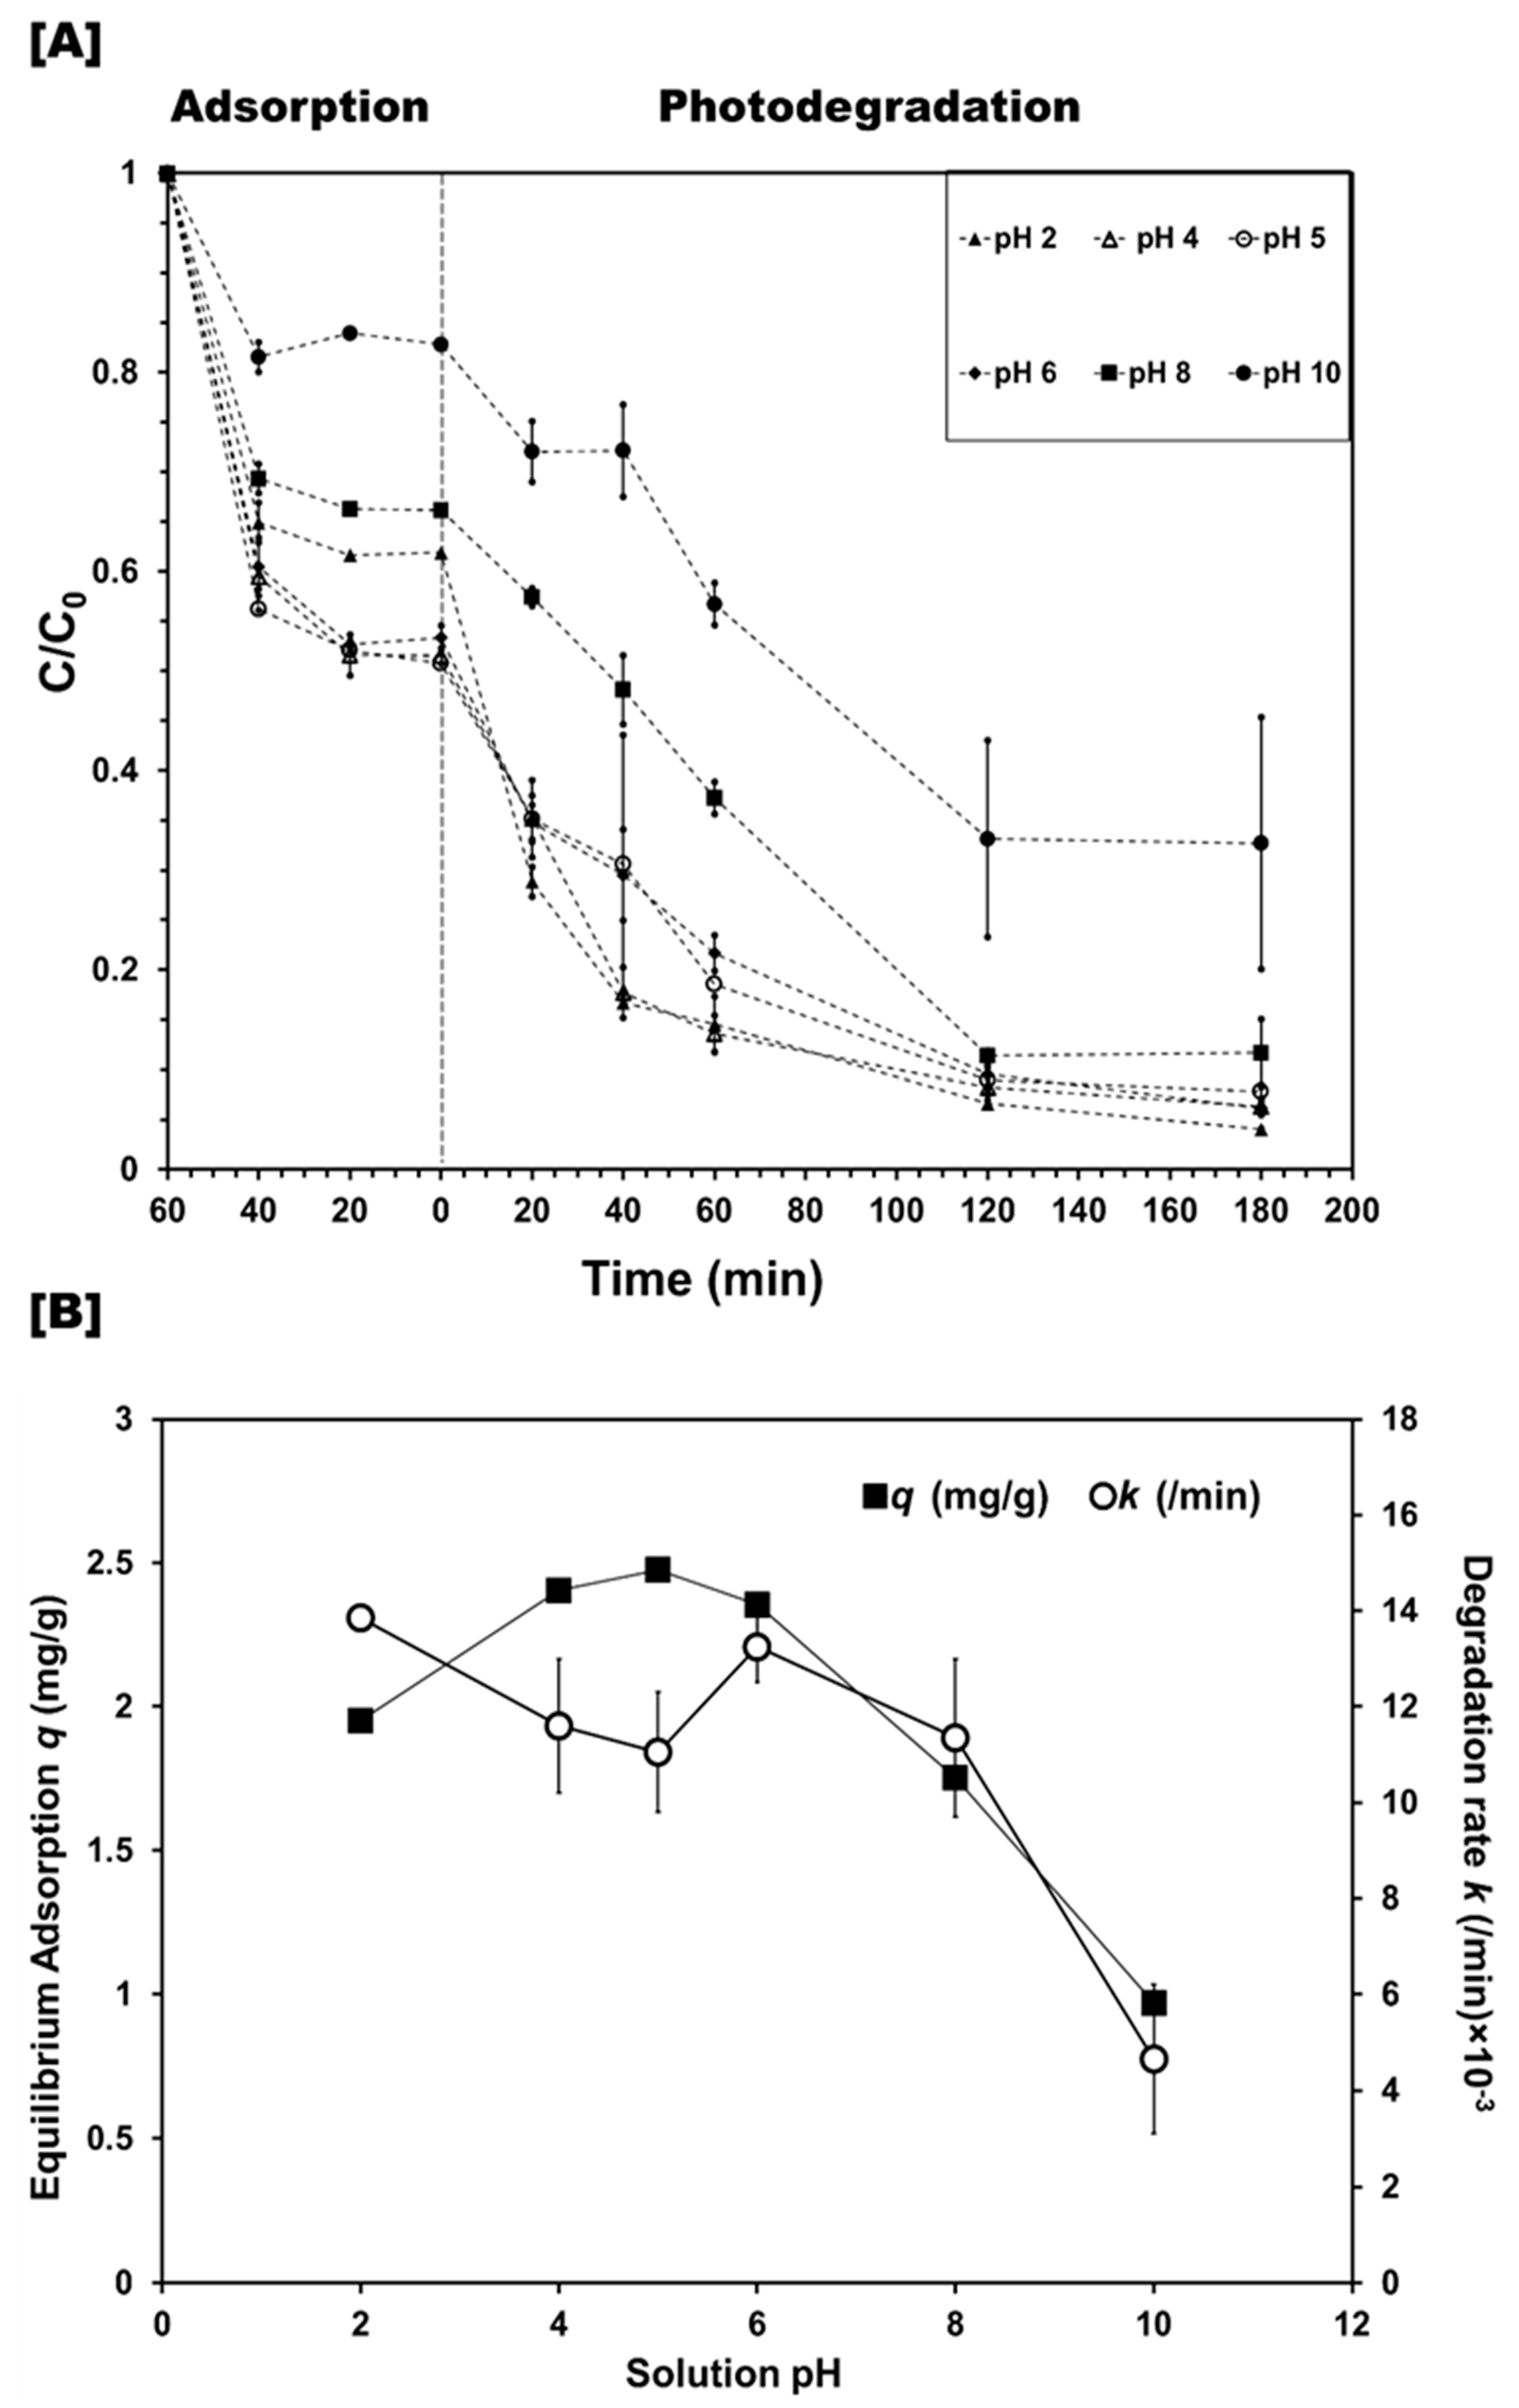
3.2.2. Effect of Photocatalyst Dose and Reaction Conditions

For the initial concentration of CBZ at 5 mg/L, the optimal dose of the catalyst was 1 g/L, showing high adsorption capacity (2.5 mg/g) and degradation rate (0.0135 min–1) and good CBZ removal (>90%) in 2 h (Figure 4). A higher catalyst dose led to greater CBZ adsorption, as it provided more adsorption sites [31,58]. At a dose of 2 g/L, most of the CBZ was adsorbed and only a small amount (<40%) remained in solution. However, the equilibrium adsorption at 2 g/L was smaller than those at lower dosages (0.5 and 1 g/L) due to low availability of CBZ in the reaction system, as confirmed in Section 3.2.3, and by the aggregation of the catalyst, which reduced the effective number of active sites [59] (Figure 4B). The degradation rate (Figure 4B) at 2 g/L was also lower than those with lower dosages (0.5 and 1 g/L) because of light-shielding [26]. Although the highest equilibrium adsorption (3.42 mg/g) was seen at 0.5 g/L, the degradation rate was low (0.0091 min–1); this dose was insufficient to remove CBZ, resulting in a low photodegradation efficiency (˂75%).
The effect of initial CBZ concentration on its photodegradation was investigated by applying different initial CBZ concentrations of 3, 5, 10, and 20 mg/L. Equilibrium adsorption first increased with increasing CBZ concentration due to a higher driving force of the concentration gradient [31,60] (Figure 5). In contrast, when the initial concentration increased from 3 to 10 mg/L, the degradation rate decreased. This was because excessive initial concentration could shield some UV light, reducing the amount of photons reaching the composite [61,62]. When the CBZ concentration increased from 10 to 20 mg/L, the degradation rate remained constant. A possible reason for this result is that at high initial CBZ concentration, more CBZ molecules are exposed to OH, resulting in a higher degradation rate, as explained by Ali et al. and Khan et al. [25,63].
From our experiment, CBZ is extremely stable in strong acid (pH = 2) and alkali (pH = 10) conditions. However, the photodegradation of CBZ proved to be pH-dependent, with higher degradation being observed in a low pH range of 2–6 (Figure 6). Since the pKa of CBZ is 13.9 [64,65], it would be neutral or bear a positive charge in acidic pH. Meanwhile, pH corresponding to the point of zero charge (pHpzc) is at 6 for UiO-66 and at 4 for GO, and thus the surface of the composite adsorbent will be positively charged at pH < 4 and negatively charge at pH > 6 [40,53,66]. Therefore, the adsorption of CBZ at pH < 4 might be disfavored by repulsive interactions between the positive charges of CBZ and UiO-66_GO-0.5. The highest equilibrium adsorption was obtained at pH = 4–6, at which the surface charge of UiO-66_GO-0.5 is almost neutral. Apparently, electrostatic interactions are not the main adsorption mechanism of CBZ. The adsorption of CBZ decreased when the pH was raised to 8–10. This might be related to the increased number of deprotonated Zr-O-groups on the metal clusters of UiO-66_GO-0.5, which might reduce the number of active sites for hydrogen bonding. Thus, due to higher equilibrium adsorption, the lower pH range ≤ 6 showed higher overall removal efficiency (R = 0.84, n = 6, p = 0.03).

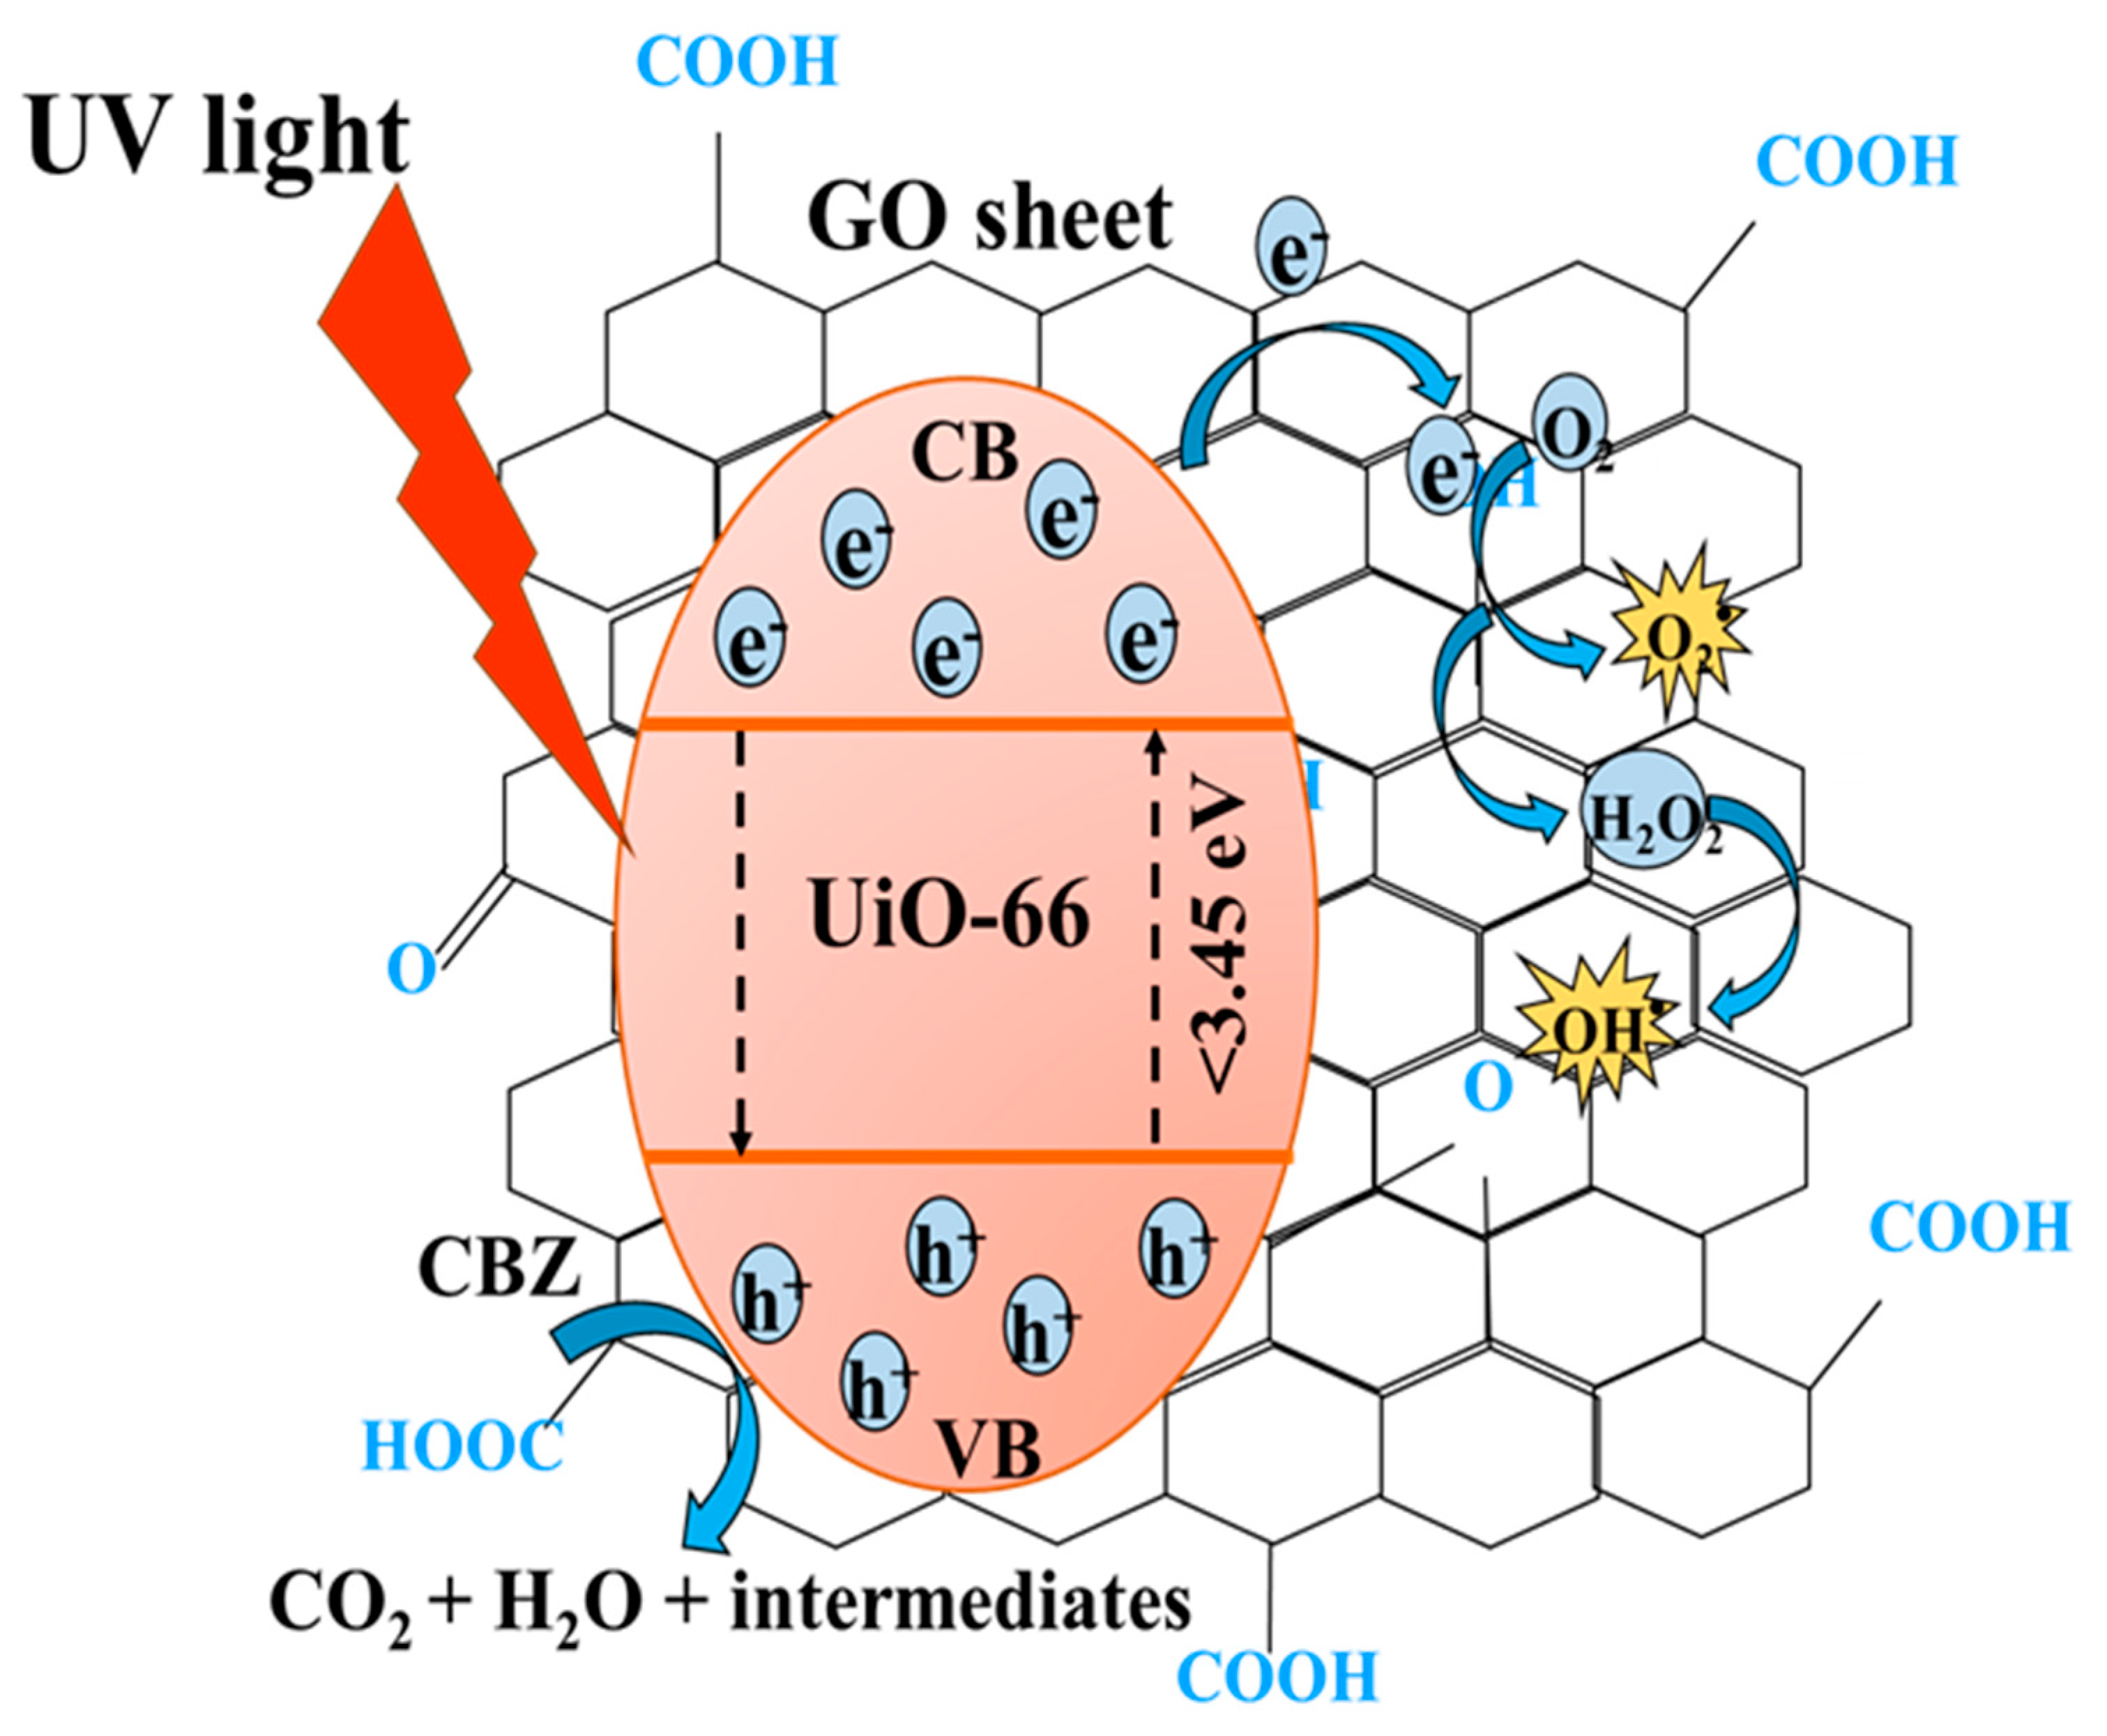
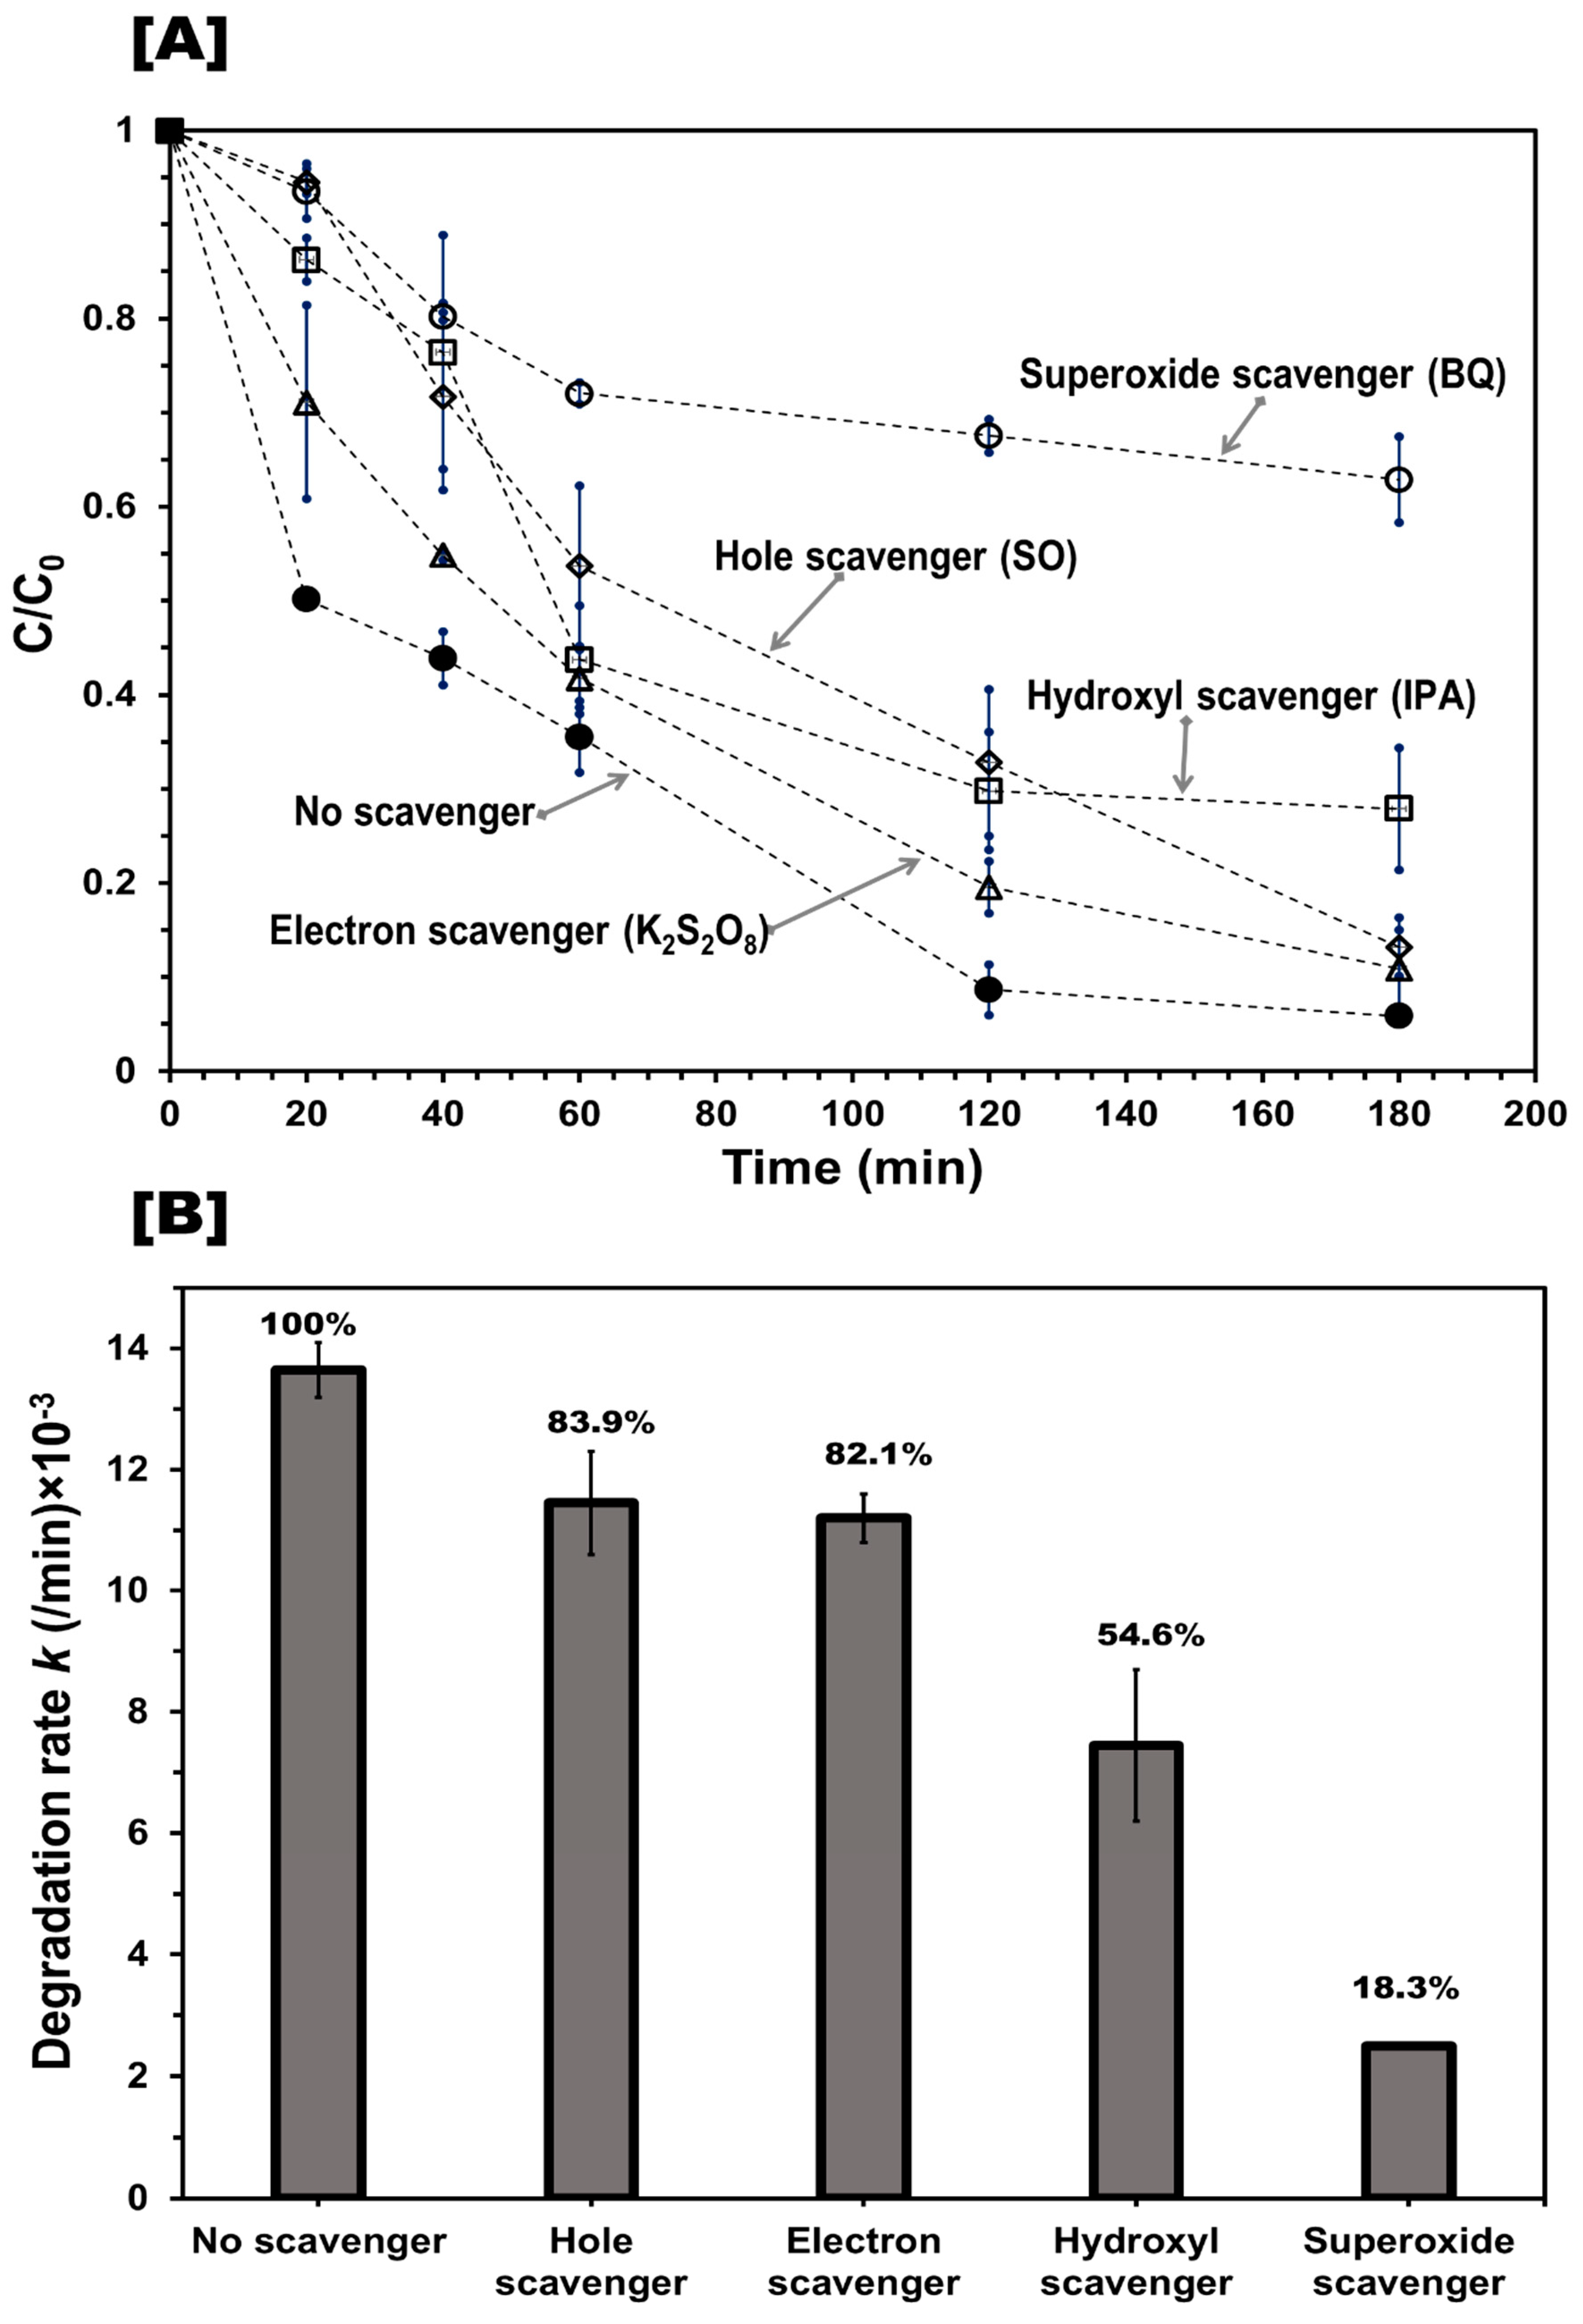
3.2.3. Identification of Reactive Species and Photodegradation Mechanism

To gain further understanding of the role of photogenerated radicals in the CBZ degradation mechanism, p-benzoquinone (BQ), sodium oxalate (SO), isopropanol (IPA), and potassium persulfate (K2S2O8) were used to quench superoxide radicals (O2●−), holes (h+), hydroxyl radicals (OH), and electrons (e), respectively [31,33]. The addition of BQ or IPA significantly inhibited the degradation of CBZ, whereas the addition of SO or K2S2O8 had no significant effects (Figure 7). These observations suggested that O2●− and OH are the main active species for CBZ photodegradation over the UiO-66_GO system, which is in line with previously reported UiO-66 composites [9,31].
The mechanism of CBZ photodegradation over UiO-66 enhanced by GO (UiO-66_GO) can be hypothesized to involve the following equations (Equations (3–5)) [9] and is outlined in Figure 8.
UiO-66_GO + hv → e + h+
e + O2 → O2●−
h+ + OH → OH
CBZ was most likely adsorbed on the benzene structure in UiO-66_GO nanoparticles. Under UV irradiation, the organic ligands (H2BDC) of the composite catalyst were excited and could then transfer a photoelectron to the inorganic Zr-O clusters. The photogenerated electron (e) in the conduction band of UiO-66 then quickly migrated to the GO support, greatly enhancing the carrier separation, resulting in improved photocatalytic activity. Subsequently, the photogenerated electron (e) reacted with dissolved oxygen in the reaction system to form first O2●− and then OH. The O2●− and OH radicals then degraded the CBZ molecule to CO2, H2O, and other intermediates during the photolysis. This hypothesized mechanism is in good agreement with previous literature [19,20,31].
The result of TOC analysis showed that the mineralization rate of CBZ after photodegradation was 25%. This mineralization rate indicated that CBZ was degraded into CO2 and H2O and other organic intermediate compounds about 75%. Thus, the chemical structure and toxicity of those intermediate products after CBZ photodegradation need to be further studied.

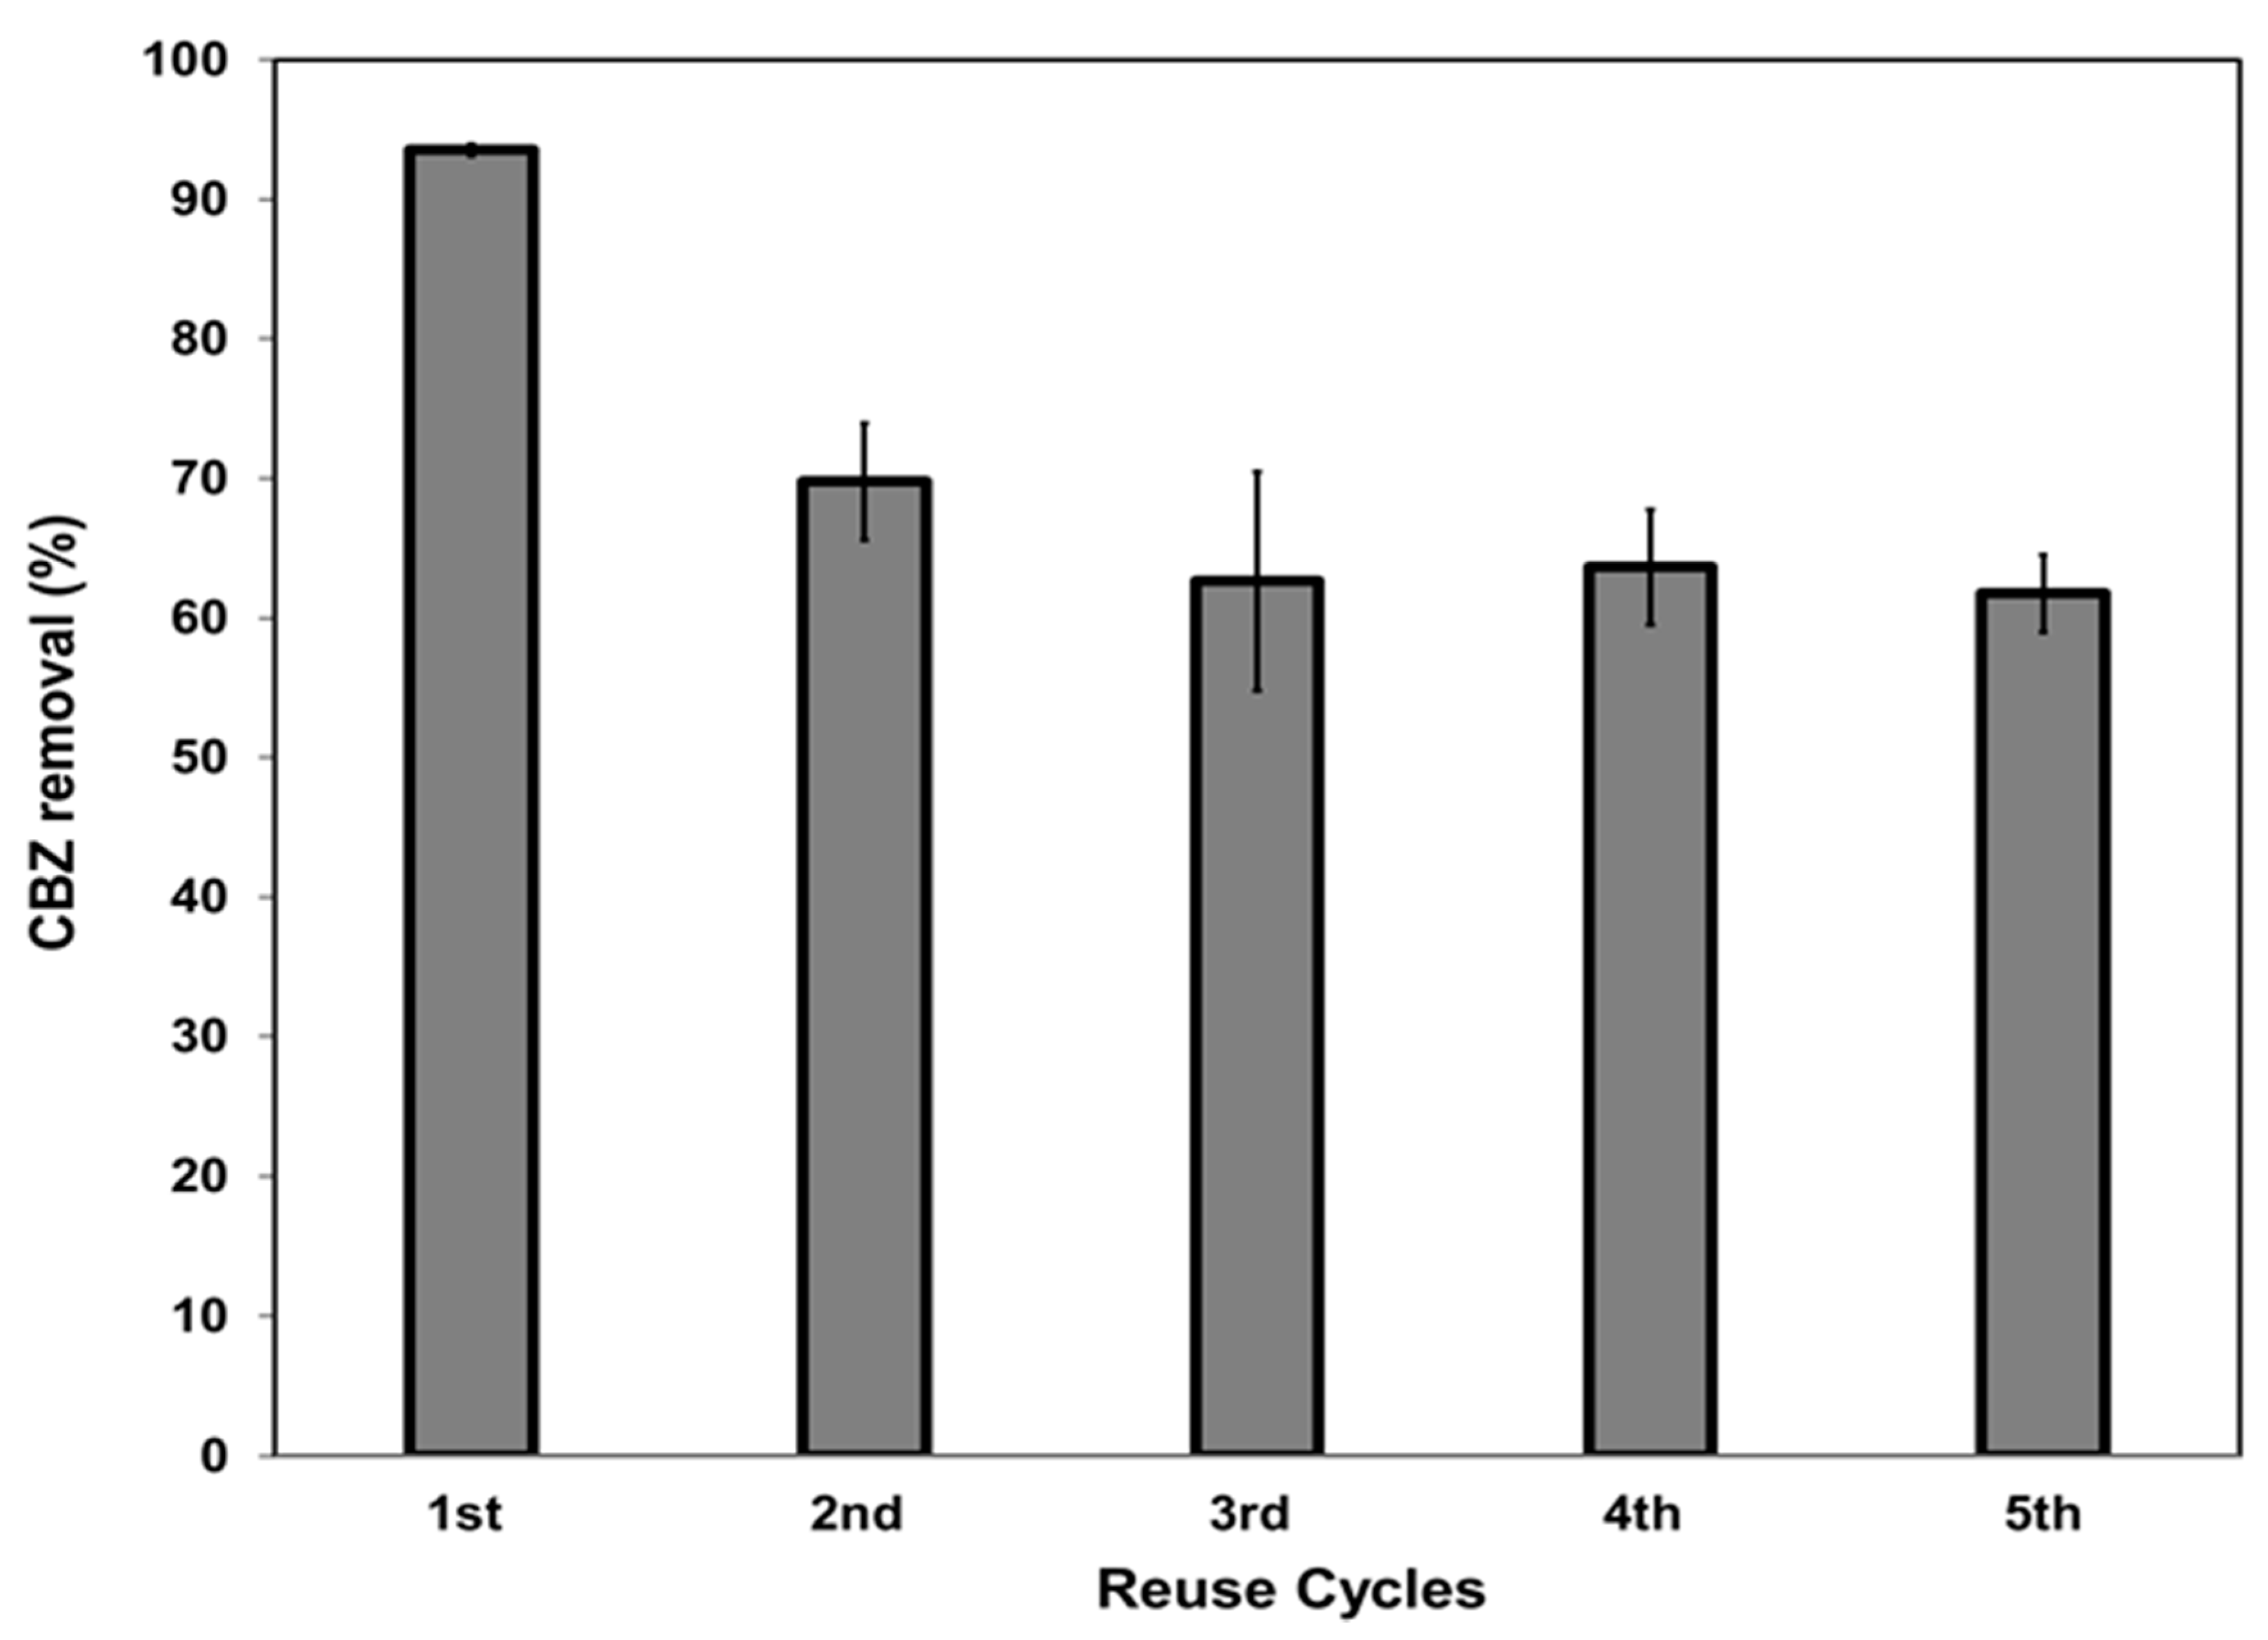
3.3. Recyclability of the Composites

After five consecutive runs, the photocatalytic activity of the UiO-66_GO-0.5 composite was still considerably high (>60%). It decreased by only 30% between the 1st and 3rd runs and maintained a similar level until the 5th run (Figure 9). The decline in CBZ degradation could be due to its accumulation and deposition of its photodegradation by-products on the UiO-66_GO-0.5 nanoparticles, as confirmed by FTIR (Figure S5). After five runs, no significant change in the structure of UiO-66_GO-0.5 was observed by XRD or SEM (Figures S6 and S7), indicating good stability and recyclability of UiO-66_GO-0.5 for practical applications. However, quantitative and qualitative measurements of CBZ accumulation and its by-products on catalyst surface are required in further study for better understanding the major factors on stability and recyclability of the composite catalyst.

4. Conclusions

UiO-66_GO composite catalysts were prepared by a simple solvothermal method and was applied for the photodegradation of the persistent pharmaceutical compound CBZ. The results showed the effective degradation efficiency in 2 h (≥90%) superior to those of its constituent materials: GO (<67%) and UiO-66 (<76%). This enhancement by GO in the photocatalytic activity of UiO-66 is most likely attributable to the increased SSA and porosity and the narrowed band gap. In addition, the photocatalytic activity of UiO-66_GO composites was shown to be significantly influenced by GO loading, catalyst dose, initial pollutant concentration, and solution pH. The main reactive species responsible for the photodegradation of CBZ were identified as O2●− and OH radicals. Furthermore, the composite showed good recyclability, maintaining a high CBZ degradation efficiency of more than 60% for five cycles.
Overall, this work confirmed that the modification of semiconductors with GO as electron acceptor is an effective technique for improving photocatalytic activity. It also gives us great inspiration for the development of other GO-based composite photocatalysts and the application of UiO-66 in water or wastewater treatment technologies. Moreover, since this composite material can absorb light in the visible light region (400–700 nm), it could possibly be applied as a solar-base catalyst. To the best of our knowledge, this is the first application of UiO-66_GO for photocatalysis, showing the optimum experimental conditions. Practical conditions, such as actual concentrations of target OMPs, and water matrix might also affect UiO-66_GO catalysts, which need to be investigated in further research.

Supplementary Materials

The following are available online at https://www.mdpi.com/2504-477X/4/2/54/s1, Table S1: Summary of UiO-66_GO applications, Figure S1: synthesis method of UiO-66_GO composite, Figure S2: SEM images of GO, UiO-66 and composites, Figure S3: Pore size, pore volume distribution and N2 adsorption of GO, UiO-66 and composites, Figure S4: Pore size and pore volume distribution of GO, UiO-66 and composites, Figure S5: FTIR spectra of fresh and after 5th run of UiO-66_GO-0.5, Figure S6: XRD patterns of fresh and after 5th run of UiO-66_GO-0.5, Figure S7: SEM images of fresh and after 5th run of UiO-66_GO-0.5.

Author Contributions

Conceptualization, R.H., M.A., C.Y., P.P. and D.A.; methodology, R.H., M.A., C.Y., P.P., and D.A.; validation, R.H., M.A. and C.Y.; formal analysis, R.H. and C.Y.; investigation, R.H.; resources, C.Y.; data curation, R.H.; writing—original draft preparation, R.H.; writing—review and editing, R.H., M.A., C.Y., P.P. and D.A; visualization, R.H. and M.A.; supervision, M.A. and C.Y.; funding acquisition, C.Y. All authors have read and agreed to the published version of the manuscript.

Funding

This research was funded by Japan Society for the Promotion of Science (JSPS KAKENHI), grant number 18H01566.

Acknowledgments

We would like to thank Ookayama Material Analysis Division of Tokyo Institute of Technology, Japan for XRD, SEM and TEM analysis, and Faculty of Science Energy and Environment of King Mongkut’s University of Technology North Bangkok, Thailand for N2 adsorption–desorption measurement. Also, the first author would like to acknowledge financial support from the ASEAN University Network/Southeast Asia Engineering Education Development Network (AUN/SEED-Net) program of Japan International Cooperation Agency (JICA) to complete her PhD degree.

Conflicts of Interest

The authors declare no conflict of interest.

References

  1. Uyguner-Demirel, C.S.; Birben, N.C.; Bekbolet, M. Elucidation of background organic matter matrix effect on photocatalytic treatment of contaminants using TiO2: A review. Catal. Today 2017, 284, 202–214. [Google Scholar] [CrossRef]
  2. Dong, S.; Feng, J.; Fan, M.; Pi, Y.; Hu, L.; Han, X.; Liu, M.; Sun, J.; Sun, J. Recent developments in heterogeneous photocatalytic water treatment using visible light-responsive photocatalysts: A review. RSC Adv. 2015, 5, 14610–14630. [Google Scholar] [CrossRef]
  3. Ateia, M.; Alalm, M.G.; Awfa, D.; Johnson, M.S.; Yoshimura, C. Modeling the degradation and disinfection of water pollutants by photocatalysts and composites: A critical review. Sci. Tot. Env. 2020, 698, 134197. [Google Scholar] [CrossRef] [PubMed]
  4. Shimizu, Y.; Ateia, M.; Wang, M.; Awfa, D.; Yoshimura, C. Disinfection mechanism of E. coli by CNT-TiO2 composites: Photocatalytic inactivation vs. physical separation. Chemosphere 2019, 235, 1041–1049. [Google Scholar] [CrossRef] [PubMed]
  5. Sahu, S.P.; Qanbarzadeh, M.; Ateia, M.; Torkzadeh, H.; Maroli, A.S.; Cates, E.L. Rapid degradation and mineralization of perfluorooctanoic acid by a new petitjeanite Bi3O (OH)(PO4) 2 microparticle ultraviolet photocatalyst. Env. Sci. Tech. Lett. 2018, 5, 533–538. [Google Scholar] [CrossRef]
  6. Wen, M.; Mori, K.; Kuwahara, Y.; An, T.; Yamashita, H. Design and architecture of metal organic frameworks for visible light enhanced hydrogen production. Appl. Catal. B Environ. 2017, 218, 555–569. [Google Scholar] [CrossRef]
  7. Wang, S.; Wang, X. Multifunctional metal–organic frameworks for photocatalysis. Small 2015, 3097–3112. [Google Scholar] [CrossRef]
  8. Sharma, V.K.; Feng, M. Water depollution using metal–organic frameworks-catalyzed advanced oxidation processes: A review. J. Hazard. Mater. 2019, 372, 3–16. [Google Scholar] [CrossRef]
  9. Wang, A.; Zhou, Y.; Wang, Z.; Chen, M.; Sun, L.; Liu, X. Titanium incorporated with UiO-66(Zr)-type Metal–Organic Framework (MOF) for photocatalytic application. RSC Adv. 2016, 6, 3671–3679. [Google Scholar] [CrossRef]
  10. Jin, Z.; Yang, H. Exploration of Zr–metal–organic framework as efficient photocatalyst for hydrogen production. Nanoscale Res. Lett. 2017, 12. [Google Scholar] [CrossRef]
  11. Denny, M.S.; Cohen, S.M. In situ modification of metal–organic frameworks in mixed-matrix membranes. Angew. Chem. Int. Ed. 2015, 54, 9029–9032. [Google Scholar] [CrossRef] [PubMed]
  12. Deria, P.; Mondloch, J.E.; Karagiaridi, O.; Bury, W.; Hupp, J.T.; Farha, O.K. Beyond post-synthesis modification: Evolution of metal–organic frameworks via building block replacement. Chem. Soc. Rev. 2014, 43, 5896–5912. [Google Scholar] [CrossRef] [PubMed] [Green Version]
  13. Kim, M.; Cahill, J.F.; Su, Y.; Prather, K.A.; Cohen, S.M. Postsynthetic ligand exchange as a route to functionalization of “inert” metal–organic frameworks. Chem. Sci. 2012, 3, 126–130. [Google Scholar] [CrossRef]
  14. Kalidindi, S.B.; Nayak, S.; Briggs, M.E.; Jansat, S.; Katsoulidis, A.P.; Miller, G.J.; Warren, J.E.; Antypov, D.; Corà, F.; Slater, B.; et al. Chemical and structural stability of zirconium-based metal–organic frameworks with large three-dimensional pores by linker engineering. Angew. Chem. Int. Ed. 2015, 54, 221–226. [Google Scholar] [CrossRef] [Green Version]
  15. Cavka, J.H.; Olsbye, U.; Guillou, N.; Bordiga, S.; Lillerud, K.P. A New Zirconium Inorganic Building Brick Forming Metal Organic Frameworks with Exceptional Stability—Supporting Information. J. Am. Chem. Soc. 2008, 6, 1–19. [Google Scholar] [CrossRef]
  16. Musho, T.; Li, J.; Wu, N. Band gap modulation of functionalized metal–organic frameworks. Phys. Chem. Chem. Phys. 2014, 16, 23646–23653. [Google Scholar] [CrossRef]
  17. Akpinar, I.; Yazaydin, A.O. Adsorption of atrazine from water in metal–organic framework materials. J. Chem. Eng. Data 2018, 63, 2368–2375. [Google Scholar] [CrossRef]
  18. Lin, R.; Shen, L.; Ren, Z.; Wu, W.; Tan, Y.; Fu, H.; Zhang, J.; Wu, L. Enhanced photocatalytic hydrogen production activity via dual modification of MOF and reduced graphene oxide on CdS. Chem. Commun. 2014, 50, 8533–8535. [Google Scholar] [CrossRef]
  19. Xu, J.; He, S.; Zhang, H.; Huang, J.; Lin, H.; Wang, X.; Long, J. Layered metal–organic framework/graphene nanoarchitectures for organic photosynthesis under visible light. J. Mater. Chem. A 2015, 3, 24261–24271. [Google Scholar] [CrossRef]
  20. Yang, Z.; Xu, X.; Liang, X.; Lei, C.; Gao, L.; Hao, R.; Lu, D.; Lei, Z. Fabrication of Ce doped UiO-66/graphene nanocomposites with enhanced visible light driven photoactivity for reduction of nitroaromatic compounds. Appl. Surf. Sci. 2017, 420, 276–285. [Google Scholar] [CrossRef]
  21. Suriyanon, N.; Punyapalakul, P.; Ngamcharussrivichai, C. Mechanistic study of diclofenac and carbamazepine adsorption on functionalized silica-based porous materials. Chem. Eng. J. 2013, 214, 208–218. [Google Scholar] [CrossRef]
  22. Atkinson, D.E.; Brice-Bennett, S.; D’Souza, S.W. Antiepileptic medication during pregnancy: Does fetal genotype affect outcome? Pediatr. Res. 2007, 62, 120. [Google Scholar] [CrossRef] [PubMed]
  23. Awfa, D.; Ateia, M.; Fujii, M.; Yoshimura, C. Novel Magnetic Carbon Nanotube-TiO2 Composites for Solar Light Photocatalytic Degradation of Pharmaceuticals in the Presence of Natural Organic Matter. J. Wat. Proc. Eng. 2019, 31, 100836. [Google Scholar] [CrossRef]
  24. Painter, M.M.; Buerkley, M.A.; Julius, M.L.; Vajda, A.M.; Norris, D.O.; Barber, L.B.; Furlong, E.T.; Schultz, M.M.; Schoenfuss, H.L. Antidepressants at environmentally relevant concentrations affect predator avoidance behavior of larval fathead minnows (Pimephales promelas). Environ. Toxicol. Chem. 2009, 28, 2677–2684. [Google Scholar] [CrossRef] [Green Version]
  25. Ali, F.; Ali, J.; Shah, N.S.; Sayed, M.; Khan, H.M. Carbamazepine degradation by UV and UV-assisted AOPs: Kinetics, mechanism and toxicity investigations. Process Saf. Environ. Prot. 2018, 117, 307–314. [Google Scholar] [CrossRef]
  26. Awfa, D.; Ateia, M.; Fujii, M.; Yoshimura, C. Photocatalytic degradation of organic micropollutants: Inhibition mechanisms by different fractions of natural organic matter. Wat. Res. 2020, 115643. [Google Scholar] [CrossRef]
  27. Hai, F.I.; Yang, S.; Id, M.B.A.; Id, V.S.; Shawkat, S.; Sanderson-smith, M.; Gorman, J.; Xu, Z.; Yamamoto, K. Carbamazepine as a possible anthropogenic marker in water: Occurrences, toxicological effects, treatment technologies. Water 2018, 10, 107. [Google Scholar] [CrossRef] [Green Version]
  28. Abdolhosseinzadeh, S.; Asgharzadeh, H.; Kim, H.S. Fast and fully-scalable synthesis of reduced graphene oxide. Nat. Publ. Gr. 2015, 5, 10160. [Google Scholar] [CrossRef] [Green Version]
  29. Ma, J.; Guo, X.; Ying, Y.; Liu, D.; Zhong, C. Composite ultrafiltration membrane tailored by MOF@GO with highly improved water purification performance. Chem. Eng. J. 2017, 313, 890–898. [Google Scholar] [CrossRef] [Green Version]
  30. Safarpour, M.; Vatanpour, V.; Khataee, A. Preparation and characterization of graphene oxide/TiO2 blended PES nanofiltration membrane with improved antifouling and separation performance. Desalination 2016, 393, 65–78. [Google Scholar] [CrossRef]
  31. Cao, J.; Yang, Z.; Xiong, W.; Zhou, Y.; Peng, Y.; Li, X. One-step synthesis of Co-doped UiO-66 nanoparticle with enhanced removal efficiency of tetracycline: Simultaneous adsorption and photocatalysis. Chem. Eng. J. 2018, 353, 126–137. [Google Scholar] [CrossRef]
  32. Shen, L.; Liang, R.; Luo, M.; Jing, F.; Wu, L. Electronic effects of ligand substitution on metal–organic framework photocatalysts: The case study of UiO-66. Phys. Chem. Chem. Phys. 2015, 17, 117–121. [Google Scholar] [CrossRef] [PubMed]
  33. Yang, M.-Q.; Zhang, Y.; Zhang, N.; Tang, Z.-R.; Xu, Y.-J. Visible-light-driven oxidation of primary C–H bonds over CdS with dual co-catalysts graphene and TiO2. Sci. Rep. 2013, 3, 3314. [Google Scholar] [CrossRef] [PubMed] [Green Version]
  34. Cai, D.; Song, M. Preparation of fully exfoliated graphite oxide nanoplatelets in organic solvents. J. Mater. Chem. 2007, 17, 3678–3680. [Google Scholar] [CrossRef]
  35. Cao, Y.; Zhao, Y.; Lv, Z.; Song, F.; Zhong, Q. Preparation and enhanced CO2 adsorption capacity of UiO-66/graphene oxide composites. J. Ind. Eng. Chem. 2015, 27, 102–107. [Google Scholar] [CrossRef]
  36. Guo, H.; Wang, X.; Qian, Q.; Wang, F.; Xia, X. A green approach to the synthesis of graphene nanosheets. ACS Nano 2009, 3, 2653–2659. [Google Scholar] [CrossRef]
  37. Yang, C.; You, X.; Cheng, J.; Zheng, H.; Chen, Y. A novel visible-light-driven In-based MOF/graphene oxide composite photocatalyst with enhanced photocatalytic activity toward the degradation of amoxicillin. Appl. Catal. B Environ. 2017, 200, 673–680. [Google Scholar] [CrossRef]
  38. Qiu, X.; Wang, X.; Li, Y. Controlled growth of dense and ordered metal–organic framework nanoparticles on graphene oxide. Chem. Commun. 2015, 51, 3874–3877. [Google Scholar] [CrossRef]
  39. Petit, C.; Bandosz, T.J. MOF-graphite oxide nanocomposites: Surface characterization and evaluation as adsorbents of ammonia. J. Mater. Chem. 2009, 19, 6521–6528. [Google Scholar] [CrossRef]
  40. Chen, C.; Chen, D.; Xie, S.; Quan, H.; Luo, X.; Guo, L. Adsorption behaviors of organic micropollutants on zirconium metal−organic framework UiO-66: Analysis of surface interactions. ACS Appl. Mater. Interfaces 2017, 9, 41043–41054. [Google Scholar] [CrossRef]
  41. Ding, J.; Yang, Z.; He, C.; Tong, X.; Li, Y.; Niu, X.; Zhang, H. UiO-66(Zr) coupled with Bi2MoO6 as photocatalyst for visible-light promoted dye degradation. J. Colloid Interface Sci. 2017, 497, 126–133. [Google Scholar] [CrossRef] [PubMed]
  42. Shafiei-alavijeh, M.; Alivand, M.S.; Rashidi, A.; Samimi, A. Thermally stable UIO-66 nano-adsorbent with high gasoline vapor recovery. In Proceedings of the 7th International Congress on Nanoscience & Nanotechnology (ICNN2018), Tehran, Iran, 26–28 September 2018. [Google Scholar]
  43. Smith, S.J.D.; Ladewig, B.P.; Hill, A.J.; Lau, C.H.; Hill, M.R. Post-synthetic Ti exchanged UiO-66 metal−organic frameworks that deliver exceptional gas permeability in mixed matrix membranes. Sci. Rep. 2015, 5, 15–18. [Google Scholar] [CrossRef]
  44. Bradder, P.; Ling, S.K.; Wang, S.; Liu, S. Dye adsorption on layered graphite oxide. J. Chem. Eng. Data 2011, 56, 138–141. [Google Scholar] [CrossRef]
  45. Liu, W.M.; Wang, X.Q.; Wang, C.M.; Chen, G.G.; Sun, W.L.; Zheng, C.T. Green and large-scale preparation of reduced graphene oxide for electroreduction of nitrobenzene to p-aminophenol. Micro Nano Lett. 2016, 11, 661–665. [Google Scholar] [CrossRef]
  46. Lonkar, S.P.; Dubois, J.R.P. One-pot microwave-assisted synthesis of graphene/layered double hydroxide (LDH) nanohybrids. Nano-Micro Lett. 2015, 7, 332–340. [Google Scholar] [CrossRef] [PubMed] [Green Version]
  47. Pignatello, J.J. Characterization of aromatic compound sorptive interactions with black carbon (charcoal) assisted by graphite as a model. Environ. Sci. Technol. 2005, 39, 2033–2041. [Google Scholar] [CrossRef]
  48. Zhou, Y.; Apul, O.G.; Karanfil, T. Adsorption of halogenated aliphatic contaminants by graphene nanomaterials. Water Res. 2015, 79, 57–67. [Google Scholar] [CrossRef] [Green Version]
  49. Peng, T.; Li, K.; Zeng, P.; Zhang, Q.; Zhang, X. Enhanced photocatalytic hydrogen production over graphene oxide−cadmium sulfide nanocomposite under visible light irradiation. J. Phys. Chem. C 2012, 116, 22720–22726. [Google Scholar] [CrossRef]
  50. Sun, D.; Liu, W.; Qiu, M.; Zhang, Y.; Li, Z. Introduction of a mediator for enhancing photocatalytic performance via post-synthetic metal exchange in metal−organic frameworks (MOFs). Chem. Commun. 2015, 66, 2056–2059. [Google Scholar] [CrossRef]
  51. Fan, W.; Lai, Q.; Zhang, Q.; Wang, Y. Nanocomposites of TiO2 and reduced graphene oxide as efficient photocatalysts for hydrogen evolution. J. Phys. Chem. C 2011, 115, 10694–10701. [Google Scholar] [CrossRef]
  52. Yu, J.; Jin, J.; Jaroniec, M. A noble metal-free reduced graphene oxide-cds nanorod composite for the enhanced visible-light photocatalytic reduction of CO2 to solar fuel. J. Mater. Chem. A 2014, 10, 3407–3416. [Google Scholar] [CrossRef]
  53. Cai, N.; Larese-casanova, P. Sorption of carbamazepine by commercial graphene oxides: A comparative study with granular activated carbon and multiwalled carbon nanotubes. J. Colloid Interface Sci. 2014, 426, 152–161. [Google Scholar] [CrossRef]
  54. Wang, C.; Li, H.; Liao, S.; Zheng, H.; Wang, Z.; Pan, B. Coadsorption, desorption hysteresis and sorption thermodynamics of sulfamethoxazole and carbamazepine on graphene oxide and graphite. Carbon N. Y. 2013, 65, 243–251. [Google Scholar] [CrossRef]
  55. Awfa, D.; Ateia, M.; Fujii, M.; Johnson, M.S. Photodegradation of pharmaceuticals and personal care products in water treatment using carbonaceous-TiO2 composites: A critical review of recent literature. Water Res. 2018, 142, 26–45. [Google Scholar] [CrossRef] [PubMed]
  56. Giri, R.R.; Ozaki, H.; Ota, S.; Takanami, R.; Taniguchi, S. Degradation of common pharmaceuticals and personal care products in mixed solutions by advanced oxidation techniques. 2010, 7, 251–260. Int. J. Environ. Sci. Technol. 2010, 7, 251–260. [Google Scholar] [CrossRef] [Green Version]
  57. Hu, A.; Zhang, X.; Oakes, K.D.; Peng, P.; Zhou, Y.N.; Servos, M.R. Hydrothermal growth of free standing TiO2 nanowire membranes for photocatalytic degradation of pharmaceuticals. J. Hazard. Mater. 2011, 189, 278–285. [Google Scholar] [CrossRef]
  58. Ramezanzadeh, M.; Asghari, M.; Ramezanzadeh, B. Fabrication of an e ffi cient system for Zn ions removal from industrial wastewater based on graphene oxide nanosheets decorated with highly crystalline polyaniline nano fibers (GO-PANI): Experimental and ab initio quantum mechanics approaches. Chem. Eng. J. 2018, 337, 385–397. [Google Scholar] [CrossRef]
  59. Almasri, D.A.; Rhad, T.; Atieh, M.A.; Mckay, G.; Ahzi, S. High performance hydroxyiron modified montmorillonite nanoclay adsorbent for arsenite removal. Chem. Eng. J. 2018, 335, 1–12. [Google Scholar] [CrossRef]
  60. Abdi, J.; Vossoughi, M.; Mohammad, N. Synthesis of metal−organic framework hybrid nanocomposites based on GO and CNT with high adsorption capacity for dye removal. Chem. Eng. J. 2017, 326, 1145–1158. [Google Scholar] [CrossRef]
  61. Alahiane, S.; Qourzal, S.; el Ouardi, M.; Abaamrane, A.; Assabbane, A. Factors influencing the photocatalytic degradation of reactive yellow 145 by TiO2-coated non-woven fibers. Am. J. Anal. Chem. 2014, 5, 445–454. [Google Scholar] [CrossRef] [Green Version]
  62. Mamun, K.; Asw, R.; Fahmida, K. Parameters affecting the photocatalytic degradation of dyes using TiO2: A review. Appl. Water Sci. 2017, 7, 1569–1578. [Google Scholar] [CrossRef] [Green Version]
  63. Khan, J.A.; He, X.; Khan, H.M.; Shah, N.S.; Dionysiou, D.D. Oxidative degradation of atrazine in aqueous solution by UV/H2O2/Fe2+, UV/S2O82−/Fe2+ and UV/HSO5/Fe2+ processes: A comparative study. Chem. Eng. J. 2013, 218, 376–383. [Google Scholar] [CrossRef]
  64. Moztahida, M.; Jang, J.; Nawaz, M.; Lim, S.; Sung, D. Effect of rGO loading on Fe3O4: A visible light assisted catalyst material for carbamazepine degradation. Sci. Total Environ. 2019, 667, 741–750. [Google Scholar] [CrossRef]
  65. Oleszczuk, P.; Pan, B.; Xing, B. Adsorption and desorption of oxytetracycline and carbamazepine by multiwalled carbon nanotubes. Environ. Sci. Technol. 2009, 43, 9167–9173. [Google Scholar] [CrossRef]
  66. Castarlenas, S.; Téllez, C.; Coronas, J. Gas separation with mixed matrix membranes obtained from MOF UiO-66-graphite oxide hybrids. J. Memb. Sci. 2017, 526, 205–211. [Google Scholar] [CrossRef] [Green Version]
Figure 1. (A) XRD patterns and (B) FTIR spectra of graphite, GO, UiO-66, and UiO-66_GO composites.
Jcs 04 00054 g001
Figure 2. TEM images of (A) GO, (B) UiO-66, and (C) composite (UiO-66_GO-5) and EDS spectra of (D) GO, (E) UiO-66, and (F) composite (UiO-66_GO-5).
Jcs 04 00054 g002
Figure 3. (A) Adsorption and photodegradation of CBZ, (B) adsorption capacity and photocatalytic rate k with no photocatalyst, GO, UiO66, 0.5 wt%, 1 wt%, and 5 wt% GO-loaded UiO-66 composites (experimental conditions: initial CBZ concentration = 5 mg/L; pH = 7 ± 0.2; photocatalyst concentration = 1 g/L; solution volume V = 50 mL). Plots and error bars represent averages and standard deviations from triplicate experiments.
Jcs 04 00054 g003
Figure 4. (A) Adsorption and photodegradation and (B) equilibrium adsorption and photocatalytic rate k of different photocatalyst doses (experimental conditions: initial CBZ concentration = 5 mg/L; pH = 7 ± 0.2; concentration of UiO-66_G-0.5 = 0.5, 1, or 2 g/L; solution volume V = 50 mL). Plots and error bars represent averages and standard deviations from triplicate experiments.
Jcs 04 00054 g004
Figure 5. Effect of initial CBZ concentration on equilibrium adsorption q and degradation k rate (experimental conditions: pH 7 ± 0.2; concentration of UiO-66_GO-0.5 = 1 g/L; solution volume V = 50 mL). Plots and error bars represent the averages and standard deviations from duplicate experiments.
Jcs 04 00054 g005
Figure 6. (A) Photodegradation of CBZ at different solution pH and (B) effect of solution pH on equilibrium adsorption q and degradation rate k (experimental conditions: initial CBZ concentration = 5 mg/L; concentration of UiO-66_GO-0.5 = 1 g/L; solution volume V = 50 mL). Plots and error bars represent averages and standard deviations from duplicate experiments.
Jcs 04 00054 g006
Figure 7. Effects of the absence and presence of scavengers on (A) the photodegradation efficiency and (B) the degradation rate of CBZ over UiO-66_GO-0.5. (Experimental conditions: initial CBZ concentration = 5 mg/L; solution pH 7; concentration of UiO-66_GO-0.5 = 1 g/L; solution volume V = 50 mL). Plots and error bars represent averages and standard deviations from duplicate experiments.
Jcs 04 00054 g007
Figure 8. Schematic diagram of the proposed mechanism for the enhanced photocatalytic oxidation over the UiO-66_GO composite catalyst.
Jcs 04 00054 g008
Figure 9. Photocatalytic performance over five cycles (experimental condition: initial CBZ concentration = 5 mg/L; pH = 7; concentration of UiO-66_GO-0.5 = 1 g/L; solution volume V = 50 mL). Plot and error bars represent averages and standard deviations from triplicate experiments.
Jcs 04 00054 g009
Table 1. Surface area, pore size, pore volume, and indirect band gap of GO, UiO-66, and composites.
CatalystSSABET a
m2/g
Main Pore Size b
nm
PVtotalc
cm3/g
BJH Pore Volume Distribution dIndirect Band Gap e
eV
PVmicro(<2 nm)
cm3/g, [%]
PVmeso(2–50 nm)
cm3/g, [%]
PVmacro(> 50 nm)
cm3/g, [%]
GO56.410.940.5880.027 [4.63]0.004 [0.68]0.557 [94.69]N/A
UiO-66419.93.940.4480.177 [39.41]0.013 [2.99]0.258 [57.60]3.55
UiO-66_GO-0.11004.63.950.8790.577 [65.65]0.007 [0.83]0.295 [33.52]3.55
UiO-66_GO-0.5913.44.021.0520.526 [50.04]0.004 [0.36]0.522 [49.6]3.45
UiO-66_GO-17783.920.8110.385 [47.45]0.005 [0.56]0.522 [51.99]3.3
UiO-66_GO-5552.44.030.3980.226 [56.79]0.005 [1.33]0.167 [41.87]3.2
a Composites specific surface area calculated from N2 adsorption data using the Brunauer–Emmett–Teller (BET) method. b Pore diameter calculated from N2 adsorption data using the Barrett–Joyner–Halenda (BJH) method. c Total pore volume calculated from N2 adsorption data using the BJH method at P/P0 = 0.99. d Pore volume distribution classified according to the IUPAC definition and calculated by the BJH method. e Indirect bandgap calculated from UV/Vis absorption data by the Tauc plot method. N/A: not available.

