1. Introduction
The concept of bulk glass reinforcement has been introduced for structural systems as a material that can provide lower construction costs when compared against conventional construction materials [
1]. The cost advantage occurs due to glass’ large compressive strength (1000 MPa [
2]; >1100 MPa for fused quartz [
3]). When comparing glass directly against other materials, glass can appear more attractive, providing costs that are 20% that of equivalent strength concrete and 5% that of equivalent strength steel [
1]. However, designing structural elements around the particularities of glass has proven difficult, stemming from glass’ relatively low Young’s modulus, which is also an issue for pultruded glass fiber reinforced polymers [
4].
This paper is in distinction dissimilar to pultruded glass fiber reinforced polymers, such as the focus of studies in References [
5,
6,
7,
8]. Instead, the glass is presented as a lower-cost bulk cast glass. While pultruded glass fiber composites have their uses, the focus of this paper is instead on composites that can be economically designed when compared against standard construction materials.
This paper assumes that an acceptable bond can be held between the glass and polymers (specifically, high-density polyethylene adhering to soda-lime glass). This could be accomplished by a sizing agent; these chemicals, when applied to glass, allow resins to adhere to them [
9]. These are commonly utilized in the glass-fiber industry. This is required to allow the polymers to effectively contribute to the buckling resistance of glass by compositing the glass into a matrix with the polymer [
10]. Without such agents, the glass will buckle prematurely as the frictional resistance between glass and the supporting polymers will be very low. Special care must be taken when selecting a sizing agent, as it needs to be compatible with the selected polymer. One example would be Michem
® Emulsion 93135M, a sizing agent that is polyethylene compatible [
11].
One advantage that glass composites may have over competing materials is that the components necessary for glass composites are non-degradable. That is, they do not rot or corrode, unlike reinforced concrete (the reinforcing steel corrodes), steel, or structural timbers. This is similar to the advantages provided by glass fiber-reinforced polymers, which also are non-degradable [
12]. Additionally, by securing a cap over both ends of a glass composite, the composite can be completely encased in a polymer. This may provide a competitive edge for glass composites with regard to their use in structures.
The manufacturing process for the glass composite columns (GRCCs) is an extrusion process. More specifically, an over jacketing extrusion process (sometimes called coextrusion, such as in [
13], page 683) is considered; in this process, the reinforcing interior of the beam would be fed perpendicularly to the extrusion screw, allowing for the binder to form around the reinforcing core. These manufacturing methods are similar to pultrusion, the method sought by glass fiber-related research (e.g., [
5,
6,
7,
8]); these manufacturing methods tend to have reduced manufacturing costs [
12], leading to more economical designs.
Load and Resistance Factor Design (LRFD) strength reduction factors (
ϕ) throughout this paper are assumed to be 0.9. However, as concluded by Reference [
14], these
ϕ factors may need to be reduced in certain circumstances, as they would need to be for the similar pultruded glass fiber-reinforced polymers. Therefore, the strengths referenced in this paper are listed as the maximum strength of the section (
Pn).
This paper investigates the possibility of GRCCs providing a cost-competitive alternative to other construction materials.
Section 2 and
Section 3 investigate a 2 × 4 stud (nominally 2 inches by 4 inches lumber planed down to 1.5 inches by 3.5 inches, or nominally 51 mm by 102 mm planed down to 38 mm by 89 mm) replacement and
Section 4 and
Section 5 investigate the cost comparison between a series of hollow-structural-steel (HSS) section equivalents using GRCCs.
The targeted applications of GRCCs are the replacement of standard construction columns as well as applications where inert construction materials are preferred or required, such as chemical plants processing corrosive materials, power poles, and salt-water applications.
Composite 2 × 4 studs have been conceptualized and patented previously, such as in Reference [
15]. The composite studs characterized in this patent, however, did not seek to reduce costs but to increase the functionality of steel studs by compositing them with other materials. Through the finite element modeling (FEM) conducted as part of this paper, and using the cost assumptions presented, GRCCs is a cost competitive material when compared against both structural timbers and structural steel.
2. Analytical Design for 2 × 4 Douglas Fir Equivalent
To create a GRCC of similar buckling load as the buckling load of a 2 × 4 (38 mm × 89 mm) stud, it is necessary to clearly identify the buckling load and cost of the competing material. Due to the cyclical nature of the timber market, cost comparisons can be difficult. For the purposes of this paper, a price of USD 525 per MBF (thousand board feet), which is equivalent to USD 222.5/m
3, is assumed; this represents the price of kiln dried Douglas fir timber as of March 2020 [
16]. Therefore, the selected column length of 2440 mm (8 feet) results in a cost of USD 1.835 (USD) for a Douglas fir stud. This value is an intermediate price for timber; as Reference [
17] indicated, the recent high for Douglas fir was USD 690 in June 2018, which would be a price of USD 2.411 per stud.
As this section suggests, the goal is the analytical design of a 2 × 4 Douglas fir equivalent. For purposes of comparison, both weak and strong axis bending will be compared. Accordingly, the buckling loads of Douglas fir timber is summarized in
Table 1. This table compares the buckling loads of No. 3-1 and select structural lumber. Note that this table assumes a variety of Young’s moduli ranging from 510,000 (3.54 GPa) to 690,000 psi (4.79 GPa), which varies with the grade of the lumber. The source for these buckling load values is Reference [
18], which utilized the design requirements put forth by Reference [
19,
20].
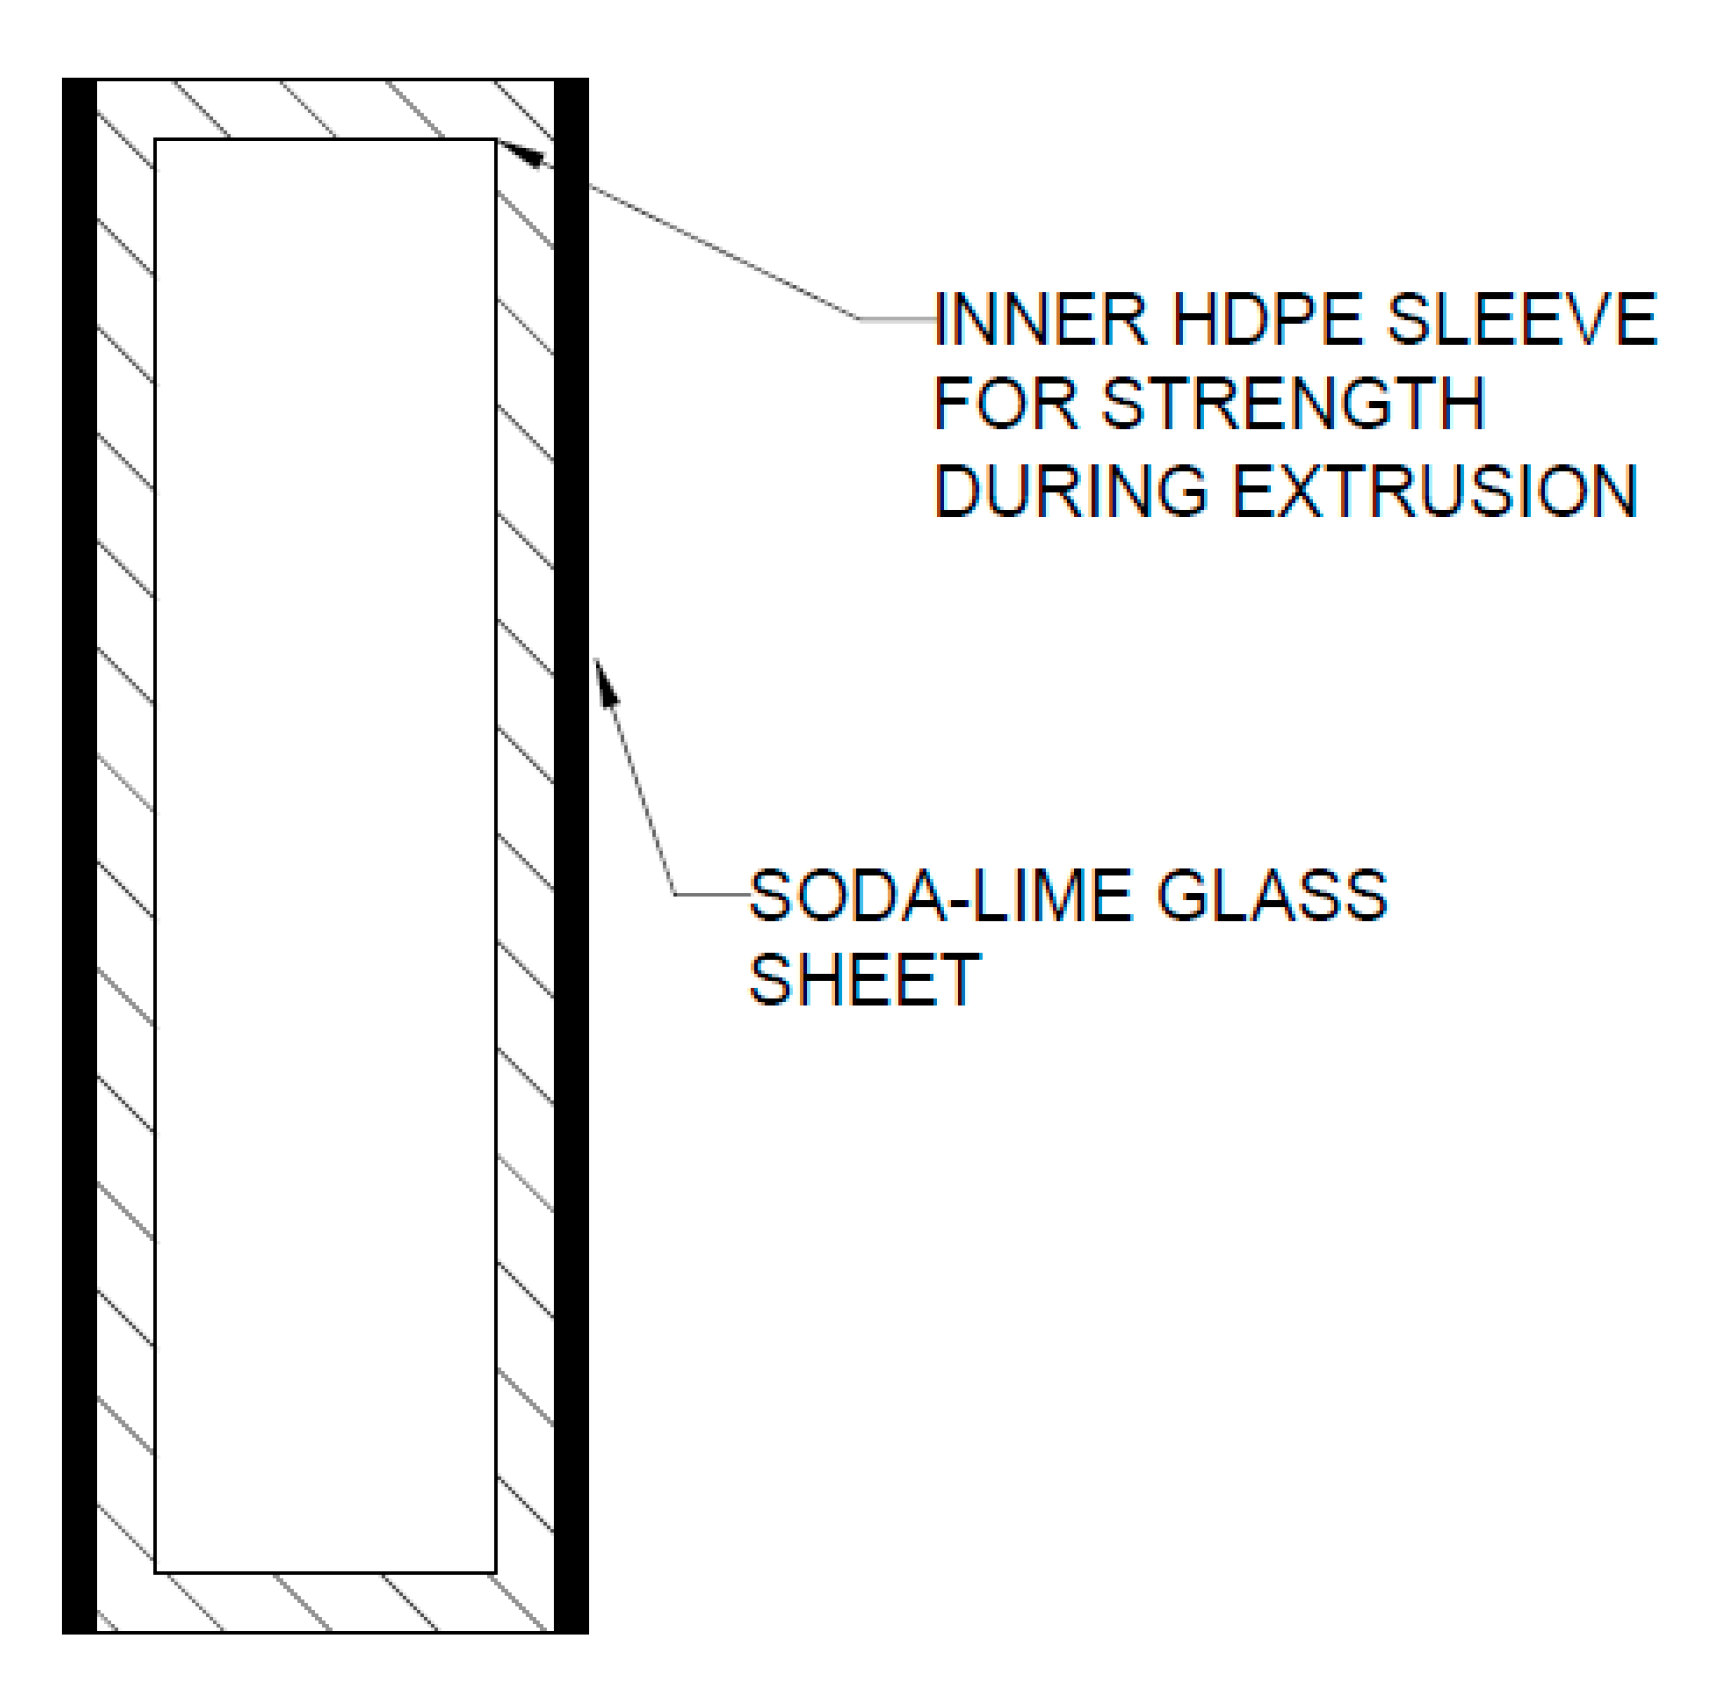
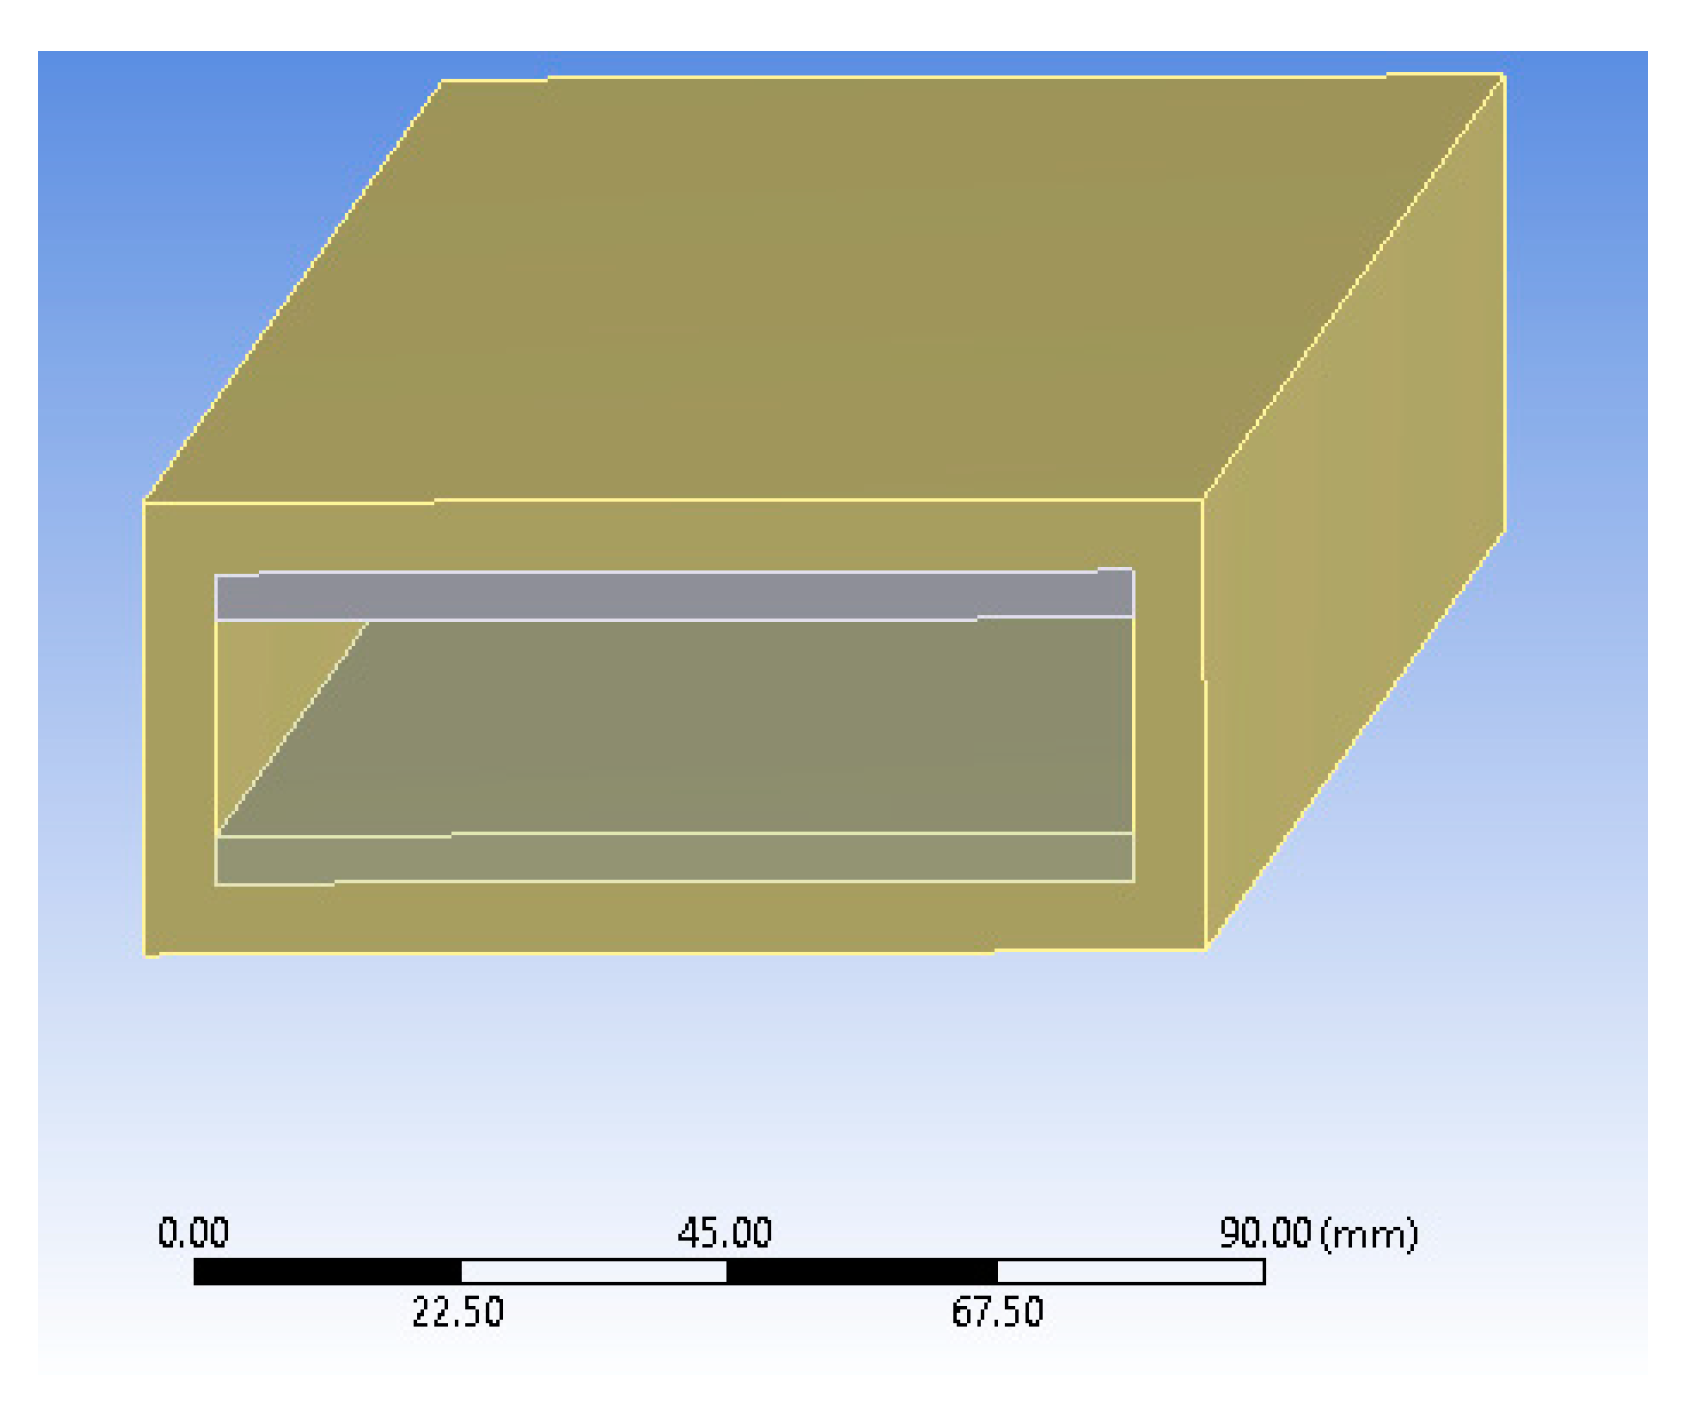
Now, considering the glass columns, it should first be mentioned how the GRCCs are assumed to be constructed. An example of the composite prior to over jacket extrusion is shown in
Figure 1. In this figure, two glass plates are supported by an inner sleeve, which is a simplistic extruded high-density polyethylene (HDPE) shape. This is necessary to prevent the glass plates from pressing together during the over jacket extrusion process.
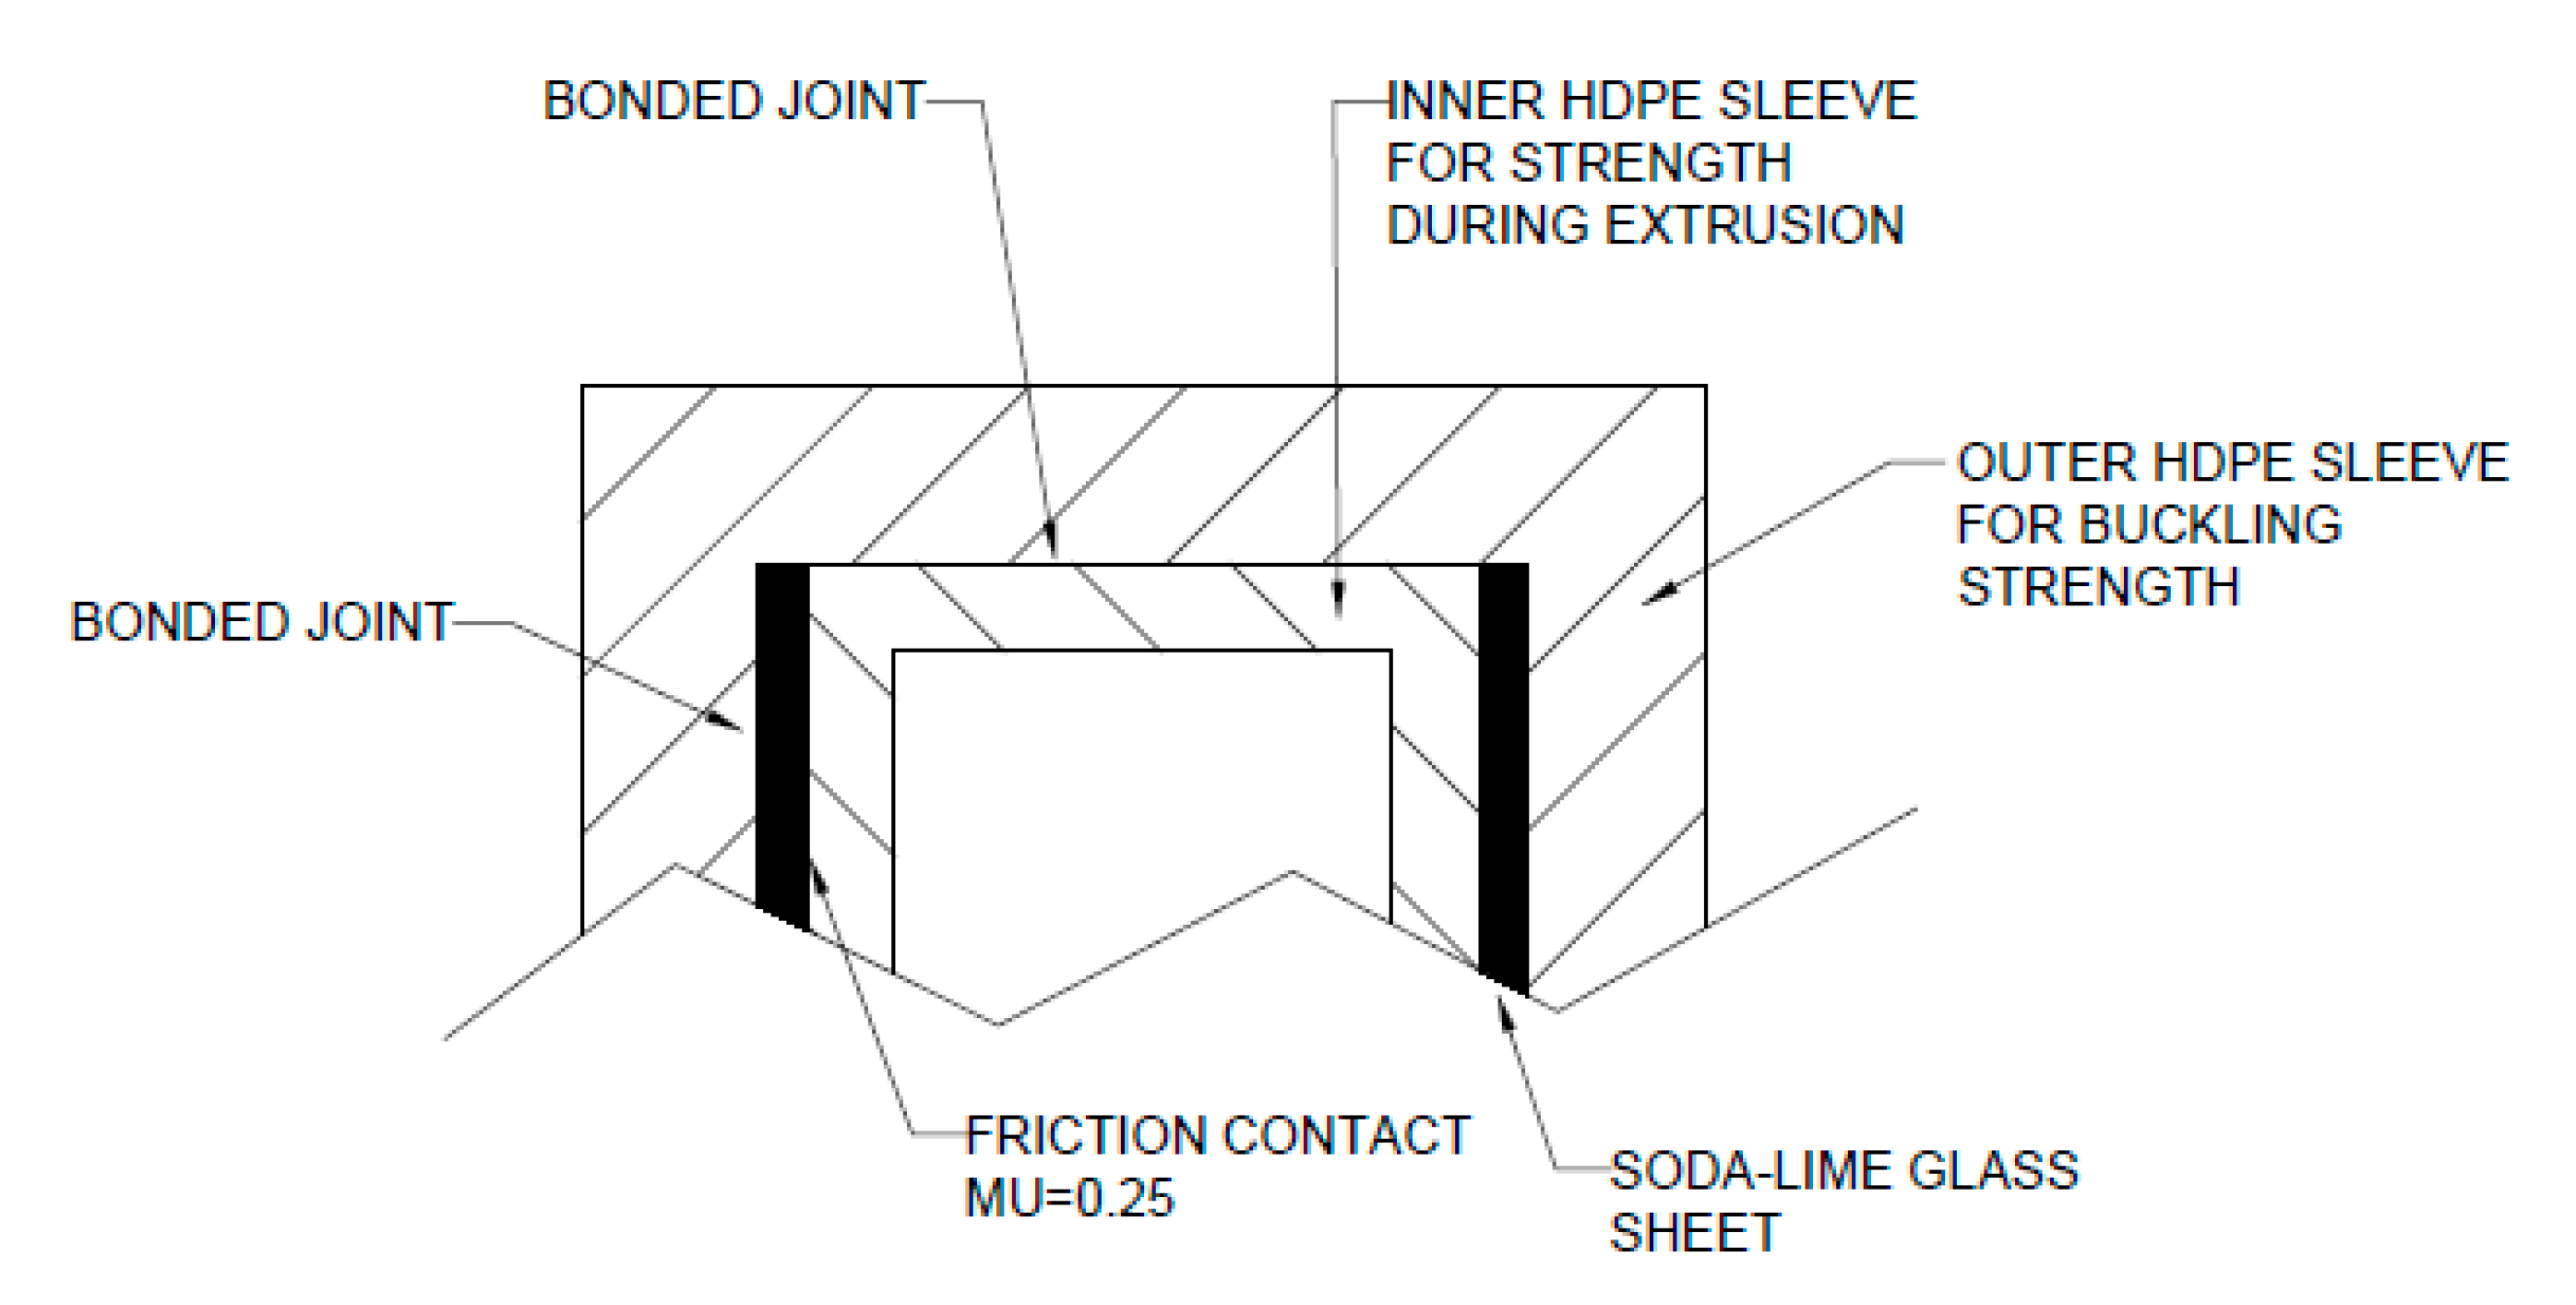
For buckling analysis, it is considered that the glass plates will not slide relative to the outside sleeve of HDPE. That is, the glass plates are assumed to be bonded to the exterior HDPE sleeve. To prove this condition, additional physical testing is necessary to be conducted. However, as
Section 7. Required Bond Strengths indicates, the bonding strength necessary can likely be met with a sizing agent. These sizing agents work to bond glass to polymers, of which there exists sizing agents specifically developed to allow HDPE to stick to soda-lime glass.
For an explanation on the specific contact conditions, see
Figure 2. The interior sleeve is considered to be unbonded to the glass plates for this analysis, and the coefficient of friction between this interior sleeve and glass plates is assumed sufficiently. The interior sleeve does serve two purposes; it provides support to the GRCC during the over jacket extrusion process, and it increases the material thickness that fasteners would be attached to.
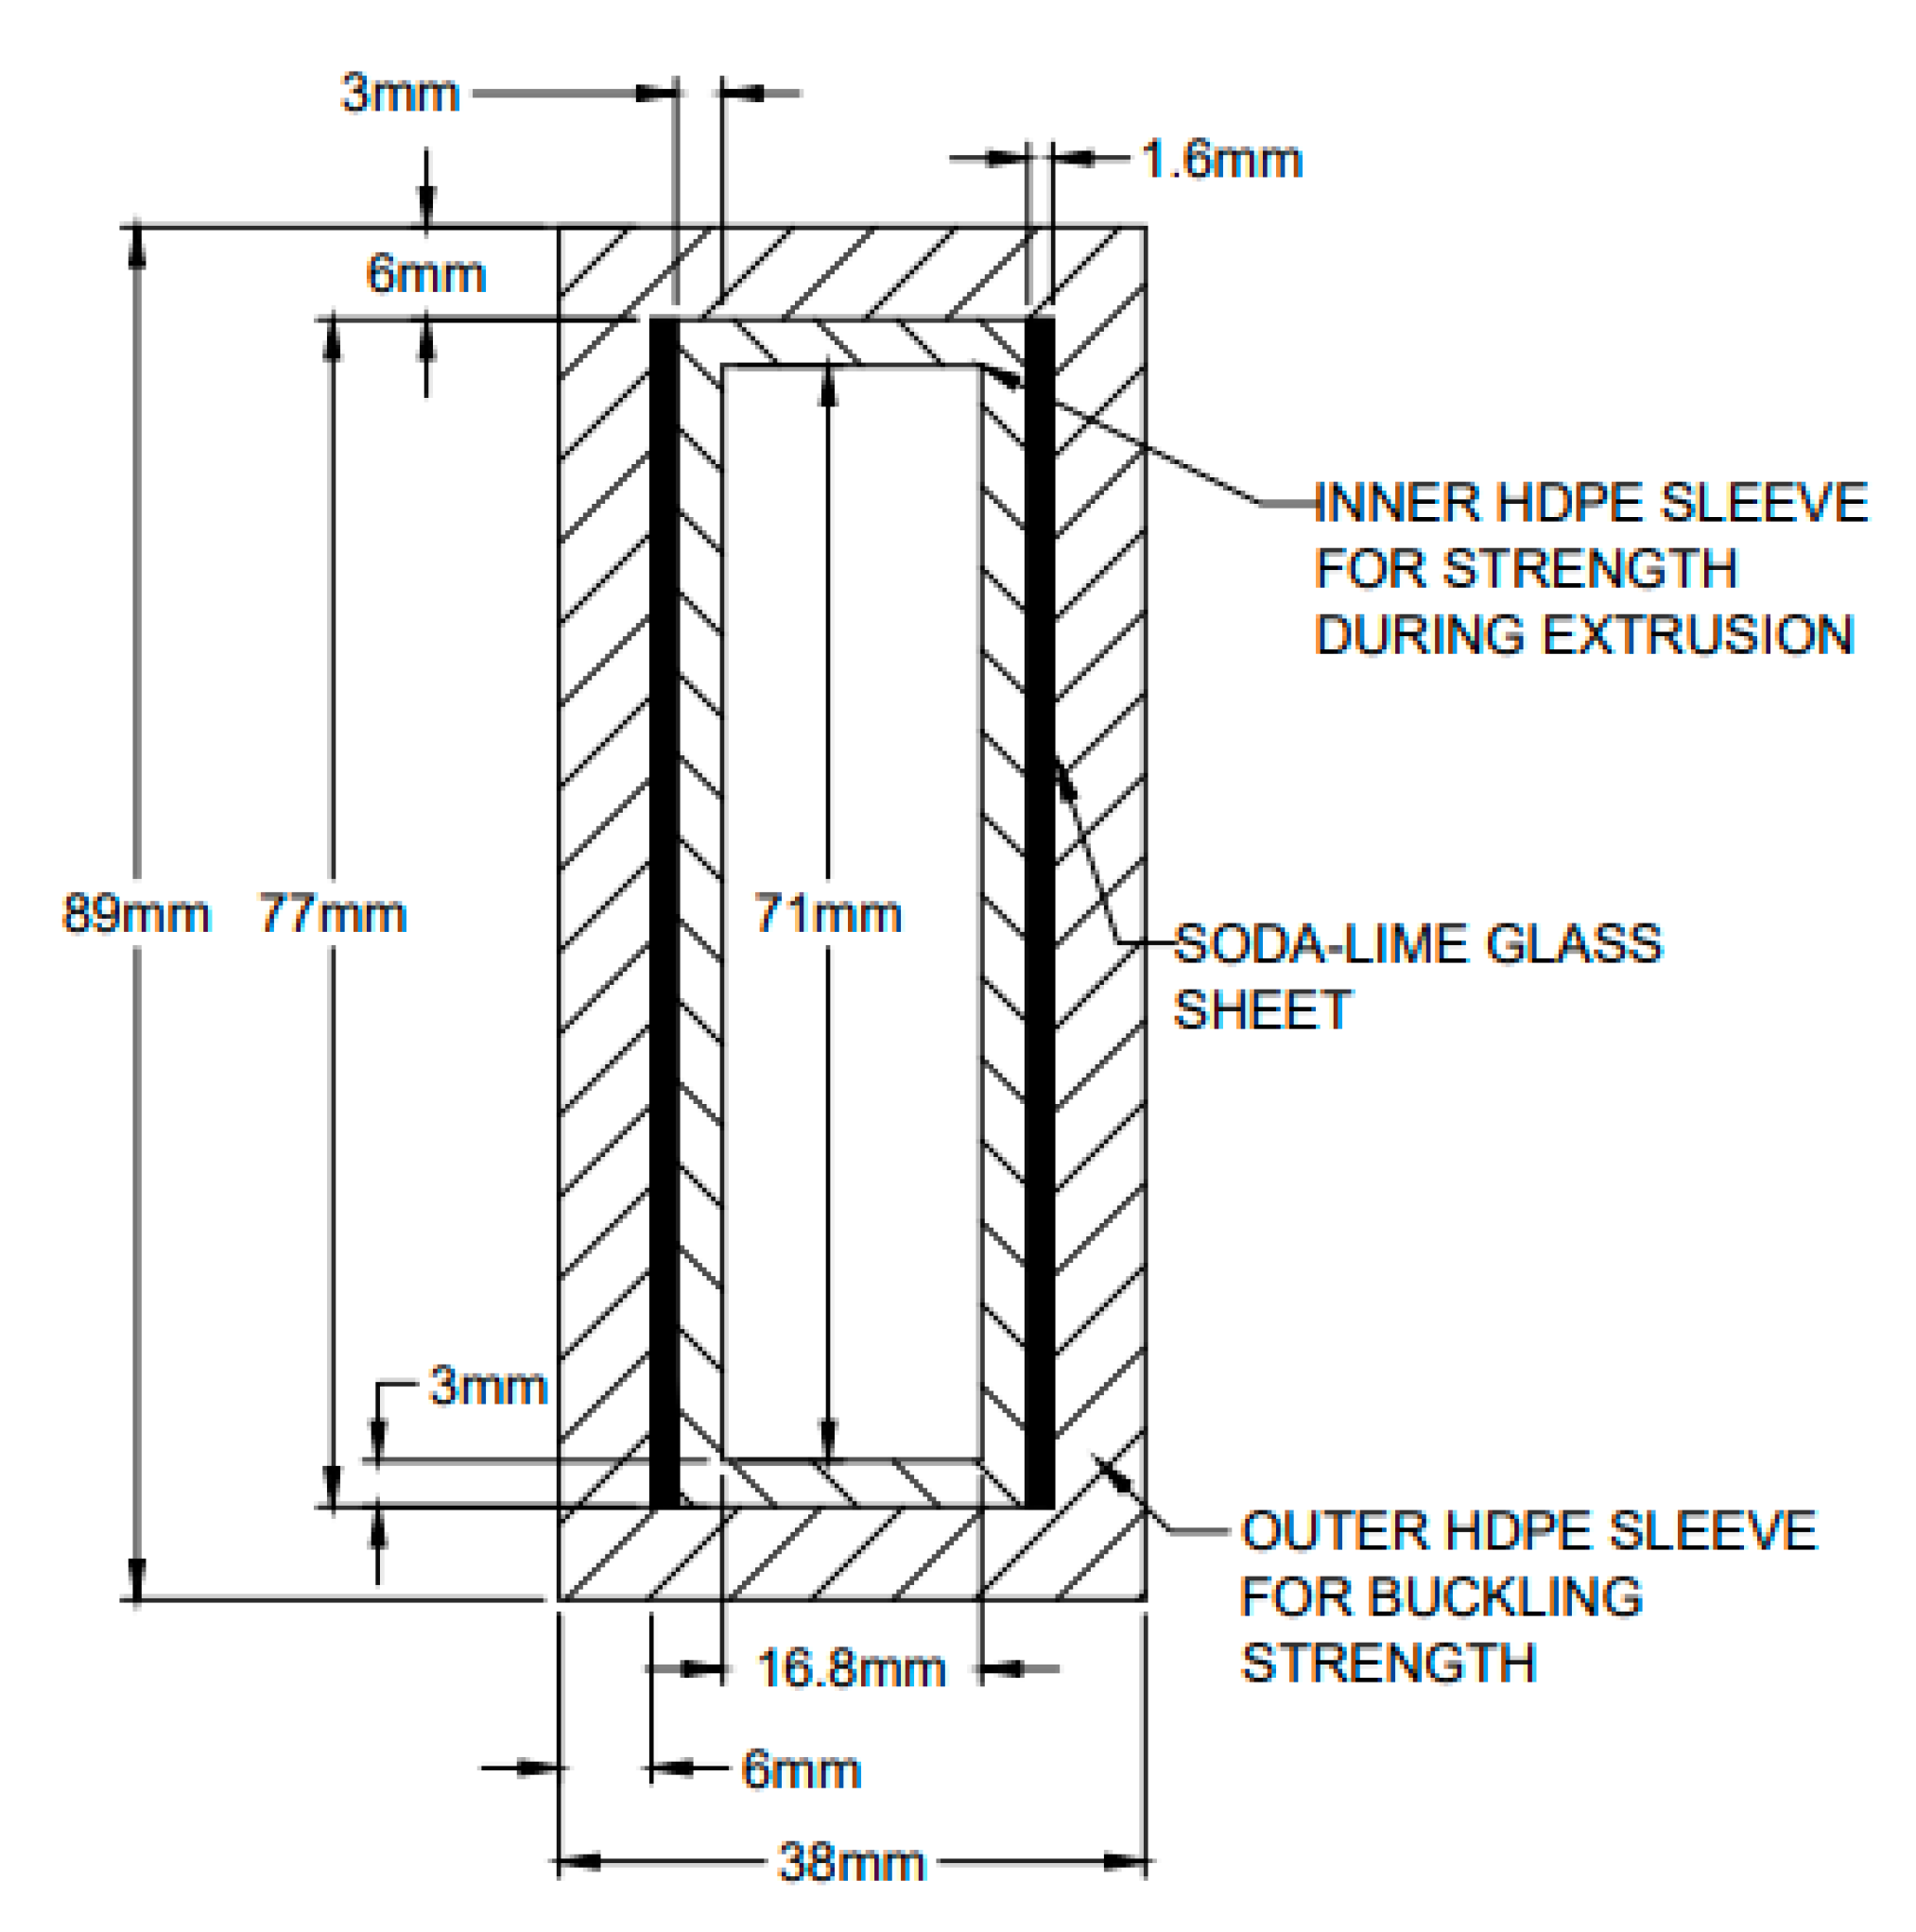
To limit the analytical analysis, a single arrangement for the GRCC will be considered. The considered dimensions are 6 mm for the exterior thickness, 3 mm for the interior thickness, and a glass sheet thickness of 1.6 mm (equivalent to 1/16 inches). This specific arrangement is shown in
Figure 3. Note that this design provides 9 mm thickness of HDPE for securing anchors to the GRCC 2 × 4 equivalent.
As the section behaves as a complete unit, the moments of inertia necessary to calculate the buckling load can be determined by simply considering the glass’ contributions. This is appropriate as the Young’s modulus of glass is 72 GPa [
21], while the Young’s modulus of HDPE is only 0.8 GPa [
22]; this means the HDPE contributes little to the buckling load of the column.
The resulting calculations are included in the
Appendix A, Equations (A1)–(A7). This results in a GRCC with a weak axis buckling load of 4768 N and a strong axis buckling load of 16,163 N.
As can be seen, if the glass is allowed to function as a column, and not to suffer from a local buckling condition, the glass deforms as a section, resulting in significant buckling load. In fact, the calculated buckling load of the GRCC for the analytical section is equivalent in buckling load to a No. 1 Douglas fir 2 × 4.
Now, the costs are estimated. Considering a soda-lime glass price of USD 0.17 per kg [
23], and an HDPE cost of USD 0.25 per kg [
24], the resulting estimated cost is USD 2.31. This estimated cost includes a factor of 40% of the cost for the manufacturing cost of the extrusion, as suggested by [
25]. As over jacket extrusion is assumed for manufacturing GRCCs, but is not explicitly detailed in [
25], the specific cost factoring may be inaccurate, but is considered as an approximation of the true cost of GRCCs. This is at a cost disadvantage to Douglas fir timber (
$1.835), costing 26% more. However, as the timber market is cyclical, prices for Douglas fir have climbed as high as
$2.411 (USD) per 8-foot 2 × 4. Due to GRCCs non-degradability, the premium pricing may provide marketability for GRCCs.
While this first analytical design is at a cost disadvantage, other designed GRCCs have costs approaching or below the price of timber, as is developed and described in the following section on finite element modeling (FEM) of GRCCs.
3. Finite Element Modeling for 2 × 4 Douglas Fir Equivalent
To extrapolate on the solution calculated previously, finite element modeling (FEM) is conducted. In particular, the program utilized is ANSYS 2019 R3, utilizing the Static Structural and Eigenvalue Buckling Analysis Systems. The specific reason that buckling is considered extensively is that the maximum glass stress encountered in all of the analyses is 123 MPa (which is derived from 73.9 MPa multiplied by a safety factor conversion of 1.67), a value that is 12.3% the maximum strength value for glass (glass has a strength of 1000 MPa in compression, [
2]). This means that the columns considered as part of this research are limited by the buckling strength and not the compressive strength of glass.
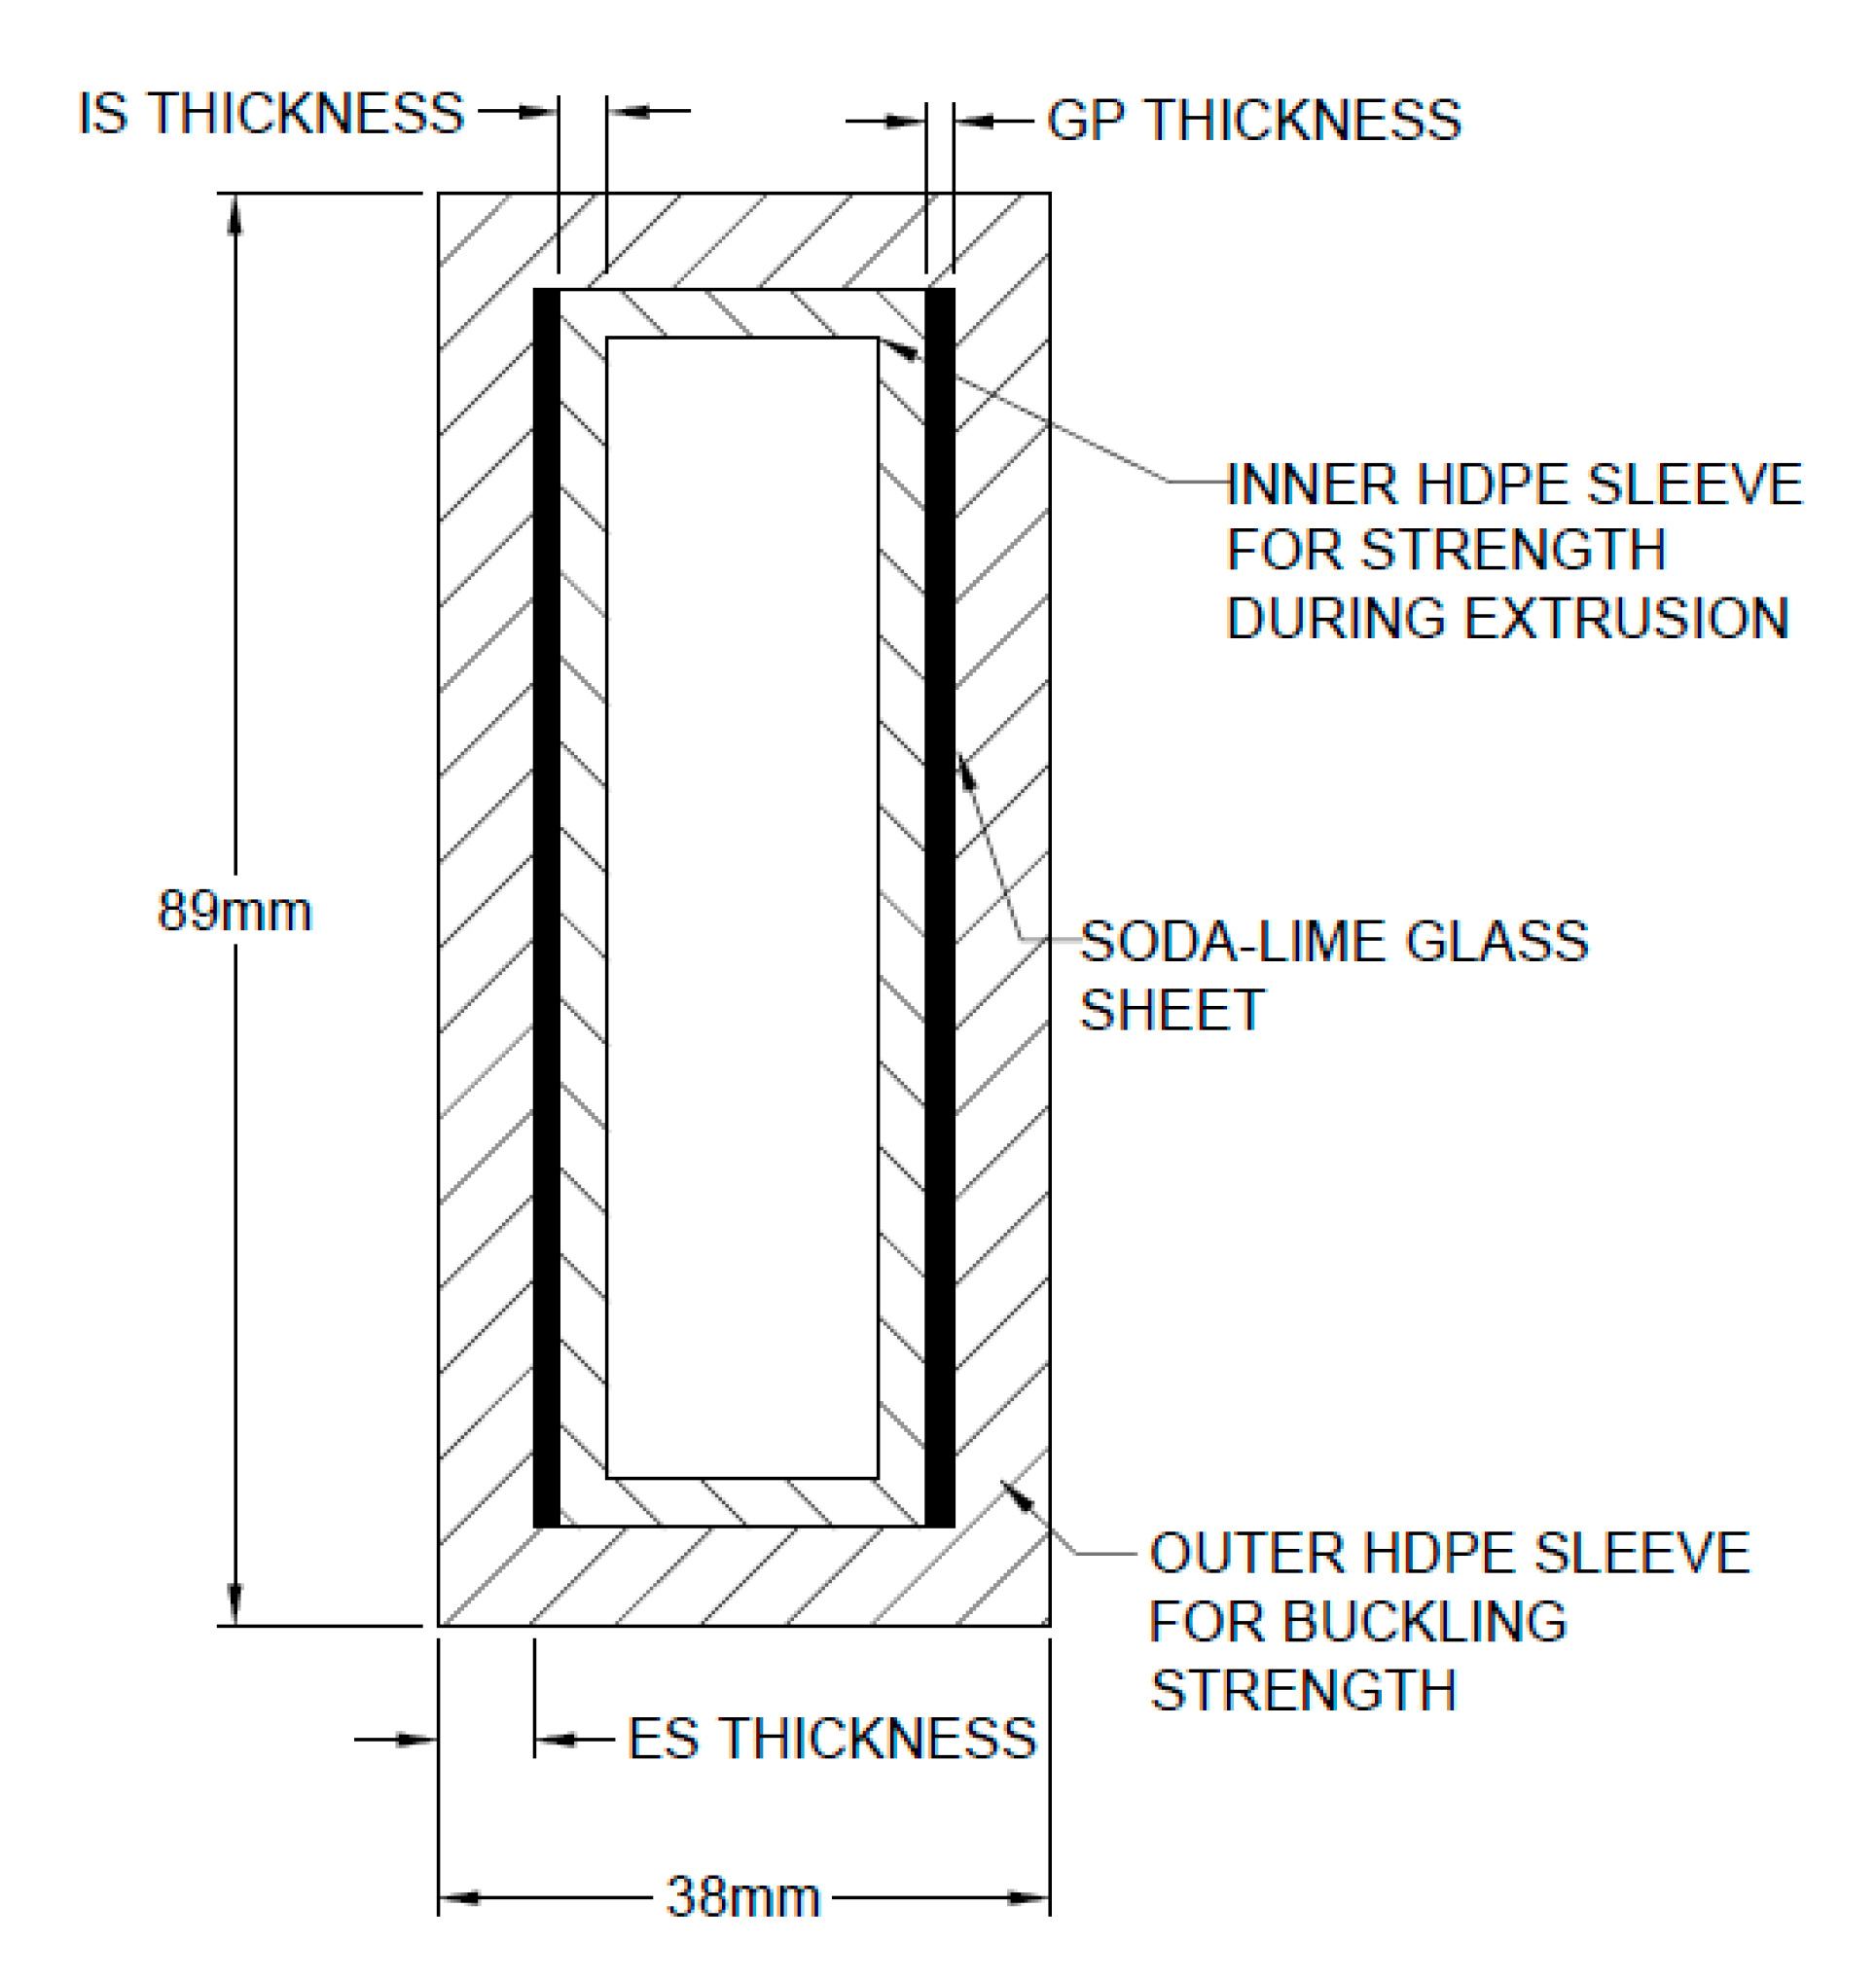
The general design for the 2 × 4 equivalent GRCCs is shown in
Figure 4. In this figure, the thickness of the exterior (denoted ES THICKNESS) and interior (denoted IS THICKNESS) HDPE sleeves will be modulated, and the glass thicknesses (denoted GP THICKNESS) will be varied in the design.
An example of the cross-section is shown in
Figure 5. One additional note is that the length of the analyzed members was reduced to ½ the selected length; this was done as the ANSYS analysis was performed as a fixed-free buckling condition; this means that the value of
kL (the effective buckling length of a column) between the two analyses (between the analytical analysis required to determine the buckling loads of the timber columns and the ANSYS FEM) was equivalent (that is,
kL = 1.0 × 2.44 m = 2.0 × 1.22 m = 2.44 m).
Next, the results of the iterative analysis are shown in
Table 2. In this table, the section designation is organized such that the two numbers represent the outside dimensions of the section (a standard 89 mm by 38 mm), the third number represents the exterior sleeve thickness (ES THICKNESS in
Figure 4), and the fourth number represents the glass plate thickness (GP THICKNESS in
Figure 4). A standard interior sleeve thickness of 3 mm was assumed.
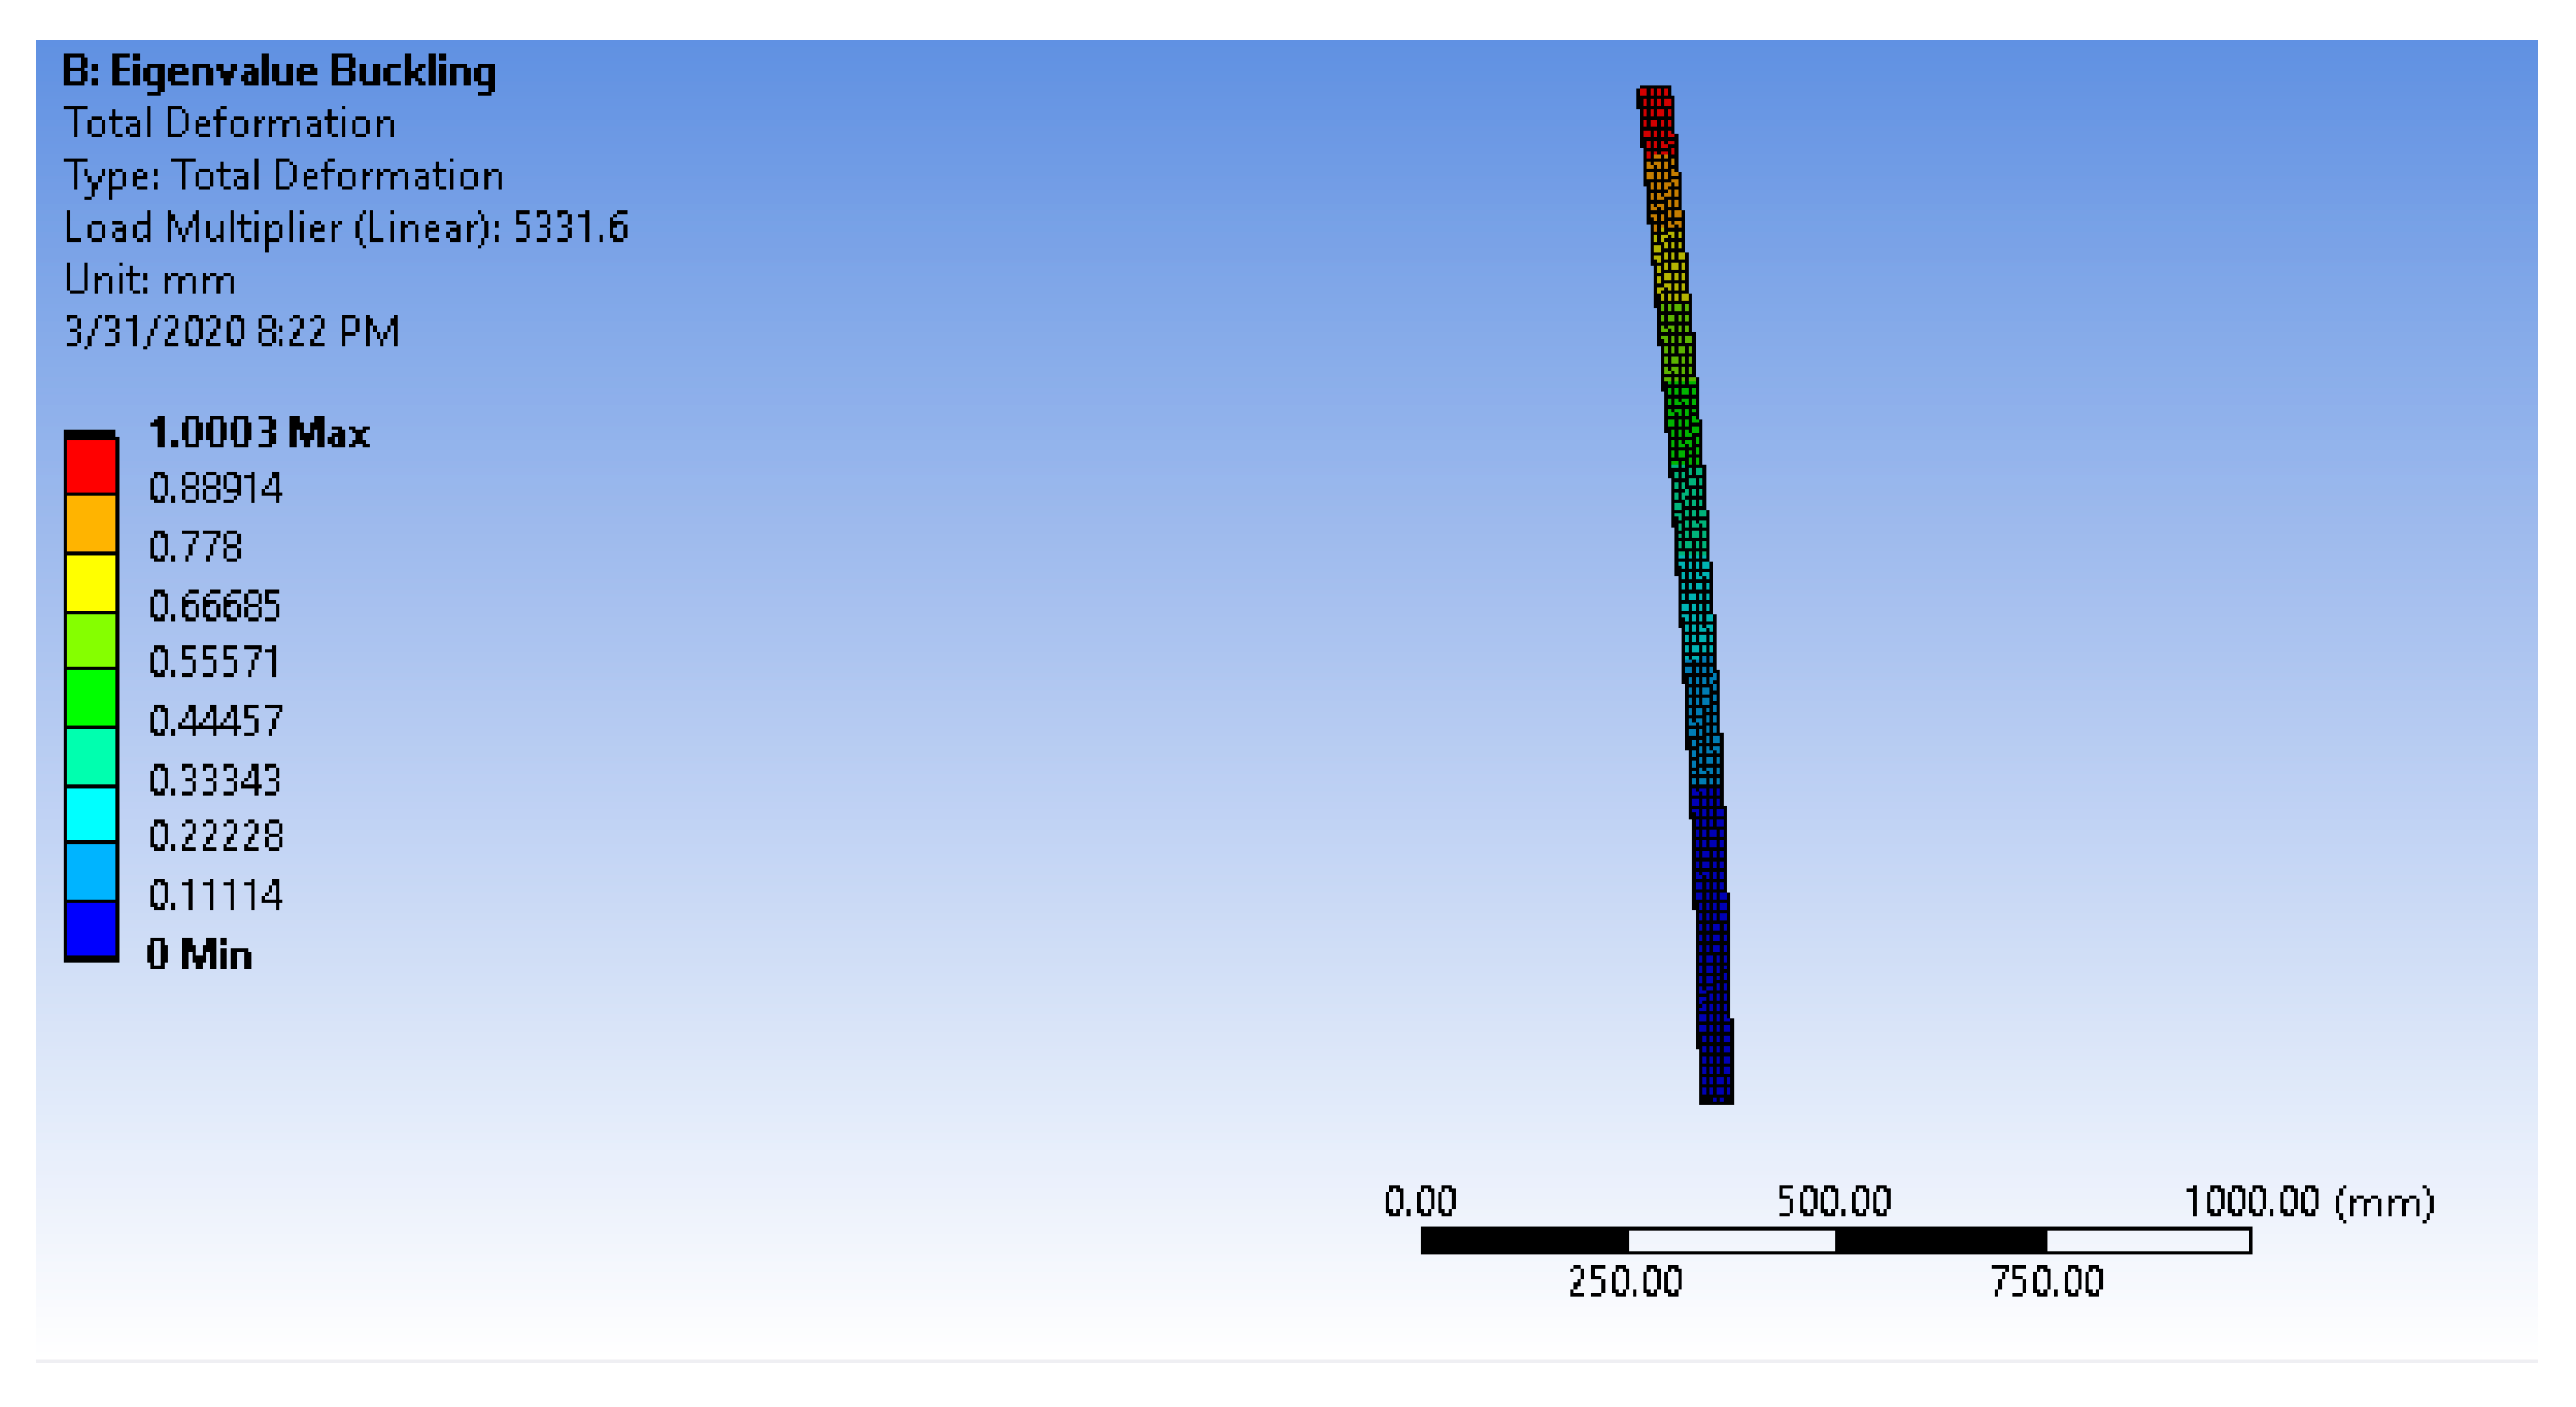
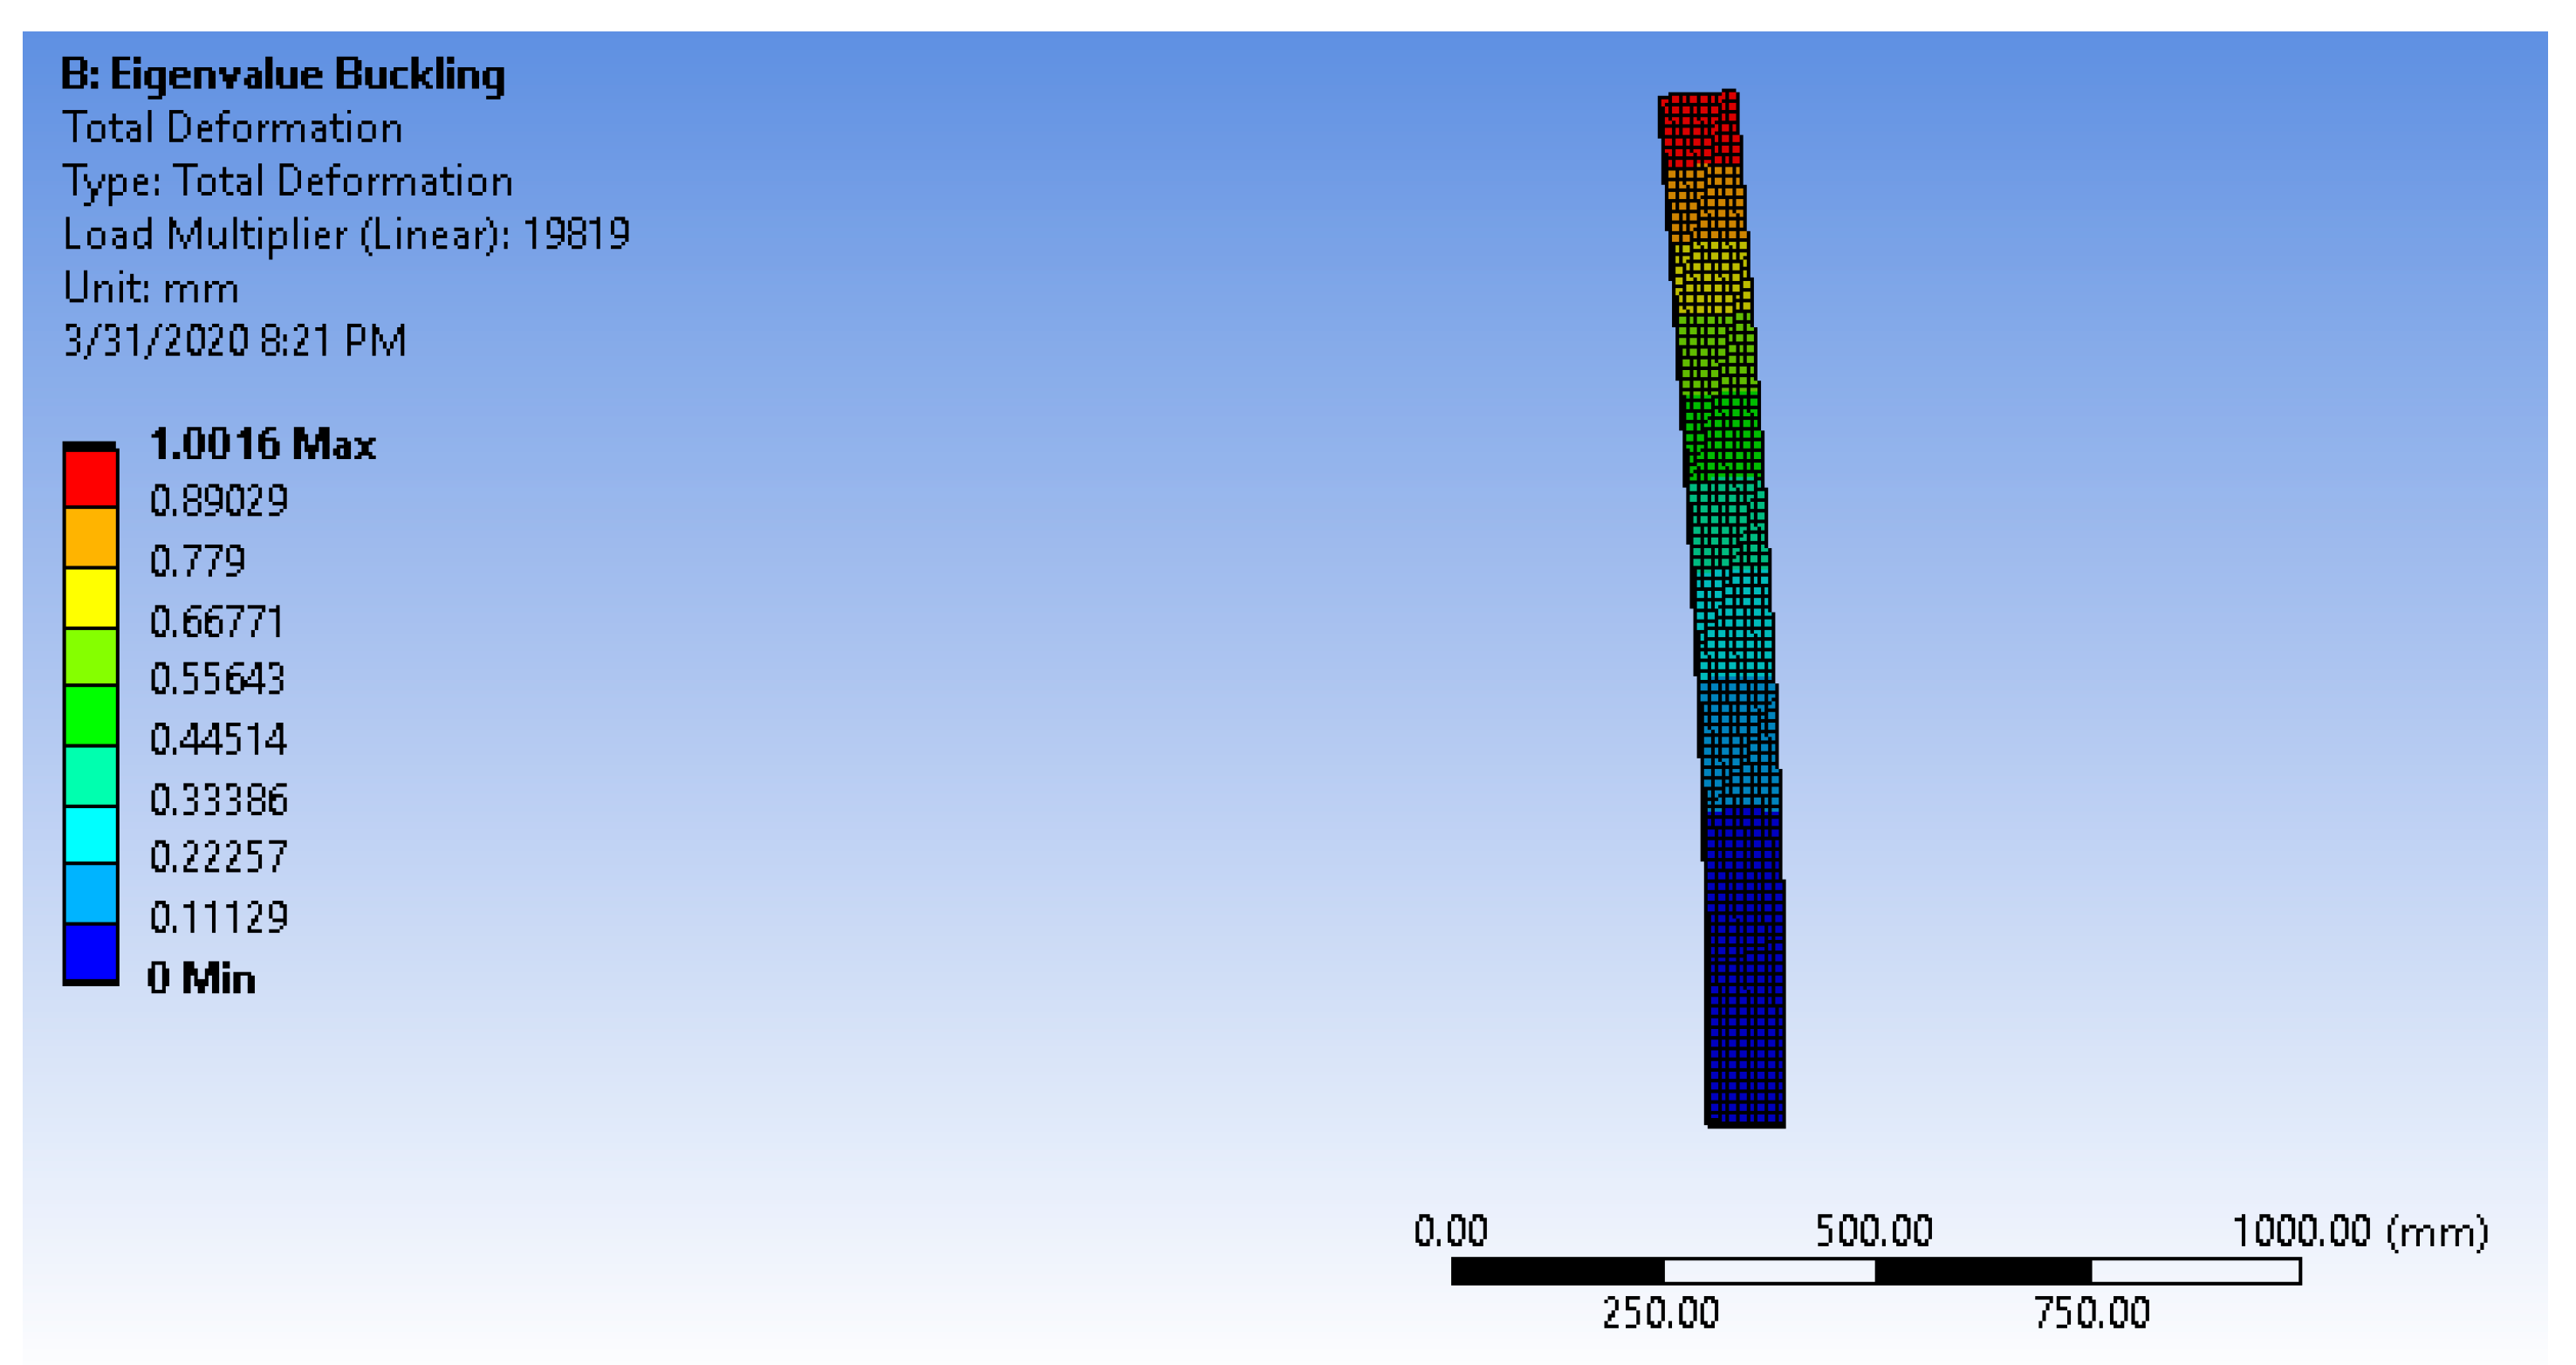
The resulting analysis found two modes of failure among all dimensions shown in
Table 2. The failure modes were gross deflection of the weak and strong axes. These can be seen in
Figure 6 and
Figure 7.
Note that the buckling modes were gross-buckling of the GRCCs. This is in distinction to local buckling failures, which were seen in the hollow-structural-steel GRCC replacements.
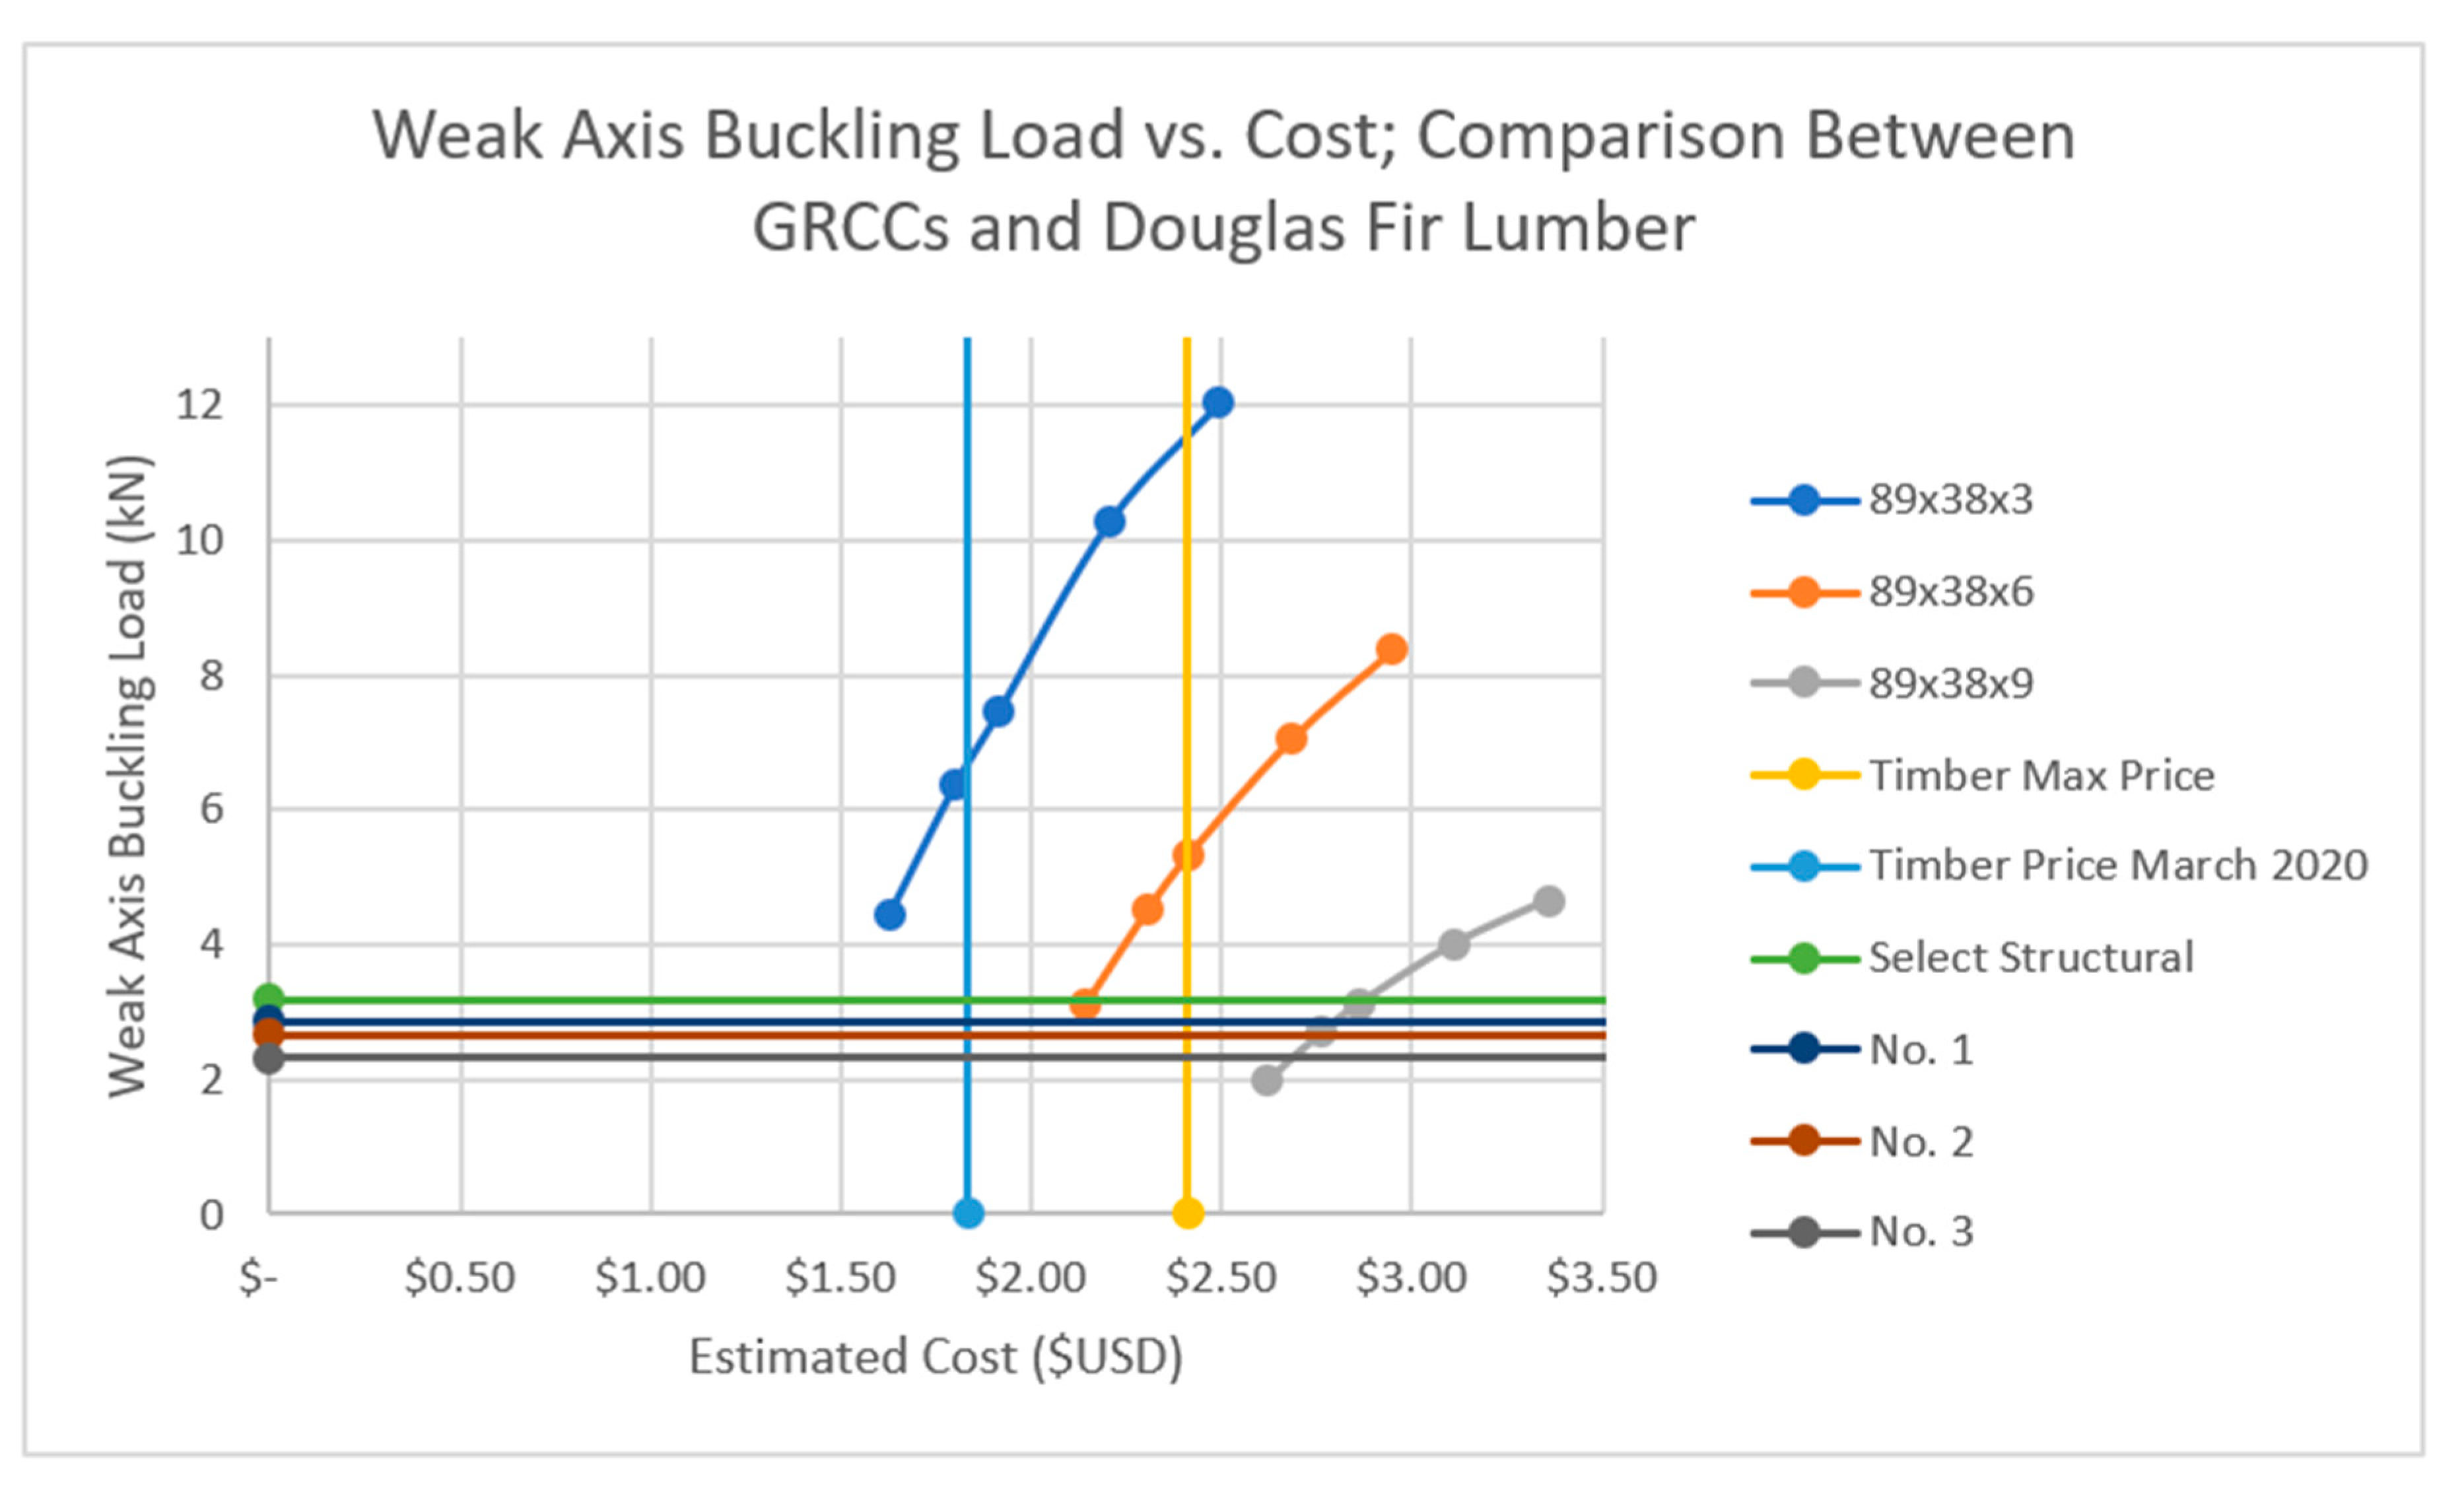
To better understand the findings of the FEM, graphs were developed. The data between the timber section buckling loads, timber costs, and estimated costs and buckling loads of the GRCC equivalents were collated into two figures.
Figure 8 shows the weak axis buckling load vs. cost, while
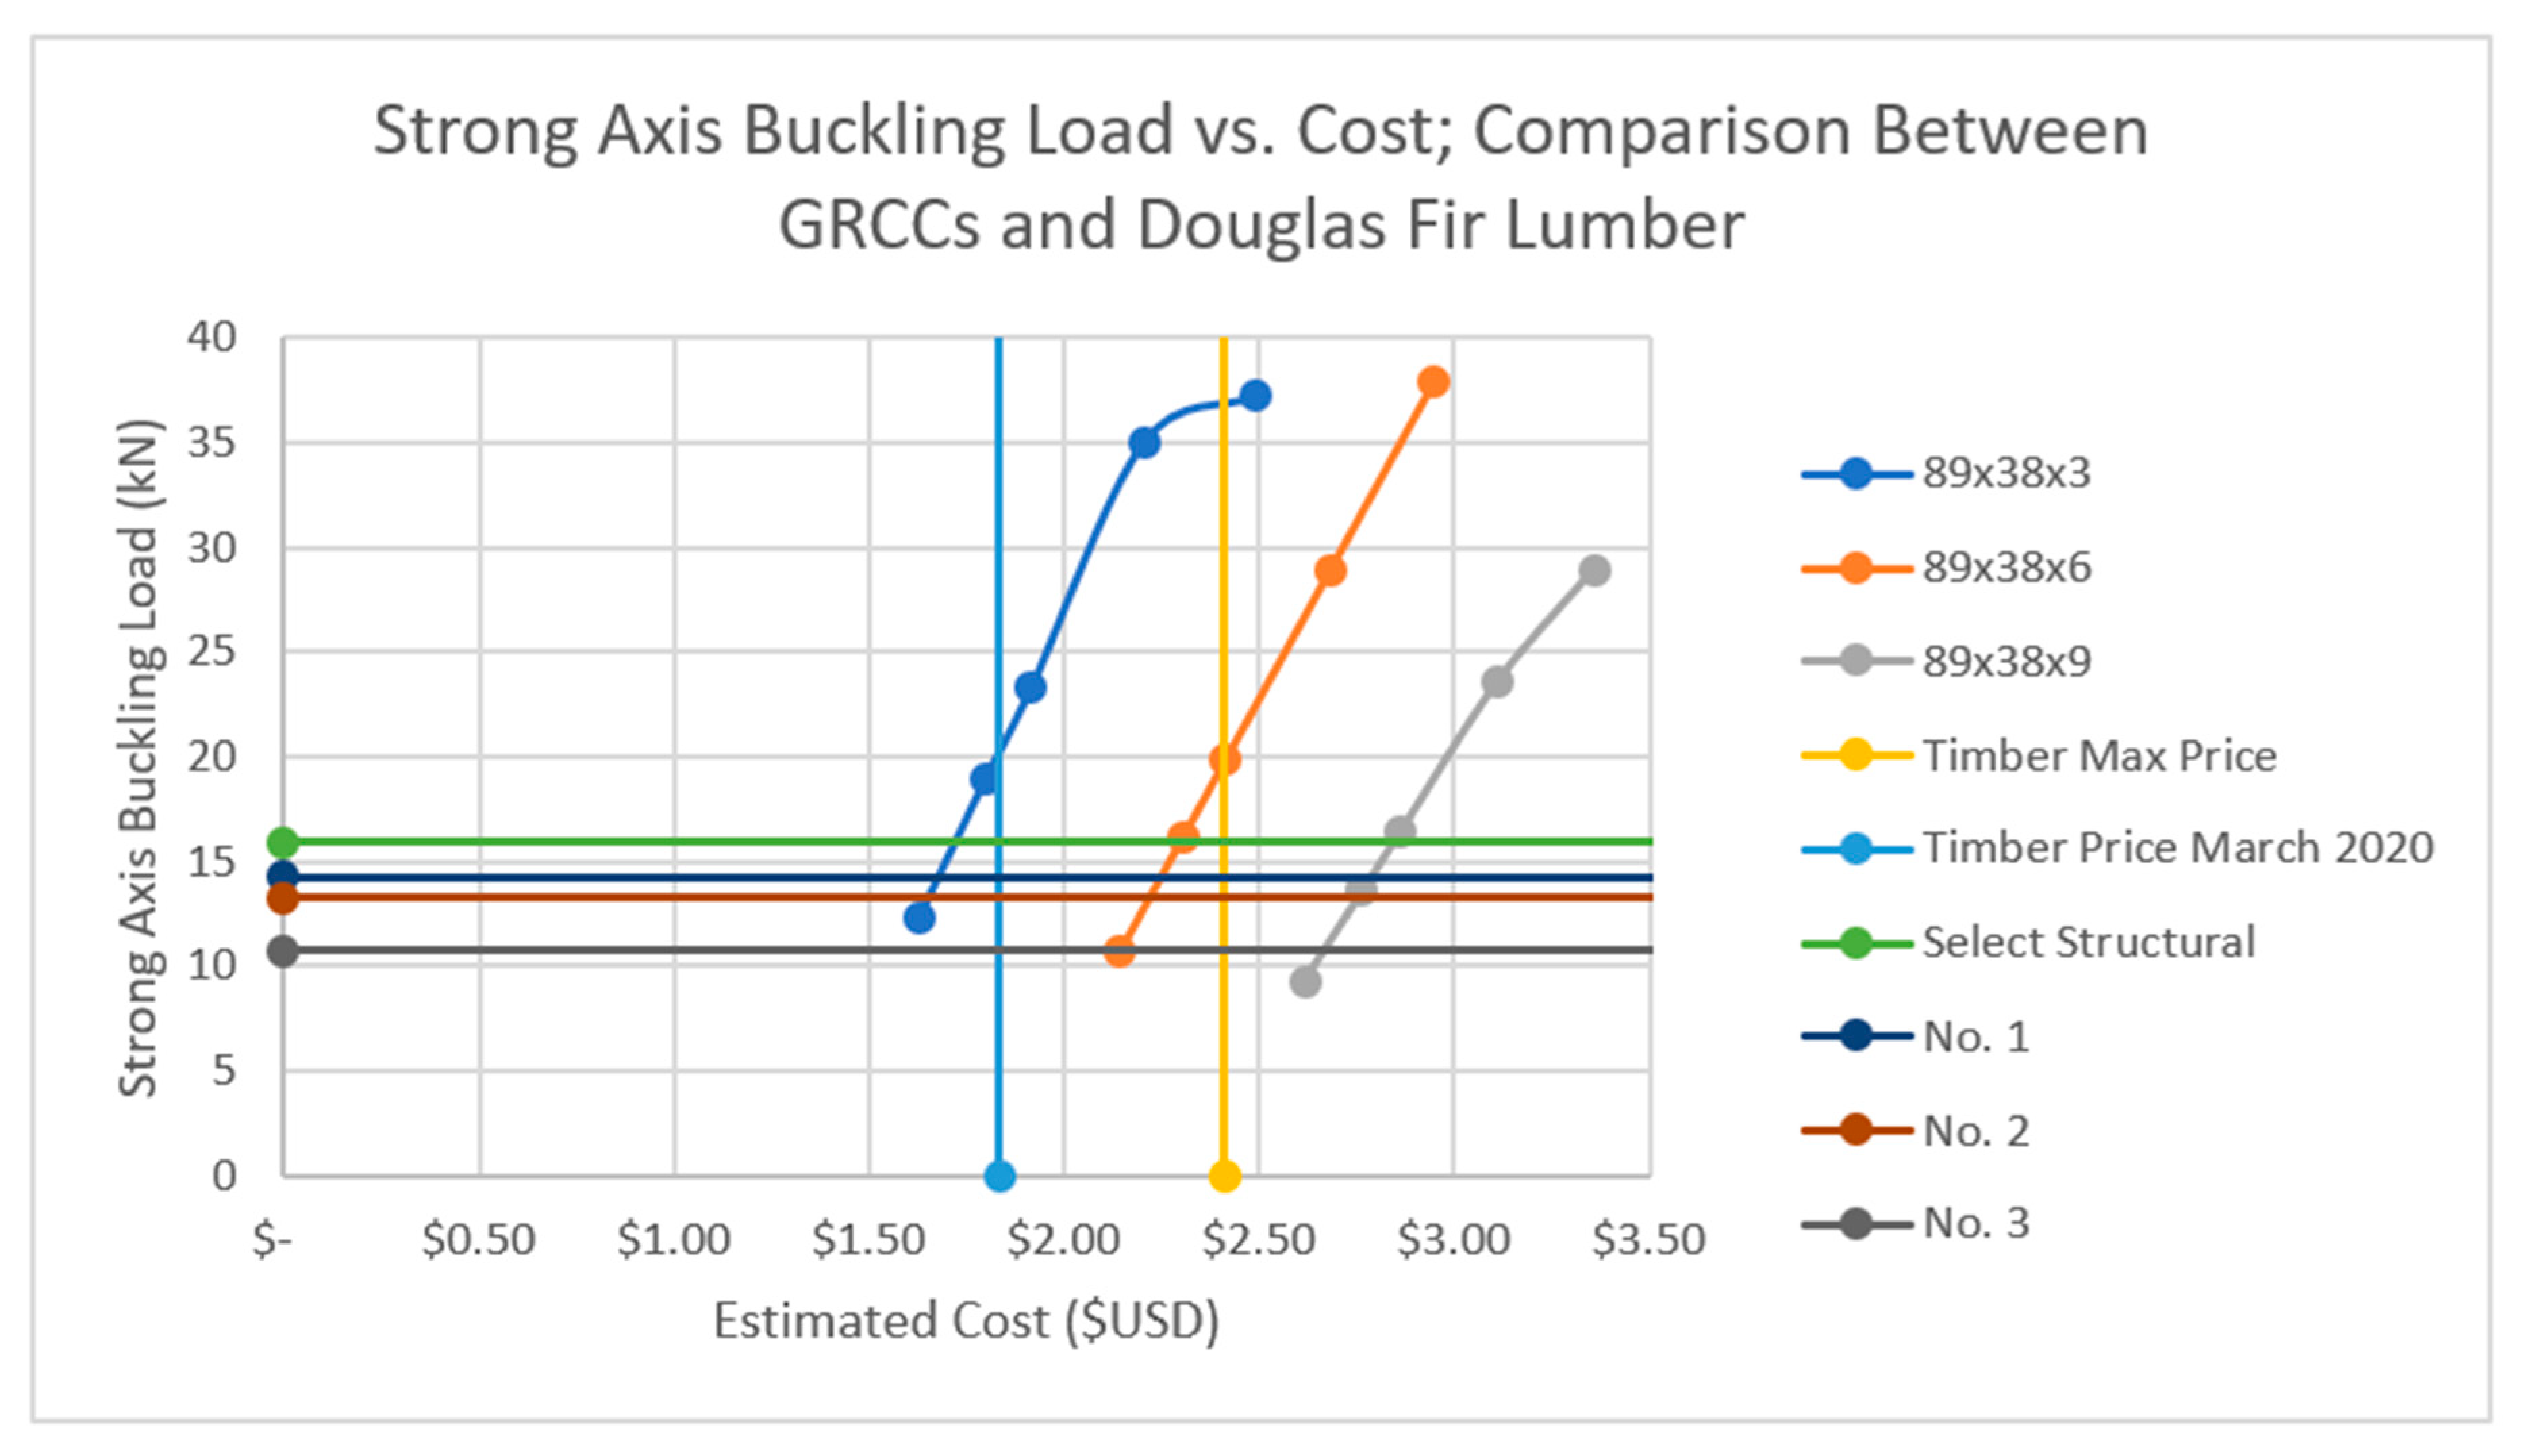
Figure 9 shows the same for the strong axis buckling. Note that the timber buckling loads are graphed as horizontal lines while the timber costs are vertical lines.
As can be seen in
Figure 8 and
Figure 9, the most cost-effective sizes are 89 × 38 × 3 GRCCs. These can approach a price of USD 1.63 if utilizing a 1 mm glass plate thickness, which results in a cost saving of 11% over current timber prices (USD 1.835). This section, however, only beats the buckling load of No. 3 grade timber, so the glass plate thickness would need to be modulated until an acceptable design was found.
The 89 × 38 × 3 GRCCs feature a 3 mm exterior sleeve, which is more problematic with respect to utility. The polymer sheeting allows for fasteners to attach to the GRCC. The total thickness of the 89 × 39 × 3 GRCCs is 6 mm (3 mm from the exterior, 3 mm from the interior sleeve). This may be an unacceptably thin region for practical purposes.
4. Analytical Design for 5 × 5 × 1/8 Steel Equivalent
As it would be insufficient to only calculate and compare buckling loads of GRCCs against timber structural members, a similar comparison analysis will also be performed for a GRCC that matches the requirements of buckling load as an HSS 5 × 5 × 1/8 (the metric equivalent being HSS 127 × 127 × 3.2). For this shape, the maximum load (assuming LRFD design) is 355 kN (note that this is the value of Pn, the nominal buckling load without the 0.9 reduction factor). For this shape, an equivalent GRCC is designed.
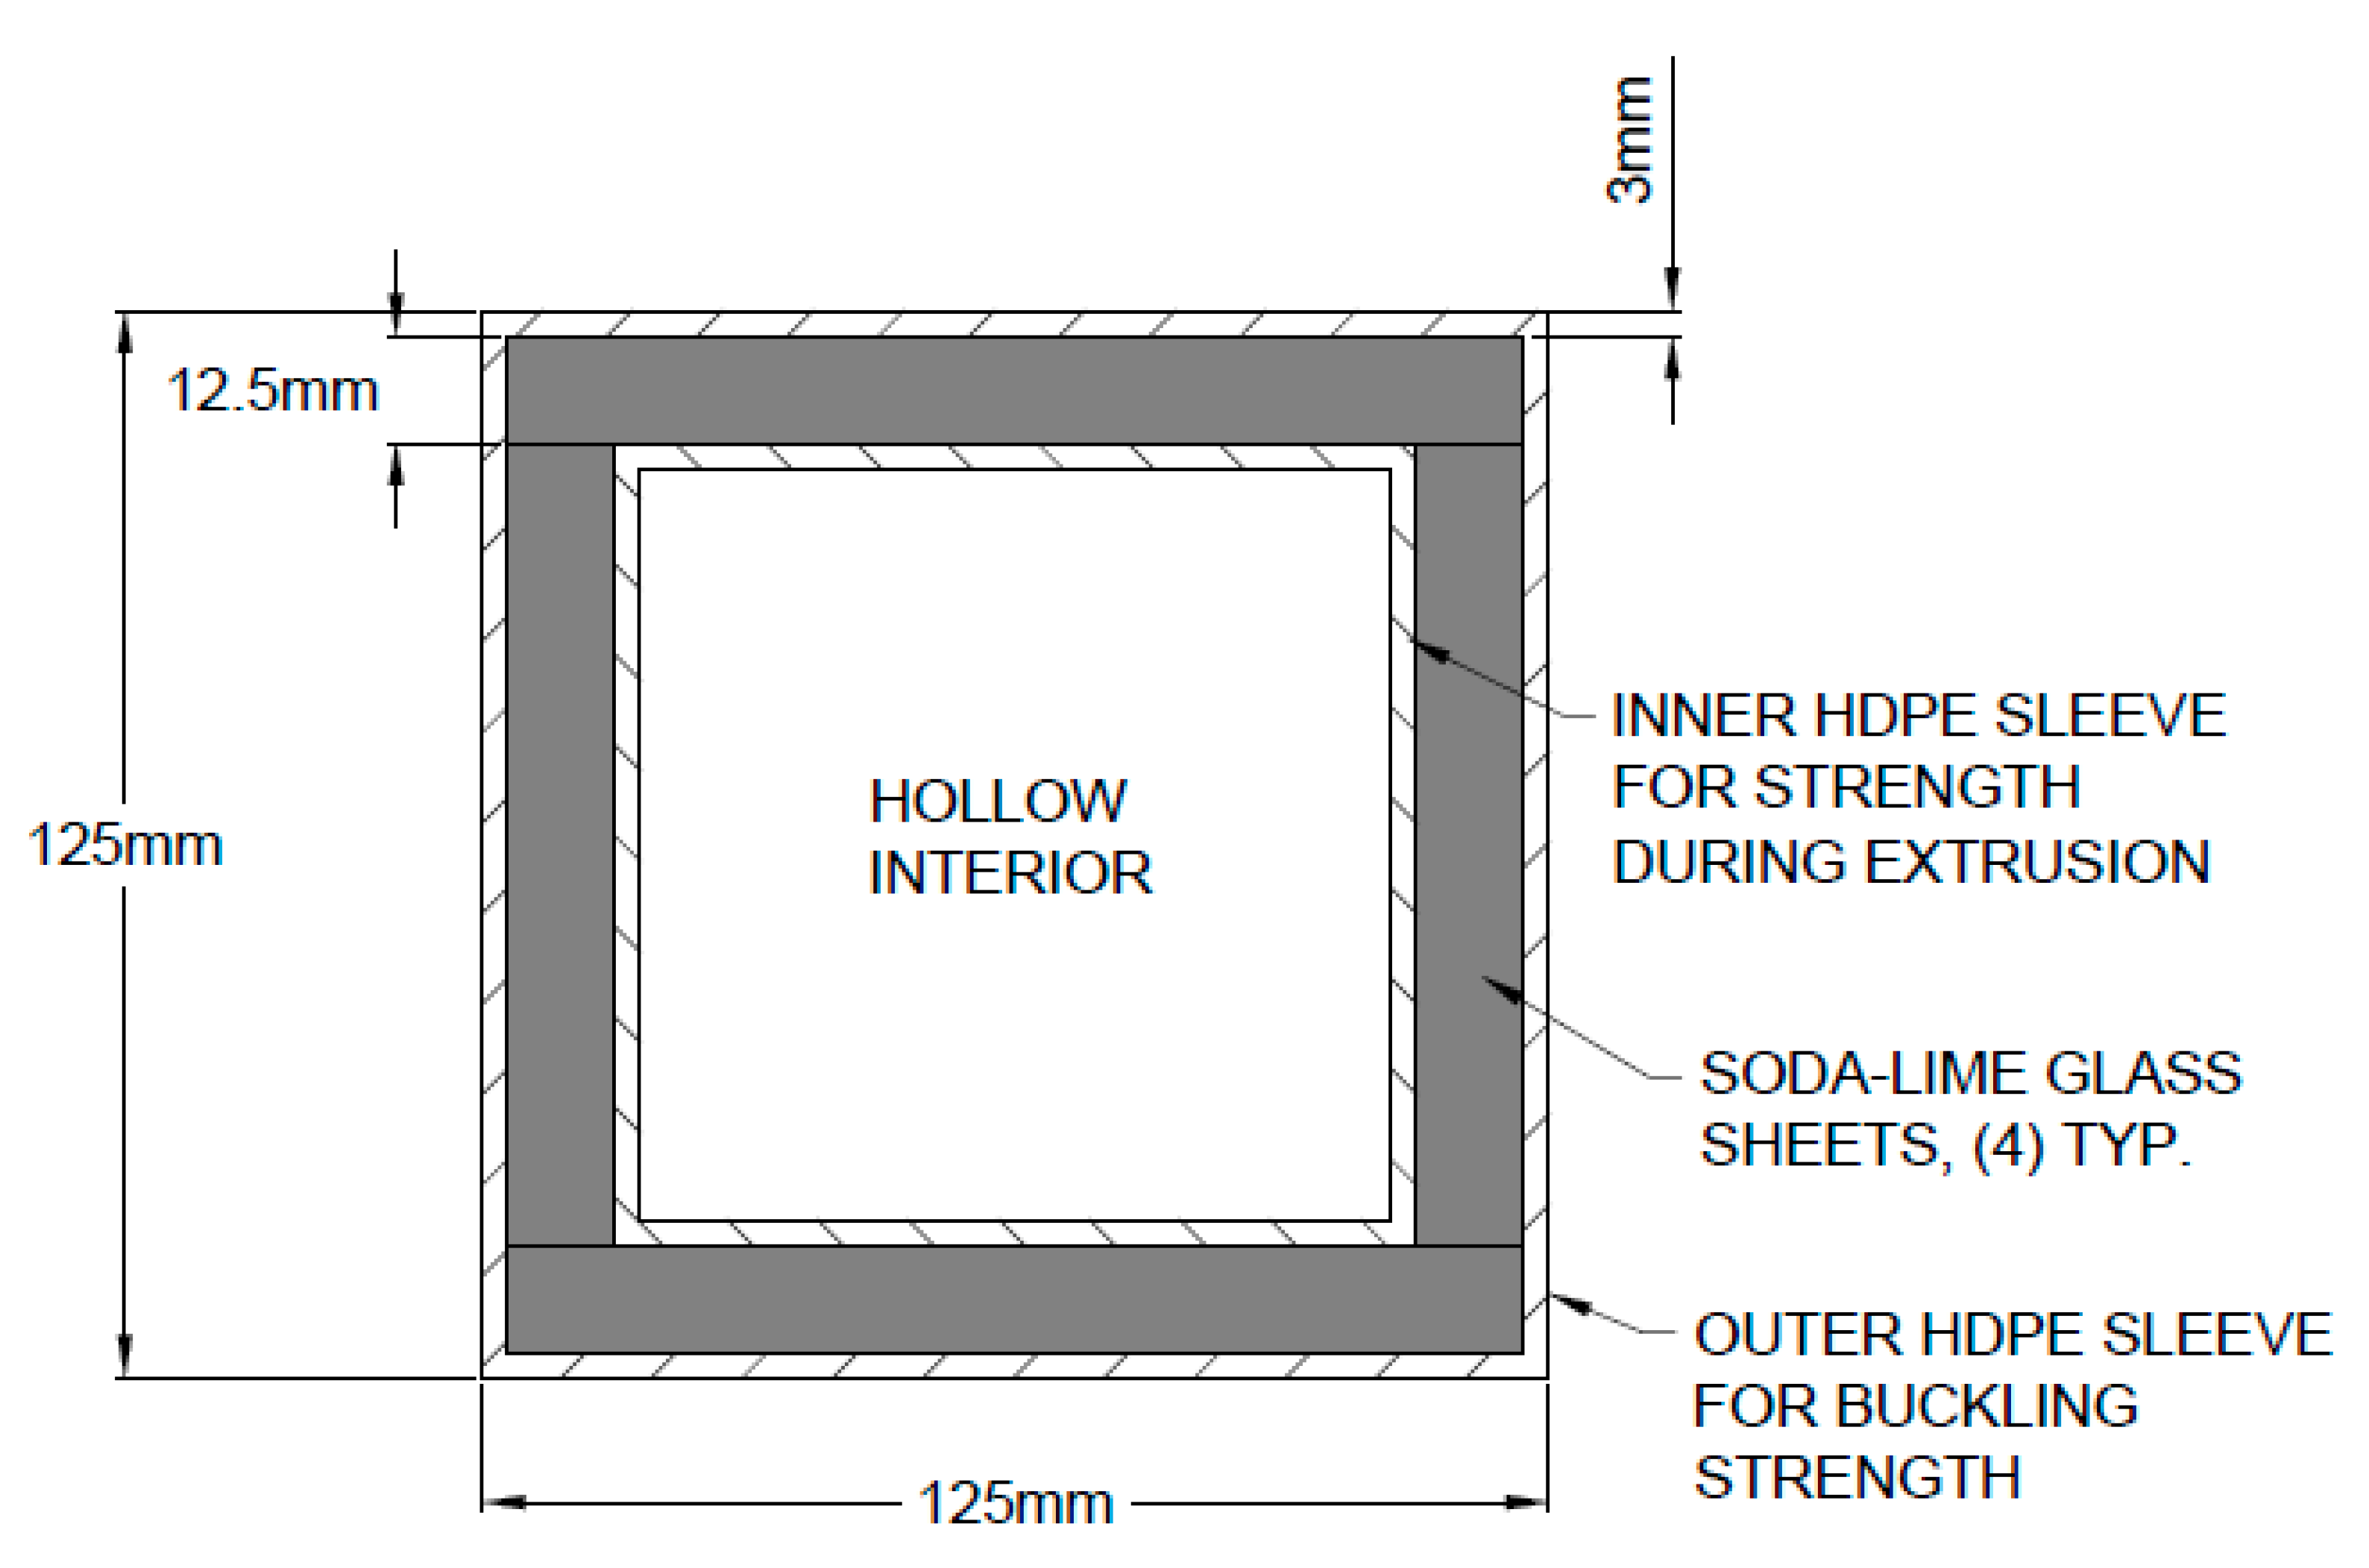
The selected GRCC is a 125 mm × 125 mm section with 12.5 mm thickness glass sheets. A standard sleeve thickness of 3 mm is assumed for both the interior and exterior HDPE sleeves. An example of the selected member is shown in
Figure 10. Note that the design features four glass plates of varying widths, unlike the two glass plates utilized for the equivalent stud GRCC.
As with the previous GRCCs, it is absolutely necessary for the HDPE sleeve to bond to the glass sheet.
First, the costs of the steel need to be presented. Based on a current steel price of USD 0.77per kg [
26], and assuming A36 plate prices are equivalent to A500 grade B (which is what hollow structural steel sections are typically composed of), the resulting prices for the selected sections for comparison are shown in
Table 3.
The selected design for comparison is an HSS 127 × 127 × 3.2 (HSS 5 × 5 × 1/8). For this section, the unreduced buckling load is 355.36 kN.
Now, the equivalent buckling load GRCC is designed. The selected GRCC is a 125 mm × 125 mm section with 12.5 mm thickness glass sheets and an HDPE sleeve of 3 mm (which is designated a 125 × 125 × 3 × 12.5). As before, the section is assumed to deform as a solid component. This results in the glass not locally buckling but deforming the entire column as a complete unit. For the purposes of the analytical design, the frictional contact between the glass plates will not be considered for analysis.
The resulting calculations are included in the
Appendix A, Equations (A8) and (A9). This results in a GRCC with a 669 kN.
However, due to the complex interaction between the glass plates, this critical load calculated analytically is proven to be incorrect in the finite element section. That being said, the FEM-determined buckling load surpasses the HSS buckling load of 355.36 kN. An explanation for the difference in buckling load is presented in the following section.
Additionally, using the same cost assumptions as before, the cost of the GRCC 125 mm × 125 mm with 12.5 mm glass plates is USD 15.12; this is significantly lower than the HSS 127 × 127 × 3.2 (HSS 5 × 5 × 1/8) at a cost of USD 26.42. This would be a cost saving of 43% over the equivalent steel section.
5. Finite Element Modeling for 5 × 5 × 1/8 Steel Equivalent
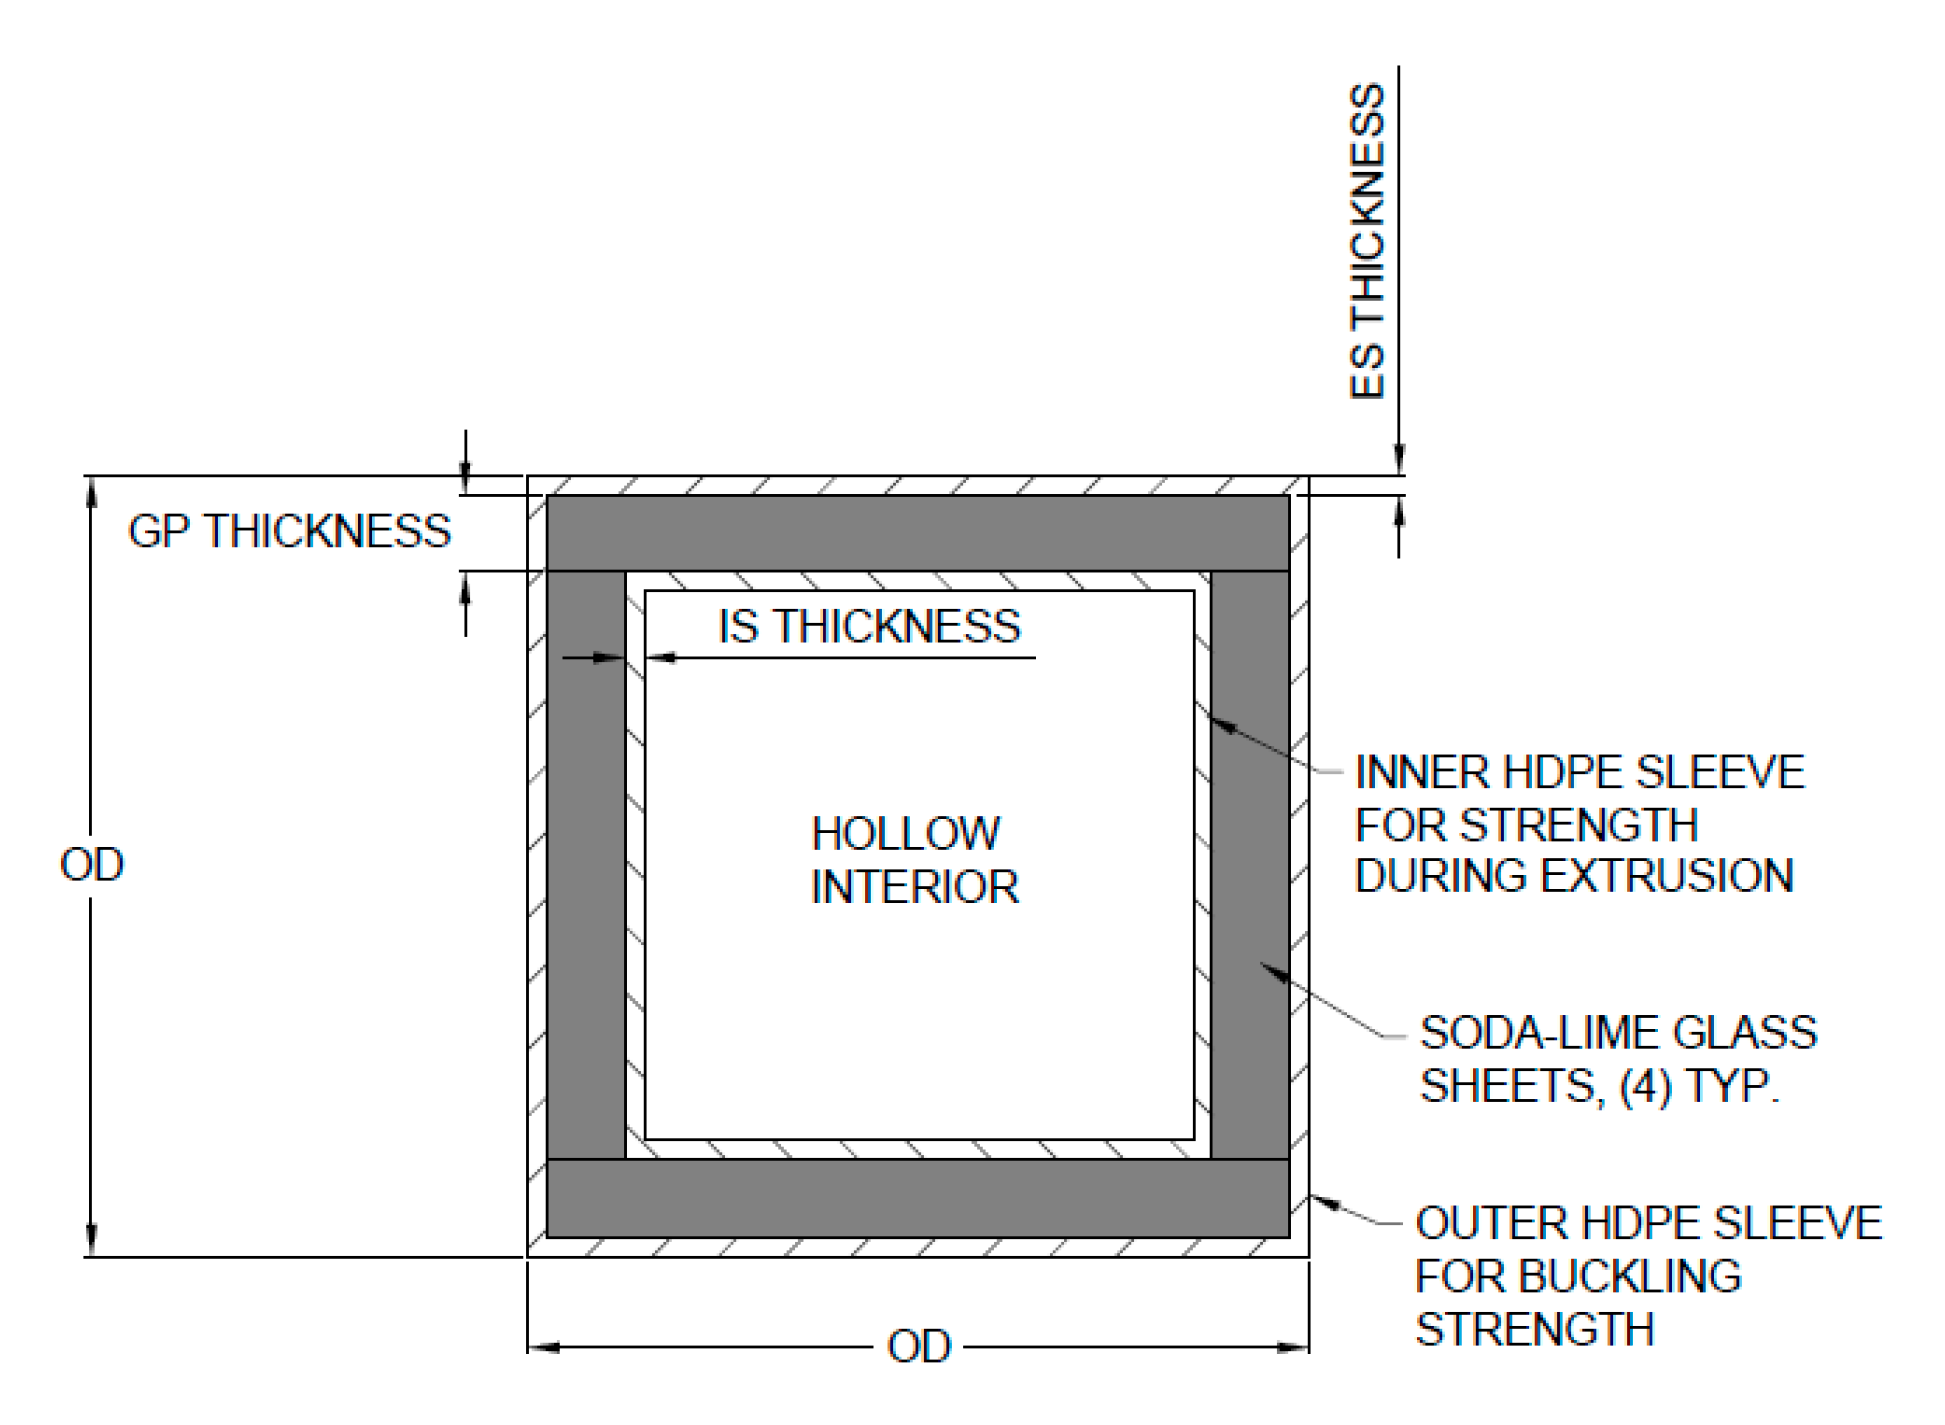
As before, FEM was conducted of iterative designs to showcase the variety of buckling loads and costs possible for GRCCs. FEM was conducted using ANSYS 2019 R3′s Static Structural and Eigenvalue Buckling Analysis Systems. Before displaying the FEM determined results, it is necessary to describe the standardized shape.
Figure 11 below shows the shape that was modulated. As before, there are four primary measurements; the outside dimensions (denoted OD), the exterior sleeve thickness (denoted ES THICKNESS), the glass plate thickness (denoted GP THICKNESS), and the interior sleeve thickness (denoted IS THICKNESS).
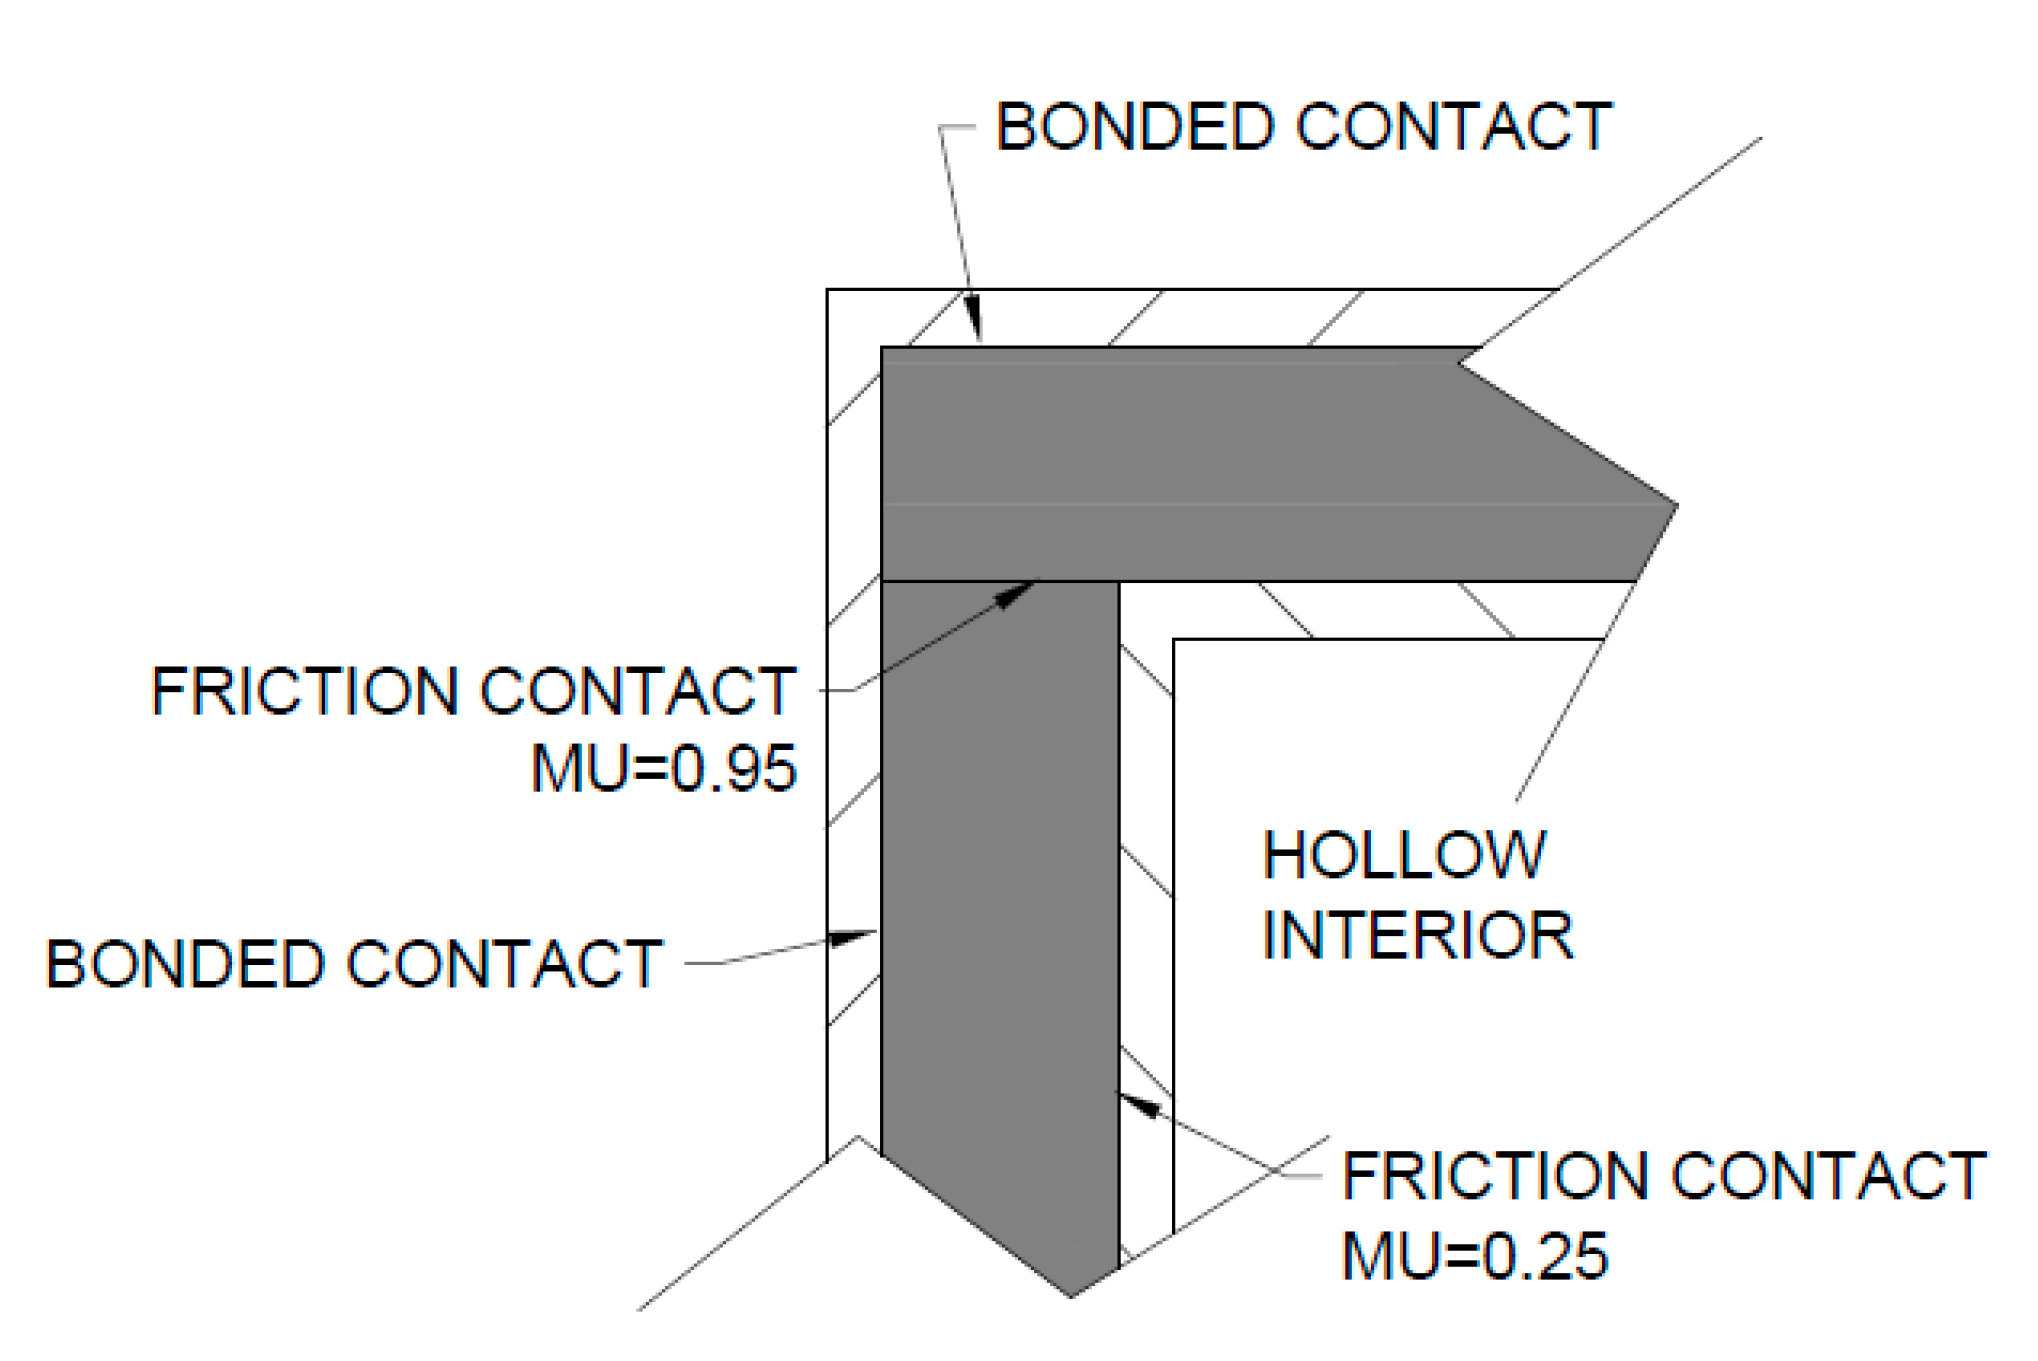
An explanation of the contact conditions for the GRCCs analyzed using FEM are presented in
Figure 12. The inner contact with a frictional coefficient of 0.25 (the author’s estimate) is not reflected in the FEM as the inner sleeves were excluded from the analysis (as they contribute a negligible amount of buckling load). The glass plates have a coefficient of friction of 0.95 [
27] between them.
Next, the results of the FEM are listed in
Table 4. In this table, the mesh size, maximum buckling load, maximum glass stress, and estimated cost are listed. Note that while two modes of buckling were calculated, only the first mode is reported.
This table presents an issue with the analytically determined buckling load of the 125 × 125 × 3 × 12.5; the analytical buckling load was calculated as 669 kN and the FEM resulted in a buckling load of 425 kN. The difference between these two values is thought to derive from the inclusion of the frictional joint between the glass plates (as shown in
Figure 12). This frictional joint, which is intrinsically assumed as bonded in the analytical section, significantly reduces the buckling load of the section. As the FEM can account for this interaction while the analytical does not, the results from the FEM are considered more accurate.
Next, the buckling loads vs. costs of the different dimensions of the GRCCs are graphically presented. This is shown in
Figure 13 and
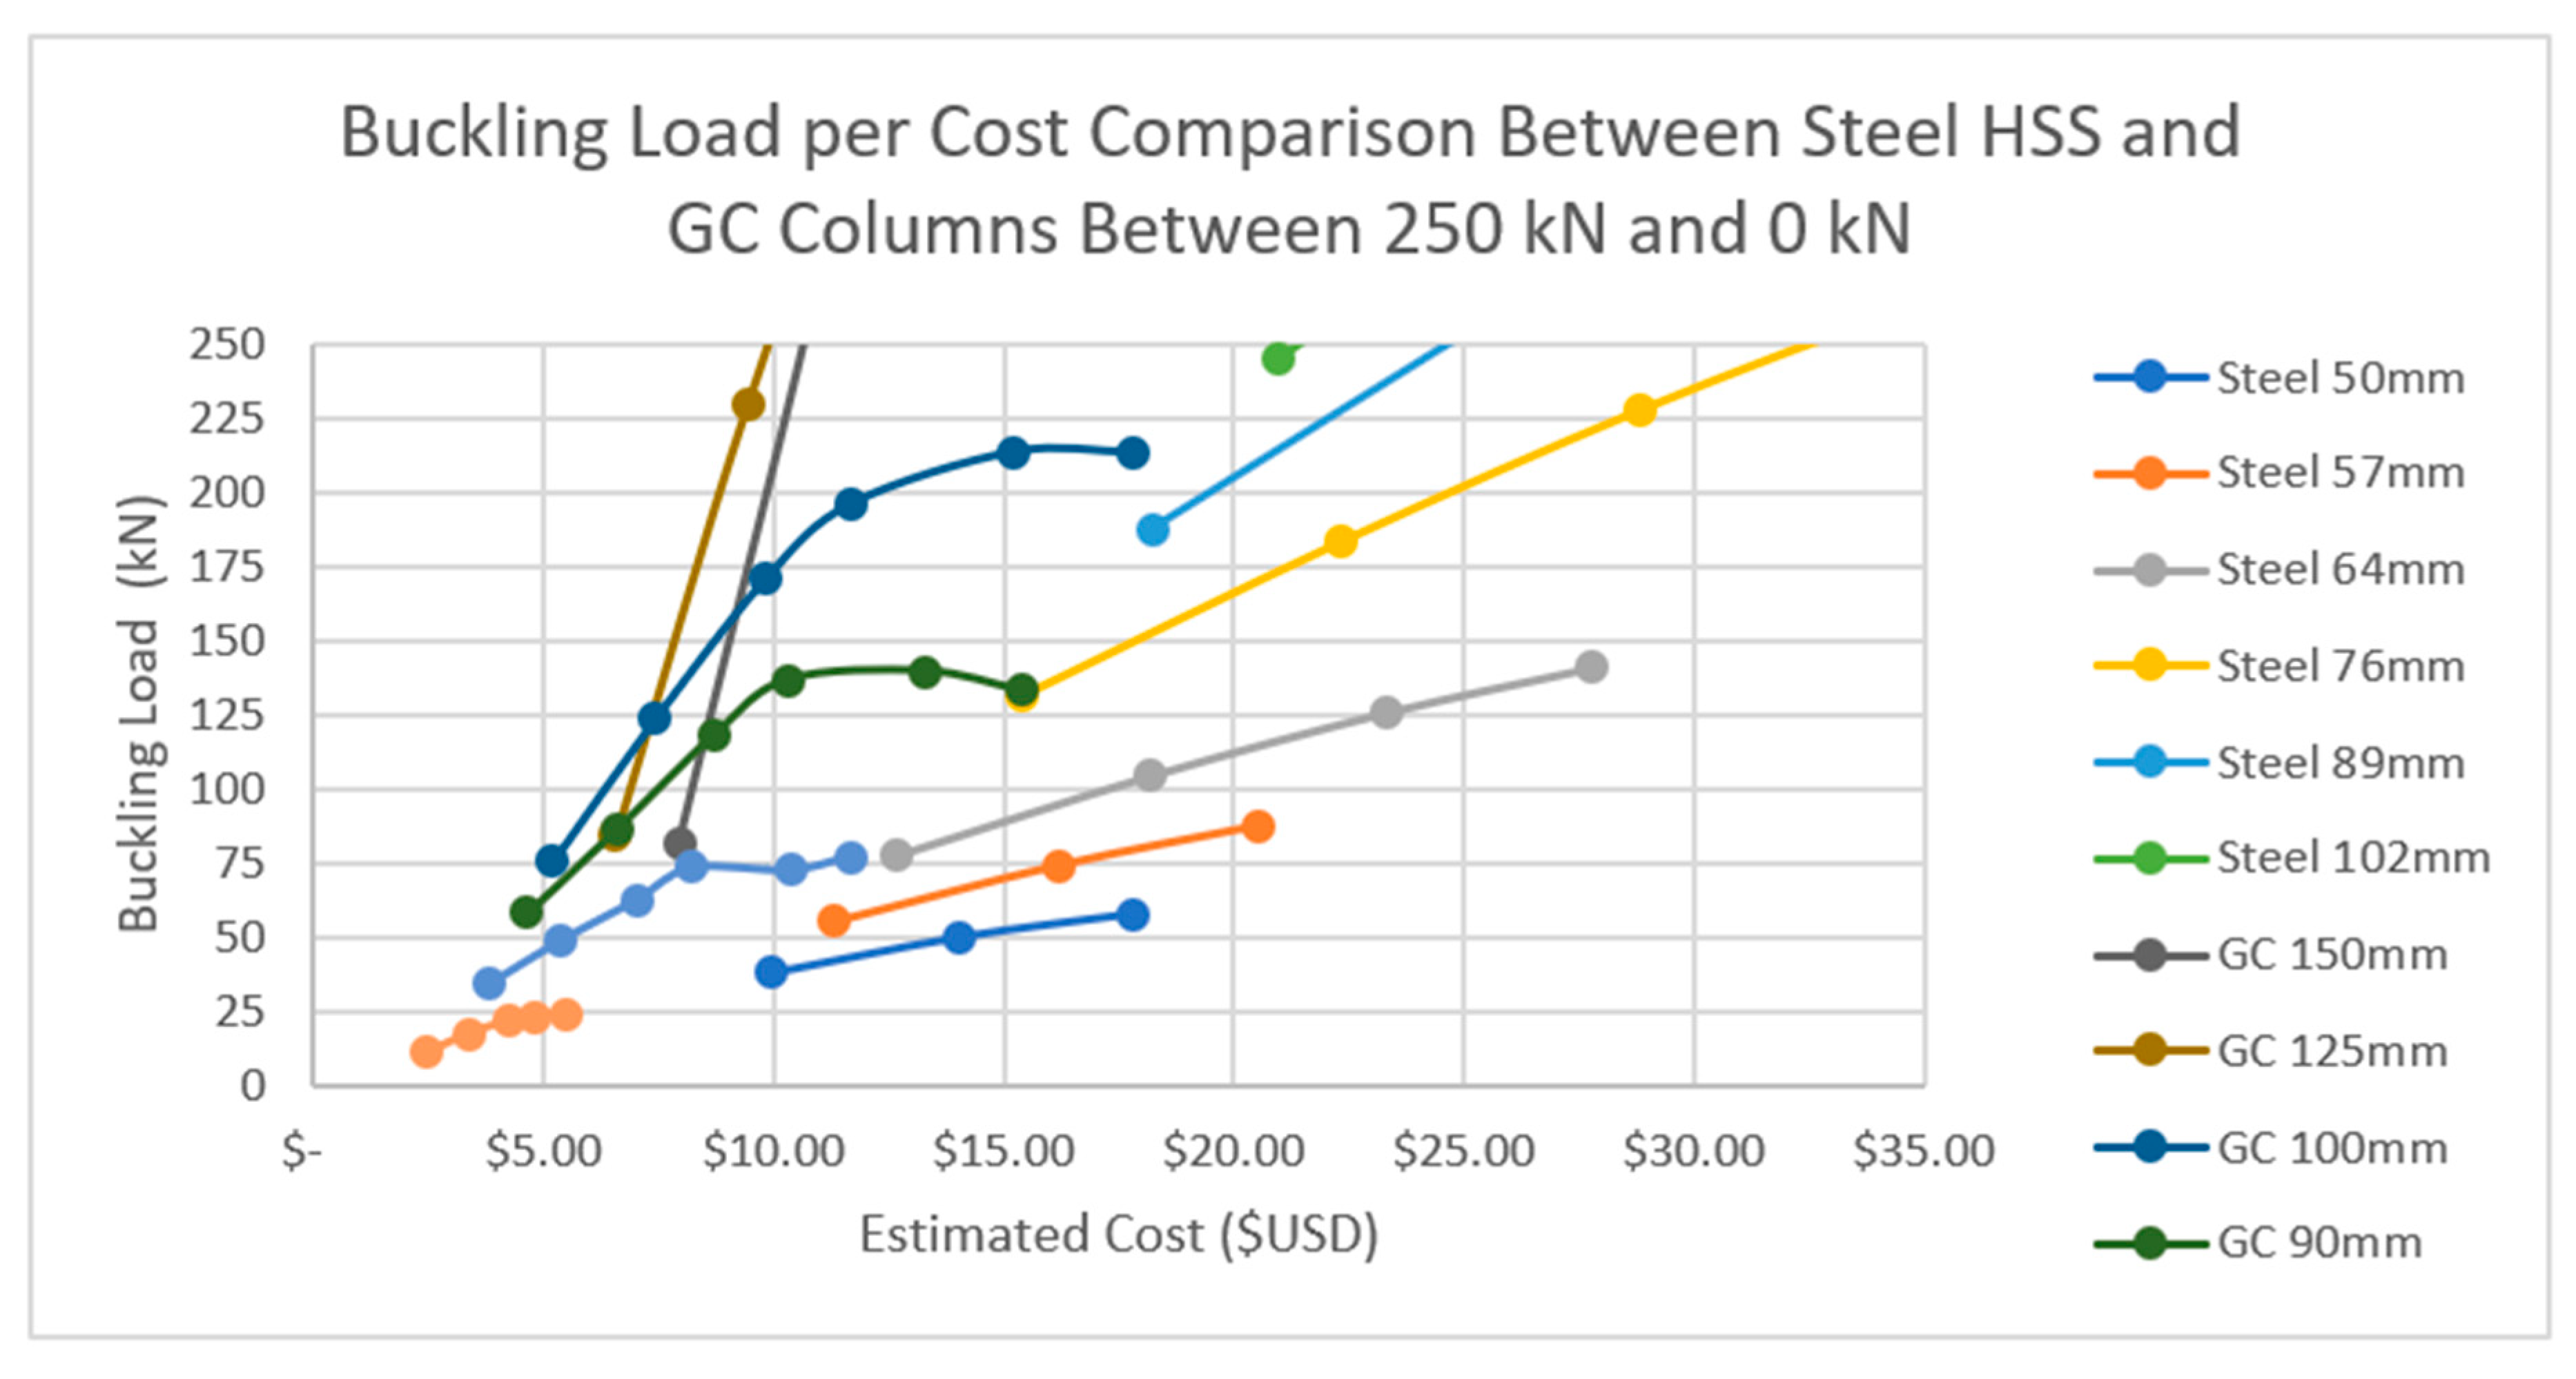
Figure 14. Due to the ranges of the values, two graphs are presented;
Figure 13 covers the range of strengths from 1000 to 250 kN while 14 covers 250 to 0 kN.
As can be seen in the graphs above, GRCCs tend to have lower costs, with cost savings up to 50% over their HSS equivalents. However, GRCCs tend to have lower buckling loads for equivalent outside dimensions, particularly for the smaller OD GRCCs. This means that if the dimensions of the column are restricted, it may require the use of a steel section.
6. Interpretation of the Results
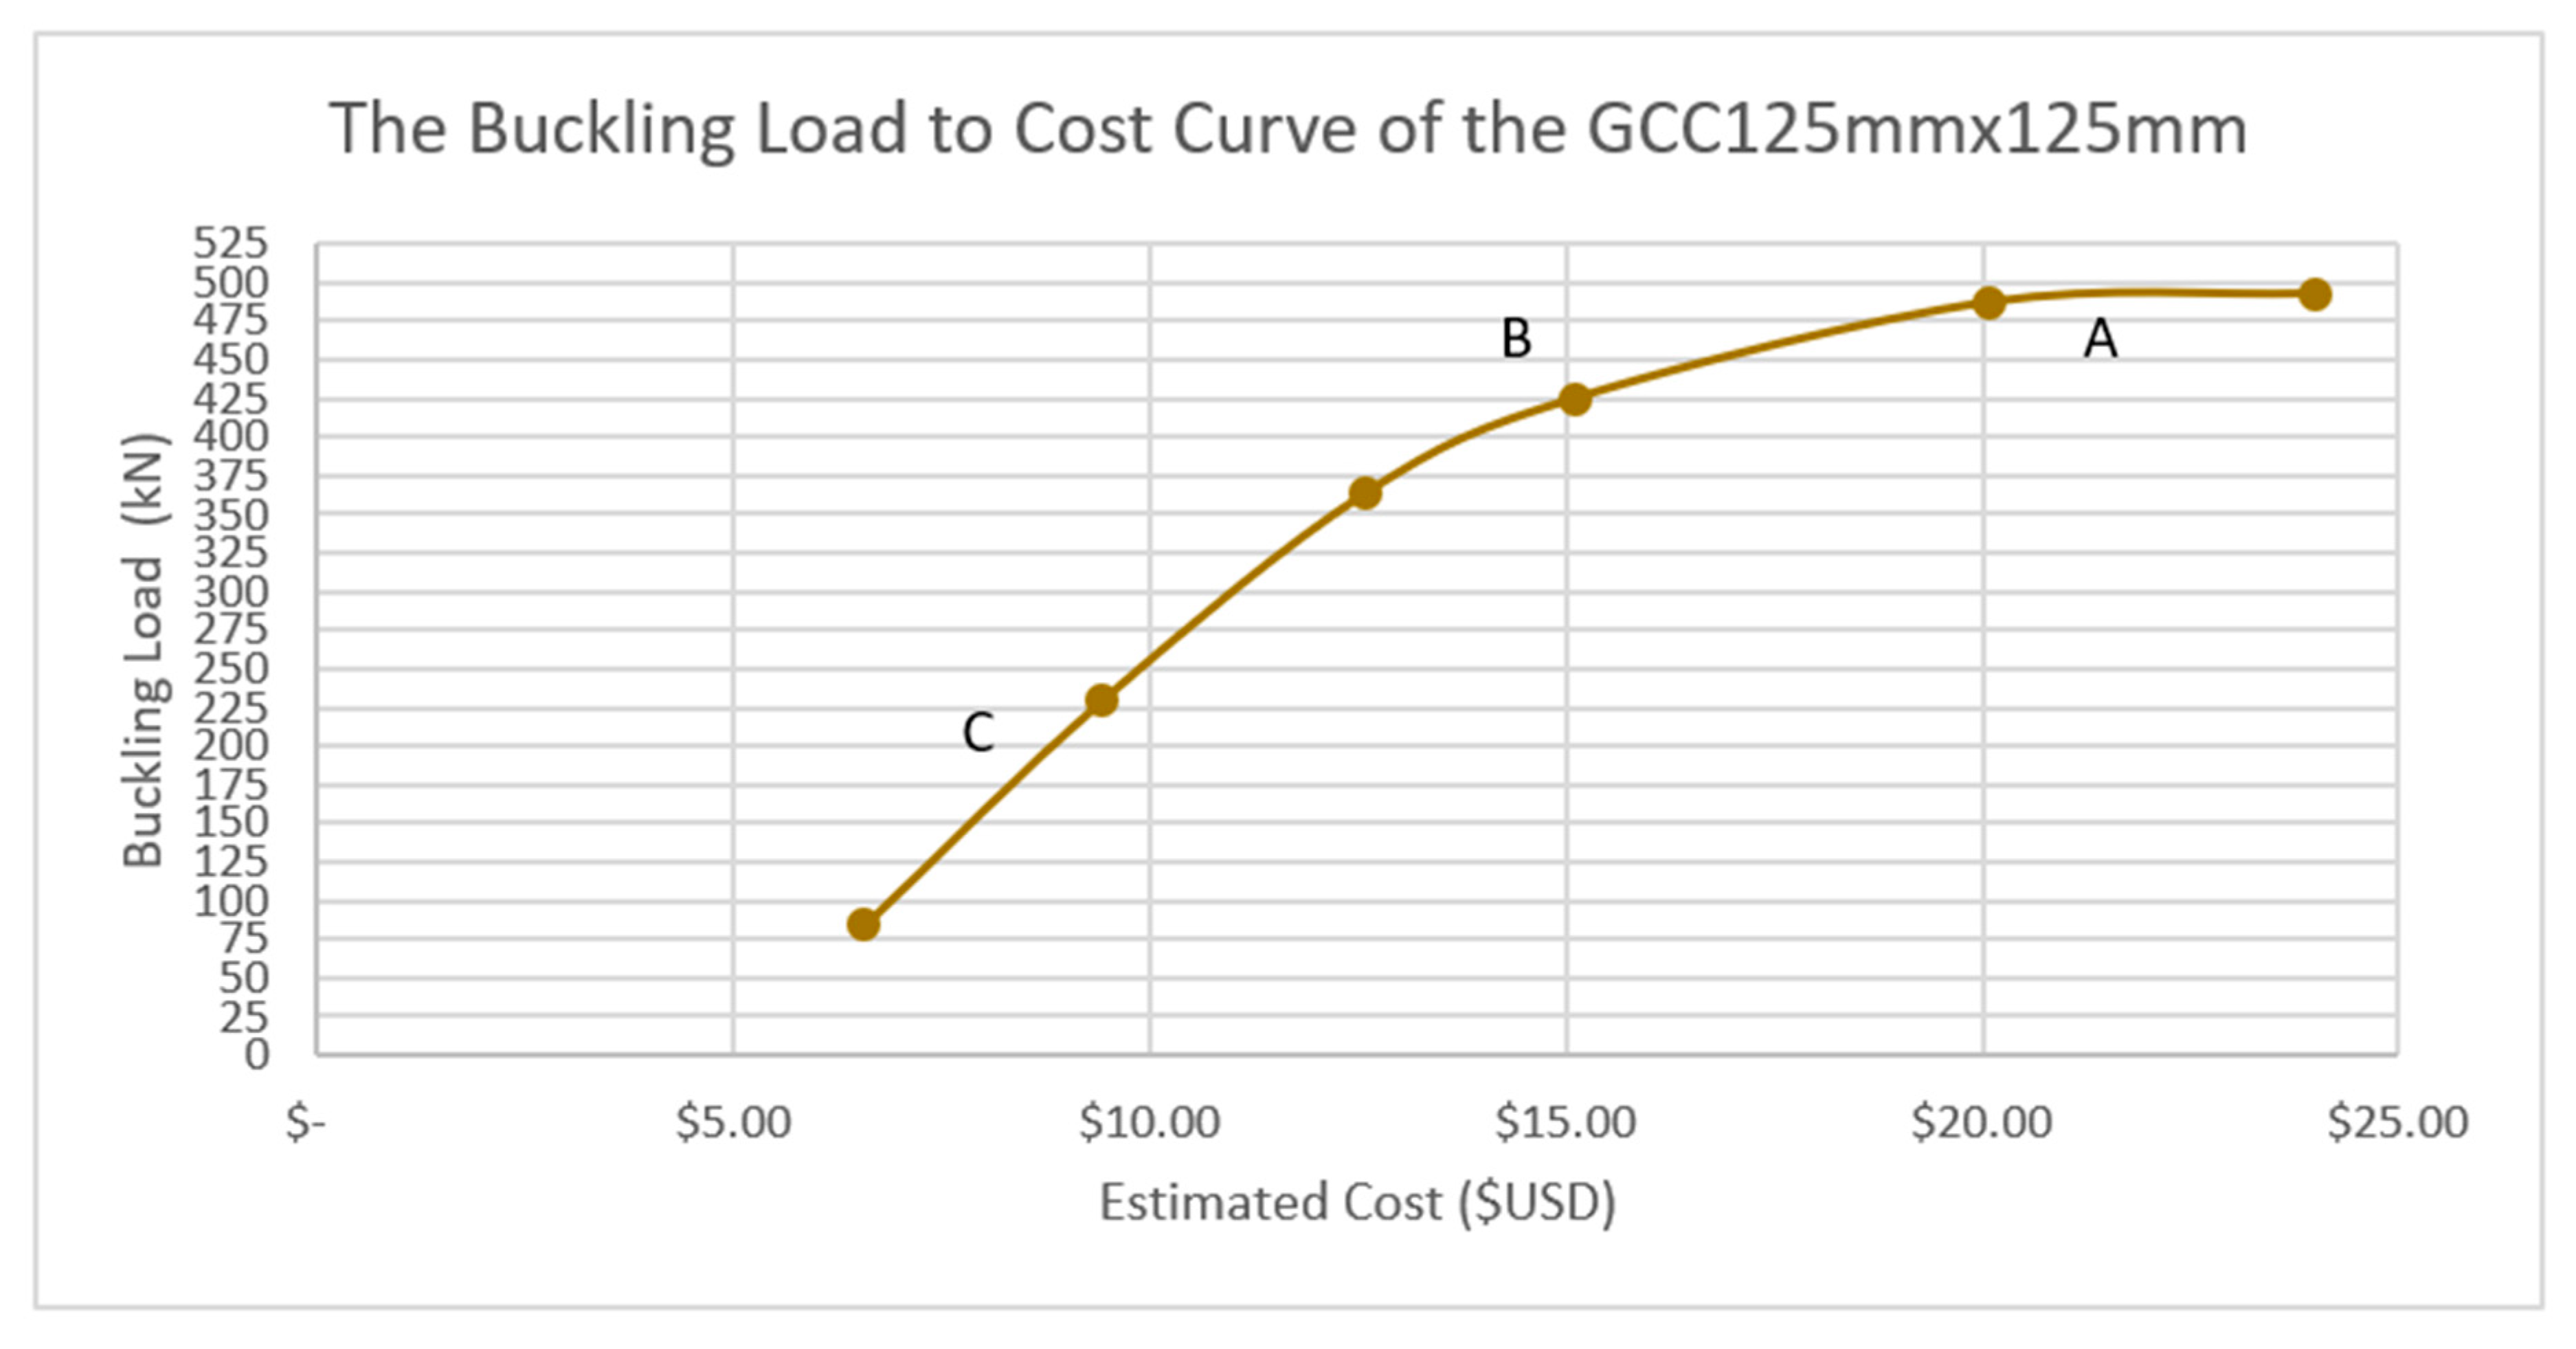
Looking at the results, there are three primary regions that describe the buckling load to cost relationships between columns controlled by buckling failure. These regions can be seen in
Figure 15 below.
Figure 15 is the buckling load to cost curve of the GRCC 125 mm × 125 mm for the different glass plate thicknesses. Specifically,
Figure 15 highlights three primary regions for the curve, denoted A, B, and C.
These regions correspond to three conditions occurring in the GRCC. Region A is the location to which increasing glass content does not significantly add to the buckling load of the column. This occurs as the moment of inertia is not significantly improved by additional glass as the additional glass is placed closer to the centroid of the column.
Region B is the region in which most economical designs occur. HSS appears to all be within this region, indicating that the original design of HSS most likely took this into account. This region is the preferred region for GRCC as well as it produces the most buckling load for the cost. The failure modes expected are gross buckling of the column, as is seen in
Figure 6 and
Figure 7.
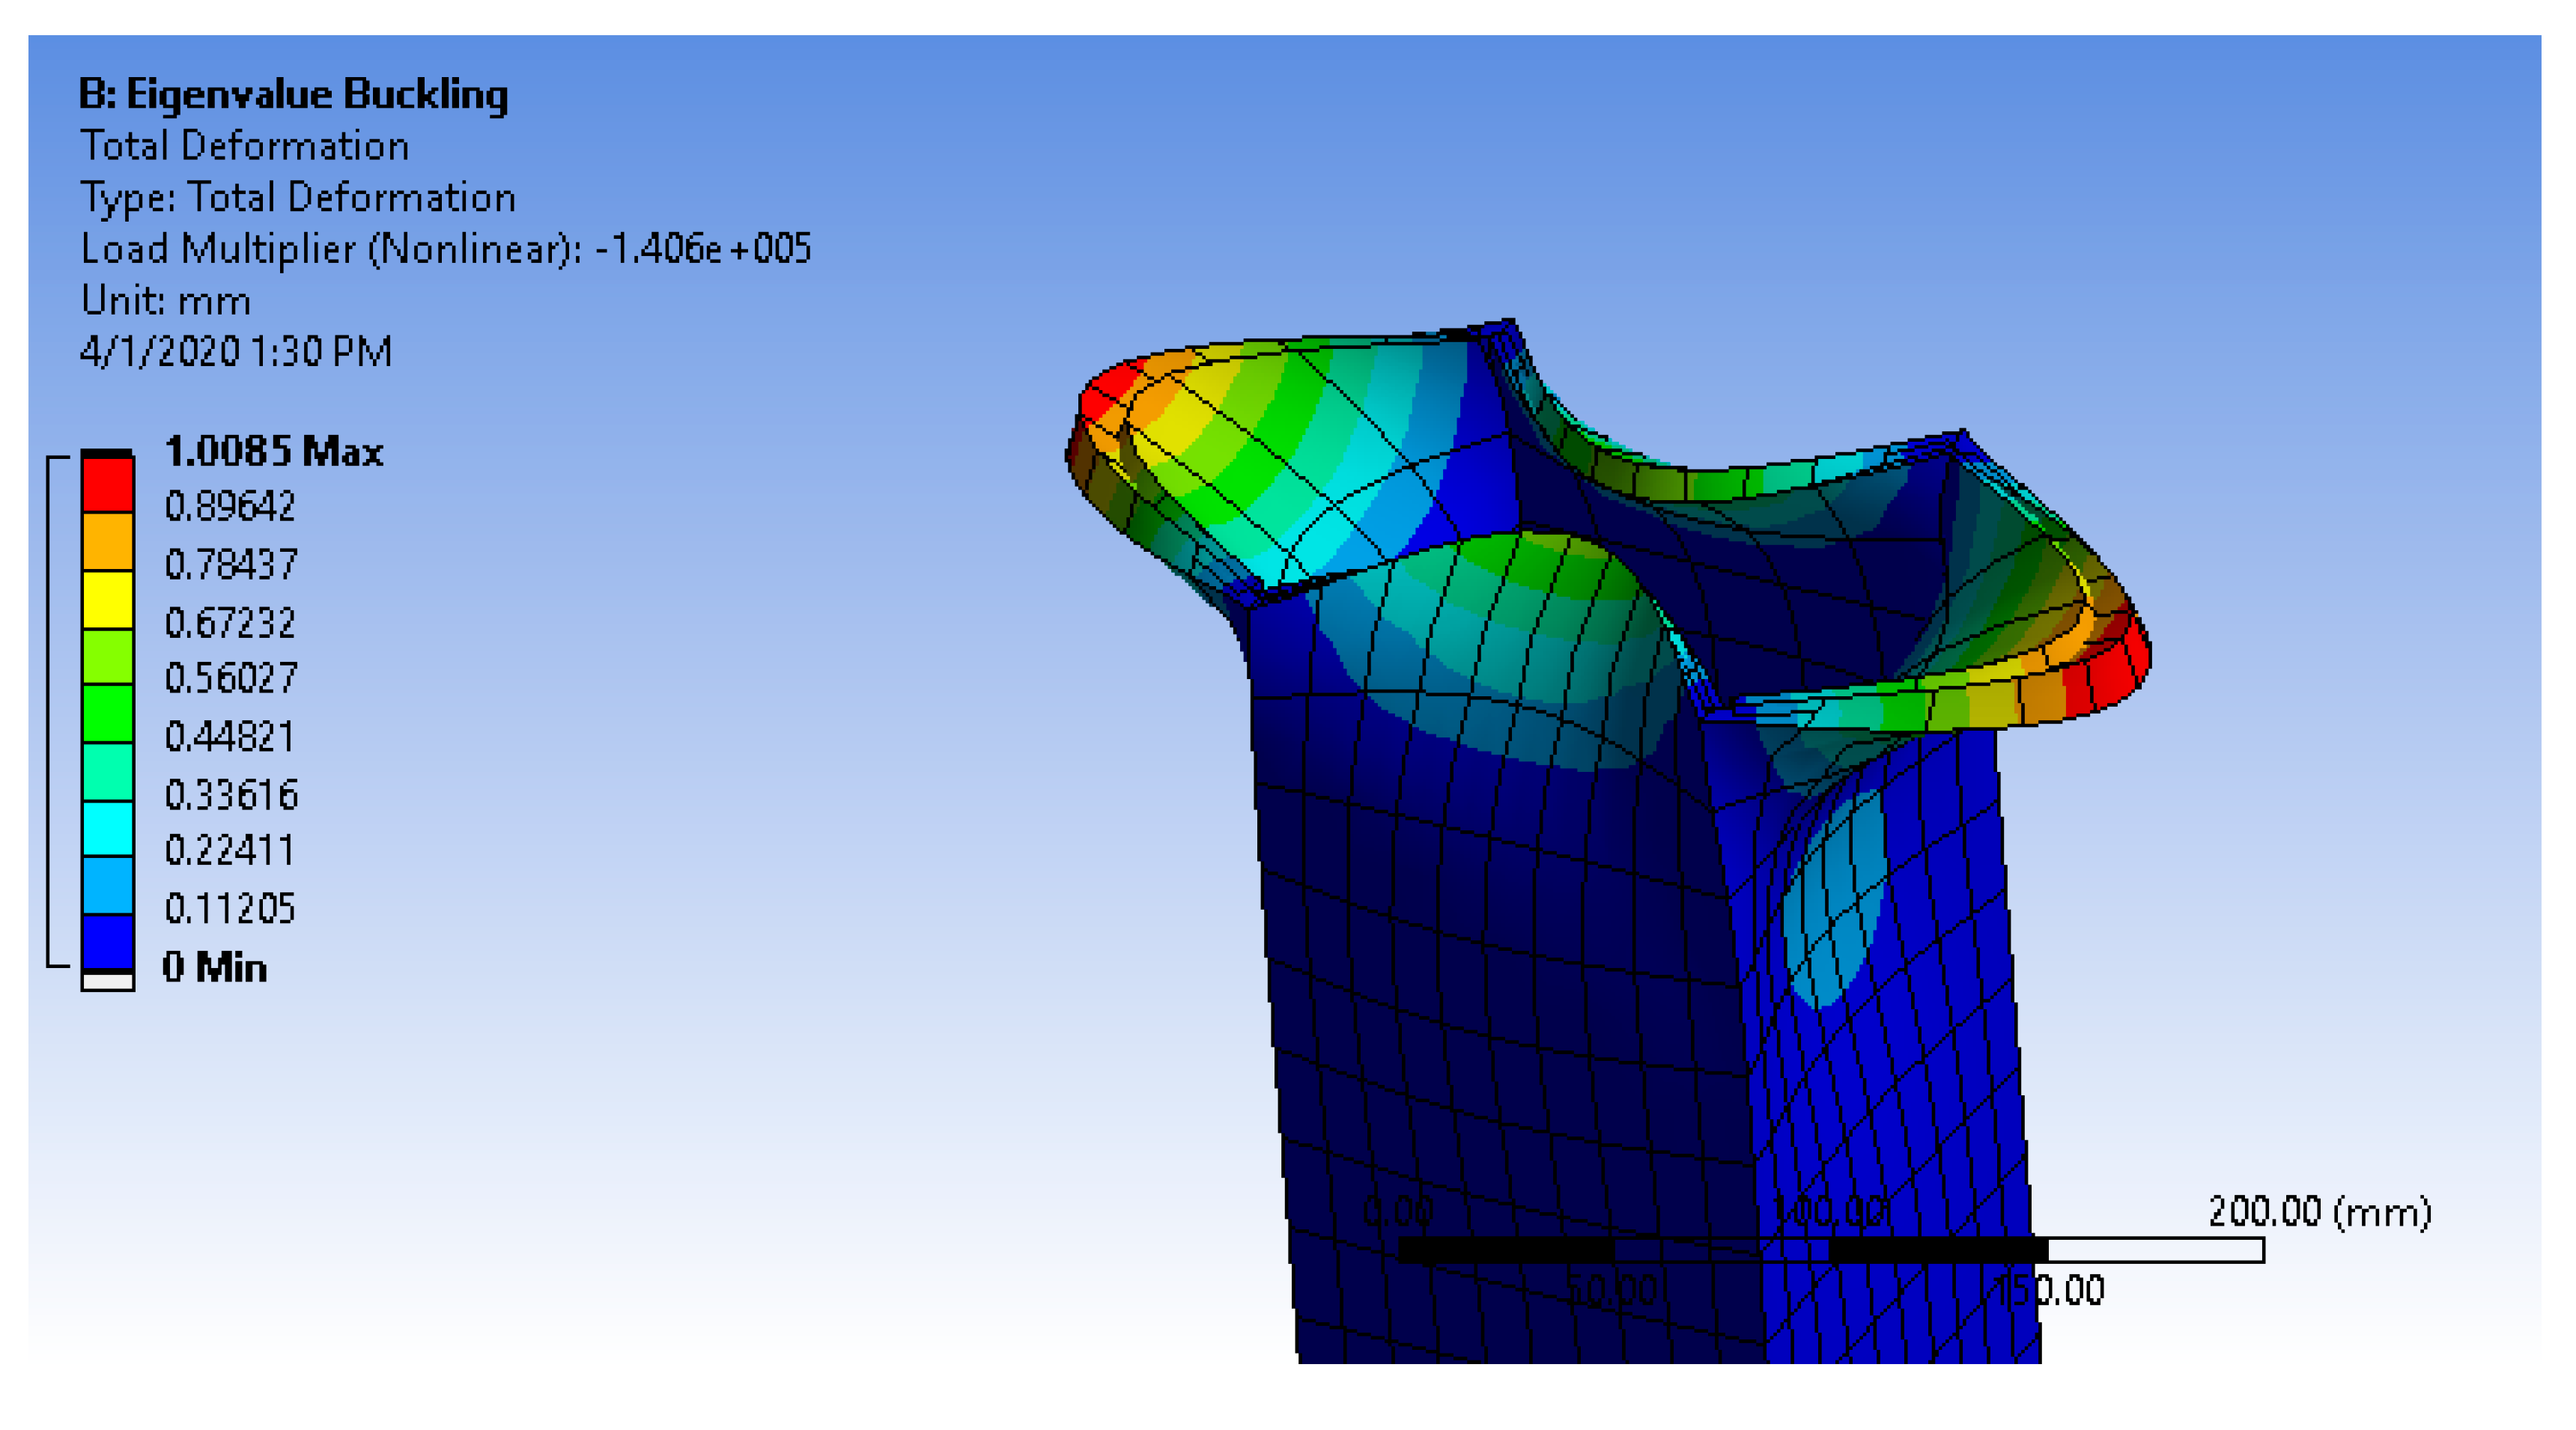
Region C occurs when the glass begins to locally buckle. This can be seen in
Figure 16. In this figure, the HDPE sleeve is not able to prevent the glass from greatly displacing locally at the top of the column. This results in premature failure of the column, preventing it from being able to fully engage the section. As a result, the column begins to rapidly lose buckling load for the given cost, as is reflected in
Figure 15′s region C.
It should be mentioned that the deflected shape in
Figure 16 appears as though it is debonding, but this occurs as the ANSYS program exaggerates the deflections of individual elements; these exaggerated deflections cause the localized overlap and stretched look at the top of the column in
Figure 16. If desired, these excessive deflections can be depressed by utilizing large deflections within ANSYS. However, the authors have opted to utilize the exaggerated deflections to allow viewing of the buckling failure mode.
This condition of local buckling of shapes occurs in HSS. As Reference [
28] indicated, there exists a region in which steel sections are considered slender. Specifically, the local buckling based on plate buckling is a similar condition, which is described in the commentary, section E7.2. Slender Stiffened Elements,
Qn of Reference [
28].
7. Required Bond Strengths
Much of this paper assumed that the bond strengths between the glass plates and polymer sleeves were sufficient to prevent delamination of the composites.
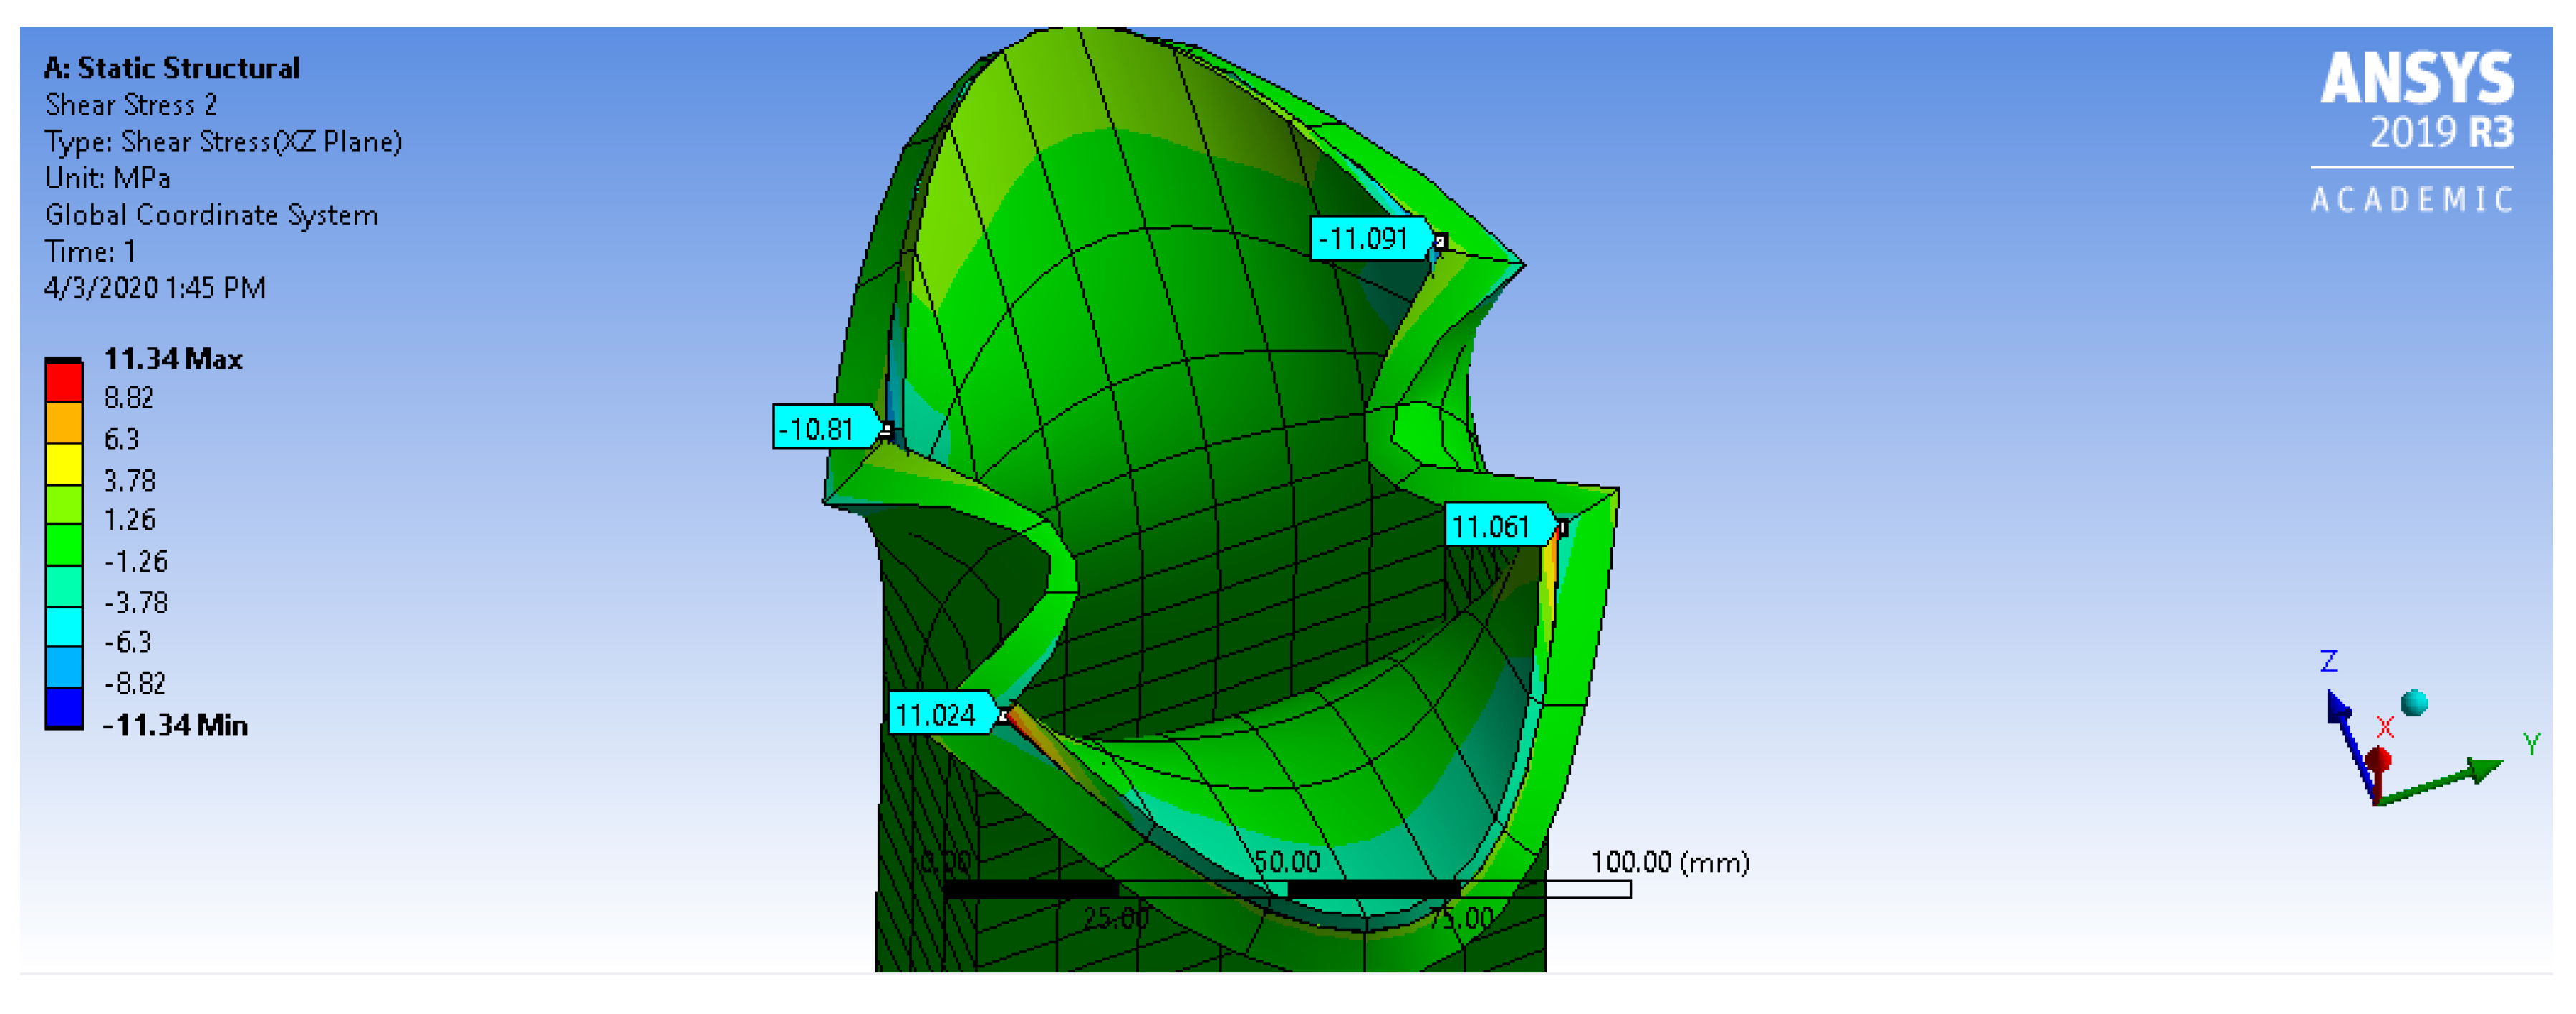
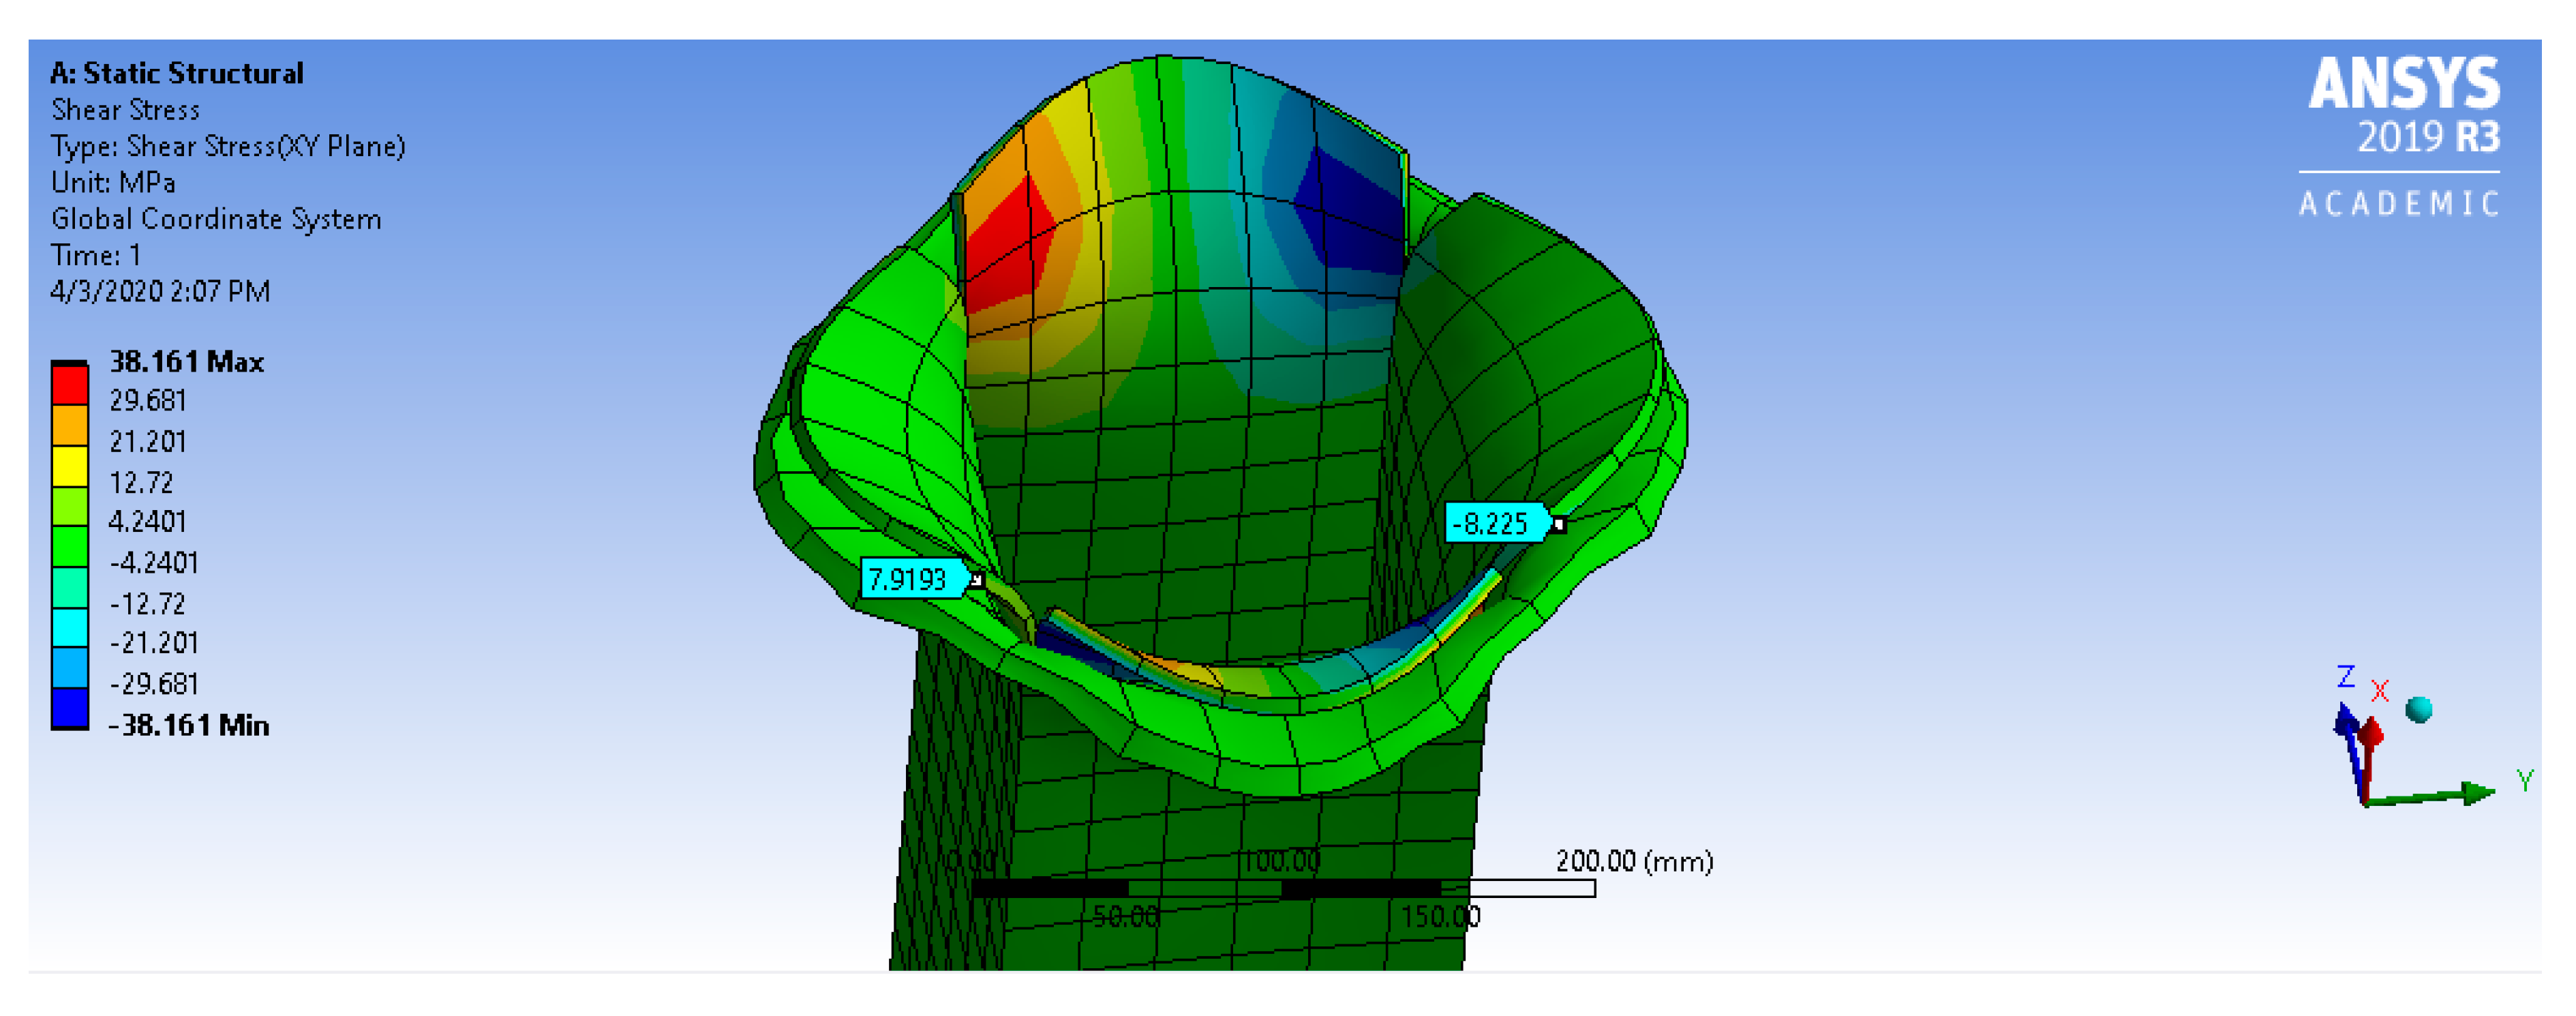
To make this determination, the shear stresses at the polymer-glass interface for the 2 × 4 stud equivalents were determined. For these sections, the shear stresses are shown in
Figure 17 and
Figure 18. In
Figure 17, the maximum shear stress is shown for the 89 × 38 × 3 × 1 GRCC at the weak-axis buckling loading of 4.43 kN.
In
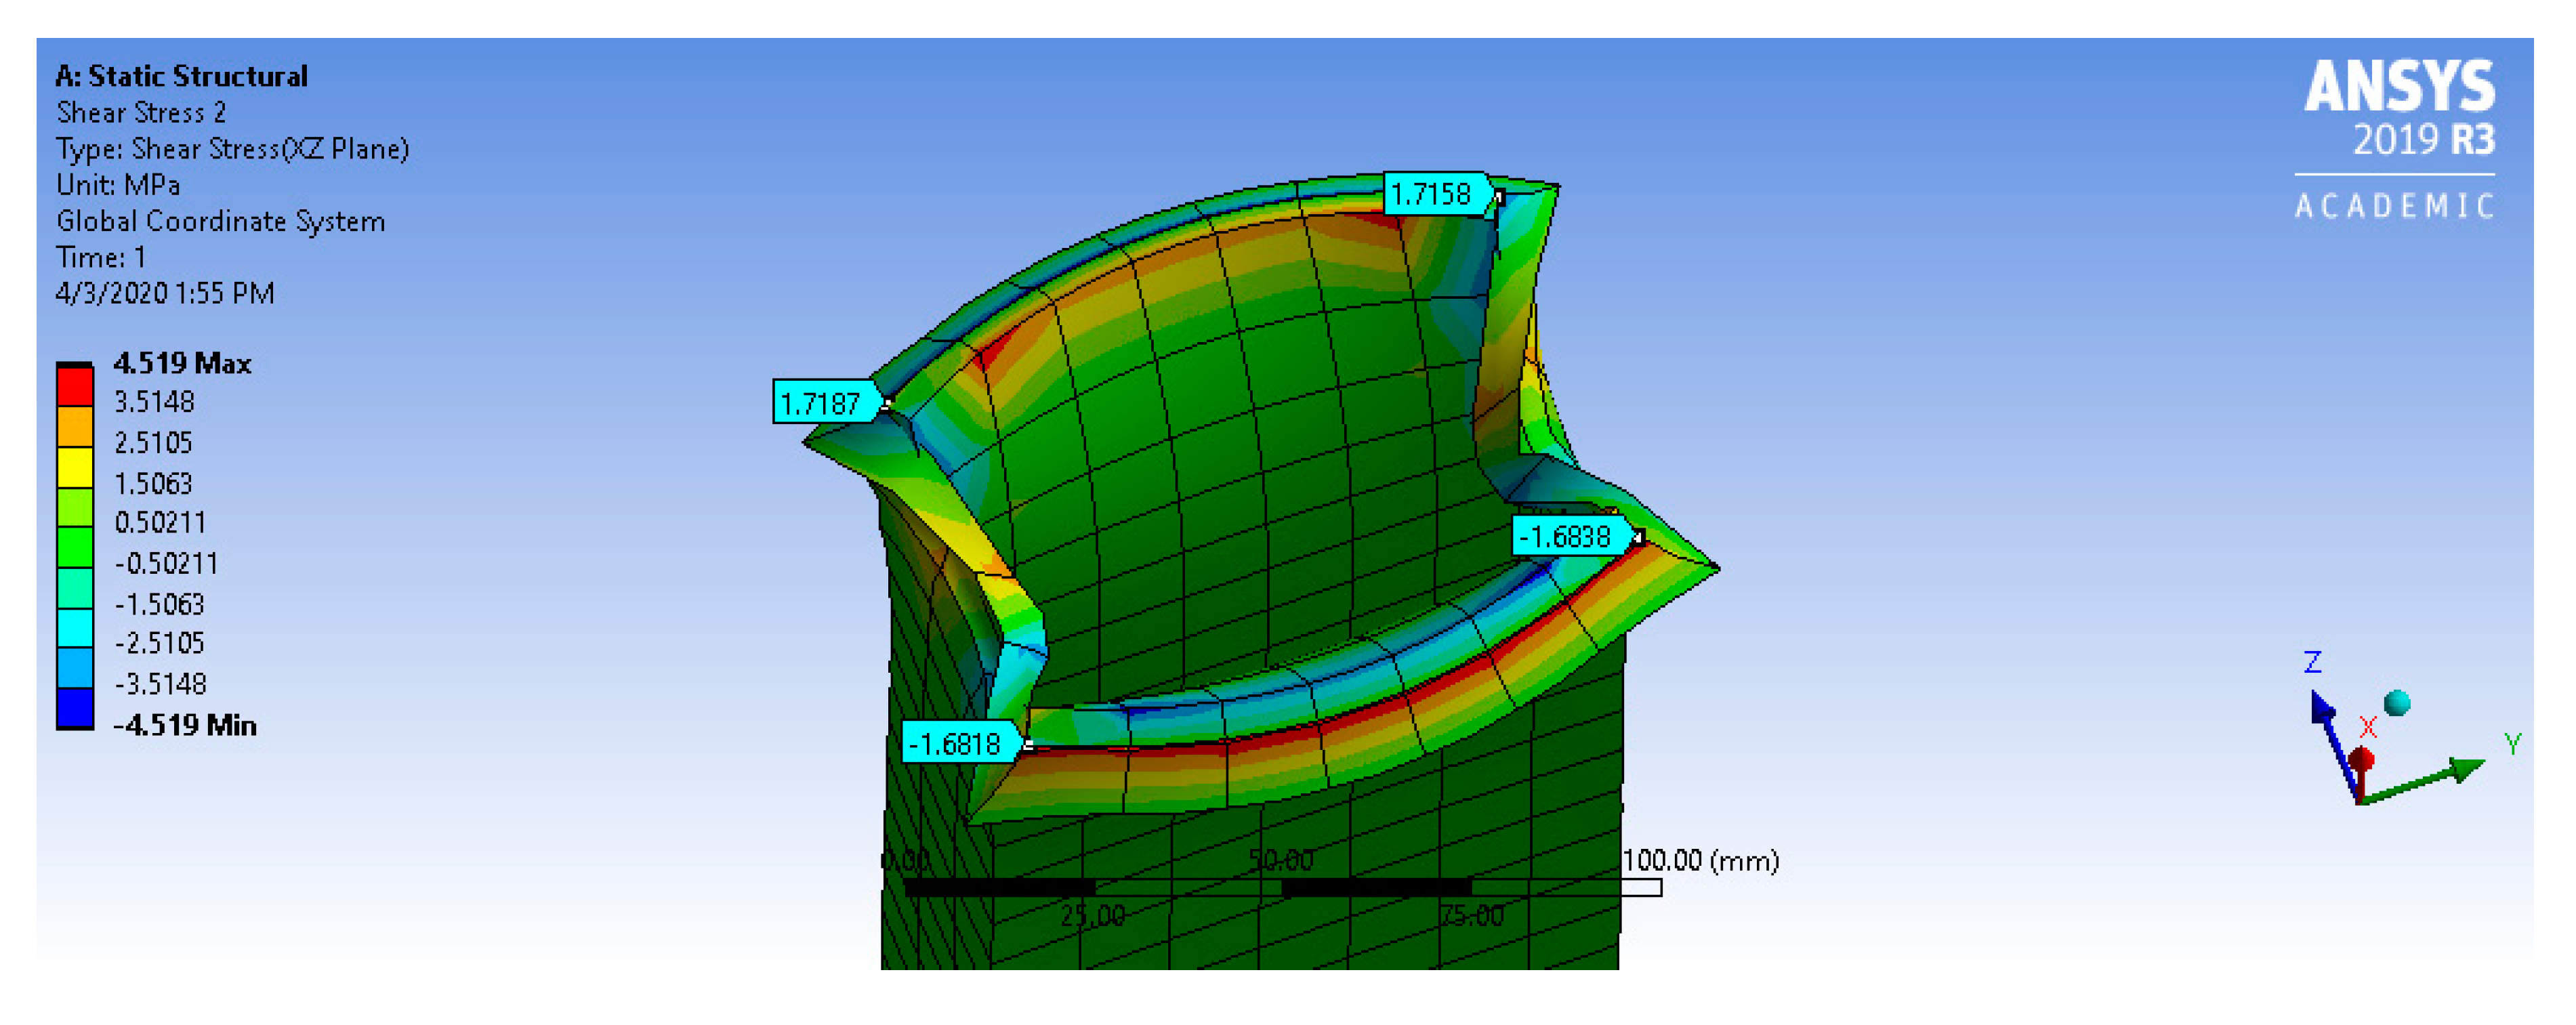
Figure 18, the shear stresses at the interface is shown for the 89 × 38 × 3 × 4 GRCC. This column is also loaded to its weak-axis failure loading of 12.0 kN. Note that the stresses in
Figure 18 are at most 1.7158 MPa, which is significantly smaller than the maximum shear stress of 11.091 MPa indicated in
Figure 17.
Similar to the previous two examples, a third (
Figure 19) is shown; this is the 150 × 150 × 3 × 3 GRCC at the buckling load. Note that these stresses are less than the worst case from
Figure 17 above.
So, the worst-case design is that of the 89x38x3x1, which if loaded in the strong axis, the shear stress would become 30.69 MPa (as the ratio between the weak and strong axis buckling loads is 2.77:1).
These stresses are within the acceptable limits for typical sizing agents. For instance, Reference [
29] indicated that interfacial shear stresses up to 44 MPa are possible, with 32 MPa being the lower limit of their samples.
8. Conclusions
Glass-reinforced composite columns (GRCCs) were investigated from a cost standpoint, to determine if GRCCs could be constructed at a cost that lower than competing structural materials. GRCCs, when constructed to compete against No. 3 grade Douglas fir, can provide comparable buckling loads while costing 11% less than the equivalent timber. Additionally, it was found that GRCCs can provide up to 50% cost savings over equivalent steel columns, although GRCCs tend to have lower buckling loads for their overall dimensions. This means in applications where size limitations are stringent, steel will likely be three superior choice, but this is dependent on a number of factors.
These cost estimates were based on an assumed factor of 40% for the manufacturing costs for the intended to be over jacketing extruded sections [
25]. This assumption may be inaccurate, al though no cost estimation alternative has been found. Additionally, this paper assumed that appropriate bond strengths could be developed between the glass plates and the polymers, a requirement for bonding the glass to the exterior sleeve of polymer. This is possible using sizing agents, chemicals utilized by the glass-fibers industry, although the costs are not reflected in the estimated costs presented. While specific sizing agent interfacial shear stresses for HDPE have not been researched, the interfacial shear stresses of similar use (for epoxies) have strengths that are within the stresses presented in this paper.
The paper concluded with remarks about how increasing glass reinforcement aids in increasing the buckling loads of the GRCCs, but only to a point. Also, a condition of local buckling failure in which the polymers were unsuccessful in securing the glass plates was found when glass thicknesses decreased excessively.
