The Synergic Effects of FDM 3D Printing Parameters on Mechanical Behaviors of Bronze Poly Lactic Acid Composites


Abstract
1. Introduction
2. Experimental Design and Methodology
2.1. Response Surface Method
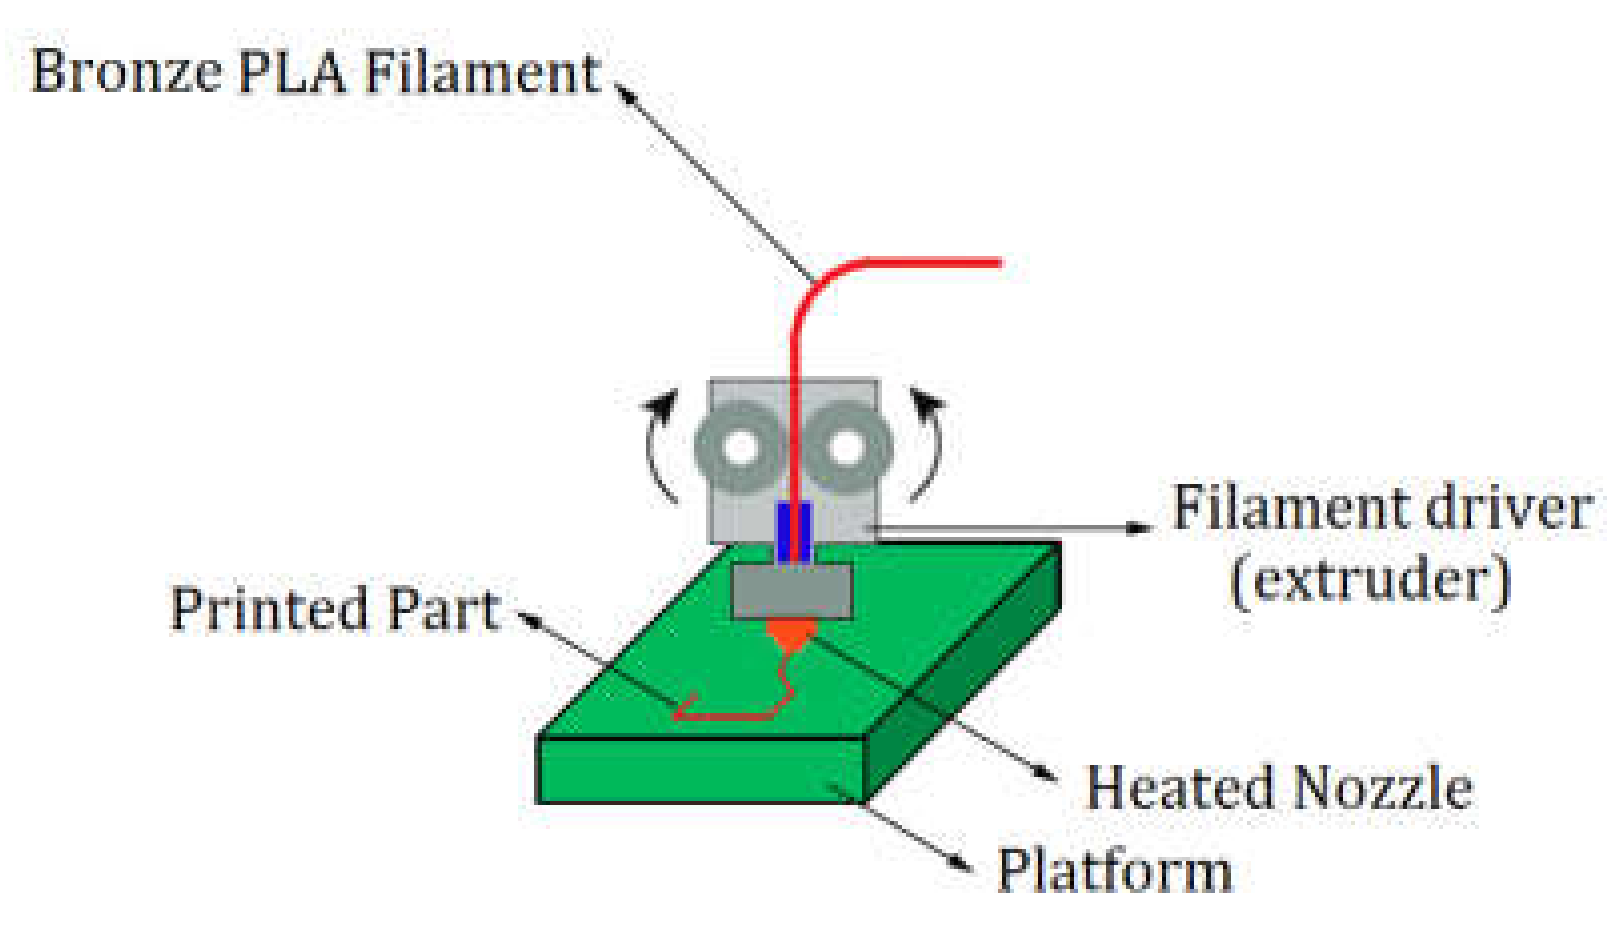
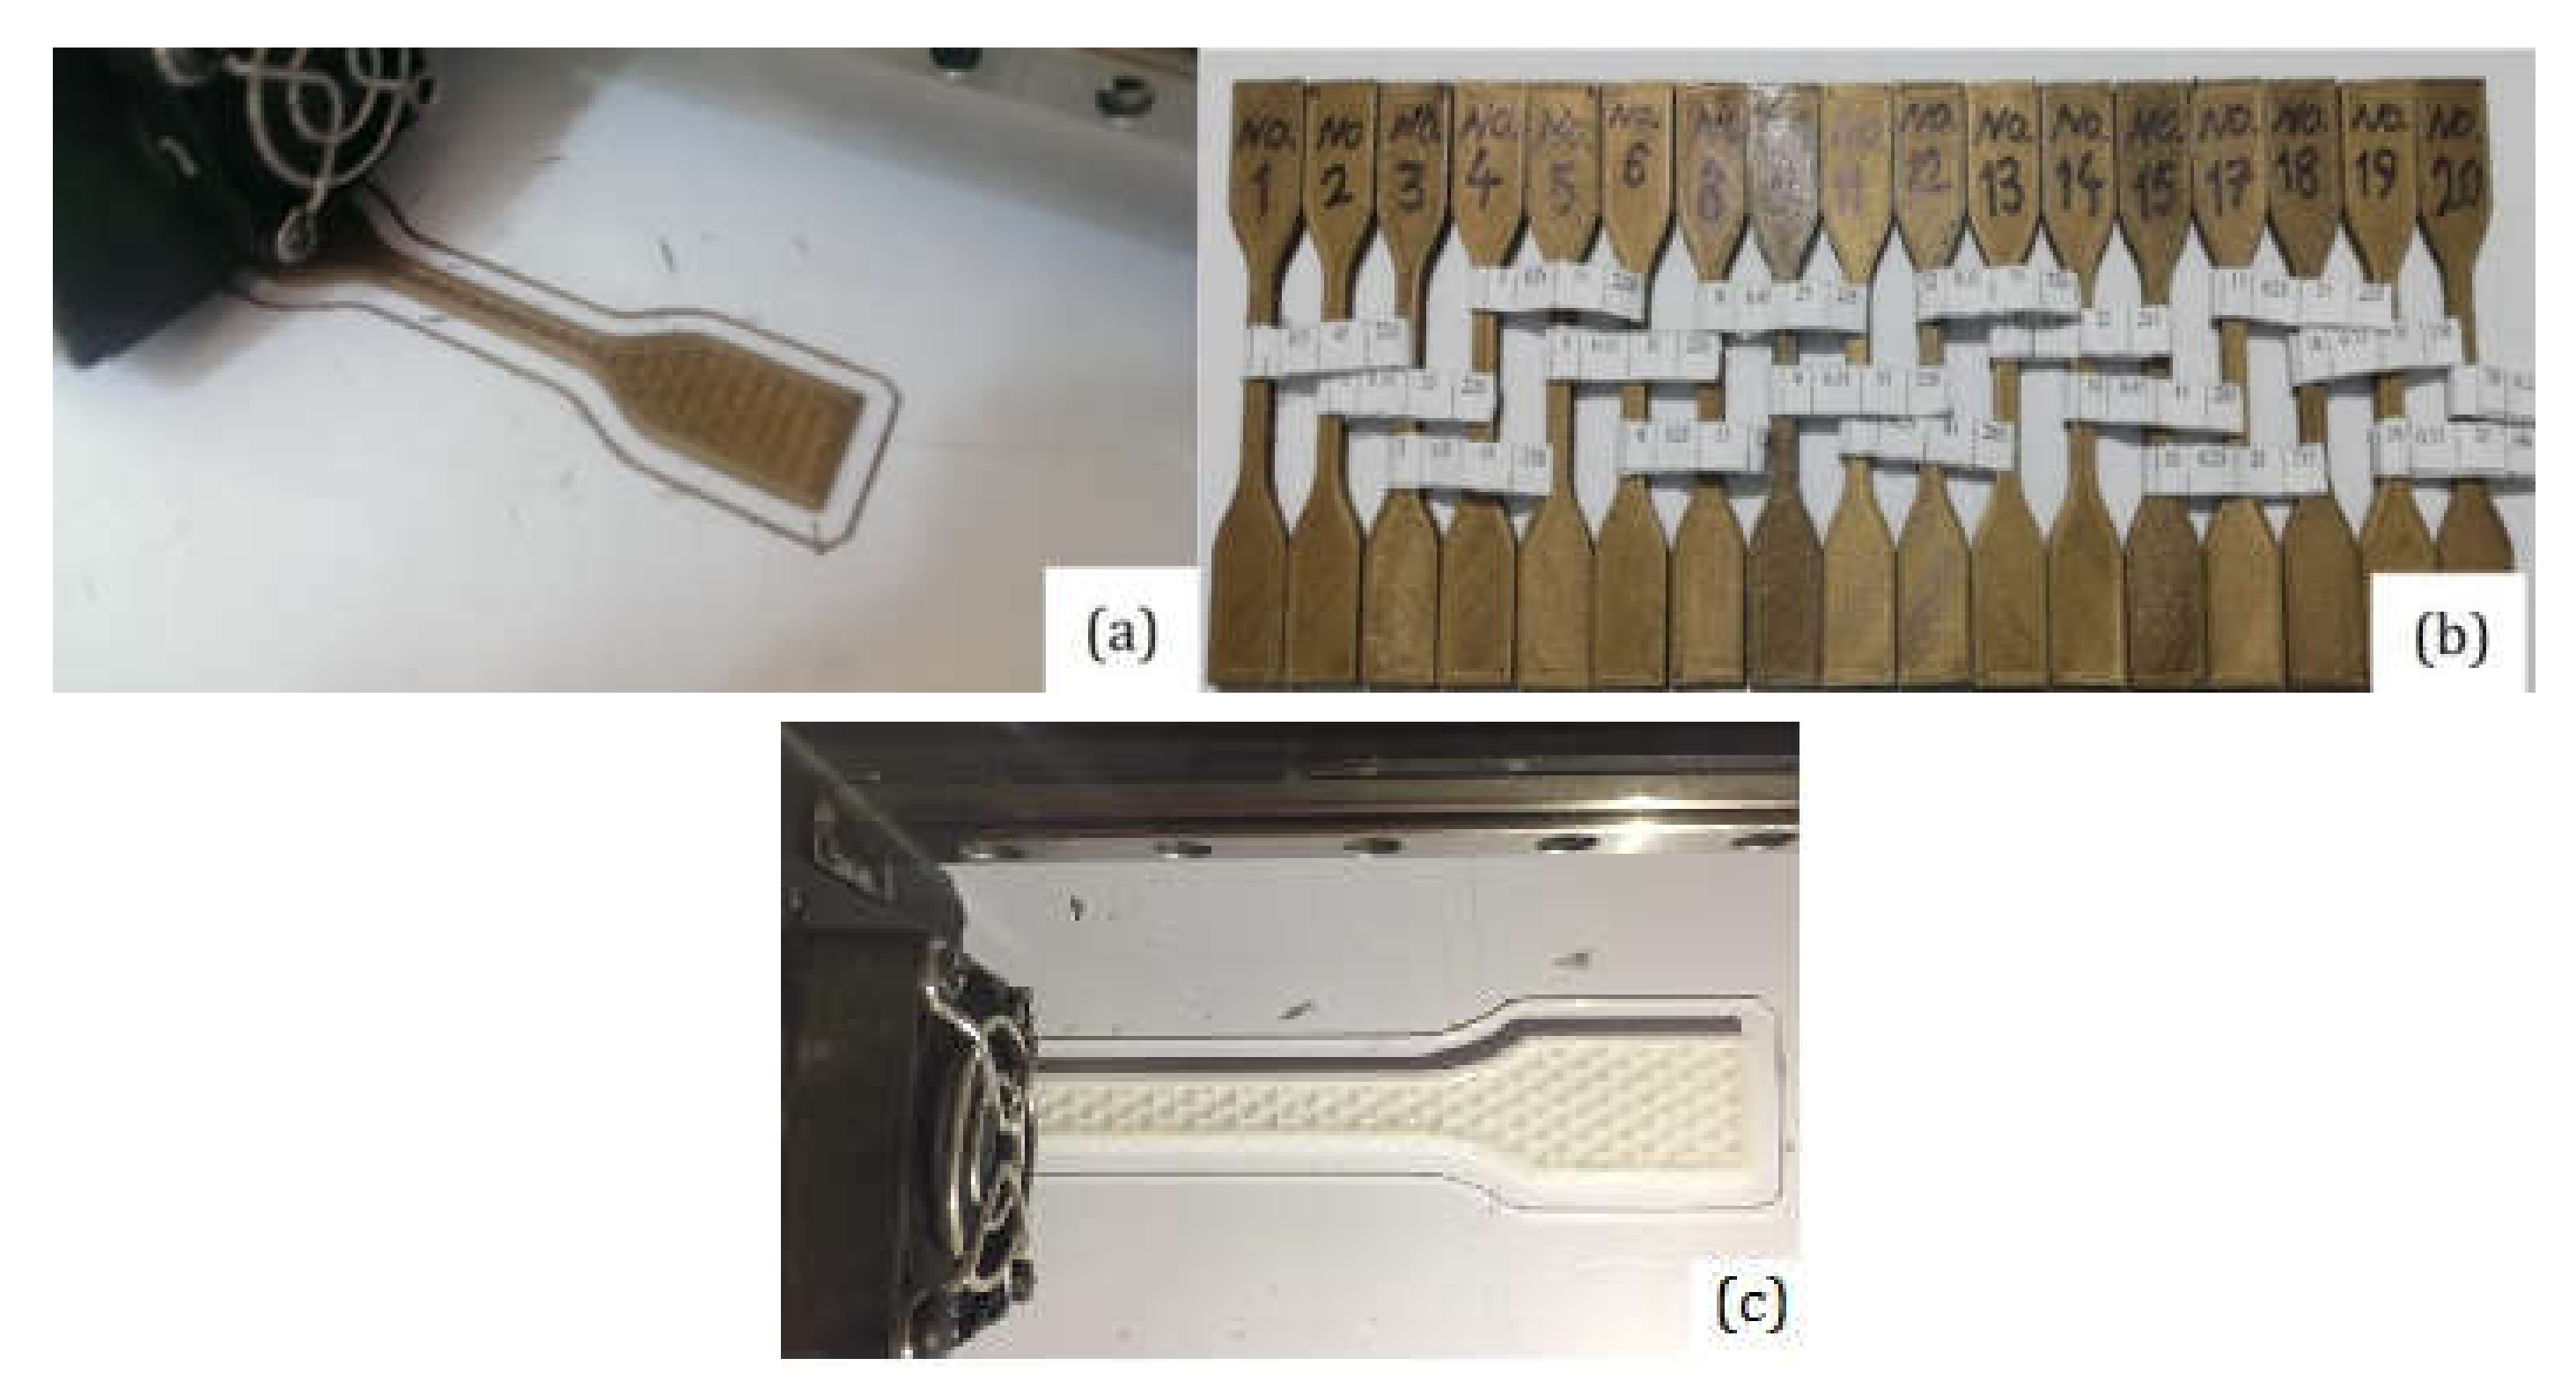
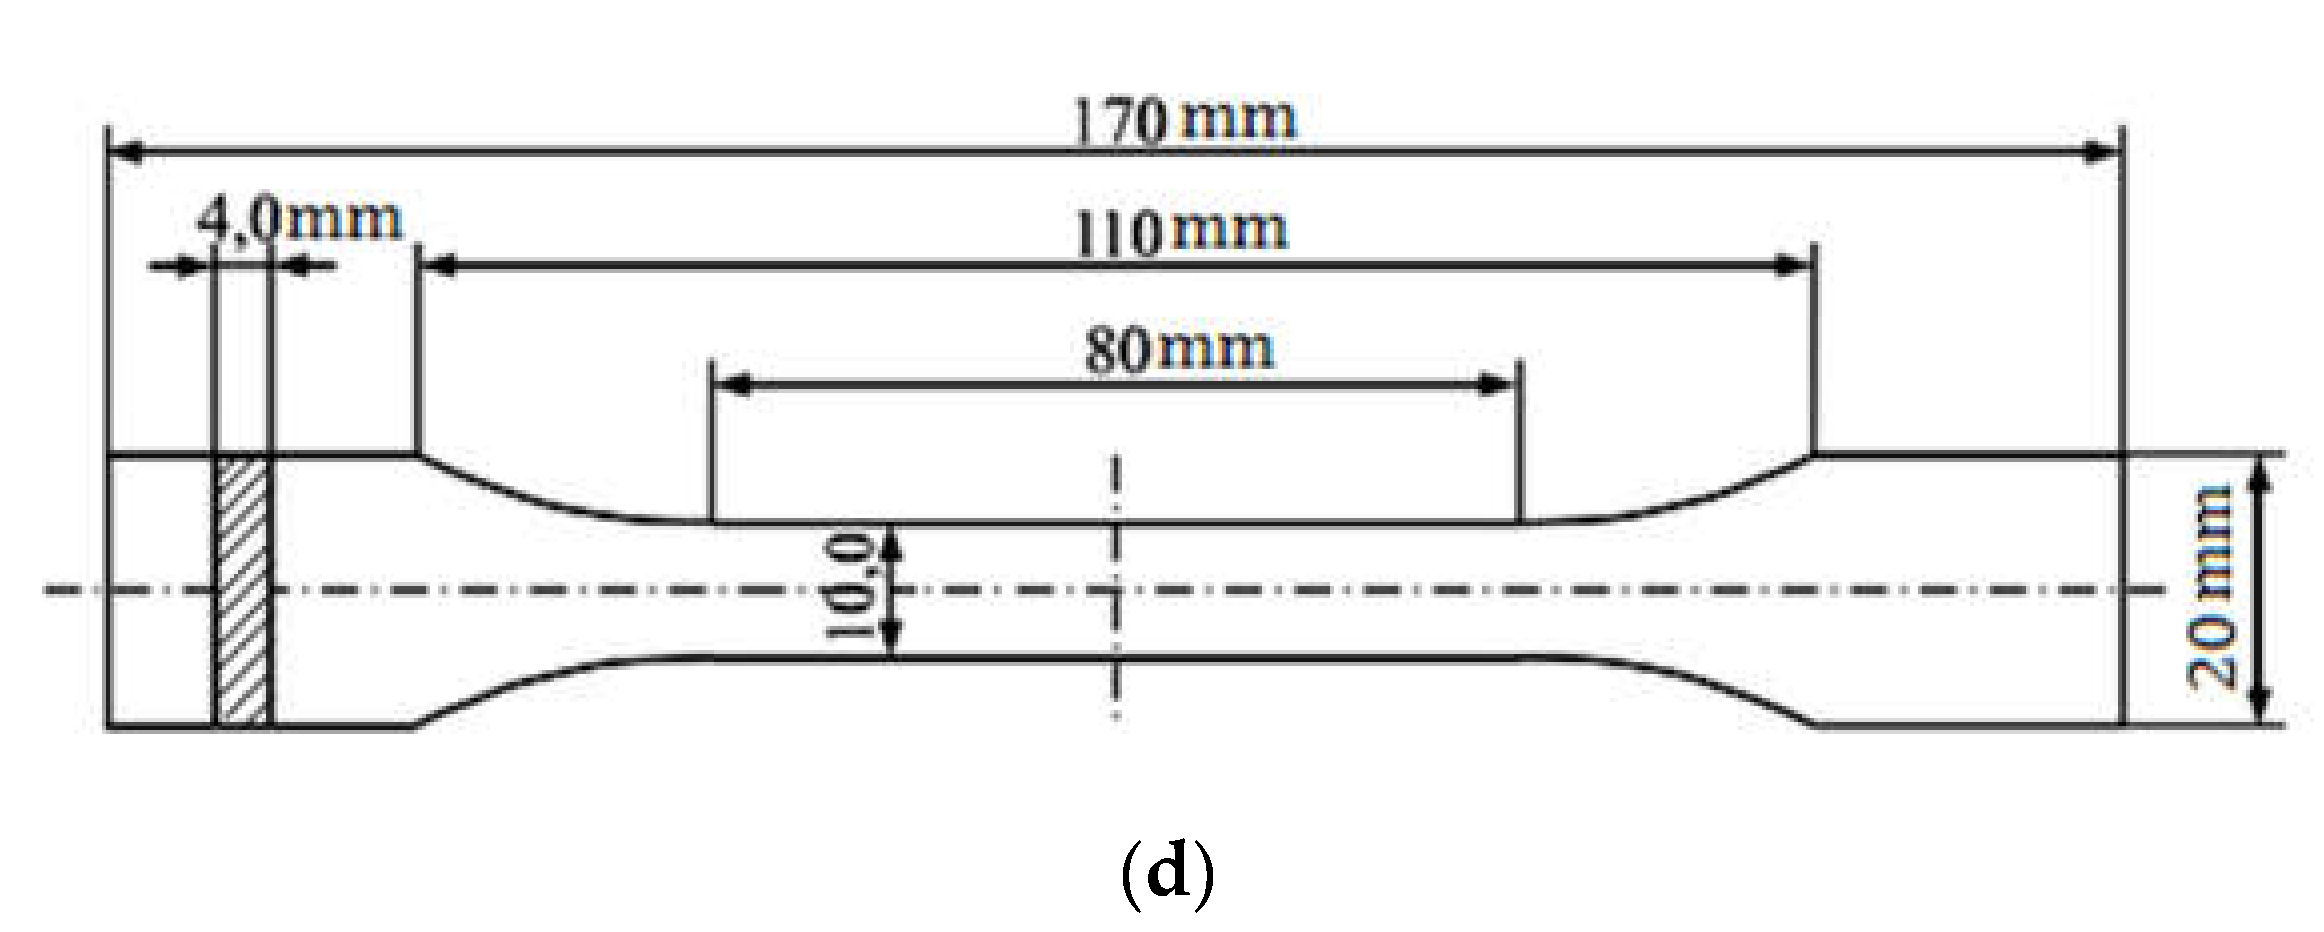
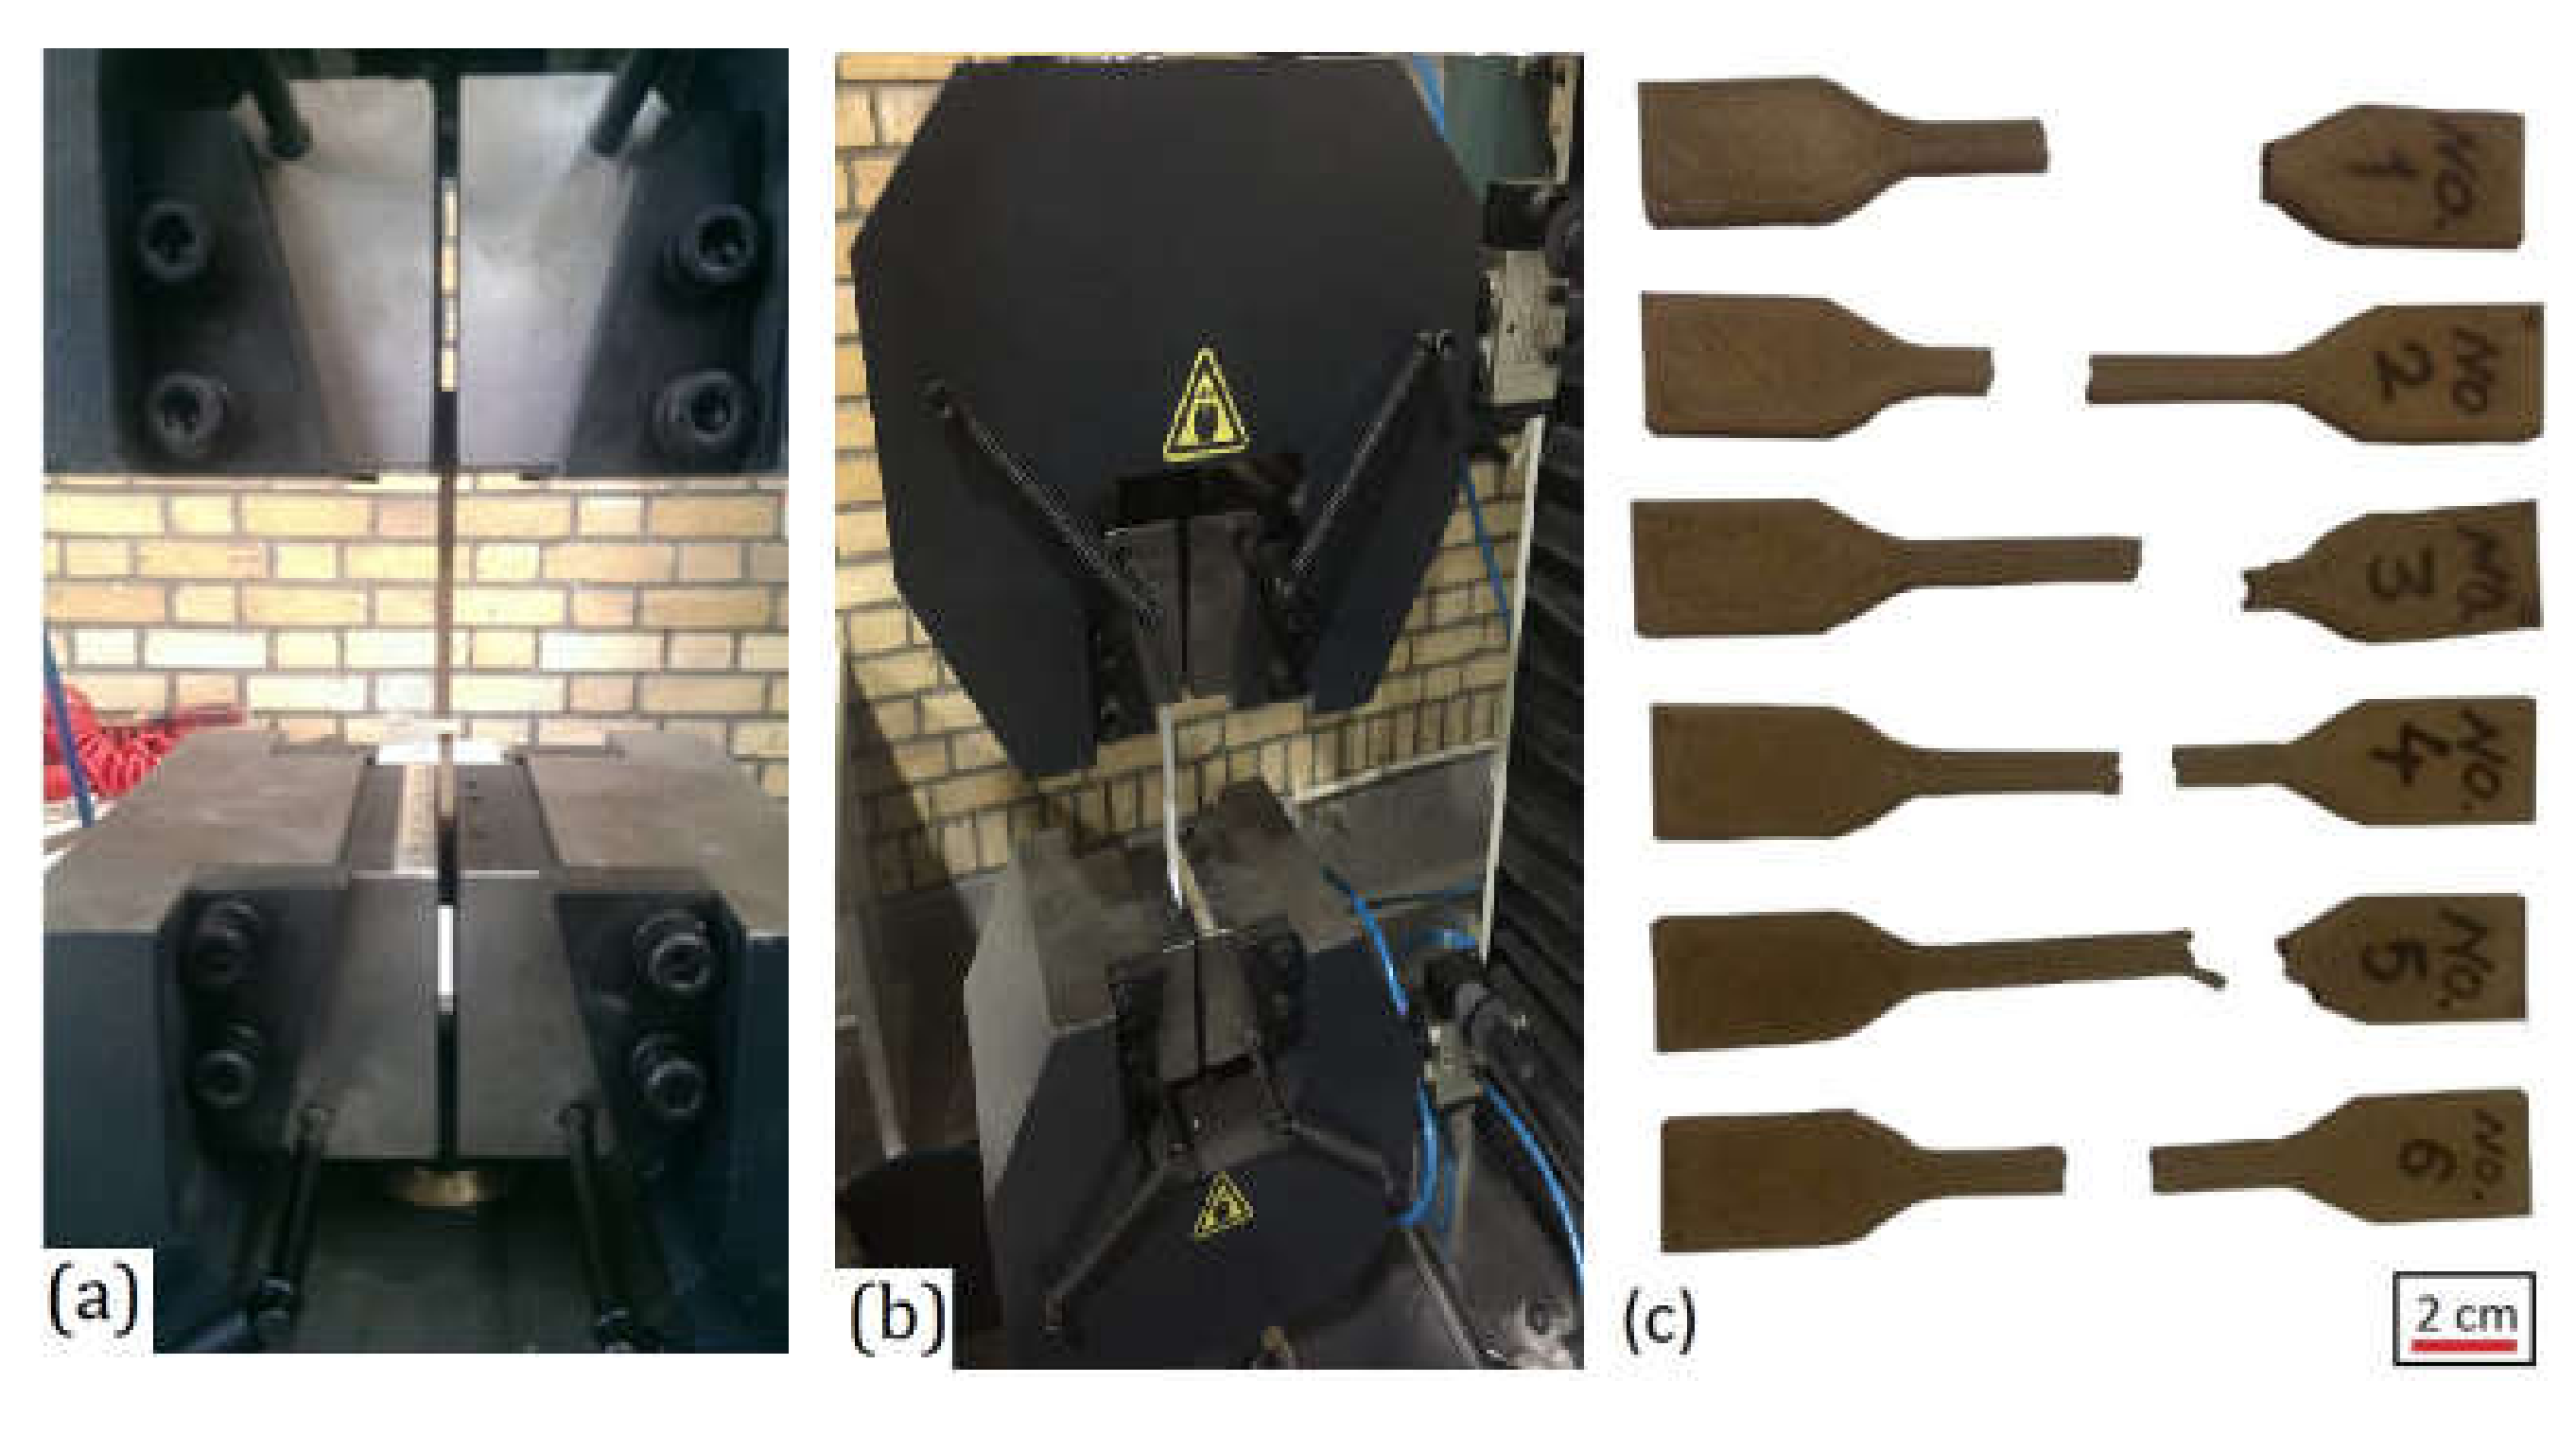
2.2. Experimental Work
3. Results and Discussion
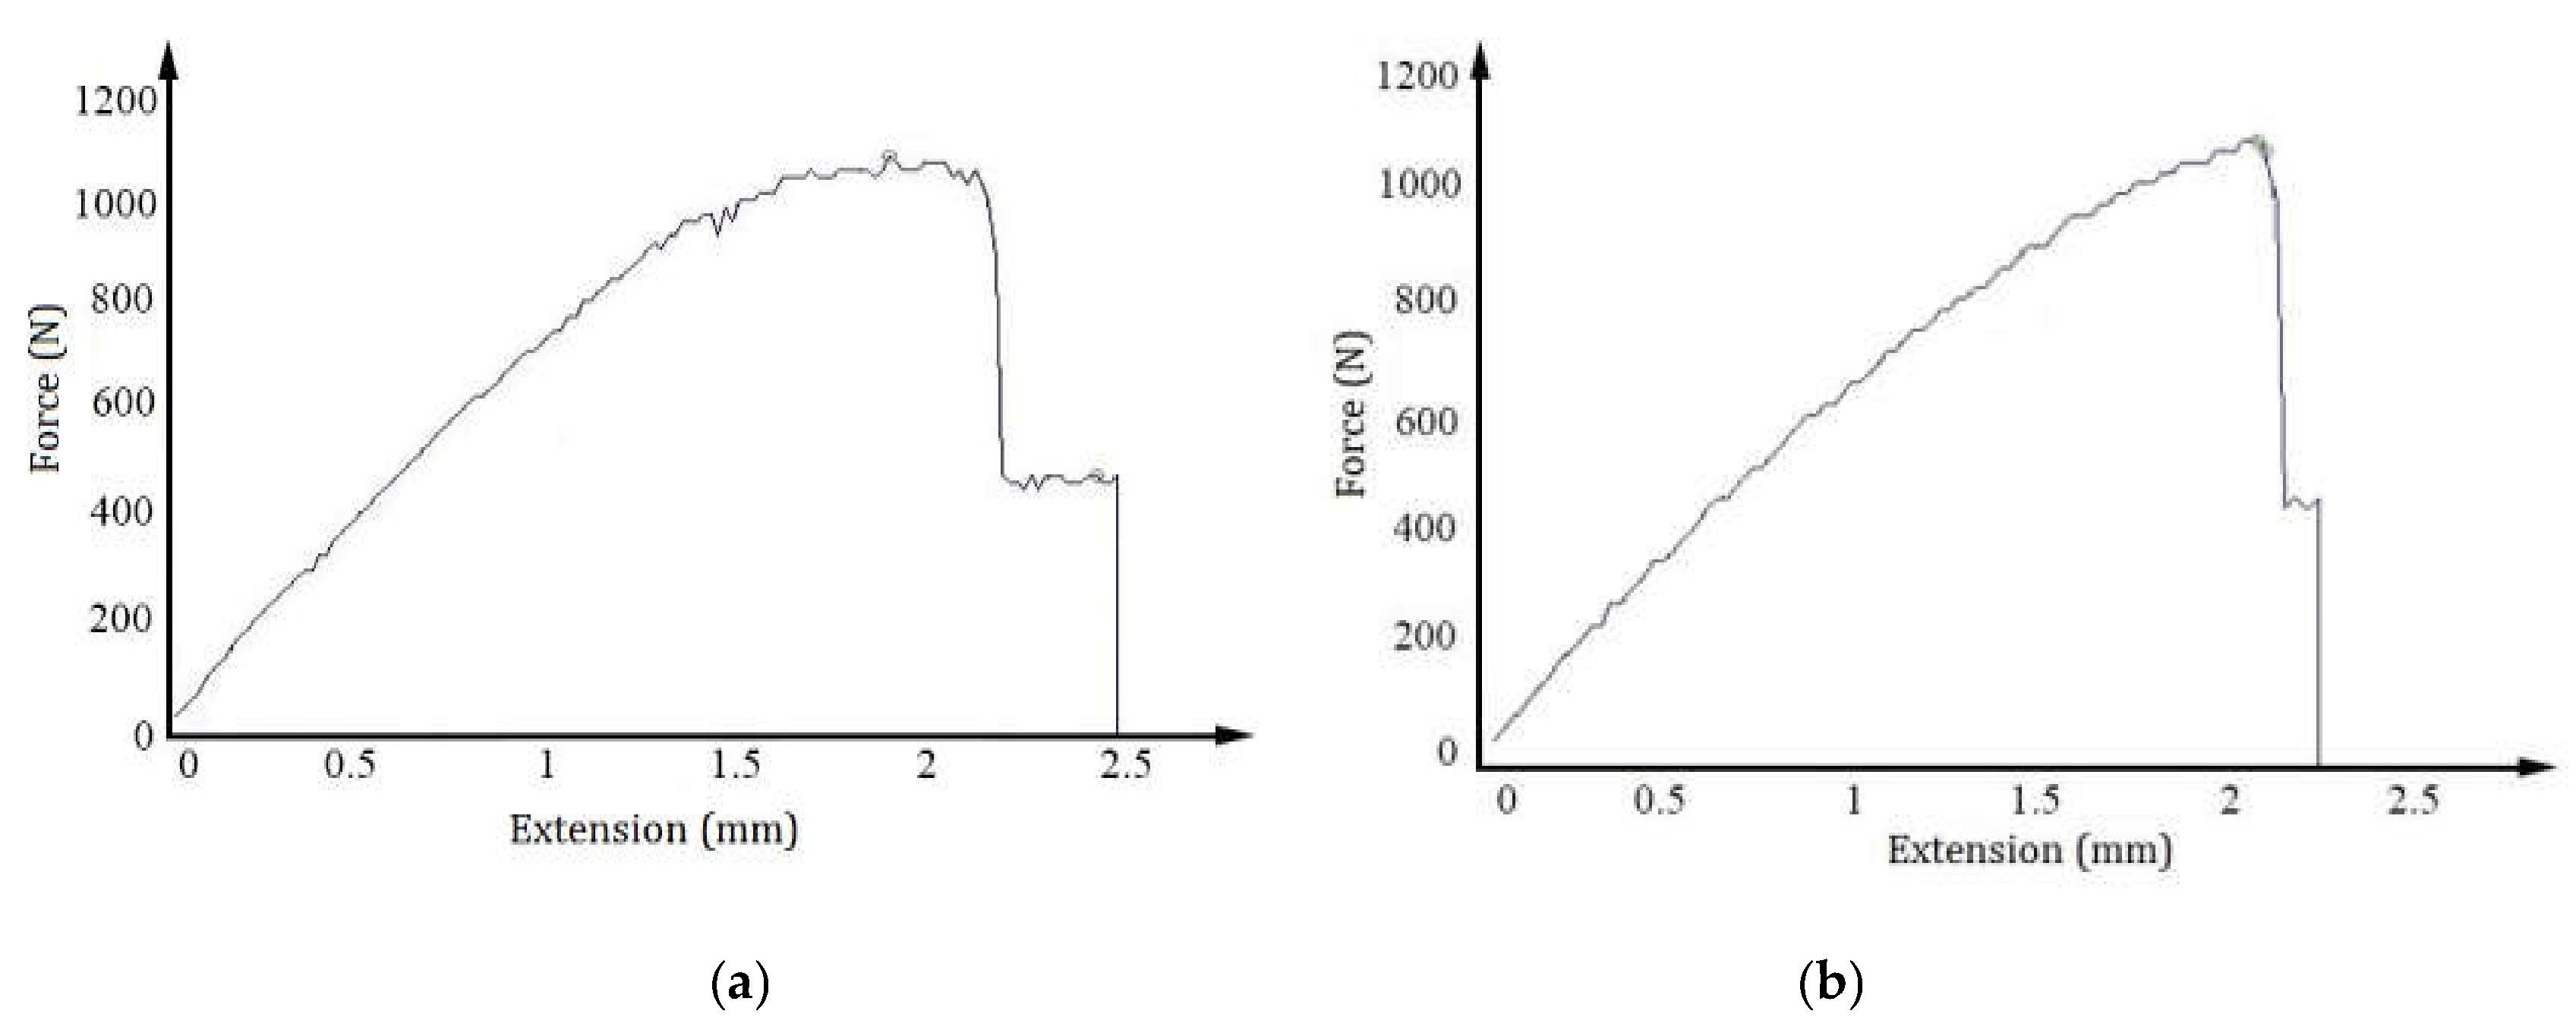
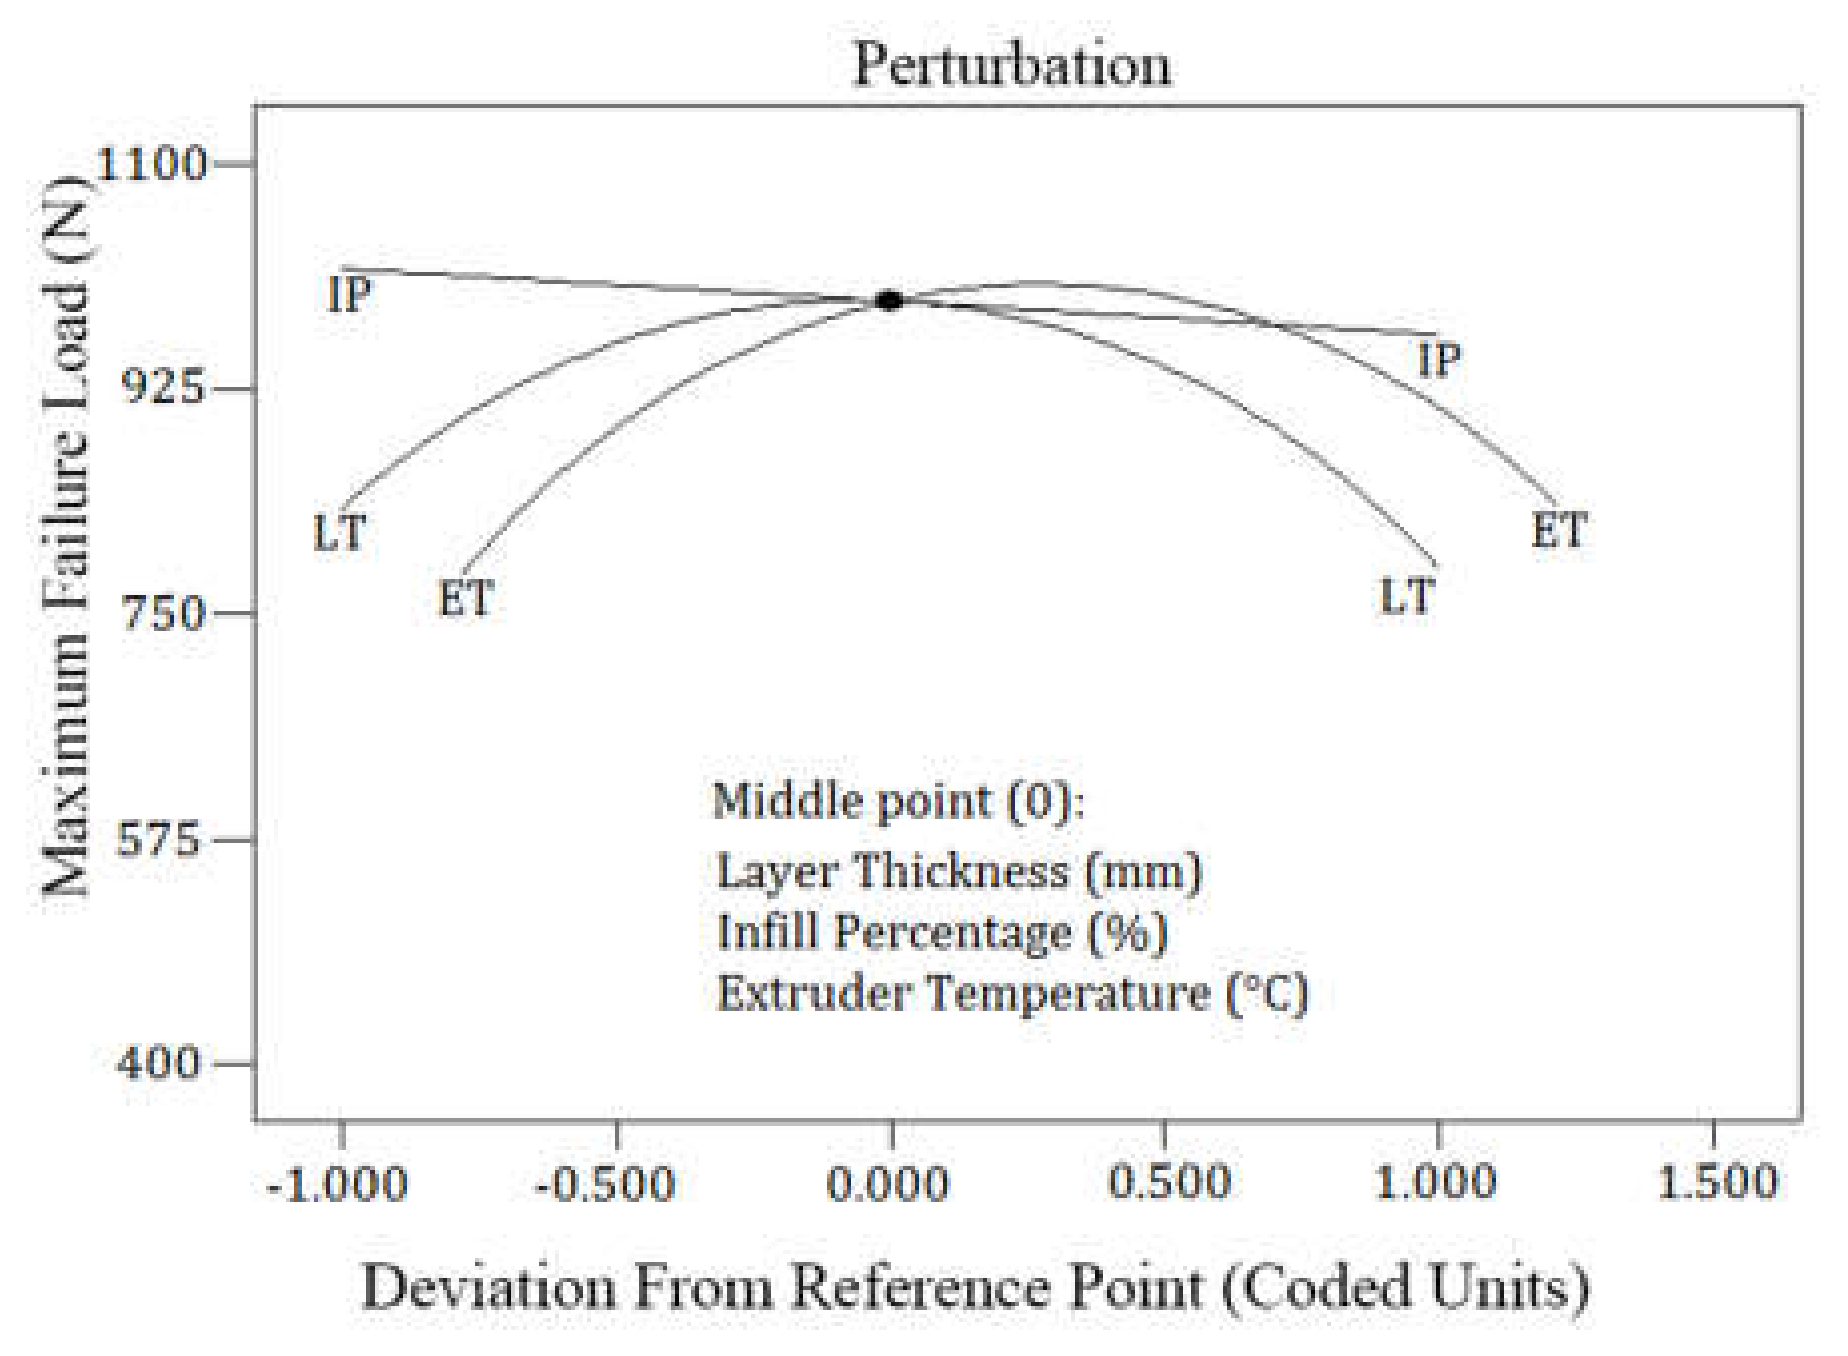
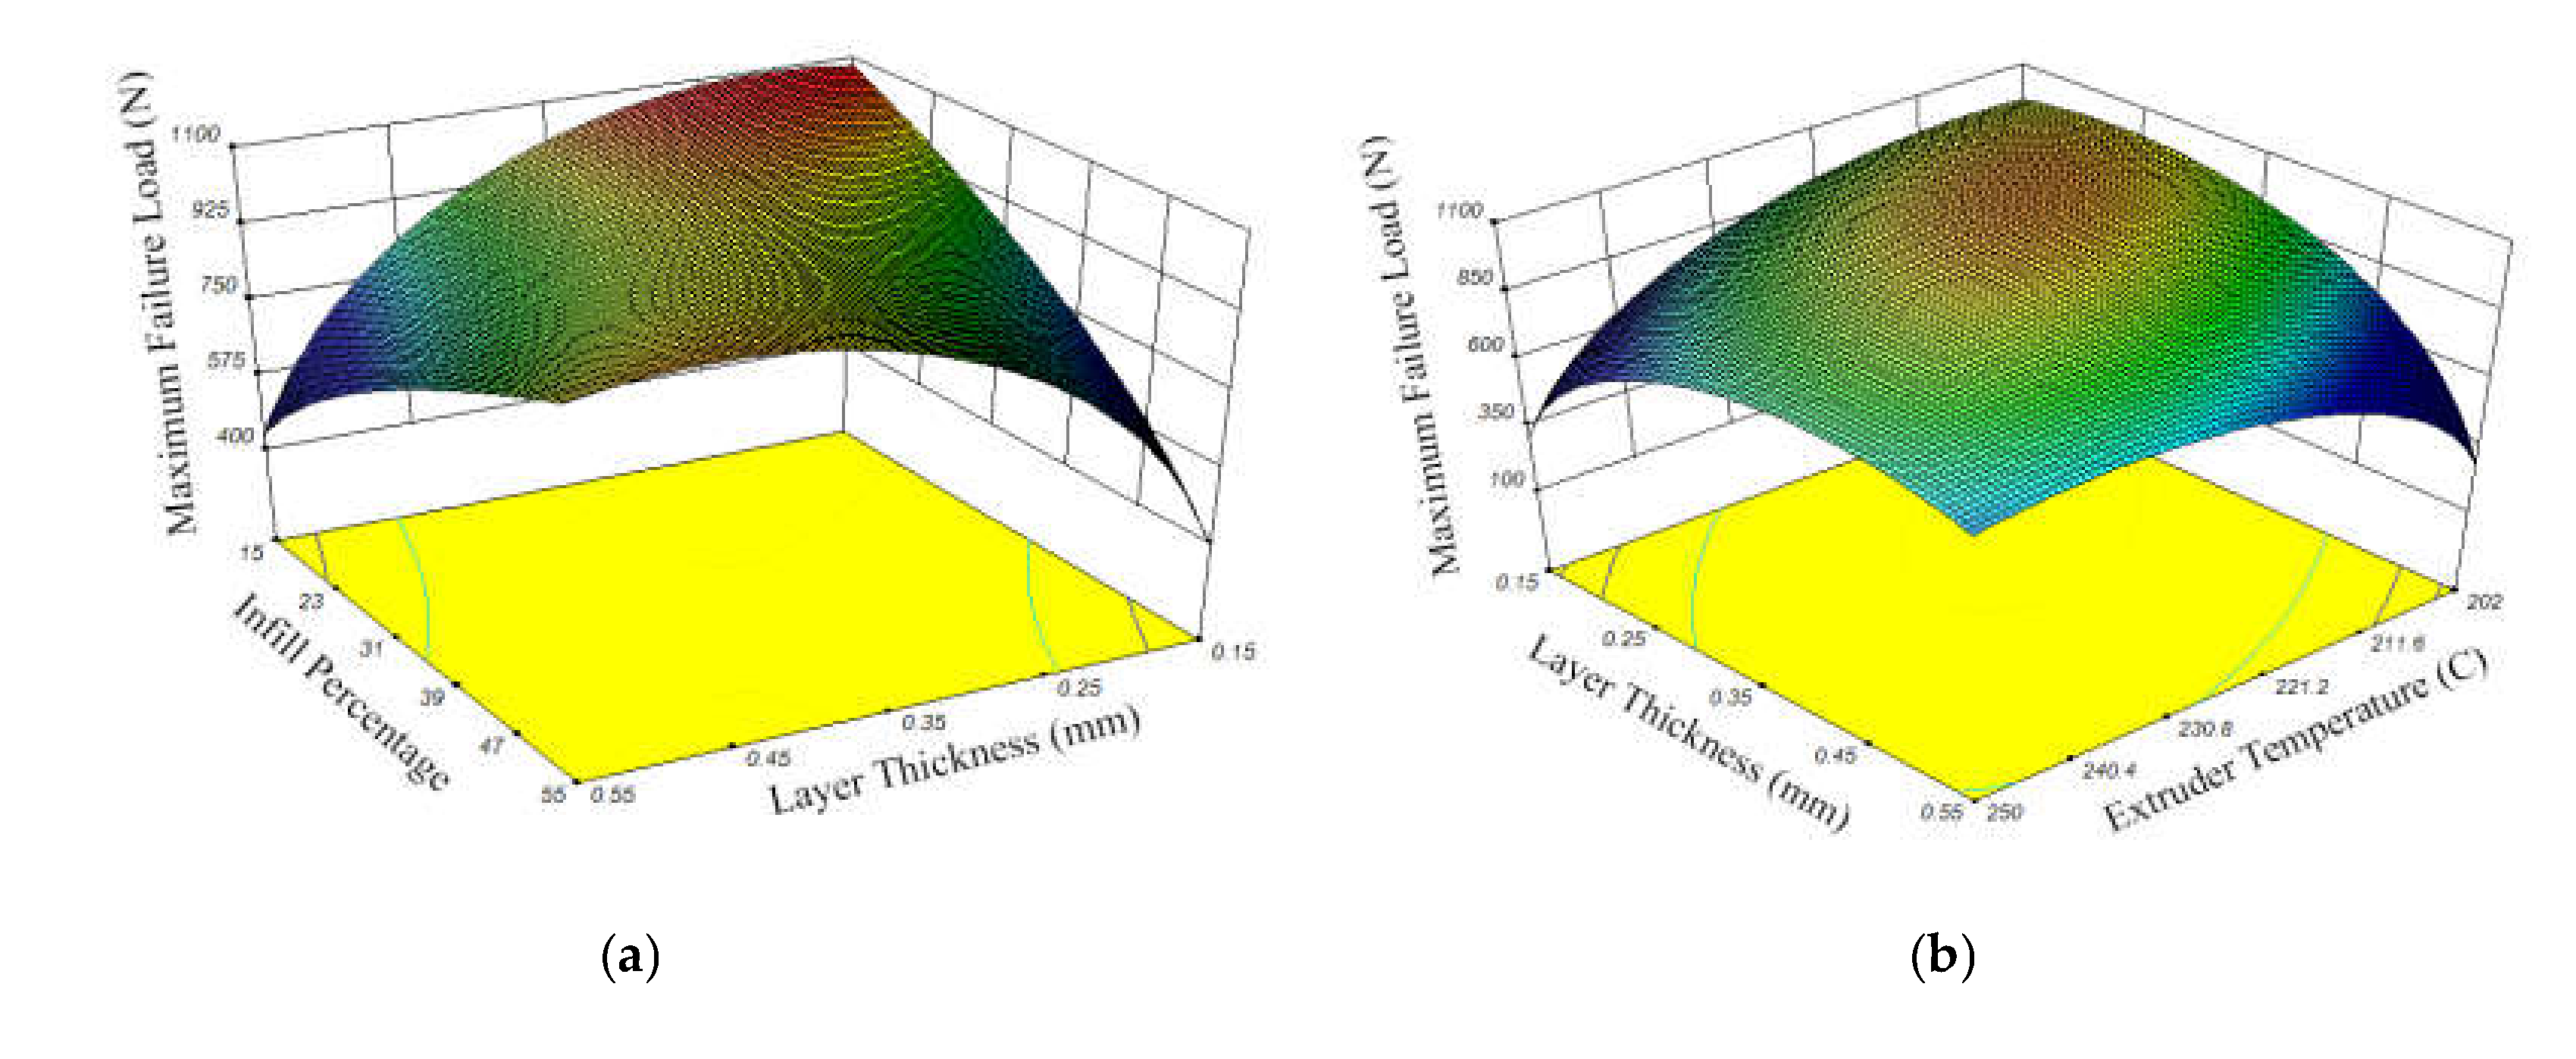
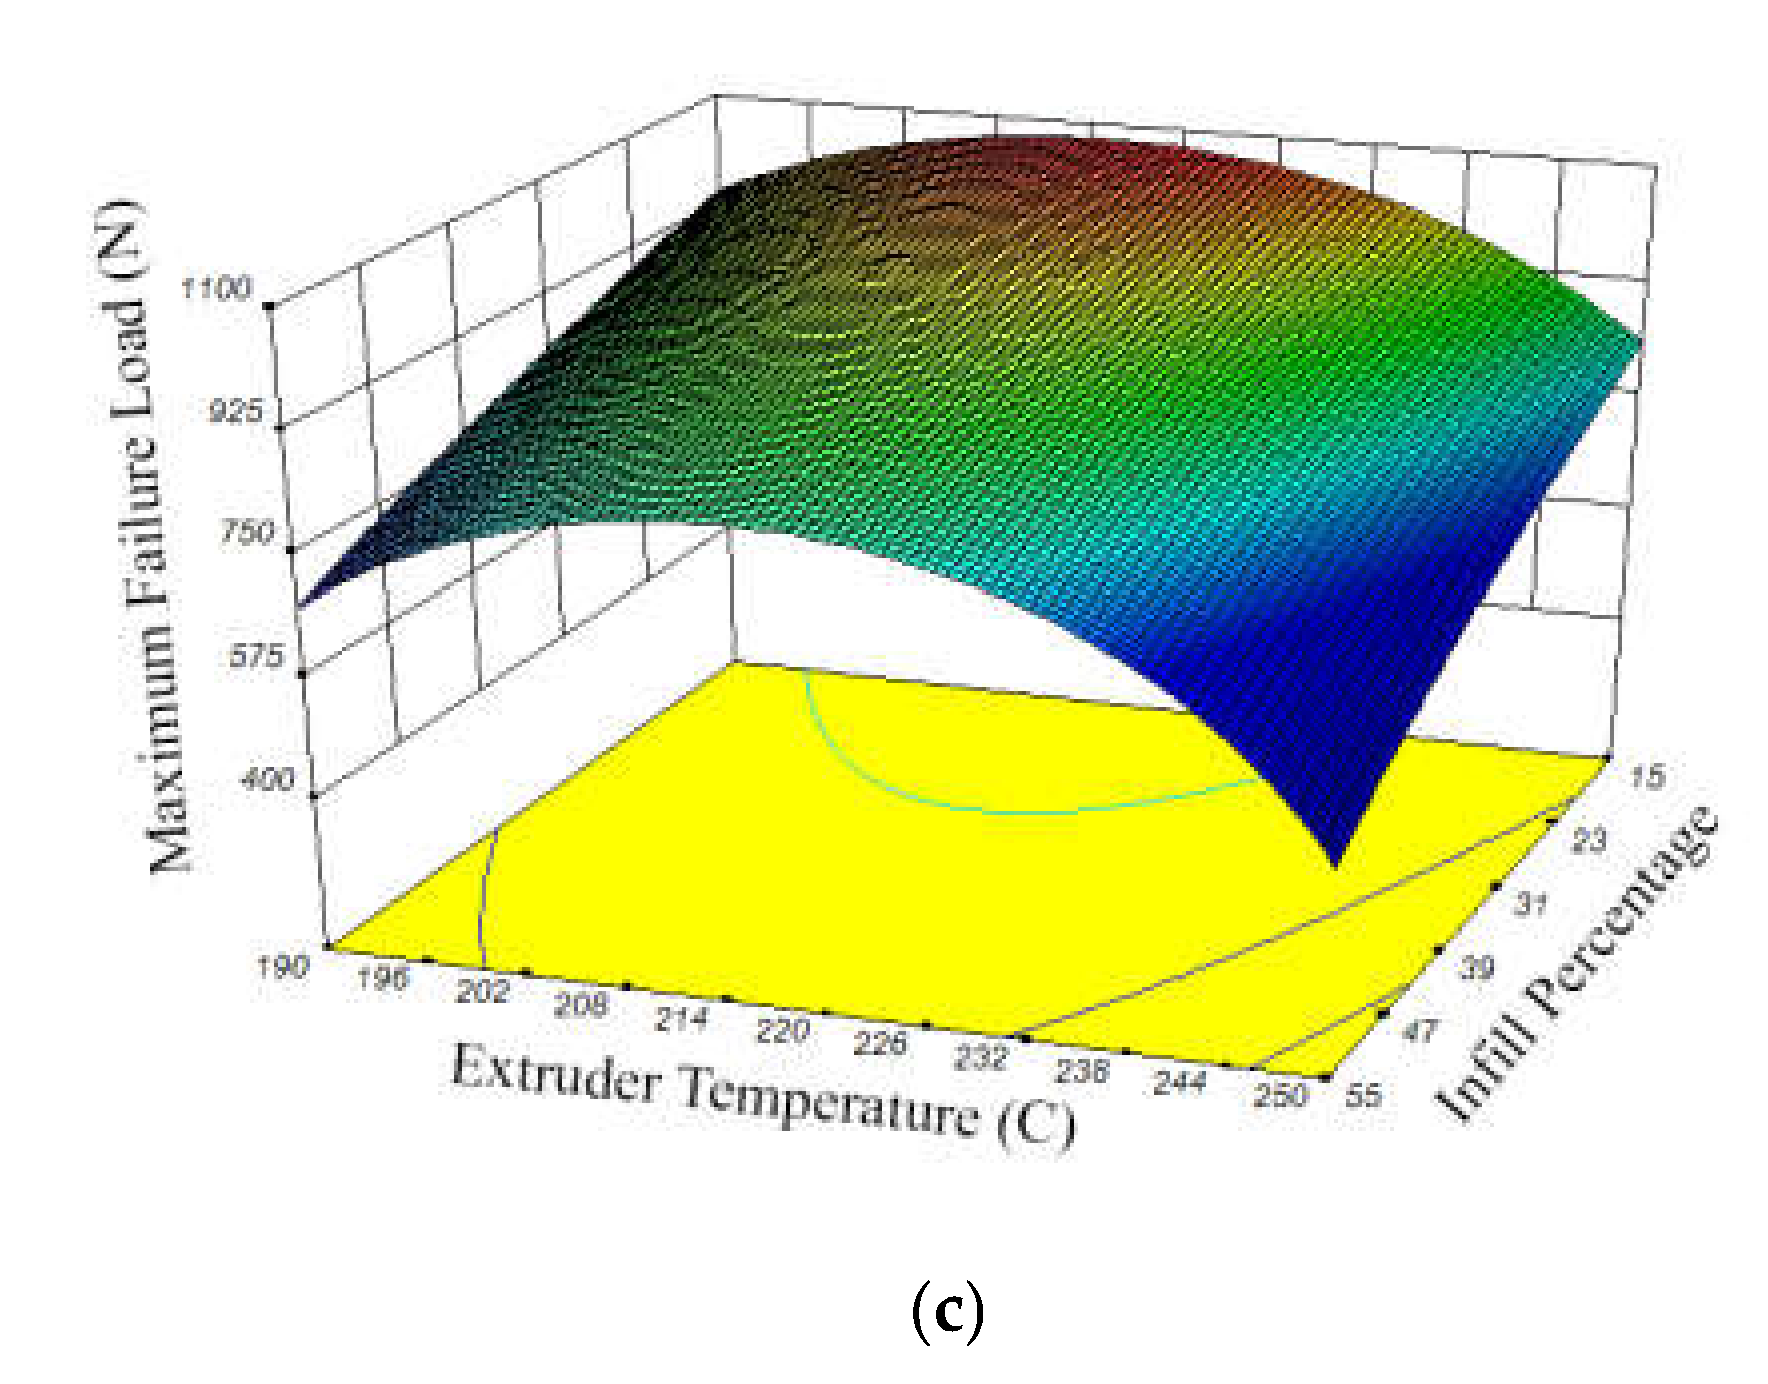
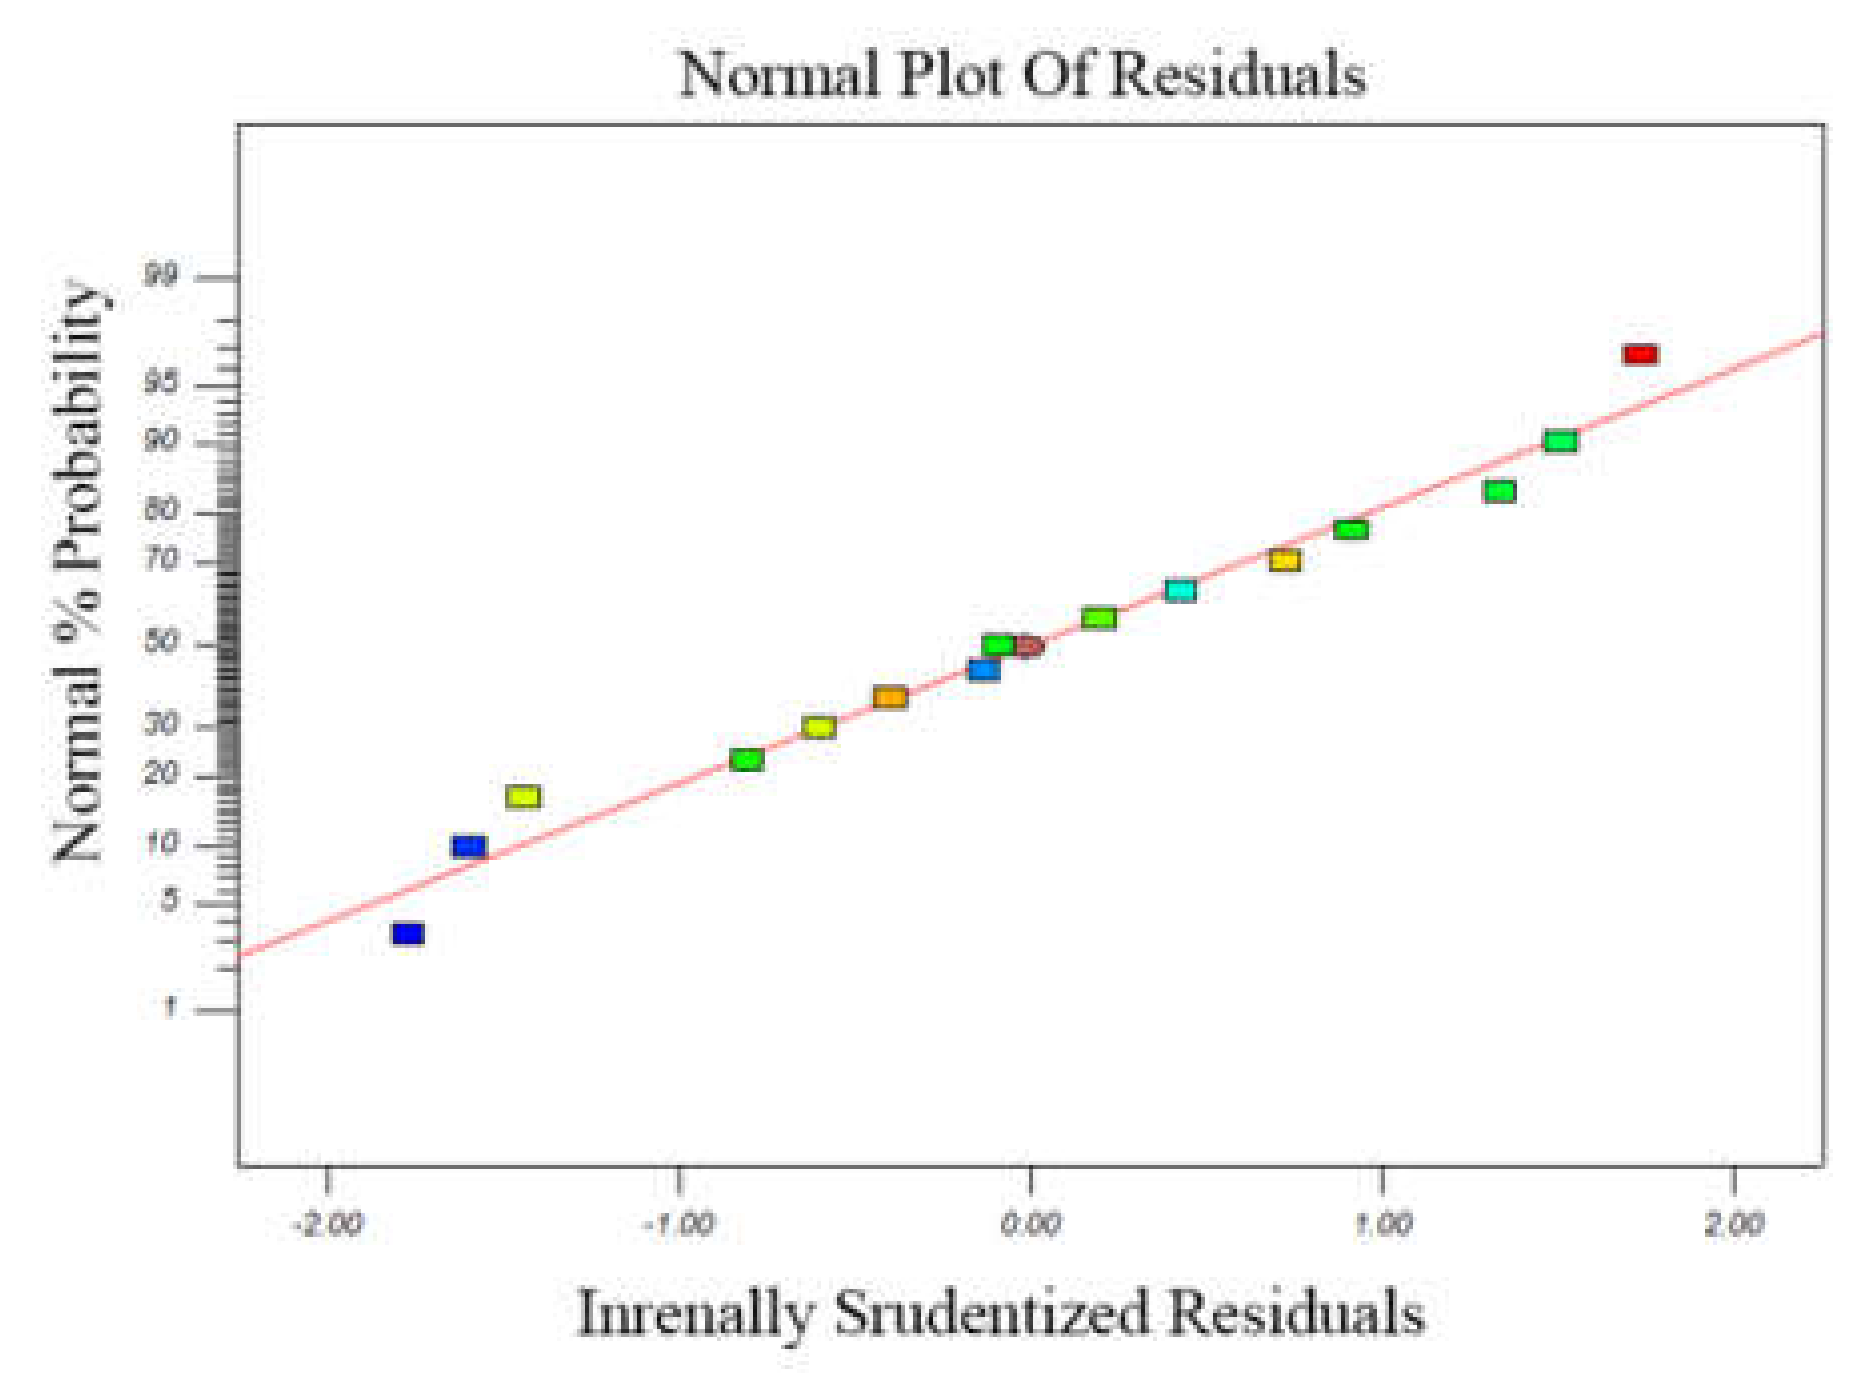
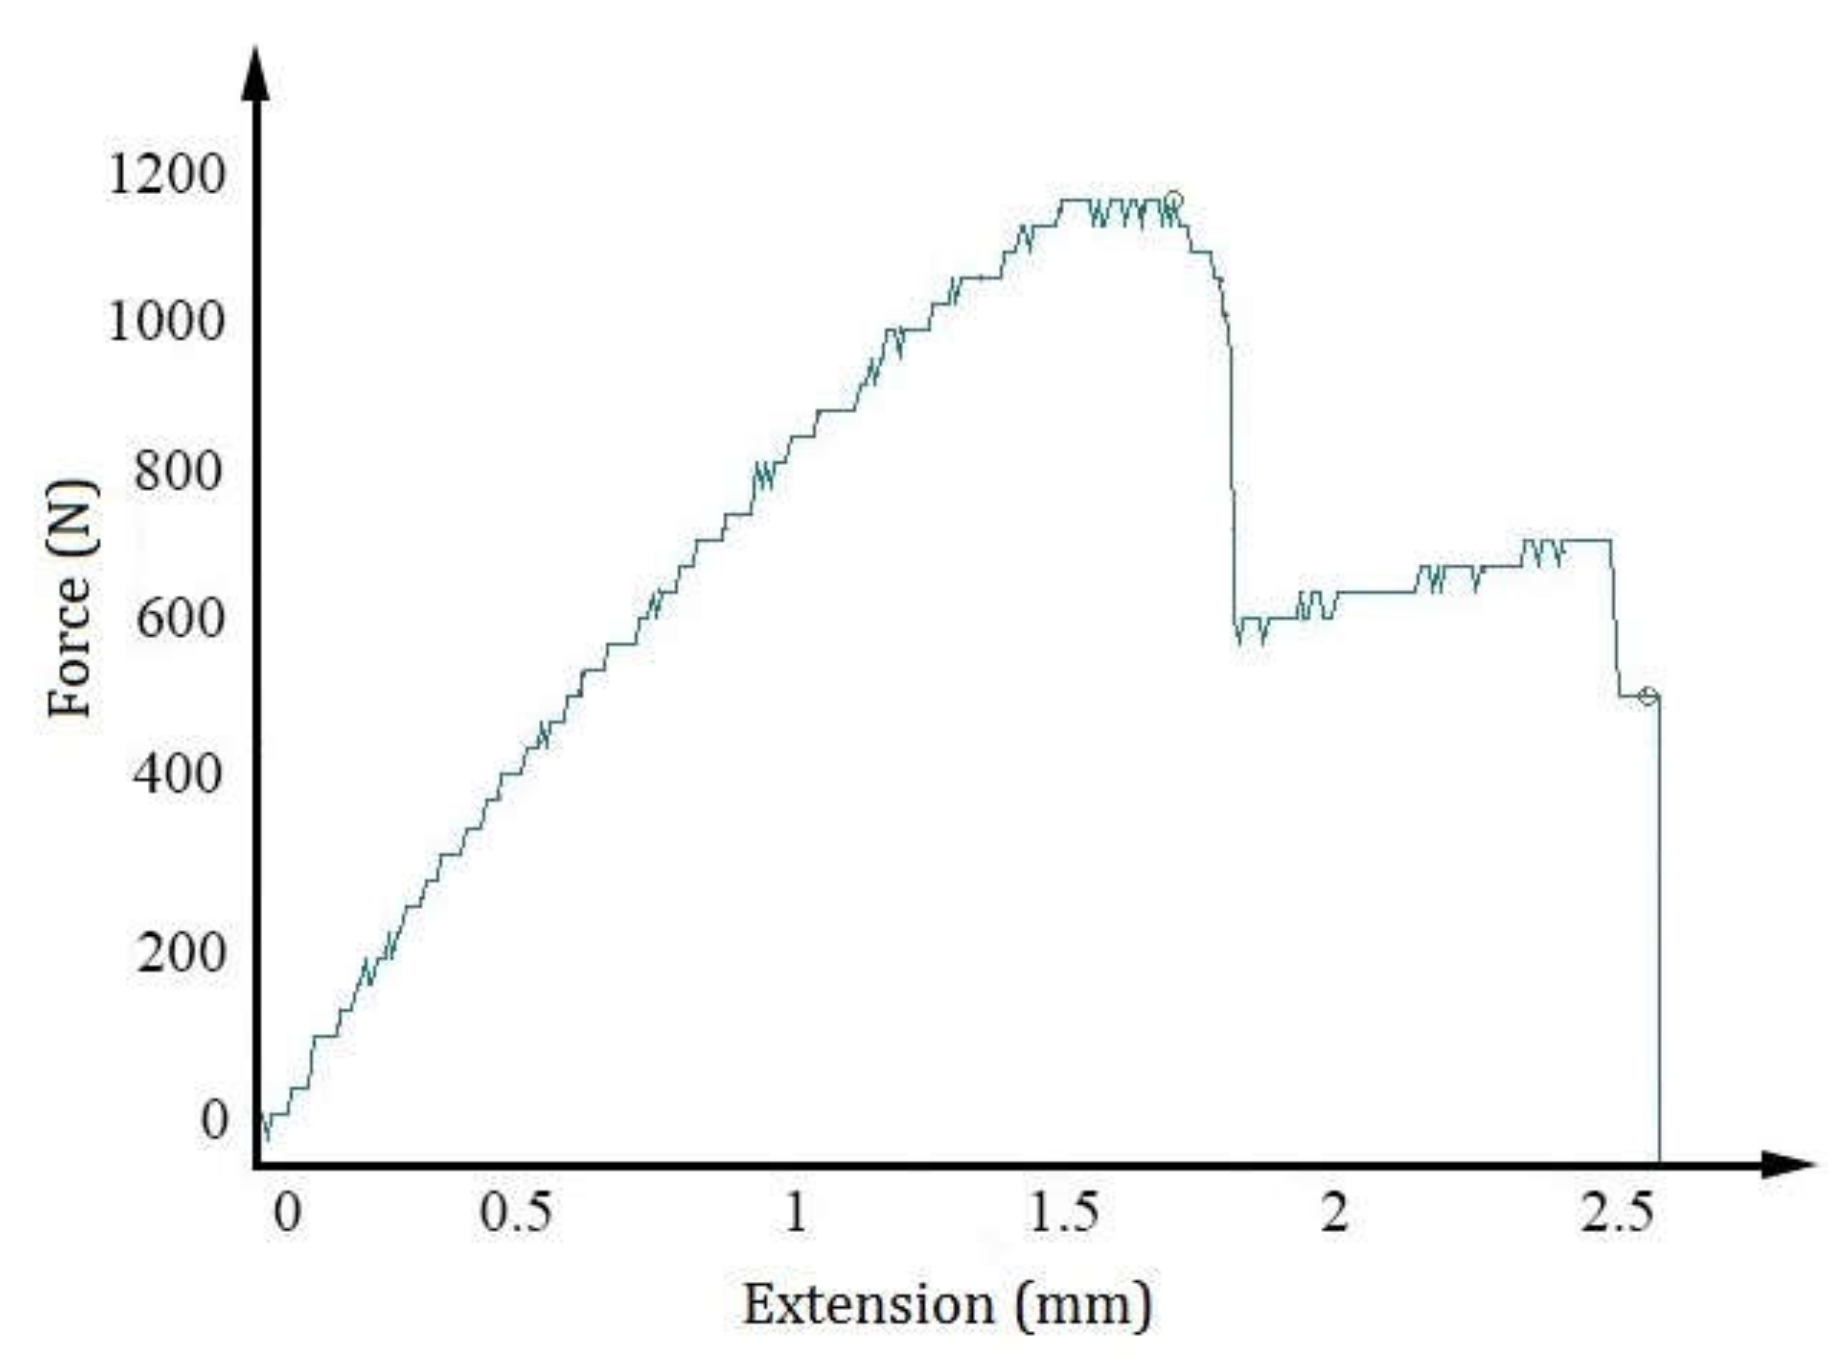
3.1. Maximum Failure Load
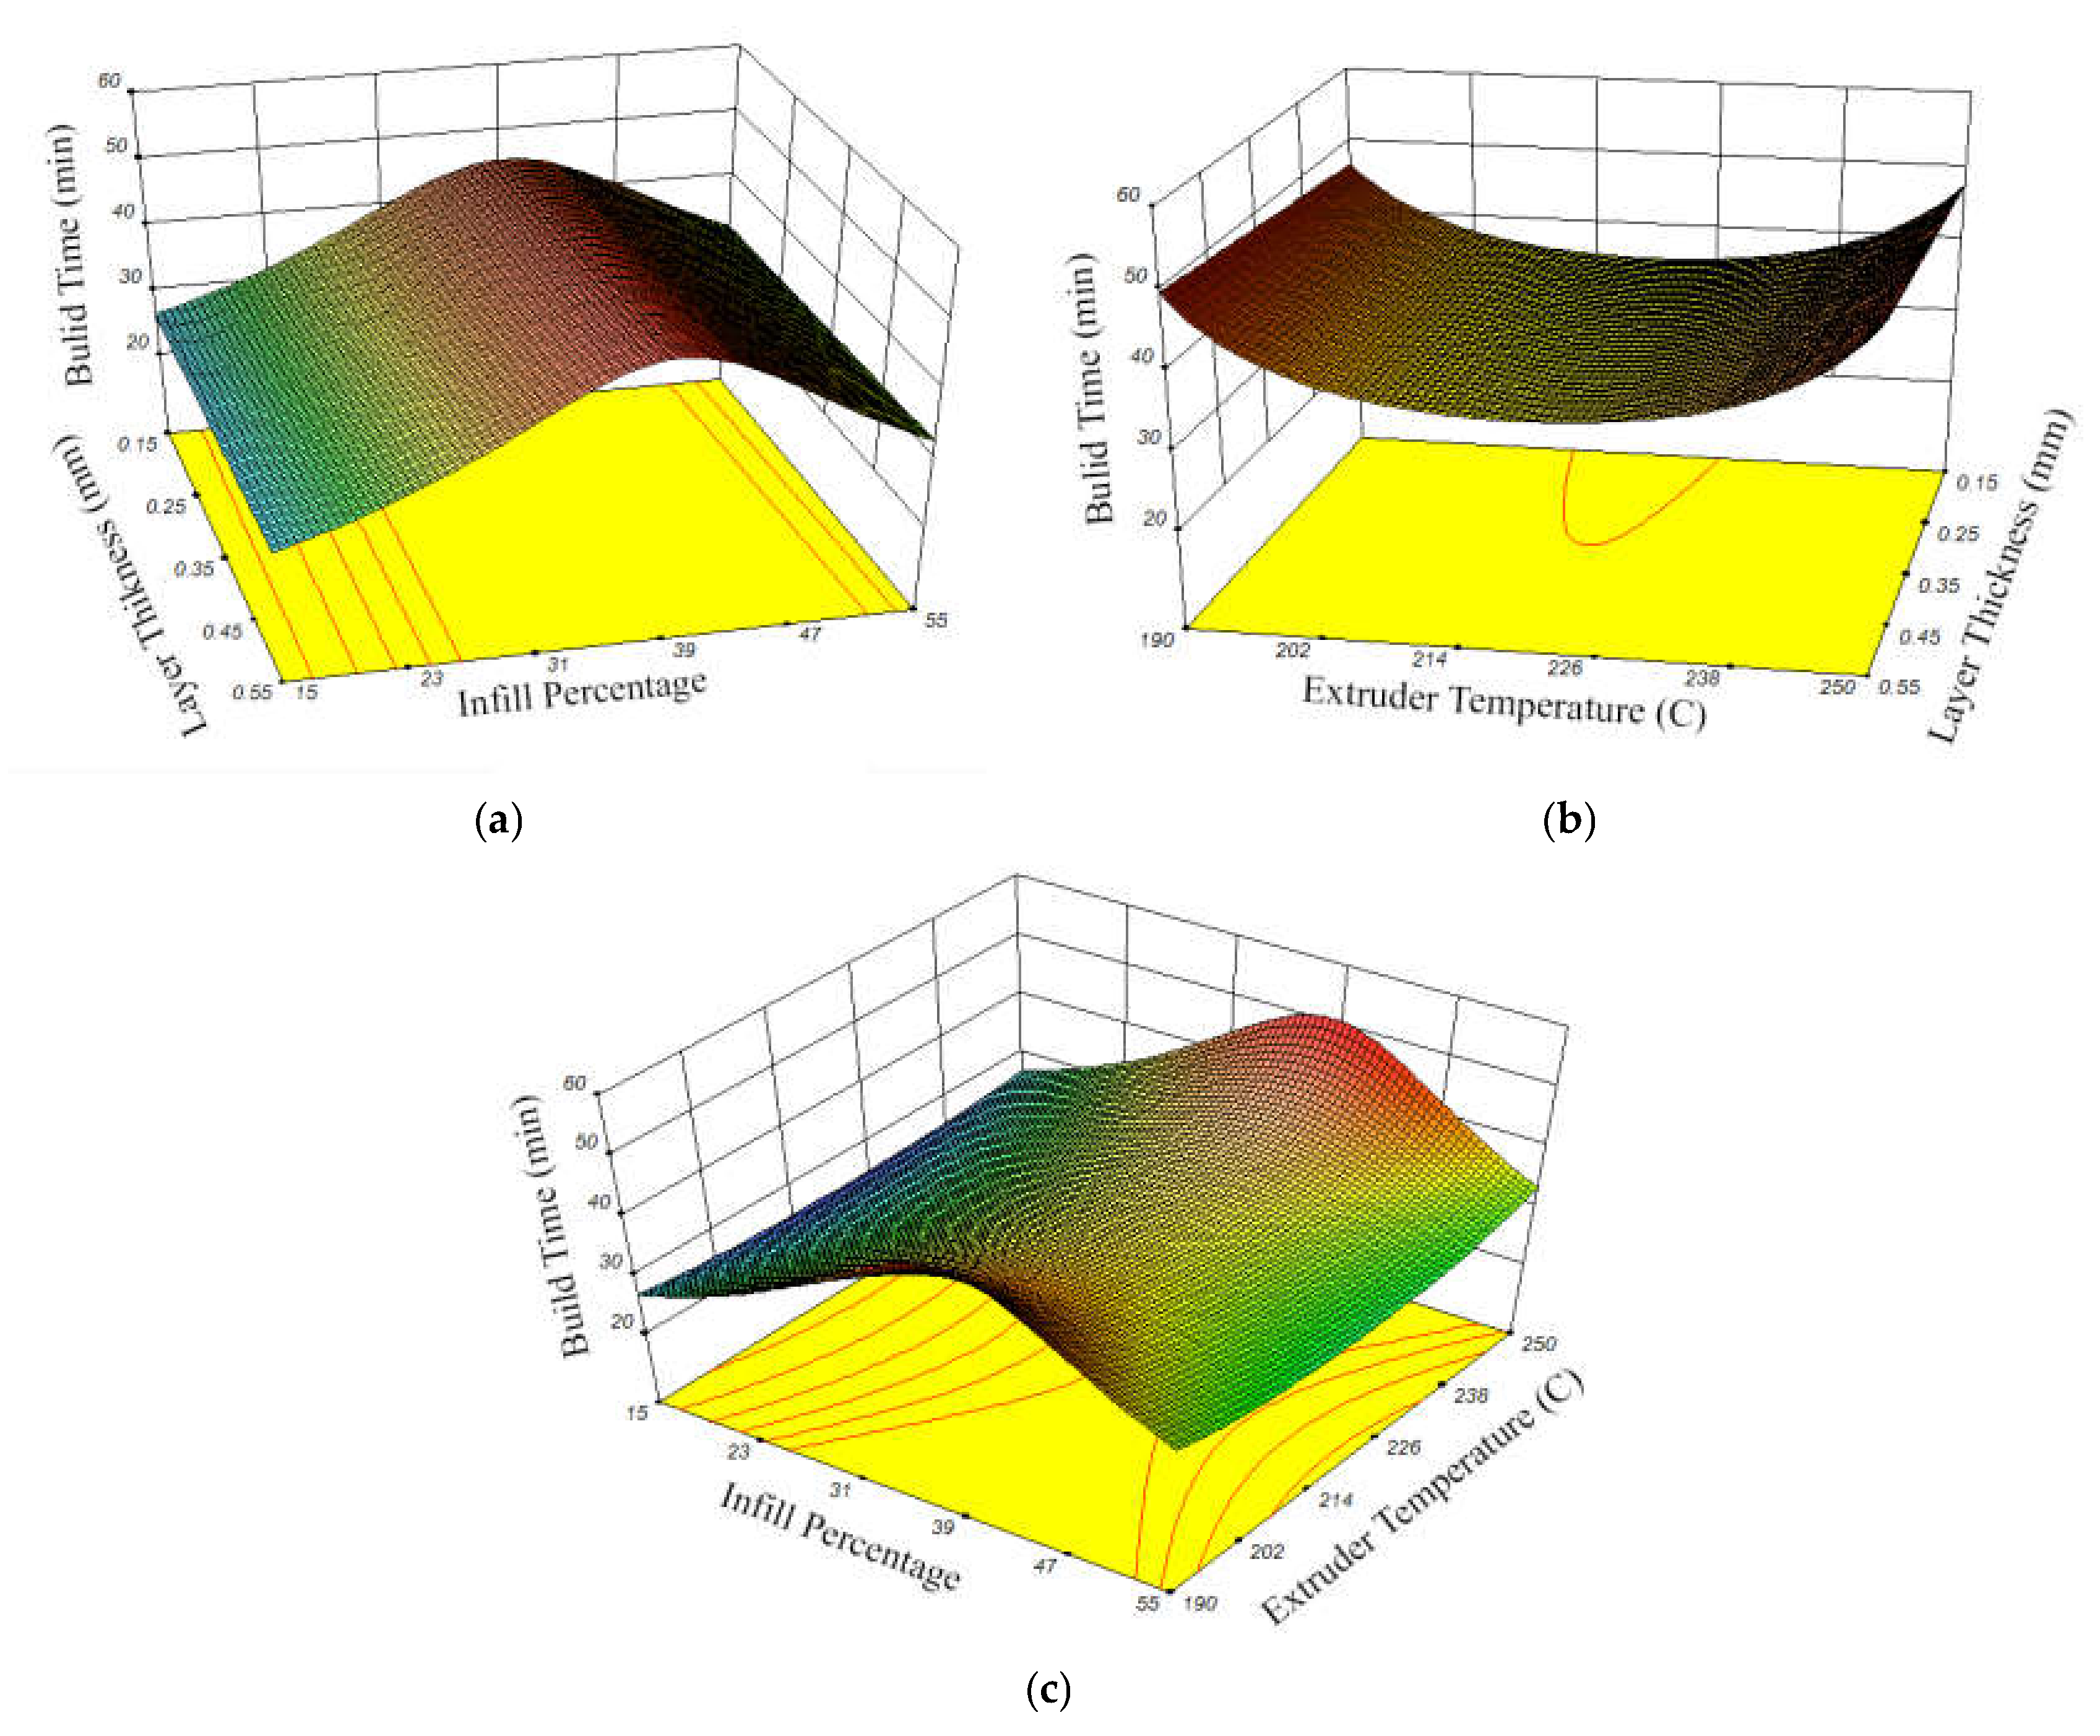
3.2. Build Time
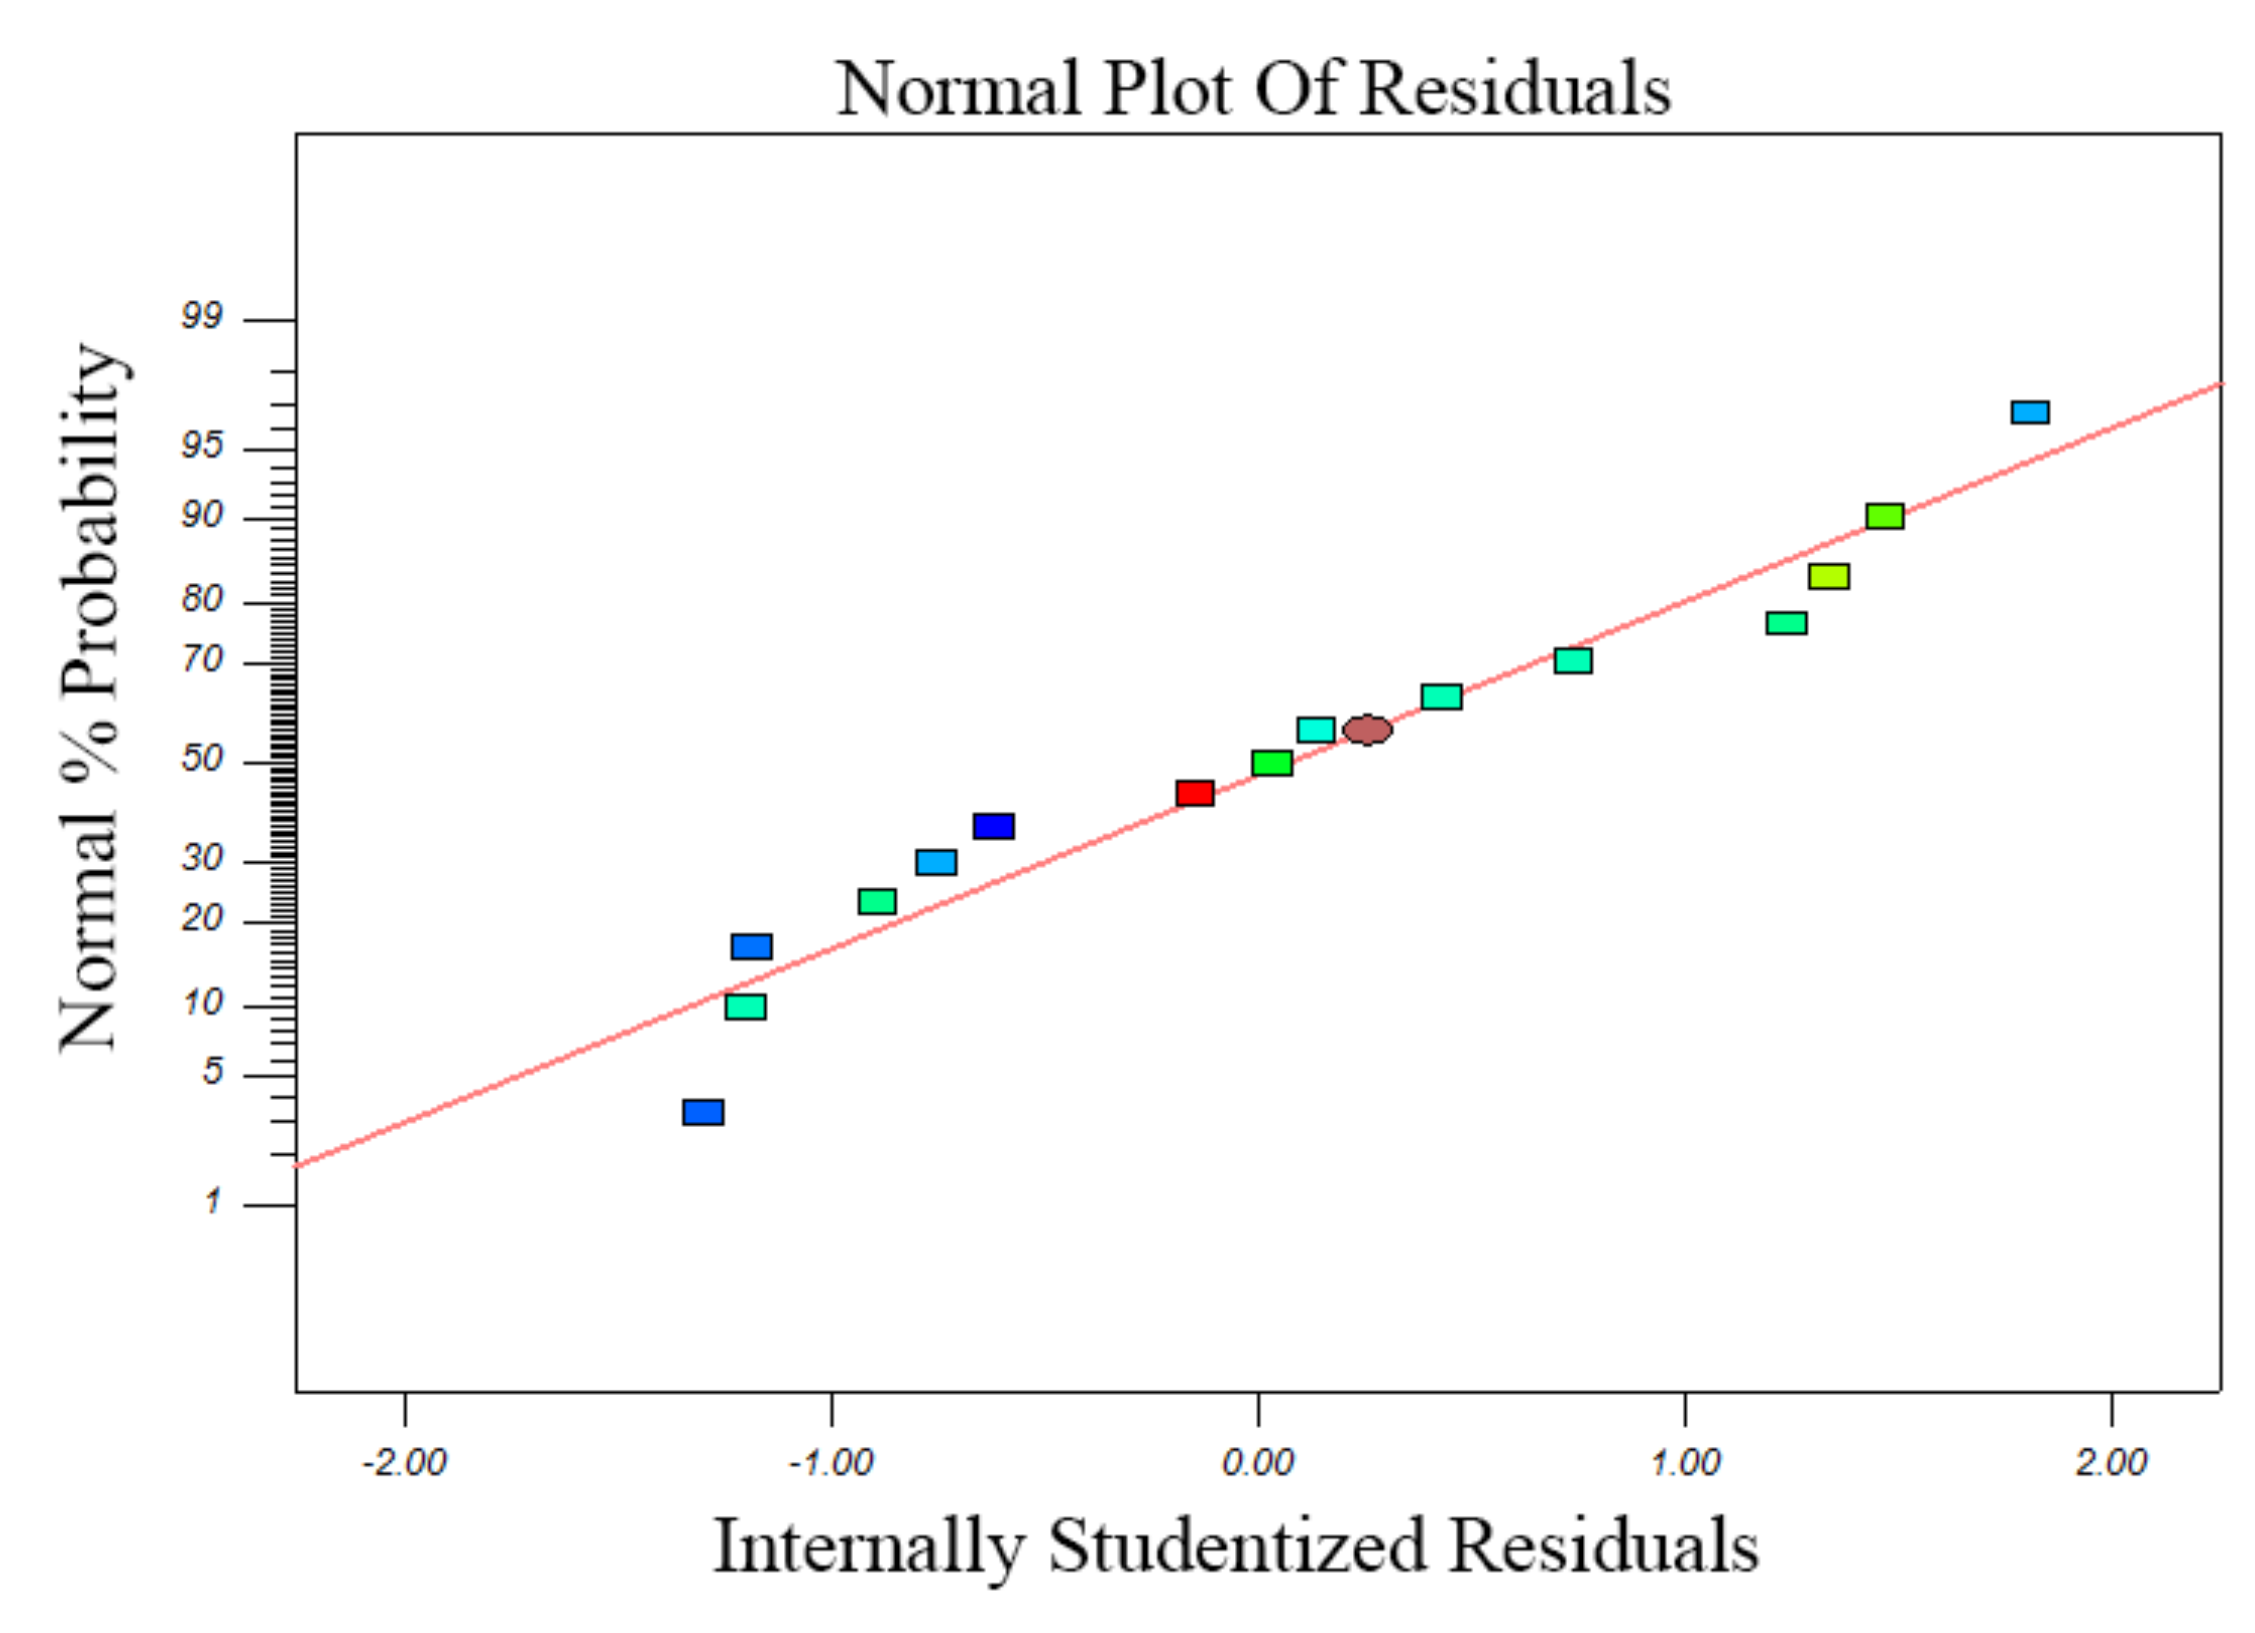
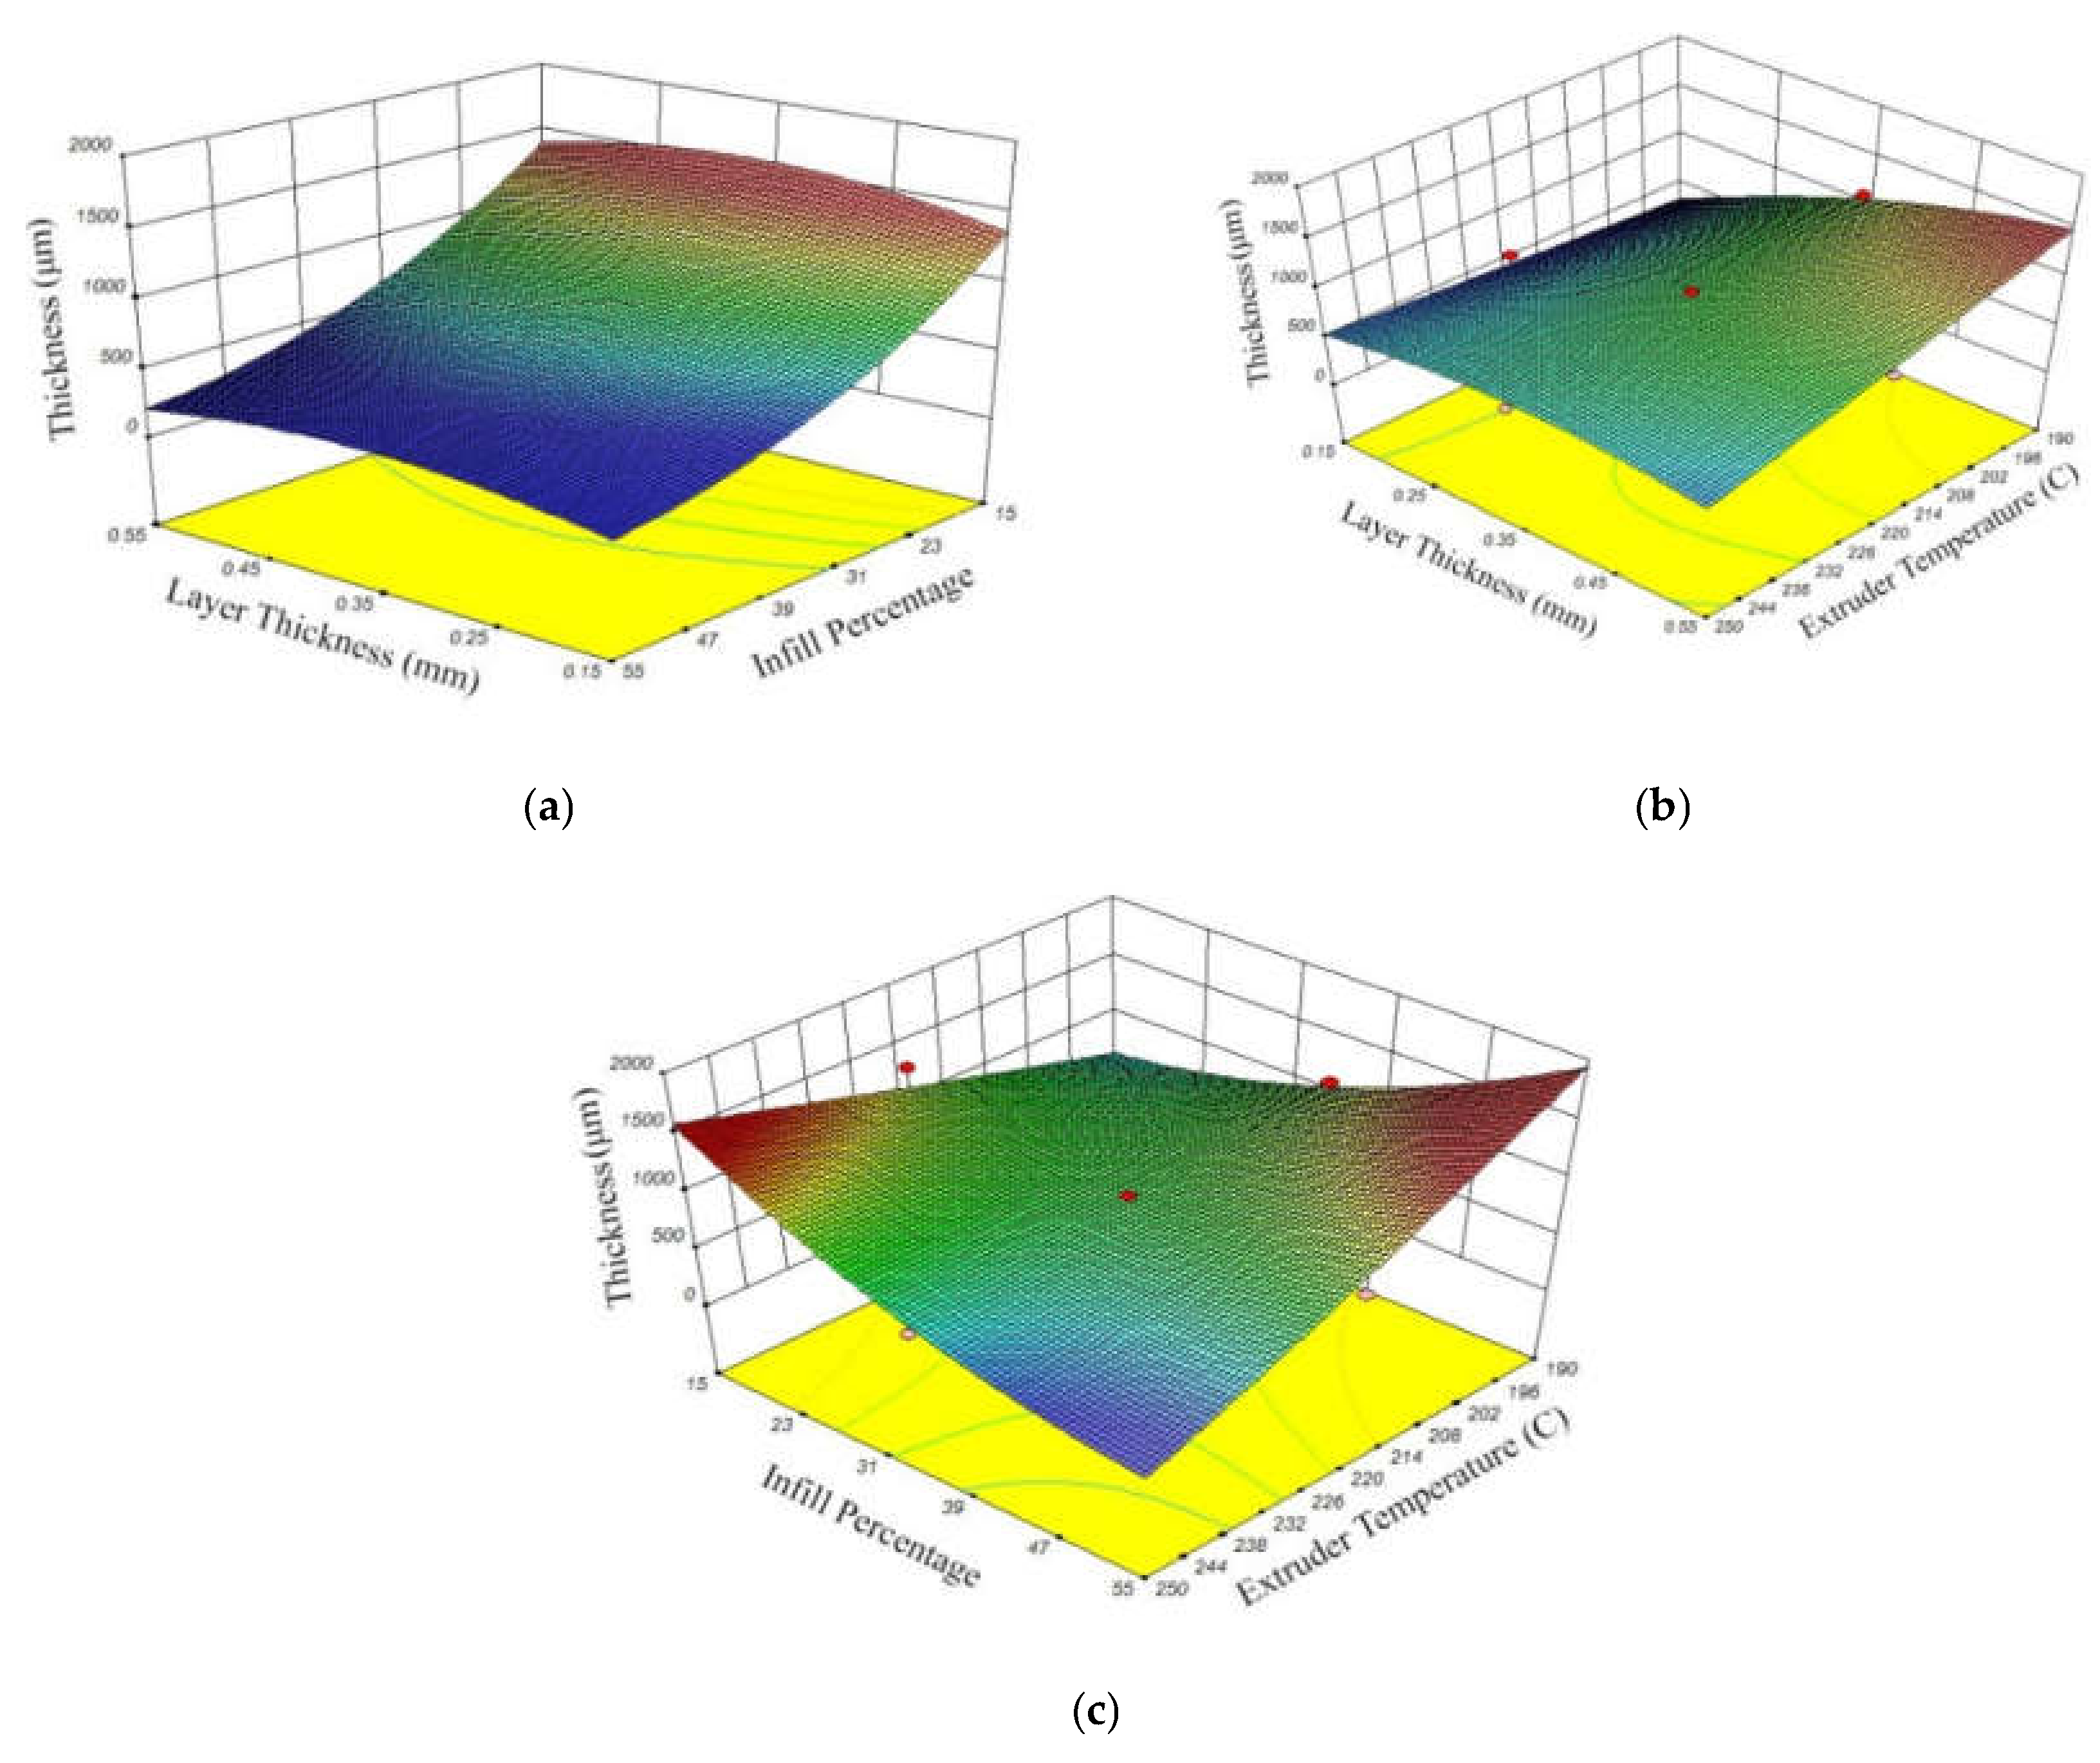
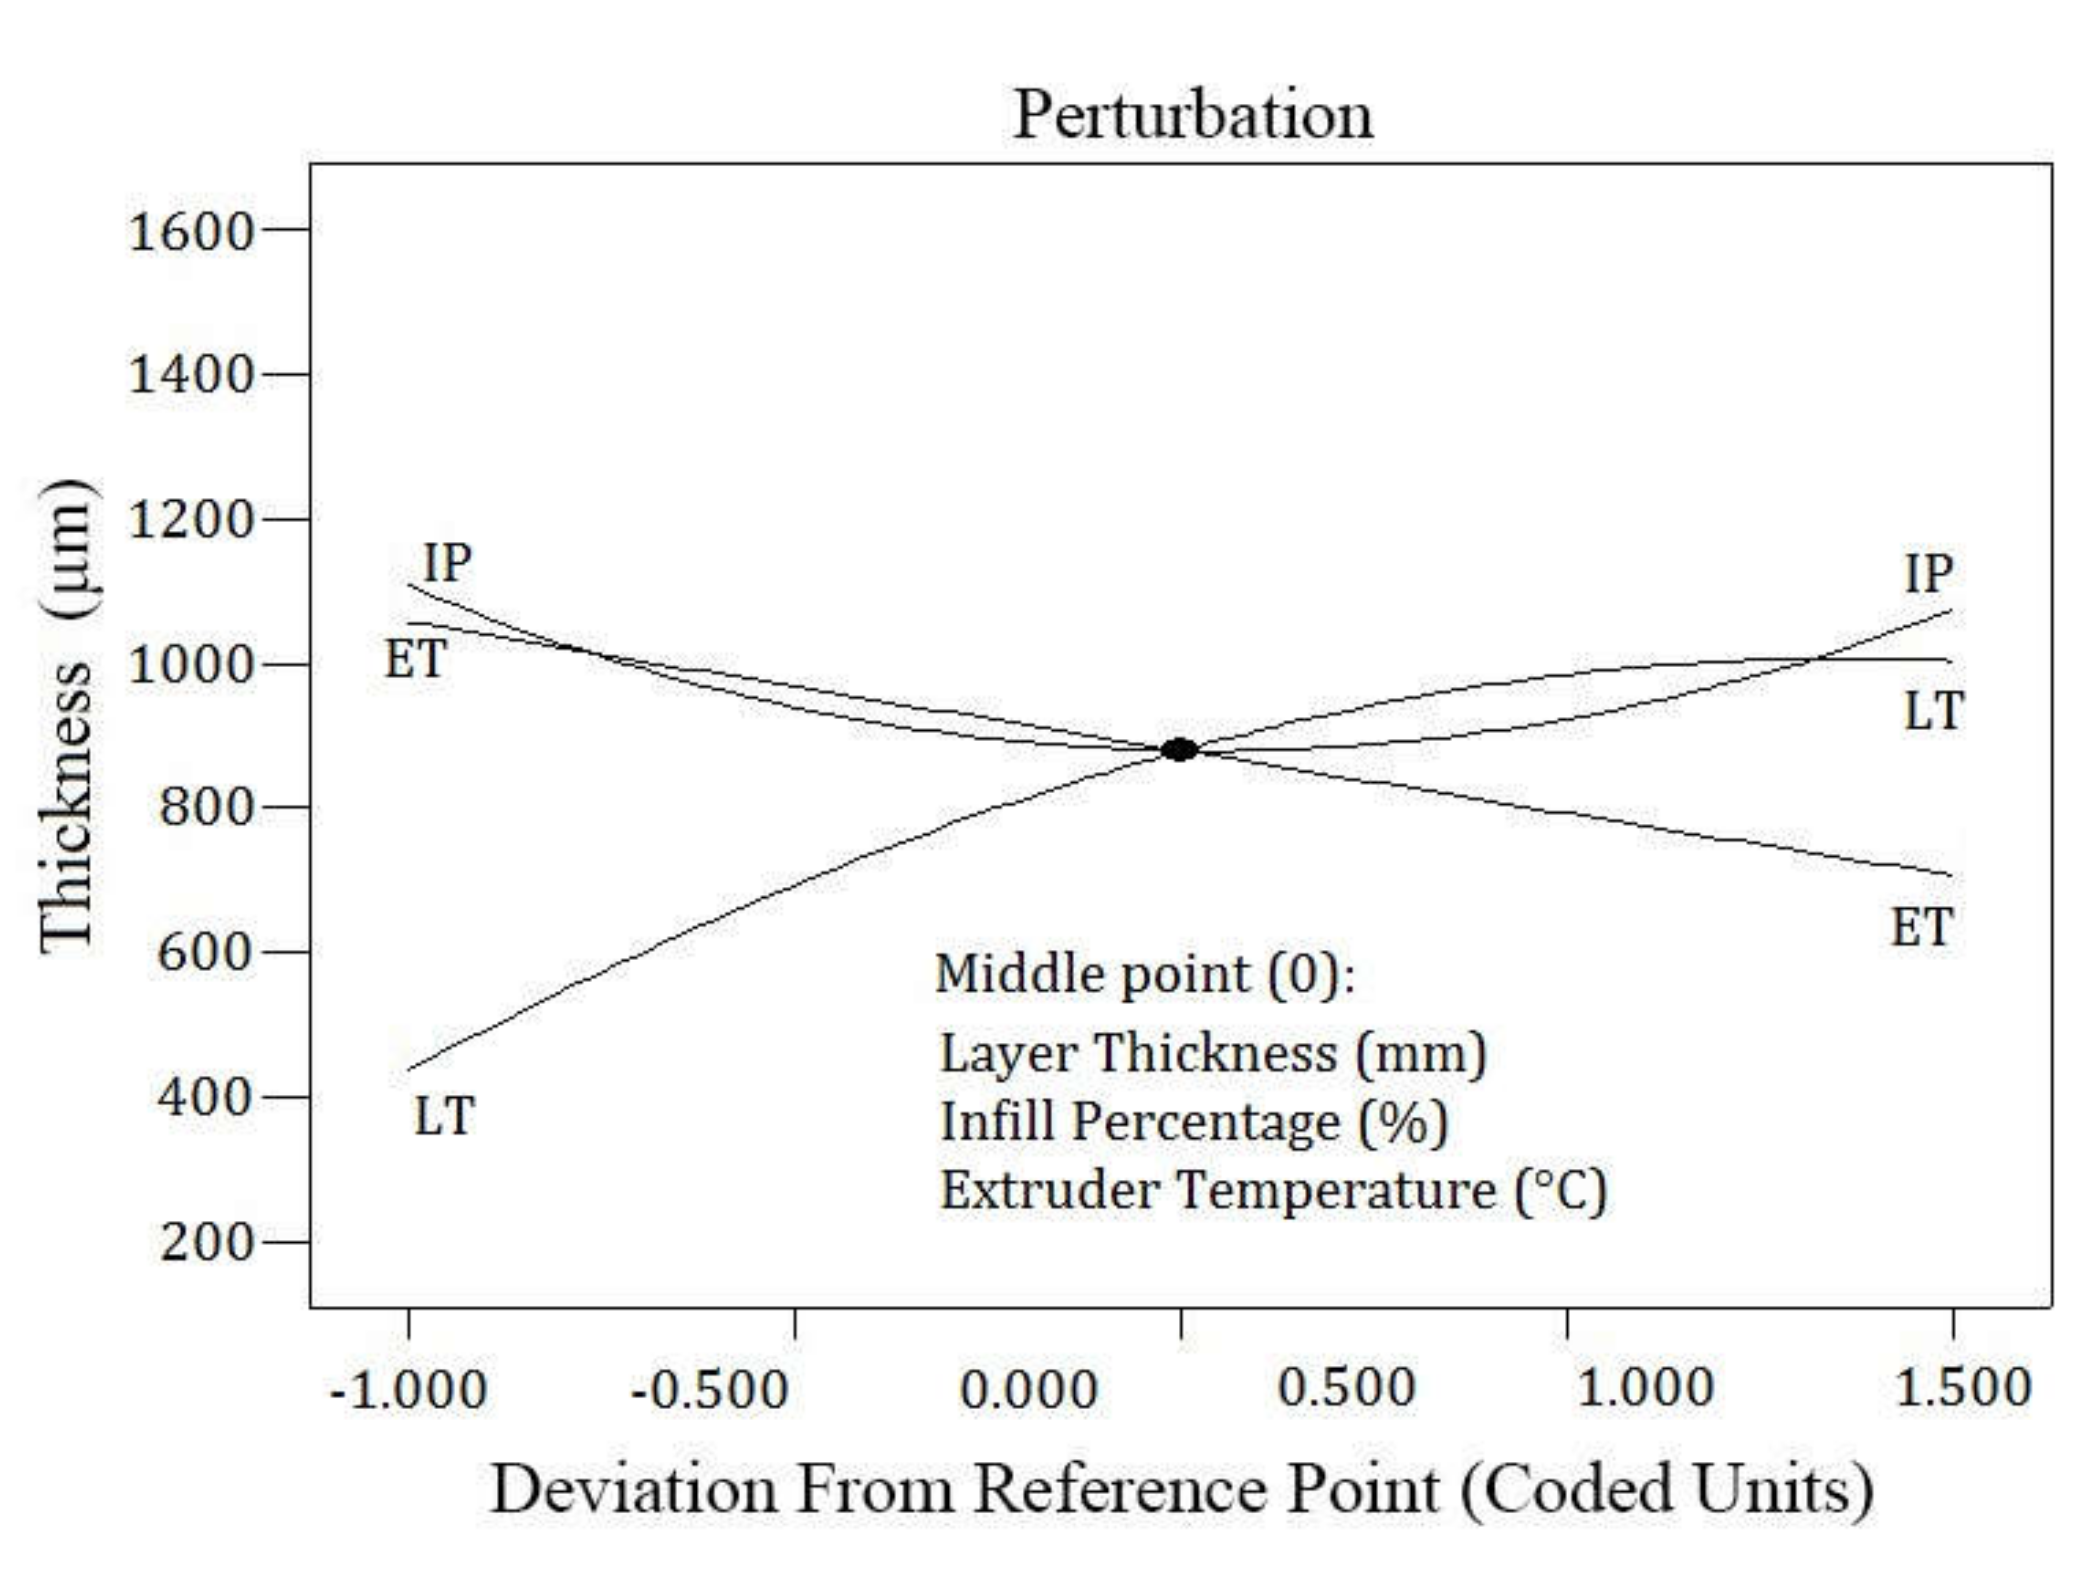
3.3. Thickness
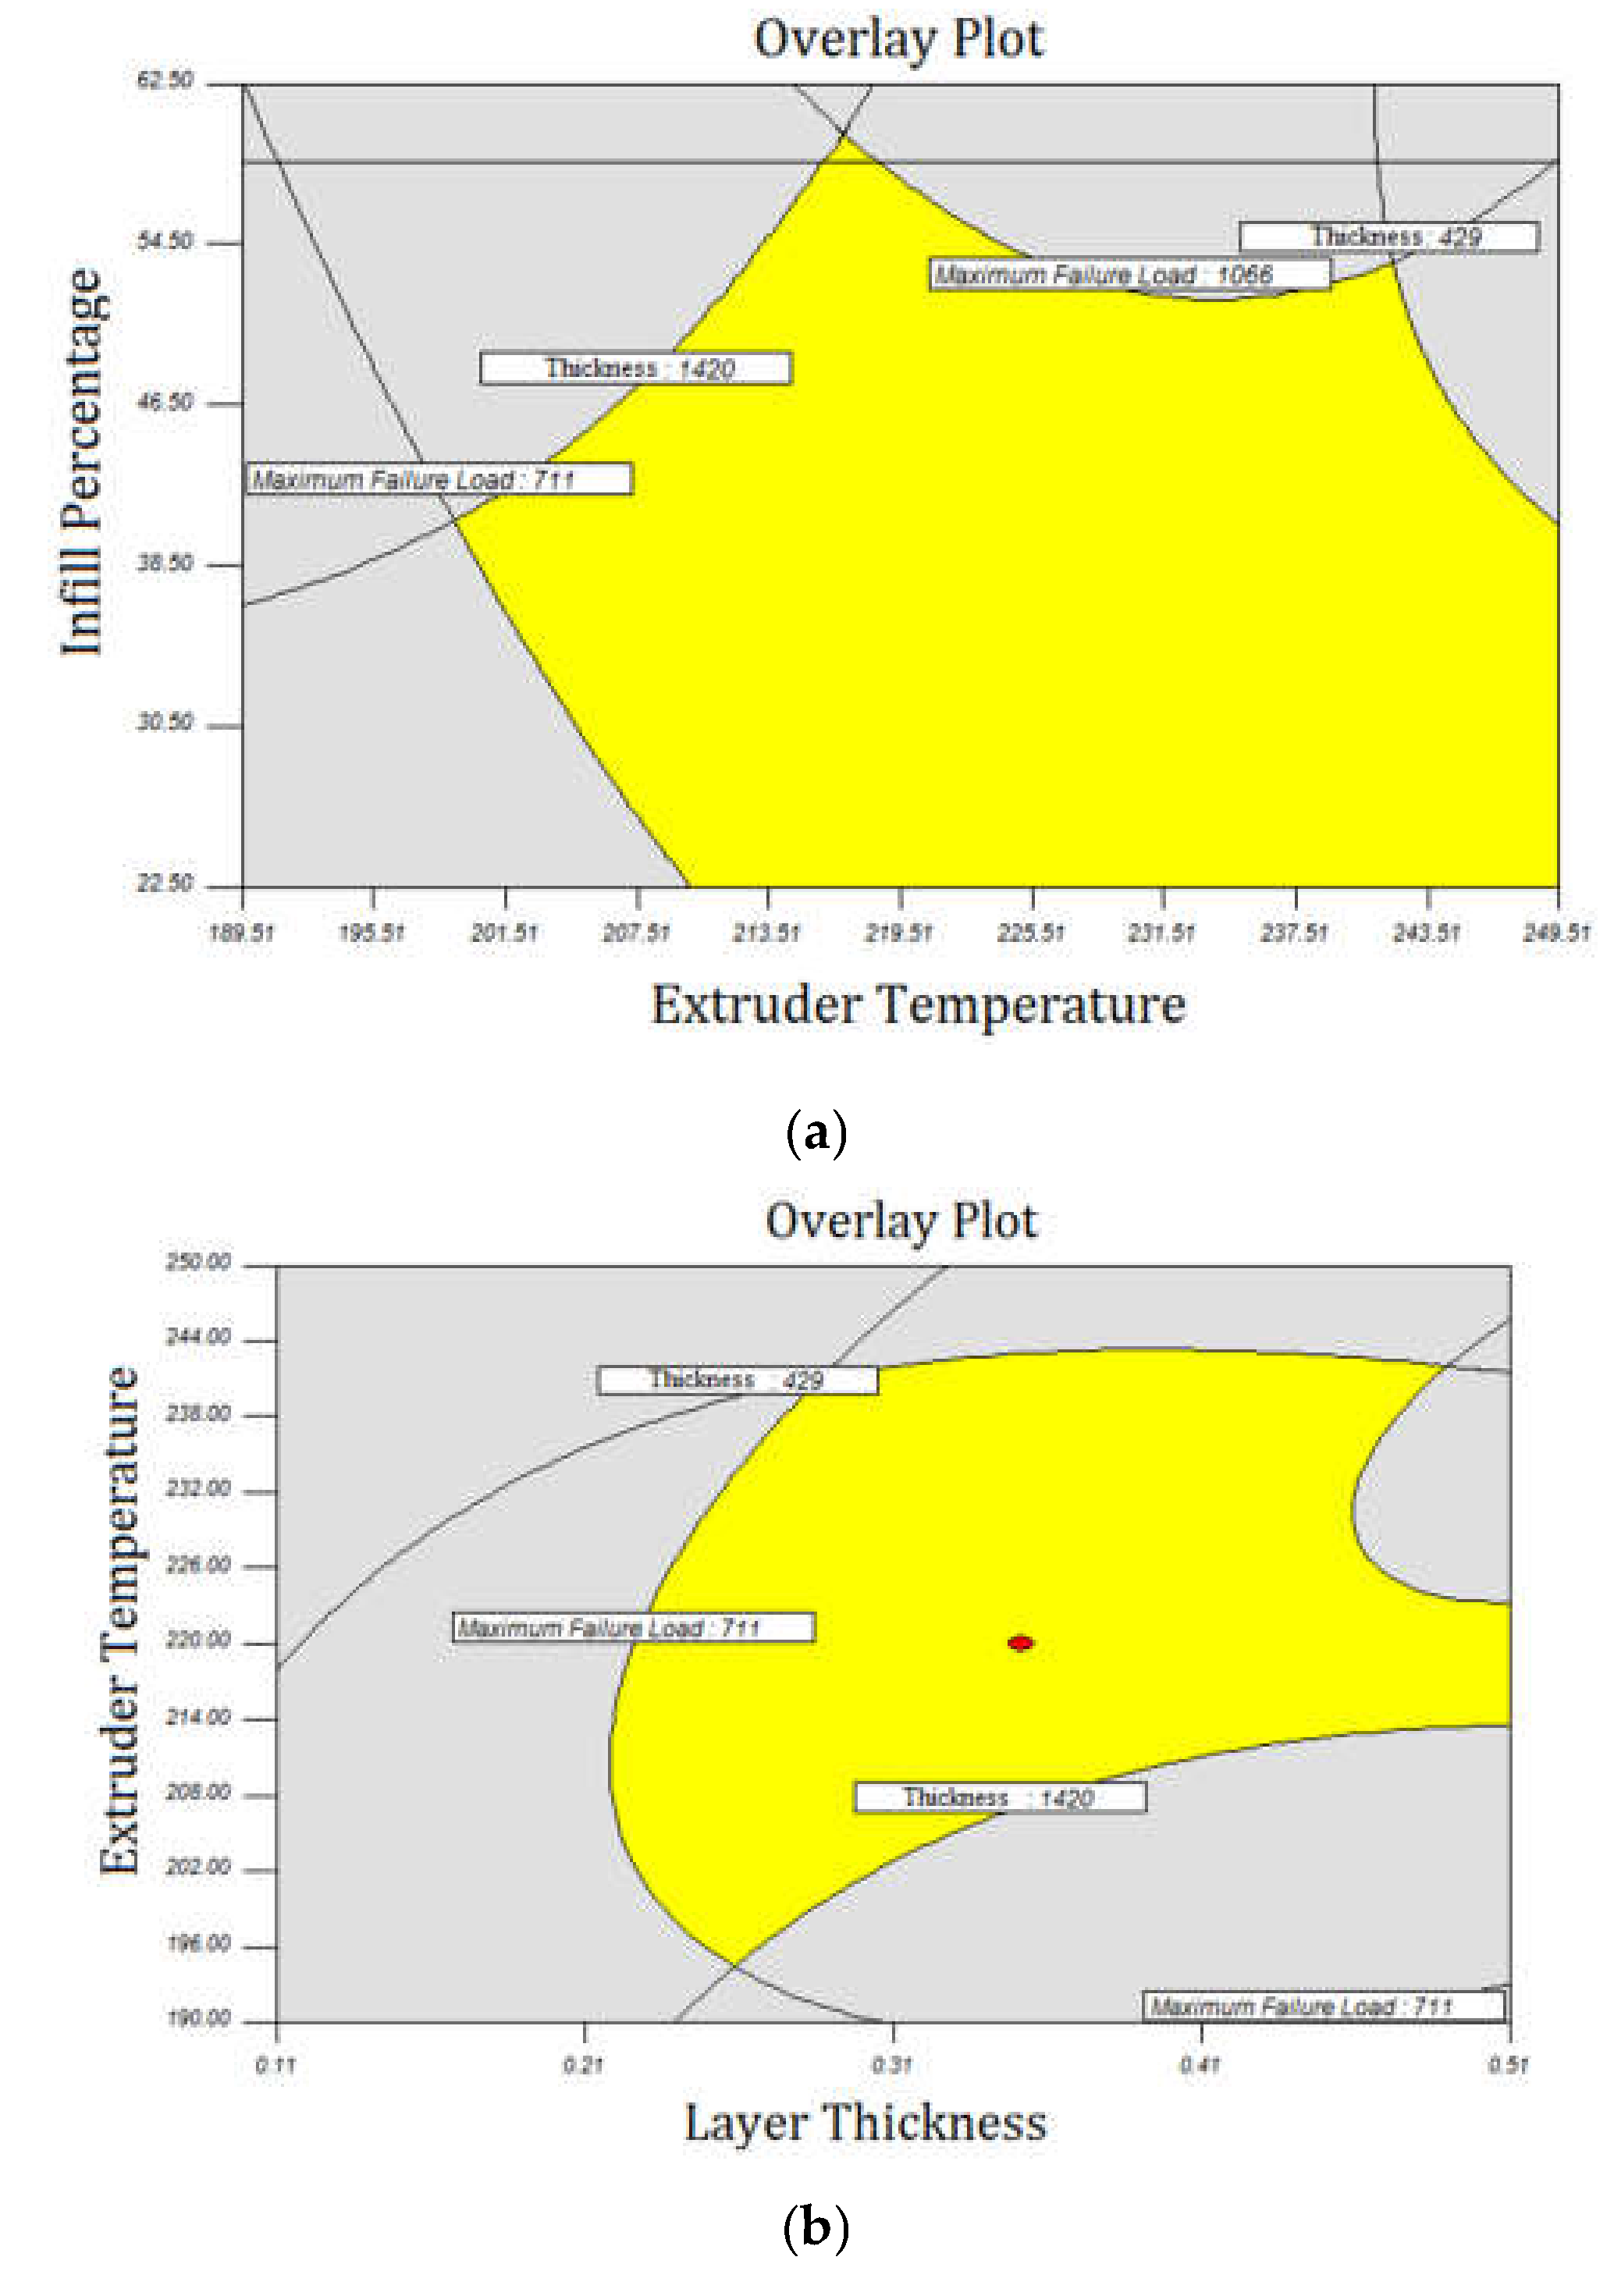
4. Numerical Optimization
5. Comparison of PLA and Br-PLA 3D Printed Samples
6. Conclusions
- (1)
- The results showed that the mechanical properties (maximum failure load) of the samples improved as the layer thickness increased because the higher layer thickness could resist a more tensile load.
- (2)
- Results indicated that when the infill percentage increased, the mechanical properties of pieces improved because of the increase in the adhesion of components.
- (3)
- The optimized printed Br-PLA specimen with a layer thickness of 0.25 mm, 15.20 infill percentage, and 222.82 °C extruder temperature could resist more than 1000 N.
- (4)
- For producing a suitable sample with good mechanical and economical features, middle extruder temperatures and low infill percentages must be considered. Because in the Br-PLA 3D samples, the heavy and rough samples might not be used very much, and the heavier samples are costly.
- (5)
- In the PLA 3D printing samples, the maximum failure load was reported more than Br-PLA samples, and that is because the composite structure has the more particle’s space, and in Br-PLA, the metal component takes up more space than PLA structure.
Author Contributions
Funding
Conflicts of Interest
References
- Groover, M.P. Fundamentals of Modern Manufacturing: Materials, Processes, and Systems, 4th ed.; John Wiley & Sons, Inc.: Hoboken, NJ, USA, 2010. [Google Scholar]
- Casalino, G.; Moradi, M.; Moghadam, M.K.; Khorram, A.; Perulli, P. Experimental and Numerical Study of AISI 4130 Steel Surface Hardening by Pulsed Nd: YAG Laser. Materials 2019, 12, 3136. [Google Scholar] [CrossRef] [PubMed]
- Moradi, M.; KaramiMoghadam, M. High power diode laser surface hardening of AISI 4130; statistical modelling and optimization. Opt. Laser Technol. 2019, 111, 554–570. [Google Scholar] [CrossRef]
- Gibson, I.; Rosen, D.; Stucker, B. Additive Manufacturing Technologies: 3D Printing, Rapid Prototyping, and Direct Digital Manufacturing, 2nd ed.; Springer: Berlin, Germany, 2015. [Google Scholar]
- Ahn, S.; Montero, M.; Odell, D.; Roundy, S.; Wright, P.K. Anisotropic material properties of fused deposition modeling ABS. Rapid Prototyp. J. 2002, 8, 248–257. [Google Scholar] [CrossRef]
- Liu, X.; Zhang, M.; Li, S.; Si, L.; Peng, J.; Hu, Y. Mechanical property parametric appraisal of fused deposition modeling parts based on the gray Taguchi method. Int. J. Adv. Manuf. Technol. 2017, 89, 2387–2397. [Google Scholar] [CrossRef]
- Dong, G.; Wijaya, G.; Tang, Y.; Zhao, Y.F. Optimizing process parameters of fused deposition modeling by Taguchi method for the fabrication of lattice structures. Add. Manuf. 2018, 19, 62–72. [Google Scholar] [CrossRef]
- Mahmood, S.; Qureshi, A.J.; Talamona, D. Taguchi based process optimization for dimension and tolerance control for fused deposition modelling. Add. Manuf. 2018, 21, 183–190. [Google Scholar] [CrossRef]
- Milosevic, M.; Stoof, D.; Pickering, K.L. Characterizing the Mechanical Properties of Fused Deposition Modelling Natural Fiber Recycled Polypropylene Composites. J. Compos. Sci. 2017, 1, 7. [Google Scholar] [CrossRef]
- Pandey, P.M.; Thrimurthulu, K.; Reddy, N.V. Optimal part deposition orientation in FDM by using a multicriteria genetic algorithm. Int. J. Prod. Res. 2004, 42, 4069–4089. [Google Scholar] [CrossRef]
- El Magri, A.; El Mabrouk, K.; Vaudreuil, S.; Ebn Touhami, M. Mechanical properties of CF-reinforced PLA parts manufactured by fused deposition modeling. J. Thermopl. Compos. Mater. 2019. [Google Scholar] [CrossRef]
- Moura, N.K.; Siqueira, I.A.W.B.; Machado, J.P.B.; Kido, H.W.; Avanzi, I.R.; Rennó, A.C.M.; Trichês, E.S.; Passador, F.R. Production and Characterization of Porous Polymeric Membranes of PLA/PCL Blends with the Addition of Hydroxyapatite. J. Compos. Sci. 2019, 3, 45. [Google Scholar] [CrossRef]
- Backes, E.H.; Pires, L.N.; Costa, L.C.; Passador, F.R.; Pessan, L.A. Analysis of the Degradation During Melt Processing of PLA/Biosilicate® Composites. J. Compos. Sci. 2019, 3, 52. [Google Scholar] [CrossRef]
- Galantucci, L.M.; Lavecchia, F.; Percoco, G. Quantitative analysis of a chemical treatment to reduce roughness of parts fabricated using fused deposition modelling. CIRP Ann. Manuf. Technol. 2010, 59, 247–250. [Google Scholar] [CrossRef]
- Sood, A.K.; Ohdar, R.K.; Mahapatra, S.S. Experimental investigation and empirical modelling of FDM process for compressive strength improvement. J. Adv. Res. 2012, 3, 81–90. [Google Scholar] [CrossRef]
- Rao, V.; Rai, D.P. Optimization of fused deposition modelling process using teaching-learning based optimization algorithm. Eng. Sci. Technol. Int. J. 2016, 19, 587–603. [Google Scholar] [CrossRef]
- Austin, P.; Robert, M.; Alexander, G.D.; Jack, G. Graphene and Carbon Nanotube PLA Composite Feedstock Development for Fused Deposition Modeling; University of Tennessee Honors Thesis Projects: Knoxville, TN, USA, 2016. [Google Scholar]
- Moradi, M.; Meiabadi, S.; Kaplan, A. 3D Printed Parts with Honeycomb Internal Pattern by Fused Deposition Modelling; Experimental Characterization and Production Optimization. Met. Mater. Int. 2019, 25, 1312–1325. [Google Scholar] [CrossRef]
- Padhi, S.K.; Sahu, R.K.; Mahapatra, S.S.; Das, H.C.; Sood, A.K.; Patro, B.; Mondal, A.K. Optimization of fused deposition modeling process parameters using a fuzzy inference system coupled with Taguchi philosophy. Adv. Manuf. 2017, 5, 231–242. [Google Scholar] [CrossRef]
- Gardan, J.; Makke, A.; Recho, N. Improving the fracture toughness of 3D printed thermoplastic polymers by fused deposition modeling. Int. J. Fract. 2018, 210, 1–15. [Google Scholar] [CrossRef]
- Peng, A.; Xiao, X.; Yue, R. Process parameter optimization for fused deposition modeling using response surface methodology combined with fuzzy inference system. Int. J. Adv. Manuf. Technol. 2014, 73, 87–100. [Google Scholar] [CrossRef]
- Sajan, N.; John, T.D.; Singh, N.K. An investigation on circularity error of components processed on Fused Deposition Modeling (FDM). Mater. Today Proc. 2018, 5, 1327–1334. [Google Scholar] [CrossRef]
- Gautam, R.; Idapalapati, S.; Feih, S. Printing and characterisation of Kagome lattice structures by fused deposition modelling. Mater. Des. 2018, 137, 266–275. [Google Scholar] [CrossRef]
- Ning, F.; Cong, W.; Wei, J.; Wang, S. Additive Manufacturing of CFRP Composites Using Fused Deposition Modeling: Effects of Carbon Fiber Content and Length. In Proceedings of the ASME 2015 International Manufacturing Science and Engineering Conference, Charlotte, NC, USA, 8–12 June 2015. [Google Scholar]
- Ghennai, W.; Boussaid, O.; Bendjama, H.; Haddag, B.; Nouari, M. Experimental and numerical study of DC04 sheet metal behaviour—plastic anisotropy identification and application to deep drawing. Int. J. Adv. Manuf. Technol. 2019, 100, 361–371. [Google Scholar] [CrossRef]
- Taherzadehboroujeni, M.; Kalhor, R.; Fahs, G.B.; Moore, R.B.; Case, S.W. Accelerated testing method to estimate the long-term hydrostatic strength of semi-crystalline plastic pipes. Poly. Eng. Sci. 2019. [Google Scholar] [CrossRef]
- Komarasamy, M.; Wang, T.; Liu, K.; Reza-Nieto, L.; Mishra, R.S. Hierarchical multi-phase microstructural architecture for exceptional strength-ductility combination in a complex concentrated alloy via high-temperature severe plastic deformation. Scr. Mater. 2019, 162, 38–43. [Google Scholar] [CrossRef]
- Yuan, S.; Shen, F.; Chua, C.K.; Zhou, K. Polymeric composites for powder-based additive manufacturing. Mater. Appl. Progr. Polym. Sci. 2019, 91, 141–168. [Google Scholar] [CrossRef]
- Naranjo-Lozada, J.; Ahuett-Garza, H.; Orta-Castañón, P.; Verbeeten, W.M.; Sáiz-González, D. Tensile properties and failure behavior of chopped and continuous carbon fiber composites produced by additive manufacturing. Add. Manuf. 2019, 26, 227–241. [Google Scholar] [CrossRef]
- Griffiths, R.J.; Perry, M.E.; Sietins, J.M.; Zhu, Y.; Hardwick, N.; Cox, C.D.; Rauch, H.A.; Hang, Z.Y. A Perspective on Solid-State Additive Manufacturing of Aluminum Matrix Composites Using MELD. J. Mater. Eng. Perform. 2019, 28, 648–656. [Google Scholar] [CrossRef]
- Dickson, A.N.; Dowling, D.P. Enhancing the bearing strength of woven carbon fibre thermoplastic composites through additive manufacturing. Compos. Struct. 2019, 212, 381–388. [Google Scholar] [CrossRef]
- Singh, N.; Singh, R.; Ahuja, I.P.S.; Farina, I.; Fraternali, F. Metal matrix composite from recycled materials by using additive manufacturing assisted investment casting. Compos. Struct. 2019, 207, 129–135. [Google Scholar] [CrossRef]
- Sekar, V.; Fouladi, M.H.; Namasivayam, S.N.; Sivanesan, S. Additive Manufacturing: A Novel Method for Developing an Acoustic Panel Made of Natural Fiber-Reinforced Composites with Enhanced Mechanical and Acoustical Properties. J. Eng. 2019, 2019, 4546863. [Google Scholar] [CrossRef]
- Feng, Y.C.; Bodaghi, M.; Liao, W.H. Numerical/experimental assessment of 3D-printed shape-memory polymeric beams. J. Appl. Polym. Sci. 2019, 136, 47422. [Google Scholar] [CrossRef]
- Bodaghi, M.; Damanpack, A.R.; Hu, G.F.; Liao, W.H. Large deformations of soft metamaterials fabricated by 3D printing. Mater. Des. 2017, 131, 81–91. [Google Scholar] [CrossRef]
- Kuznetsov, V.E.; Solonin, A.N.; Urzhumtsev, O.D.; Schilling, R.; Tavitov, A.G. Strength of PLA Components Fabricated with Fused Deposition Technology Using a Desktop 3D Printer as a Function of Geometrical Parameters of the Process. Polymers 2018, 10, 313. [Google Scholar] [CrossRef] [PubMed]


| Variable | Symbol | Unit | Levels | ||||
|---|---|---|---|---|---|---|---|
| −2 | −1 | 0 | 1 | 2 | |||
| Layer thickness (LT) | LT | mm | 0.15 | 0.25 | 0.35 | 0.45 | 0.55 |
| Infill percentage (IP) | IP | % | 15 | 25 | 35 | 45 | 55 |
| Extruder temperature (ET) | ET | C | 190 | 205 | 220 | 235 | 250 |
| Run | Input Variables | Output Responses | ||||||
|---|---|---|---|---|---|---|---|---|
| Layer Thickness (mm) | Infill Percentage (%) | Extruder Temperature (°C) | Maximum Failure Load (N) | Thickness (μm) | Build Time (min) | Elongation at Break (mm) | Type of Fracture | |
| 1 | 0.25 | 45.00 | 235.00 | 1015 | 1249 | 36 | 2.24 | Brittle |
| 2 | 0.35 | 35.00 | 220.00 | 1025 | 1255 | 36 | 2.48 | Tough |
| 3 | 0.45 | 45.00 | 235.00 | 1022 | 1258 | 37 | 2.35 | Brittle |
| 4 | 0.35 | 15.00 | 220.00 | 1018 | 1252 | 36 | 2.26 | Brittle |
| 5 | 0.15 | 35.00 | 220.00 | 805.8 | 521 | 25 | 1.50 | Brittle |
| 6 | 0.35 | 35.00 | 220.00 | 1020 | 1256 | 35 | 2.25 | Brittle |
| 7 | 0.35 | 35.00 | 220.00 | 1018 | 1255 | 36 | 2.20 | Brittle |
| 8 | 0.45 | 25.00 | 235.00 | 1026 | 1258 | 36 | 2.64 | Brittle |
| 9 | 0.35 | 55.00 | 220.00 | 1017 | 1247 | 36 | 3.45 | Tough |
| 10 | 0.35 | 35.00 | 220.00 | 1019 | 1256 | 35 | 2.13 | Brittle |
| 11 | 0.25 | 45.00 | 205.00 | 875 | 860 | 29 | 1.65 | Brittle |
| 12 | 0.35 | 35.00 | 220.00 | 1014 | 1247 | 34 | 2.53 | Tough |
| 13 | 0.45 | 25.00 | 205.00 | 862 | 905 | 30 | 1.40 | Brittle |
| 14 | 0.45 | 45.00 | 205.00 | 882 | 910 | 31 | 1.52 | Brittle |
| 15 | 0.25 | 25.00 | 235.00 | 895 | 917 | 32 | 1.89 | Brittle |
| 16 | 0.35 | 35.00 | 220.00 | 1024 | 1257 | 36 | 2.75 | Brittle |
| 17 | 0.25 | 25.00 | 205.00 | 981 | 923 | 33 | 2.26 | Brittle |
| 18 | 0.35 | 35.00 | 250.00 | 1030 | 1270 | 39 | 2.55 | Tough |
| 19 | 0.35 | 35.00 | 190.00 | 1017 | 1254 | 36 | 2.40 | Tough |
| 20 | 0.55 | 35.00 | 220.00 | 1025 | 1272 | 38 | 2.25 | Brittle |
| No | Build Parameters | Definition | Unit | Value |
|---|---|---|---|---|
| 1 | Nozzle diameter | The diameter of the extruder nozzle. | mm | 0.45 |
| 2 | Extrusion width | The desired single-outline width of the plastic extrusion. | mm | 0.45 |
| 3 | Build orientation | The angle between the central axis of the part and the horizontal direction. | Degree | 45 |
| 4 | Top solid layer | Number of solid layers required at the top of the part. | - | 6 |
| 5 | Bottom solid layers | Required number of solid layers at the bottom of the part. | - | 6 |
| 6 | Default printing speed | Initial speed used for all printing movements (modification may be added for cooling or outline underspeed). | mm/min | 3600 |
| 7 | Retraction speed | Extruder speed for the retraction movements typically uses the highest speed the extruder can support. | mm/min | 1800 |
| 8 | Outline overlap | Percentage of extrusion width that will overlap with outline perimeters (ensures infill bonds to outline). | % | 15 |
| Source | Sum of Squares | Degrees of Freedom (DF) | Mean Square | F Value | p-Value |
|---|---|---|---|---|---|
| Model | 4.22 × 10¹³ | 7 | 6.02 × 10¹² | 5.972742 | 0.0155 |
| LT | 8.95 × 10¹¹ | 1 | 8.95 × 10¹¹ | 0.887652 | 0.3775 |
| IP | 1.16 × 10¹² | 1 | 1.16 × 10¹² | 1.150847 | 0.3190 |
| ET | 7.56 × 10¹¹ | 1 | 7.56 × 10¹¹ | 0.750007 | 0.4152 |
| LT × IP | 9.67 × 10¹² | 1 | 9.67 × 10¹² | 9.593505 | 0.0174 |
| LT × ET | 7.71 × 10¹² | 1 | 7.71 × 10¹² | 7.643659 | 0.0279 |
| LT2 | 1.41 × 10¹³ | 1 | 1.41 × 10¹³ | 13.96848 | 0.0073 |
| ET2 | 1.65 × 10¹³ | 1 | 1.65 × 10¹³ | 16.36513 | 0.0049 |
| Residual | 7.06 × 10¹² | 7 | 1.01 × 10¹² | ||
| Cor Total | 4.92 × 10¹³ | 14 | |||
| Adj R-Squared = 0.7131 | R-Squared = 0.8565 | ||||
| Source | Sum of Squares | Df | Mean Square | F Value | p-Value |
|---|---|---|---|---|---|
| Model | 2.54 × 10⁻⁹ | 5 | 5.09 × 10⁻¹⁰ | 10.81049 | 0.0013 |
| IP | 5.8 × 10⁻¹⁰ | 1 | 5.8 × 10⁻¹⁰ | 12.33532 | 0.0066 |
| ET | 2.52 × 10⁻¹³ | 1 | 2.52 × 10⁻¹³ | 0.005361 | 0.9432 |
| IP2 | 1.09 × 10⁻⁹ | 1 | 1.09 × 10⁻⁹ | 23.14339 | 0.0010 |
| ET2 | 1.98 × 10⁻¹⁰ | 1 | 1.98 × 10⁻¹⁰ | 4.203745 | 0.0706 |
| Residual | 4.23 × 10⁻¹⁰ | 9 | 4.7 × 10⁻¹¹ | ||
| Cor Total | 2.97 × 10⁻⁹ | 14 | |||
| R-Squared = 0.7779 | Adj R-Squared = 0.8572 | ||||
| Source | Sum of Squares | Df | Mean Square | F Value | p-Value |
|---|---|---|---|---|---|
| Model | 94,256.12 | 7 | 13,465.16 | 4.82262 | 0.0274 |
| LT | 38,000.68 | 1 | 38,000.68 | 13.61015 | 0.0078 |
| IP | 116.7494 | 1 | 116.7494 | 0.041814 | 0.8438 |
| ET | 13,605.18 | 1 | 13,605.18 | 4.872769 | 0.0630 |
| IP × ET | 22,140.75 | 1 | 22,140.75 | 7.929828 | 0.0259 |
| Residual | 19,544.59 | 7 | 2792.084 | ||
| Cor Total | 113,800.7 | 14 | |||
| Adj R-Squared = 0.6565 | R-Squared = 0.8282 | ||||
| Parameters/Responses | Name | Goal | Lower Limit | Upper Limit | Lower Weight | Upper Weight | Importance | |
|---|---|---|---|---|---|---|---|---|
| Parameters | Layer thickness | is in rang | 0.15 | 0.55 | 1 | 1 | - | |
| Infill percentage | is in rang | 15 | 55 | 1 | 1 | - | ||
| Extruder temperature | is in rang | 190 | 250 | 1 | 1 | - | ||
| Responses | Criteria 1 | Maximum failure load | maximize | 711.2 | 1066.8 | 1 | 1 | 5 |
| Maximum width | is in rang | 429.5 | 1420.32 | 1 | 1 | 3 | ||
| Build time | minimize | 25 | 52 | 1 | 1 | 5 | ||
| Criteria 2 | Maximum failure load | maximize | 711.2 | 1066.8 | 1 | 1 | 3 | |
| Maximum width | maximize | 429.5 | 1420.32 | 1 | 1 | 3 | ||
| Build time | minimize | 25 | 52 | 1 | 1 | 2 | ||
| Criteria 3 | Maximum failure load | maximize | 711.2 | 1066.8 | 1 | 1 | 2 | |
| Maximum width | maximize | 429.5 | 1420.32 | 1 | 1 | 3 | ||
| Build time | minimize | 25 | 52 | 1 | 1 | 5 | ||
| Solution | Optimum Input Parameters | Desirability | Output Responses | |||||
|---|---|---|---|---|---|---|---|---|
| LT | IP | ET | Maximum Failure Load (N) | Thickness (μm) | Build Time (min) | |||
| 1 | 0.23 | 15.15 | 222.73 | 0.97 | Actual | 1016 | 1247 | 36 |
| Predicted | 950 | 1110 | 34 | |||||
| Error% | 6.49 | 10.98 | 5.55 | |||||
| 2 | 0.2 | 15.15 | 219.13 | 0.85 | Actual | 1007 | 1234 | 34 |
| Predicted | 944 | 1099 | 33 | |||||
| Error% | 6.25 | 10.94 | 2.94 | |||||
| 3 | 0.25 | 15.20 | 222.82 | 0.78 | Actual | 1021 | 1257 | 36 |
| Predicted | 1013 | 1237 | 35 | |||||
| Error% | 0.78 | 1.59 | 2.77 | |||||
© 2020 by the authors. Licensee MDPI, Basel, Switzerland. This article is an open access article distributed under the terms and conditions of the Creative Commons Attribution (CC BY) license (http://creativecommons.org/licenses/by/4.0/).
Share and Cite
Moradi, M.; Karami Moghadam, M.; Shamsborhan, M.; Bodaghi, M. The Synergic Effects of FDM 3D Printing Parameters on Mechanical Behaviors of Bronze Poly Lactic Acid Composites. J. Compos. Sci. 2020, 4, 17. https://doi.org/10.3390/jcs4010017
Moradi M, Karami Moghadam M, Shamsborhan M, Bodaghi M. The Synergic Effects of FDM 3D Printing Parameters on Mechanical Behaviors of Bronze Poly Lactic Acid Composites. Journal of Composites Science. 2020; 4(1):17. https://doi.org/10.3390/jcs4010017
Chicago/Turabian StyleMoradi, Mahmoud, Mojtaba Karami Moghadam, Mahmoud Shamsborhan, and Mahdi Bodaghi. 2020. "The Synergic Effects of FDM 3D Printing Parameters on Mechanical Behaviors of Bronze Poly Lactic Acid Composites" Journal of Composites Science 4, no. 1: 17. https://doi.org/10.3390/jcs4010017
APA StyleMoradi, M., Karami Moghadam, M., Shamsborhan, M., & Bodaghi, M. (2020). The Synergic Effects of FDM 3D Printing Parameters on Mechanical Behaviors of Bronze Poly Lactic Acid Composites. Journal of Composites Science, 4(1), 17. https://doi.org/10.3390/jcs4010017