Article

A Dimensionless Characteristic Number for Process Selection and Mold Design in Composites Manufacturing: Part I—Theory

Department of Mechanical Engineering, Research Center for High Performance Polymer and Composite Systems (CREPEC), Polytechnique Montréal, 2900 Blvd. Edouard Montpetit, Montréal, OC H3T 1J4, Canada
*
Author to whom correspondence should be addressed.
J. Compos. Sci. 2020, 4(1), 11; https://doi.org/10.3390/jcs4010011
Submission received: 14 November 2019 / Revised: 20 December 2019 / Accepted: 13 January 2020 / Published: 18 January 2020
(This article belongs to the Special Issue Feature Papers in Journal of Composites Science in 2019)

Abstract

:
The present article introduces a dimensionless number devised to assist composite engineers in the fabrication of continuous fiber composites by Liquid Composite Molding (LCM), i.e., by injecting a liquid polymer resin through a fibrous reinforcement contained in a closed mold. This dimensionless number is calculated by integrating the ratio of the injection pressure to the liquid viscosity over the cavity filling time. It is hereby called the “injectability number” and provides an evaluation of the difficulty to inject a liquid into a porous material for a given part geometry, permeability distribution, and position of the inlet gate. The theoretical aspects behind this new concept are analyzed in Part I of the article, which demonstrates the invariance of the injectability number with respect to process parameters like constant and varying injection pressure or flow rate. Part I also details how process engineers can use the injectability number to address challenges in composite fabrication, such as process selection, mold design, and parameter optimization. Thanks to the injectability number, the optimal position of the inlet gate can be assessed and injection parameters scaled to speed up mold design. Part II of the article completes the demonstration of the novel concept by applying it to a series of LCM process examples of increasing complexity.

1. Introduction

Manufacturing processes of continuous fiber composites by liquid polymer injection through fibrous reinforcements contained in a mold cavity may be grouped under the general name of Liquid Composite Molding (LCM) [1,2]. These processes have gained in popularity during the last few decades because they allow for reducing manufacturing costs and offer high flexibility in composite production. For example, the polymer resin can be injected through a fibrous preform contained in a closed and rigid mold such as in Resin Transfer Molding (RTM). It can be as well infused under vacuum in an open cavity covered by a plastic film or a flexible membrane such as in Vacuum Assisted Resin Infusion (VARI). Deformable mold cavities made of composite shells such as in RTM-Light or with twin chambers separated by a membrane have been also used and are normally regrouped under the generic term of Flexible Injection (FI) [3,4,5]. Additional LCM processes, which are notably popular in the automotive industry, are Compression Resin Transfer Molding (C-RTM) [6,7] and High Pressure Resin Transfer Molding (HP-RTM) [8].
LCM processes enable the fabrication of large composite parts having high specific mechanical properties, at a significantly lower cost and with a shorter cycle time compared to several other manufacturing technologies [9,10]. Automating production is an important factor to reduce costs that can be achieved by LCM [11]. However, the design, development, and optimization of a proper process, tool, and injection parameters still remain challenging tasks with financial consequences in the case of mistake, especially for large parts. In summary, three main challenges are faced by process engineers: (1) process selection; (2) mold design; and (3) optimization of process parameters, namely finding the best injection pressure or flow rate and setting proper injection and mold temperatures.
  • Process selection. Because of the absence of general guidelines, process selection represents the first difficulty. Among RTM, C-RTM, VARI, FI, or other processes, what is the best LCM technique to fabricate a given part by liquid injection through a porous medium? More specifically, should one inject in a closed and rigid mold (RTM), infuse under vacuum (VARI), or use a deformable cavity (FI)? Depending on the size and the number of parts to be produced, a preliminary assessment is possible by computer simulation. Nevertheless, apart from expert knowledge, no commonly accepted rules exist to choose the most suitable manufacturing process.
  • Mold design. Once the fabrication technique has been selected, no systematic information is provided on process feasibility and robustness to assist in defining the best mold configuration in terms of inlet gates/lines and vents. In addition, specific features can be considered in the mold to enhance resin injection. For instance, flow channels and flow enhancement layers on top and/or bottom of the preform can speed up mold filling. Moreover, the resin can be heated to decrease viscosity and create a faster flow. These solutions aim at controlling the two main physical parameters that govern composite manufacturing, namely pressure and temperature in the mold. Although computer models represent a useful tool to simulate the injection process and improve mold design, expert knowledge is again necessary to use it effectively. Given the high number of design variables, the analysis of the different solutions is often arduous and computationally demanding. Therefore, the final processing decisions remain today mostly based on experience and experimental trials.
  • Optimization of process parameters. The performance of LCM processes depends on the injection pressure and/or the liquid flow rate. Another critical factor is the viscosity of the resin, which depends on temperature. What is the optimal inlet pressure for a fast injection with minimum void content and limited fabric deformation? What is the best temperature to minimize resin viscosity and achieve a proper impregnation of the fiber bed? How do pressure and temperature changes affect the fill time in a complex mold? All of these questions can be partially answered by computer simulations, once the process has been defined. However, simple guidelines are still missing to both select a manufacturing technique and optimize process parameters. This latter task requires evaluating the interconnections between the fill time and the two key physical parameters of pressure and temperature (Figure 1).
To summarize, composite engineers face complicated challenges. Not only must they rely on their own experience or on expert advice to choose the fabrication process (Challenge 1), but extensive virtual prototyping and experimental trials are also needed to choose a suitable mold configuration (Challenge 2) and set optimal process parameters (Challenge 3). As an example, for large and complex parts fabricated in heated molds, optimal mold design and selection of injection parameters based on numerical simulations remain very time-consuming. At the same time, practical approaches based on trial and error translate into long lead times and elevated costs.
The present article introduces the original concept of a dimensionless “injectability number” to address the above-mentioned challenges. As illustrated in Figure 1, this number connects the primary process parameters. It is defined by a time integral of the ratio of the injection pressure to the resin viscosity, and represents an invariant of Darcy’s law, the mathematical model commonly used to describe flows through porous media [12]. This article shows how the injectability number can offer a simple quantitative way to evaluate the industrial feasibility of LCM processes. It can also assist in designing the mold and setting up a proper injection strategy. This new concept is actually general and applies not only to LCM, but also to any liquid injection process through porous media.
The main features and the usability of the injectability number are presented in details in Part I (Theory) of this article. In Part II (Applications), the concept will be applied to a series of composite parts of growing complexity: a rectangular laminate fabricated by different injection strategies, two geometric models of automotive hoods, a perforated reservoir box and a complex fuselage section with crossing ribs for aerospace industry. In the cases investigated in Part II, the injectability number for RTM will be compared to values obtained for other LCM process variants such as Compression-RTM and VARI.
Part I of the article is organized as follows: after a review of the state of the art in Section 2, the injectability number is defined in Section 3 as a dimensionless quantity associated with a specific reinforcing material and mold configuration. The invariance of the injectability number with respect to process parameters is then examined, highlighting its link to the cavity filling pattern to lay the ground for a detailed demonstration in Appendix A. In Section 4, the injectability number is evaluated analytically and numerically for unidirectional injections. This allows for establishing a connection between the devised dimensionless number and the difficulty of injecting a liquid through a porous medium. Section 5 presents possible ways to use the injectability number, considering the above-mentioned engineering challenges. Finally, Section 6 summarizes the theoretical analysis.

2. State of the Art

The scientific investigations [2,13,14] carried out over the last 50 years on LCM techniques have provided experimental, analytical, and numerical methods to investigate mold filling for different LCM processes. Various software packages are nowadays available to carry out numerical simulations [15,16,17], which assist in defining an effective tool configuration, namely positioning inlet gates and vents. Different filling strategies and manufacturing parameters (injection pressure or flow rate, resin and mold temperatures, etc.) can be virtually evaluated before fabricating the mold. However, although computer simulation is of great help to speed up mold design, it does not provide a fully optimal solution yet. A series of virtual tests based on trial and error are needed to analyze several tool configurations and process parameters, before a better solution can be identified.
While many studies have been conducted to optimize the number and positions of inlet gates in molds [18,19,20], a robust and effective procedure is still not available. The problem is rather complex, given the number of interconnected physical variables and the various possible tool configurations. However, it has become possible to optimize single process parameters, for example to find the best time-dependent injection flow rate [21] and to improve the selection of processing temperatures, so as to reduce cycle time and improve part quality [9].
Process optimization has indeed become an active field of research. To minimize void content, partial optimization based on the modified capillary number can be performed [22,23]. The heating cycle during cure can be optimized to prevent defects and reduce warpage [24,25]. Möller et al. [26] used an approach based on the integration of the fluidity until gel time, in order to study the processability of different polymers by resin infusion. Simplified procedures have also been proposed for control of the injection and curing stages as well as for online assessment of laminate quality [27,28]. However, no systematic, robust, and efficient methodology has been devised yet to optimize the mold features and the whole injection process concurrently.
Furthermore, the selection of a proper manufacturing technique raises questions that have not been fully investigated in the scientific literature up to now. The limitations of each process have not been thoroughly identified and documented. Critical issues such as the maximum length of the liquid flow path or limitations for large or thick composite parts have not been comprehensively addressed yet to provide guidelines to end-users.

3. Injectability Number

This section gives the formal definition of the injectability number and discusses the invariance property with respect to process parameters. A mathematical demonstration is given in Appendix A. For ease of reference, Table 1 lists the symbols used in the article.

3.1. Definition

Consider a mold cavity with one inlet gate and one outlet vent: for the sake of simplicity and robustness, having only one injection port and a single vent is a desirable molding feature from a practical point of view. Let Pinj denote the relative injection pressure, i.e., the difference between the inlet and outlet pressures, and µ the viscosity of the liquid injected at the inlet. The viscosity is generally a function of the temperature T and the degree of curing α for thermosetting polymers (0 ≤ α ≤ 1). The injectability number In is defined as the following dimensionless quantity:
I n = 0 t inj P inj ( t ) μ ( α ( t ) , T ( t ) ) d t ,
where tinj represents the fill time and t denotes the current time during injection. Note that the temperature, which affects viscosity directly and indirectly through the degree of curing, may vary over time as well as exhibit spatial gradients. However, only isothermal injections will be considered here; namely, the temperatures of the liquid resin and of the fibrous reinforcement are assumed to remain identical and uniform everywhere in the mold cavity, although they may change in time during injection.
The integrand in Equation (1) is the ratio of the pressure (representing the external forces driving the injection) to the viscosity (source of internal forces resisting liquid impregnation). In essence, the injectability number evaluates the ratio of time-dependent parameters that regulate forces both causing and hindering the resin flow. Therefore, it can be intuitively seen as a measure of the total effort required to fill a mold cavity. Our hypothesis is that lower injectability numbers imply easier impregnation of the fibrous reinforcement. This means that less external energy—for example, a lower injection pressure—is required to overcome the internal resistance to the liquid flow.
The injectability number can evaluated through Equation (1) using results of computer simulations as well as real experimental data of temperature and pressure. As a matter of fact, a pressure sensor is often placed at the inlet gate in RTM molds. The experimental and numerical values of the injectability number can thus be compared, providing an additional way to validate process simulations. A discussion of other uses of the injectability number will follow in Section 5.

3.2. Invariance Property

Assuming that the fiber volume content vf and permeability K of the fibrous reinforcement do not change in time during the injection, the total volume Vinj of liquid injected to fill the mold cavity is independent of process parameters like pressure and flow rate. Under this condition, the injectability number In, which is proportional to Vinj, is also a constant with respect to the process parameters. More specifically, for a given cavity geometry and preform characteristics—namely, a given permeability distribution in the cavity—the injectability number depends only on inlet and outlet positions. The invariance of In with respect to process parameters can be proven resorting to Darcy’s law and to the uniqueness of its solution [29], as shown in Appendix A.
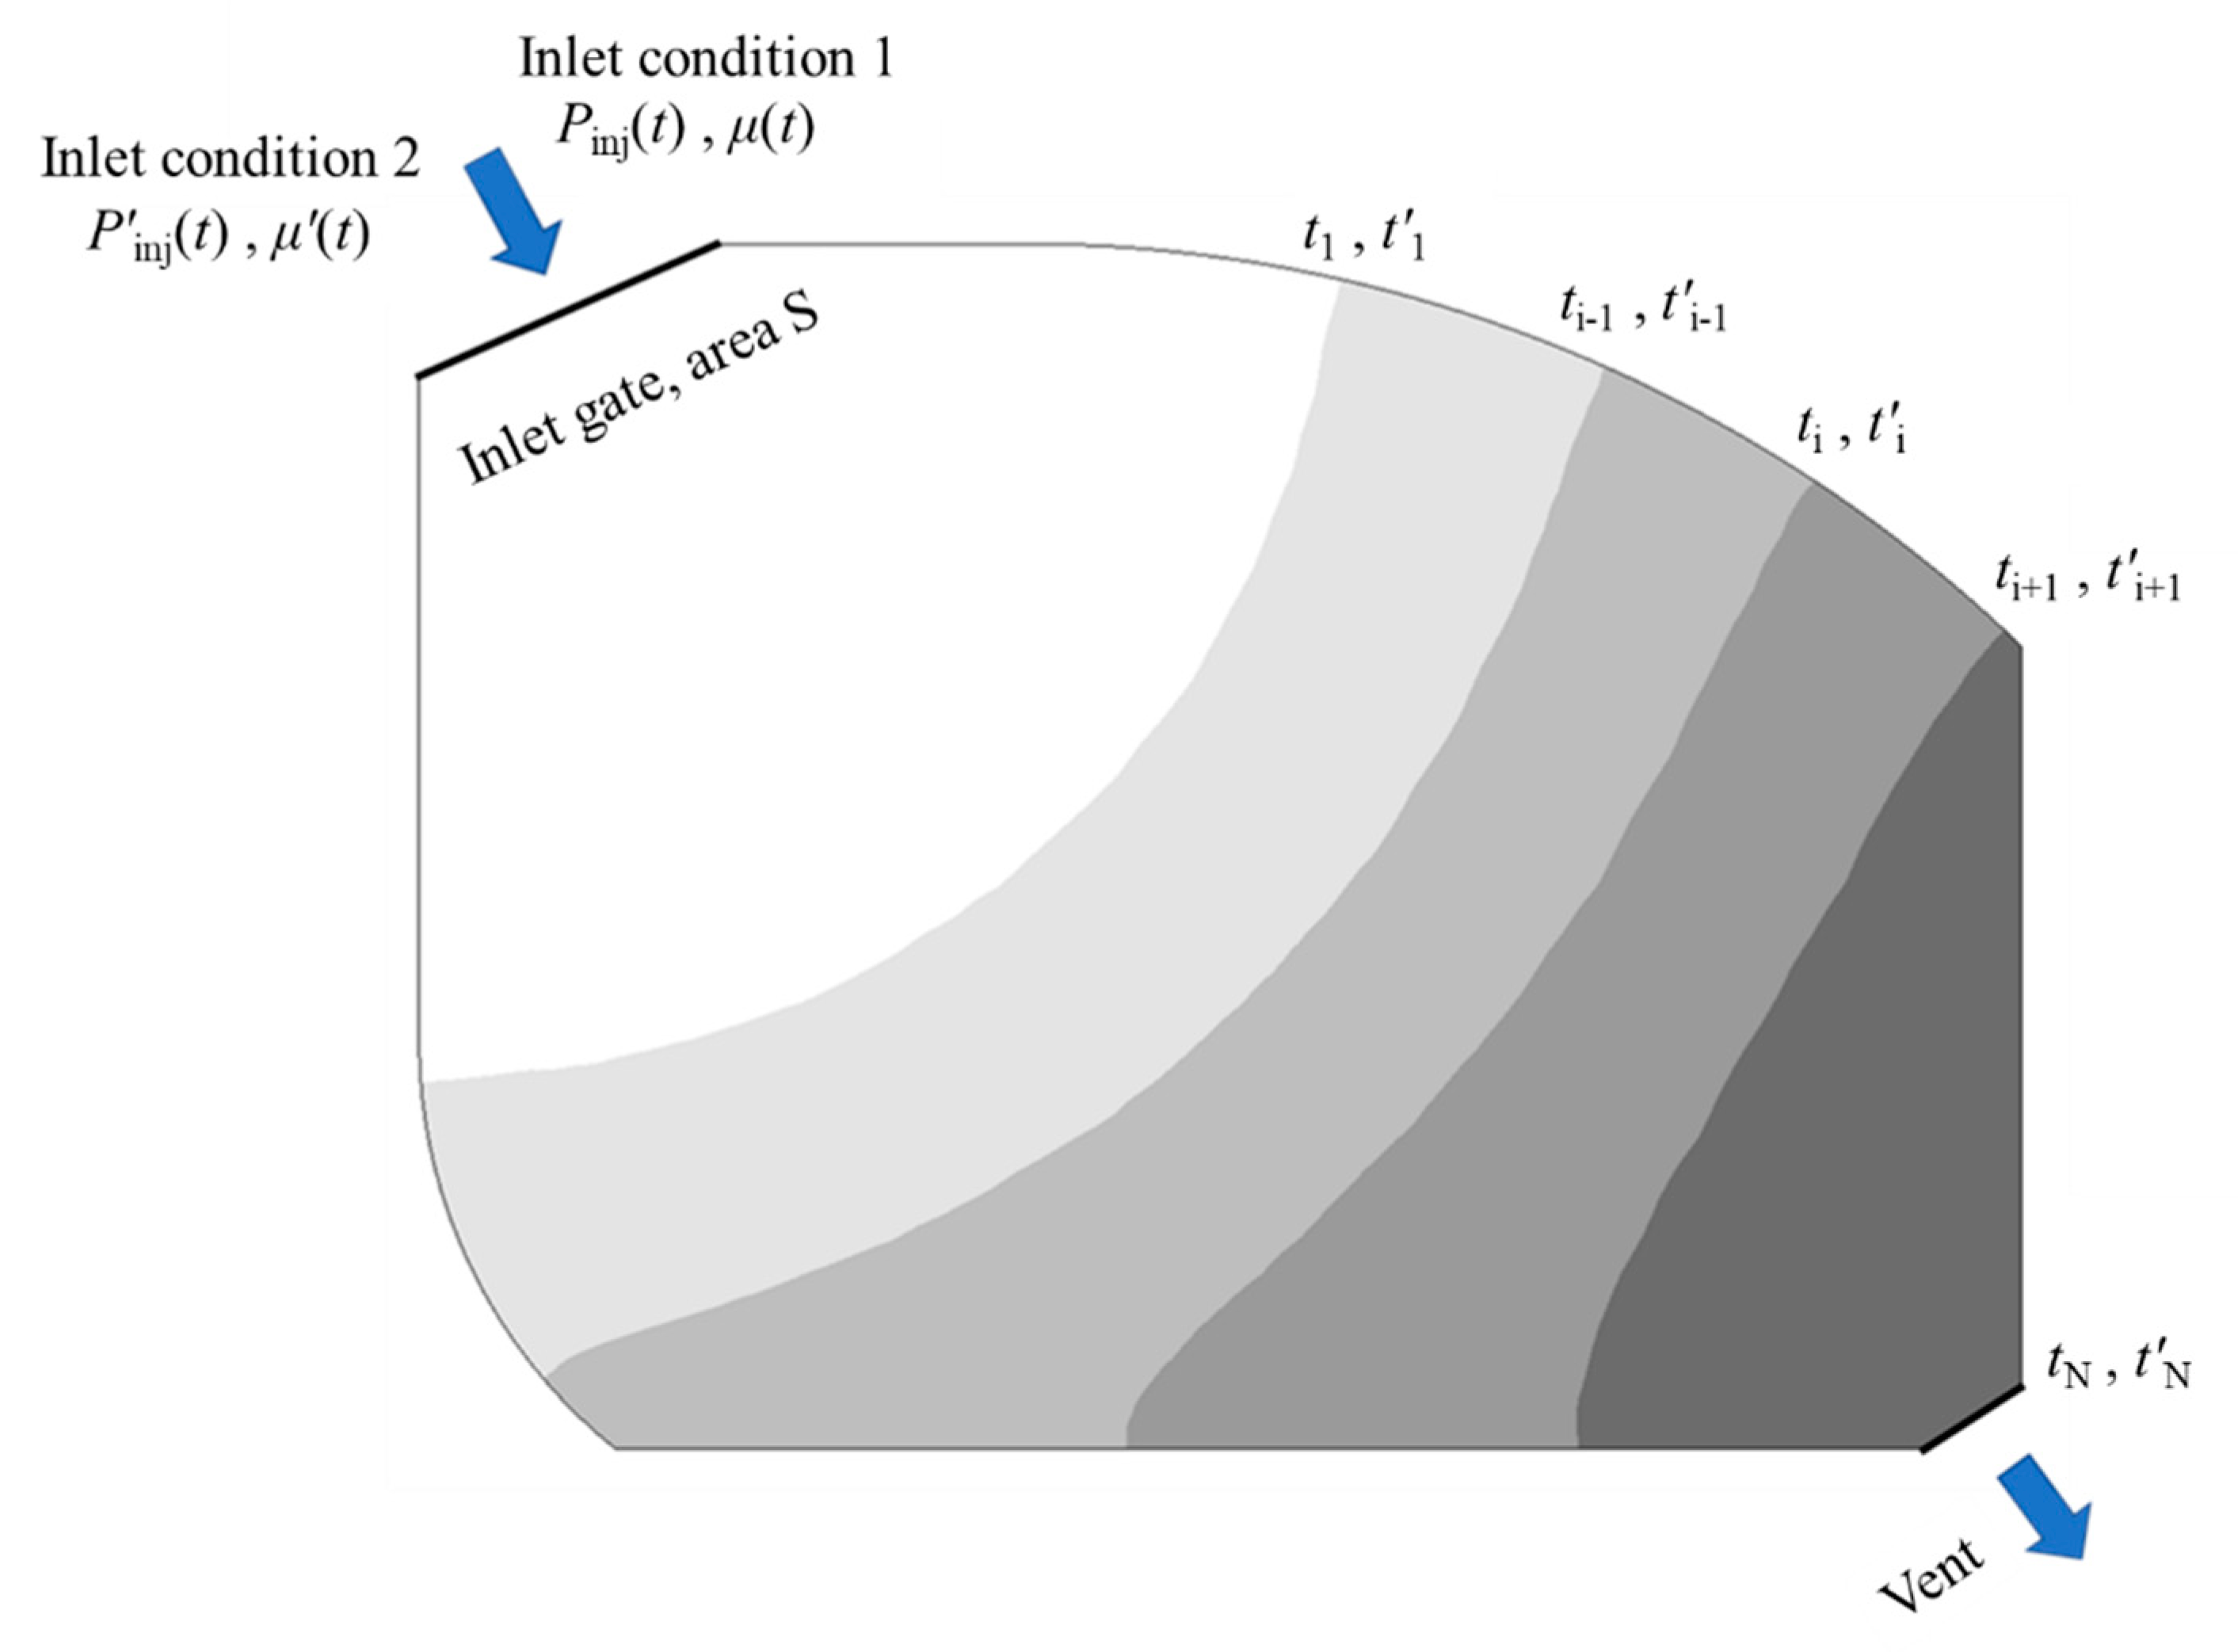
It is worth pointing out that the invariance property of the injectability number is linked to the sameness of the filling pattern. Consider the generic mold configuration illustrated in Figure 2: at every time step ti, the liquid fills a certain volume delimited by a specific flow front shape. At the final time step tN, the liquid reaches the vent location (tN = tinj) and the total liquid volume has been injected. By modeling the liquid flow with Darcy’s law [2,13,14], the unique sequence of flow fronts during cavity filling can be determined for set material properties and inlet conditions—for example, a time-dependent injection pressure Pinj(t). Supposing the permeability field does not vary over time, the linearity of the flow model with respect to the pressure field [29] implies that any different injection pressure inj(t) will still provide the same unique flow front shapes, although at different times. In other words, if the injection pressure (or the flow rate) increases or decreases, the flow becomes faster or slower, but the filling pattern does not change, since the mold geometry, port configuration, and preform permeability remain the same. Similarly, any change in time of the viscosity μ(t) affects the flow rate and fill time, but not the filling pattern.
As demonstrated in Appendix A, the injectability number is invariant in the case of identical filling patterns because this number is associated with the volume of liquid injected into the mold, and the same liquid volume is required to fill the gap between same consecutive positions of the flow fronts. Therefore, a unique value of In can be calculated, independently of the chosen set of process parameters, for each mold configuration with specific preform properties. The invariance of the injectability number is a useful feature not only to rate different mold configurations and injection strategies, but also to generate “moldability” maps and scale process parameters (see Section 5).

4. Analysis of Unidirectional Injection Cases

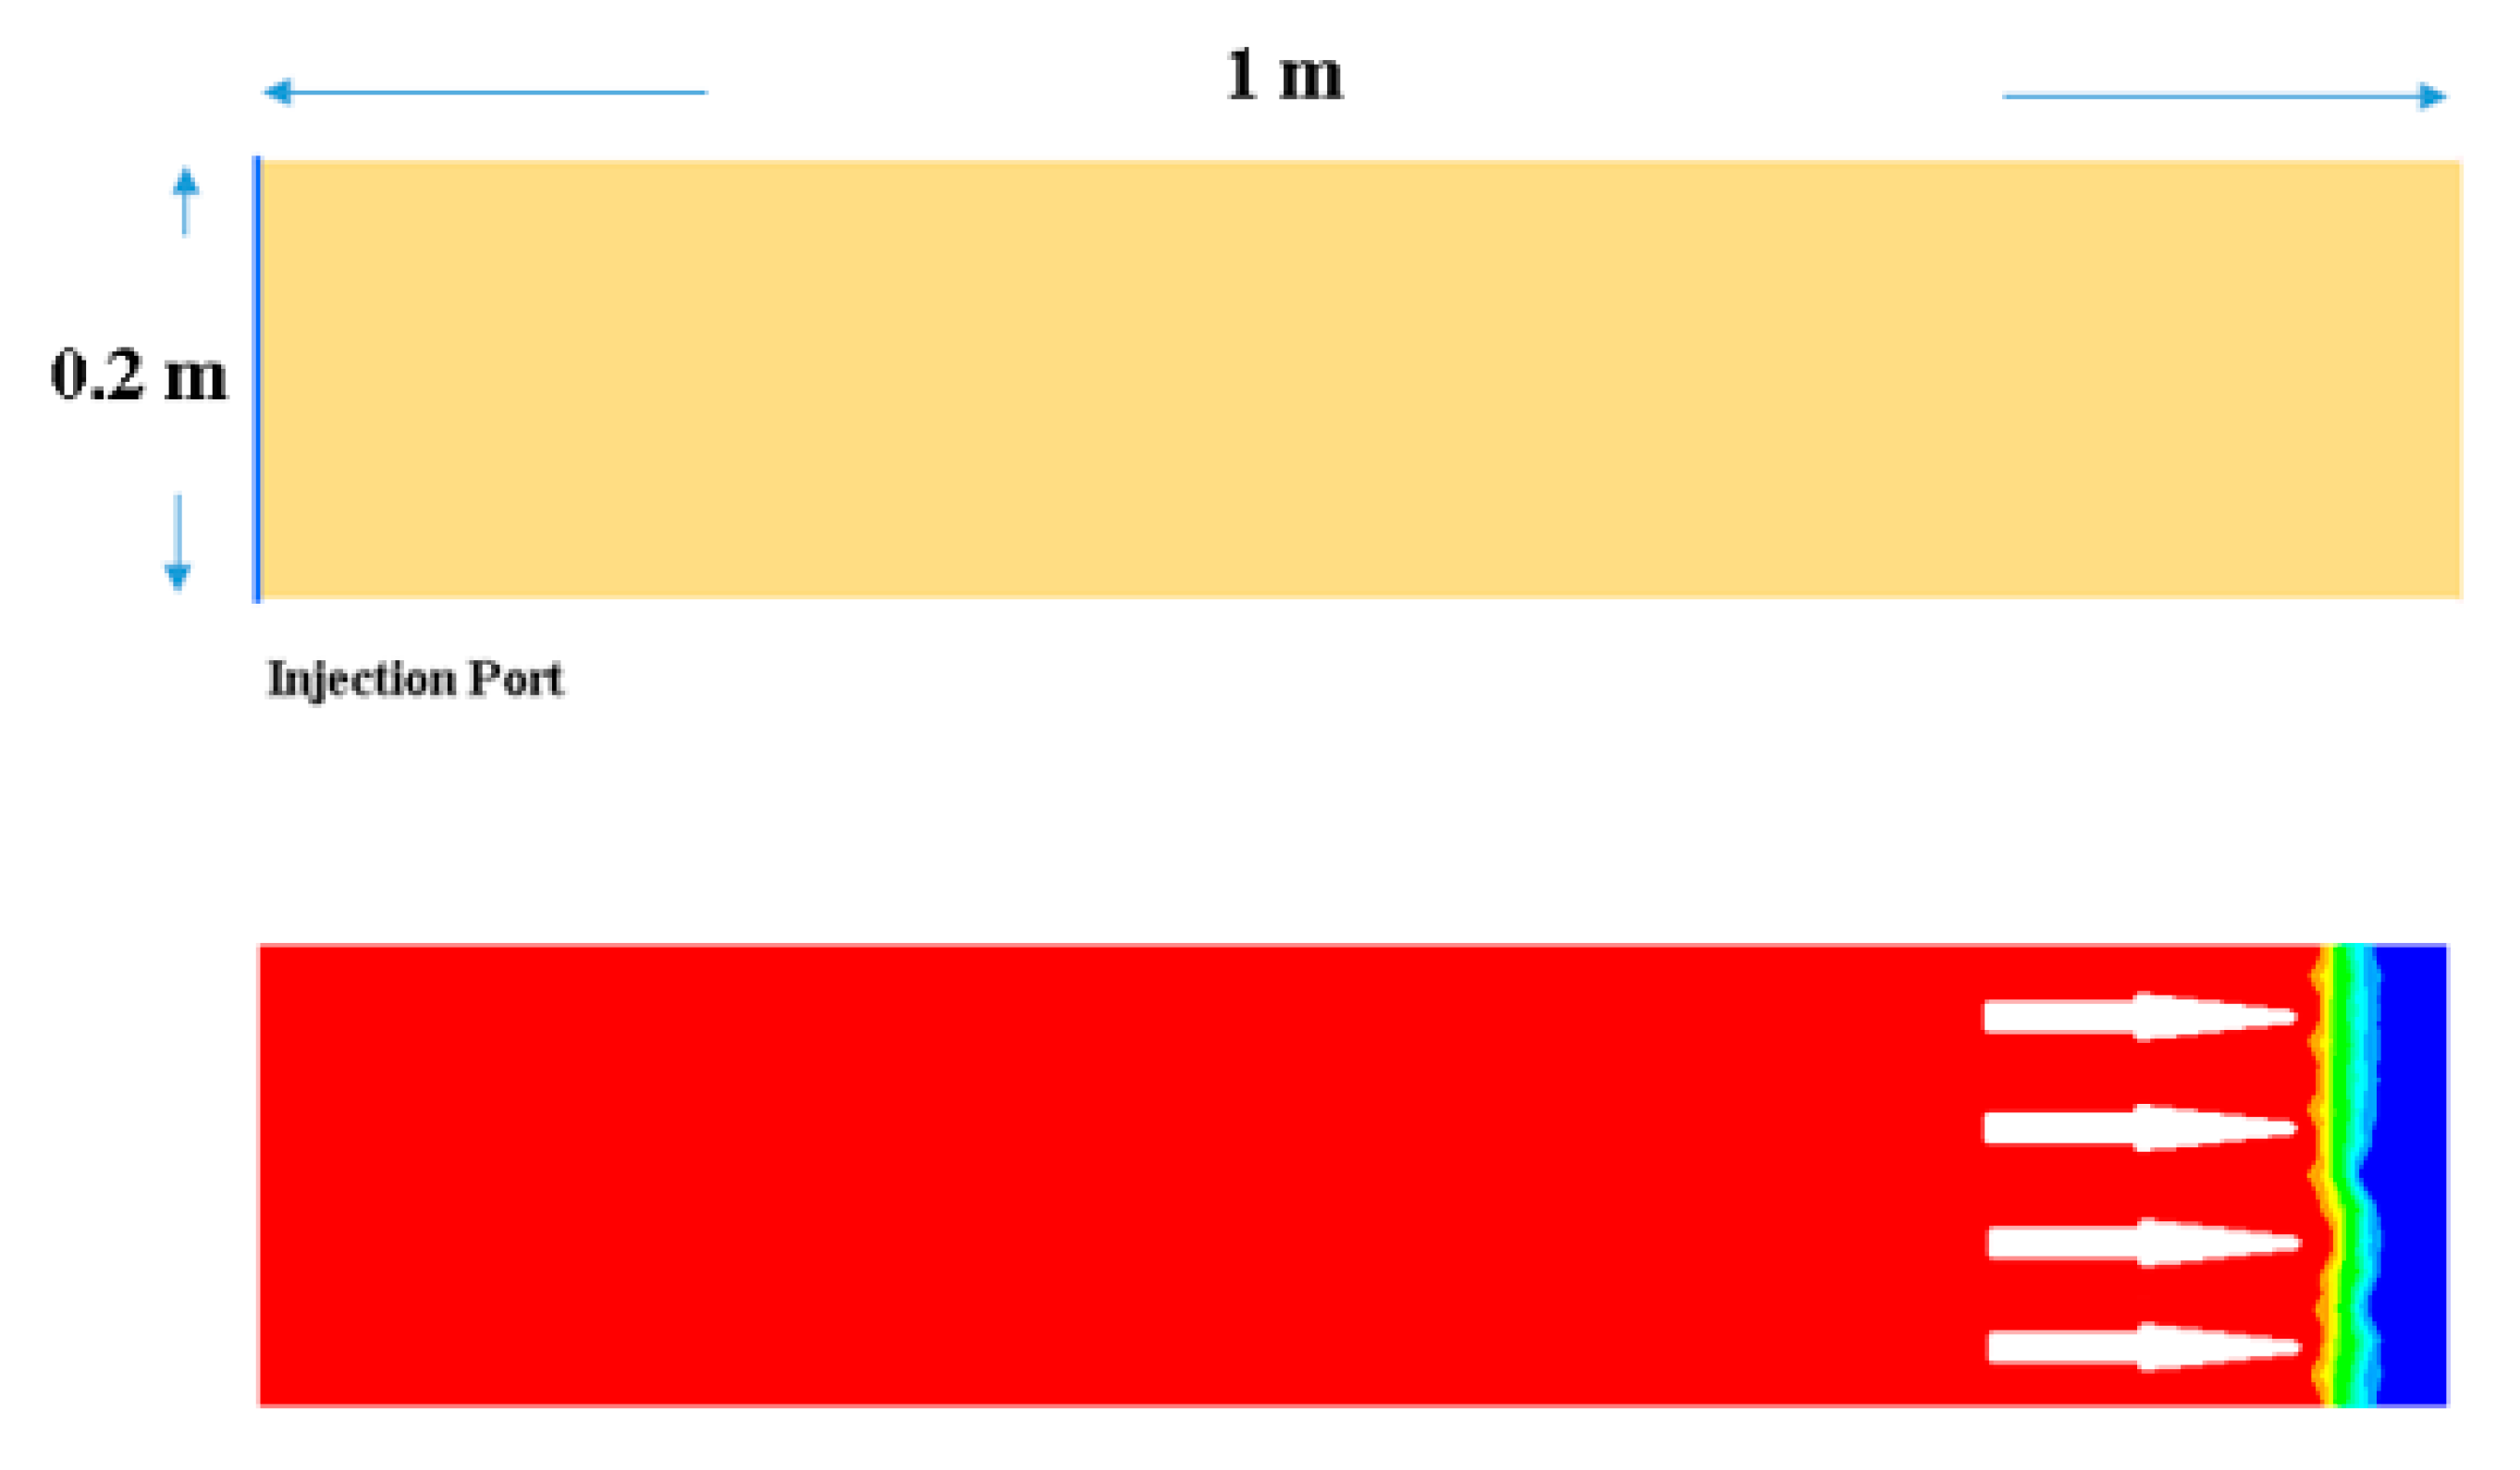
A first verification of the research hypotheses is carried out for unidirectional injections in a rectangular cavity of length L = 1 m, width W = 0.2 m and thickness H = 3 mm (Figure 3). In this set-up, the injectability number can be calculated analytically for constant injection pressure or flow rate, as shown in the following subsections. In the cases of time-varying pressure or flow rate, numerical simulations are run to evaluate the injectability number and confirm its invariance with respect to process parameters. In order to reflect actual manufacturing conditions, typical values of permeability K = 2.5 × 10⁻¹⁰ m2, porosity φ = 0.5 and liquid viscosity µ = 0.1 Pa·s are selected for this analysis. The investigation of rectangular cavity filling will be extended to non-unidirectional injections in Part II, considering various locations and shapes of the inlet gate and different combinations of parameters.

4.1. Analytical Solution at Constant Injection Pressure

In the case of unidirectional flow at constant injection pressure and temperature, Darcy’s law gives the following solution for the fill time [1]:
t inj = φ μ L 2 2 K P inj ,
where the porosity φ is the complement of the fiber volume content vf = 1 − φ and the mold length L corresponds to the characteristic length of the longest flow path in the mold. Combining Equations (1) and (2) leads to:
I n = 0 t inj P inj μ d t = P inj μ t inj = φ L 2 2 K .
Equation (3) shows that the injectability number is only a function of the characteristic length of the mold and of the properties of the fibrous material (permeability and porosity). It does not actually depend on process variables like the injection pressure or temperature (nor on liquid viscosity). In the reference example considered here, the value of the injectability number calculated by Equation (3) is In = 109.

4.2. Analytical Solution at Constant Injection Flow Rate

Consider now the case of a unidirectional injection at constant flow rate Qinj. The flow front position xf moves forward proportionally to the time t until it reaches the total mold length L at the final fill time tinj as follows:
x f ( t ) = Q inj φ S t       L = Q inj φ S t inj ,
where S denotes the mold cross-section (S = W·H). In this case, Darcy’s law gives the following analytical solution for the injection pressure [1]:
P inj ( t ) = μ Q inj 2 φ S 2 K t .
Equations (4) and (5) are then used in Equation (1) to calculate the injectability number for a unidirectional injection at constant flow rate:
I n = 0 t inj P inj ( t ) μ d t = Q inj 2 φ S 2 K t inj 2 2 = φ 2 K ( Q inj φ S t inj ) 2 = φ L 2 2 K ,
which gives the same result as Equation (3) for constant injection pressure. The injectability number, which is again equal to 109 for the considered reference parameters, depends also here only on the mold geometry (via the characteristic length L) and on the properties of the textile preform (permeability K and porosity φ). Note that the preform permeability is generally an exponential function of fiber volume content [30]; thus, it dominates porosity in the ratio K/φ. Therefore, the injectability number given by Equations (3) and (6) for a unidirectional flow is mainly determined by the permeability and the characteristic length L of the cavity. When L increases, the injectability number becomes larger and the injection is more difficult. When permeability increases, the injection is easier and the injectability number decreases. Consequently, based on the analytical expression of the injectability number for unidirectional injections, this dimensionless number gives information on the difficulty to fill a mold cavity, independently of resin viscosity and of injection parameters.

4.3. Computer Simulations for Constant and Time-Varying Pressure and Flow Rate

The analysis of unidirectional injections is completed here by considering time-varying injection pressure and flow rate, in addition to the cases of constant injection parameters. For this purpose, computer simulations are run with the software PAM-RTM [16], reproducing injections in the rectangular mold of Figure 3 with the same material properties as above. The goal of the simulations is to determine the fill time tinj and the injectability number In from Equation (1). The finite element mesh used in the computer simulations is shown in Figure 4 and consists of 7050 triangular elements. Note that the mesh size influences the numerical error of the simulations; thus, it contributes to the accuracy of the calculation of the injectability number In. The following four process parameters are considered in this analysis:
  • Constant injection pressure Pinj = 2 bar.
  • Constant flow rate Qinj = 2 cm3/s.
  • Time-dependent injection pressure Pinj(t) = A·f(t), with A = 2 bar and f defined by Equation (7).
  • Time-dependent flow rate Qinj(t) = B·f(t), with B = 2 cm3/s and f defined by Equation (7).
It is worth remarking that, in real applications, an injection at constant flow rate is limited in time by the maximum sustainable pressure allowed by the injection pump and the mold.
In the case of time-dependent injection pressure and flow rate, the following function f was chosen to reproduce the variability of injection parameters in time:
f ( t ) = 1 e ζ ω t b sin ( ω b t + tan 1 ( b ζ ) )
with ω = 0.025 Hz, ζ = 0.5, and b = (1 − ζ2)1/2. As plotted in Figure 5 for the injection pressure, this function replicates the typical behavior of injection pumps, namely showing a ramp stage followed by overshooting, adjustment/damping and, finally, stabilization.
Table 2 reports the fill times and injectability numbers calculated for the four cases listed above. The results verify our hypothesis since the dimensionless numbers are identical in all cases and thus independent of process parameters. Moreover, the value of In is equal to the analytical solutions obtained by Equations (3) or (6). This invariance with respect to process parameters will be confirmed also for more complex injection cases in Part II. As detailed in the next section, the knowledge of the injectability number for a given mold geometry and material properties (i.e., permeability and porosity) allows for finding the fill time for any other arbitrary injection pressure or flow rate.

5. Usability of the Injectability Number

This section gives an insight into how the injectability number can assist composite engineers to address the three main challenges mentioned in Section 1: (1) process selection, (2) mold design, and (3) optimization of process parameters.

5.1. Process Selection

For a given composite part to be fabricated, it is possible to estimate the relative efficiency of different LCM processes by evaluating the corresponding injectability numbers. The guiding principle is that the lower the injectability numbers are, the more favorable/efficient the associated injection processes are. Moreover, these dimensionless numbers provide quantitative information leading to a better understanding of the specific advantages and limitations of various LCM techniques. As an example, the expression of In in Equations (3) and (6) for unidirectional injections may explain why through-thickness injections are often easier to carry out than in-plane flows in a rigid and closed mold. Consider the manufacturing of a 5 mm-thick laminate with a length of half a meter: although the through-thickness permeability is normally between 50 and 100 times lower than the in-plane permeability, the shorter flow path through the thickness makes the corresponding injectability number be at least two orders of magnitude lower than the same number for an injection along the length direction. LCM processes like FI and VARI with a distribution medium can largely resemble through-thickness injections and thus lead to lower injectability numbers than standard RTM, in which the mold is usually filled by an in-plane flow. A specific comparison of LCM processes based on injectability numbers will be exposed in Part II for different composite parts.
It is worth remarking here that the injectability number can be evaluated even if the conditions for its invariance (see Section 3.2) are not satisfied. For instance, the injectability number can be assessed if temperature is not uniform in the cavity or the preform permeability changes in time. Moreover, this number can be approximated using the simple analytical expression of Equation (3) and the concept of equivalent permeability in vacuum infusion or RTM [31].

5.2. Mold Design

Besides comparing different LCM technologies, the injectability number allows for evaluating the efficiency of different mold configurations in terms of inlet gate and vent positions. The idea is again that the most favorable configurations correspond to the lowest injectability numbers. General guidelines on process feasibility can also be derived from the injectability number by introducing the concept of equivalent length Leq, which is defined by the following expression deriving from Equation (3):
L e q = 2 K φ I n .
The equivalent length relates the injectability number for a generic mold configuration to a physically meaningful variable, i.e., the length of the maximum liquid flow path in a unidirectional injection. Since it is typically difficult in RTM to ensure a good resin impregnation over distances longer than approximately 1.5 m, Equation (8) can provide a practical criterion to assess the feasibility of injections in complex molds by establishing a connection with equivalent unidirectional flow cases.
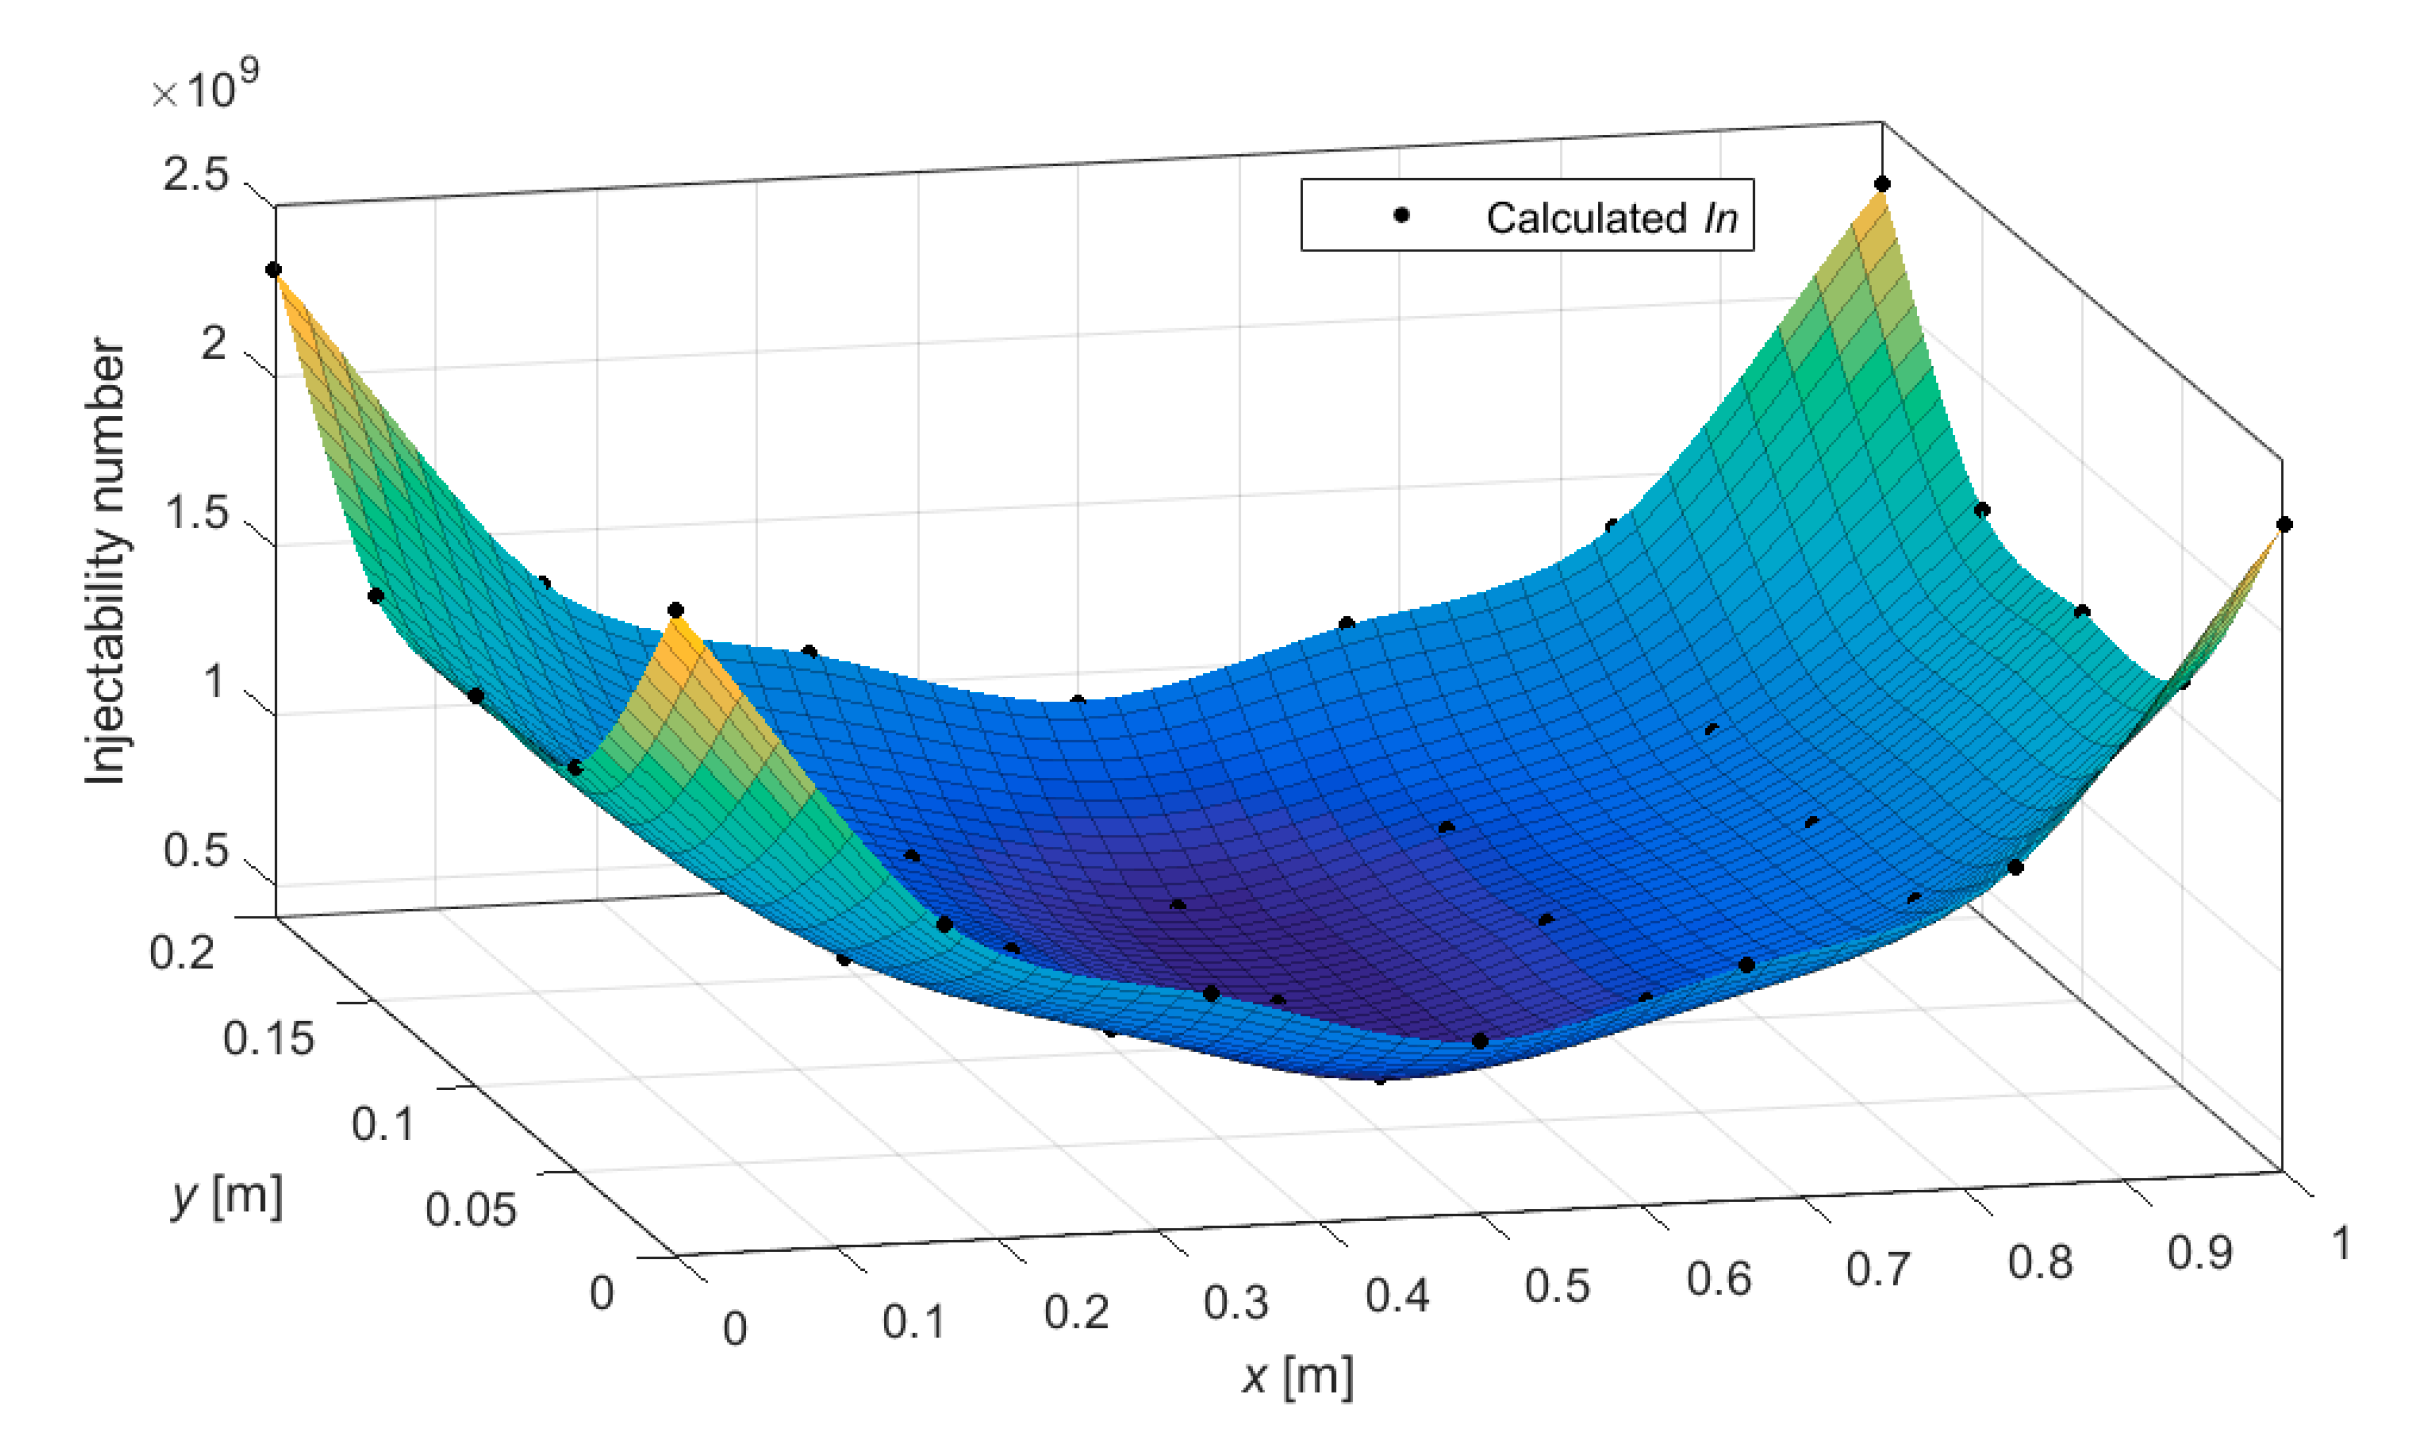
As the mold cavity shape is defined by the final part geometry, the best position of a point inlet can also be found directly by calculating the injectability number for a series of gate positions. In the example of Figure 6, the injectability number In is shown as a function of x and y, which represent the coordinates of the inlet gate in a two-dimensional mold cavity. The coordinates of the optimal inlet gate correspond to the minimum value of the injectability number, which is at the cavity center in the case of Figure 6.

5.3. Optimization of Process Parameters

For a specific part geometry and mold configuration, the injectability number establishes classes of process parameters relating injection pressure and temperature (through resin viscosity) with the fill time. Therefore, it constitutes a simple tool to select, optimize, and scale up those parameters. This can speed up LCM process development and increase its robustness—for example when resin system, pump equipment, and/or mold heating devices are to be changed.
Once the injectability number has been calculated for a given mold configuration, it is possible to determine how the fill time is affected by any parameter variation, thanks to the invariance property of In. Consider for simplicity an injection carried out at constant injection pressure Pinj and constant temperature T (and thus constant viscosity µ, assumed to depend only on T). In this situation, the injectability number allows for evaluating the fill time tinj straightforwardly as follows:
I n = P inj t inj μ ( T )       t inj = μ ( T ) P inj I n .
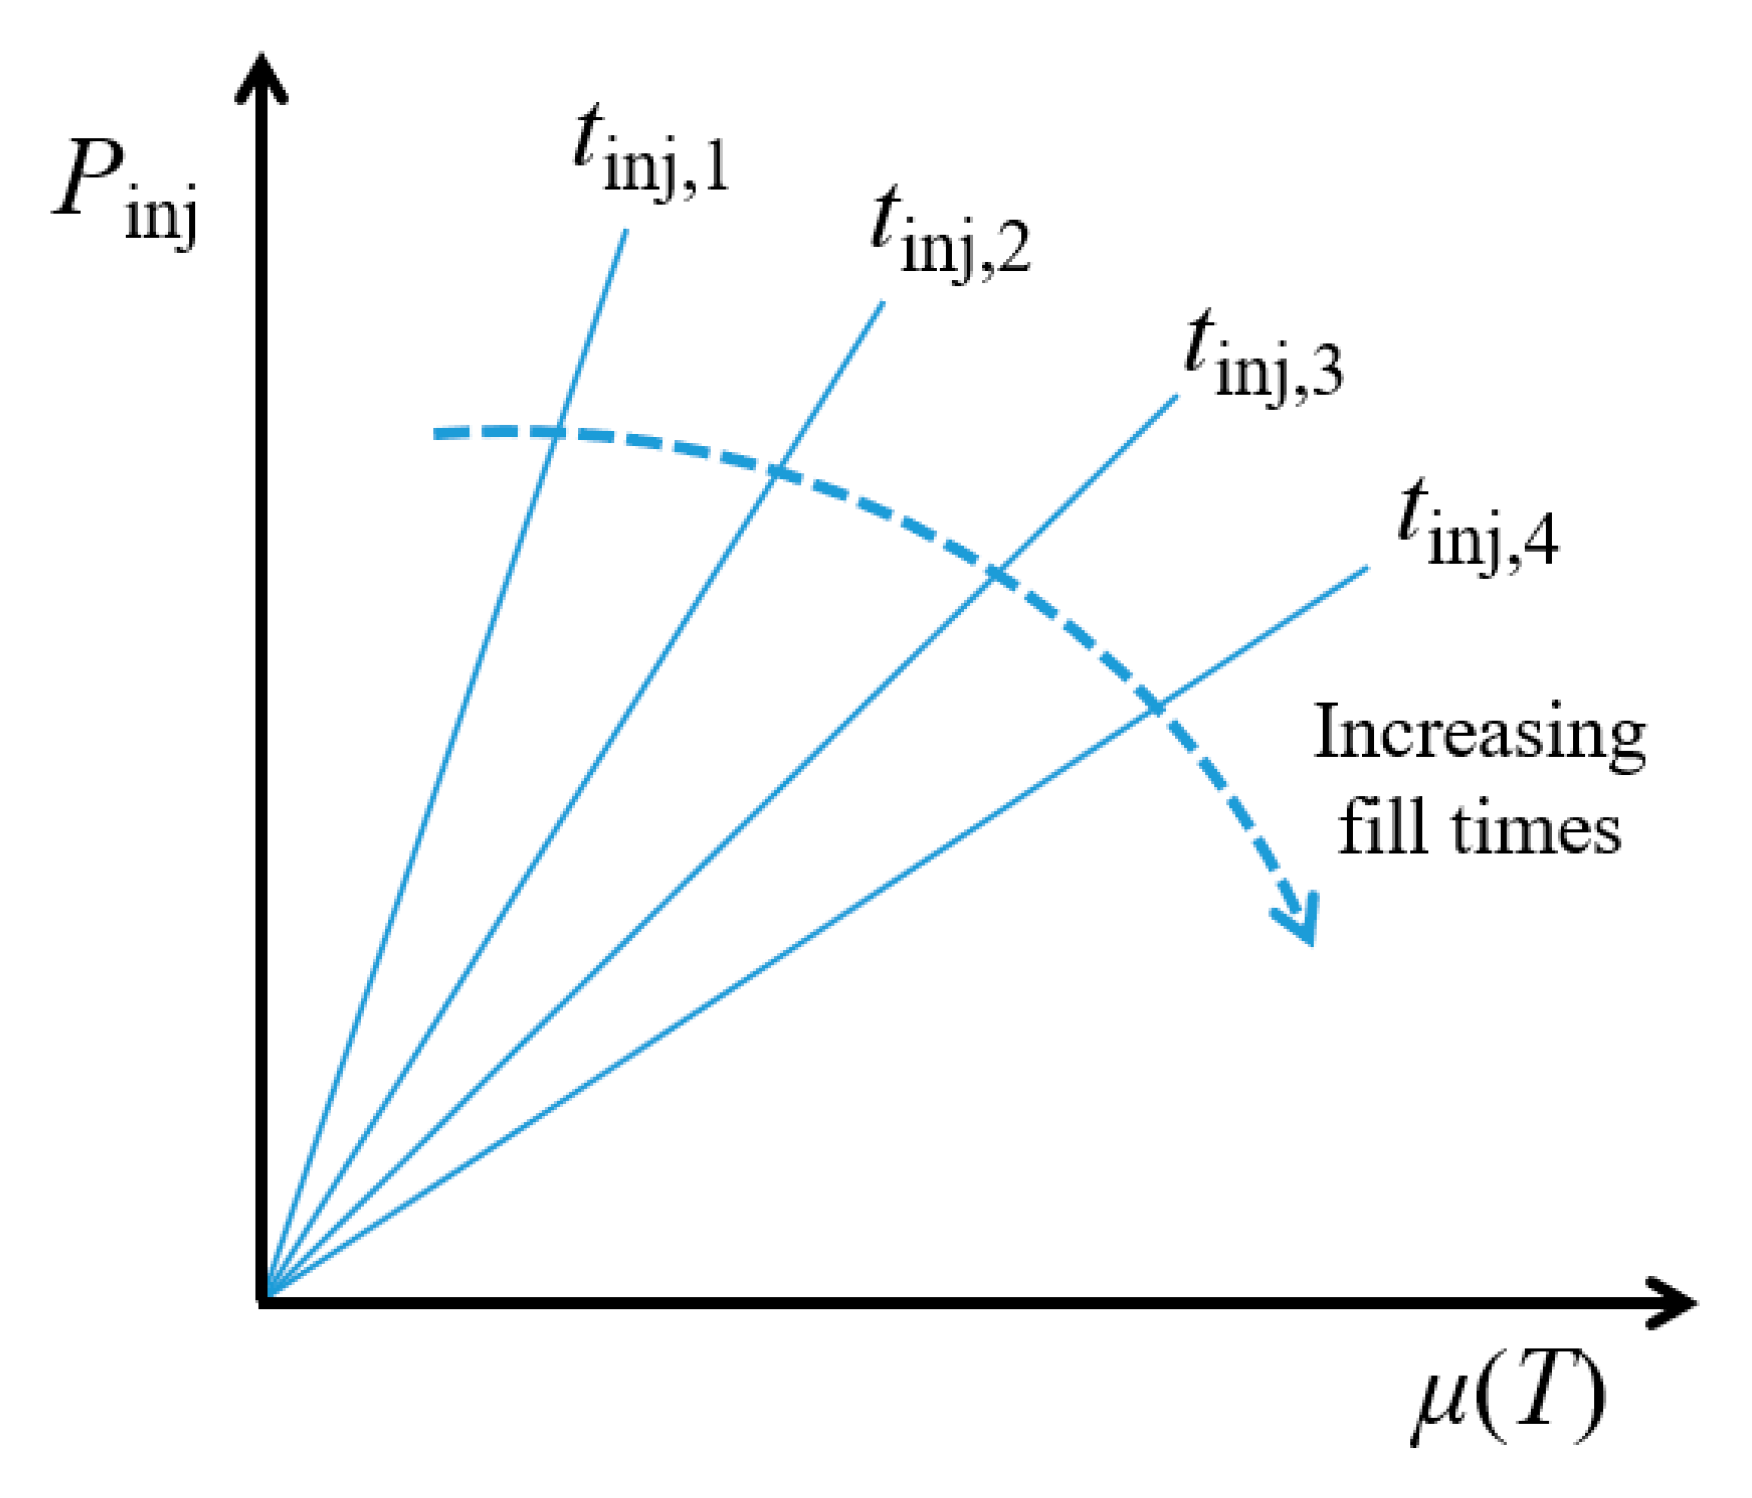
Equation (9) enables to scale the fill time with the injection pressure and the viscosity, as long as the injectability number is known for a single combination of parameters (and just one process simulation is needed for such a purpose). It is interesting to note that the injection pressure must increase by a factor 2 to halve the fill time, while the same result is obtained by just decreasing the viscosity by 50%. Additionally, a parameter diagram can be generated as in Figure 7, which illustrates the isochrones, i.e., curves of identical fill times. Replacing viscosity with its analytical expression as a function of temperature in Equation (9), the parameter diagram can be rebuilt with temperature and injection pressure as Cartesian coordinates.
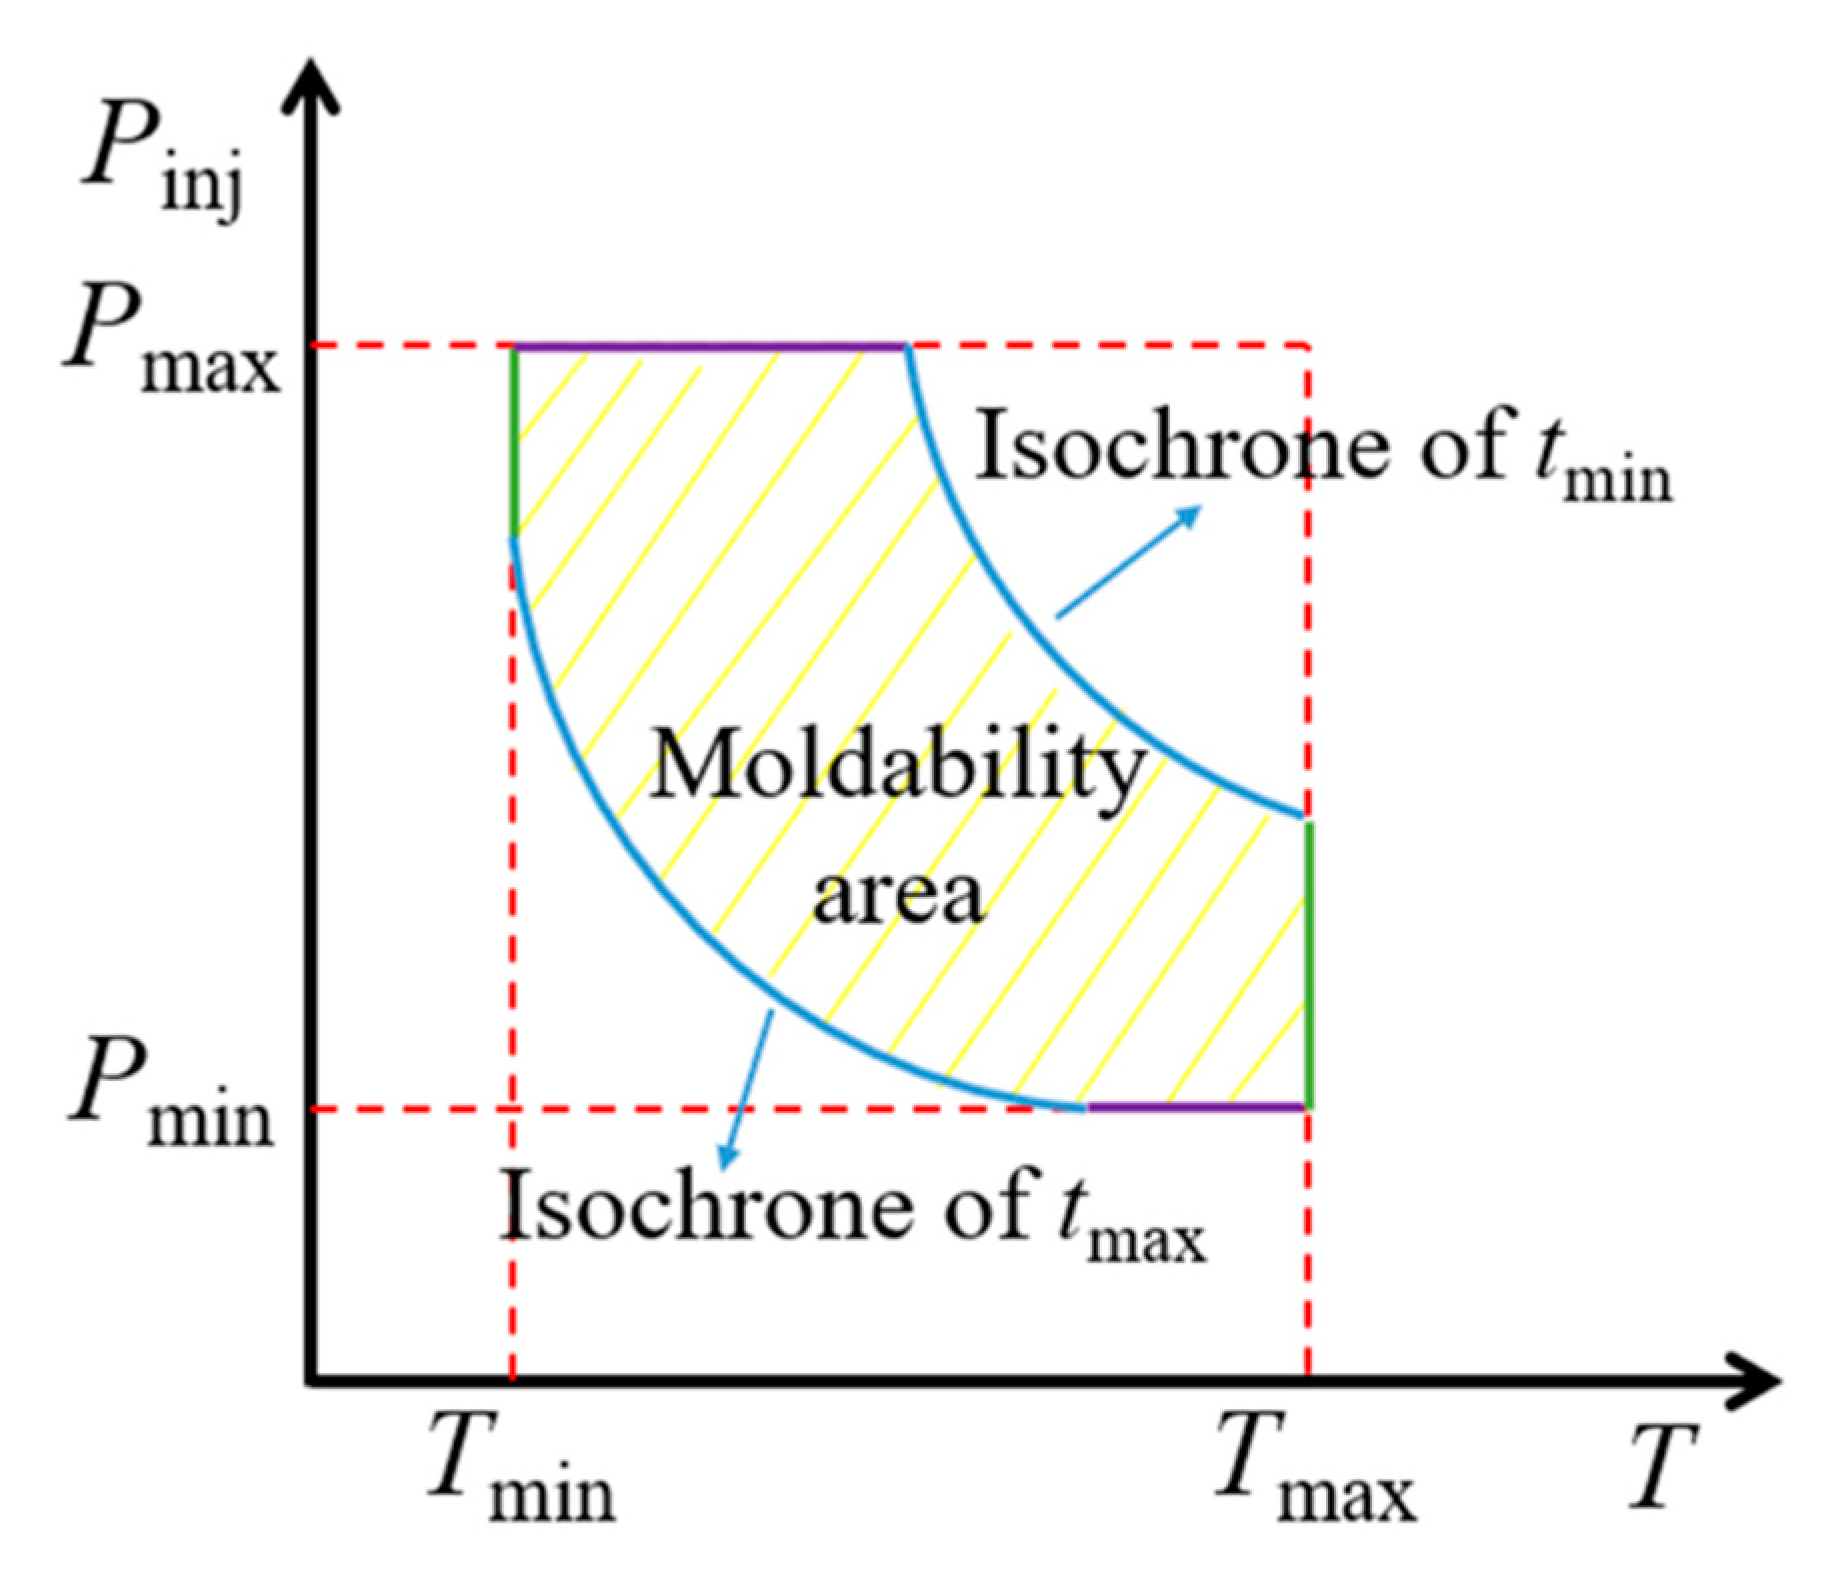
In order to draw a complete moldability map, minimum and maximum values of each process parameter must be set. Those limit values are defined by the manufacturing set-up or other constraints [32]: for example, Pmin is the minimum injection pressure and Pmax is the maximum pressure reachable by the injection pump or is determined by the maximum allowed mold deflection; the limit temperatures Tmin and Tmax are set by the mold heating system or by the overall thermal stability requirements; the limit fill times tmin and tmax may be given by productivity constraints or by limitations due to viscosity or even be connected to fiber washing issues [31].
A typical moldability map is shown in Figure 8. After evaluating the invariant injectability number by running a single simulation at arbitrary injection pressure and temperature, such a map can be constructed analytically with the scaling function of Equation (9) and the set parameter limit values. Building the moldability map is more complicated in the general case of time-varying injection pressure or temperature because the integral definition of the injectability number in Equation (1) must be used as scaling function. Nevertheless, an appropriate optimization tool can be employed to easily find out and scale the fill time, by resorting to the injectability number or to a reference fill time, determined for a constant injection pressure and temperature. For instance, knowing In from one simulation with reference injection conditions, the fill time tinj for generic time-varying injection pressure Pinj and viscosity µ can be readily calculated finding the variable τ that solves the following minimization problem:
I n 0 t inj P inj ( t ) μ ( T ( t ) ) d t = 0       t inj = arg min τ > 0 ( | I n 0 τ P inj ( t ) μ ( T ( t ) ) d t | ) .

6. Conclusions

The present article defines a dimensionless number, called the injectability number, which is associated with Darcy’s law and is shown to be an invariant with respect to LCM process parameters. This number can quantify the ease of injecting a resin through a textile preform for a given mold configuration with one inlet gate. The invariance of the injectability number was demonstrated by considering the volume of liquid injected in the mold cavity and was also verified, both analytically and by numerical simulation, for unidirectional injections in a rectangular mold.
To assist composite engineers in the fabrication of parts by LCM, potential applications of the injectability number were described in regard to the selection of the most favorable process variant, the mold design, and the definition of process parameters. The injectability number can be used to find the optimal position of the inlet gate, scale the fill times with changes in the process variables, and build moldability maps that speed up LCM process development. The concept of equivalent length was also introduced to help evaluate the feasibility and robustness of complex molding by a simple comparison to equivalent unidirectional injections. In Part II of the article, the injectability number will be applied to a series of LCM examples of growing complexity.
Introducing the concept of injectability number can facilitate the practical application of the scientific background in LCM and particularly the use of process simulation to improve the production of high-performance composites. A strong and timely interest would motivate future works on the efficient development and fabrication of large composite parts by LCM, such as aircraft wings, fuselages, automotive chassis, bridges, or wind blades. In such a context, moldability maps could be generated and experimental investigations on process limitations could be conducted with the correlation that the injectability number can establish between complex injection cases and equivalent unidirectional flows. Furthermore, academic investigations could also address in detail the theoretical aspects of the injectability number when permeability changes in time such as in FI or in VARI processes, and in the cases of injections through multiple inlet gates or with non-uniform temperature/viscosity inside the mold cavity.
A deeper analysis of the relation between the injectability number and progression of the flow front could be carried out for the purpose of process monitoring and quality control. For example, a time-dependent injectability function might be introduced to capture the dynamics of the impregnation process. Since the filling pattern in a generic mold can be decomposed in a sequence of straight, convergent, and divergent flows [31], the extent and average velocity of the flow front normally varies during the injection, governing the appearance of voids or air entrapments [22]. Thus, a dimensionless injectability function, which would be devised to track the positions of the flow front in time, could enhance the detection of possible defects in manufactured parts.

Author Contributions

C.D.F. and F.T. envisioned the research idea on the introduced dimensionless number, prepared jointly the outline and scope of works, led the investigation, analyzed the results, and wrote the article. C.D.F. further developed the new concept, devised its usability and contributed to the demonstration of its invariance. Y.S. contributed to the investigation and conducted computer simulations. P.C. proofread the article and contributed to some theoretical aspects to verify and demonstrate the invariance of the dimensionless number. F.T. first suggested the novel concept, devised the demonstration of its invariance, and supervised the research. All authors have read and agreed to the published version of the manuscript.

Funding

This research received partial funding from the Natural Sciences & Engineering Research Council of Canada (NSERC) and the Research Center for High Performance Polymer and Composite Systems (CREPEC) funded by the Fonds de Recherche Québécois sur la Nature et les Technologies (FRQNT).

Conflicts of Interest

The authors declare no conflict of interest.

Appendix A

The flow of a volume V of liquid through a porous media is governed by Darcy’s law that relates the volumetric flow rate through an area S to the gradient of pressure P as follows:
d V d t = S μ K · P ,
where K indicates the permeability tensor, which is assumed to be constant in time (but may be generally anisotropic [33] and spatially varying). Combining Darcy’s law with the continuity equation for incompressible fluids gives:
· ( K μ · P ) = 0 .
By setting the boundary conditions at the inlet gate, the outlet vent and on the mold cavity walls, Equation (A2) can be solved for the pressure field in the cavity [24,25]. Moreover, following a quasi-static approach [2,13,14], a unique sequence of flow fronts and pressure distribution at any time during the injection can be obtained. Consider the example of Figure 2: the flow front at time step ti can be determined by calculating the liquid volume entering the cavity through the inlet area S and equating it to the liquid volume flowing across the flow front between the time steps ti-1 and ti. In particular, the infinitesimal liquid volume dV entering the cavity during the infinitesimal time interval dt can be calculated from Equation (A1) as follows:
d V = S μ K · P d t .
Referring again to Figure 2, imagine two different inlet boundary conditions for the same mold containing a specific fibrous reinforcement: the inlet condition 1 is defined by the time-dependent injection pressure Pinj(t) and viscosity μ(t), while the condition 2 is characterized by the different parameters inj(t) and μʹ(t). As discussed in Section 3, the flow front shapes for these inlet conditions are identical and unique, as demonstrated by Voller and Chen [29]. However, the corresponding fill times tinj and inj are generally different and the subsequent flow front positions depicted in Figure 2 are reached at two distinct series of time steps:
  • Inlet condition 1, Pinj(t) and μ(t): 0 ≤ t1 ≤ … ≤ ti ≤ … ≤ tN = tinj,
  • Inlet condition 2, P’inj(t) and μ(t): 0 ≤ t’1 ≤ … ≤ t’i ≤ … ≤ t’N = t’inj
Imagine now that the cavity of Figure 2 is filled with a prescribed unit pressure at the inlet gate and let p denote the pressure field, which solves Darcy’s law for this unit pressure injection. Because of the linearity of Darcy’s law [29], the pressure field for any prescribed time-varying injection pressure is obtained by multiplying p by a scalar number equal to the prescribed pressure at the inlet. Therefore, the pressure field solutions P and , for the inlet conditions 1 and 2 respectively, can be written as follows:
P = p   P inj                                     P = p   P inj
and consequently:
P = P inj   p                                     P = P inj p .
Looking at Figure 2, consider the volume of liquid injected between two consecutive time steps, corresponding to the (I − 1)th and ith positions of the flow front. By discretization of Equations (A3) and (A5), the increase of liquid volume ∆Vi for inlet condition 1 can be expressed as:
V i = S μ K · P i t i     V i = P inj ( t i ) μ ( t i ) S K · p i t i .
Similarly, for inlet condition 2, it can be written:
V i = S μ K · P i t i     V i = P inj ( t i ) μ ( t i ) S K · p i t i .
Since the flow front positions are the same for both inlet conditions and the permeability tensor is assumed constant in time, then ∆Vi = ∆V’i and it follows that:
P inj ( t i ) μ ( t i ) S K · p i t i = P inj ( t i ) μ ( t i ) S K · p i t i     P inj ( t i ) μ ( t i ) t i = P inj ( t i ) μ ( t i ) t i .
From Equation (A8), summing up all the increments of liquid volume between consecutive flow front positions gives:
N P inj ( t i ) μ ( t i ) t i = N P inj ( t i ) μ ( t i ) t i ,
which, passing to the infinitesimal time intervals, becomes:
0 t inj P inj ( t ) μ ( t ) d t = 0 t inj P inj ( t ) μ ( t ) d t       I n = I n .
Equation (A10) proves the invariance of the injectability number for any arbitrary inlet condition. If a constant or time-varying flow rate is specified as boundary conditions, the same demonstration holds by considering the corresponding time-varying pressure at the inlet gate.

References

  1. Ermanni, P.; Di Fratta, C.; Trochu, F. Molding: Liquid Composite Molding (LCM). In Wiley Encyclopedia of Composites; Nicolais, L., Borzacchiello, A., Eds.; John Wiley & Sons, Inc.: Hoboken, NJ, USA, 2012; pp. 1884–1894. [Google Scholar]
  2. Parnas, R.S. Liquid Composite Molding; Carl Hanser Verlag GmbH: Munich, Germany, 2000. [Google Scholar]
  3. Causse, P.; Ruiz, E.; Trochu, F. Experimental study of flexible injection to manufacture parts of strong curvature. Polym. Compos. 2011, 32, 882–895. [Google Scholar] [CrossRef]
  4. Alms, J.; Advani, S.G. Simulation and experimental validation of flow flooding chamber method of resin delivery in liquid composite molding. Compos. Part A 2007, 38, 2131–2141. [Google Scholar] [CrossRef]
  5. Yalcinkaya, M.A.; Guloglu, G.E.; Pishvar, M.; Amirkhosravi, M.; Sozer, E.M.; Altan, M.C. Pressurized Infusion: A New and Improved Liquid Composite Molding Process. J. Manuf. Sci. Eng. 2019, 141, 011007. [Google Scholar] [CrossRef]
  6. Pham, X.T.; Trochu, F. Simulation of compression resin transfer molding to manufacture thin composite shells. Polym. Compos. 1999, 20, 436–459. [Google Scholar] [CrossRef]
  7. Simacek, P.; Advani, S.G.; Iobst, S.A. Modeling Flow in Compression Resin Transfer Molding for Manufacturing of Complex Lightweight High-Performance Automotive Parts. J. Compos. Mater. 2008, 42, 2523–2545. [Google Scholar] [CrossRef]
  8. Bodaghi, M.; Cristóvão, C.; Gomes, R.; Correia, N. Experimental characterization of voids in high fibre volume fraction composites processed by high injection pressure RTM. Compos. Part A 2016, 82, 88–99. [Google Scholar] [CrossRef]
  9. Achim, V.; Ruiz, E. Guiding selection for reduced process development time in RTM. Int. J. Mater. Form. 2010, 3, 1277–1286. [Google Scholar] [CrossRef]
  10. Pierce, R.S.; Falzon, B.G. Simulating Resin Infusion through Textile Reinforcement Materials for the Manufacture of Complex Composite Structures. Engineering 2017, 3, 596–607. [Google Scholar] [CrossRef] [Green Version]
  11. Schubel, P.J. Cost modelling in polymer composite applications: Case study—Analysis of existing and automated manufacturing processes for a large wind turbine blade. Compos. Part B 2012, 43, 953–960. [Google Scholar] [CrossRef]
  12. Bear, J. Dynamics of Fluids in Porous Media; American Elsevier Publishing Company: New York, NY, USA, 1972. [Google Scholar]
  13. Strong, A.B. Fundamentals of Composites Manufacturing: Materials, Methods and Applications; Society of Manufacturing Engineers: Southfield, MI, USA, 2008. [Google Scholar]
  14. Advani, S.G.; Hsiao, K.-T. Manufacturing Techniques for Polymer Matrix Composites (PMCs); Woodhead Publishing Limited: Cambridge, UK, 2012. [Google Scholar]
  15. Controlled Vacuum Infusion (CVI)—Product and Services—Polyworx. Available online: http://www.polyworx.com/pwx/cvi/ (accessed on 28 August 2019).
  16. PAM-RTM—Composites Molding Simulation Software. Available online: https://www.esi-group.com/software-solutions/virtual-manufacturing/composites/pam-composites/pam-rtm-composites-molding-simulation-software (accessed on 28 August 2019).
  17. Simacek, P.; Advani, S.G. Desirable features in mold filling simulations for liquid composite molding processes. Polym. Compos. 2004, 25, 355–367. [Google Scholar] [CrossRef]
  18. Okabe, T.; Oya, Y.; Yamamoto, G.; Sato, J.; Matsumiya, T.; Matsuzaki, R.; Yashiro, S.; Obayashi, S. Multi-objective optimization for resin transfer molding process. Compos. Part A 2017, 92, 1–9. [Google Scholar] [CrossRef]
  19. Jiang, S.; Zhang, C.; Wang, B. Optimum arrangement of gate and vent locations for RTM process design using a mesh distance-based approach. Compos. Part A 2002, 33, 471–481. [Google Scholar] [CrossRef]
  20. Henz, B.J.; Mohan, R.V.; Shires, D.R. A hybrid global–local approach for optimization of injection gate locations in liquid composite molding process simulations. Compos. Part A 2007, 38, 1932–1946. [Google Scholar] [CrossRef]
  21. Trochu, F.; Ruiz, E.; Achim, V.; Soukane, S. Advanced numerical simulation of liquid composite molding for process analysis and optimization. Compos. Part A 2006, 37, 890–902. [Google Scholar] [CrossRef]
  22. Ruiz, E.; Achim, V.; Soukane, S.; Trochu, F.; Bréard, J. Optimization of injection flow rate to minimize micro/macro-voids formation in resin transfer molded composites. Compos. Sci. Technol. 2006, 66, 475–486. [Google Scholar] [CrossRef]
  23. Saad, A.; Echchelh, A.; Hattabi, M.; Ganaouli, M.E. Review of modeling and simulation of void formation in liquid composite molding. Compos. Mech. Comput. Appl. Int. J. 2018, 9, 51–93. [Google Scholar] [CrossRef]
  24. Ruiz, E.; Trochu, F. Multi-criteria thermal optimization in liquid composite molding to reduce processing stresses and cycle time. Compos. Part A 2006, 37, 913–924. [Google Scholar] [CrossRef]
  25. Di Fratta, C.; Klunker, F.; Ermanni, P. A methodology for flow-front estimation in LCM processes based on pressure sensors. Compos. Part A 2013, 47, 1–11. [Google Scholar] [CrossRef]
  26. Möller, J.; Kuncho, C.N.; Schmidt, D.F.; Reynaud, E. Rheological Studies of High-Performance Bioepoxies for Use in Fiber-Reinforced Composite Resin Infusion. Ind. Eng. Chem. Res. 2017, 56, 2673–2679. [Google Scholar] [CrossRef]
  27. Matsuzaki, R.; Kobayashi, S.; Todoroki, A.; Mizutani, Y. Full-field monitoring of resin flow using and area-sensor array in a VaRTM process. Compos. Part A 2011, 42, 550–559. [Google Scholar] [CrossRef]
  28. Di Fratta, C.; Koutsoukis, G.; Klunker, F.; Ermanni, P. Fast method to monitor the flow front and control injection parameters in resin transfer molding using pressure sensors. J. Compos. Mater. 2016, 50, 2941–2957. [Google Scholar] [CrossRef]
  29. Voller, V.R.; Chen, Y.F. Prediction of filling times of porous cavities. Int. J. Numer. Methods Fluids 1996, 23, 661–672. [Google Scholar] [CrossRef]
  30. Di Fratta, C.; Klunker, F.; Trochu, F.; Ermanni, P. Characterization of textile permeability as a function of fiber volume content with a single unidirectional injection experiment. Compos. Part A 2015, 77, 238–247. [Google Scholar] [CrossRef]
  31. Di Fratta, C. Combined Experimental–Numerical Methods to Monitor Liquid Composite Molding and Characterize Textile Permeability. Ph.D. Thesis, ETH Zurich, Zurich, Switzerland, July 2015. [Google Scholar]
  32. Hergan, P.; Beter, J.; Stelzer, S.; Fauster, E.; Schledjewski, R. Influence of processing parameters on quality factors of one-shot hybrid structures made by RTM. Prod. Eng. 2018, 12, 185–194. [Google Scholar] [CrossRef] [Green Version]
  33. Di Fratta, C.; Koutsoukis, G.; Klunker, F.; Trochu, F.; Ermanni, P. Characterization of Anisotropic Permeability from Flow Front Angle Measurements. Polym. Compos. 2016, 37, 2037–2052. [Google Scholar] [CrossRef]
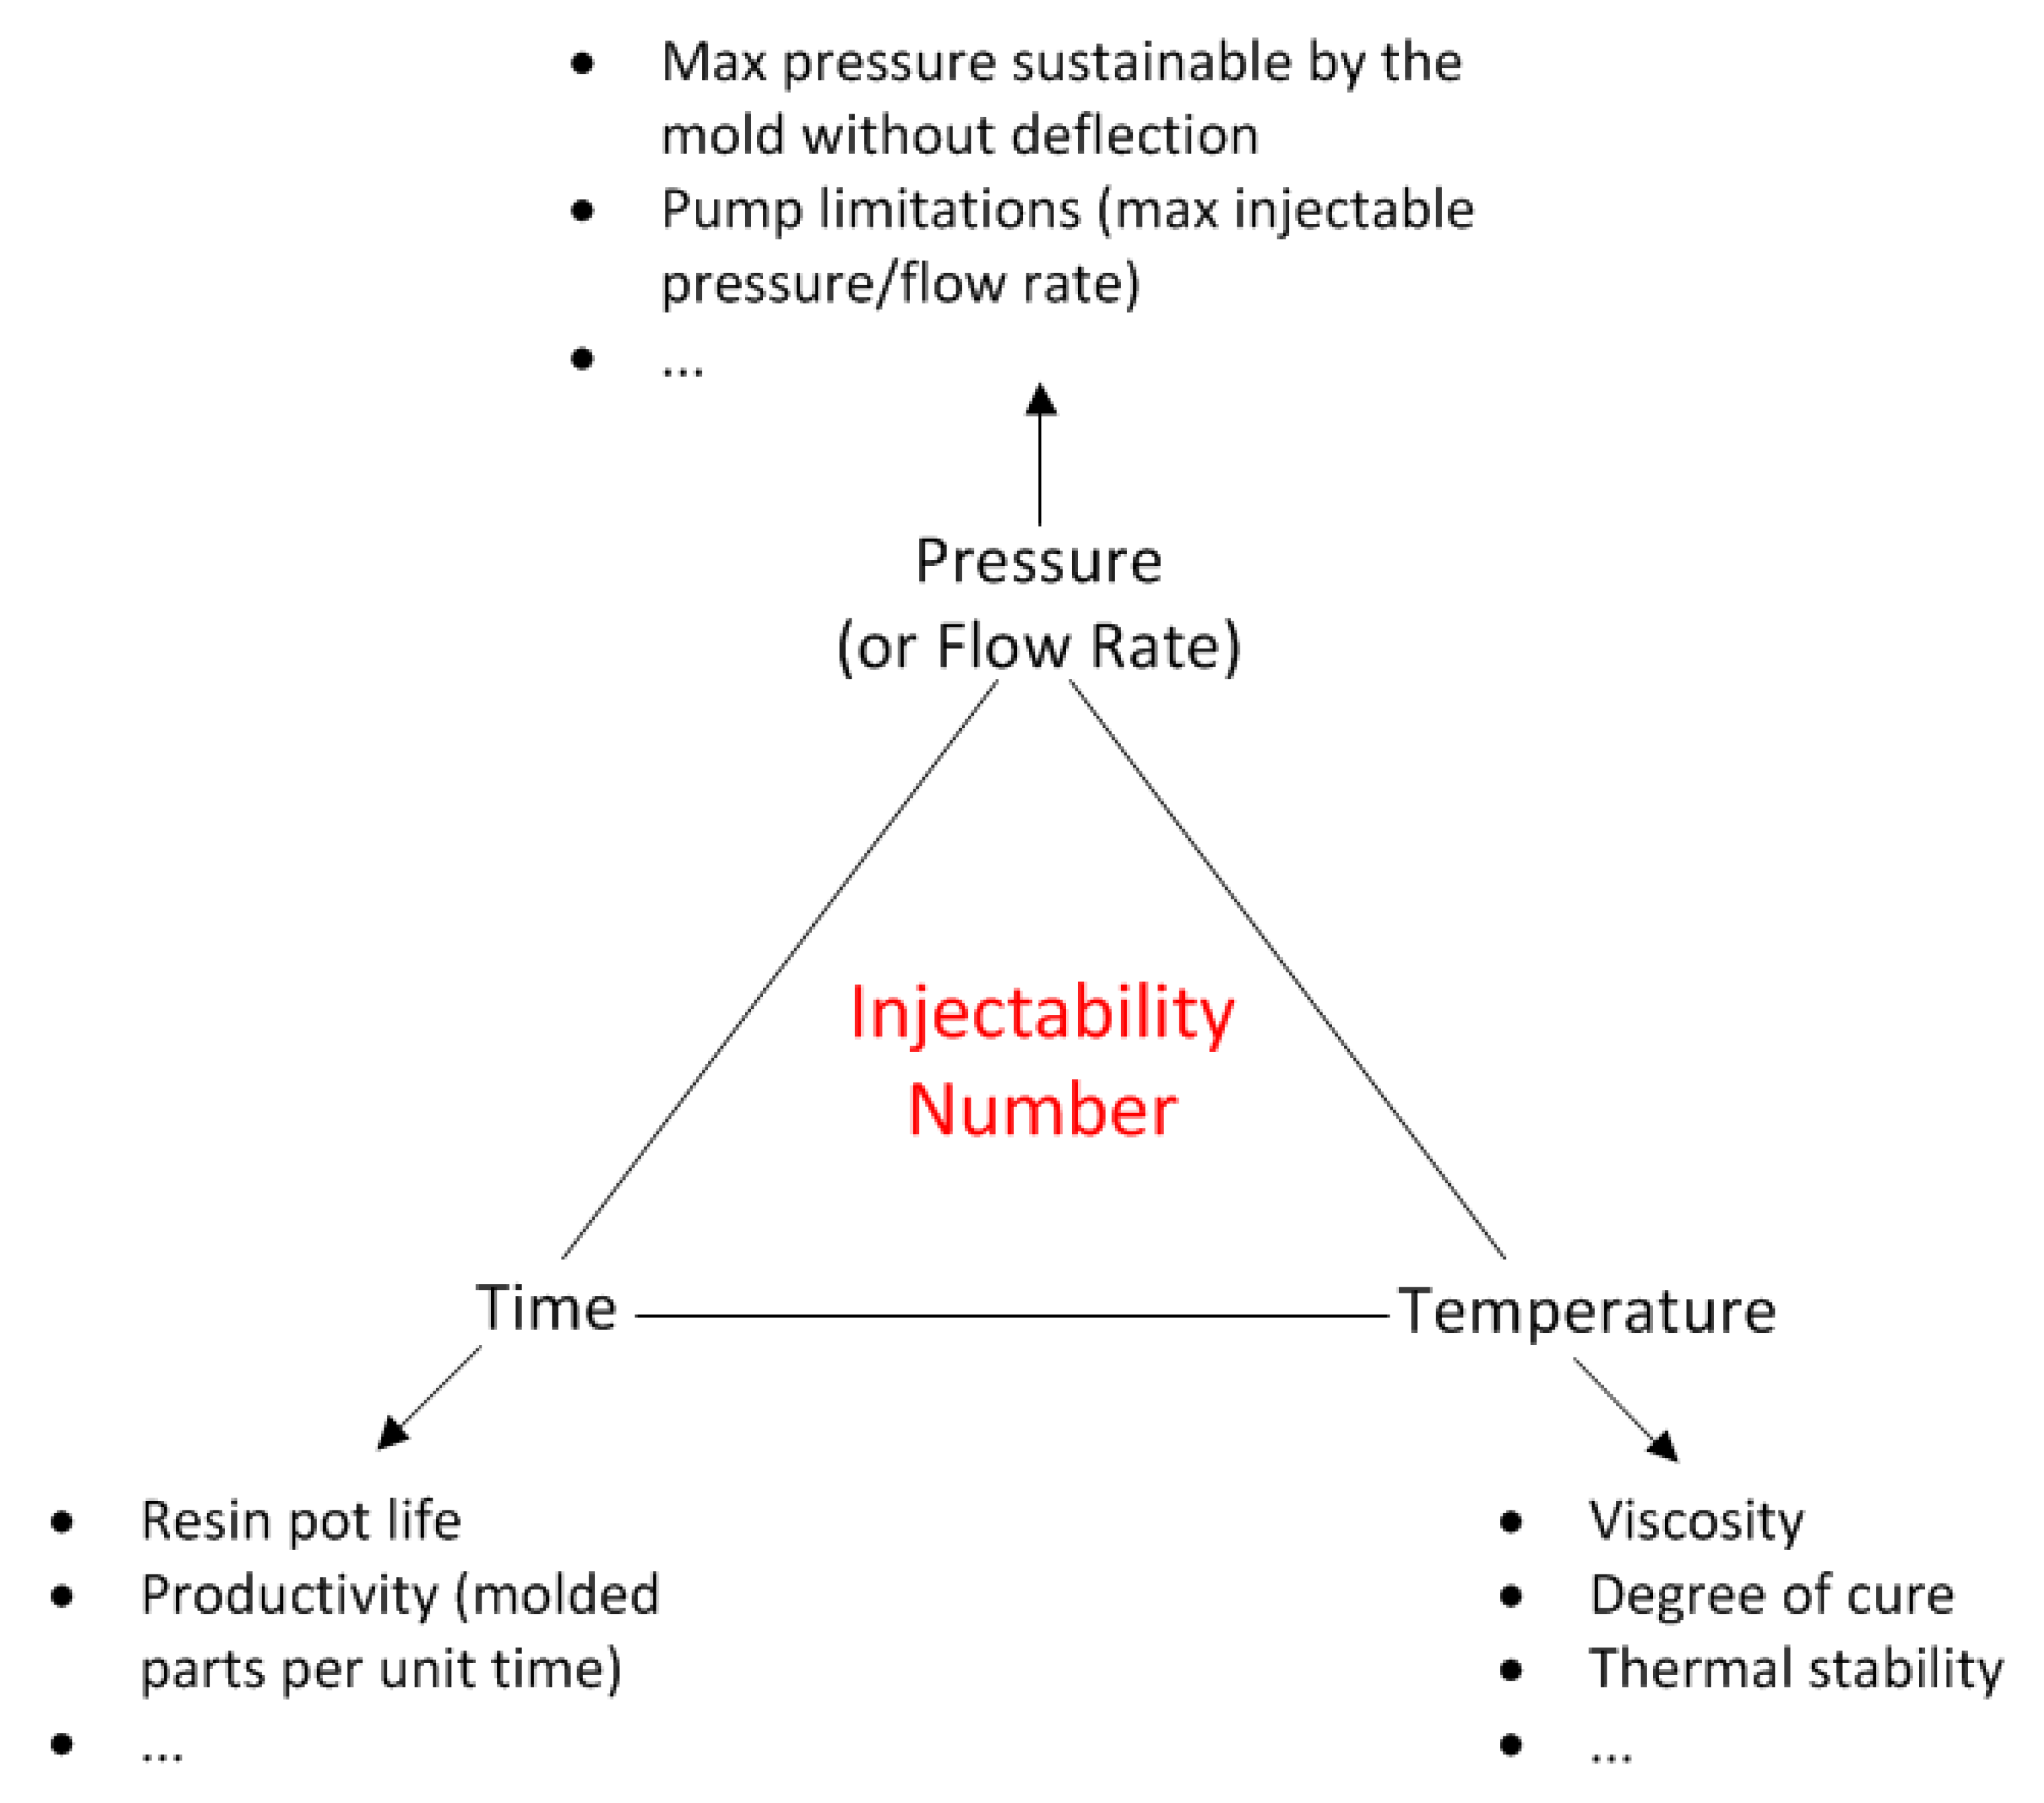
Figure 1. Injectability number, main process variables, and technological constraints.
Jcs 04 00011 g001
Figure 2. Schematic progression of the flow front for two different inlet conditions in a generic mold cavity: the inlet conditions lead to the same filling pattern but at different times.
Jcs 04 00011 g002
Figure 3. Analyzed case of unidirectional injection in a rectangular mold cavity: the flow advances from the left side (injection port) toward the right side (vent).
Jcs 04 00011 g003
Figure 4. Finite element mesh of the rectangular cavity used to simulate unidirectional injections.
Jcs 04 00011 g004
Figure 5. Variable function representing a time-varying injection pressure.
Jcs 04 00011 g005
Figure 6. Injectability number as a function of inlet point coordinates in a rectangular mold cavity. The surface is obtained by interpolating the injectability numbers calculated on a grid of inlet positions using the same geometry and material parameters as in Section 4.
Jcs 04 00011 g006
Figure 7. Example of parameter diagram with isochrones of fill times. Each point along the same isochrone line is associated with the same fill time (lower slopes imply higher fill times).
Jcs 04 00011 g007
Figure 8. Example of moldability map with constraints on process parameters.
Jcs 04 00011 g008
Table 1. List of symbols.
Symbol.Description
αDegree of cure
µViscosity
τIntegration variable related to time
φPorosity
ζ, ω, bParameters for time-dependent function f
A, BTarget values of time-dependent injection pressure and flow rate
fTime-dependent function of injection pressure and flow rate
H, WCavity height and width
InInjectability number
KPermeability
LCavity length
LeqEquivalent length
pPressure field resulting from prescribed unit injection pressure
PPressure
PinjInjection pressure, relative to the outlet pressure
QinjInjection flow rate
SCavity cross-section or inlet area
tTime during injection process
tinjFill time
TTemperature
vfFiber volume content
VVolume
VinjTotal volume of liquid injected
xfFlow front position
x, ySpatial coordinates
Table 2. Numerically calculated fill times and injectability numbers for unidirectional injections in a rectangular cavity (the results are rounded to the third significant digit).
CaseType of InjectionFill Time [s]Injectability Number
1Constant injection pressure5001.00 × 109
2Constant flow rate1501.00 × 109
3Time-dependent injection pressure5401.00 × 109
4Time-dependent flow rate1901.00 × 109