Article

An Impedance Measurement Technique for Composite Materials Moisture Level Detection Devoted to Health Monitoring in Aeronautics

Italian Aerospace Research Centre (CIRA), via Maiorise snc, 81043 Capua CE, Italy
*
Author to whom correspondence should be addressed.
J. Compos. Sci. 2019, 3(3), 76; https://doi.org/10.3390/jcs3030076
Submission received: 8 January 2019 / Revised: 12 July 2019 / Accepted: 15 July 2019 / Published: 1 August 2019

Abstract

:
The current design practice of composite material aeronautical structures imposes the use of knock-down structural material allowables to take into account the high sensitivity to environmental exposure (i.e., moisture, temperature, damages). The “moisture derating factor” comes from specific mechanical test campaign and drastically reduces the advantage of using such materials; but the continuous monitoring of the moisture content of the structure could enable the use of higher design allowables. In the framework of FUSIMCO (Work developed within the frame of the Project FUSIMCO-FUSoliera Ibrida Metallo COmposito-co-financed by MIUR-Italian Ministry of Research with DAC-Campania Aerospace District as beneficiary and Leonardo Company-Aerostructure Division as “prime” partner) project, the aim of this study is to verify the effectiveness of the impedance measurement method as a health-monitoring tool to evaluate the moisture quantity absorbed by an aeronautical composite structure. The method is based on the idea that a composite laminate can be associated with an equivalent electric circuit (EEC). Some electrical characteristics of this EEC can be associated to the moisture content of the laminate. A simple EEC model, mainly capacitive, was used. A frequency sweep was the electric stimulus signal of some electrodes, glued onto the specimens to investigate the EEC parameters variation with respect to the induced moisture content variation (gravimetrically determined). The study confirmed the possibility of effectively using the impedance measurement method as a health-monitoring tool for moisture content evaluation of a composite laminate.

1. Introduction

The current trend in aeronautics shows an extended use of composite materials for the design of primary airframe structures. The latest certified large transport and regional aircraft consist of many composite parts: 50% and 53% by weight for the Boeing B787 and Airbus A350, respectively, 26% for the Bombardier CS100. The use of higher allowables (strengths) than the standard practice in the design phase is allowed by the continuous identification (during the operational life of the aircraft) of the damage (smaller than typical Barely Visible Impact Damage—BVID) occurring into the composite structure and continuous measuring of the moisture absorption level by means of a dedicated sensor-network.
The moisture absorption level of a composite material structure is very important because it is strictly related to its mechanical strength (ref. [1,2]).
The current designing practice of composite aircraft imposes the use of knock-down mechanical allowables to take into account the high sensitivity to environmental exposure (i.e., damages, moisture, and temperature) of composite structures. The effect of considering a structure damaged at BVID level with a moisture content reduces drastically the advantage of using such materials that have very high specific strengths with respect to the aeronautical current practice manufacturing materials.
This was performed so that the knowledge of the moisture absorption level of the structure during aircraft operations could enable the use of higher design allowables. In addition, the proposed structurally not-invasive method for the moisture detection in composite airframe during operative life of aircraft is not yet used at the state of art of conditioned-based monitoring best practice. The proposed approach mainly devoted to carbon fiber reinforced composite for primary structures is of high commercial impact, as moisture uptake control is considered as a problem in modern aeronautics. Recent studies performed by Grammatikos et al. [3] have begun, very recently, to apply a similar technique on pultruted glass fiber reinforced composite for civil engineering application by using dielectric spectroscopy for evaluation of moisture uptake.
Many authors treated composite materials by an electric point of view.
Mazzeffoli et al. [4] indicated the dielectric analysis as a good technique for monitoring diffusion processes in polymeric systems and used epoxy resin matrices for their experiments. Davis et al. [5], investigated the relationship between electric parameters and adsorbed moisture in civil engineering (moisture in glass fiber reinforced polymers concrete, even if an epoxy resin layer was into the specimen, but its contribution was neglected).
Fraga et al. [6], King et al. [7] investigated the relationship between water absorption and dielectric behavior of natural fiber composite materials (included wood).
Boinard et al. [8] investigated the use of dielectric technique over a wide range of frequency for quantitative analysis of water ingress into epoxy composites.
Grammatikos et al. [3], still in civil engineering, indicated that dielectric measurements methodology for determination of moisture uptake in carbon fiber reinforced polymers (CFRP) is preferable with respect to the commonly adopted gravimetric methodology, due to complication induced by chemical mass loss.
Wandowski et al. [9] used a different method, electromechanical impedance measurements of piezoelectric patches glued on CFRP samples, to show that increasing moisture level cause frequency shift of resistance peaks, related to the reduction of natural frequencies values of CFRP samples.
Some authors (Banks et al. [10]) developed high-frequency (up to 3 GHz) dielectric propagation for the moisture intake identification in the aeronautic bonded joints.
In this work, the authors investigated the possible application of a direct laminate impedance measurement correlating the electric measurements with the gravimetric ones.
The method concept and its functionalities, as well as the application limits, are described and illustrated by using experimental tests results. The main aim is the demonstration, supported by experimental data, of the applicability of the proposed method for the identification of the moisture absorption level of composite laminates, especially for aeronautical applications. Final tuning, engineering of the method, as well as regular test campaigns devoted to absorption level identification and calibration of sensors, will be part of further activities.
In particular, the authors looked for a simply measurable electric parameter, linearly related to the moisture content of an aeronautical structure specimen, to be cheaply and easily measured during normal aircraft maintenance operations.
A carbon fiber composite material laminate (CML), widely used in airframe structures, is an electrically conductive element (carbon fiber) within a dielectric matter (epoxy resin), so, from an electric point of view a CML specimen could be seen as an electric circuit with some basic elements, namely capacitors and resistors, connected by a net. In other words, a CML specimen could be associated at an equivalent electric circuit (EEC) with a particular net layout and some electric parameters. In particular, the conductive layers of the CML could be seen as the electrodes (conductive plates) of a capacitor having an epoxy resin dielectric as shown in Figure 1 and Figure 2.
The next step, that this work focuses, is the relationship of the CML electric status and the moisture level adsorbed by the CML itself, in order to detect the degradation level of its mechanical characteristics.
As this work points out, the studied technique enables to have information about the mechanical degradation level in an easily measurable, instantaneous and nondestructive way.
The relation between the electric status characteristics of a CML and its moisture absorption level was investigated. Then, with respect to the CML moisture absorption level, the best related electric parameters and EEC layout were selected, in terms of ease of measuring, sensitivity, linearity.

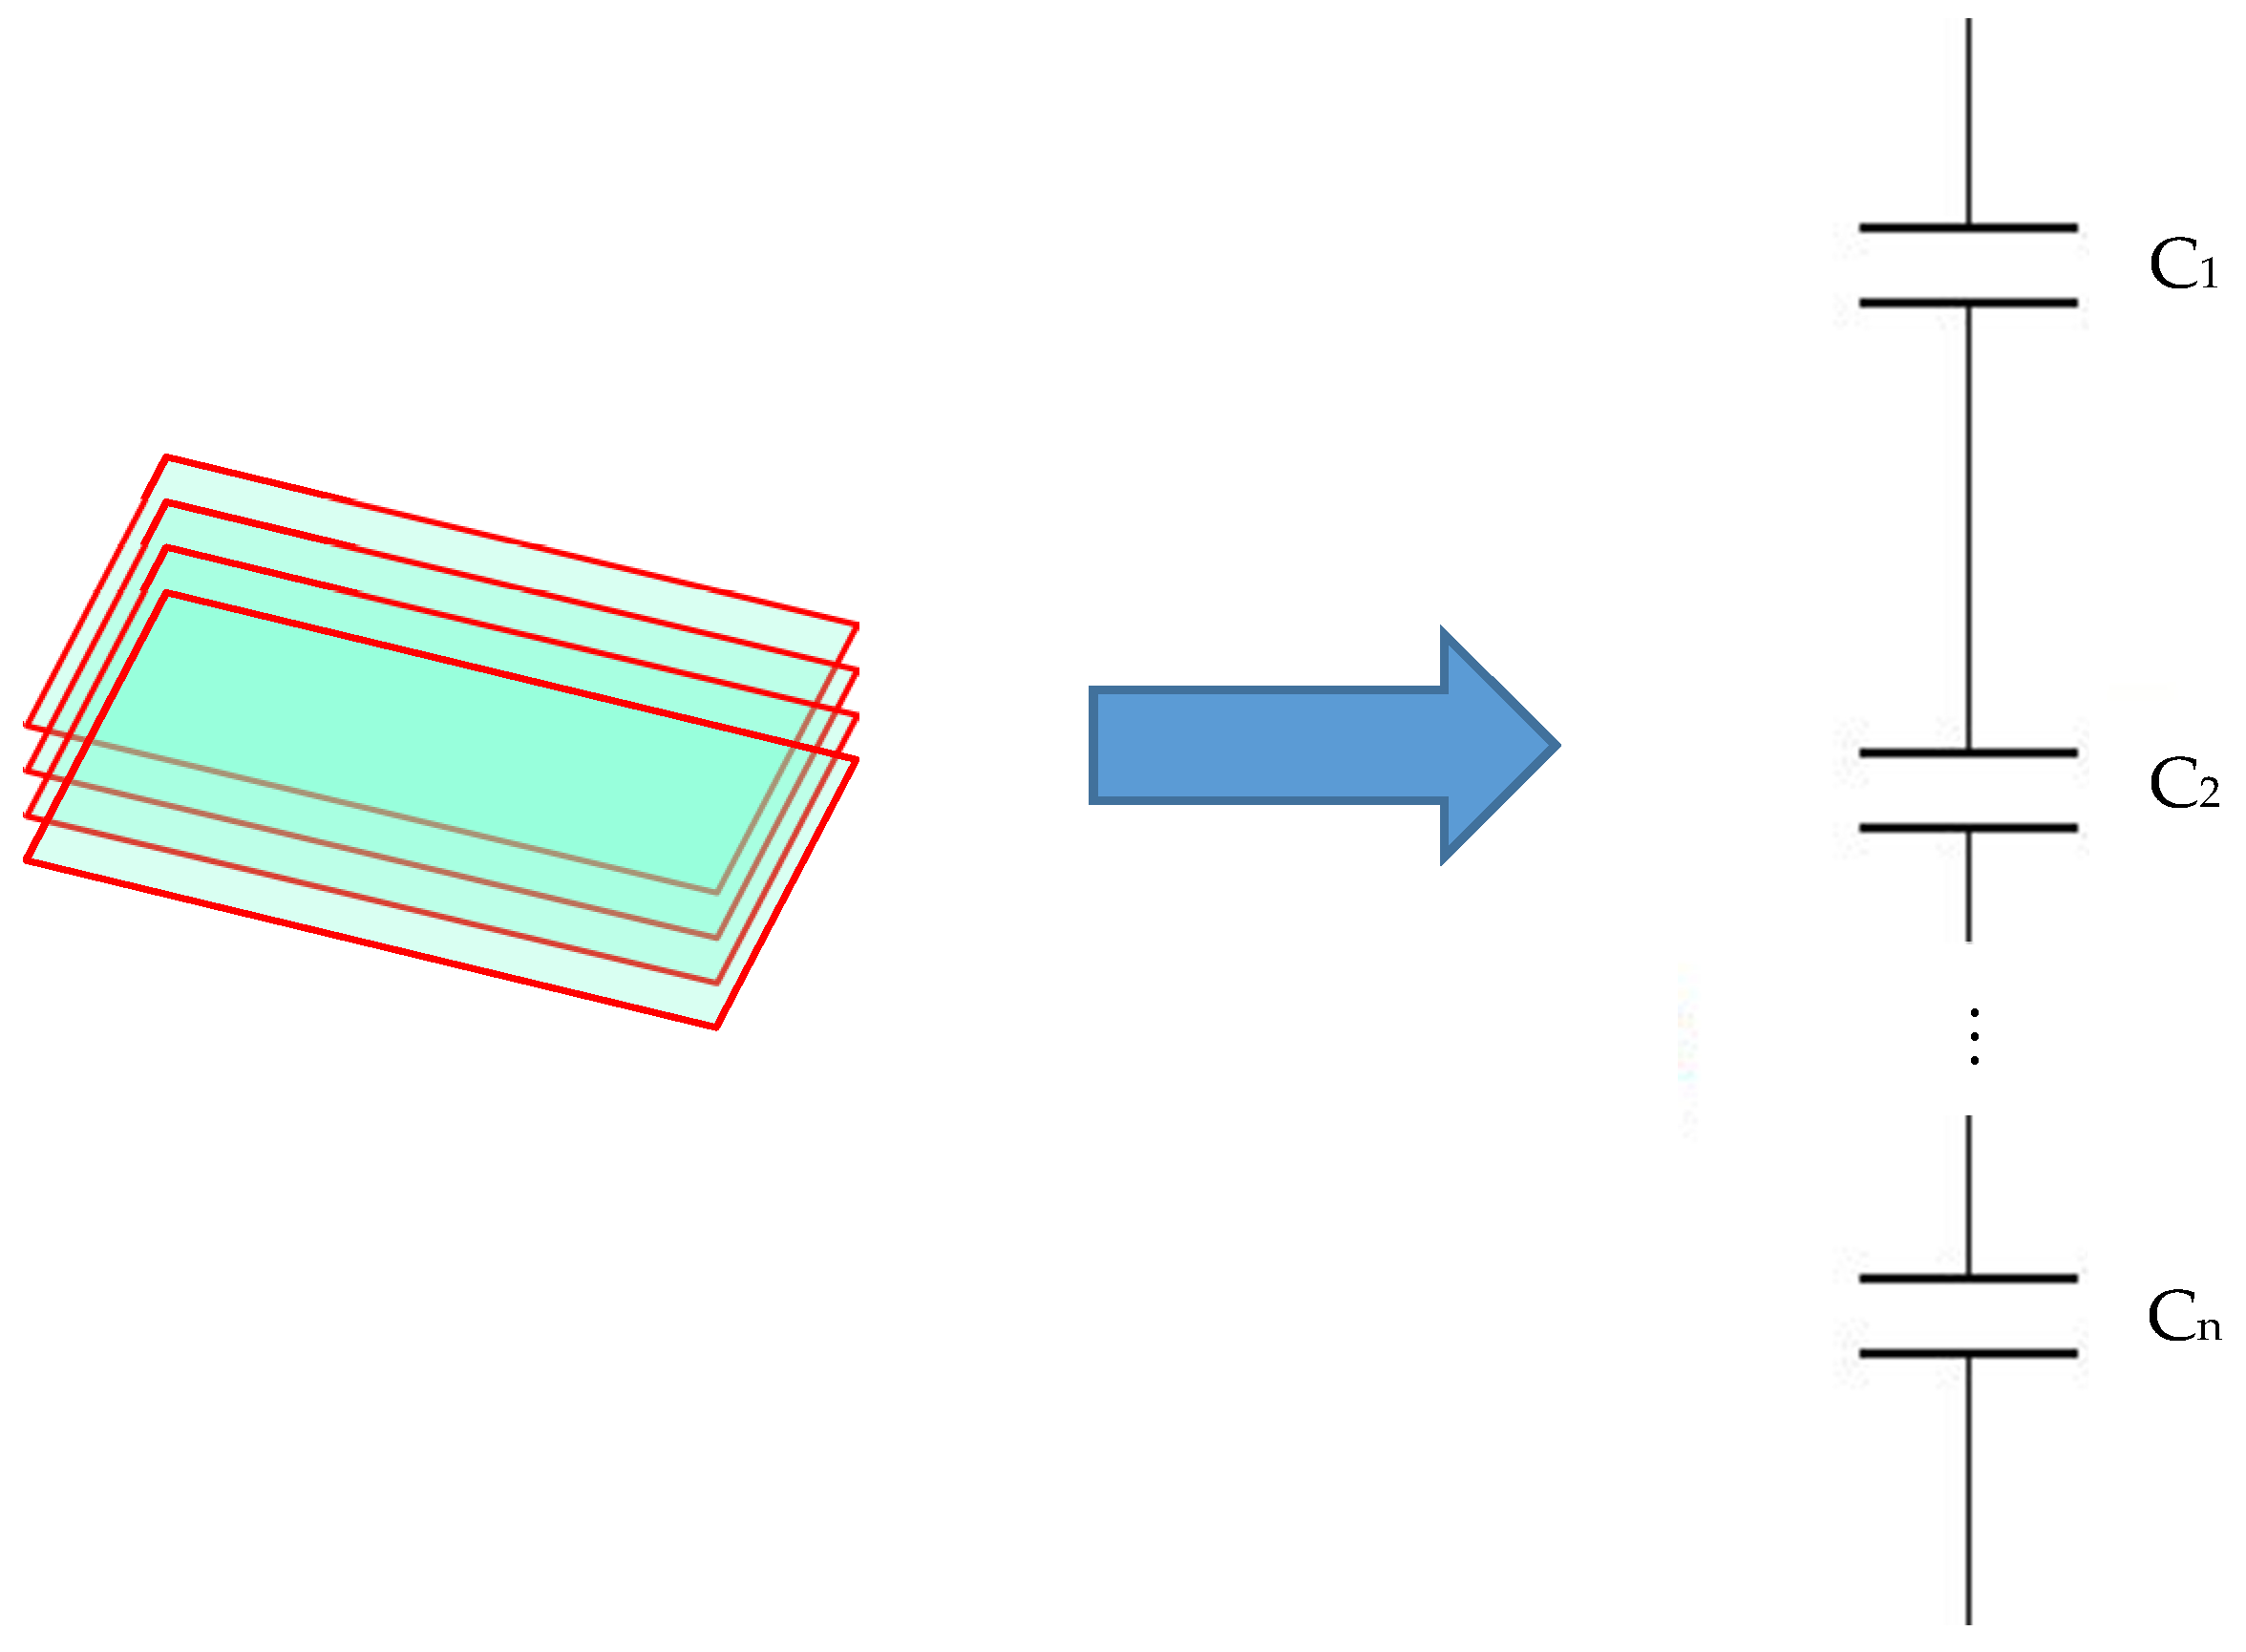
2. Materials and Methods

A simple EEC model of the CML, mainly capacitive, was proposed, with the target to study the laminate electric behavior with respect to its internal moisture level variation. To detect the laminate electric behavior, some sensing elements, namely electrodes, were chosen in accordance with that model (The electrodes become part of the capacitor whose dielectric is the epoxy matrix).
24 plies quasi-isotropic and symmetric laminate of (0/90/−45/+45/0/90/−45/45/0/90/−45/45)s of Cytec 977-2 matrix reinforced with IMS carbon fiber were used to obtain the specimens, which were made by gluing the electrodes onto some rectangular cuttings of the laminates. The gluing element was a nonconductive epoxy resin, homogeneous with the epoxy matrix of the CML. As electrodes some square conductive patches were needed, so it was decided to use some ceramic platelets with silver alloy coating. The Specimens characteristics are in the Table 1 below.
In order to measure the laminate EEC parameters, such as Resistance and Capacitance, an experimental investigation was carried out.
The specimens’ moisture measurements were performed according mostly to ASTM D5229 (ref. [11,12]). For the electrical investigation it was necessary to furnish the specimens with glued superficial metallic-ceramic electrodes. The electrodes could induce a variation of the specimen moisture intake level; however, this does not affect the performed investigation, which aims to demonstrate the applicability of impedance method for moisture identification.
A frequency sweep in the range 20 Hz–200 kHz was used as an electric stimulus for the electrodes to measure the EEC parameters and the parameters variation was investigated, with respect to an induced moisture content variation.
Some preliminary qualitative tests pointed out that:
  • Surface was not conductive (a sufficiently thick layer of insulating epoxy resin was present)
  • Lateral planes were conductive, probably due to the cutting method that connected together the carbon fiber of the various layers.
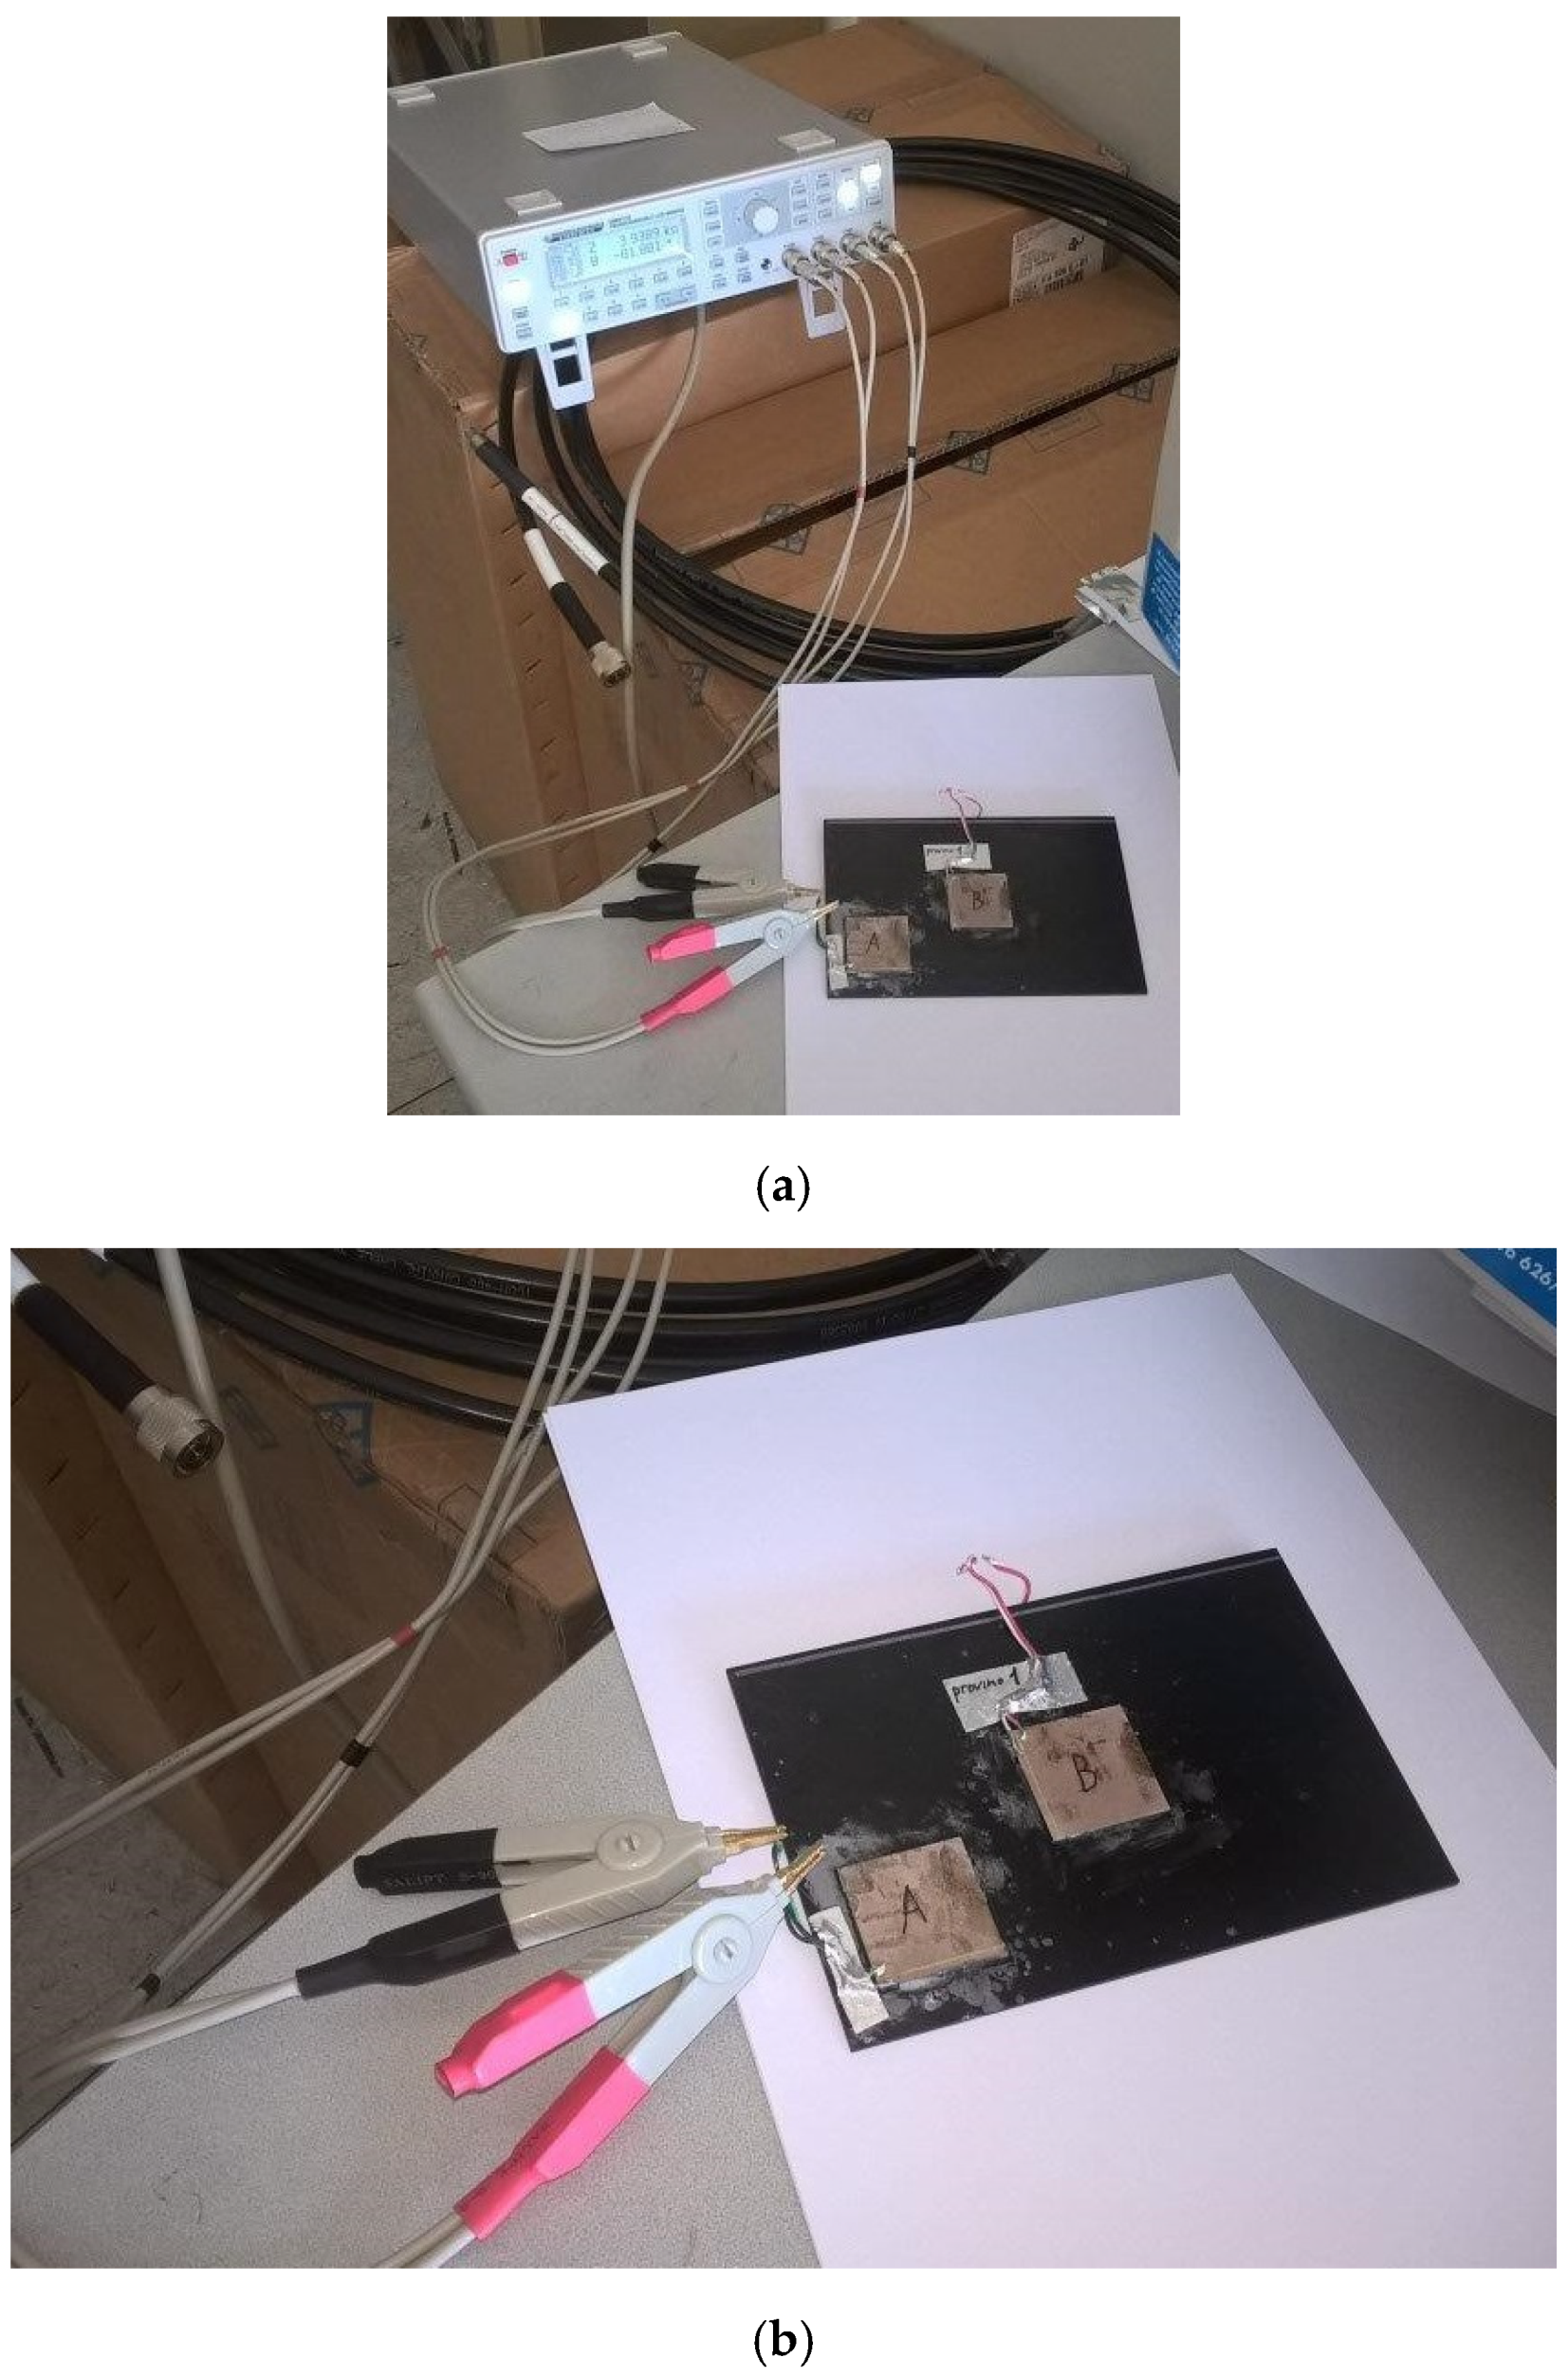
2.1. Test Set-Up

The test set-up is shown below, in Figure 3a. In Figure 3b, it is shown a zoom of the previous picture with the electrode details glued onto the specimen surface. In particular, the electrodes 1A are connected to the set-up.

2.2. Test Description

In order to measure the variation of the electrical characteristics of the CML specimens due to variation of moisture absorption level, the following procedure was performed:
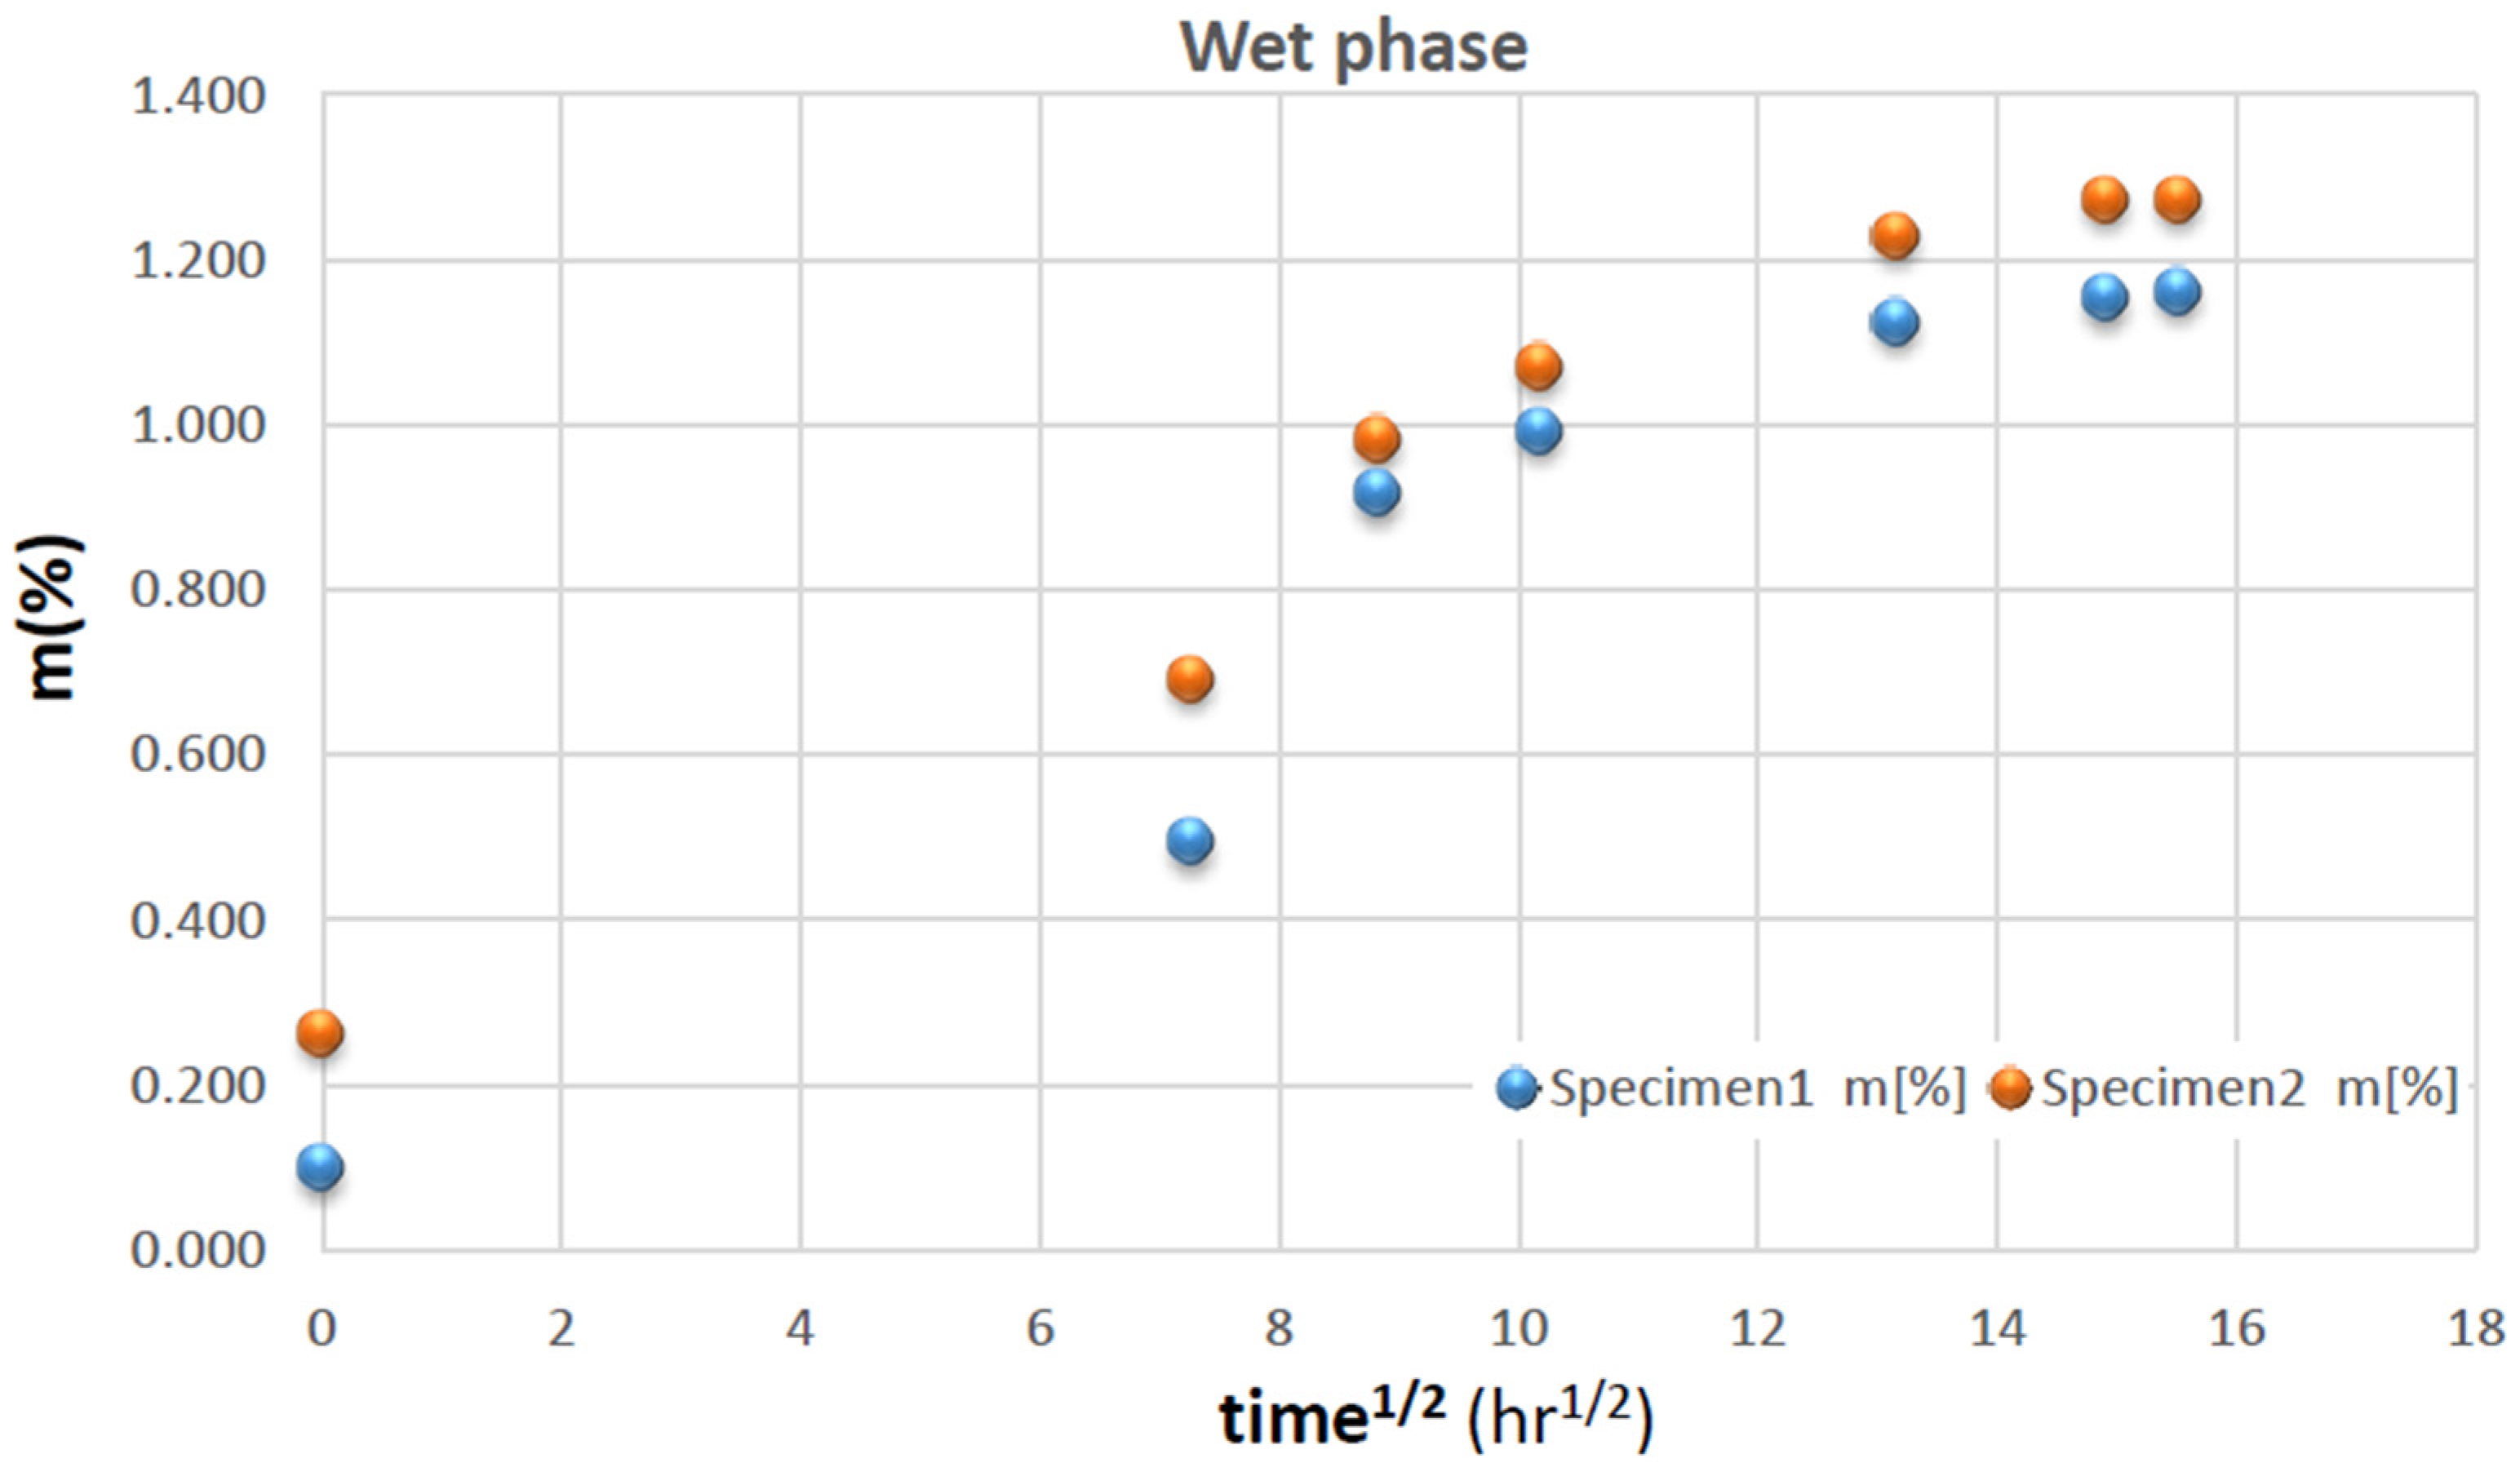
  • Wet phase. The specimens are conditioned in a saturated environment (bath in distilled water at T = 80 °C) as required by ASTM 5229 (wet phase—ref. [11,12]).
    • For measurement, the specimens are removed from the bath, dried on the surface and weighed with a precision electronic balance.
    • Then the electrical measurement is performed as described in the following chapter.
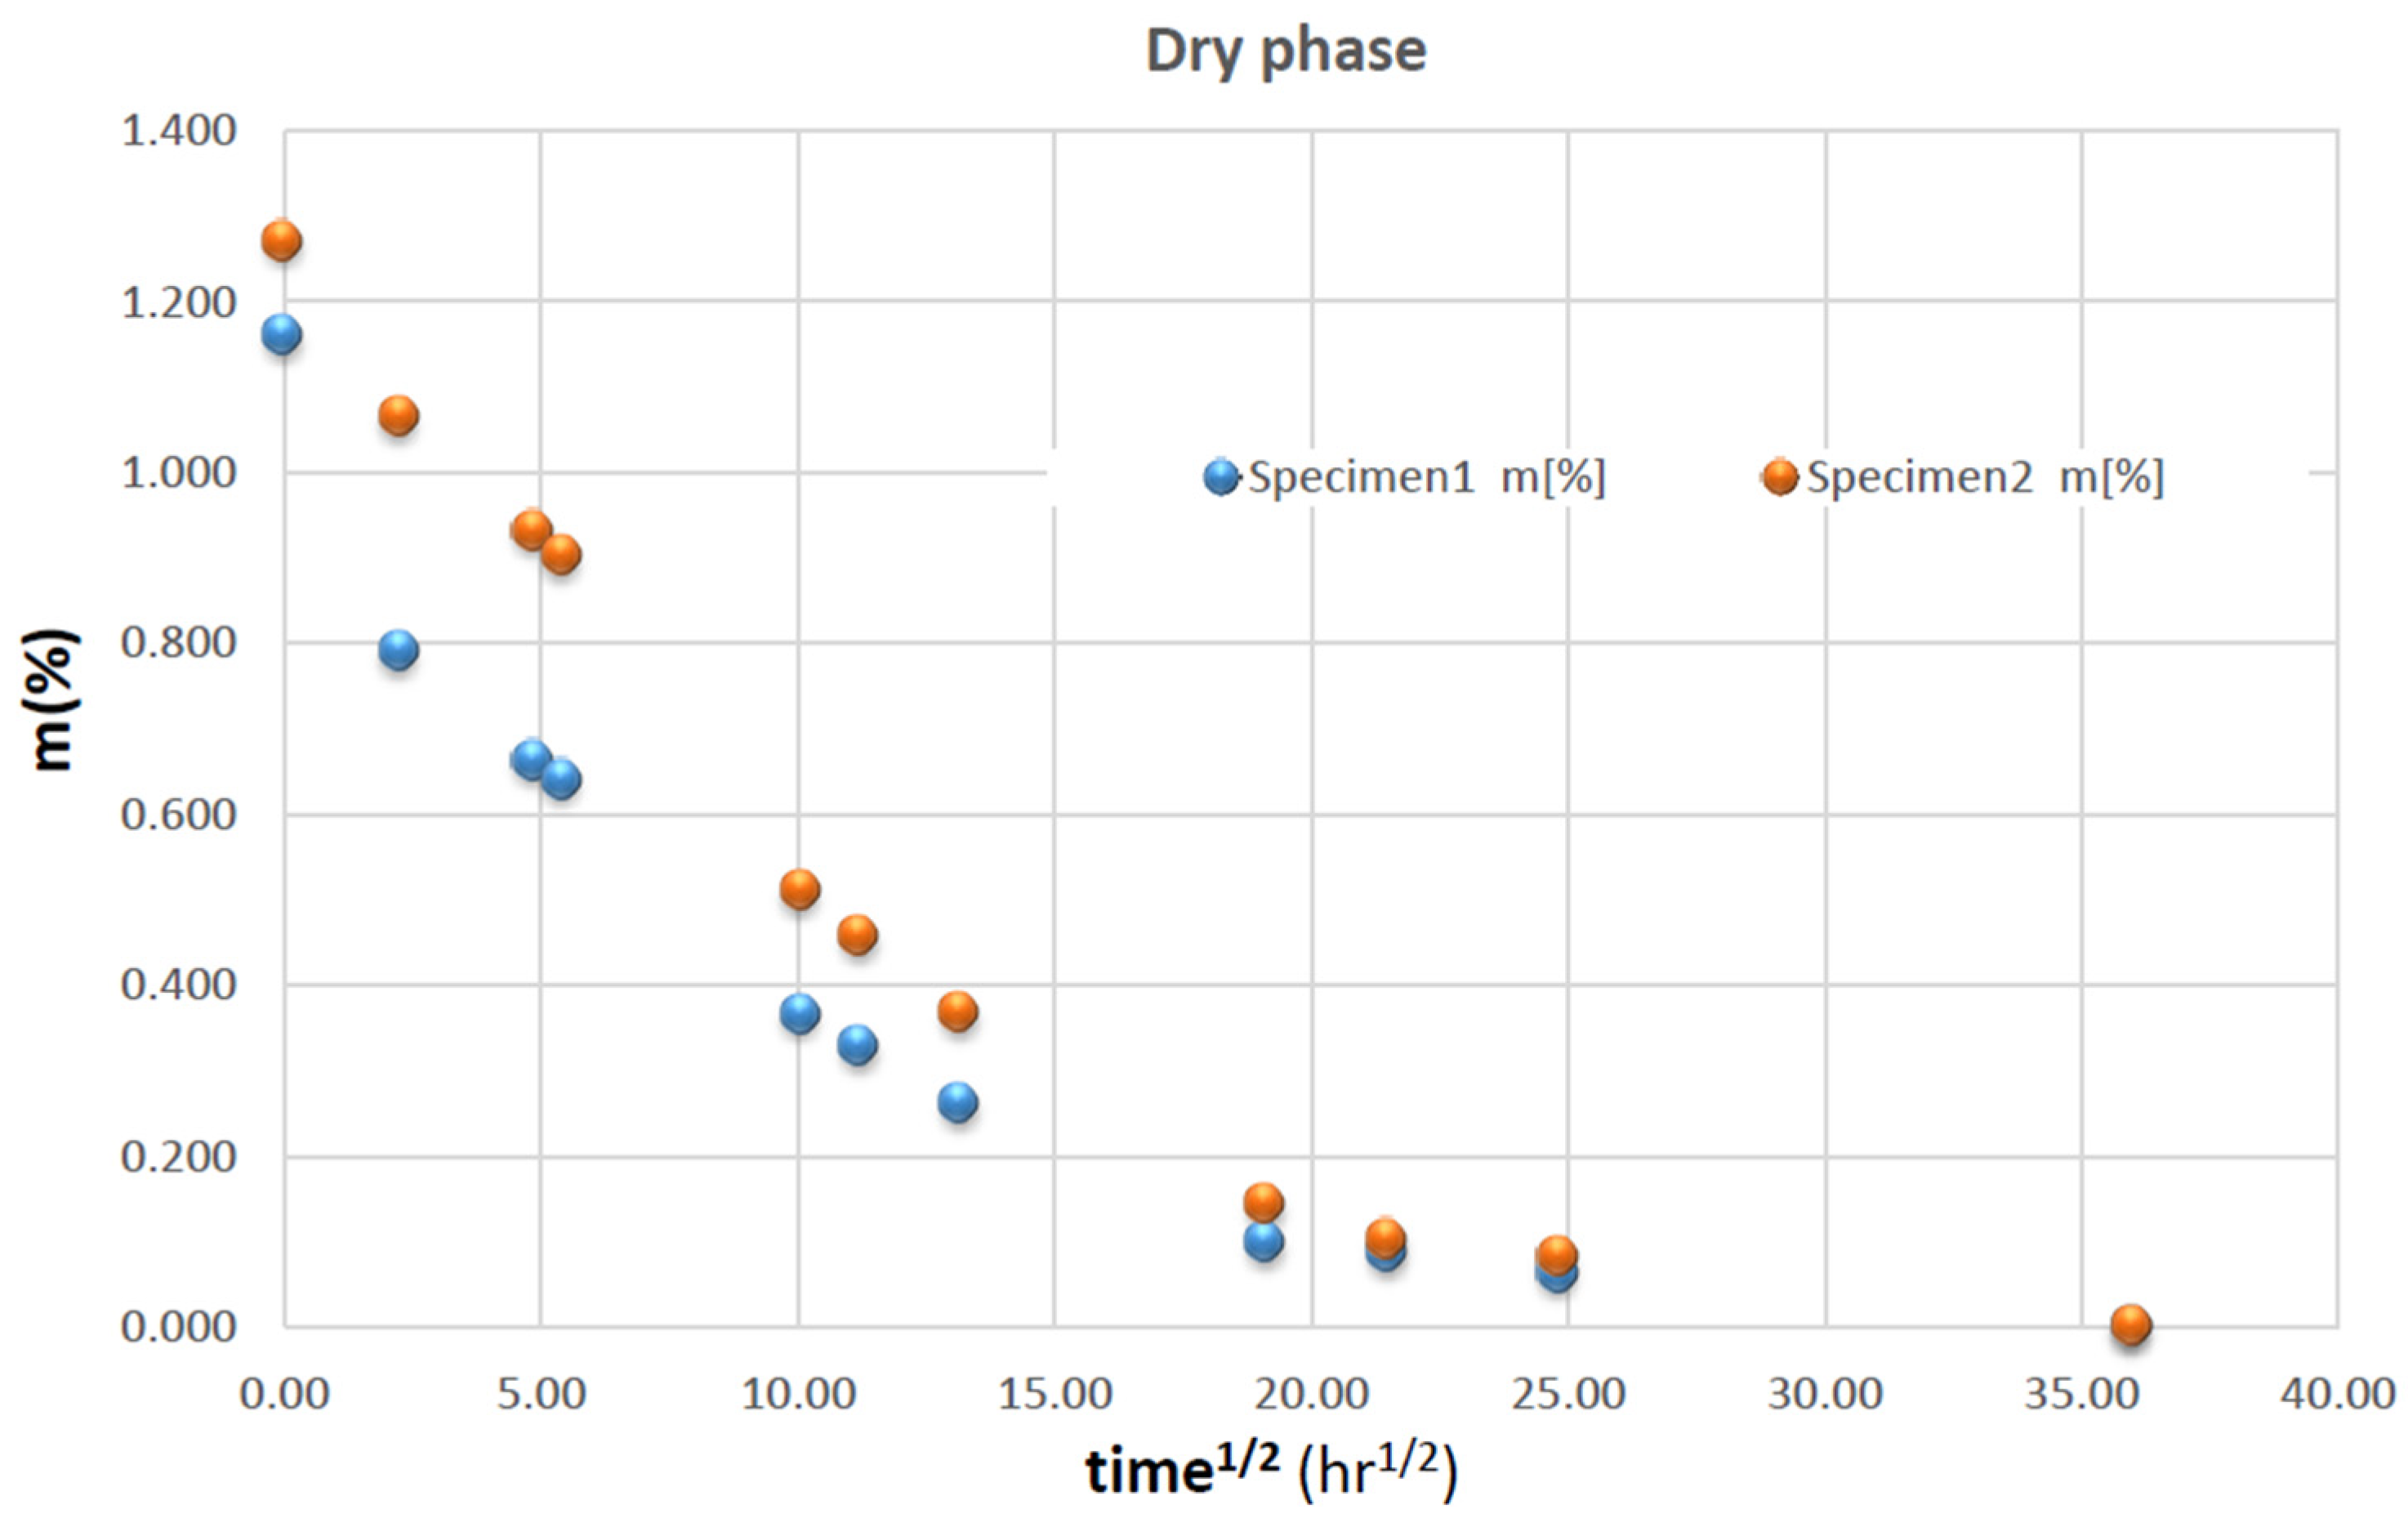
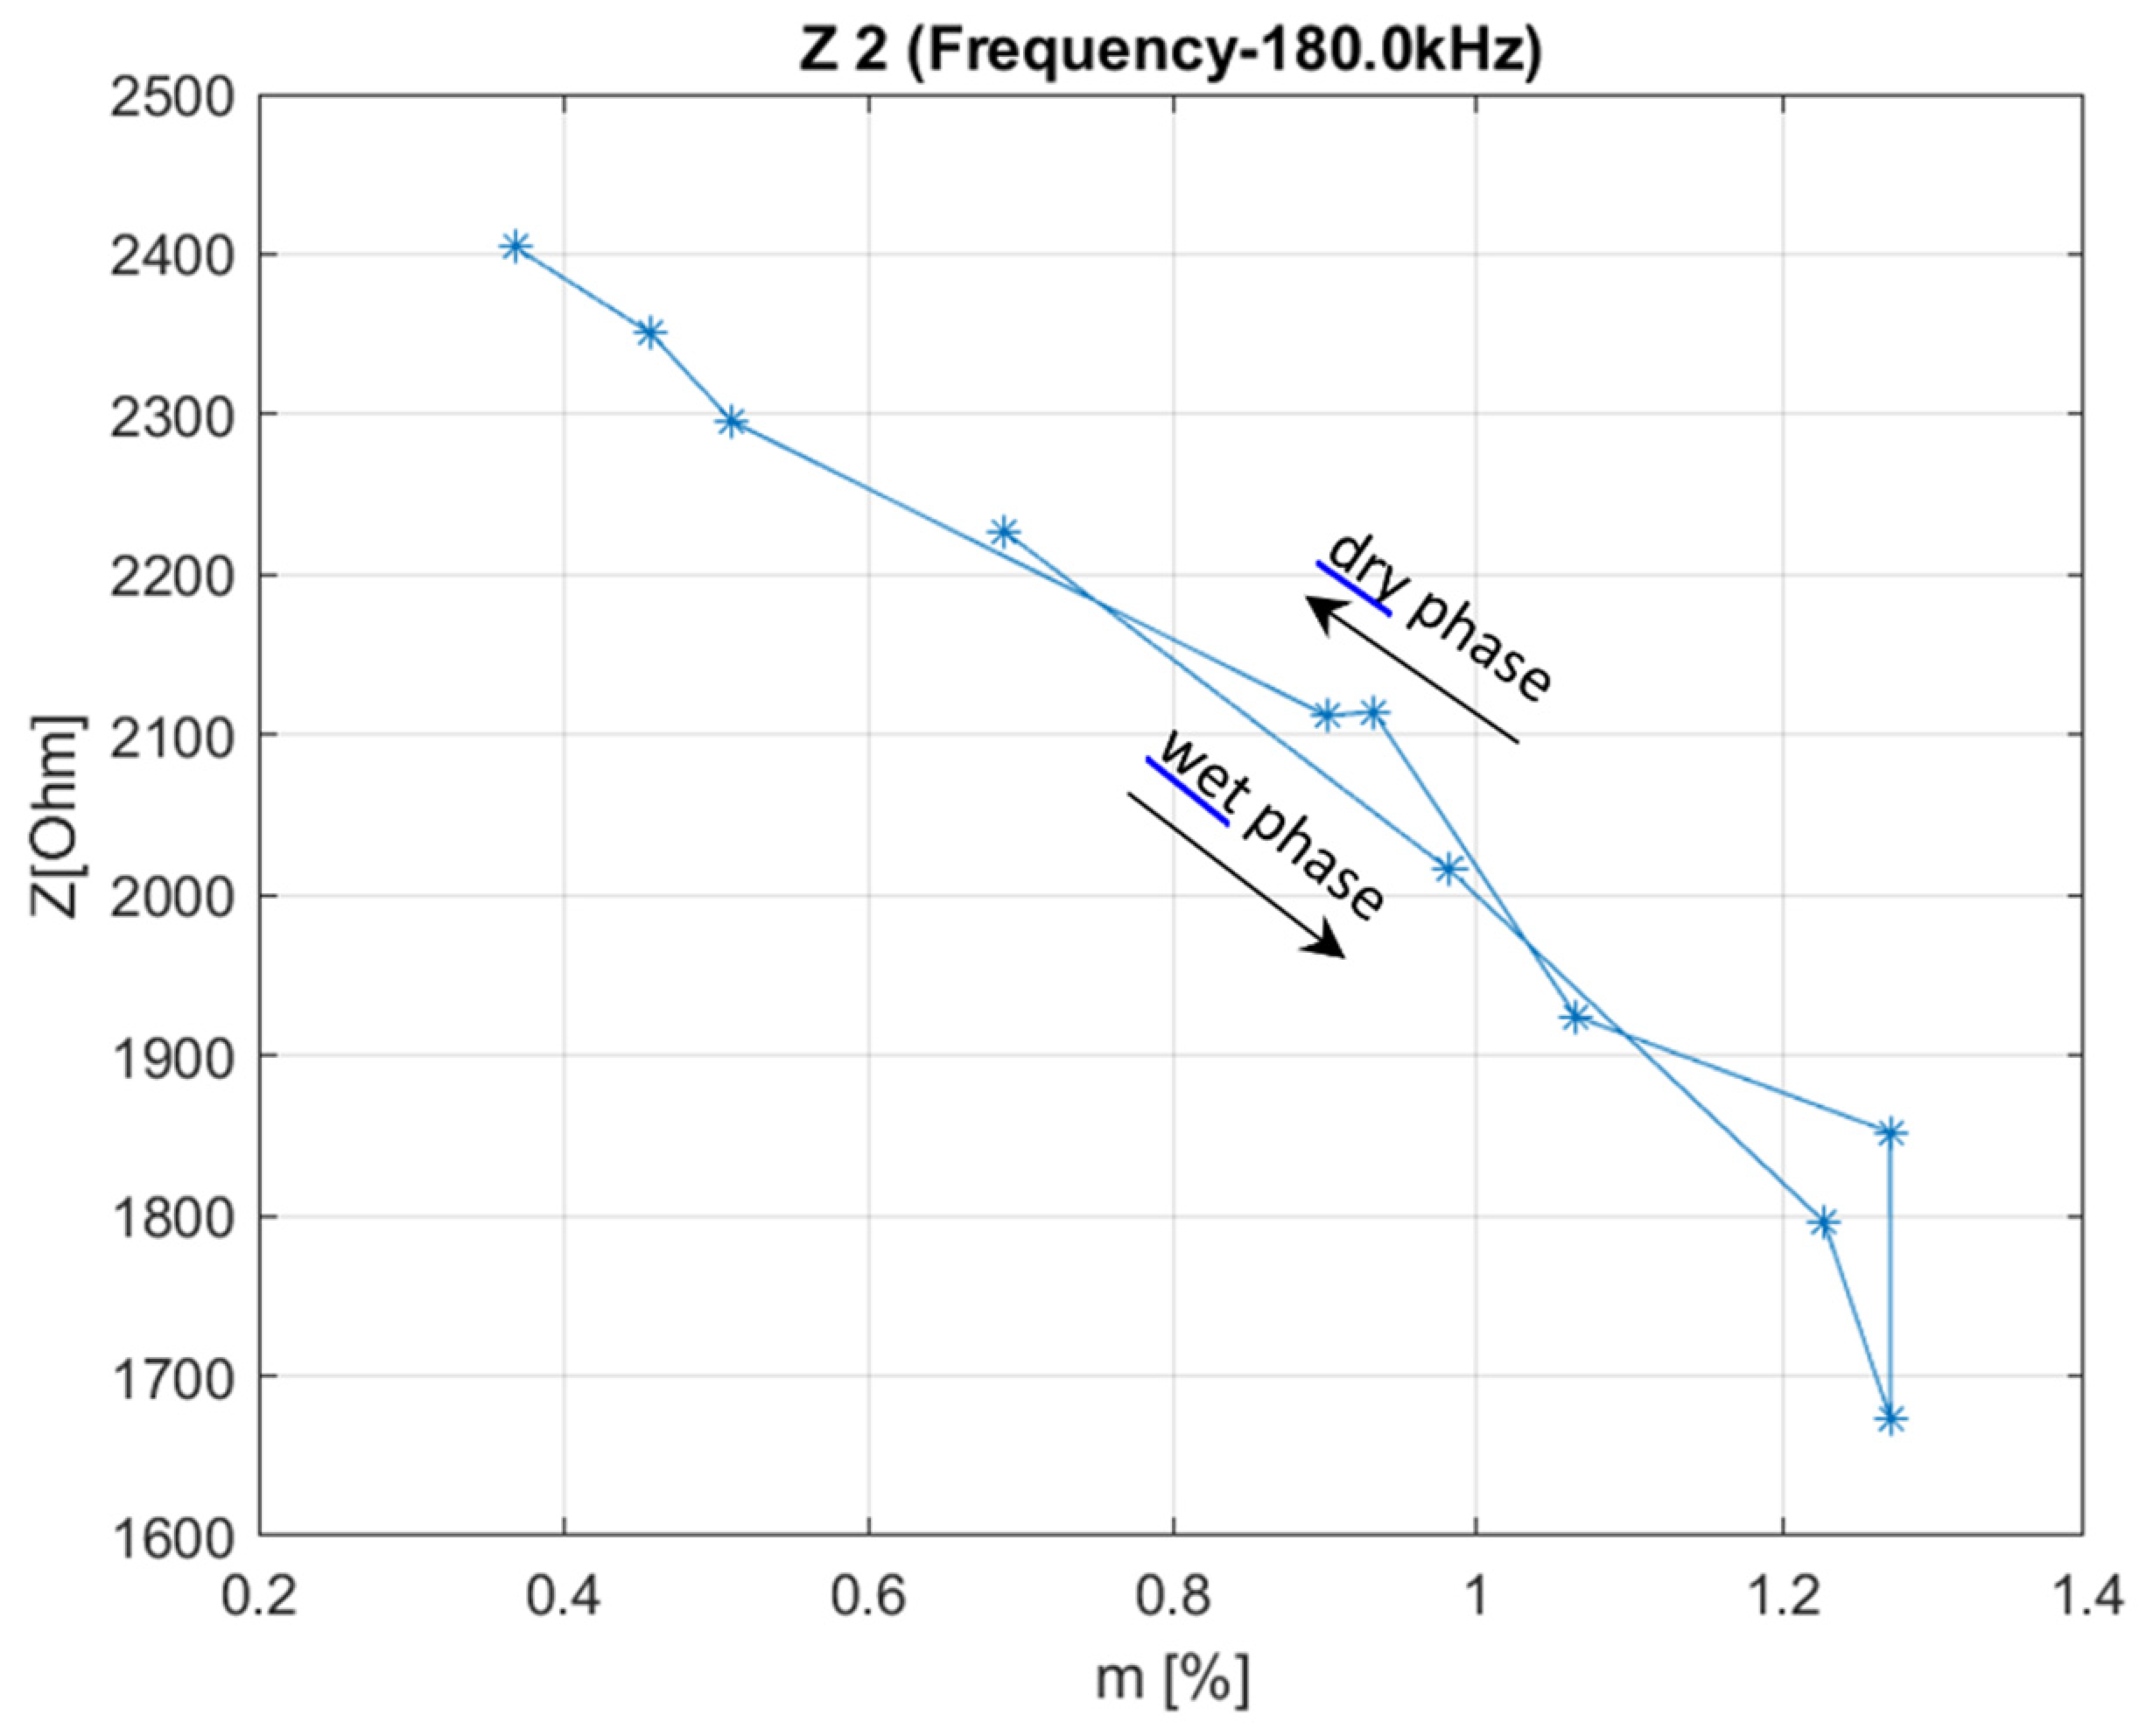
    In order not to alter the level of moisture absorption, the specimens are kept out of the bath no more than 30 min (the duration of each set of a + b. measurements is, therefore, less than 30 min).
  • Dry phase. Once the “saturation level” of the wet phase was reached, in which the phenomena of irregularity of the measurements begin to appear with respect to those of the previous measurement points, the specimens were subjected to a dry phase, also measuring the trend of the electrical parameters as a function of moisture absorption level. During the dry phase the specimens are conditioned in a ventilated oven at a constant temperature of 80 °C, in order to eliminate all the humidity present inside them. The mass and electrical measurements continue as in the previous phase, until the complete dehydration of the specimens is achieved. At the end of this phase, the mass M0 of each specimen is detected.

2.3. Electrical Measurement

In the following paragraphs it is described the measurement method used to determine the trend of electrical quantities with respect of the moisture level variation in the resin matrix of the CML specimens.

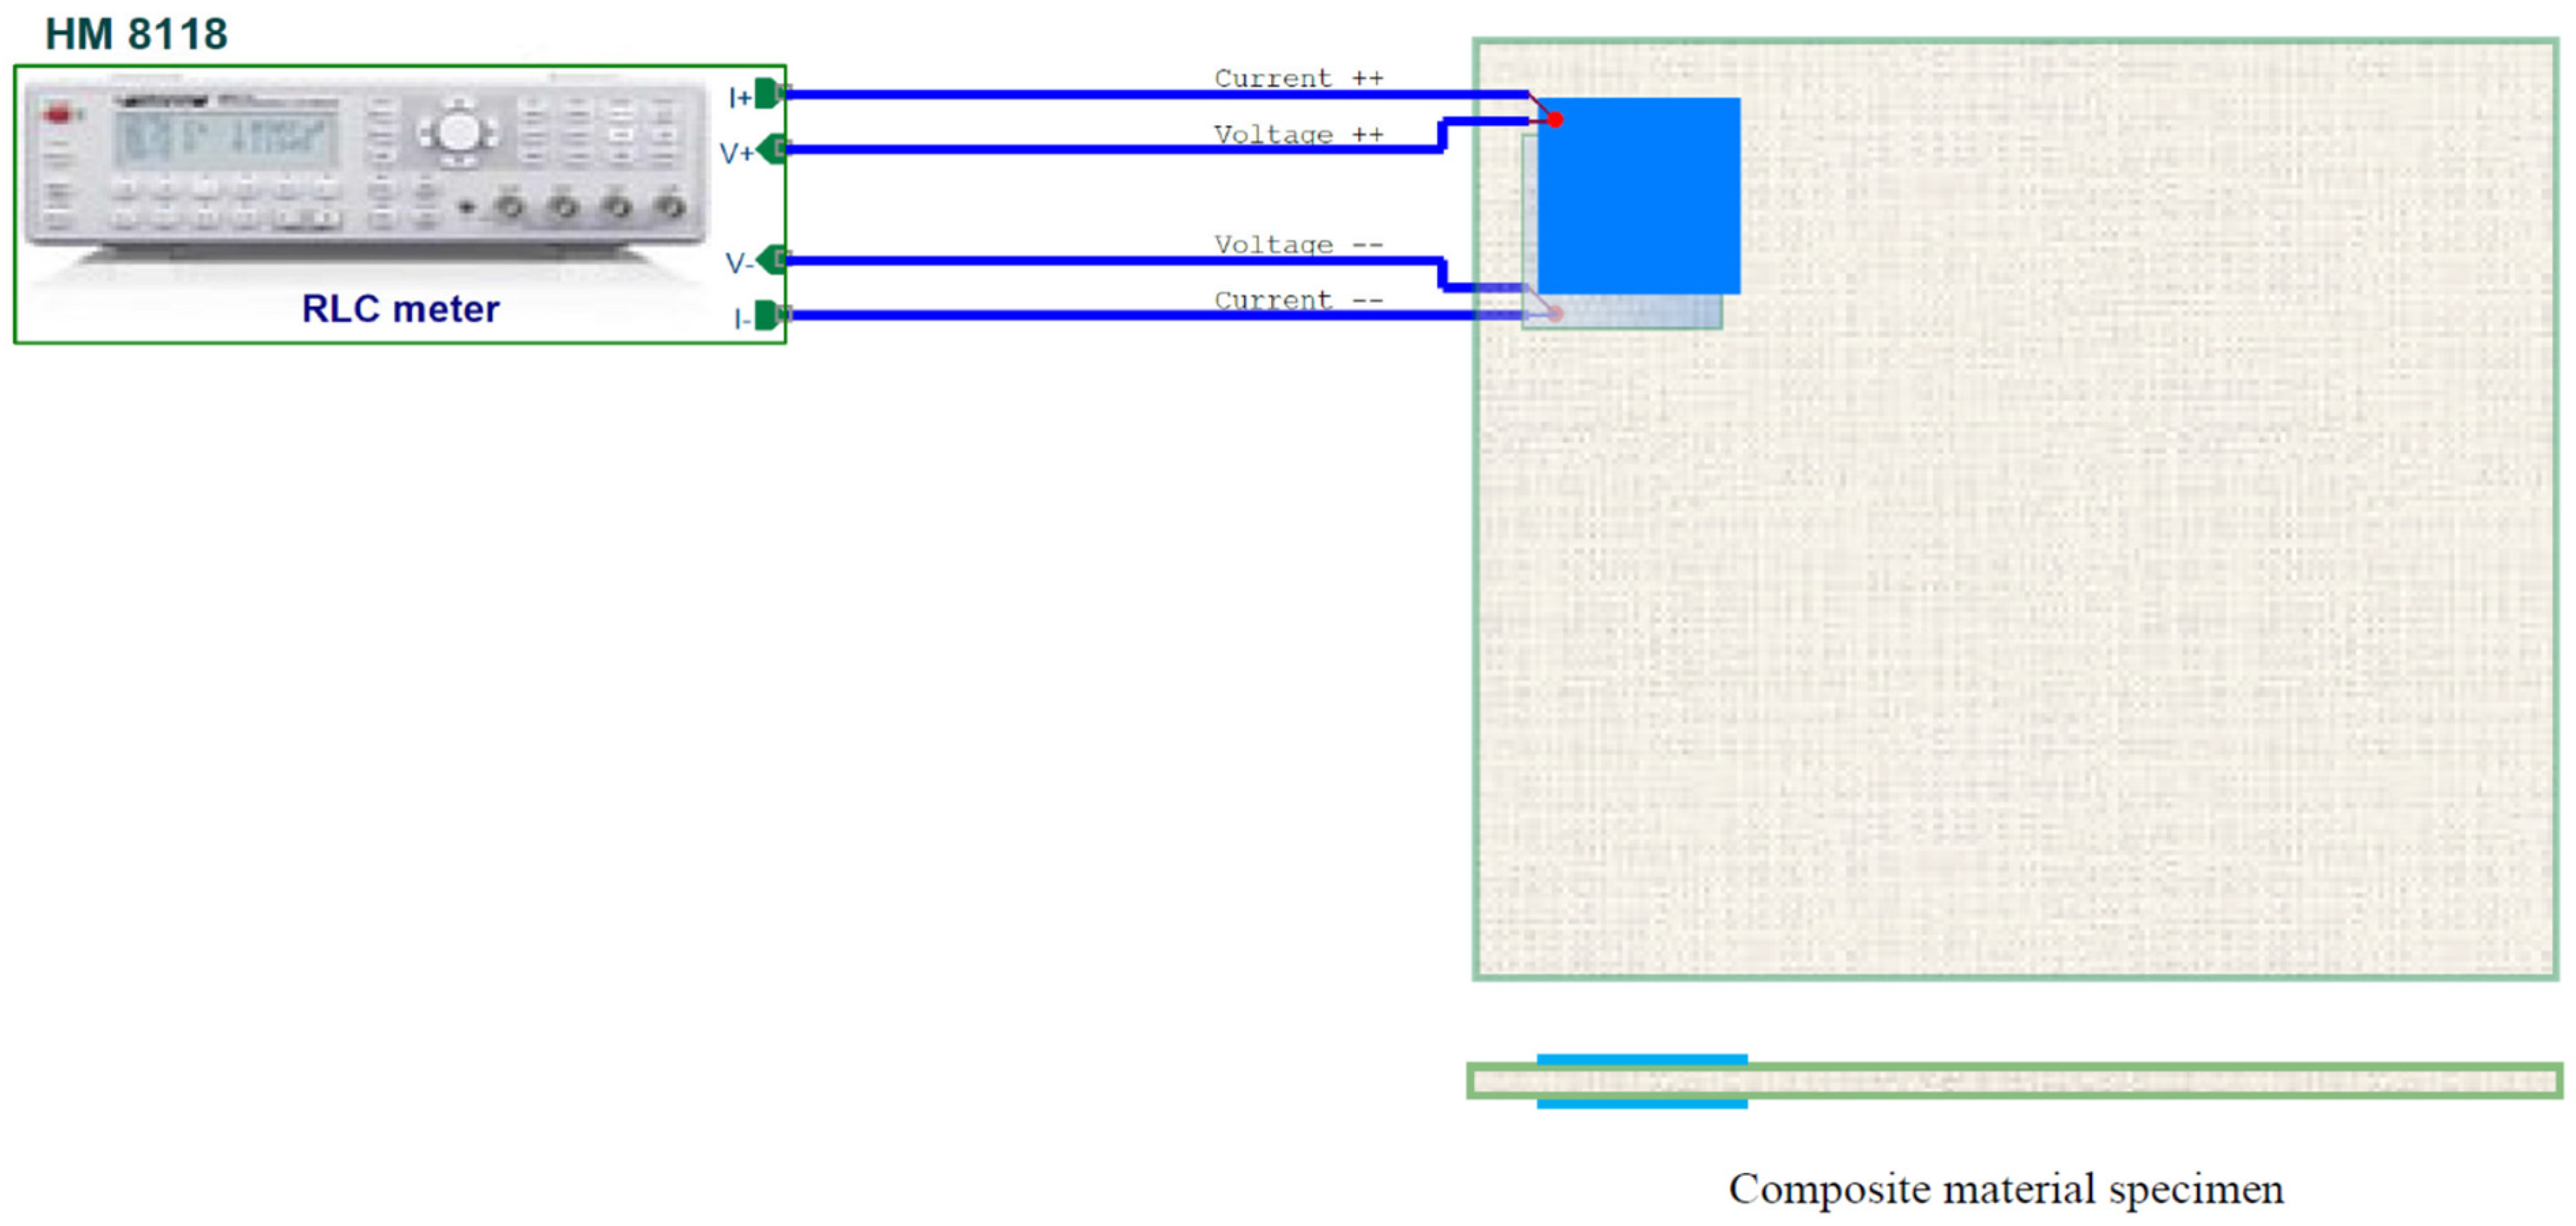
2.3.1. The Measuring Instrument

The equipment used for electrical measurements on the CML is the Hameg HM 8118 LCR meter (Rohde & Schwarz, Munich, Germany). The instrument was provided to us by the Rohde & Schwarz Company, which we thank here.
It is able to perform 4-wire electrical measurements for passive dipoles characterization, obtaining the significant parameters as a function of the excitation frequency.
The 4-wire measurement significantly increases the accuracy of the instrument [13].
The instrument uses inside a voltmeter and an ammeter for the measurements, and for the excitation it uses an internal adjustable frequency generator, ranging from 20 Hz to 200 kHz, while adapting its output impedance according to the impedance of the dipole under test.

2.3.2. Measurement Scheme

The measurement scheme is shown in Figure 4. The electrodes are glued one in front of the other, facing on opposite surfaces of each specimen.
The measurement is performed with 4 wires: 2 wires for the exciting current to flow (amperometric section) and 2 wires for the high impedance voltage measurement (voltmeter section). In this way, due to a negligible current flow into the voltmeter section, used for measurement, the error due to the voltage drop of the connection cables (parasitic impedance) is greatly reduced. Otherwise, in the high frequency measurement range, where, as we shall see, the dipole impedance is lower, the parasitic impedance error would be greater.
In the figure below, the voltmetric section is connected to terminals V+ and V−, while the amperometric section is connected to terminals I+ and I−.

2.3.3. Measurement Details

Two specimens were investigated.
Measurements were made through two pairs of electrodes onto the first specimen and a pair of electrodes onto the second specimen.
The electrodes were platelets of 30 × 30 mm dimensions, gathered as pairs for the electric measurement, faced each other (see previous paragraph) and glued as follows:
  • a pair of measurement, called test piece 1A, placed laterally on the facing surfaces of the first specimen;
  • a measurement pair, called test piece 1B, at the center of the first specimen surfaces;
  • a measurement pair, called specimen 2, at the center of the second specimen.
By these pairs of electrodes, at various excitation frequencies, the following electrical quantities were measured as a function of the moisture absorption level:
  • Z, Theta (modulus and phase of the impedance)
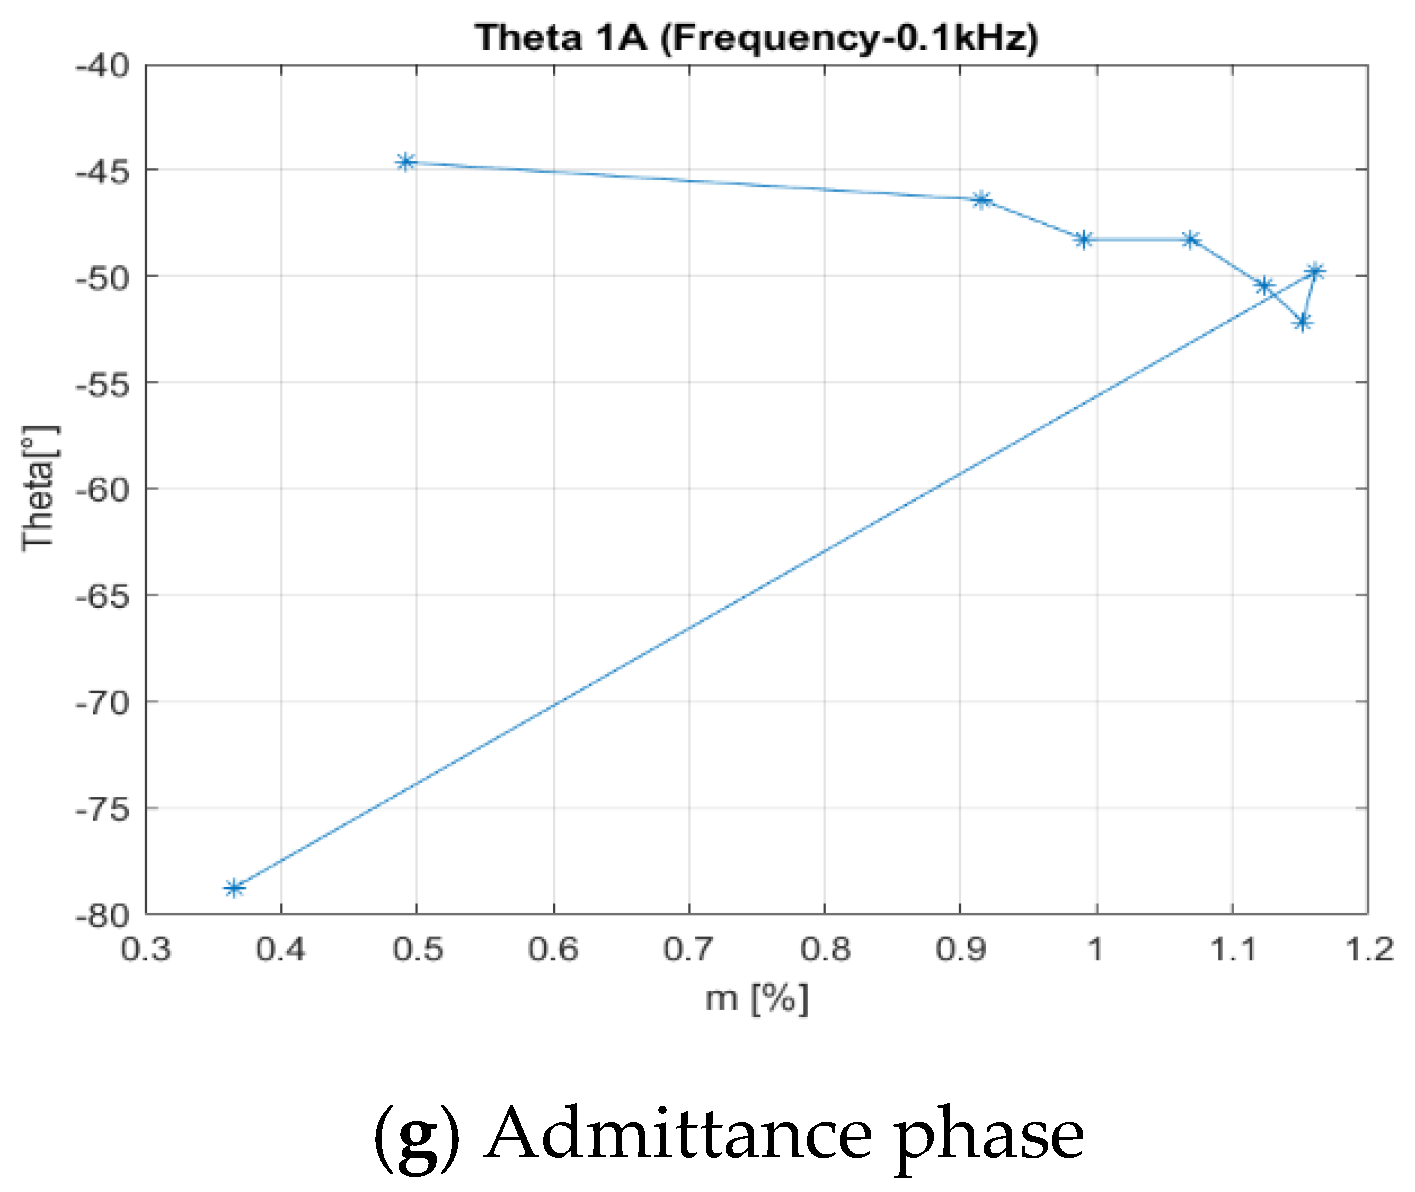
  • Y, Theta (modulus and phase of the admittance)
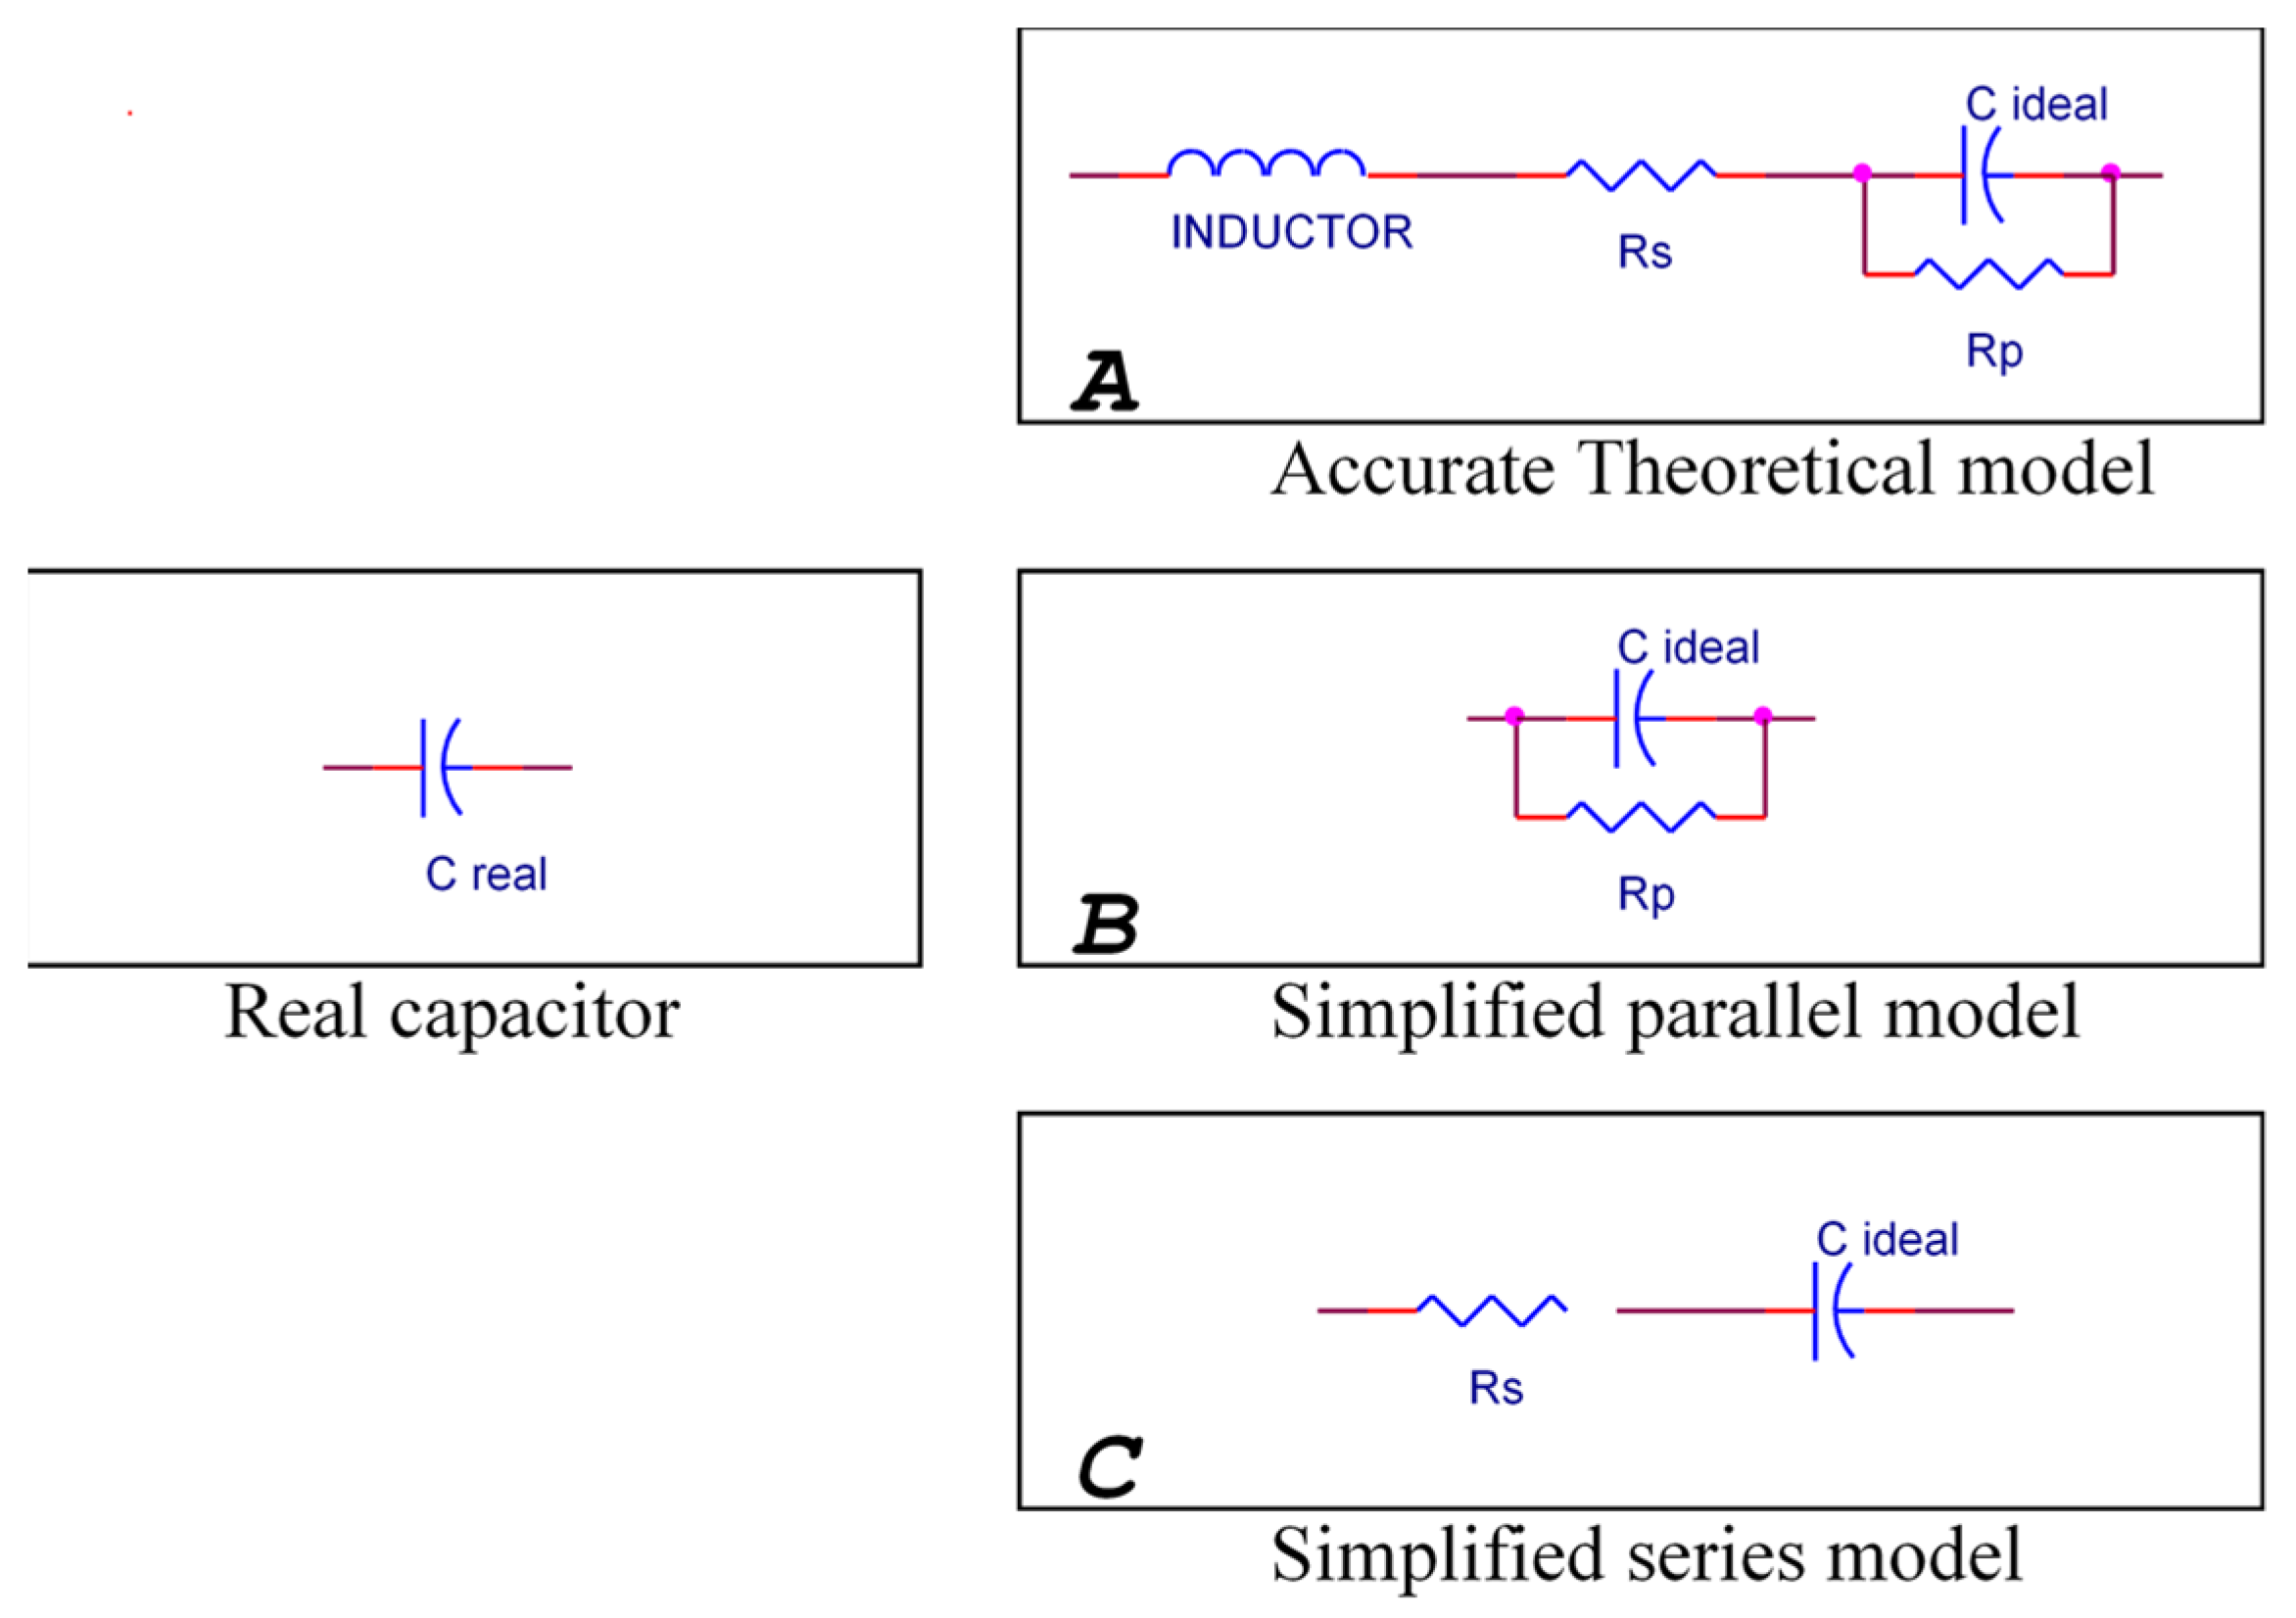
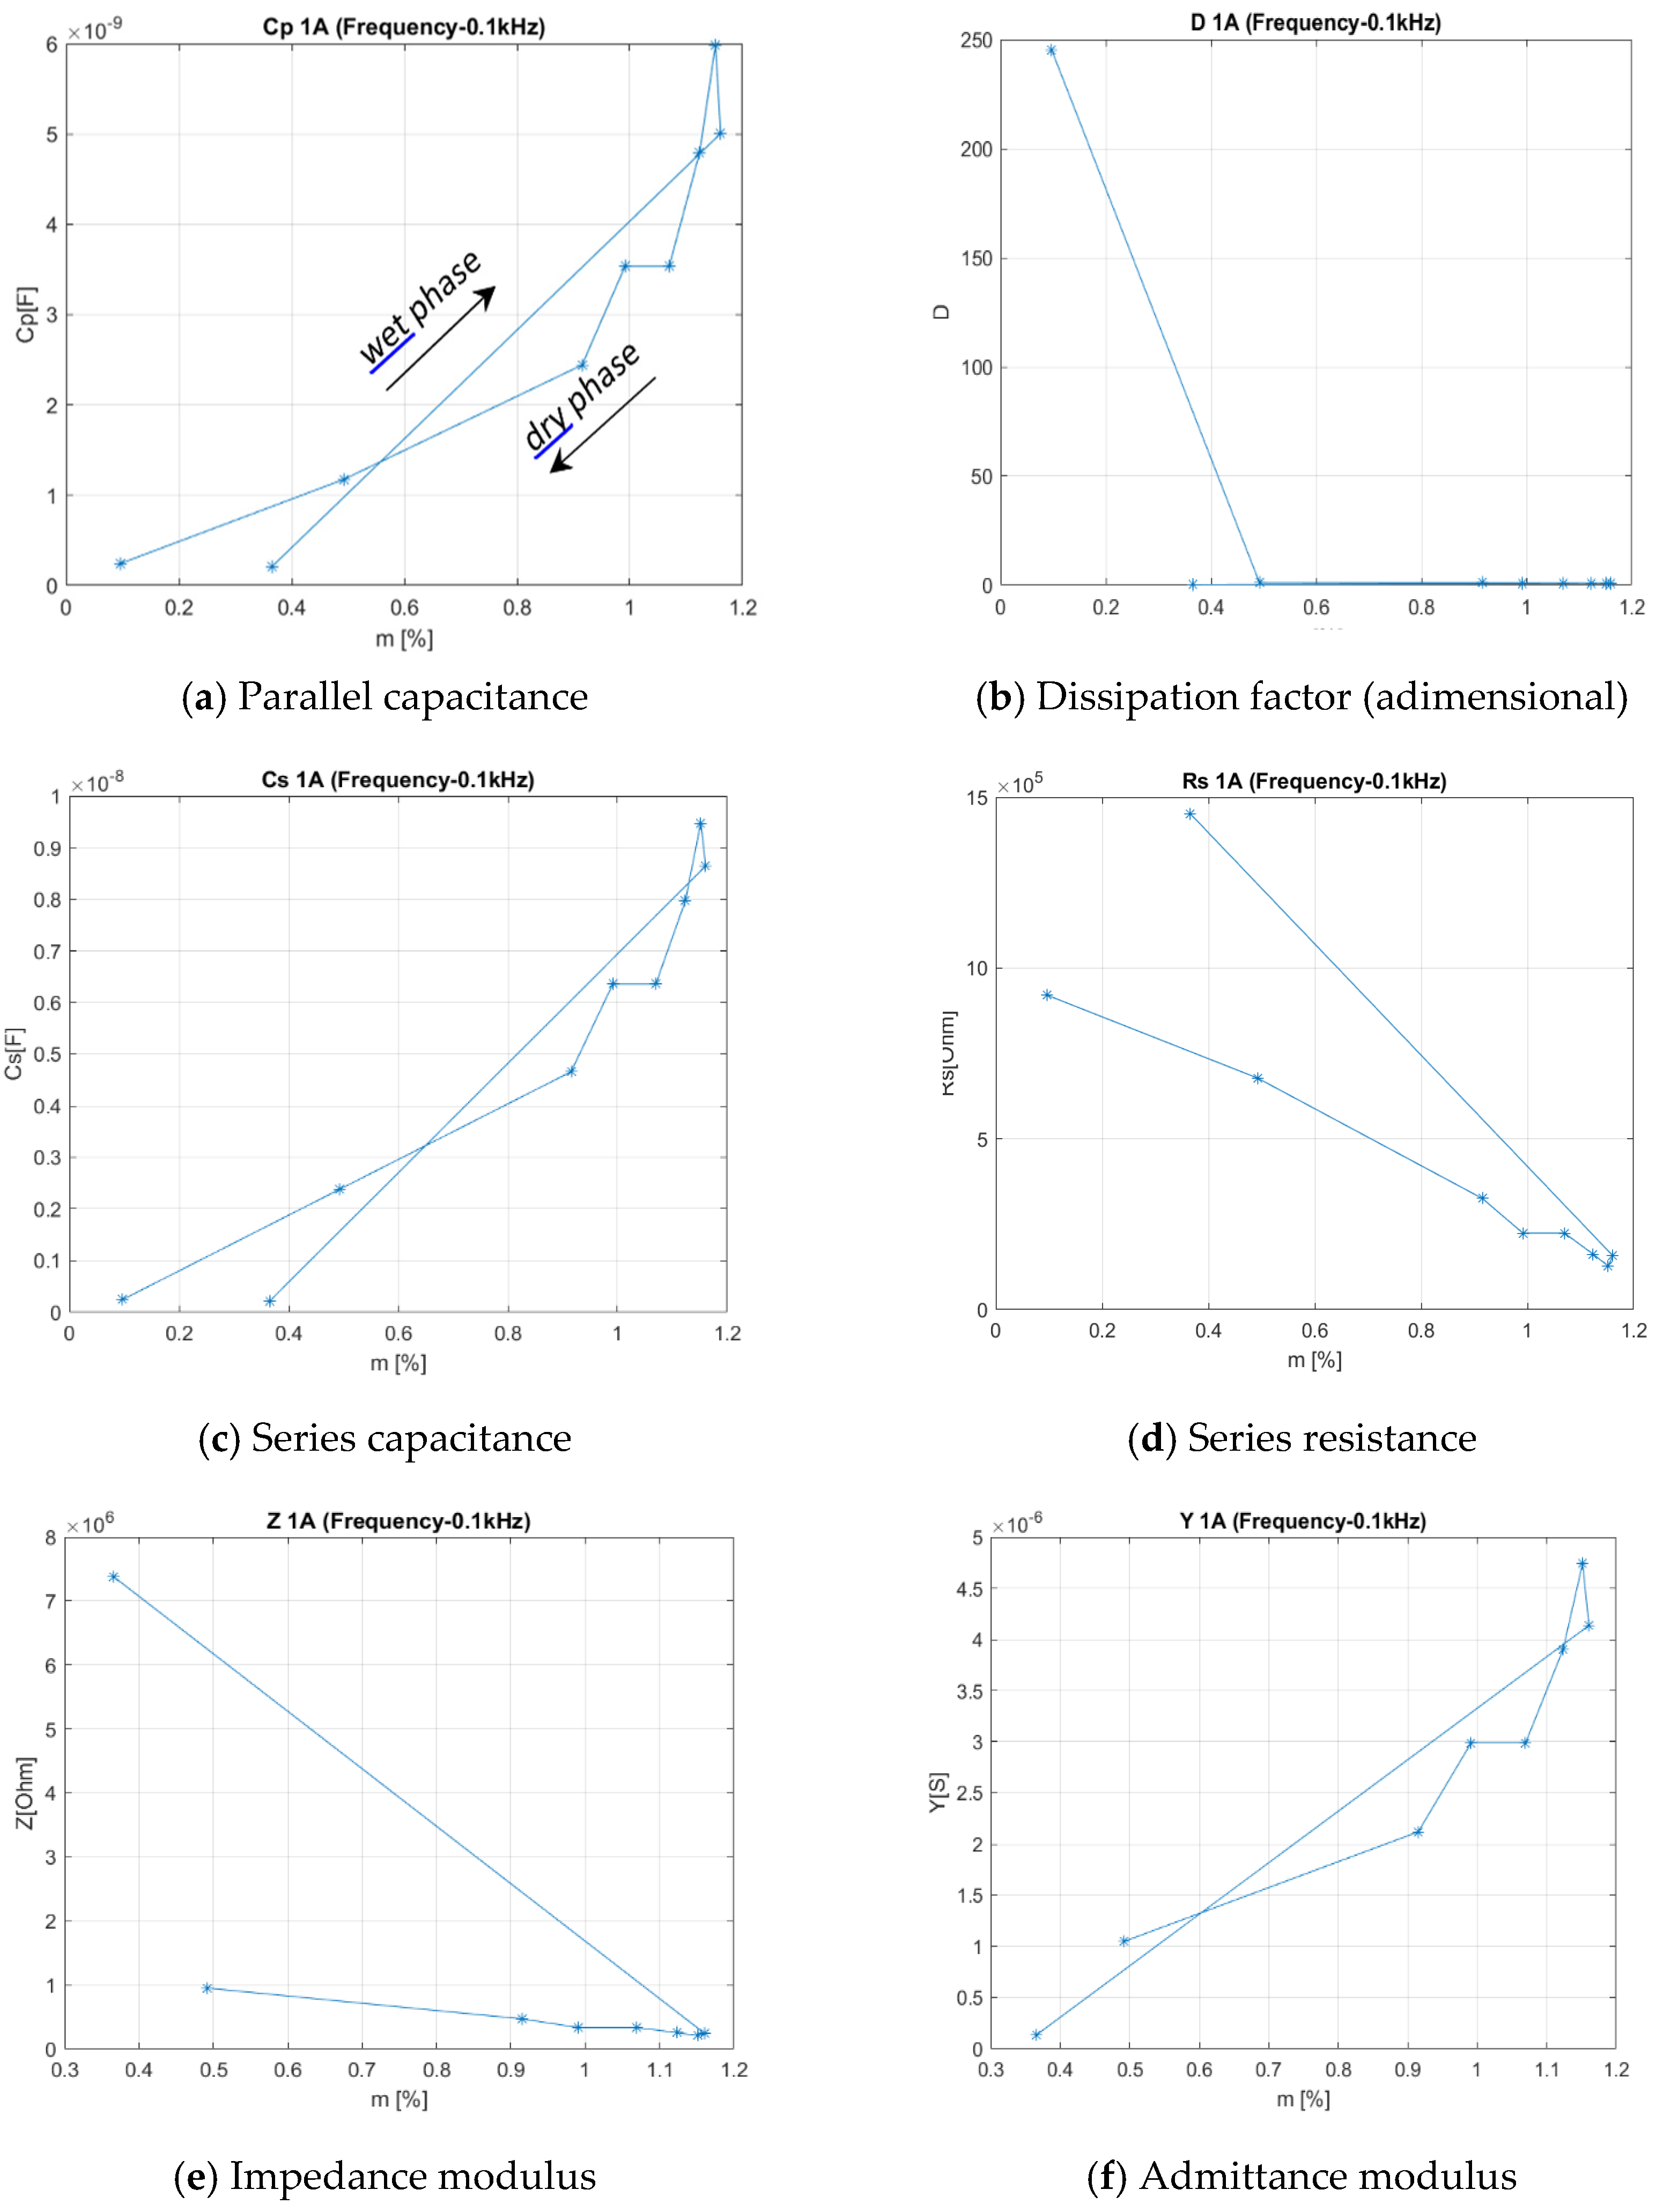
  • Cp, D (capacity and dissipation factor of the parallel equivalent circuit, i.e., assuming to have a simplified equivalent circuit configuration corresponding to a parallel of a capacitor plus a resistor—see Figure 2, box B)
  • Cs, Rs (capacity and resistance of the equivalent series circuit, made of a capacitor plus a resistor serially connected—see Figure 2, box C)
Measurements were automatically performed by the instrument, by means of voltage and current values correlation as measured by the voltage section and amperometric section of the instrument.
The instrument was programmed using LabVIEW design software (National Instruments, Austin, TX, USA).

2.4. Mass Measurement (Absorbed Moisture Level)

In order to derive the moisture content of the CML, the specimens were subjected to drying, according to ASTM 5229 procedures [11].
As told before, the M0 weight point was found, namely the point of minimum water content, beyond which, even if continuing in the phase of drying in the oven, we could not go.
This point was used as a reference for measurements, in the various stages of hydration. So, at each set of measurement, the hydration status of the specimen was expressed in term of percentage variation m of the absorbed moisture level:
m (%) = 100(MM0)/M0
where:
M = mass of specimen during that set of measurements
M0 = mass at full dry condition
At each hydration status of the specimens, that is at each set of measurements, the specimens were weighed by using a Sartorius BP 211D (Sartorius AG, Göttingen, Germany) precision analytical balance and the electrical measurements of that set were related to m, the percentage difference of the absorbed moisture content, referred to M0.
To be noted that the weight of the electrodes and their wires was subtracted from the measured values.
The M0 value, the mass of the specimen in full dry condition was obtained by drying the specimen in an oven at 80 °C for a total time of about 1200 h.
The limited absorption and desorption test campaign gave the following curves:
Figure 5 and Figure 6 represent respectively the results of the moisture absorption and desorption tests of the two composite specimens, 1 and 2. At each point of both absorption and desorption curves the electrical scan has been performed on both specimens.
The maximum moisture intake percentage was in line with data provided by other authors [14].

2.5. Data Sets

In summary, after the first achievement of the full dry condition the specimens electrical characteristics were investigated during wet and dry subsequent phases, by measuring the electric parameters and mass and each measurement set was related to the relative moisture absorption level m.
In particular, each set of measurement was performed, for each specimen, during a momentary suspension of hydration or dehydration. Thus, each set of measurement is related to a hydration status, m, and 15 stages of hydration were considered. So, we had 15 hydration status (m).
For each m hydration status the following pairs of electrical measurements were made:
  • Z(m), Theta(m)
  • Y(m), Theta(m)
  • Cp(m), D(m)
  • Cs(m), Rs(m)
Each of the previous electrical parameter was evaluated using excitation signals in the frequency range 20 Hz–200 kHz, at 66 frequency points, for 3 electrode pairs (2 onto the first specimen and 1 onto the other one).
Totally, about 23,000 elementary measurement points were taken.
Database and software used for data treatment are available in Supplementary Materials.

2.6. Data Reduction and Graphics
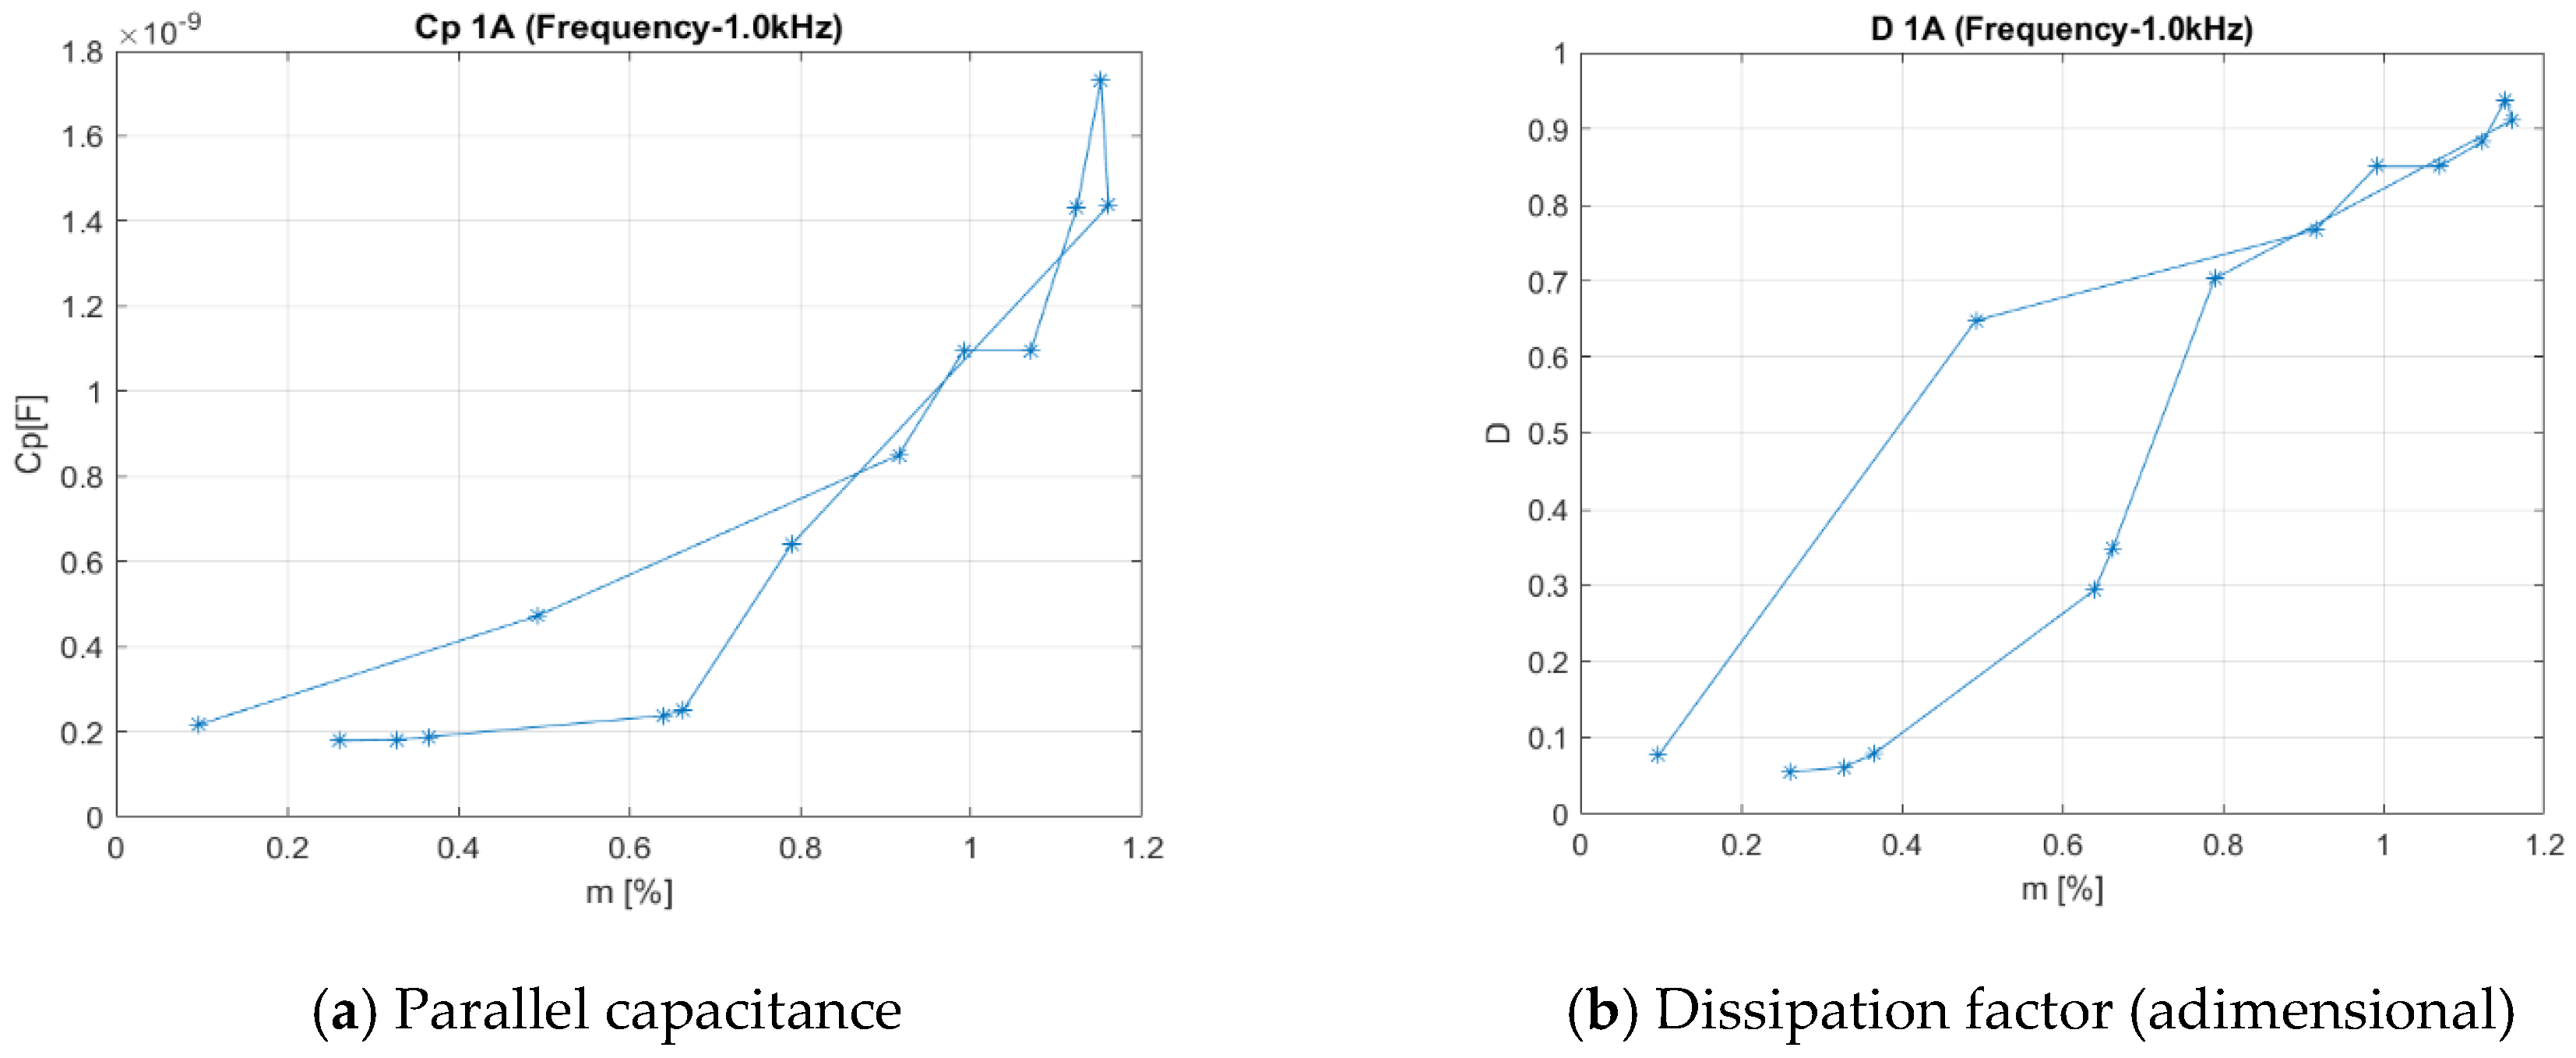
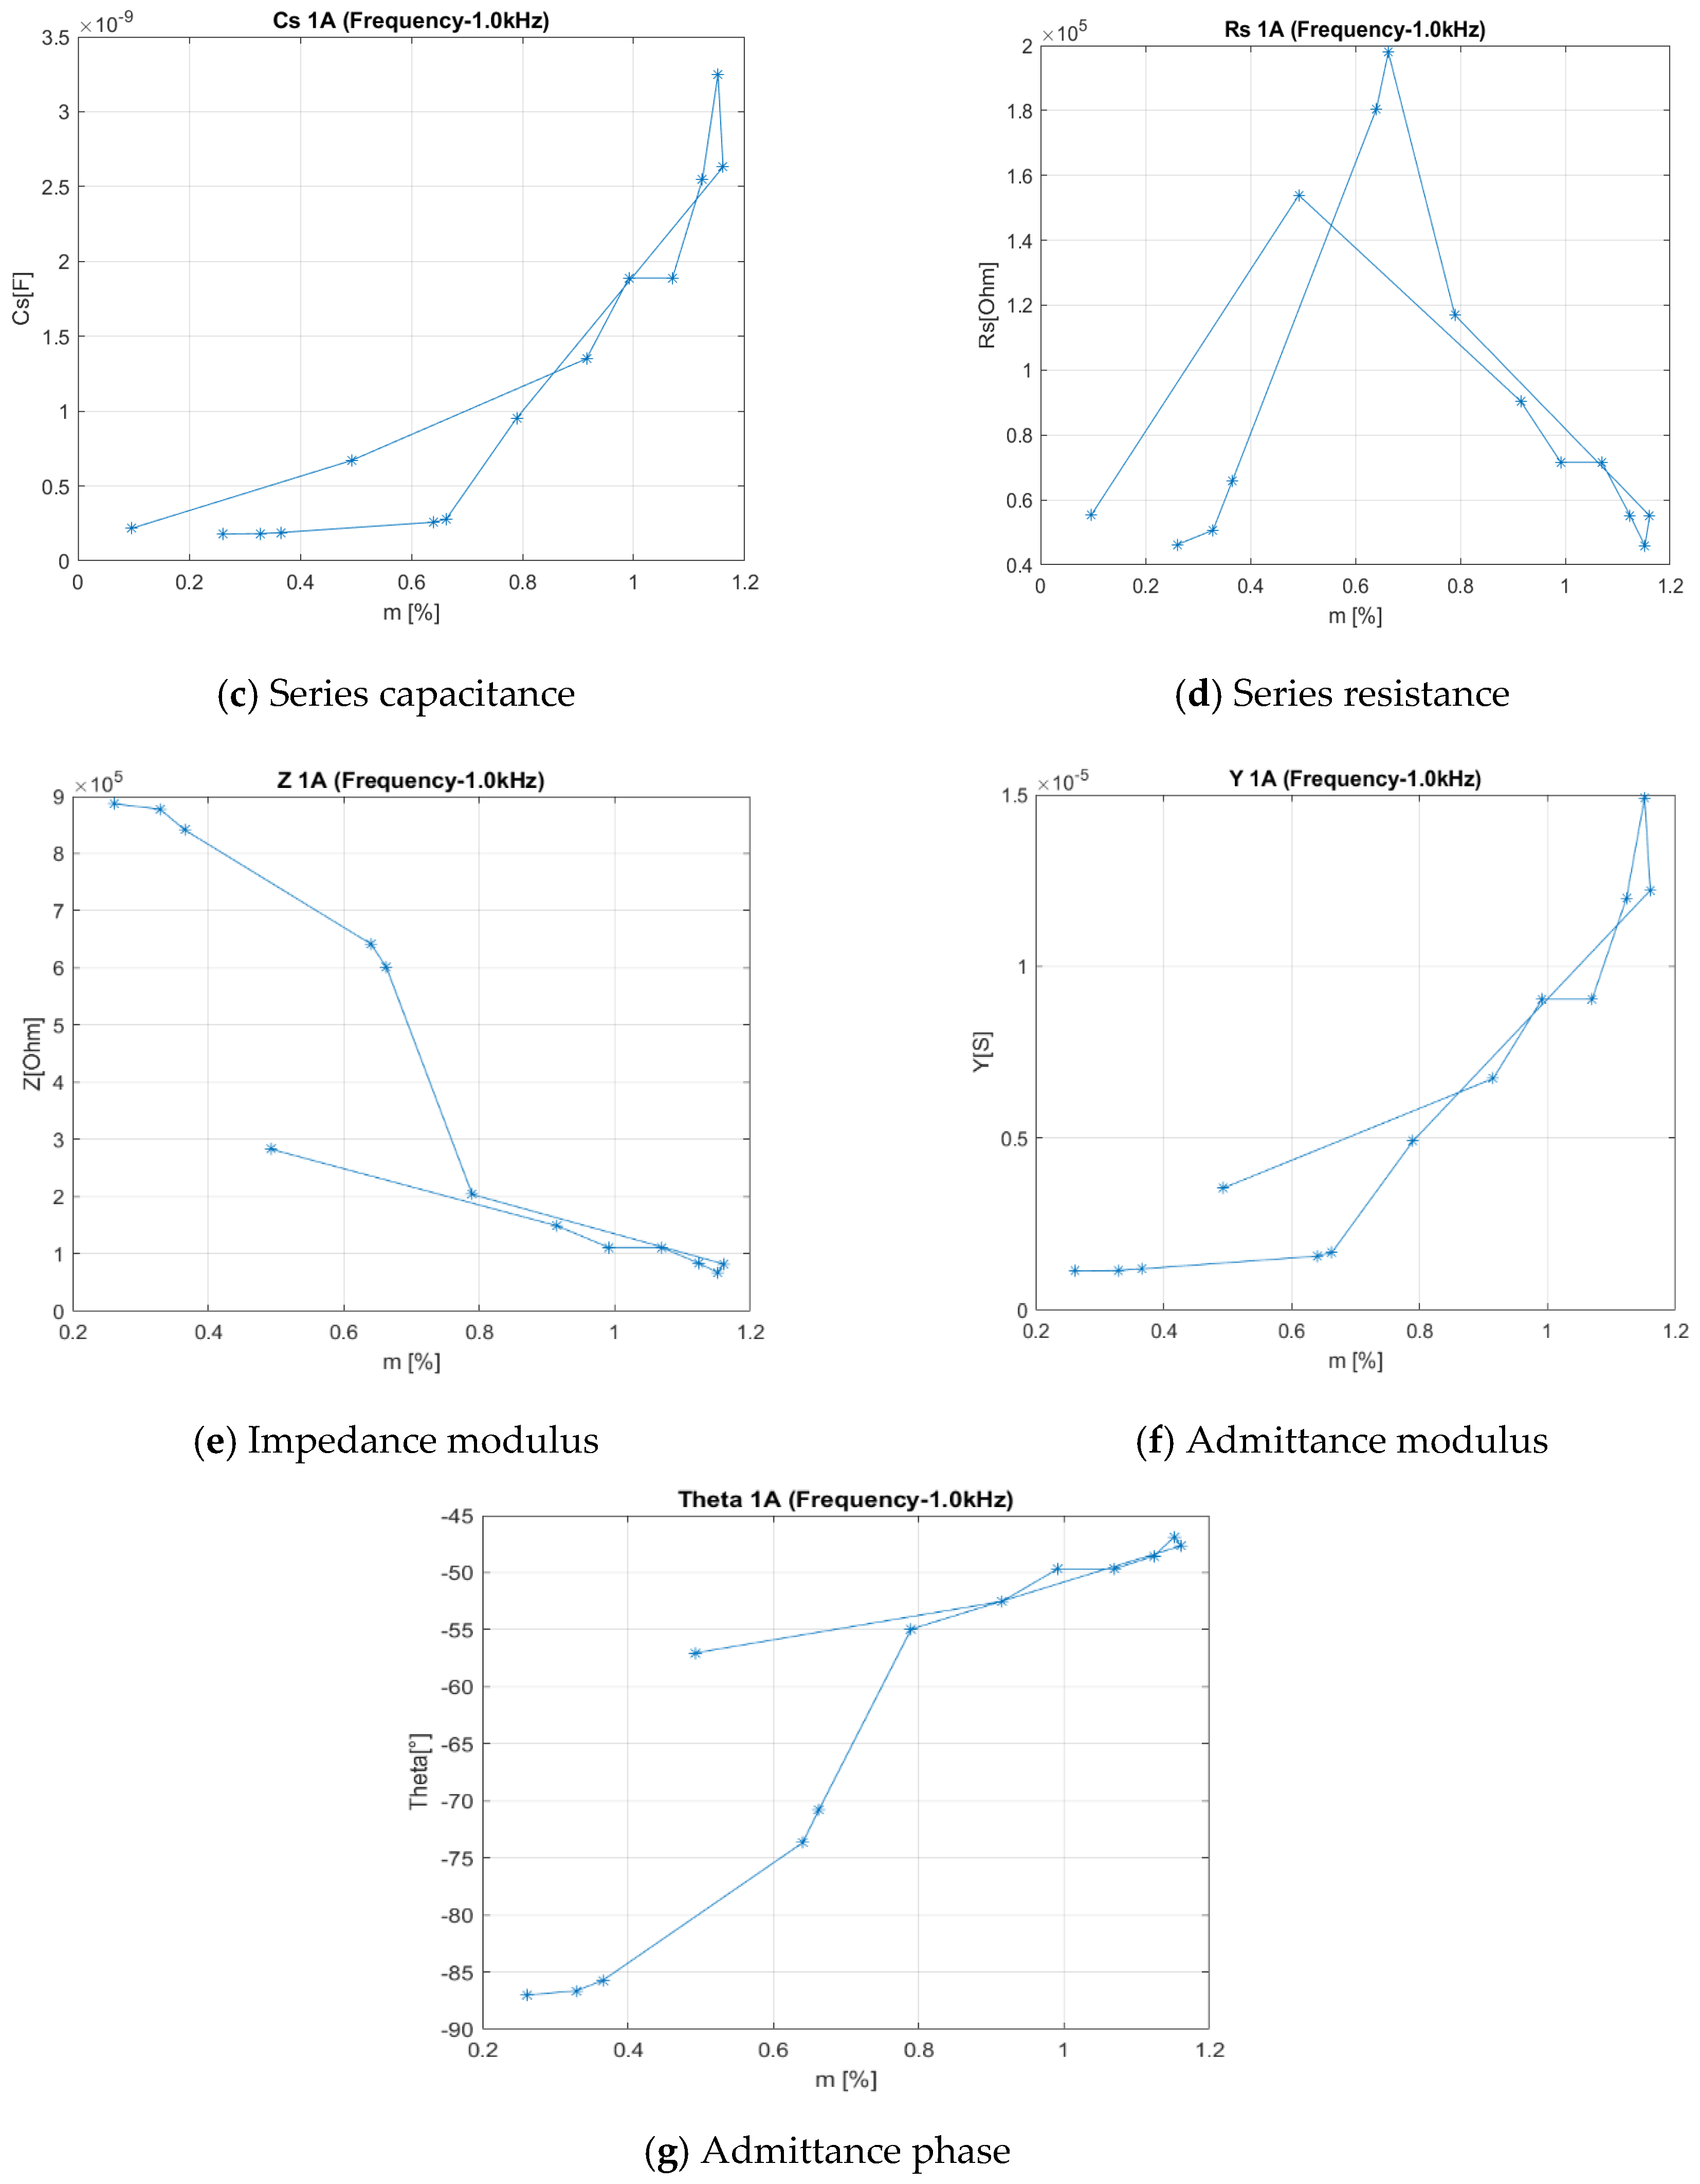
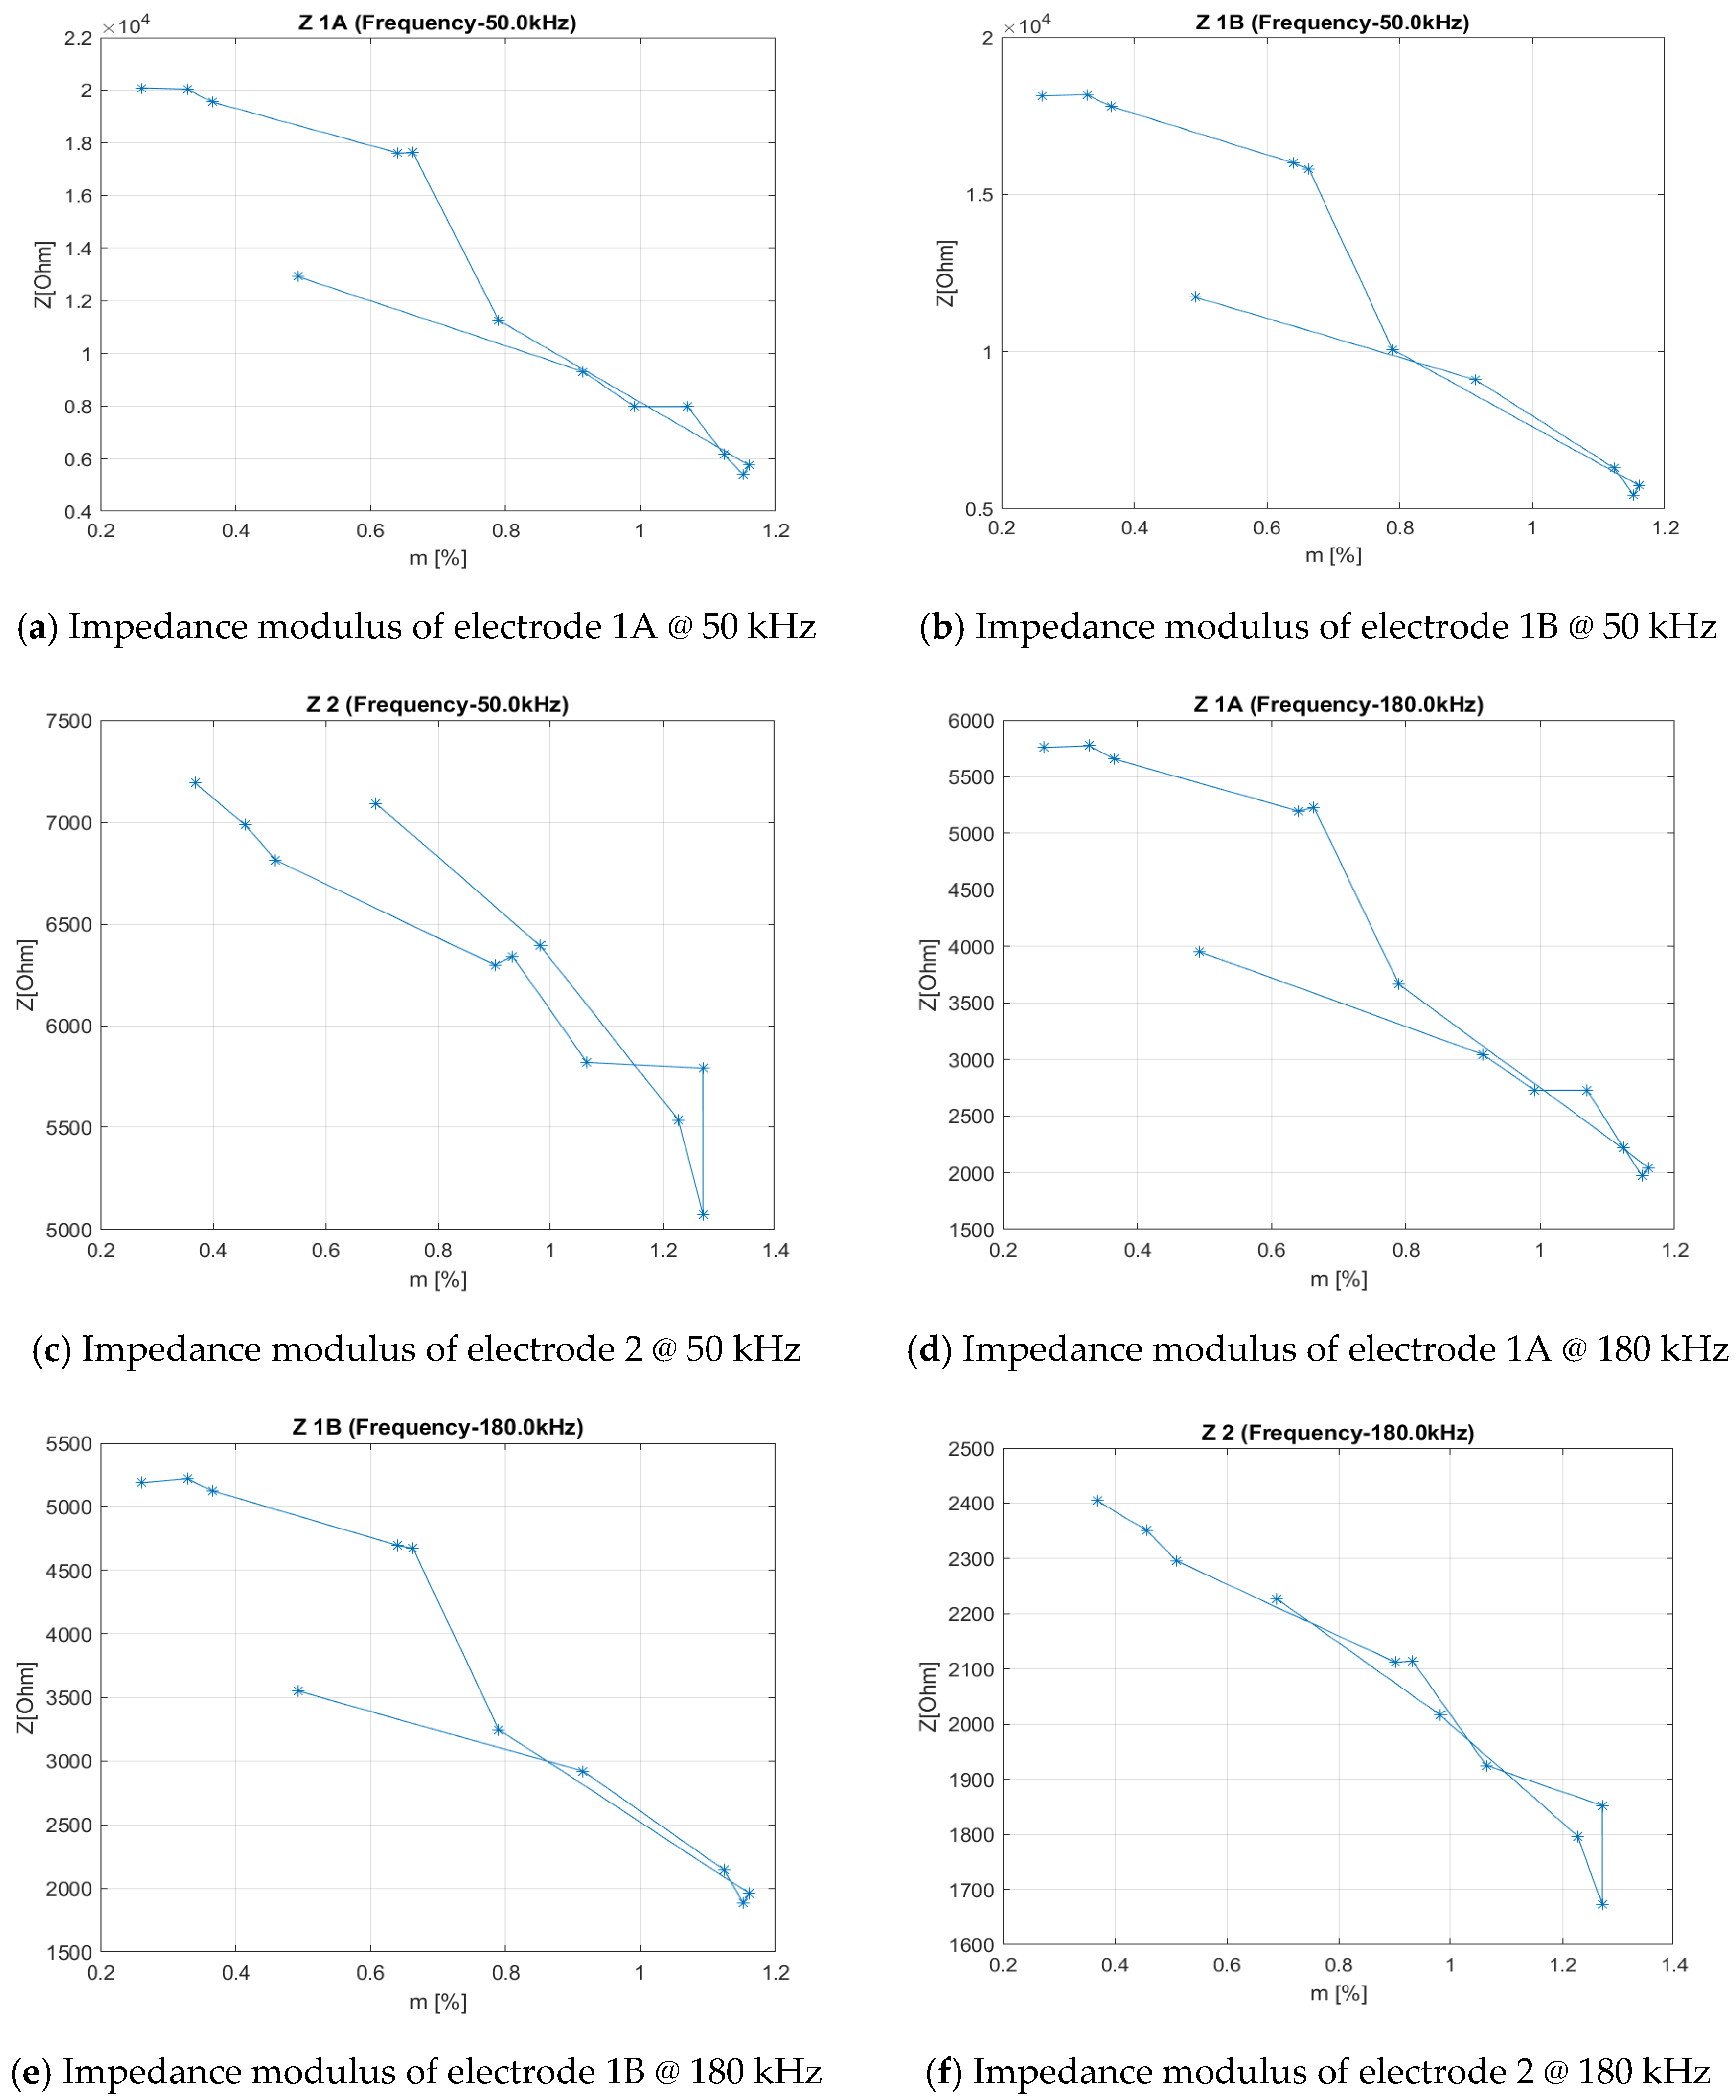
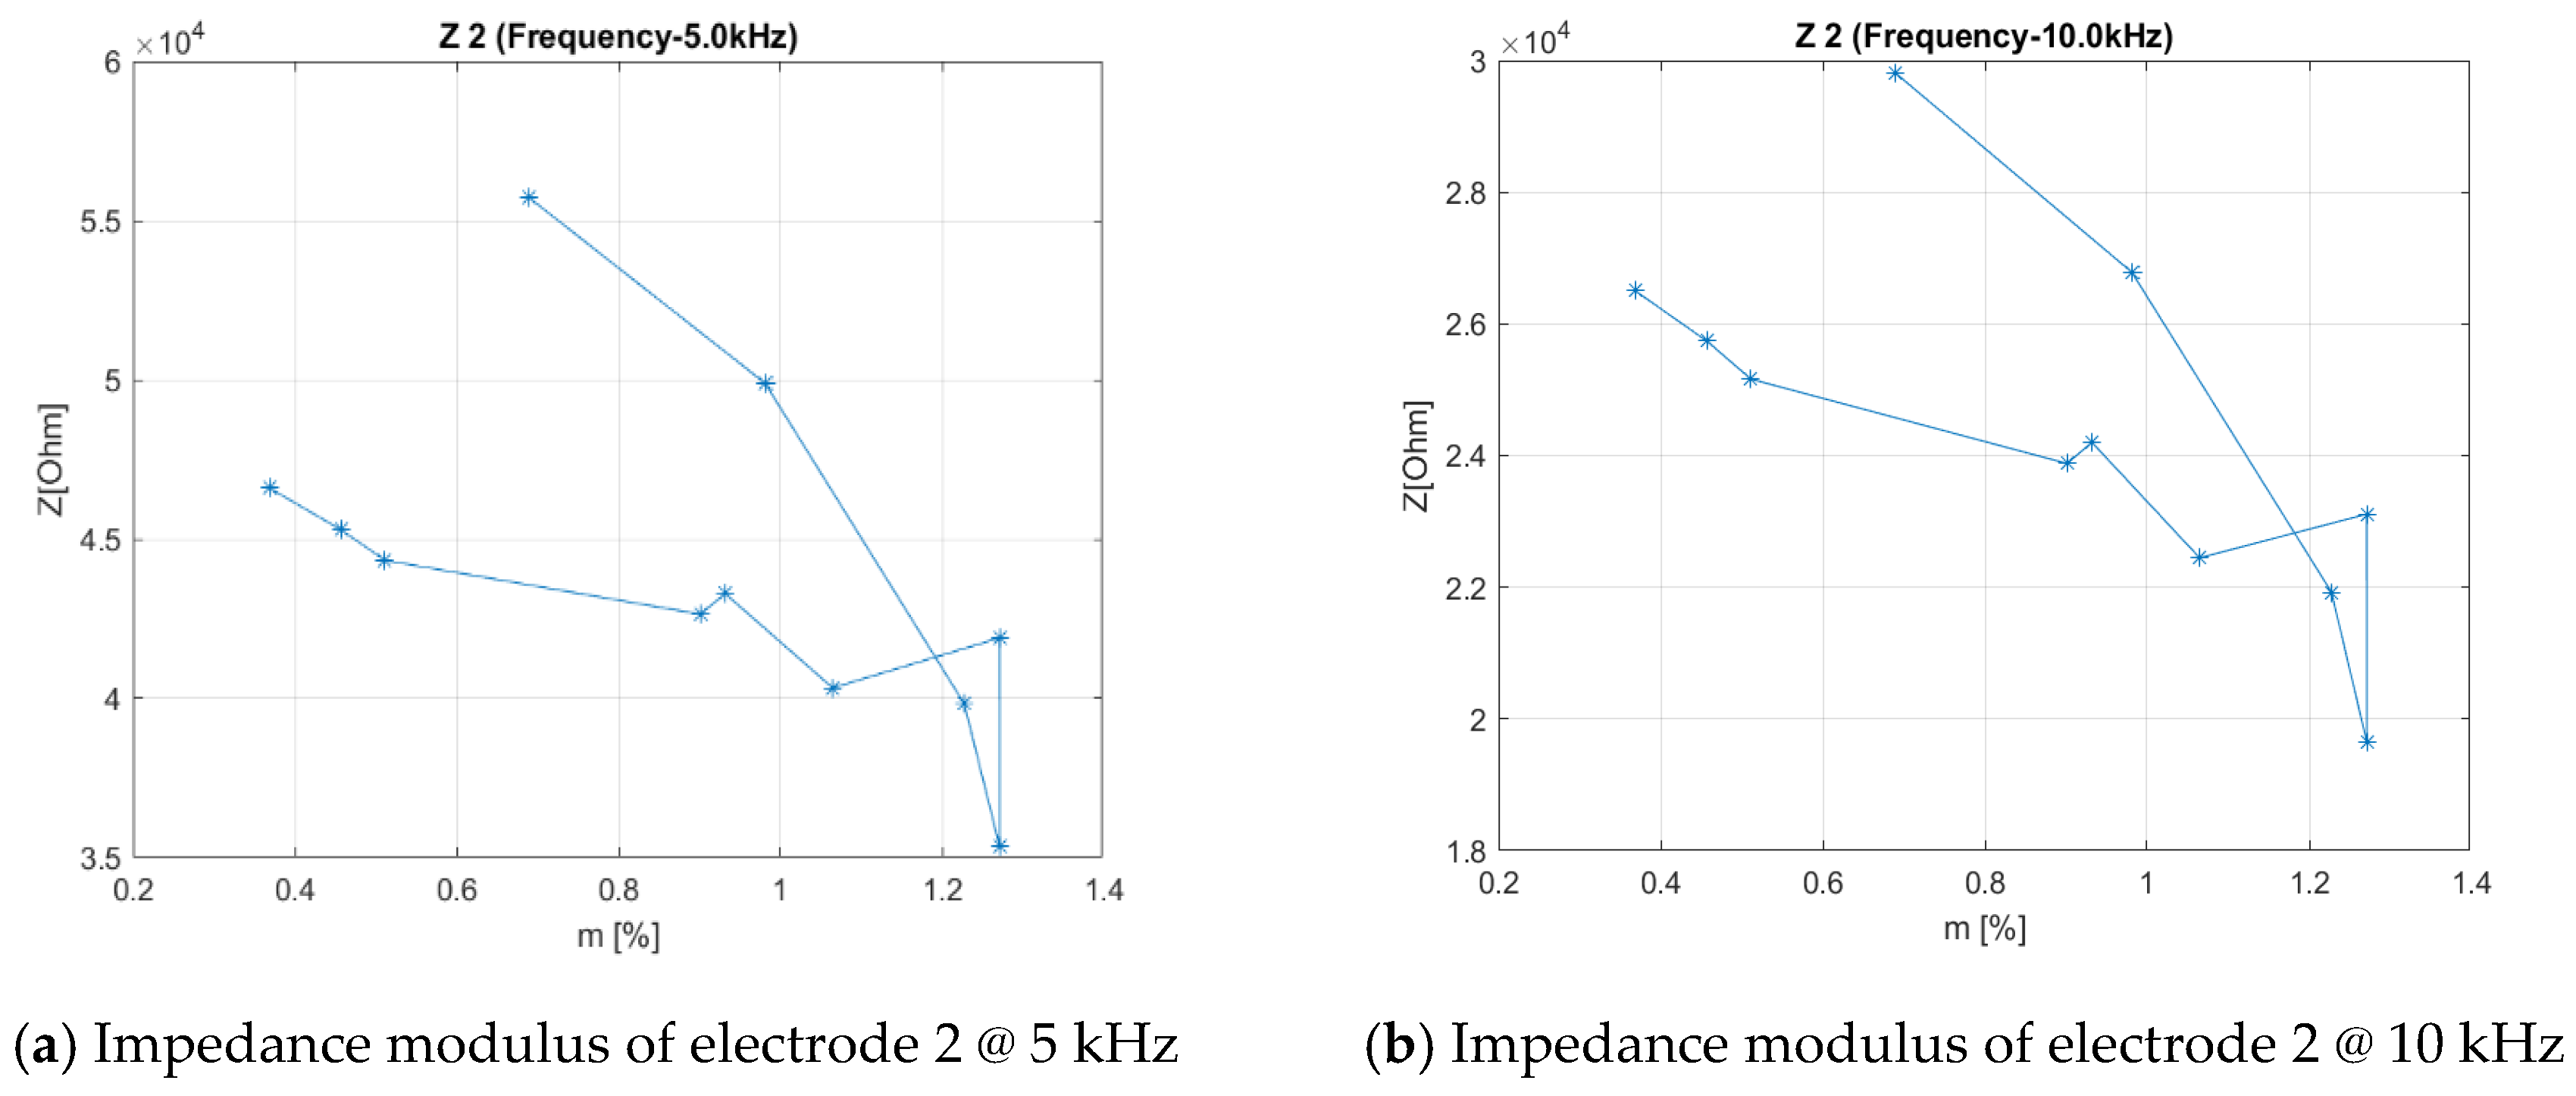
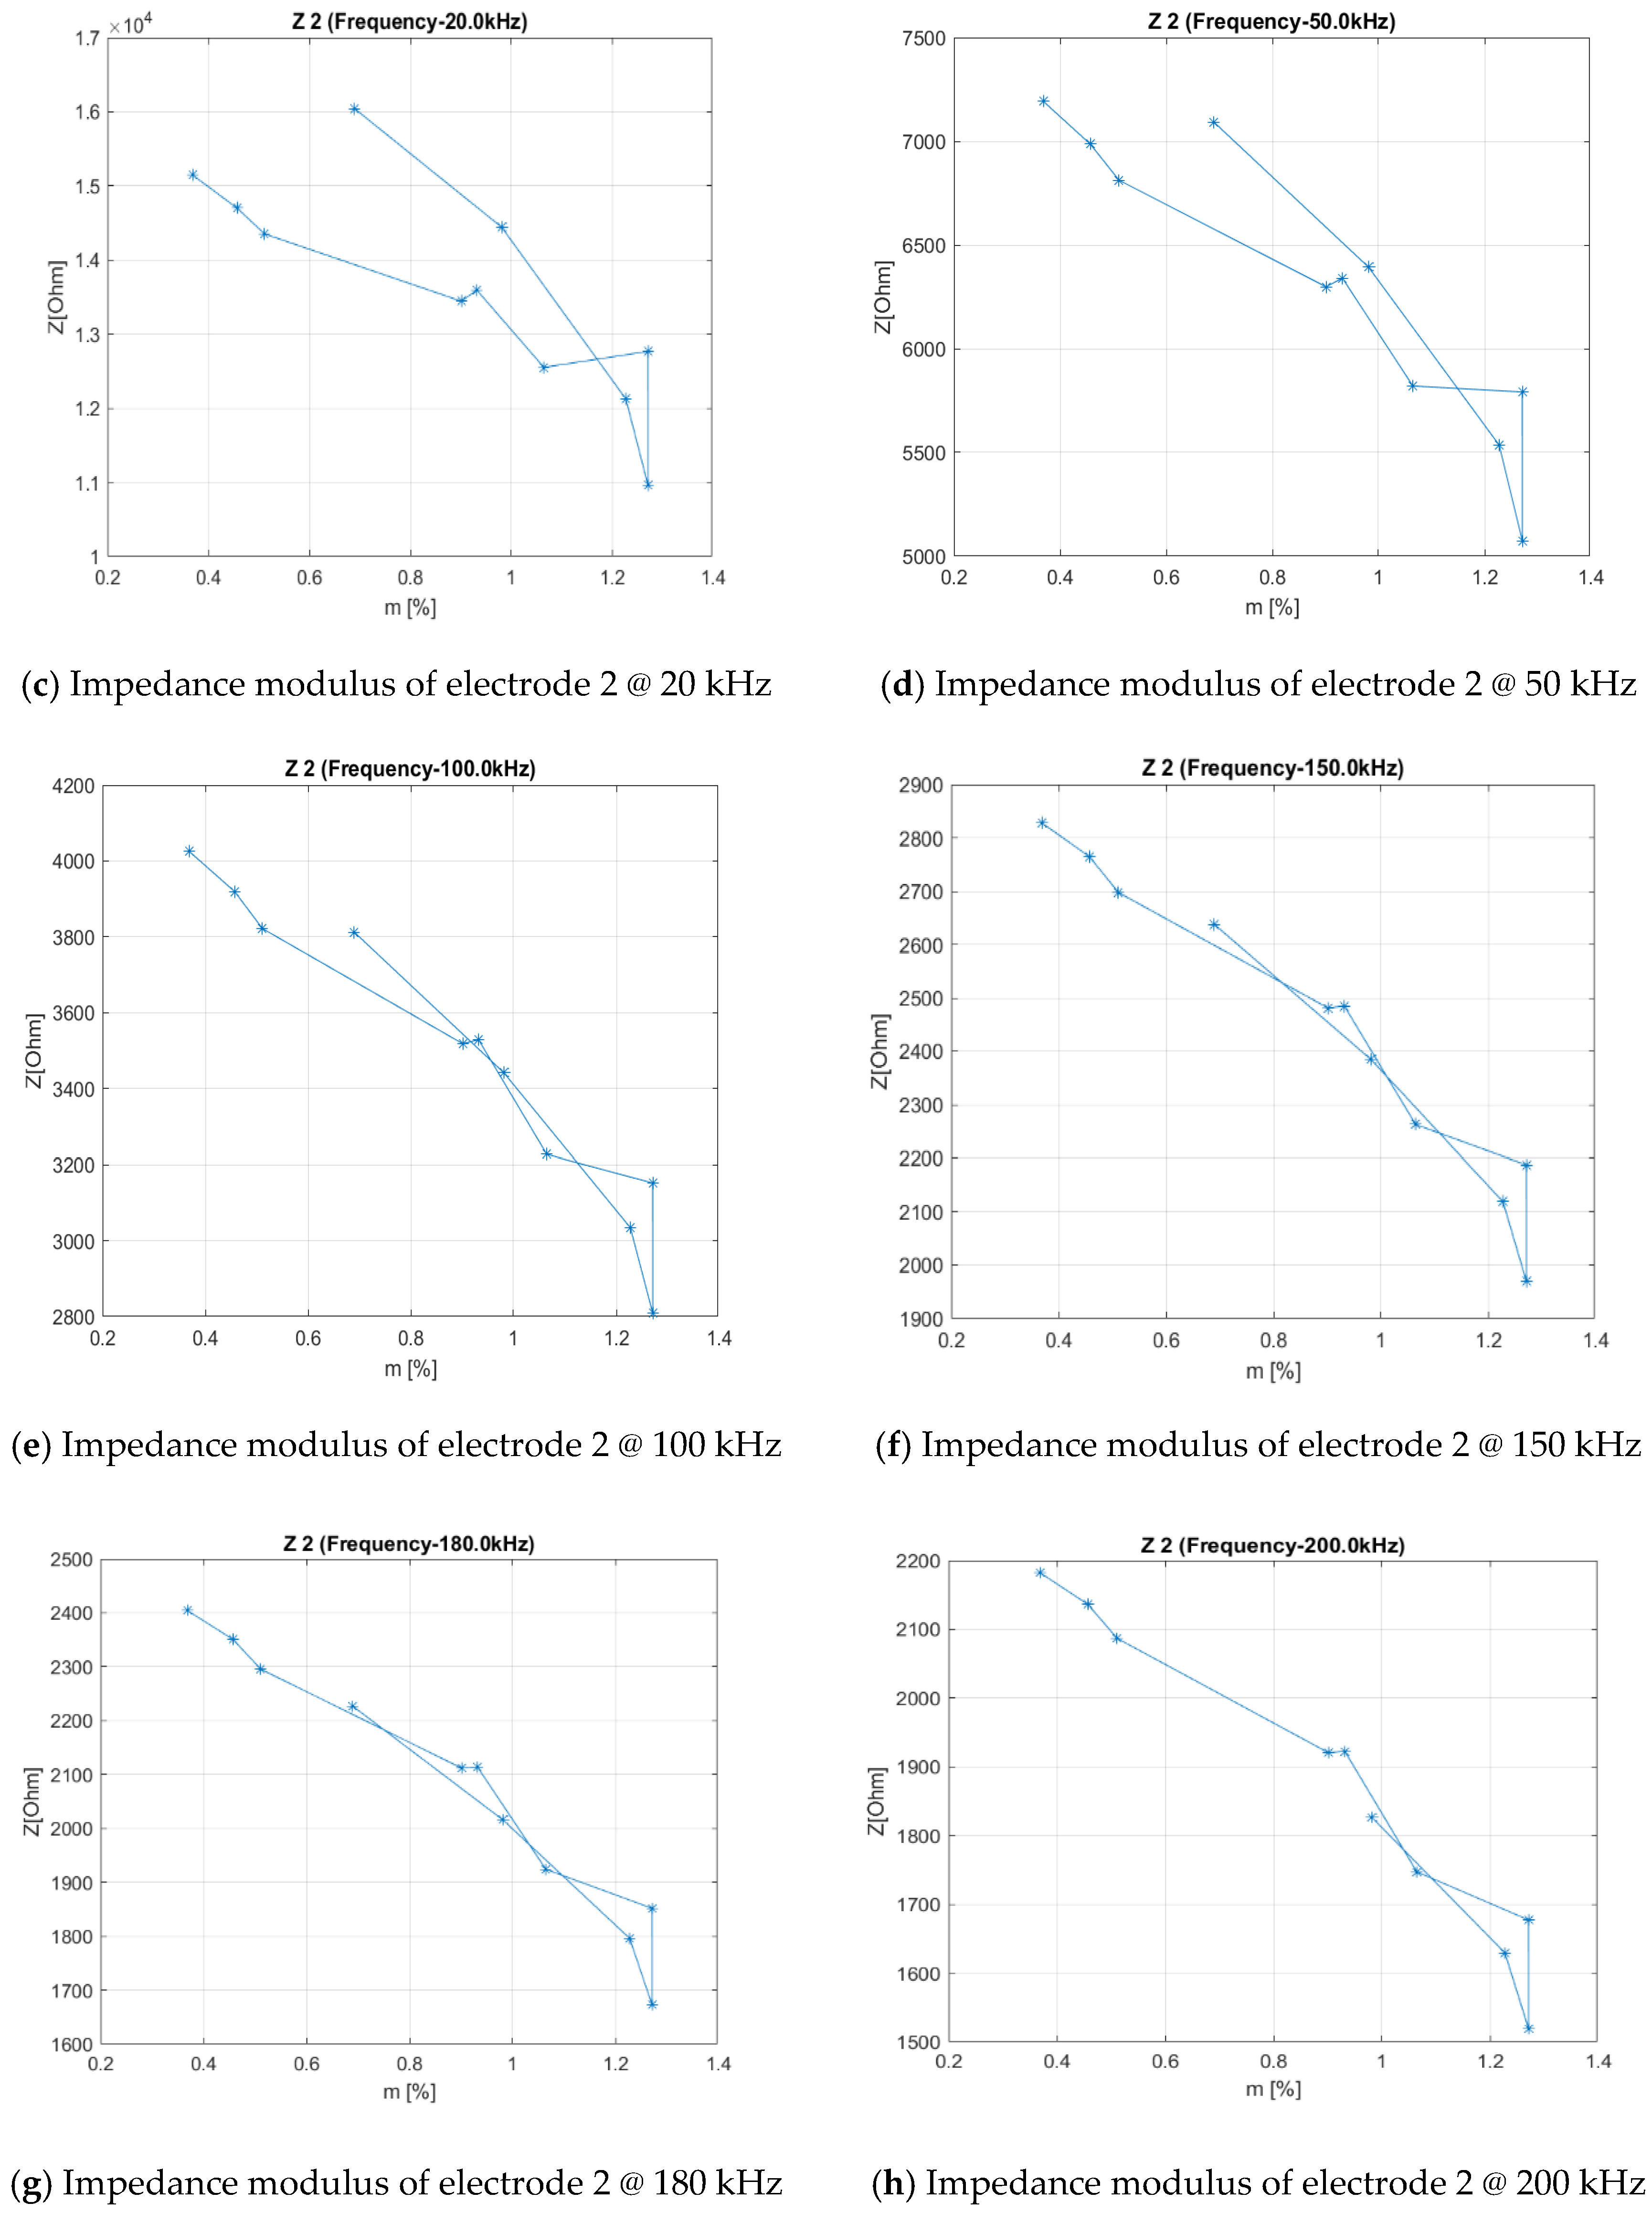
An example of the collected data at the excitation frequency of 100 Hz is shown in Figure 7.
The initial data were reduced and selected with the aim to identifying the electrical parameters that were most linearly correlated to m, more easily measurable, in a practical (easily to obtain) and narrow frequency range, so as to reduce the measurement difficulties.
The procedure is described below.
Data of the above mentioned electric parameters (Z(m), Cp(m), etc.) related to an excitation signal below the frequency of 1 kHz were excluded, as they didn’t show an easily understandable physical interpretation as a function of the hydration status m (not monotonous or regular curves as a function of m).
Then, the graphs of the electric parameters, resulting from the above described selection (data within frequency range 1–200 kHz), were evaluated in terms of dispersion and, even them, in terms of monotonicity: The non-monotonic curves in m and those ones with excessive dispersion of the values were excluded.

3. Results

In Figure 8 and Figure 9 there are some examples of the resulting curves of the first data selection, above described, evaluated at 1, 50 and 180 kHz of the excitation frequencies, for both pairs of electrodes of specimen 1 (1A and 1B) and for the pair of electrodes of specimen 2.

3.1. Interpretation of Results

A first interpretation of results could be given, looking at the capacitance, both of the EEC series and EEC parallel (first and third curve in Figure 8):
As the number of polar molecules of water inside CML increases, so the measured electrical capacity increases, and, being the geometry fixed, this means that the dielectric constant of the material increases as the moisture content increases. (For a plain plates capacitor is: C = εrC0 = εr ε0 A/d, where it is: εr = relative permittivity or dielectric constant, due to the dielectric structure; ε0 = vacuum permittivity; A = area of the capacitor electrode surface; d = electrode distance. By fixing the geometry, A and d are fixed, so, if C goes up, is εr that goes up. It should be noted that the considered EEC also includes the measurement electrodes and the measured permittivity is that of the region between the electrodes.)
This proportionality between C and εr is easily explained by considering that, as the water molecules are polar, an increased number of polar molecules into the epoxy resin implies its increased dielectric performance.
Further, looking at the D parameter curve (the second curve in the same figure), it is seen that: As the concentration of water molecules increases, so the dissipation factor (D parameter) increases.
This could be easily explained by considering that an increased number of polar molecules into the structure induce an increased work made by the variable electric field generated by the electrodes of our measurement system. That work is proportional to the number of polar water molecules present into the electric field generated by the electrodes.
From the curves Figure 8 it should also be noted that, when the water content increases too much (more than 1.1%), a sort of saturation takes place. This causes an irregularity of the measurements, due to the occurrence of other phenomena, probably related to electrical conduction in its various forms (ion conduction, electrolysis, etc.), as the water molecules begin to touch each other. These phenomena were not investigated.

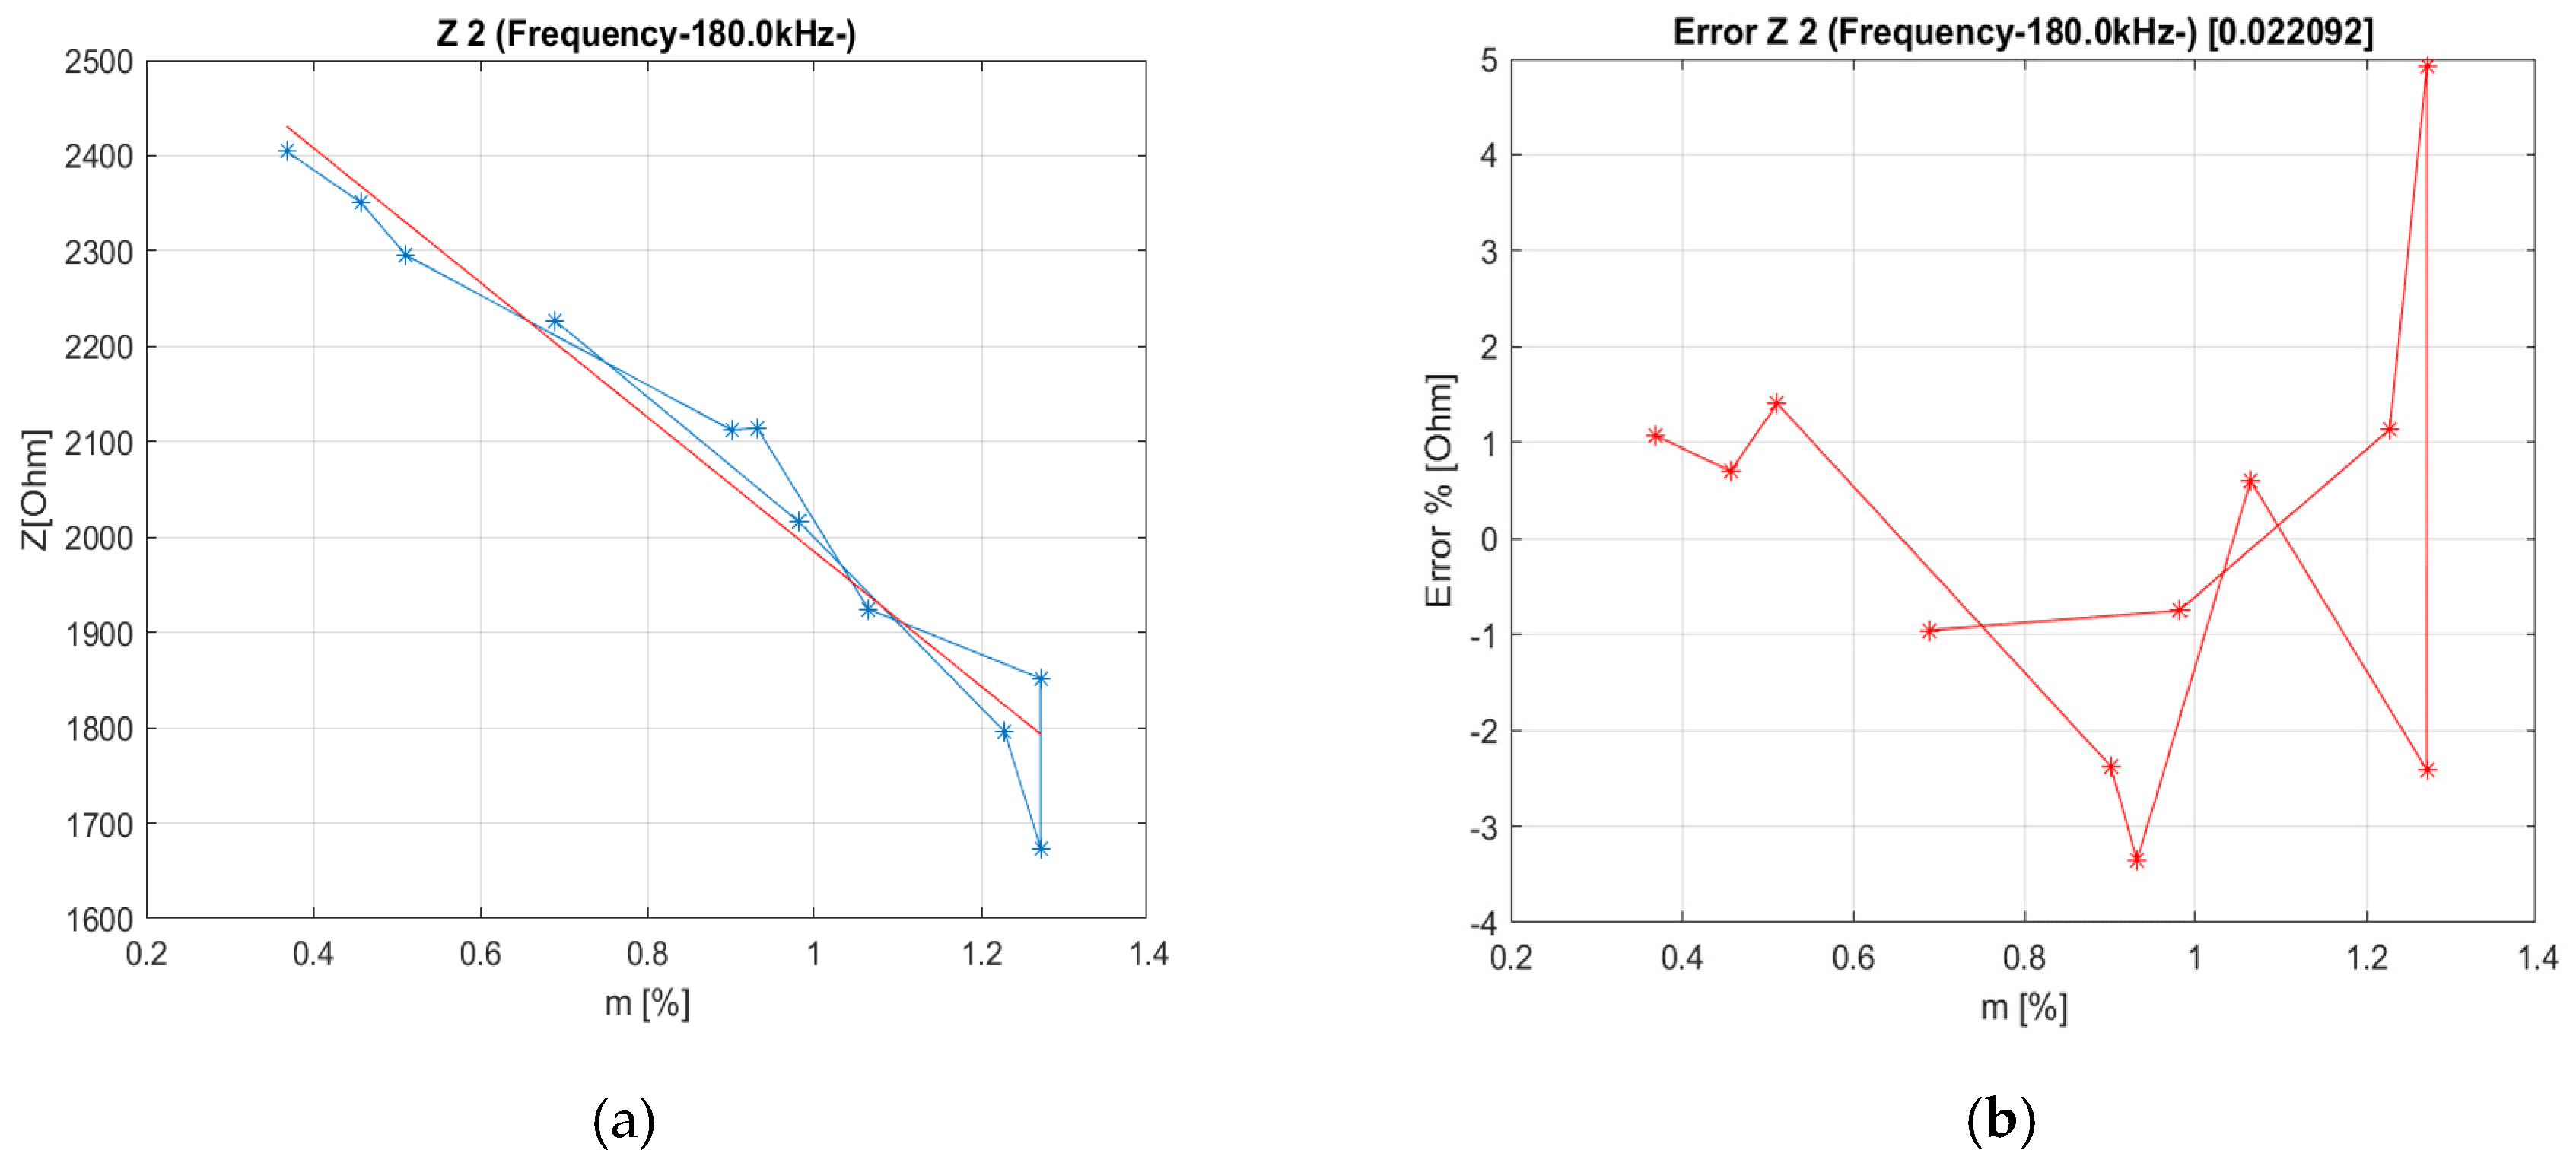
3.2. Further Data Selection and Choice of the Electric Parameter

A further data selection was performed:
  • The observation was reduced to the nearest curves to a linear trend, evaluated in the reduced frequency range 1–200 kHz.
  • Finally, the electric parameter whose curves had a lower data dispersion was chosen as representative of the hydration state of the specimen.
It was the impedance modulus, Z(m).
In Figure 10 are presented the curves of the impedance modulus Z(m), as obtained at various frequencies of the electrical measurement stimulus. It can be seen that the Z(m) measurements that represent more linearly the increase in the concentration of water inside the resin matrix are those with a stimulus frequency between 100 and 200 kHz.
The enlarged 180 kHz curve is shown in Figure 11 (the arrows indicate the temporal sequence of the measurements, carried out during the dry-wet treatment of the specimen).
In Figure 12 a linear regression straight line (red line) of the previous curve is presented (Figure 12a) together with its full-scale percentage error (Figure 12b). From these curves it is possible to notice a certain linearity and a low dispersion of the measurements.

4. Discussion and Conclusions

According to our study, we can state that, in order to detect the moisture uptake level of a CML, the method of measuring the impedance modulus of the capacitive element, made by the CML plus the two electrodes glued onto the CML surface, gives promising results to the development of a Structural Health-Monitoring system (SHM) to be applicable to composite primary structures for real-time detection.
  • The method can apply a wide range of low and medium frequencies from 1 to 200 kHz of electric stimuli. Preliminary setup allows one to identify a narrow range of frequencies stimuli that optimizes the data storage reducing the number of acquisitions to just one value. In fact, the proposed method allows one to adjust, on the base of the material to be monitored, the frequency of the stimulus signal of the measuring set up, in order to induce a rather linear response with respect to the moisture uptake. After that, just a single measurement of the impedance modulus could synthetically describe the status of the structure related to the moisture uptake.
  • The proposed method identifies a law of variation with a monotonous trend of the moisture uptake level of the CML with respect to its impedance modulus, in good agreement with other similar studies [4,5,6,9].
  • Previous studies discouraged the use of dielectric analysis for moisture content evaluations: It is not possible to clearly know the status of the water inside the structure, that could be bound or interstitial [15]. Water can exist in polymers as bound water, characterized by strong molecular interactions with the matrix, and as free water present in capillaries and micro-cavities within the polymer. The values of the dielectric properties of water in these two forms are not well known and in general lie between those of ice and liquid water [16]. So dielectric measurements have limitations and quantitative measurements of water uptake in polymers are not usually performed by dielectric analysis. But, for SHM purpose, this is not so important to have absolute measurements, because it is just needed a differential evaluation with respect to a structure pristine initial status, or intermediate time, after some operative flights. So, by recording the initial measurement, the current health status of the structure is easily derived. Thus, the dielectric analysis by measurements of the impedance modulus of the CML EEC becomes a viable path for SHM.
  • Furthermore, as previous studies assessed [3], it is not affected by the disadvantages found in other more traditional methods, such as the gravimetric method, which, moreover, is not suitable for measurements during the operational life of an aircraft. A dedicated sensor network should be applied to the structure in order to monitor its moisture uptake. Final calibration of the impedance methods will take into account the effects of the electrodes’ presence on external specimen surfaces. Correction factor will be evaluated by using numerical analysis as well.
  • Anyway, the study releases a possible new trend in SHM systems for composite materials in aeronautics.
Indeed, the next step is the integration of the proposed method with an already developed SHM approach for barely visible impact damage (BVID) identification. This study has been already performed by some authors [17,18]. In addition, a direct relationship between the impedance of moisturized specimen and mechanical strength is to be evaluated in order to establish the “residual strength” of the structures during the operation life of aircraft with respect to the current state of the art in level of safety [1].

Supplementary Materials

Database and software used for data treatment are available https://www.mdpi.com/2504-477X/3/3/76/s1.

Author Contributions

Conceptualization, R.S. and L.D.P.; Data curation, R.S.; Formal analysis, R.S. and L.D.P.; Funding acquisition, R.S.; Investigation, R.S.; Methodology, R.S. and L.D.P.; Project administration, L.D.P.; Resources, L.D.P.; Software, M.I. and P.V.; Supervision, R.S. and L.D.P.; Validation, R.S.; Visualization, M.I.; Writing—original draft, R.S.

Funding

Program PON 2007–2013 through the POR—FESR funds managed by Regione Campania, promoter DAC (Distretto Aerospaziale della Campania), project FUSIMCO (Metallic-Composite Hybrid Fuselage), partner CIRA SCpA.

Acknowledgments

Authors would like to thank Rohde & Schwarz Company for providing the instrument used for the electrical measurements.

Conflicts of Interest

The authors declare no conflict of interest.

References

  1. EASA AMC 20–29 Acceptable Means of Compliance for Airworthiness of Products, Parts and Appliances—Composite Aircraft Structure, 26 July 2010. Annex II to ED decision 2010/003/R of 19/07/2010. Available online: https://www.easa.europa.eu/sites/default/files/dfu/Annex%20II%20-%20AMC%2020-29.pdf (accessed on 23 July 2019).
  2. Shen, C.-H.; Springer, G.S. Effects of Moisture and Temperature on the Tensile Strength of Composite Materials. J. Compos. Mater. 1977, 11, 2–16. [Google Scholar] [CrossRef]
  3. Grammatikos, S.A.; Ball, R.J.; Evernden, M.; Jones, R.G. Impedance spectroscopy as a tool for moisture uptake monitoring in construction composites during service. Compos. Part A 2018, 105, 108–117. [Google Scholar] [CrossRef]
  4. Maffezzoli, A.M.; Peterson, L.; Seferis, J.C.; Kenny, J.; Nicolais, L. Dielectric characterization of water sorption in epoxy resin matrices. Polym. Eng. Sci. 1993, 33, 75–81. [Google Scholar] [CrossRef]
  5. Davis, G.D.; Rich, M.J.; Harichandran, R.S.; Drzal, L.T.; Mase, T.; Al-Ostaz, A. Development of an Electrochemical Impedance Sensor to Monitor Delamination and Moisture Uptake in CFRP-Reinforced Concrete Structures. In Proceedings of the 81st TRB 2003 Annual Meeting, Washington, DC, USA, 13–17 January 2002. [Google Scholar]
  6. Fraga, A.N.; Frulloni, E.; de la Osa, O.; Kenny, J.M.; Vàzquez, A. Relationship between water absorption and dielectric behaviour of natural fibre composite materials. Polym. Test. 2006, 25, 181–187. [Google Scholar] [CrossRef]
  7. King, R.J.; Basuel, J.C. Measurement of basis weight and moisture content of composite boards using microwaves. For. Prod. J. 1993, 43, 15–22. [Google Scholar]
  8. Boinard, P.; Banks, W.M.; Pethrick, R.A. Changes in the dielectric relaxations of water in epoxy resin as a function of the extent of water ingress in carbon fibre composites. Polimer 2005, 46, 2218–2229. [Google Scholar] [CrossRef]
  9. Wandowski, T.; Malinowski, P.; Skarbek, L.; Ostachowicz, W. Moisture detection in carbon fiber reinforced polymer composites using electromechanical impedance technique. Proc. Inst. Mech. Eng. Part C J. Mech. Eng. Sci. 2016, 230, 331–336. [Google Scholar] [CrossRef]
  10. Banks, W.M.; Dumolin, F.; Haywardd, D.; Pethrickd, R.A.; Lid, Z.C. Non-destructive examination of composite joint structures: A correlation of water absorption and high-frequency dielectric propagation. J. Phys. D Appl. Phys. 1996, 29, 233. [Google Scholar] [CrossRef]
  11. ASTM D5229/D5229M-14e1—Standard Test Method for Moisture Absorption Properties and Equilibrium Conditioning of Polymer Matrix Composite Materials; ASTM International: West Conshohocken, PA, USA, 2014.
  12. Department of Defense Handbook Composite materials handbook volume 1. Polymer Matrix Composites Guidelines for Characterization of Structural Materials (MIL-HBDK 17); U.S. Department of Defense: Arlington, VA, USA, 2002; ISBN 978-1-59124-509-4.
  13. Overview of Two-Wire and Four-Wire (Kelvin) Resistance Measurements; Keithley (Tektronix) Application Note n.3176; Keithley Instruments: Solon, OH, USA, 2012.
  14. Shen, C.-H.; Springer, G.S. Moisture Absorption and Desorption of Composite Materials. J. Compos. Mater. 1976, 10, 2–20. [Google Scholar] [CrossRef]
  15. Mikols, W.J.; Seferis, J.C.; Apicella, A.; Nicolais, L. Evaluation of structural changes in epoxy systems by moisture sorption-desorption and dynamic mechanical studies. Polym. Compos. 1982, 3, 118–124. [Google Scholar] [CrossRef]
  16. Hasted, J.B. Aqueous Dielectrics; Chapman and Hall: London, UK, 1973. [Google Scholar] [CrossRef]
  17. Di Palma, L.; Sorrentino, A.; Vitiello, P.; Izzo, C. Composite Structural Health Monitoring for MALE UAV Application. In Proceedings of the SAE 2013 AeroTech Congress & Exhibition, Montreal, QC, Canada, 24–26 September 2013. [Google Scholar]
  18. Sorrentino, A.; De Fenza, A. Improved Elliptical Triangulation Method for Damage Detection in Composite Material Structures. J. Mech. Eng. Sci. 2017, 231, 3011–3023. [Google Scholar] [CrossRef]
Figure 1. The conductive layers of the composite material laminate (CML) could be seen as the electrodes (conductive plates) of a capacitor having an epoxy resin dielectric.
Jcs 03 00076 g001
Figure 2. By an electric point of view, a real capacitor (left box) could be accurately modeled as in box A (an equivalent electric circuit (EEC) with a series resistor, a parallel resistor, an inductor and an ideal capacitor), or modeled by a simplified parallel model (parallel EEC in box B) or series model (series EEC in box C). The series resistor Rs and the parallel resistor Rp take into account the dissipative phenomena of the dielectric. In this paper, the simplified models were considered.
Jcs 03 00076 g002
Figure 3. Test set-up (a) and a zoom on Specimen1 (b).
Jcs 03 00076 g003
Figure 4. Electric measurement scheme (just one of the two pairs of facing electrodes is shown in the scheme).
Jcs 03 00076 g004
Figure 5. Specimens 1 and 2: Moisture Absorption data (70° Celsius distilled water liquid immersion conditioning, wet phase, ref. Section 2.4).
Jcs 03 00076 g005
Figure 6. Specimens 1 and 2: Moisture Desorption data (80° Celsius vented oven conditioning, dry phase, ref. Section 2.4).
Jcs 03 00076 g006
Figure 7. From (ag): An example of data before the data reduction: In this example the excitation frequency is 100 Hz, electrode pair 1A. (Theta 1A in (g) is the admittance phase, that is equal to the impedance phase, but with opposite sign).
Jcs 03 00076 g007aJcs 03 00076 g007b
Figure 8. (ag) First step of data reduction: In this example the excitation frequency is 1 kHz, electrode pair 1A.
Jcs 03 00076 g008aJcs 03 00076 g008b
Figure 9. First step of data reduction: In this example it is plotted the impedance modulus Z(m) at the excitation frequencies of 50 kHz (ac) and 180 kHz (df) for, electrodes pair 1A and 1B (specimen 1) and electrodes pair 2 (specimen 2), respectively.
Jcs 03 00076 g009
Figure 10. Impedance modulus Z(m) of specimen 2 at various excitation frequencies, ranging from 5 kHz to 200 kHz (ah).
Jcs 03 00076 g010aJcs 03 00076 g010b
Figure 11. Impedance modulus Z(m), measured at 180 kHz on the peripheral electrodes of specimen 2 (arrows indicate the temporal sequence of measurements: first humidifies, wet phase, then dehumidifies, dry phase).
Jcs 03 00076 g011
Figure 12. Linear regression straight line (red line) of impedance modulus Z(m), (a), and its full-scale linearity error, (b).
Jcs 03 00076 g012
Table 1. Specimens characteristics.
CML Cutting #Dimensions (mm)Mass * (g)Fiber Volume Ratio
CML 1150 × 101 × 2.555.145665%
CML 2149 × 100 × 2.552.878565%
Electrode pair #Dimensions of Each Electrode (mm)Mass * of the Pair of Electrodes (g)
1A30 × 30 × 111.1646
1B30 × 30 × 111.1621
230 × 30 × 111.1598
Specimen (CML + Electrodes + wires + glue) **,#Mass,M0*,§§ (g)
Specimen 182.3637
Specimen 268.2620
* Sartorius BP 211D analytical balance (+/−0.1 mg accuracy). ** Layup sequence: wire/EPL1/glue/CML/glue/EPL2/wire. § Measured at 25 °C, before moisture absorption procedure ASTM D5229. §§ Measured at fully dry condition (ref. Section 2.3).

