Article

Non-Destructive Characterization of Mechanically Processed Waste Printed Circuit Boards: X-ray Fluorescence Spectroscopy and Prompt Gamma Activation Analysis

by
Akira Otsuki
1,2,*,
Pedro Pereira Gonçalves
1,
Christian Stieghorst
3 and
Zsolt Révay
3
1
Ecole Nationale Supérieure de Géologie, GeoRessources UMR 7359 CNRS, University of Lorraine, 2 Rue du Doyen Marcel Roubault, BP 10162, 54505 Vandoeuvre-lès-Nancy, France
2
Waste Science & Technology, Luleå University of Technology, SE 971 87 Luleå, Sweden
3
Heinz Maier-Leibnitz Zentrum (MLZ), Technische Universität München, Lichtenbergstr. 1, D-85747 Garching, Germany
*
Author to whom correspondence should be addressed.
J. Compos. Sci. 2019, 3(2), 54; https://doi.org/10.3390/jcs3020054
Submission received: 24 April 2019 / Revised: 22 May 2019 / Accepted: 27 May 2019 / Published: 1 June 2019

Abstract

:
This work aimed to characterize the deportment/concentration and liberation/association of the metals and light elements within mechanically processed waste printed circuit boards (PCBs) that hold the complex and heterogeneous structure and distribution of different material components. Waste PCBs passed through a series of mechanical processing (i.e., comminution and sieving) for metal recovery and were then characterized without further destroying the particles in order to capture their heterogeneity. The characterizations were performed in a laboratory and large-scale neutron facility. The results obtained with a portable X-ray fluorescence spectroscopy and prompt gamma activation analysis were compared and confirmed the good agreement and complementarities in general. The advantages and disadvantages of the two different methods were identified and discussed in this paper, in relation to their application to the analysis of mechanically processed PCB particles.

1. Introduction

Waste electrical and electronic equipment (WEEE) is one of the fast growing waste categories in the European Union, with the growth rate of 3%–5% per year [1]. It is about three times higher than the rate of municipal waste. This is the result of massive production of the EEE and its market expansion based on the technological progress. Thus, there is a huge need and potential for recovering valuable materials from WEEEs. However, their complex structures (e.g., mixture of a number of different metals, plastic polymers, glass and ceramics in different sizes) and their variation with time [2] lead to the technical and environmental difficulties for their effective pre-concentration stages to improve their material recycling [3]. One of the major limitations is the lack of proper characterization methods to quantitatively evaluate the distribution and liberation/association of different components that vary and be spatially different/heterogeneous, without destroying the particle status at each beneficiation step [3]. In this paper, we propose one solution to address this characterization issue using the large-scale facility with neutron sources, in comparison and complement with conventional laboratory equipment.
In the past, we developed a flowsheet to selectively enrich valuable metals from printed circuit boards (PCBs) (e.g., [4]). Thus, the flowsheet development is out of the scope of this article. On the other hand, in this article we focused on discussing our application of different non-destructive characterization methods (lab base, large scale facility base) to study and understand the liberation/association and metal/non-metal deportment in the selective milling as a part of the beneficiation steps in order to enhance the metal recovery for their recycling purpose.
In general, there are two major categories to analyze the metal concentration in a sample. They are destructive and non-destructive methods (e.g., [5]). Destructive methods are usually based on the preliminary sample dissolution into acid and the further measurement of the elemental composition by using chemical methods (e.g., atomic absorption spectroscopy, inductively coupled plasma atomic emission spectrometry). Average values of the different metals, referred to a specific sample, is thus obtained. Non-destructive methods can be directly applied without performing any acid digestion, among them; commonly utilized methods are X-Ray Fluorescence (XRF), X-Ray Diffraction (XRD) with the Rietveld analysis and Scanning Electron Microscopy (SEM). With all the stated methods, information about elemental concentration or composition inside the particles can be collected.
In this study, the elemental analysis of PCB particles by a portable X-ray fluorescent (XRF) spectroscopy in comparison with prompt gamma ray neutron activation analysis (PGAA) were performed and compared. To the authors’ best knowledge, this study is the first work which applied PGAA to PCB particle characterization. The results were discussed in relation to metal deportment/concentration and liberation/association of the PCB particles before and after mechanical processing in terms of both metallic elements and light elements (e.g., H, C, B) composing plastics utilizing a unique feature of PGAA. The advantages and disadvantages of the above two methods were identified and discussed in the paper, in relation to their application to mechanically processed PCB fine particles.

2. Materials and Methods

2.1. Materials

Printed circuit boards (origin confidential) were comminuted through shredding and hammer milling followed by sieving. In this study, two hammer mills, HM1 (Raymond Hammer Mill—equipped with a 20 cm diameter sieve having 5 mm diameter openings) and HM2 (AR6539 Hammer Mill—equipped with a 10 cm diameter sieve having 1.5 mm diameter openings), were used as an open circuit operation for milling the already shredded PCB particles (product below 10 mm). The second hammer milling step with HM2 involved a finer comminution of the products coming from the first hammer mill (HM1). The mill products were then subjected to particle size distribution analysis with sieves for the following size fractions: 2–4 mm, 1–2 mm, 0.5–1 mm, 0.35–0.5 mm, 0.125–0.35 mm, 0.074–0.125 mm, and −0.074 mm. Such size distribution was selected based on our preliminary study, which identified a proper flowsheet to selectively enrich metal contents [4]. Furthermore, it was suggested by some researchers that the degree of liberation around 95% can be achieved for the major metals when milling the PCB substrate below 2 mm (e.g., [6]). The sieved particles were analyzed using a portable XRF and the PGAA in order to evaluate the elemental composition by size fraction of the PCBs processed mechanically (i.e., comminution and sieving).

2.2. Elemental Analysis

2.2.1. XRF

A portable XRF was used to perform elemental analysis of milled and sieved products generated under different conditions. The portable XRF machine (Niton XL3t GOLDD+, Thermo Scientific, Waltham, MA, USA) locked on a stationary stand and was remotely operated through a connected PC. The Mining Cu/Zu testing mode equipped with the full fundamental parameter algorithm was used. This operation mode is intended primarily for detection of metal concentrations in light matrices (e.g., quartz [7], one of the major gangue minerals composing natural ores). The concentrations of the following metals can be detected: Mg, Al, Si, P, S, Cl, As, K, Ca, Ti, V, Cr, Mn, Fe, Co, Ni, Cu, Zn, W, Pb, Bi, Zr, Nb, Mo, Sn, Ba, Sb, Cd, Pd, Sr, Rb, Se, and Ag and Au [8].
Particles were fed into a plastic container with X-ray thin film (TF-160-255, MYLAR, Port St. Lucie, Fl, USA) window facing the X-ray beam and were measured during 120 s/point to have the elemental composition. A minimum of five different points for each processed sample and 20 different points for the uncrushed PCB were measured and their average and 95% confidence interval were calculated and reported in this paper.

2.2.2. PGAA

PGAA experiments were performed at the PGAA facility at Heinz Maier-Leibnitz Zentrum, using a cold neutron with the average energy of 1.83 meV (6.7 Å) [9]. Approximately 1 g of each sample was packaged into a thin Teflon film and it was fixed in an Al frame with polytetrafluoroethylene (PTFE) strings. The sample was then placed in the beam and the experimental program was properly assigned for the series of measurements. The measurement time (livetime) was in the range between 126 and 194 min. A software was used to run automated measurements of up to 16 samples in a batch run. The evaluation of the spectra was performed using the software Hypermet developed in Budapest [10]. Determination of the elemental comparison of samples was achieved using the Excel sheet package ProSpeRo [11].

3. Results and Discussion

3.1. Correlations and Complementarities between the Analyses Using the Portable XRF and PGAA

3.1.1. Correlation between XRF and PGAA

First, the correlations between the measurements acquired from the two methods described in the Materials and Methods section were investigated. For both XRF and PGAA, the output data consisted of a chemical composition sheet listing all the elements identified from each sample analysis. It is important to highlight that discrepancies were observed regarding the type and/or concentration of elements in the samples detected by the two different methods. Such discrepancies were anticipated beforehand, including one of our major interests upon working with the PGAA to characterize the light elements within a complex assemblage of PCB particles, e.g., Hydrogen, Carbon, Boron, and Nitrogen that cannot be detected by XRF. On the other hand, the PGAA measurements and data treatment did not detect some elements such as Au, detected by XRF and also previously reported by other researchers [12,13]. It can be due to the difference in the natures of XRF and PGAA. This point will be further discussed in the following sections. The XRF is more surface sensitive while the PGAA is good at the bulk analysis due to the high transparency of neutron beam. The chemical analysis data for the major elements of interest (i.e., Cu, Fe, Al, Zn, Si) is shown in Table 1. The values exhibited for each size fraction analyzed with the XRF comprehends a calculated mean from several readings in each subset. On the other hand, for the PGAA, only one measurement was performed for each size fraction. The 95% confidence interval for the XRF measurements and the absolute uncertainties for the PGAA measurements were also calculated and are given in Table 1.
The data acquired by the PGAA was partially consistent with what is usually reported in the literature, for example, showing the decrease in the Cu content with decreasing of particle size [14] while the XRF analysis did not agree. In addition, there are noticeable concentration differences between the Cu% identified by XRF and PGAA. In other words, PGAA gives higher Cu% (maximum 48 wt.%) than XRF (maximum 11 wt.%). It can be associated with that fact that PGAA is good at bulk analysis to capture the wider area of a heterogeneous sample while XRF tends to give surface sensitive results. A similar trend in terms of concentration difference between two different methods was also identified with other elements. For example, the maximum value of Al recorded by PGAA was 14 wt.% while 7 wt.% by XRF, both in 2–4 mm of HM1 products. For the Fe content, both XRF and PGAA showed a similar trend, i.e., significant increase in the two finest size fractions analyzed (i.e., 0.074–0.125 mm, –0.074 mm) although the concentration identified by the two methods had slight deviation. The Fe concentration was 5 wt.% by PGAA, while 3 wt.% by XRF both in −0.074 mm of HM1 products. The Si concentration was 25 wt.% by PGAA, while 10 wt.% by XRF both in −0.074 mm of HM1 products.
Comparing with the uncrushed PCBs, there is an overall enrichment trend to specific size fractions (either coarser, or finer) after the comminution/milling of the PCBs, with an exception of the Cu identified by XRF, which is at least three times richer in the intact PCBs. On the other hand, the PGAA results showed a certain degree of Cu enrichment (e.g., 48 wt.% in 1–2 mm from 35 wt.% in uncrushed PCB although the comparison of the absolute values identified by PGAA and XRF requires a caution that was discussed above and will be further discussed in Figure 1). Generally speaking, the elemental distribution within the uncrushed PCB is quite heterogeneous, thus, studying a series of different spots is required to have statistically representative results and capture the clear idea of their compositions. In the case of the uncrushed PCB, 20 spots were therefore analyzed, and the average values and 95% confidence interval were reported.
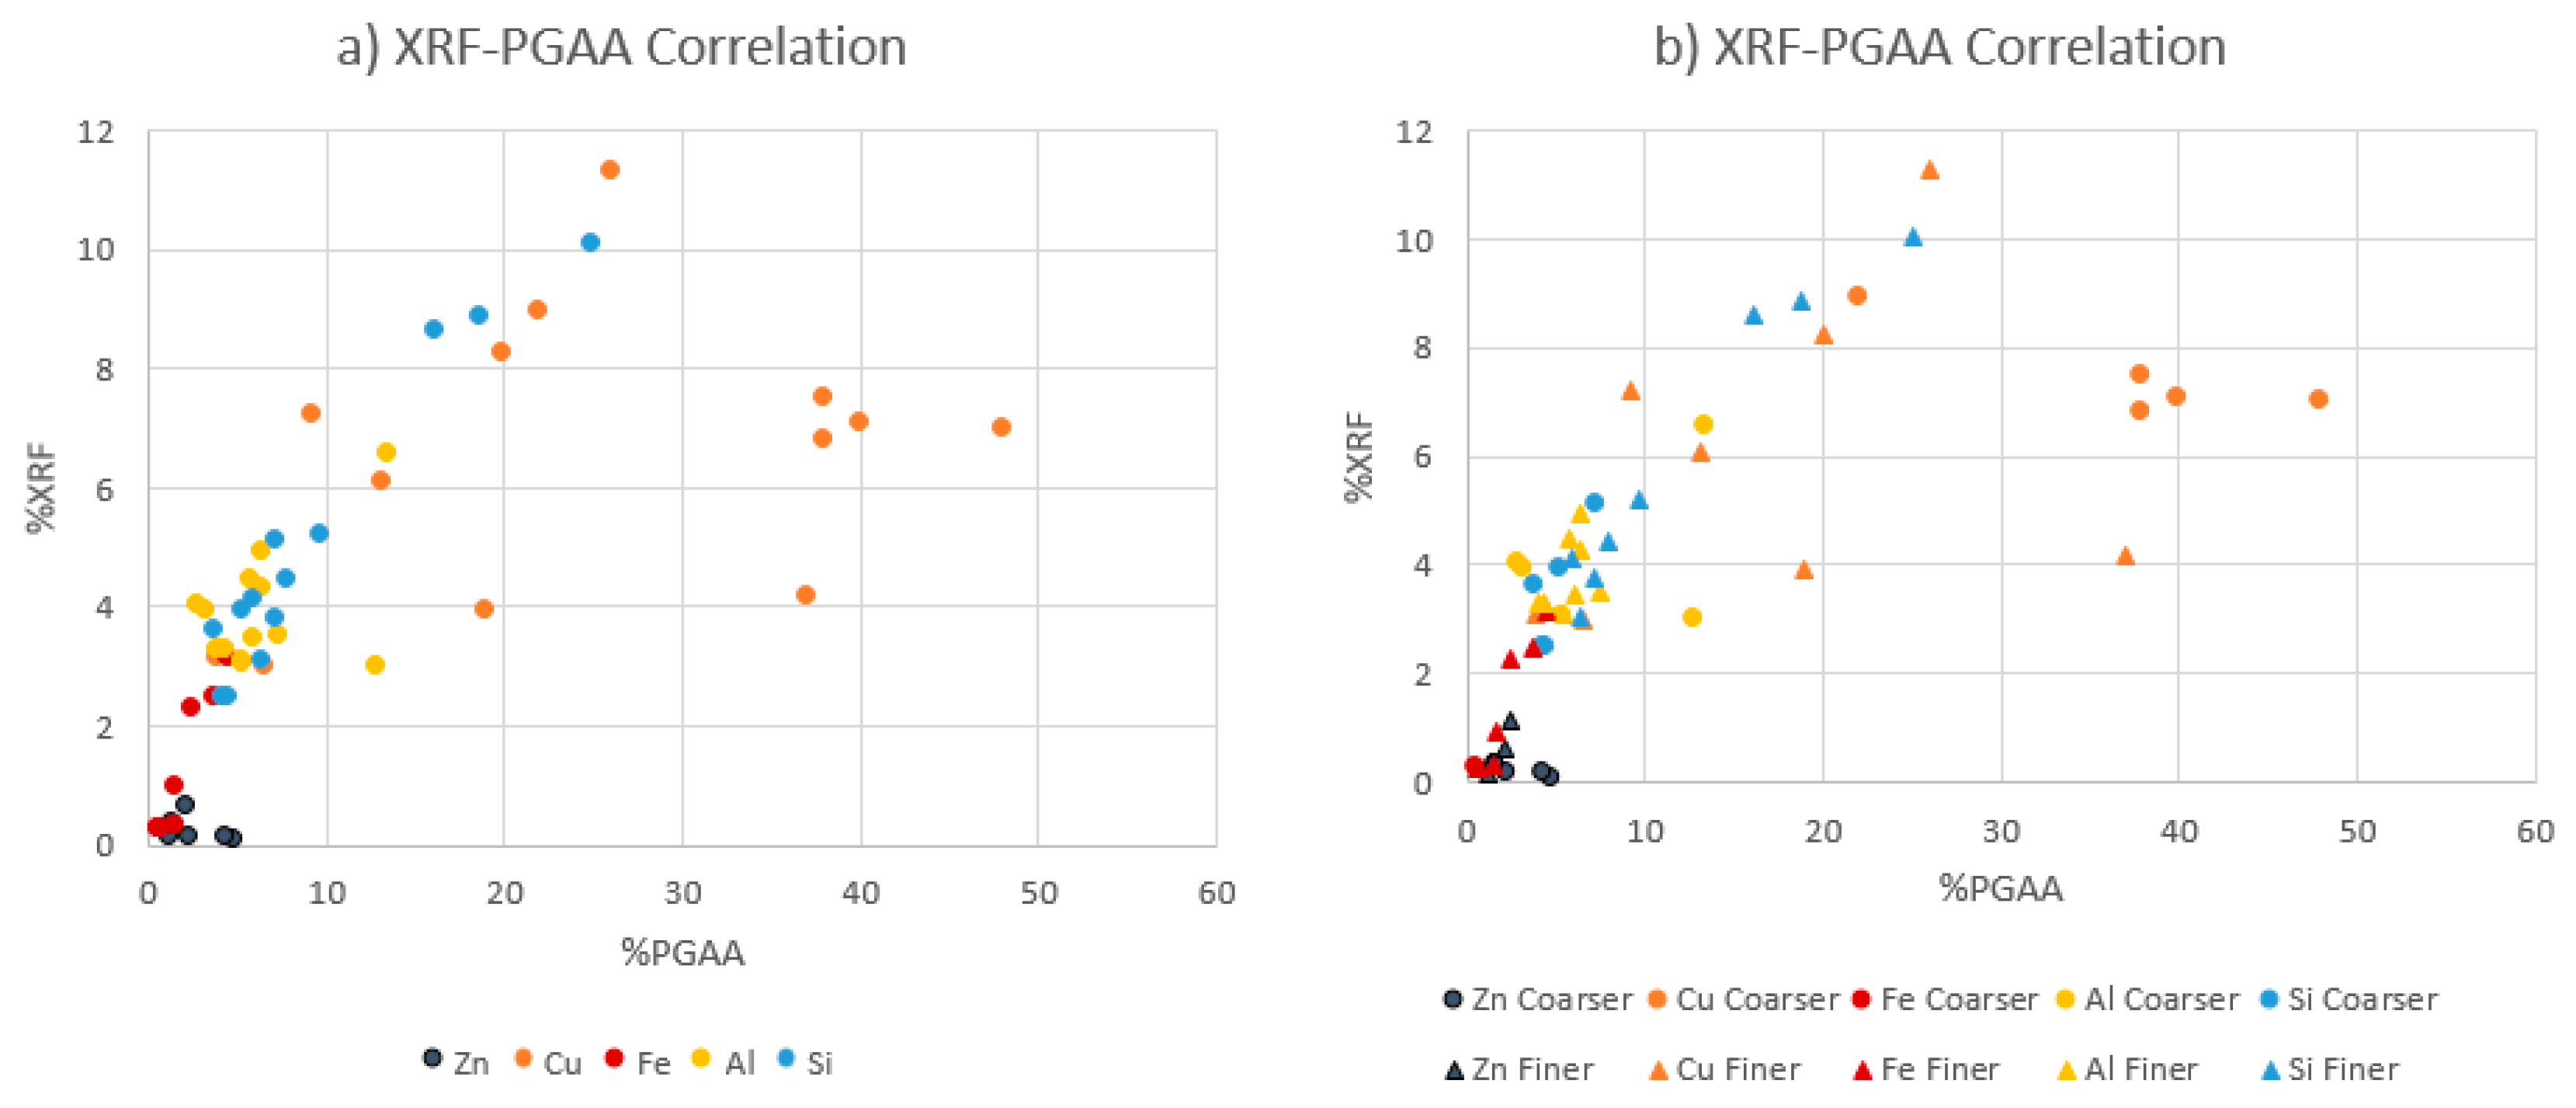
Figure 1 shows the concentration of the major metals Cu, Fe, Al, Zn, and Si in order to compare XRF results and PGAA results for the whole dataset. The results obtained from the products of the Hammer Mills 1 and 2 were plotted (Figure 1a) while the other plots classifying the whole dataset into coarse (0.5–4 mm) and fine fractions (−0.5 mm) are given in Figure 1b.
Figure 1 indicates a positive correlation between XRF and PGAA measurements in general; however, the Cu in the coarse fraction is slightly off the overall trend (Figure 1b). This deviation can be explained by the heterogeneous distribution of Cu coarse particles as well as the nature of the two different methods (i.e., PGAA = bulk analysis; portable XRF = surface sensitive analysis). In order to capture the characteristics of bulk heterogeneous material, PGAA appears to be superior to the portable XRF.

Elements of Toxicological Relevance

For some inorganic and organic substances used in the WEEE assemblages, there are several specific legislations, defined by an EU directive called the Restriction of hazardous substances (RoHS) [15]. It defines the threshold concentration of hazardous elements such as Pb, Cd, Hg, and Br (as PBB, PBDE). These elements are often used as part of flame retardants, stabilizers, pigments, and several other property modifier applications [16].
In this study, the results obtained by the PGAA and XRF were used and compared (Table 2) for the evaluation of such hazardous elements and thus their implications on the further treatment of the material to be recycled or segregated. The elemental concentration in each size fraction and method was compared to the concentrations defined by RoHS and noted as variation. The Br was only detected by the PGAA, thus configuring a complementarity to the testing mode selected for the XRF technique. Besides elements regulated by RoHS, Sb was only identified by the XRF analysis (0.17 wt.% in the coarse fraction; 0.15 wt.% in the fine fraction) while it was not identified by the PGAA.
Due to the lack of data for several elements, it is difficult to draw a clear relationship between the results obtained from the XRF and PGAA. Although, it is possible to infer an overall enrichment trend of the hazardous elements into the finer fractions of the material, identified by the both XRF and PGAA. The only element detected by both methods was Cd; however, the results obtained by the two methods indicates an overestimation of Cd by XRF, which agreed with the literature [16]. While the Cd concentrations were below the threshold limits defined by the RoHS directives, the concentrations of Pb and Br were higher than the threshold (Table 2). For further and detailed studies on those hazardous elements, mainly more sample analyses are recommended to perform an adequate comparison between the two methods when it comes to characterization of such hazardous elements.

3.1.2. Complementarities between XRF and PGAA

Despite the fact that most values of recycling PCBs can be due to the metal recovery, the non-metal fractions also take up a large proportion of WEEEs. For example, plastics account for roughly 10%–30% of WEEE composition [17]. Several studies were conducted targeting the recovery of polymers from WEEE, and the reutilization of such carbon-rich resources in applications from carbon nanotubes to supercapacitors [18,19,20].
For the plastics associated with long-term and complex appliances such as PCBs, efficient recycling can be invariably problematic, mostly due to the lack of proper identification of plastics [17], in terms of selective separation/recovery as well as economic challenges. On the other hand, there is currently no suitable standard methods for the determination of plastic polymers with the non-destructive XRF method [16].
Several studies focused on rapid identifications of the different plastics within a complex polymers assemblage, e.g., PCBs. From the literature [21], the main plastics possibly identifiable within the PCBs and their known chemical formula for the pure polymer are given in Table 3. The theoretical C/H mass ratio is also calculated and given, based on the number C and H in each compound and their molar masses.
As previously mentioned, in this paper, one of the key propositions in applying the PGAA as a characterization method for the WEEEs is to analyze light elements present in their assemblages. In that way, the PGAA can be a complementary method to the XRF analysis, which is not adequate for identifying the presence of elements lighter than Na/Mg in the periodic table of the elements; hence, not effective for identification of plastic composition. Table 4 shows the ratios between some of the major metallic elements and the light elements (both in wt.%) identified by the PGAA, in order to investigate the correlation between the metals and plastics. The results are given by size fraction and for the different hammer mills used in the experiment.
The interpretation of the metal/light element ratios from Table 4 is related to the selective enrichment of the metals from plastics for each size fraction, since most of the light elements are intrinsically related to the plastics, such as C and H, the major components of the polymer matrices. The higher/lower ratios between metal/light element than the unity (metal%/C% = 1) are evidence of liberated/free metal (or plastic) in that specific fraction (e.g., Cu/C = 2.1 in 1–2 mm product of the HM1; Cu/C = 0.1 in −0.074 mm product of the HM1). On the other hand, the unity ratio implies the similar mass of a metal present (i.e., composite of metal and plastic) in that size fraction in comparison with the mass of plastics (e.g., Cu/C = 1.0 in 0.5–1 mm product of the HM2).
The above-mentioned relationship is especially clear for Cu. The ratios between Cu and the light elements H, B, and C, are higher in the fractions 1–2 and 0.5–1 mm for the Hammer Mill 1 products and 0.35–2 mm for the Hammer Mill 2 products. Such Cu enrichment for these fractions is well correlated with the PGAA elemental composition analyses given in Table 1, where the composition of Cu by weight in the aforementioned fractions (38–48 wt.% in HM1 products; 37–40 wt.% in HM2 products) is higher than the other size fractions (4–26 wt.% in HM1 products; 9–20 wt.% in HM2 products).
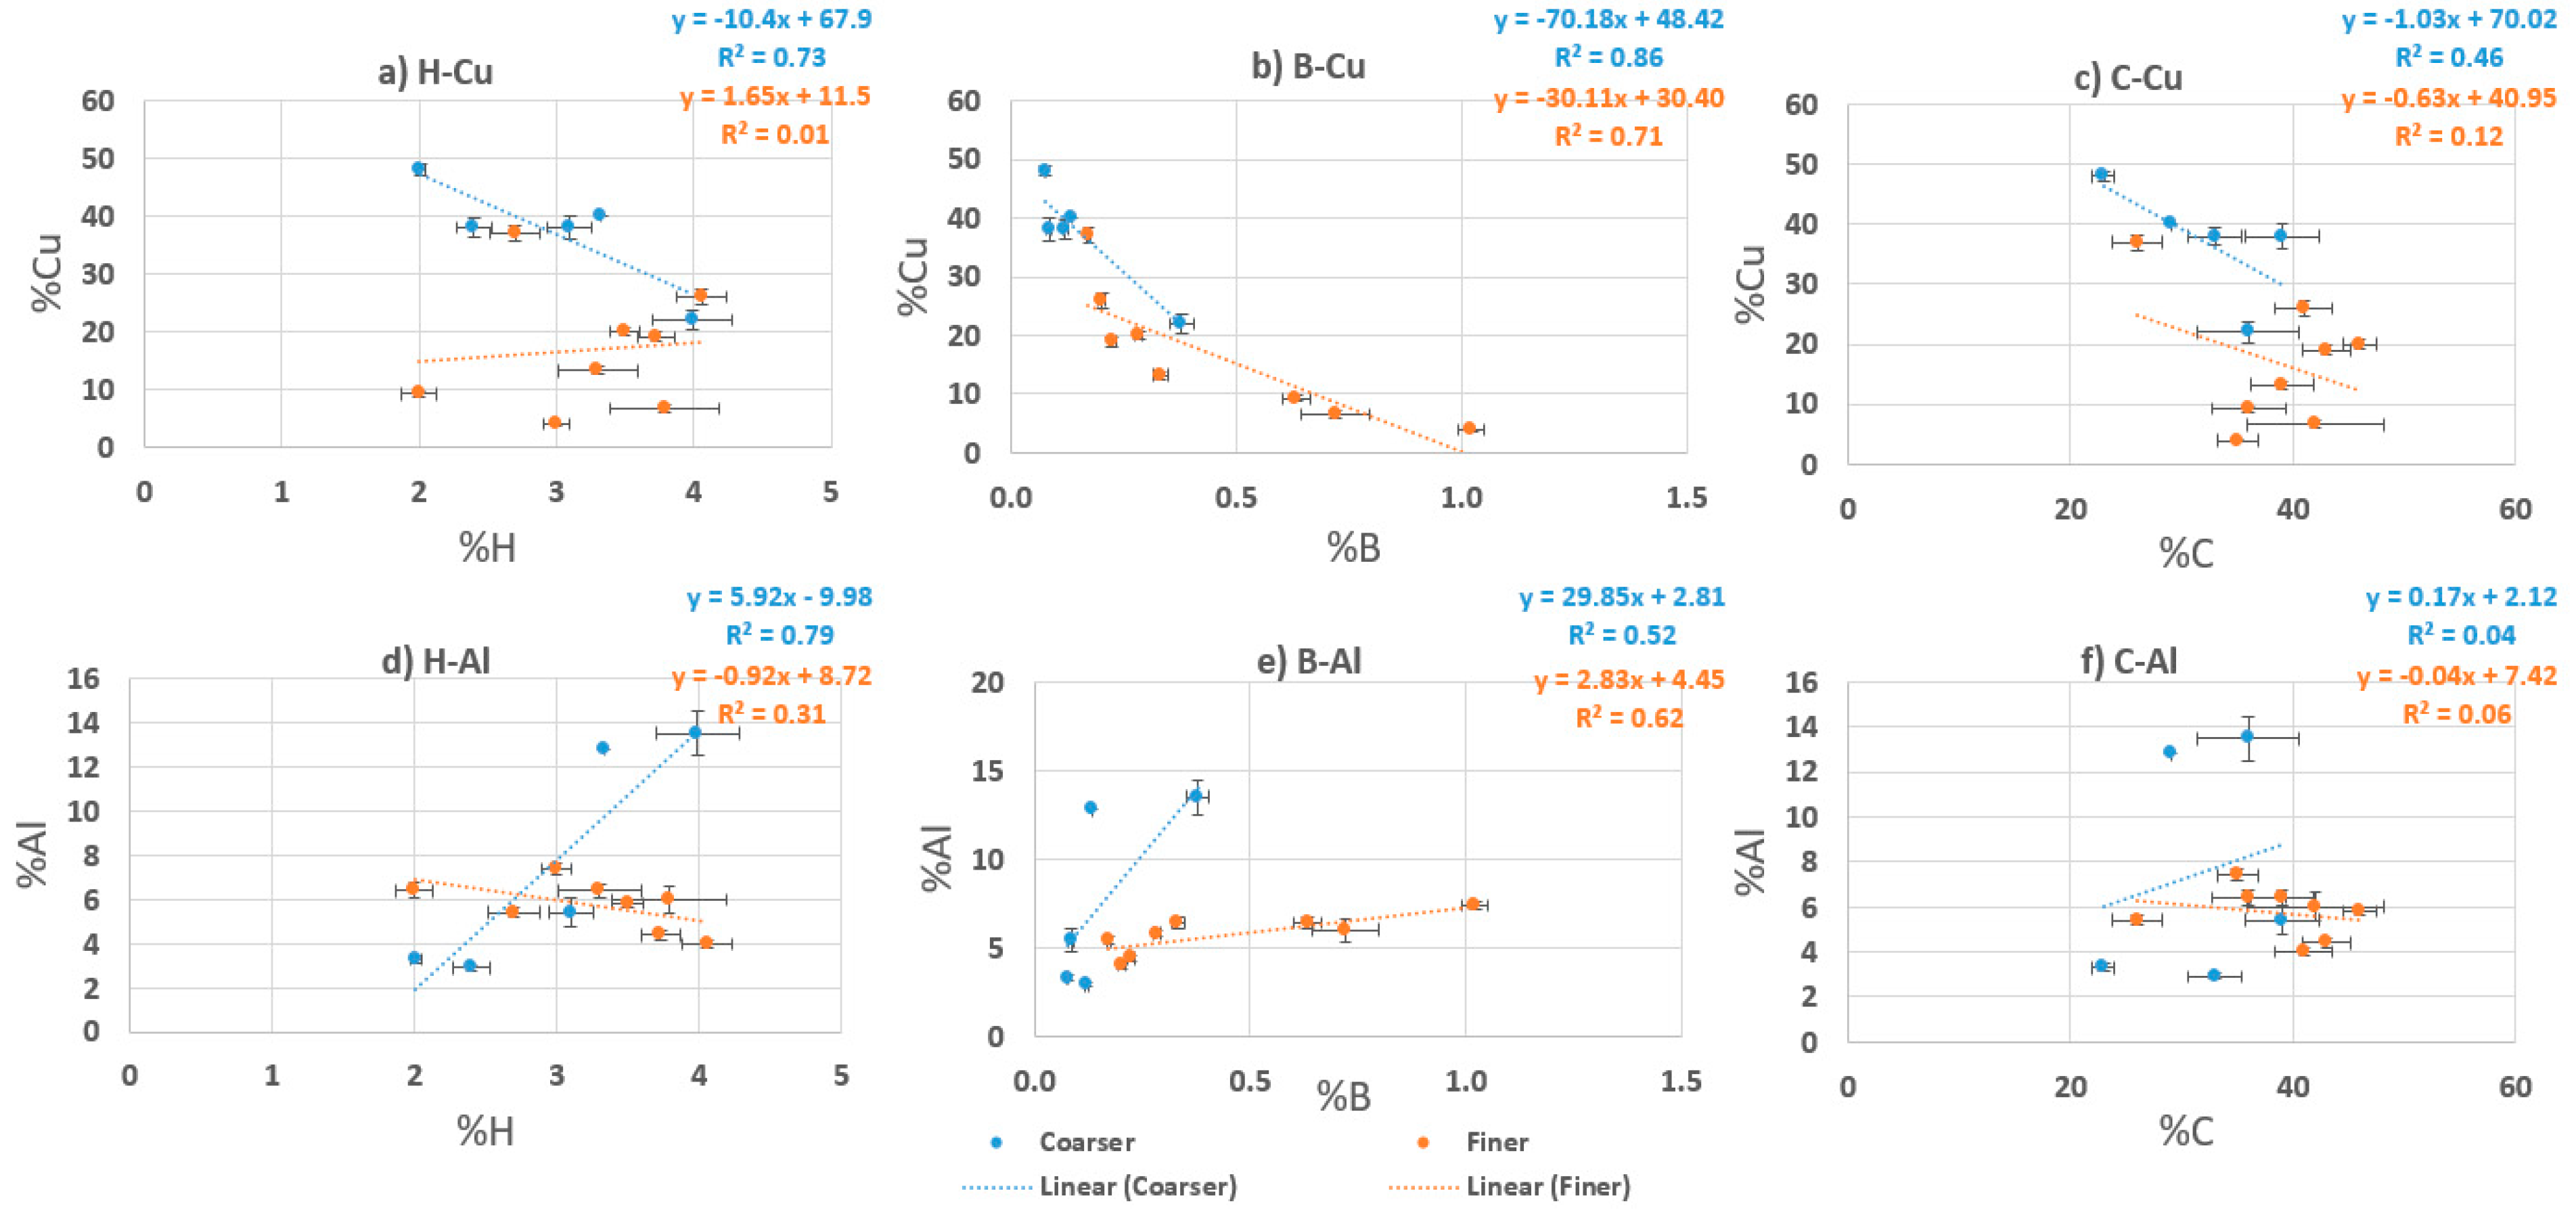
Figure 2 shows the individual correlation for the target metal elements Cu and Al, against the light elements (i.e., H, B, and C). The linear regression analyses were performed for each element in order to evaluate the relationship between metal and light elements. These analyses are feasible due to the feature of the PGAA, capable of identifying the light elements.
Table 5 shows the correlation coefficients and the slopes as results of the linear regression analyses performed to the two data sets; coarse (0.5–4 mm) and fine (−0.5 mm) fractions separately.
The Cu has a strong negative correlation with B in both coarse and fine fractions and with H in the coarse fraction, indicating the selective deportment/concentration tendency between Cu and B (or H). In other words, Cu can be concentrated and liberated from B (and H in the coarse size). A possible source of boron within the PCBs is related with a boron nitride thermal material used as a filler in the epoxy resins [26]. The Al is also related with H in the coarse fraction and less correlated with B, falling into the moderate strength of correlation category. On the other hand, the Al has the least correlation with C, showing no selective deportment/concentration tendency between them. In terms of better understanding and evaluating the selective enrichment of metals from plastics or other components (e.g., a filler of epoxy resin), this is a promising result showing the applicability of PGAA to analyze the PCB particles processed through hammer milling in terms of evaluating selective metal (or plastic) enrichment into specific size fraction(s).
Based on the results discussed in Table 4 and Figure 2, a procedure to predict the plastics present within the comminuted samples and their liberation/association with metals (i.e., Cu, Al) was tested. From the stoichiometric C/H mass ratios for the pure polymers given in Table 3 and our PGAA results, the potential plastics present in the analyzed samples are inferred. Small discrepancies from the theoretical C/H values of the pure polymers can be anticipated, due to the presence of additives (e.g., Br as a flame retardant) in these plastics in minor quantities. The C/H absolute uncertainty was calculated based on the sum of the individual relative uncertainties of C and H, following a calculation procedure given in [27].
Comparing the experimentally determined C/H mass ratios in Table 4 with the stoichiometric C/H mass ratios of potential plastics presented in Table 3, the most incoherent calculated C/H mass ratio is the one in the finest fraction from the HM2 analysis (−0.074 mm). The C/H value of 18 does not correspond to any C/H ratios from plastics typically used in the PCB assemblages (the maximum C/H = 16 with PF, Table 3) as well as quite discrepant from the 2nd highest C/H (i.e., 14) among all the experimentally determined values. This might be either an indication of other carbon sources than plastic, or the presence of carbon fiber reinforced glass, which is corroborated by the high deportment of silica to the finest fraction (−0.074 mm) both for HM1 and HM2 analyses (Table 1).
It is known that polymers with greater differences in their C/H mass ratios—in other words, more distant stoichiometric compositions—can be more reliably identified as different plastics with a spectroscopic method [28]. That means in the case of plastics potentially available in PCBs (Table 3) it is easier to identify the presence/distribution of PVC (C/H = 8) and PF (C/H = 16) in a sample, than distinguish the smaller C/H ratio differences between ABS (C/H = 12) and Epoxy Resin (C/H = 10).
When inspecting the chemical compositions of the polymers, it is also possible to associate the presence of Cl only to the Epoxy Resin (C21H25ClO5) and PVC ((C2H3Cl)n) among plastics possibly composing PCBs (Table 3). For PVCs, the presence of Cl in the chemical composition is significantly higher as it has a much smaller C-H chain (Cl/C2H3Cl = 0.57) than Epoxy Resin (Cl/C21H25ClO5 = 0.09). Thus, a correlation between high-Cl presence and the lowest values for the C/H ratio, e.g., in the size fractions 2–4 mm (HM1) and 1–2 mm (HM2), as shown in Table 4, is a reasonable indication of the concentration of PVC to these specific fractions. Likewise, the epoxy resins are typically covered with bromine-based compounds, in order to enhance their flame-resistant properties [29]; hence, the association between Br and C/H values around 10, is a good indication of epoxy resin deportment/concentration in certain fractions (e.g., 0.35–0.50 mm of HM1 and HM2 products). This correlation will be further described and discussed in the following paragraphs with Figure 3.
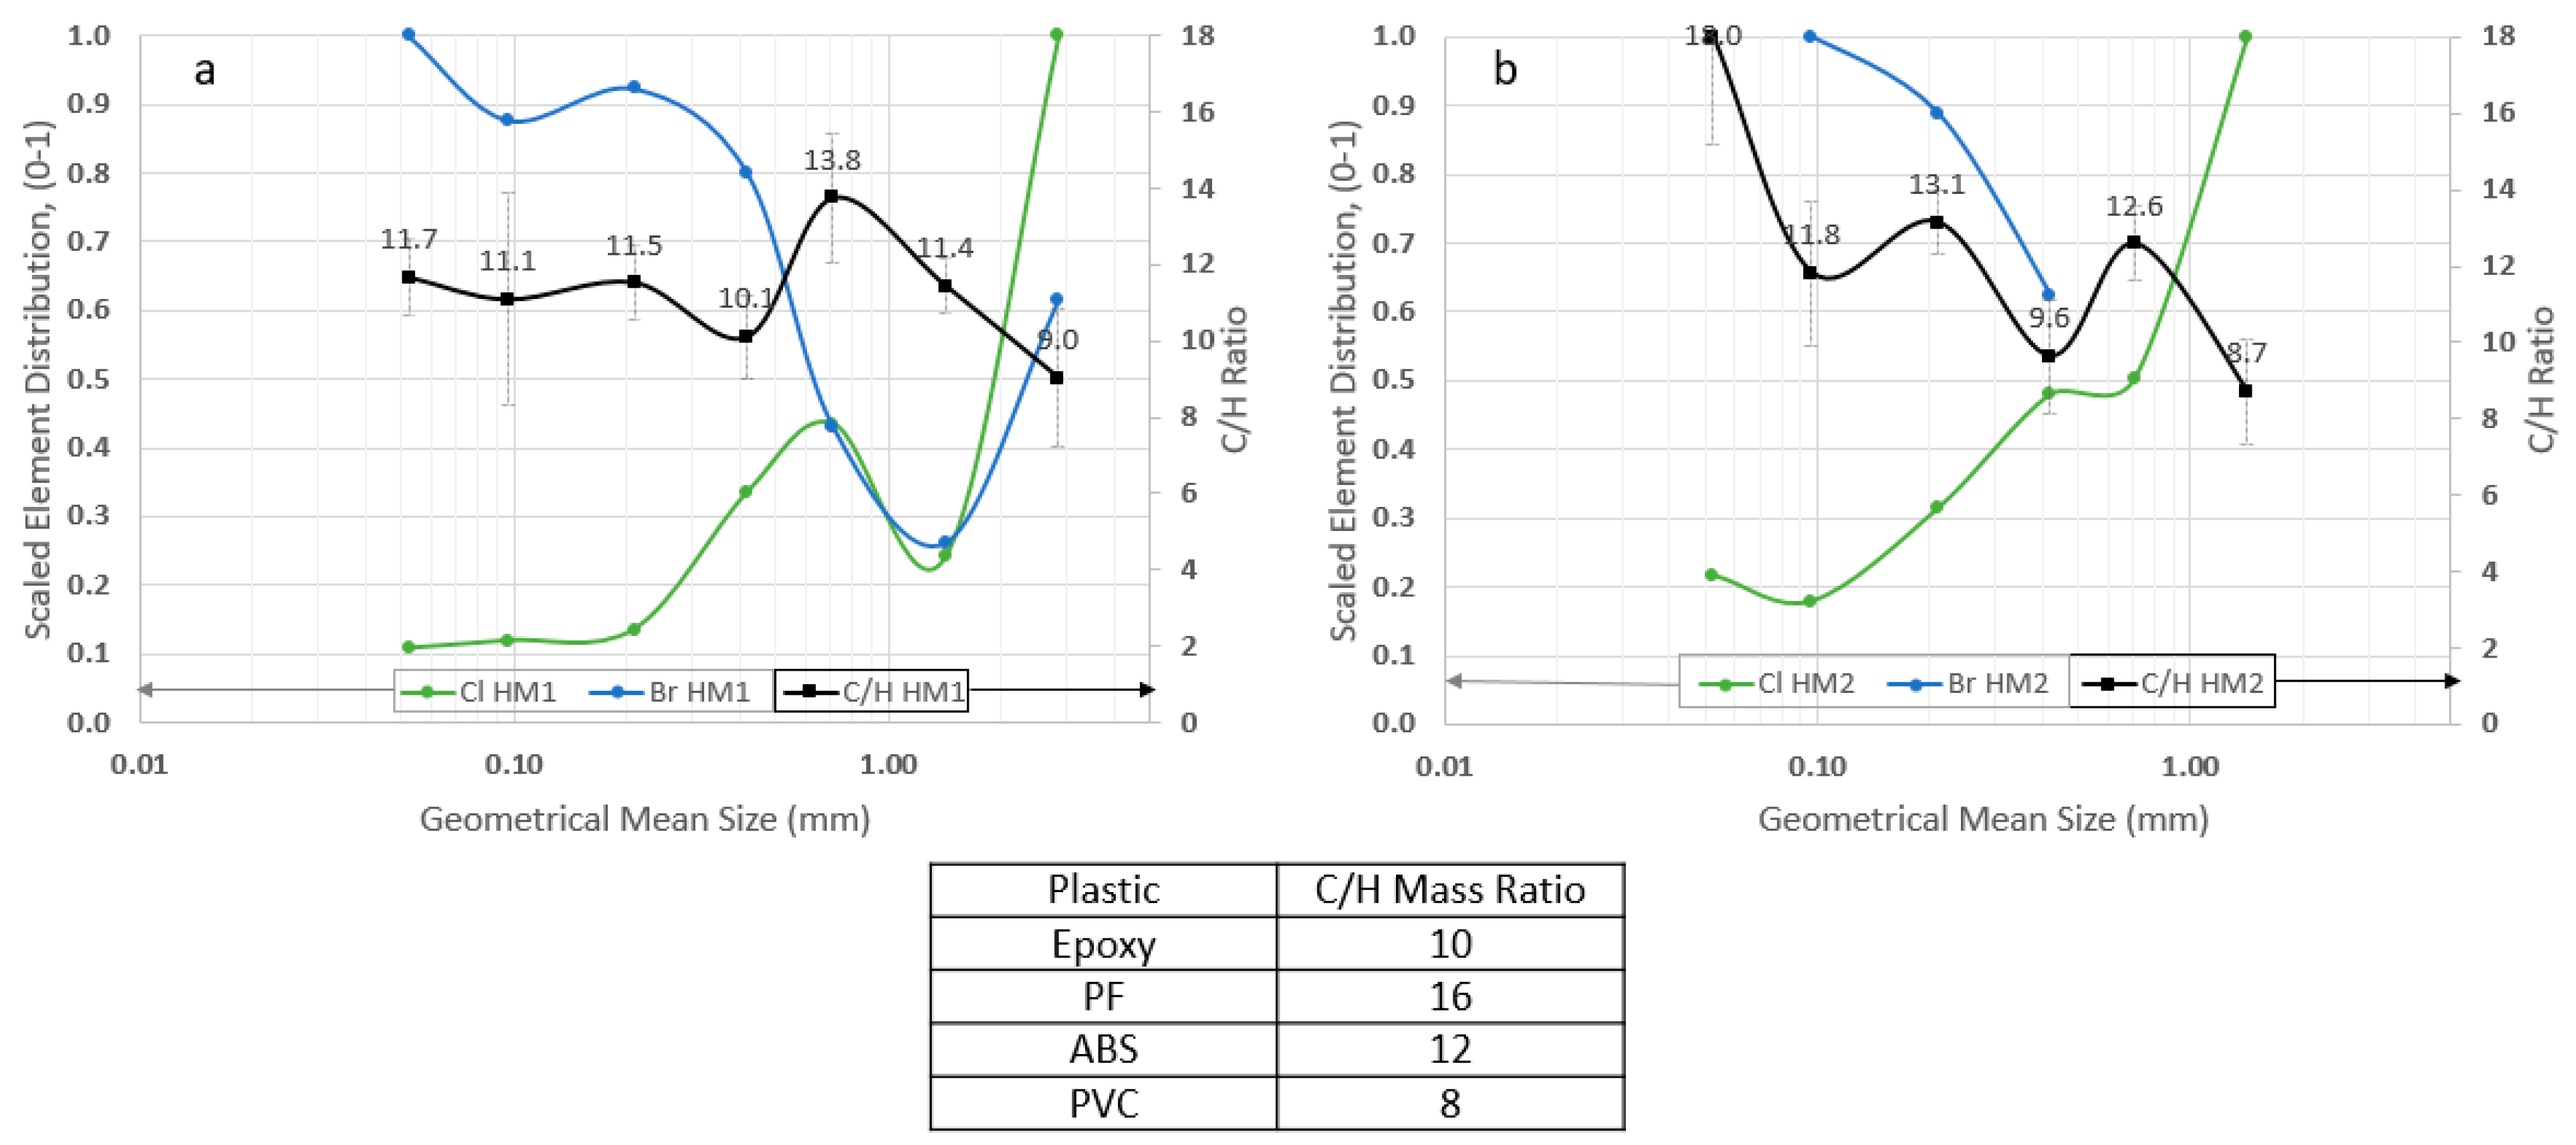
In order to further clarify the correlation between specific elements (Cl and Br for the type of plastics while Cu and Al for metal-plastic liberation/association) and C/H mass ratios, their distributions are plotted against C/H mass ratios as a function of particle size of the milled products. Figure 3 illustrates the deportment/concentration of Cl and Br analyzed by PGAA as a function of the different size fractions recorded as the geometrical mean size, in comparison with C/H mass ratios, for both HM1 and HM2 products. 
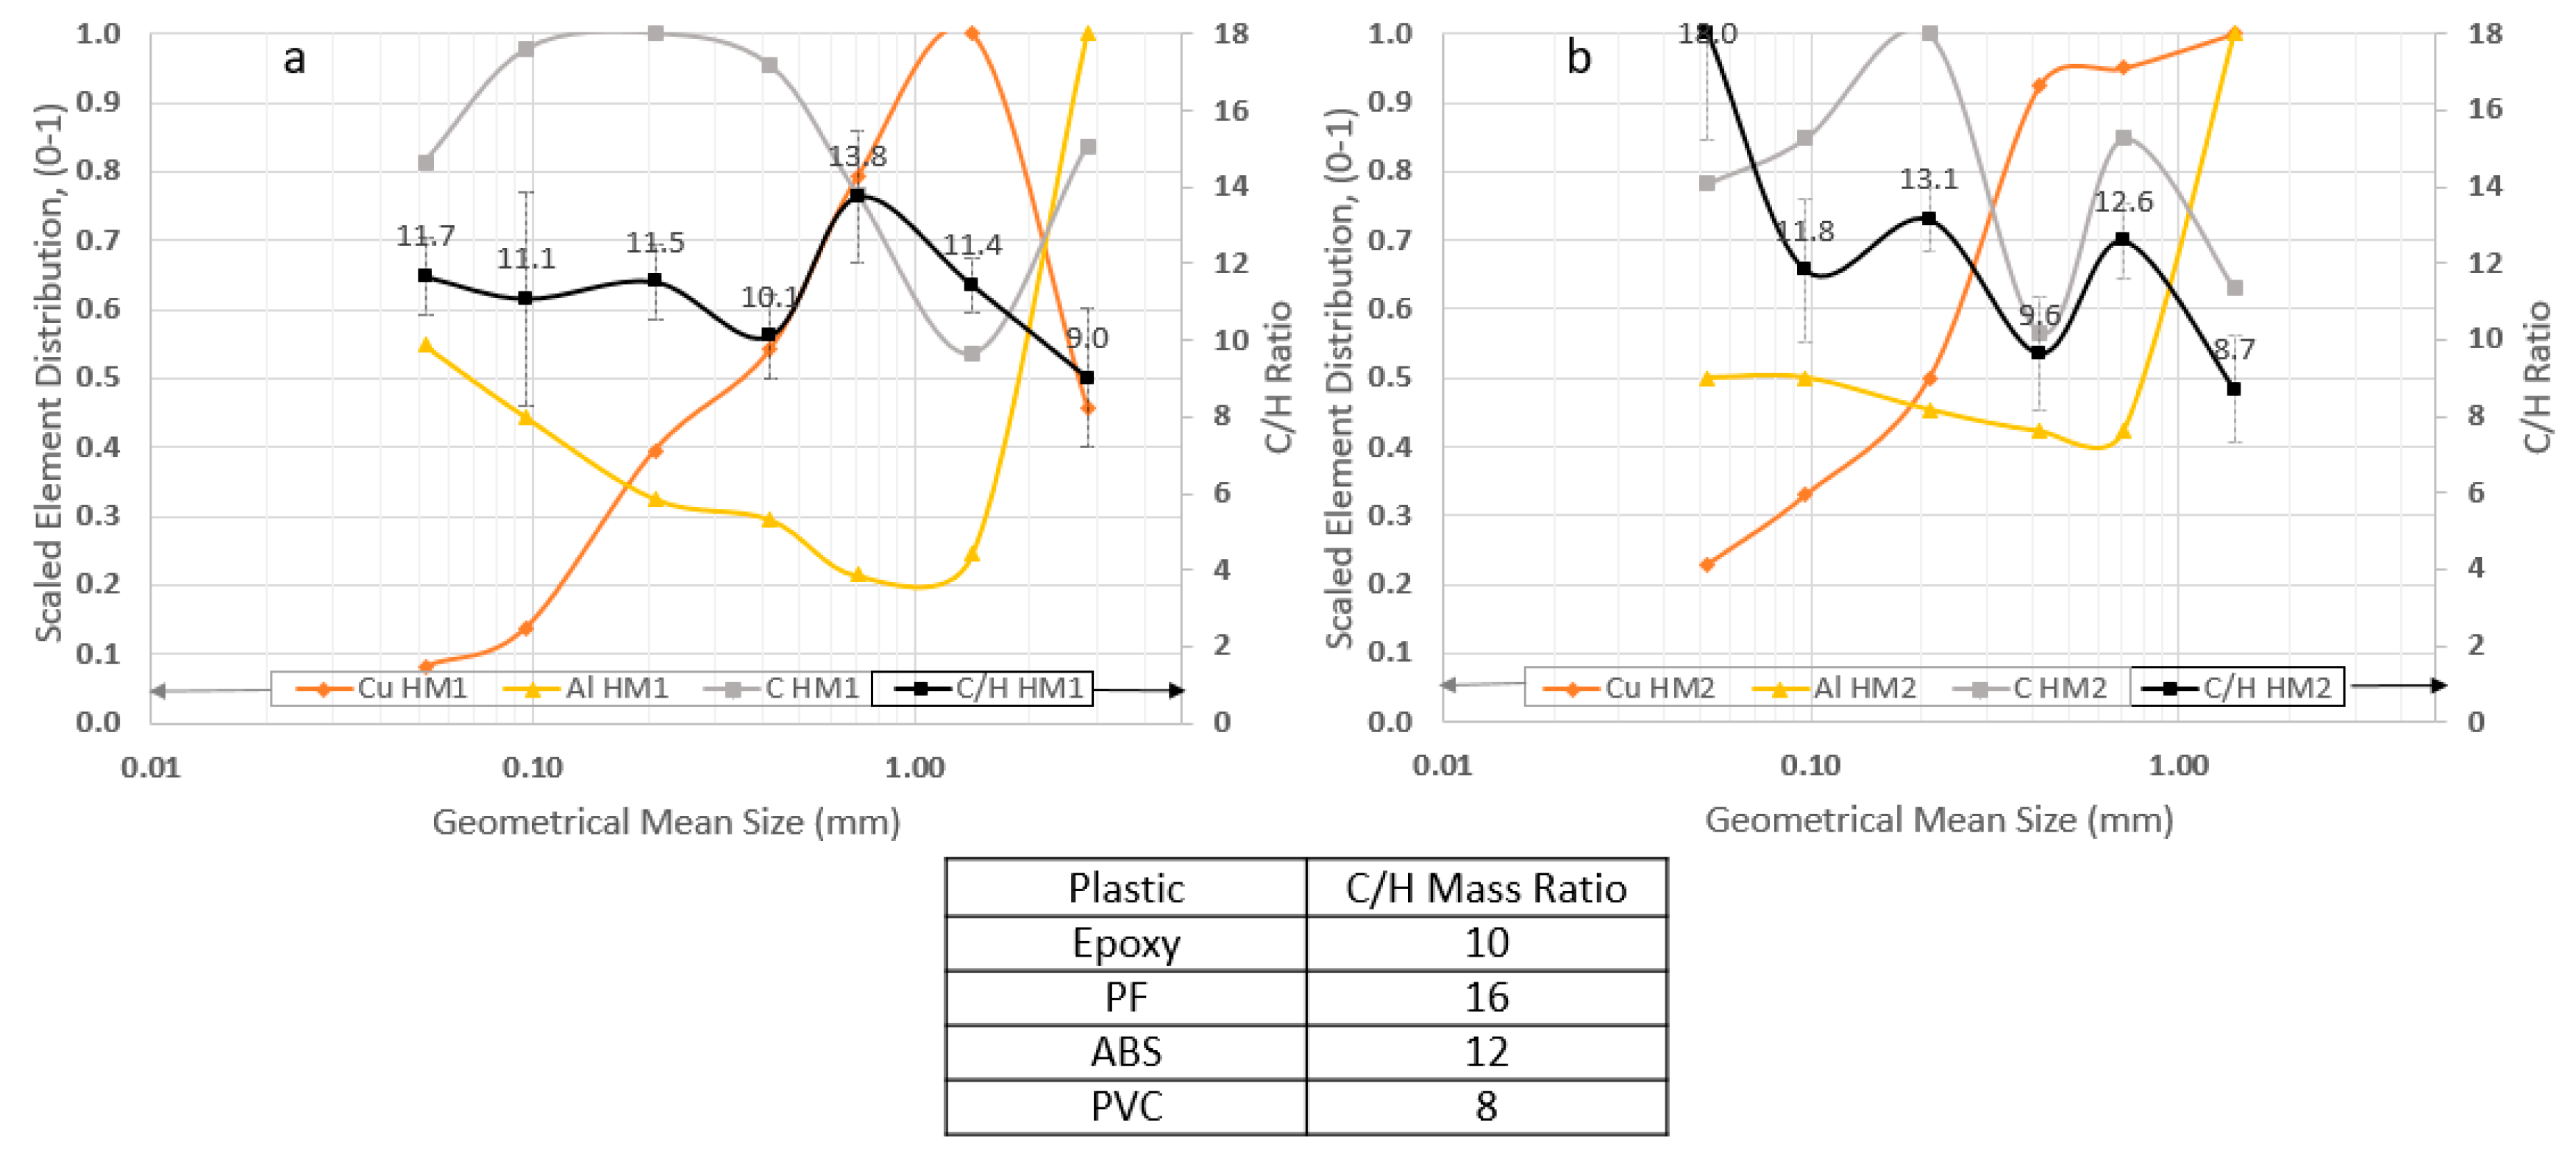
Figure 4 shows the comparison between Cu and Al with C/H. The plots were scaled and adjusted to a range from 0 to 1, meaning that the maximum element concentration measured in that specific dataset is equal to 1.
In Figure 3 and Figure 4, the geometric mean size is used, based on the calculation with an equation: √ (xi × xi+1); where xi is the finest sieve opening size in the fraction, while xi+1 is referring to the coarsest sieve opening size in a fraction [30]. As an example, for the top size fraction 2–4 mm, the calculation √ (2 × 4) results in the value of 2.83.
Figure 3a,b shows that the Cl is most concentrated in the coarsest size fraction (i.e., 2–4 mm for HM1 product; 1–2 mm for HM2 product) where the C/H mass ratio is the lowest. This is an obvious indication of selective PVC (C/H = 8, Table 3) concentration to the coarser fractions. The epoxy resins (C/H = 10, Table 3) are reported to the intermediate size fractions (i.e., 0.35–0.5 mm for both HM1 and HM2 products). In addition, these points are supported by their chemical formula with the Cl content in PVC occupying a higher mass portion (Cl/C2H3Cl = 0.57) than its content in epoxy resin (Cl/C21H25ClO5 = 0.09).
For the Br, the interpretation should be a bit more careful, as this element is not explicitly given in the molecular structure of the polymer; but as an additive in the flame-retardants [29]. Figure 3a shows that the Br is most concentrated in the fine size fractions with the C/H mass ratio around 12, indicating the presence of ABS while Figure 3a,b shows the C/H ratio around 10 (epoxy resin) is associated with approximately 5 wt.% of Br (5.2 wt.% in 0.35–0.50 mm of HM1 product while 4.5 wt.% in 0.35–0.50 mm of HM2 product). The raw wt.% data is not plotted in Figure 3.
Besides the above correlation between characteristic elements and type of plastic polymers as well as their concentration to specific size fractions, the correlations between the type of plastics and metals on the coarse and fine fractions were also investigated. Figure 4 shows the scaled deportment/concentration of Cu and Al against the C/H mass ratios as a function of the geometric mean particle size.
Figure 4 shows that the Cu enrichment in the coarser fractions is clear for both HM1 and HM2 products (i.e., 1–2 mm), with a steep decrease below 0.5 mm for HM1 products and below 0.35 mm for HM2 products. Such behavior matched with the low C content in the same fraction, e.g., 1–2 mm for both HM1 and HM2 products while the high C content in small size fraction below 0.5 mm for HM1 products and below 0.35 mm for HM2 products. This trend indicates the concentration behavior of plastics and Cu is generally opposite each other based on their good liberation.
The Al is clearly most concentrated in the coarsest fraction (i.e., 2–4 mm for the HM1 product; 1–2 mm for the HM2 product), an indication of association with the lowest C/H mass ratios (i.e., 9 for the both HM1 and HM2 products; either PVC or Epoxy Resin). On the other hand, the C content decreased from 0.85 in HM1 product to 0.63 in HM2 product, indicating Al liberated more from plastics after the 2nd hammer milling process. The Al content decreased in the intermediate fractions (0.2 in HM1 products; 0.4 in HM2 products), followed by gradual enrichment towards finer fractions (i.e., below 0.5 mm), but only up to half (0.5 out of 1) of the coarsest fraction (i.e., 2–4 mm for HM1 and 1–2 mm for HM2). Overall, the decrease in metal deportment and thus the plastic predominance for particle size below 0.5 mm agreed with the results reported by Eswaraiah et al. [6], who performed sink-float tests to evaluate the performance of separating crushed PCBs particles by air classification.
In general, both Cu and Al deportment/concentration are inversely correlated with the C/H ratios and C content, indicating the selective enrichment of those metals in the coarse size fractions after milling while in the fractions with the low Cu or Al, the higher C/H and C concentration were identified, indicating the selective enrichment of plastic particles.
As discussed above, the utilization of PGAA feature to analyze light elements, makes the investigation of the correlation between various elements and even the identification of the plastic composition feasible. In addition, the PGAA is frequently described as a reasonable spectroscopic analytical method for the determination of Rare Earth Elements within samples from water/soils to advanced materials [31]. In the present study, the elements Scandium (Sc), Neodymium (Nd), Gadolinium (Gd) and Samarium (Sm) were identified in several particle size ranges, and their concentrations increase with decreasing particle size, as shown in Table 6. For example, Gd is 19 ppm in 0.35–0.50 mm of HM1 product while 60 ppm in −0.074 mm of HM1 product. The Nd also shows the similar trend, except for the 0.5–1 mm HM1 product. It indicates that the liberation and concentration of these metals is only pronounced with fine grinding of the PCBs. Further studies on the presence of such critical elements in the PCBs and the feasibility to selectively separate and recover them can be addressed in future studies.
The detection of the rare earth elements (REEs) is possible in some of the testing modes for portable XRF other than the mining Cu/Zn mode that was used. Although, some researchers investigated and identified that the accuracy of determining critical elements such as the REEs can be poor with the portable XRF [32].
The theoretical detection limits of Nd with the portable XRF (i.e., 90 ppm, 45 s per an X-ray filter) is slightly above the lowest value detected with the PGAA (i.e., 50 ppm in the fraction 0.125–0.35 mm, HM2). For Sm and Gd, the detection limits are 40 and 60 ppm (45 s per filter) respectively, which is considerably above the values 3.5 ppm of Sm (0.125–0.3 mm, HM1) and 10 ppm of Gd (0.125–0.35 mm, HM2) that were detected with the PGAA. In addition, it is important to note that the detection limits for Nd, Sm, and Gd with the portable XRF were obtained based in samples with a simple SiO2 matrix. Thus, in a more heterogeneous composition (e.g., PCBs), the detection limits are anticipated to be even higher, as the calculation of the detection limit for a given element of interest depends on the other elements of the host matrix.
Considering these observations and the results achieved by the PGAA, it is inferred that the PGAA is considerably more effective to identify REEs present in complex assemblages like the PCBs in comparison with the portable XRF.

3.2. Comparison between the Analyses Using Portable XRF and PGAA

Both the methods provided similar results in terms of determining the metallic element concentrations with certain difference in their magnitudes. On the other hand, the detection of light elements, such as carbon that is a major component of any plastic particles, can be feasible with PGAA; but not with XRF. It is certainly very helpful to understand the plastic particle liberation from, and/or association with, metallic particles for better understanding and enhancing selective separation and material recycling. Table 7 shows the summary of advantages and disadvantages of the portable XRF and PGAA for the crushed printed circuit boards. The advantages of portable XRF are its easy access and operation as well as automated data evaluation for elemental assay. Its limitations can be the detection of light elements (e.g., carbon) and the average value generated with a certain spot size of the incident X-ray beam and its surface sensitivity that may provide less representative results for the analysis of a bulk and heterogeneous material. The main advantages of PGAA are the detection of light elements, as well as the sample size does not matter for the measurement (e.g., large and thick sample can be measured due to the high transparency of neutron beam). Its drawback can be limited access to neutron sources, and data evaluation can be complex and often must be performed by experts.

4. Conclusions

Prior to proposing a recycling procedure for any type of specific WEEEs, their complete characterization to know chemical and physical properties of individual components is of great help to develop an efficient flowsheet for recovering valuable materials with less environmental footprint.
In this study, a portable XRF and PGAA were applied to measure mechanically processed PCB particles in order to evaluate the deportment/concentration and liberation/association of metallic and light elements for their material recycling purpose. Their results were compared and discussed, as well as their commonalities and complementarities were identified and discussed. The detection of carbon content, the main composition of plastics, can be achieved by PGAA only and provided us a good indication of plastic liberation from, and/or association with, metal particles. In general, the combination of the two methods provide us good complementary information about the mechanically processed PCB particles. Results obtained by the two methods were similar in their trends, as well as can correlate the liberation/association of Cu and Al with plastic particles identified from light elements detected by PGAA. The advantages and disadvantages of the above two methods were identified and discussed through their application to PCB particles. It is important to highlight the overestimation of concentration of some metals, such as the hazardous elements by the portable XRF. Hence, the cross validation with complementary measurements by the other analytical method(s) (e.g., PGAA) is highly recommended while the results should be thoroughly reviewed in order to draw a solid conclusion, especially if the toxic elements present and their elemental concentrations are close to the RoHS threshold.

Author Contributions

Conceptualization, A.O.; methodology, A.O., P.P.G., C.S., Z.R.; software, A.O., P.P.G., C.S., Z.R.; validation, A.O., P.P.G., C.S., Z.R.; formal analysis, A.O.; investigation, A.O., P.P.G., C.S., Z.R.; resources, A.O.; data curation, A.O., P.P.G., C.S., Z.R.; writing—original draft preparation, A.O., P.P.G.; writing—review and editing, A.O., P.P.G., C.S., Z.R.; visualization, A.O., P.P.G.; supervision, A.O.; project administration, A.O.; funding acquisition, A.O.

Funding

The authors gratefully acknowledge the financial support provided by the Heinz Maier-Leibnitz Zentrum (MLZ) to perform the neutron experiments at MLZ, Garching, Germany.

Acknowledgments

The authors would like to acknowledge the contribution from Brequel for sample donation, Gasser for sample preparation, and De La Mensbruge for the part of XRF measurements.

Conflicts of Interest

The authors declare no conflict of interest.

References

  1. Eurostat. Available online: http://ec.europa.eu/eurostat/web/waste/key-waste-streams/weee (accessed on 18 May 2018).
  2. Ghosh, B.; Ghosh, M.K.; Parhi, P.; Mukherjee, P.S.; Mishra, B.K. Waste printed circuit boards recycling: An extensive assessment of current status. J. Clean. Prod. 2015, 94, 5–19. [Google Scholar] [CrossRef]
  3. Otsuki, A. Non-destructive liberation analysis of printed circuit board. In Proceedings of the 16th International Waste Management and Landfill Symposium, Cagliari, Italy, 2–6 October 2017. [Google Scholar]
  4. Otsuki, A.; Grasser, L. Comminution of particles from waste printed circuit boards. In Proceedings of the European Metallurgical Conference 2019, Dusseldorf, Germany, 23 June 2019. [Google Scholar]
  5. Otsuki, A.; Chen, Y.; Zhao, Y. Characterisation and beneficiation of complex ores for sustainable use of mineral resources: Refractory gold ore beneficiation as an example. Int. J. Soc. Mater. Eng. Resour. 2014, 20, 126–135. [Google Scholar] [CrossRef]
  6. Eswaraiah, C.; Kavitha, T.; Vidyasagar, S.; Narayanan, S.S. Classification of metals and plastics from printed circuit boards (PCB) using air classifier. Chem. Eng. Proc. 2008, 47, 565–576. [Google Scholar] [CrossRef]
  7. Thermo Fisher Scientific Inc. Exploration and Mining of Rare Earth Elements (REE) Using Tube-Based Thermo Scientific Portable XRF Analyzers. Available online: https://static.thermoscientific.com/images/D21693~.pdf (accessed on 30 May 2019).
  8. NITON XL3t 900Analyzer with GOLDD Technology, User’s Guide Version 6.5; Thermo Fisher Scientific Inc.: Billerica, MA, USA, 2010.
  9. Heinz Maier-Leibnitz Zentrum. PGAA: Prompt gamma and in-beam neutron activation analysis facility. J. Large-Scale Res. Facil. 2015, 1, A20. [Google Scholar] [CrossRef]
  10. Fazekas, B.; Molnar, G.; Belgya, T.; Dabolczi, L.; Simonits, A. Introducing HYPERMET-PC for automatic analysis of complex gamma-ray spectra. J. Radioanal. Nucl. Chem. 1997, 215, 271–277. [Google Scholar] [CrossRef]
  11. Revay, Z.; Stieghorst, C. PGAA, Prompt Gamma and In-Beam Neutron Activation Analysis Facility. Available online: http://www.mlz-garching.de/pgaa (accessed on 27 March 2018).
  12. Sinioros, P.; Lasithiotakis, M.; Akidil, M.E. Small-Capacity Gold Production Tests from Waste Desktop Computers. Environ. Q. Manag. 2015, 25, 5–26. [Google Scholar] [CrossRef]
  13. Lekka, M.; Masavetas, I.; Benedetti, A.V.; Moutsatsou, A.; Fedrizzi, L. Gold recovery from waste electrical and electronic equipment by electrodeposition: A feasibility study. Hydrometallurgy 2015, 157, 97–106. [Google Scholar] [CrossRef] [Green Version]
  14. Das, A.; Vidyadhar, A.; Mehrotra, S.P. A novel flowsheet for the recovery of metal values from waste printed circuit boards. Res. Conserv. Recycl. 2009, 53, 464–469. [Google Scholar] [CrossRef]
  15. European Parliament and the Council. Directive 2002/95/EC on the restriction of the use of certain hazardous substances in electrical and electronic equipment. Off. J. L 2003, 37, 19–23. [Google Scholar]
  16. Dimitrakakis, E.; Janz, A.; Bilitewski, B.; Gidarakos, E. Determination of heavy metals and halogens in plastics from electric and electronic waste. Waste Manag. 2009, 29, 2700–2706. [Google Scholar] [CrossRef] [PubMed]
  17. Ruixue, W.; Zhenming, X. Recycling of non-metallic fractions from waste electrical and electronic equipment (WEEE): A review. Waste Manag. 2014, 34, 1455–1469. [Google Scholar]
  18. Rajagopal, R.R.; Aravinda, L.S.; Rajarao, R.; Bhat, B.R.; Sahajwallaa, V. Activated carbon derived from non-metallic printed circuit board waste for supercapacitor application. Electrochim. Acta 2016, 211, 488–498. [Google Scholar] [CrossRef]
  19. Quan, C.; Li, A.; Gao, N. Synthesis of carbon nanotubes and porous carbons from printed circuit board waste pyrolysis oil. J. Hazard. Mater. 2010, 179, 911–917. [Google Scholar] [CrossRef] [PubMed]
  20. Khanna, R.; Ikram-Ul-Haq, M.; Cayumil, R.; Rajarao, R.; Sahajwalla, V. Novel carbon micro fibers and foams from waste printed circuit boards. Fuel Proc. Technol. 2015, 134, 473–479. [Google Scholar] [CrossRef]
  21. Rodriguez, F. Plastic. Encyclopædia Britannica, Inc. Available online: https://www.britannica.com/science/plastic/Recycling-and-resource-recovery (accessed on 11 February 2019).
  22. National Center for Biotechnology Information. PubChem Compound Database. CID=169944. Available online: https://pubchem.ncbi.nlm.nih.gov/compound/169944 (accessed on 1 March 2019).
  23. National Center for Biotechnology Information. PubChem Compound Database. CID=24754. Available online: https://pubchem.ncbi.nlm.nih.gov/compound/24754 (accessed on 1 March 2019).
  24. National Center for Biotechnology Information. PubChem Compound Database. CID=24756. Available online: https://pubchem.ncbi.nlm.nih.gov/compound/24756 (accessed on 1 March 2019).
  25. National Center for Biotechnology Information. PubChem Compound Database. CID=6338. Available online: https://pubchem.ncbi.nlm.nih.gov/compound/6338 (accessed on 1 March 2019).
  26. Yung, K.C.; Wang, J.; Yue, T.M. Thermal management for boron nitride filled metal core printed circuit board. J. Compos. Mater. 2008, 42, 2615–2627. [Google Scholar] [CrossRef]
  27. Johnson, L. How to Calculate Uncertainty. Sciencing. Available online: https://sciencing.com/how-to-calculate-uncertainty-13710219.html (accessed on 23 March 2019).
  28. Anzano, J.M.; Gornushkin, I.B.; Smith, B.W.; Winefordner, J.D. Laser-induced plasma spectroscopy for plastic identification. Polym. Eng. Sci. 2000, 40, 2423–2429. [Google Scholar] [CrossRef]
  29. Chen, Y.; Jinhui, L.; Lieqiang, C.; Shusheng, C.; Weihua, D. Brominated flame retardants (BFRs) in waste electrical and electronic equipment (WEEE) plastics and printed circuit boards (PCBs). Proced. Environ. Sci. 2012, 16, 552–559. [Google Scholar] [CrossRef]
  30. Abouzeid, A.Z.M. Mineral Processing Laboratory Manual. Trans. Tech. Publ. 1990, 9, 23–27. [Google Scholar]
  31. Zawisza, B.; Katarzyna, P.; Feist, B.; Polowniak, M.; Kita, A.; Sitko, R. Determination of rare earth elements by spectroscopic techniques: A review. J. Anal. Atomic Spectrom. 2011, 26, 2373–2390. [Google Scholar] [CrossRef]
  32. Gallhofer, D.; Lottermoser, B.G. The Influence of Spectral Interferences on Critical Element Determination with Portable X-Ray Fluorescence (pXRF). Minerals 2018, 8, 320. [Google Scholar] [CrossRef]
Figure 1. (a) Correlation between XRF and PGAA for the complete dataset of the major metals of PCB particles (b) The dataset is divided into two series, the coarser (0.5–4 mm) and finer fractions (−0.5 mm).
Jcs 03 00054 g001
Figure 2. Relationship between metallic elements and light elements measured by PGAA; (ac) light elements vs. Cu (df) light elements vs. Al.
Jcs 03 00054 g002
Figure 3. Scaled distribution of Cl and Br in comparison with the C/H mass ratio as a function of the geometric mean size of the products of (a) Hammer Mill 1 and (b) Hammer Mill 2. The absolute uncertainty for the C/H ratio is given as an error bar. Experimental data points are connected with lines for the purpose of visual aid only.
Jcs 03 00054 g003
Figure 4. Scaled distribution of Cu and Al in comparison with the C/H mass ratio as a function of the geometric mean size for the products of (a) Hammer Mill 1 and (b) Hammer Mill 2. The absolute uncertainty for the C/H ratio is given as an error bar. Experimental data points are connected with lines for the purpose of visual aid only.
Jcs 03 00054 g004
Table 1. Concentrations of the major elements identified by the portable X-Ray Fluorescence (XRF) and prompt gamma ray neutron activation analysis (PGAA). The analysis is divided by size fractions and for the different hammer mills used (HM1 and HM2). The metal (wt.%) on the uncrushed printed circuit boards (PCBs) is given at the bottom of the XRF analysis. The 95% confidence interval and absolute uncertainties for XRF and PGAA respectively are also given next to each metal% under the symbol of +/−. For the blank spaces, the referred element was not reported in the composition for that size fraction, while the dashed lines indicate that no experiment was performed due to the absence of enough material by fine grinding (2–4 mm PGAA HM2).
Analytical Method/MillSize (mm)Cu (%)+/−Fe (%)+/−Al (%)+/−Zn (%)+/−Si (%)+/−
XRF/HM12–48.943.730.250.066.551.630.060.015.120.55
1–27.004.300.160.073.931.880.140.013.580.64
0.5–17.501.020.270.054.040.580.120.023.920.47
0.35–0.511.301.350.190.013.290.170.070.013.060.45
0.125–0.353.910.580.330.023.270.160.140.014.460.35
0.074–0.1252.970.032.290.023.460.080.690.018.620.08
−0.0743.110.023.130.023.500.060.840.0010.070.02
XRF/HM22–41.570.100.800.061.990.430.220.052.640.31
1–27.080.980.170.023.010.490.130.032.470.21
0.5–16.781.290.170.013.050.280.330.142.490.12
0.35–0.54.160.300.240.013.100.260.150.054.110.32
0.125–0.358.250.560.270.024.460.340.340.073.770.13
0.074–0.1256.080.030.940.024.920.150.630.005.200.05
−0.0747.230.042.490.004.280.091.120.008.860.12
XRF/Uncrushed PCB35.044.950.030.011.620.150.090.043.860.28
PGAA/HM12–422.001.660.600.1113.500.994.800.407.300.56
1–248.000.88--3.300.164.400.203.800.16
0.5–138.001.56--2.900.13--5.300.23
0.35–0.526.001.32--4.000.20--6.400.31
0.125–0.3519.000.831.500.084.400.201.200.077.900.34
0.074–0.1256.600.722.500.286.000.64--16.101.72
−0.0743.900.164.500.187.400.26--25.000.83
PGAA/HM22–4----------
1–240.001.97--12.800.642.300.164.500.28
0.5–138.001.25--5.400.171.600.094.300.16
0.35–0.537.001.300.600.075.400.23--5.900.23
0.125–0.3520.000.690.790.055.800.181.400.117.200.24
0.074–0.12513.200.661.650.096.400.312.200.139.700.53
−0.0749.200.513.700.216.400.362.400.2118.701.00
Table 2. Chemical composition of hazardous elements within the PCBs. The size fractions were divided into coarse and fine fractions, similar to the procedure from Figure 1.
MethodSizePb (%)Cd (ppm)Br (%)Sb (%)
XRFCoarse (0.5–4 mm)0.2811.69-0.17
Fine (−0.5 mm)0.7332.34-0.15
PGAACoarse (0.5–4 mm) 1.171.61-
Fine (−0.5 mm)1.18 *4.665.39-
RoHS Thresholds [8]0.101000.10-
Variation XRF Coarse285%12%--
Variation XRF Fine734%32%--
Variation PGAA Coarse-1.17%1612%-
Variation PGAA Fine1183%4.66%5387%-
* For the fine fraction measured by the PGAA, only one fraction (0.35–0.5 mm) had Pb as an identified element.
Table 3. List of potential plastics present in a PCB.
PlasticChemical FormulaTheoretical C/H Mass Ratio
Epoxides/Epoxy ResinsC21H25ClO5 [22]10.0
Phenol Formaldehyde Resins (PF)C8H6O2 [23]15.9
Acrylonitrile Butadiene Styrene (ABS)C15H17N [24]11.9
Polyvinyl Chloride (PVC)(C2H3Cl)n [25]7.9
Table 4. Metal/light element ratios to compare the deportment/concentration in each size fraction analyzed. In the far right column, the C-H ratio is also given along with the corresponding calculated absolute uncertainty.
MillSize (mm)Cu/HCu/BCu/CAl/HAl/BAl/CFe/HFe/BFe/CClC/HC/H Abs Unc.
HM12–45.558.00.63.435.60.40.21.60.01.709.01.8
1–223.9615.42.11.642.30.10.00.00.00.4111.40.7
0.5–115.8313.01.21.223.90.10.00.00.00.7413.81.7
0.35–0.56.4128.10.61.019.70.10.00.00.00.5710.11.1
0.125–0.355.184.40.41.219.60.10.46.70.00.2311.51.0
0.074–0.1251.79.20.21.68.30.10.73.50.10.2011.12.8
−0.0741.33.80.12.57.20.21.54.40.10.1811.71.0
HM21–212.0296.11.43.894.70.40.00.00.01.218.71.4
0.5–112.3443.91.01.763.10.10.00.00.00.6112.61.0
0.35–0.513.7213.91.42.031.20.20.23.50.00.589.61.5
0.125–0.355.770.20.41.720.40.10.22.80.00.3813.10.8
0.074–0.1254.039.60.31.919.20.20.55.00.00.2211.81.9
−0.0744.614.50.33.210.10.21.95.80.10.2618.02.8
Table 5. The square of the correlation coefficient and the slope from the linear regression analysis between the major metals and light elements concentration identified by the PGAA.
Fraction Cu/HCu/BCu/CAl/HAl/BAl/C
Coarse (0.5–4 mm)R20.730.860.460.790.510.04
Slope−10.36−70.18−1.035.9229.840.17
Fine (−0.5 mm)R20.010.710.120.310.610.06
Slope1.65−30.12−0.63−0.922.83−0.04
Table 6. Distribution/concentration of REE detected by the PGAA.
MethodMillSize (mm)Sc (ppm)Nd (ppm)Sm (ppm)Gd (ppm)
PGAAHM10.5–1 1300.0
0.35–0.5 39.019.0
0.125–0.35 710.03.516.0
0.074–0.12550.01500.016.336.0
−0.074 1900.024.060.0
HM20.5–1 120.0
0.35–0.5
0.125–0.35 50.0 10.0
0.074–0.12580.01300.015.426.0
−0.074 1600.015.050.0
Table 7. Advantages and drawbacks of portable XRF and PGAA for mechanically processed PCB particles.
Portable XRFPGAA
AdvantagesDrawbacksAdvantagesDrawbacks
Easy to access; on-site evaluation.Detection of light elements is not feasible.Detection of light elements: H, B, C, N.Limited access to neutron source facilities.
Quick and automated data evaluation.Average of all the particles subjected to X-rays with a certain spot size.Spot size and intensity can be adjustable. Sample size does not matter (e.g., large and thick sample can be measured). Data evaluation can be complex and might require expert support.
Minimal sample preparation required.Surface sensitive; measurements can be less representative for a bulk and heterogeneous material.Bulk analysis; leading to more representative results.Relatively longer measurement time (126–194 min/sample with PGAA vs. 2–10 min/sample with XRF, in this study).
Easy machine manipulation and quick measurements.The metals to be analyzed are conditioned to the testing mode initially selected. In other words, it is not flexible. Lower detection limits e.g., for the REEs. More customization regarding the measuring time and excitation source.The operator must be well trained for obtaining the good results with optimizing the setups.

