Article

Damping Characterization of Hybrid Carbon Fiber Elastomer Metal Laminates using Experimental and Numerical Dynamic Mechanical Analysis

1
Karlsruhe Institute of Technology, Institute for Applied Materials, Engelbert-Arnold-Strasse 4, D-76131 Karlsruhe, Germany
2
Karlsruhe Institute of Technology, Institute of Vehicle System Technology, Lightweight Technology, Rintheimer Querallee 2, D-76131 Karlsruhe, Germany
*
Author to whom correspondence should be addressed.
J. Compos. Sci. 2019, 3(1), 3; https://doi.org/10.3390/jcs3010003
Submission received: 19 November 2018 / Revised: 23 December 2018 / Accepted: 28 December 2018 / Published: 4 January 2019

Abstract

:
Lightweight structures which consist to a large extent of carbon fiber reinforced plastics (CFRP), often lack sufficient damping behavior. This also applies to hybrid laminates such as fiber metal laminates made of CFRP and aluminum. Since they are usually prone to vibrations due to their high stiffness and low mass, additional damping material is required to meet noise, vibration and harshness comfort demands in automotive or aviation industry. In the present study, hybrid carbon fiber elastomer metal laminates (HyCEML) are investigated which are intended to influence the damping behavior of the laminates by an elastomer interlayer between the CFRP ply and the aluminum sheets. The damping behavior is based on the principle of constrained layer damping. To characterize the damping behavior, dynamic mechanical analyses (DMA) are performed under tension on the elastomer and the CFRP, and under three point bending on the hybrid laminate. Different laminate lay-ups, with and without elastomer, and two different elastomer types are examined. The temperature and frequency dependent damping behavior is related to the bending stiffness and master curves are generated by using the time temperature superposition to analyze the damping behavior at higher frequencies. A numerical model is built up on the basis of DMA experiments on the constituents and micro mechanical studies. Subsequently, three point bending DMA experiments on hybrids are simulated and the results are compared with the experimental investigations. In addition, a parameter study on different lay-ups is done numerically. Increasing vibration damping is correlated to increasing elastomer content and decreasing elastomer modulus in the laminate. A rule of mixture is used to estimate the laminate loss factor for varying elastomer content.

1. Introduction

Fibre metal laminates (FML) like glass reinforced aluminum (GLARE) or aramid reinforced aluminum (ARALL) are known for many decades now for their good specific elastic, impact and fatigue properties [1,2,3]. Thanks to constant research and development by various companies and research groups, this material class has made it into use in the fuselage of the A380 and the floor panel of the Boeing 737 [4]. These materials are mainly used in the aviation industry because they allow for long maintenance intervals due to very low crack propagation speeds and a fail-safe deformation behavior. The combination of carbon fiber reinforced plastics (CFRP) and aluminum sheets to so-called CARALL however, is much less common. Although the improved mechanical properties of carbon fibers offer a higher lightweight potential, interface-related challenges usually prevent industrial application of this material combination. The difficulties result from different electronegativities which can lead to delaminations due to corrosion, as well as different thermal expansion coefficients which lead to residual stresses in the material, especially with carbon fibers due to their low thermal expansion coefficient and high modulus [1,3]. To avoid these problems, various proposals were examined in which the two layers are isolated from each other. Besides the integration of an glass fiber reinforced (GFRP) interlayer between the CFRP and aluminum sheet [5,6], elastomeric interlayers have proven to solve these interfacial problems [7,8,9]. These laminates are called fiber metal elastomer laminates (FMEL). The elastomer layer also has strong influence on the damping and vibration behavior of such laminates. When laminates are bent, e.g., during bending vibrations, the soft elastomer layers are constrained by the stiff CFRP and aluminum layers, which subjects them to high shear strains. Due to the viscoelastic material behavior of the elastomer, strong energy dissipation can be achieved for this loading type in particular, which results in strong damping. This is known as constrained layer damping [10]. This phenomenon was first described by Ross et al. [11]. Today several applications in the aviation and automotive industry benefit from this type of damping mechanism [12,13]. The mechanism was also investigated for CFRP or metal laminates with elastomeric interlayers by Ghiringhelli et al. [14]. They showed that a fine distribution of the elastomer layers over the thickness leads to a better damping capacity than a single thick layer in the middle. An increase of the damping capacity was observed in all laminate configurations by the integration of an elastomer layer. No values for the decrease of bending stiffness due to the additional layer with a low shear modulus were provided, although this was mentioned as a negative aspect. Sarlin et al. [15] showed that in FMEL with GFRP, an additional elastomer layer had only minor effect on the damping compared to the GFRP without elastomer layers, as the GFRP itself had high loss factors already. Also a rule of mixture (ROM) was presented in this study, to calculate the structural loss factor by weight or volume fractions of the single constituents. However, again no values of Young’s modulus or storage modulus were provided, which could allow the assessment of the relationship between stiffness and damping. When substituting the glass fibers by carbon fibers in an FML a much stiffer behavior was obtained, the loss factors however were even smaller than on the neat aluminum and CFRP [16]. It is, therefore, assumed that in comparison to FMEL with GFRP, the additional elastomer layers increase the damping of FMEL, which contain generally very low-damping CFRP layers. However, the elastomer layer will also partially influence the bending stiffness.
The viscoelastic material behavior of the elastomers is strongly dependent on the temperature and frequency. Therefore, dynamic mechanical analyses (DMA) are performed in this study to investigate the temperature and frequency dependent damping behavior. This is of particular interest for industrial applications which often require damping at different ambient temperatures and excitation frequencies. DMA allows for the coverage of a broad temperature range, yet these experiments are often limited to a small frequency range of two or three decades, up to a few hundred Hz or even lower. This is not sufficient to analyze acoustic frequencies that often occur with noise, vibration and harshness comfort problems. The time temperature superposition (TTS) principle of polymers makes it possible to convert the temperature-dependent behavior into a time or frequency dependent behavior in order to cover a large frequency range [17]. However, not many studies have investigated the applicability of TTS on hybrid materials. Several studies deal with thermorheological complex materials where more than one relaxation mechanism influences the viscoelastic material behavior. Takayangi et al. [18], introduced a model to take the contributions of the individual relaxation mechanisms for the dynamic behavior of a polyblend into account. Theoretical investigations of such a polymer, typically an immiscible polymer blend, have shown the consequences for the generation of master curves. The combined relaxation mechanisms, especially at large frequency or time scales covering several decades, lead to deviations of the master curves, which depict the material behavior in a frequency range not experimentally investigated, from the actual viscoelastic material behavior of the polymer [19]. Kaplan et al. also stated that if master curves of single constituents of a polyblend exist, a shift according to these curves with an appropriate model should be preferred than shifting the data from the hybrid material [20]. Although analytical models for determining master curves for microscopic multiphase systems like polyblends have been investigated, they have not been applied to macroscopic hybrids. Since the constrained layer damping application in this paper leads to different stresses and strains of the individual layers, these models, initially developed for polyblends, cannot be applied. However, if the relaxation mechanisms occurring are active at very different temperatures, i.e., if the glass transition temperatures are far apart, then a thermorheologically simple material behavior can be assumed and master curves can be generated by horizontal shifts only [19,21]. Nakano showed analytically that TTS can hold true for a multiphase system when the glass transitions are far apart from each other or do have the same temperature dependency [22]. Hence, for hybrids with glass transitions of the constituents far apart, TTS can hold true and will also be used in this article. The glass transition temperatures of the CFRP (Tg = 135 C) and the elastomers (hard: Tg = −46.7 C, soft: Tg = 41.8 C) used in this study are more than 150 C apart. The the numerical approach presented in this study produces the master curves according to the data of the individual materials and is expected to lead to correct results even if several glass transitions are present, as long as the deformation is in the range of linear material behaviour. From the state of research a lack of investigations dealing with the influence of additional viscoelastic layers on both stiffness and damping of FML was derived. Also models are missing to describe master curves of hybrid materials like HyCEML where more than one glass transition can contribute to the dynamic behavior. Therefore, the aim of this study is, on one hand, to analyze the influence of different laminate lay-ups on their bending stiffness and damping behavior determined in experimental DMA. In addition, a numerical model is validated using experimental data obtained at fixed frequency and temperature. In Section 4 this model is used for a parameter study on different lay-ups. Also a comparison of the master curves generated by the experimental results on the hybrid laminates and the numerical approach will be made.

2. Materials and Methods

2.1. Materials

Different FMEL and FML lay-ups without elastomer were investigated in this study. First the different constituents are described, then the laminate lay-ups are presented. In Table 1 material data obtained from testing and taken from manufacturers data sheets (marked with an asterix) are given. The CFRP and the elastomers as well as the hybrid FMEL were consolidated in a hot mold process. The curing took place at a temperature of 150 C and a pressure of 40 bar for 300 s. These parameters were chosen in accordance with the data sheets of the CFRP and elastomer manufacturers.

2.1.1. Aluminum

For all FML and FMEL specimens an aluminum sheet 2024 T3 ALCLAD AMS-QQA-250/5 with a thickness of 0.3 mm was used. This alloy is a common sheet material for FML like GLARE. Before the consolidation process the metal sheets were cleaned with acetone. For the FML lay-ups without elastomer the surface of the aluminum sheets was sanded to increase the adhesion to the CFRP prepreg.

2.1.2. CFRP Prepreg

The CFRP layers consisted of unidirectional (UD) prepreg by Hexcel (HexPly M77/38/UD150/CHS-12K-70) in a biaxial lay-up. The nominal cured ply thickness according to the data sheet is 0.15 mm. Uniaxial tensile tests with ten specimens each according to DIN EN ISO 527-5 [23] and tensile tests on ± 45 laminates according to DIN EN 6031 [24] were performed to obtain material data for the numerical simulations. Beside the quasistatic tensile tests DMA on CFRP has been performed in previously reported research [25].

2.1.3. Elastomer

Two different elastomers were examined. The elastomers were provided in an unvulcanized state by KRAIBURG GmbH & Co. KG. (Waldkraiburg, Germany) Both materials were ethylene propylene diene monomer rubber (EPDM) elastomers whose main difference was the Young’s modulus. The batch numbers are HAA9275-45, which is hereinafter referred to as the hard elastomer, and SAA9579-52 which is referred to as the soft elastomer. The soft elastomer was provided in a ply thickness of 0.50 mm ( El . 5 s ) and 0.65 mm ( El . 65 s ). The hard elastomer had a ply thickness of 0.50 mm ( El . 5 h ). For the manufacturing of the neat elastomer specimens four layers of elastomer were used resulting in a thickness of about 2 mm. From uniaxial tensile tests according to ISO 37 [26] , the values for Young’s modulus and Poisson’s ratio listed in Table 1 were determined.
In an additional production step, the soft elastomer was dissolved in benzine and coated as a thin layer on the aluminum sheet. This made it possible to produce very thin elastomer layers with a resulting layer thickness of about 0.05 mm ( El . 05 s ). The elastomer coated aluminum sheets were then consolidated into an FMEL together with the CFRP as described above.

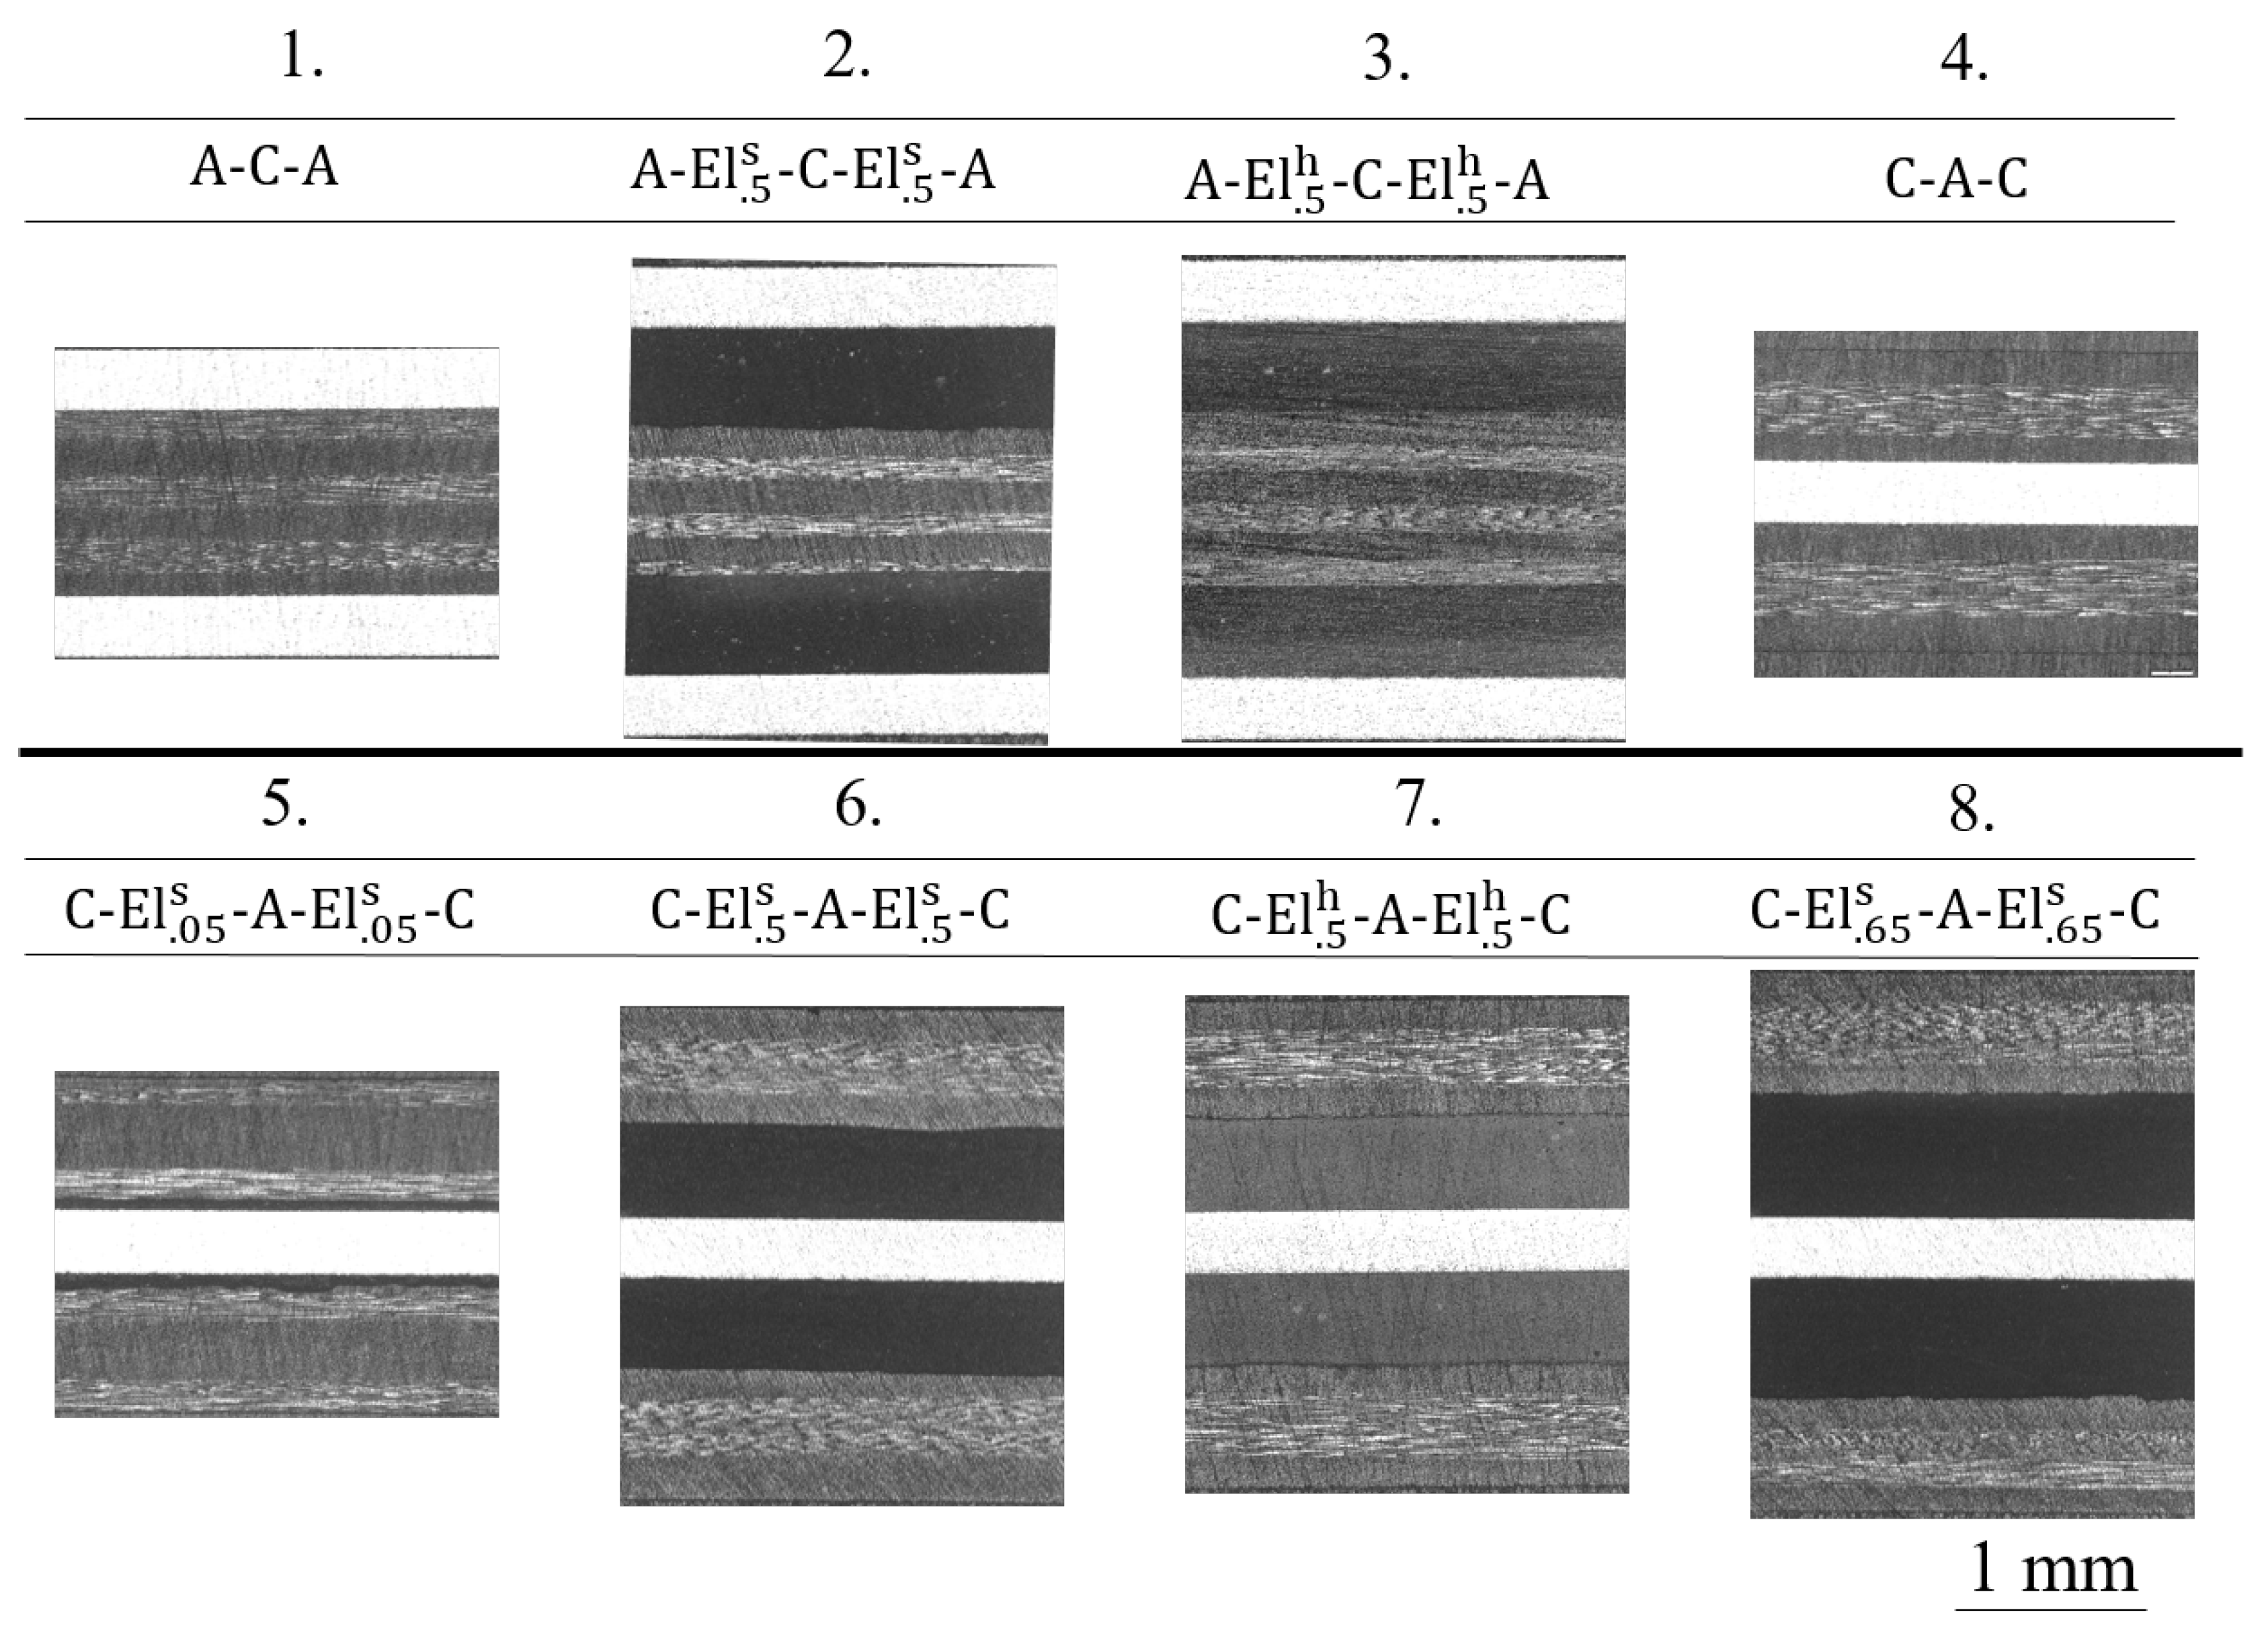
2.1.4. Hybrid Laminates

Eight different types of hybrid laminates were investigated experimentally in this study. Micrographs of these laminates can be found in Figure 1. The corresponding lay-up, containing aluminum (A), elastomer (El) and CFRP (C), with the thicknesses of each layer can be found in Table 2. Two configurations without elastomer (A-C-A (1.) and C-A-C (4.)) were tested as a reference. Both of these laminates were also tested as an FMEL configuration with soft and hard elastomer in an elastomer ply thickness of 0.5 mm (2., 3., 6., 7.). For the C-Els-A-Els-C configuration in addition elastomer ply thicknesses of 0.05 mm (5.) and 0.65 mm (8.) were examined. The laminates with 0.05 mm elastomer thickness were manufactured by the solvent process of the elastomer (Section 2.1.3).
Specimens for the bending DMA were cut from panels by using water jet cutting. The specimens had dimensions of 125 mm × 15 mm and were cut from the panels in a way that the fibers of the outer CFRP layers were orientated in length direction of the specimens.

2.2. Methods

DMA on the neat elastomer and CFRP were done in uniaxial tension mode, whereas the FMEL and FML were analyzed by three point bending (3PB). For both experiments an Instron E3000 ElectroPulsTM equipped with a temperature chamber was used. The machine is capable of applying a maximum dynamic force of ±3000 N which is important for the characterisation of the stiff CFRP. All DMA experiments were done as combined temperature and frequency sweeps, with discrete temperature and frequency steps (see Section 2.2.1 and Section 2.2.2). Besides the temperature dependent damping and stiffness behavior also the frequency dependent behavior was characterized by generating master curves. The master curves were generated by shifting the frequency dependent measurement values of storage modulus E’, loss modulus E” and loss factor tan( δ ) by means of a shift factor horizontally along the reduced frequency axis. For this shift an automated algorithm was implemented in Matlab (version R2017a) to find the best fit and derive the shift factors. For this purpose, the curves of the different temperatures in the experimentally measured frequency range (0.1 Hz–10 Hz) are fitted with a polynomial of degree three. Adjacent fits are then shifted horizontally in such a way that the quadratic deviation from the adjacent polynomials in the individual frequencies is minimal on average.

2.2.1. Tension DMA

For the soft and hard elastomers tension DMA was performed in the temperature range of −80 C to +80 C which covers a sufficiently wide range around the glass transition of the EPDM elastomers. The specimens had a quadratic cross section of of 10 mm × 2 mm with a length of 100 mm. The specimens were clamped in the test setup with a free length of 30 mm. The DMA was applied under tension-tension mode at a mean strain of 0.66% and a strain amplitude of 0.33%. Nine logarithmically distributed frequencies between 0.1 Hz and 10 Hz were tested at discrete temperature steps.

2.2.2. Three Point Bending DMA

Non resonant 3PB DMA was applied to characterize the constrained layer damping behavior of the hybrid laminates in particular. The specimens were not clamped in the fixture hence a mean deflection of 0.2 mm with an amplitude of 0.075 mm was chosen to ensure continuous contact of the loading fin. The temperature range was −70 C to +200 C in 2.5 C steps from −70 C to −20 C and in 5 C steps from −20 C to 200 C. The same nine frequencies as for the tensile DMA were tested. The support span of the three point bending setup was set to 80 mm.

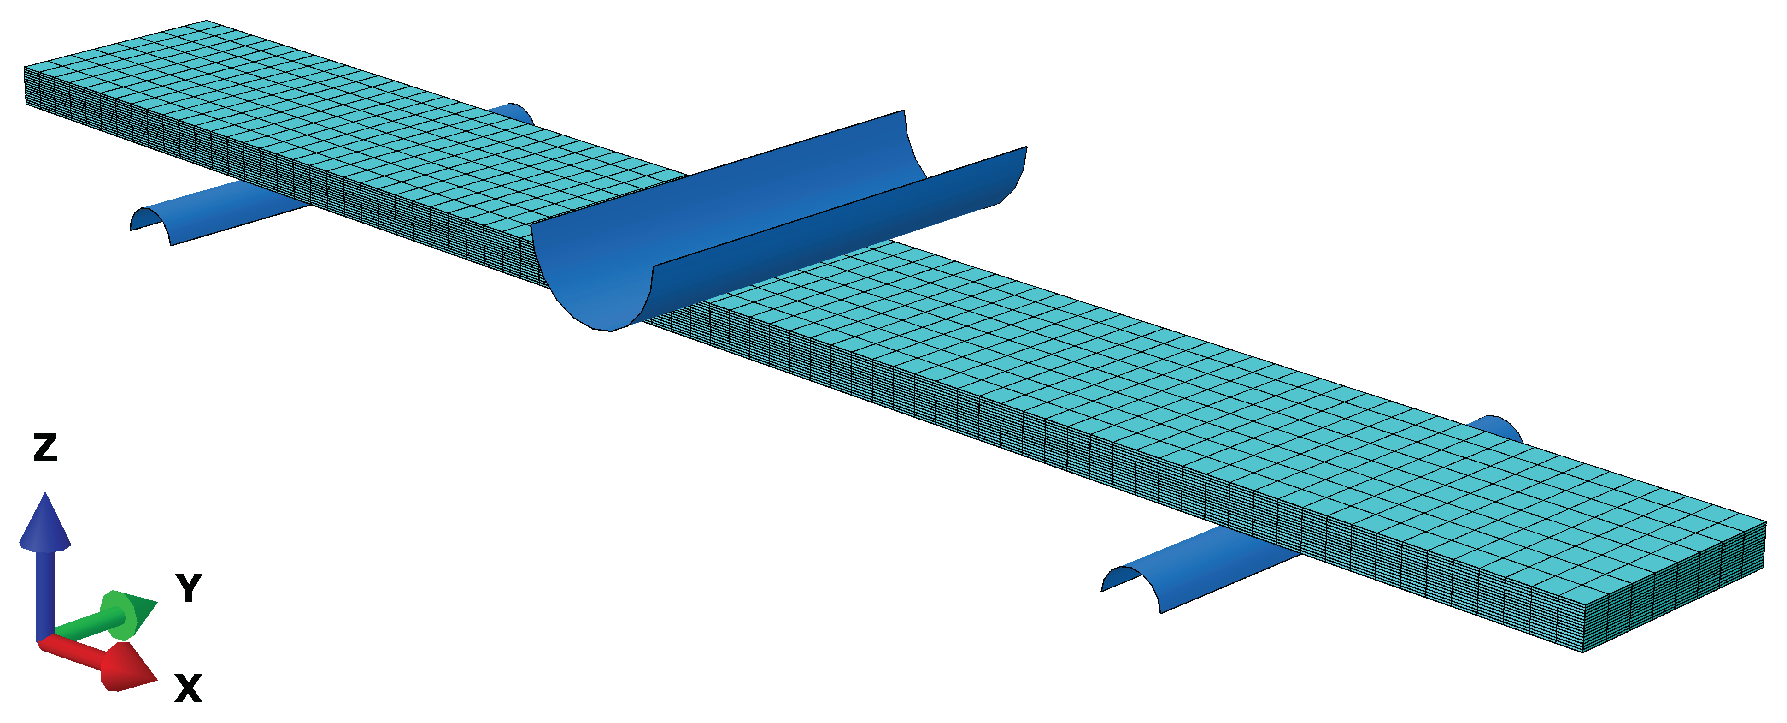
2.2.3. Finite Element Modeling

The same 3PB test on various laminates as illustrated in Section 2.2 was modeled by using the finite element method (FEM) software Abaqus®. Figure 2 shows the setup of the numerical 3PB test. A continuum based modeling approach was chosen, with each lamina being modeled by at least one layer of quadratic continuum elements. Quadratic continuum elements C3D20 were used for aluminum and CFRP layers. A hybrid formulation element C3D20H , suitable for incompressible materials, was used for the elastomeric layers. The geometric specifications of the specimen under consideration including layer thicknesses match those listed in Section 2.2.2. The loading nose and supports were modeled as analytically rigid surfaces neglecting friction. The specimen was preloaded in static step by applying a displacement u z = 0.2 to the loading fin. In a subsequent steady-state dynamics step, the loading nose was excited around the predeformed base state with an amplitude of u ¯ z = 0.075 for a frequency range of 10 4 Hz to 10 4 Hz .
The aluminum’s Young’s modulus E Al , Poisson’s ratio ν Al correspond to those listed in Table 1. Furthermore, density and Poisson’s ratio of all materials were specified based on the values in Table 1. The frequency-dependent viscoelastic behavior of both elastomers considered was directly specified by providing the experimental tension DMA data in Figure 3 and Figure 4. The transversely isotropic viscoelastic CFRP was modeled using an anisotropic generalized Maxwell model (GMM) implemented as a user-defined material model (UMAT) for Abaqus®. Details on the material model and parameter identification are found in Liebig et al. [25]. The material parameters used to model the CFRP in this study are listed in Appendix A. Table 3 summarizes the modeling approaches for each material in the laminate with respect to the chosen material model and the assumed material symmetries.
Additionally, a parametric study on the thickness of the elastomeric layer was performed on the laminate C-Es-A-Es-C. The thickness was varied in steps of 0.1 from 0.1–1 and the resulting storage modulus and loss factor were evaluated.

3. Results

First the experimental results of the DMA in tension mode on the neat soft and hard elastomer are presented, then the experimental and numerical results of the FMEL and FML specimens in 3PB DMA are shown.

3.1. Elastomer

The results of the tension DMA on the neat elastomers can be seen in Figure 3 for the soft elastomer and in Figure 4 for the hard elastomer. The master curve nomograms show the material behavior for any temperature between −60 C to +80 C in a double logarithmic scale. The curves were created by locking the storage module curve for the temperature of T ref = 20 C. All other curves, measured at higher or lower temperatures, were shifted to the reference temperature by using horizontal shift factors only. For this temperature the values for loss factor, storage and loss modulus can be read directly on the left ordinate. To obtain the material data at a different temperature, the right ordinate is used. Here the desired frequency is selected and from there one goes horizontally to the left until the diagonally running isotherm of the desired temperature is reached. The values for loss factor, storage and loss modulus are located at the intersection of a vertical line through this point. For a more detailed description of how to create nomograms from DMA data sets and how to read them, see Jones [32].
Below the glass transition temperature Tg both elastomers show a comparable high storage modulus of 3.7 GPa for the hard and a 28% lower modulus for the soft elastomer with 2.9 GPa for a frequency of 1 Hz and a temperature of −60 C. The Tg evaluated as the peak in loss factor for 1 Hz is at −46.7 C for the soft and at −41.8 C for the hard elastomer. At room temperature the storage modulus of the soft elastomer drops to 50 MPa for the soft and 480 MPa for the hard elastomer. The loss factor of the soft elastomer is generally higher in the temperature range above Tg. At room temperature a value of 0.169 for the soft and 0.056 for a frequency of 1 Hz is reached.

3.2. Hybrid Laminates

First the damping behavior at a frequency of 1 Hz is evaluated for all specimens in Section 3.2.1. This allows a clear comparison of the temperature-dependent damping behavior. In Section 3.2.2 the frequency dependent behavior of HyCEML will be analyzed with master curves.

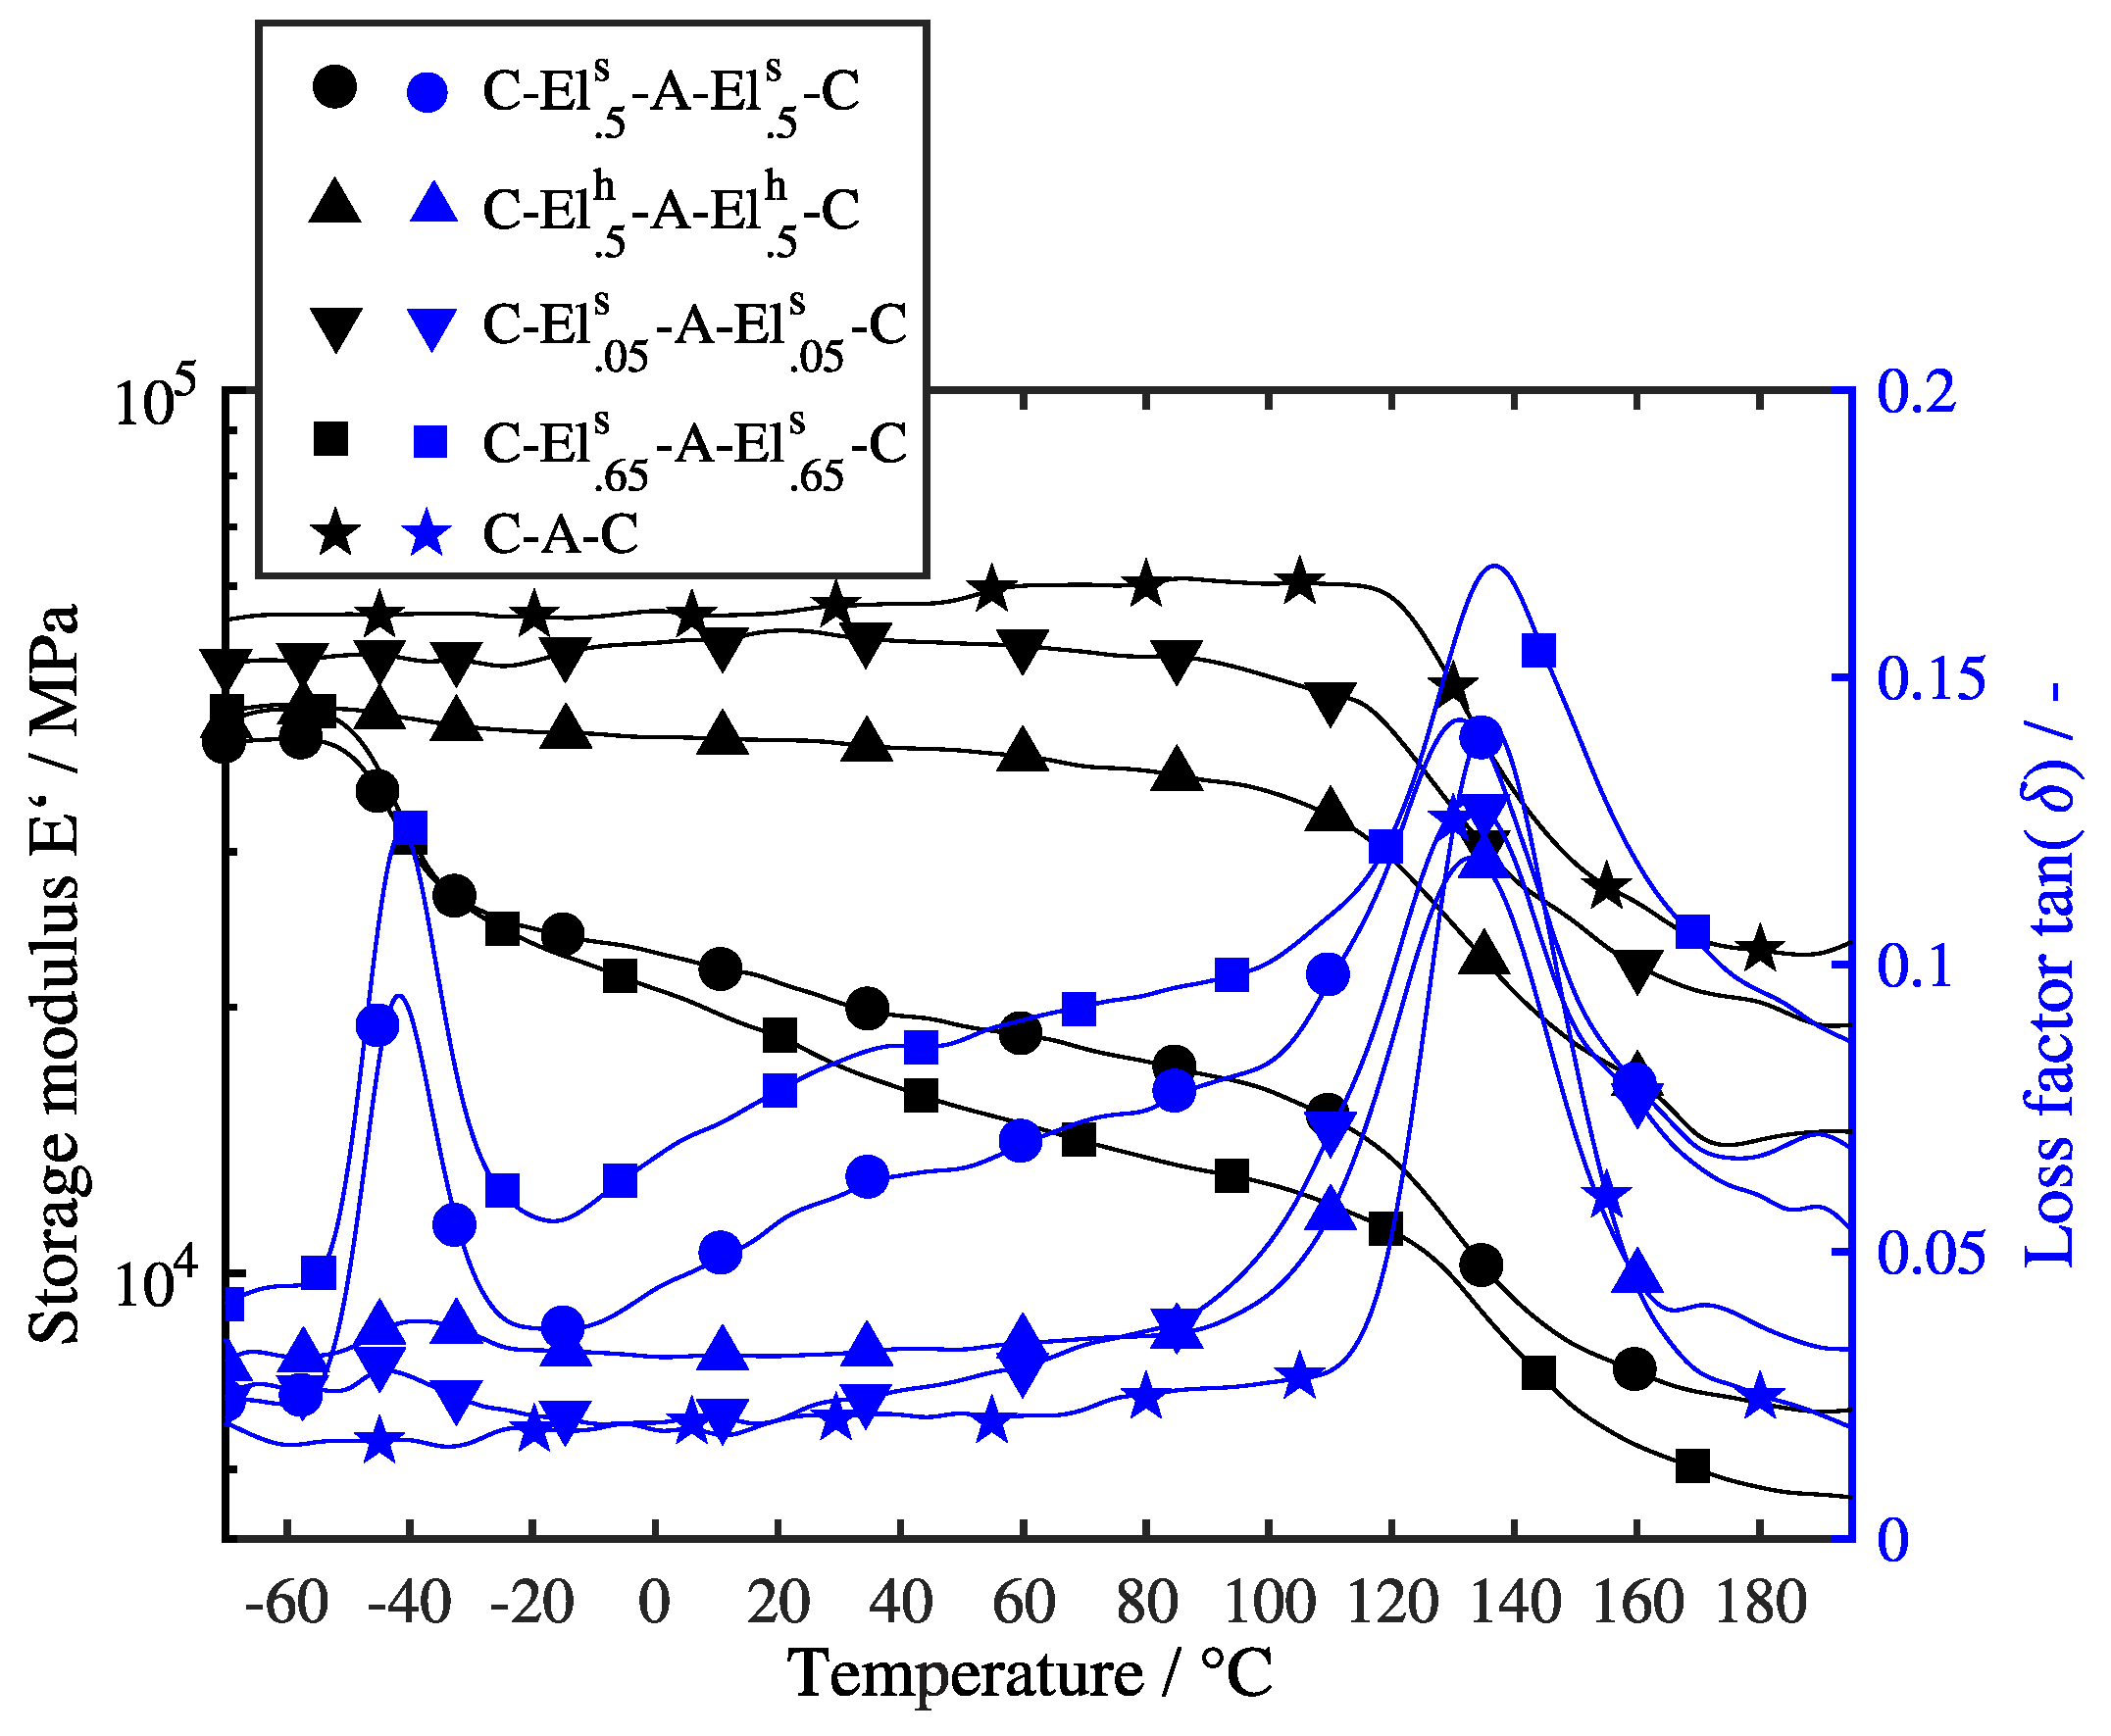
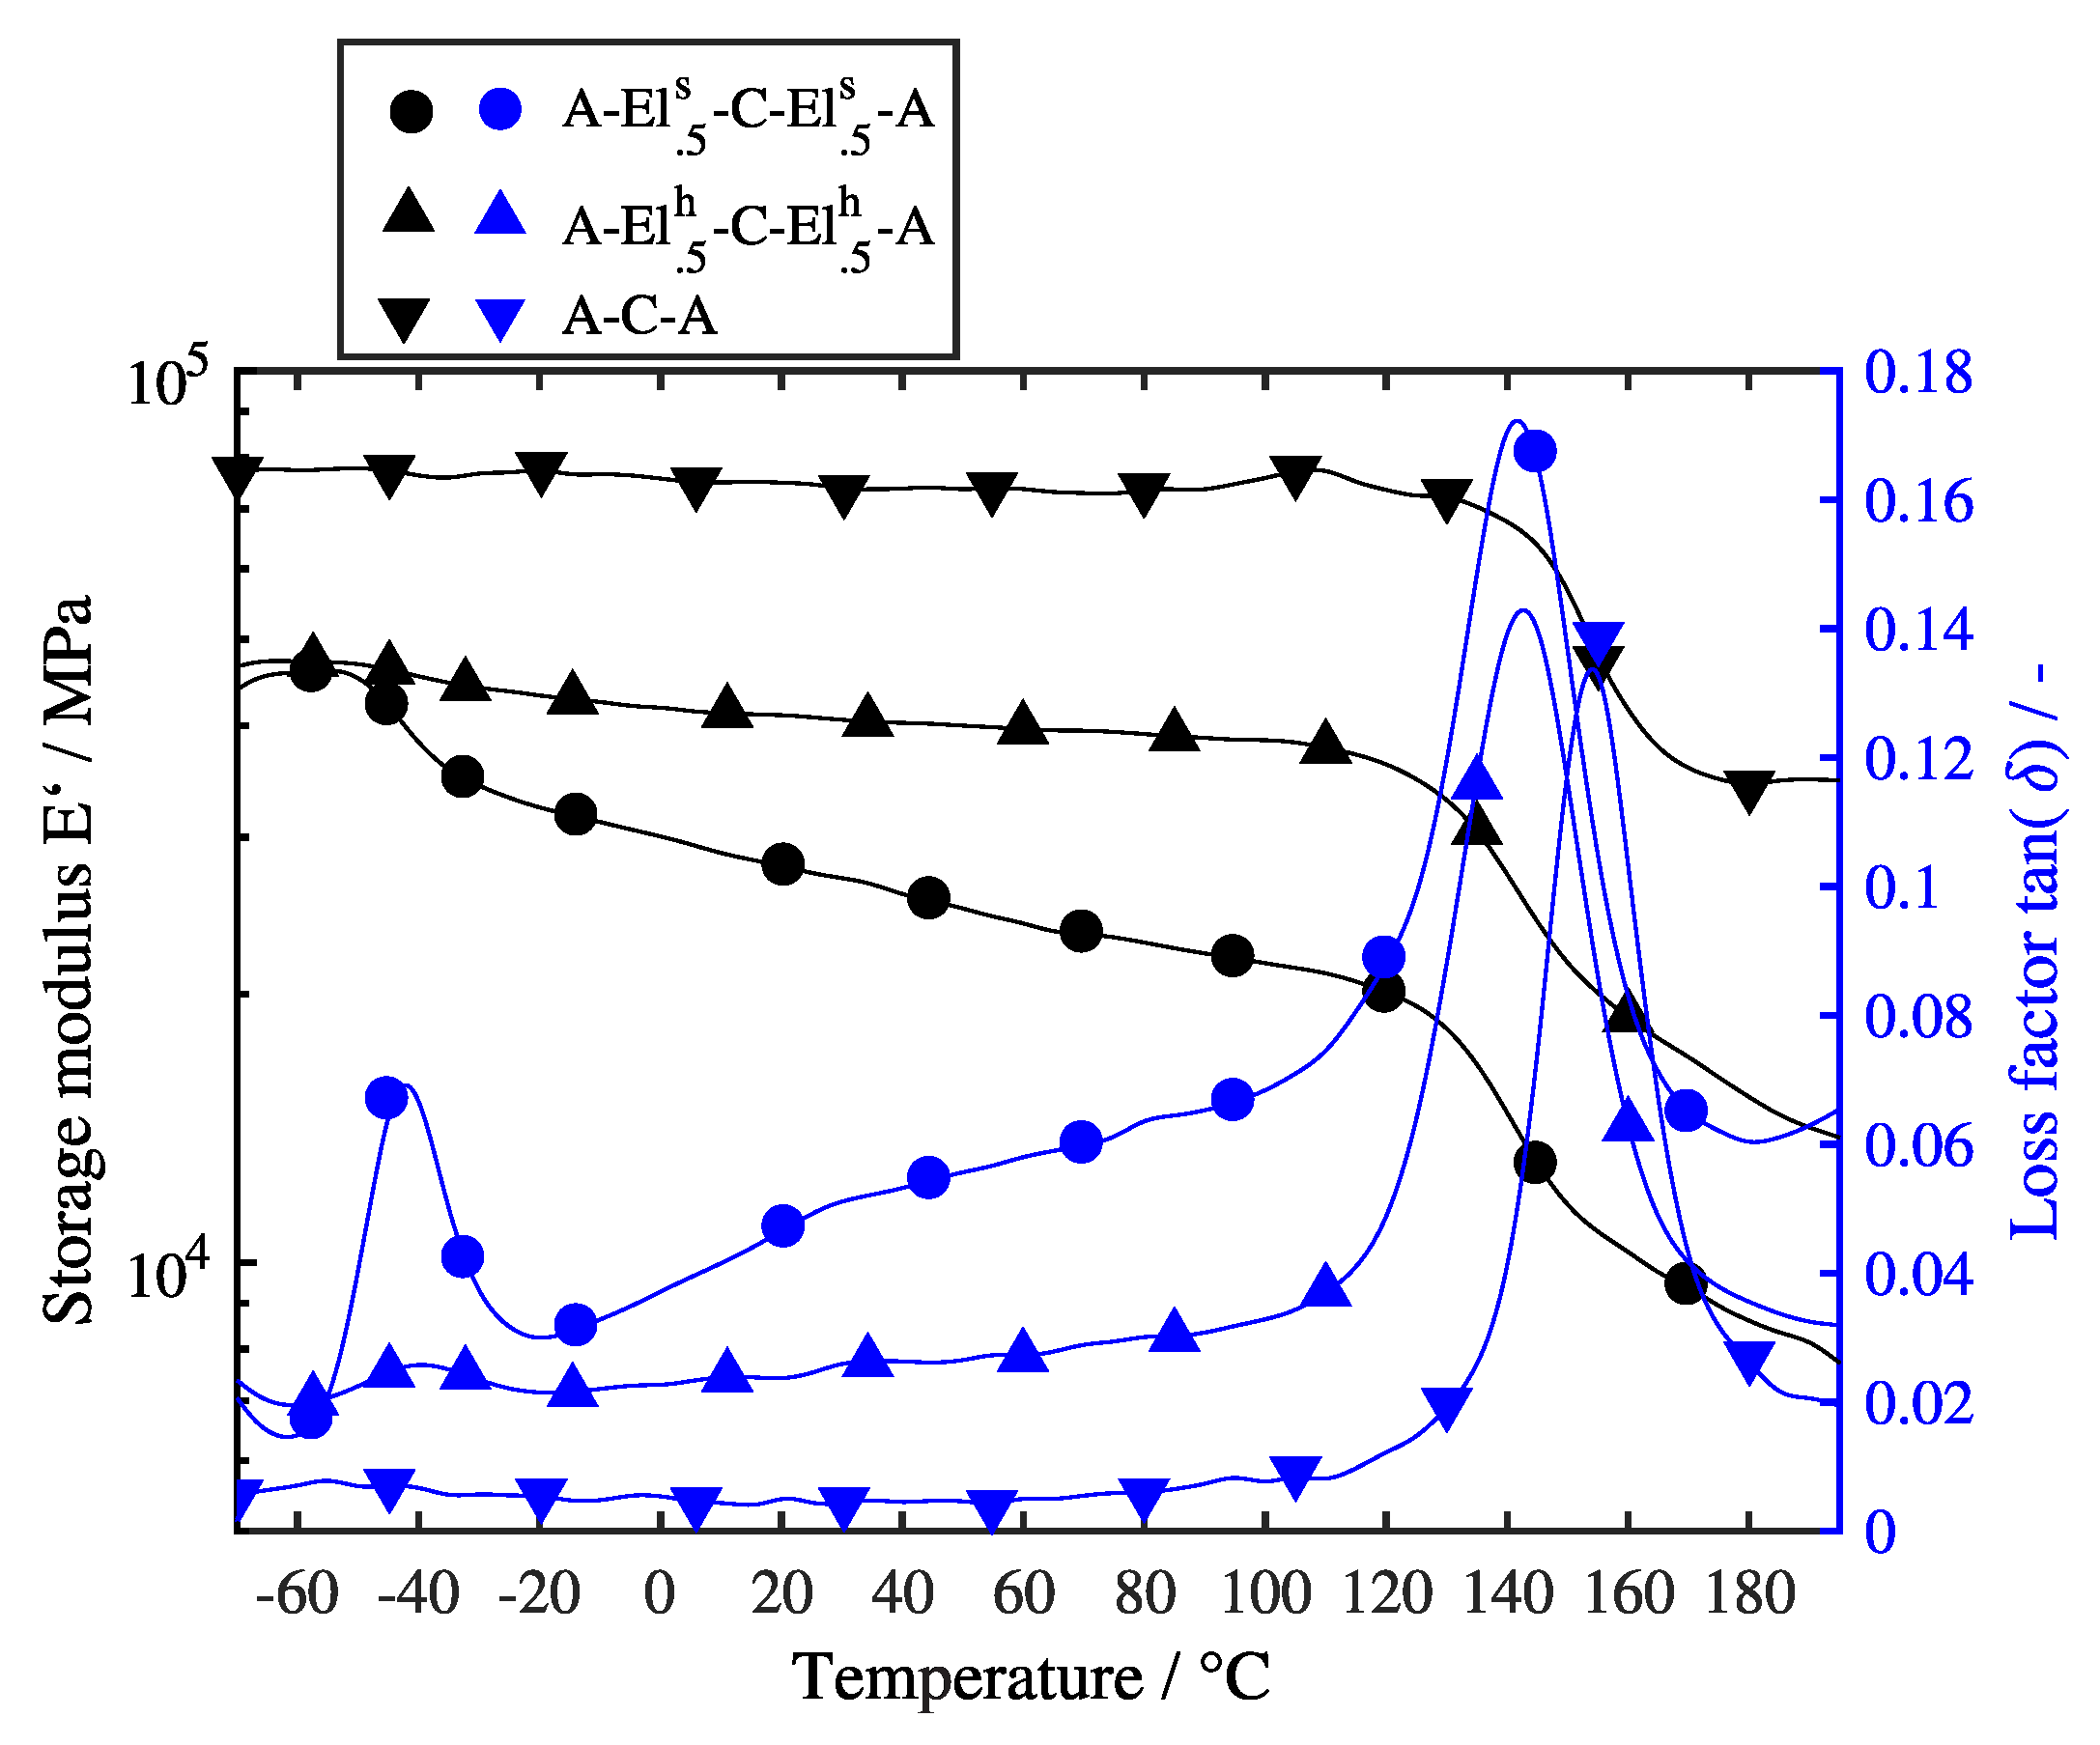
3.2.1. Temperature Sweep

The results of the 3PB temperature sweeps and a frequency of 1 Hz on the hybrid specimens can be seen in Figure 5 for the specimens with CFRP on the outer layers. For a better visibility only fewer markers are displayed as the measurements were carried out every 2.5 C and 5 C, respectively. The solid lines represent fits of all values. It can be seen that there is a strong temperature dependency of the storage modulus and the damping. The specimen with no additional elastomer layer (C-A-C) showed the stiffest behavior, but also the lowest loss factor with one single tan( δ ) peak at the glass transition range of the CFRP at around 135 C. The additional 0.05 mm thick elastomer layer in the C- El . 05 s -A- El . 05 s -C specimen lead to a decrease in storage modulus. Especially for elevated temperatures above 40 C a stronger decrease in storage modulus with a simultaneous increase of the loss modulus was observed. A distinct loss factor peak for the elastomer glass transition was only observed for the specimens with the soft elastomer and a thickness of 0.5 mm or 0.65 mm. It should be noted, that for these two lay-up configurations the storage modulus for the thicker elastomer layer (C- El . 65 s -A- El . 65 s -C) was higher than for the thinner elastomer layer (C- El . 5 s -A- El . 5 s -C) below the glass transition of the elastomer at −47.6 C. Above the glass transition of the elastomer this behavior inverts. However, the loss factor is always higher for the thicker elastomer layer. Figure 6 shows the values of storage modulus and loss factor at room temperature. In addition to the complete DMA test program two specimens of each lay-up were tested only at room temperature and a frequency of 1 Hz to decrease the testing effort but increase the statistical validation. It can be seen that with decreasing storage modulus the loss factors increased.
Figure 7 shows the temperature sweeps for the specimens with aluminum on the outside and Figure 8 displays their values of storage and loss modulus at room temperature and 1 Hz with two additional specimens tested only at this temperature. Again the lay-up without elastomer showed the highest storage modulus and lowest loss factor over a broad temperature range of −70 C to about 110 C. The single peak in loss factor marks the glass transition of the CFRP. The specimens with the hard elastomer (A- El . 5 h -C- El . 5 h -A) showed a small peak in loss factor at −40 C with a generally higher loss factor, compared to the lay-up without elastomer. The loss factor also remains in a small range up to a temperature of 110 C, until the glass transition range of the CFRP is reached. Only for the soft elastomer a strong temperature dependency can also be seen below the glass transition of the CFRP. The glass transition of the soft elastomer results in a loss factor peak at −42 C and a constant increase of the loss factor over the temperature range between −20 C and 110 C.
When comparing the different lay-up configurations, with the same elastomer thickness and stiffness from Figure 5 and Figure 7 the specimens with aluminum on the outsides showed higher storage moduli and loss lower factors.

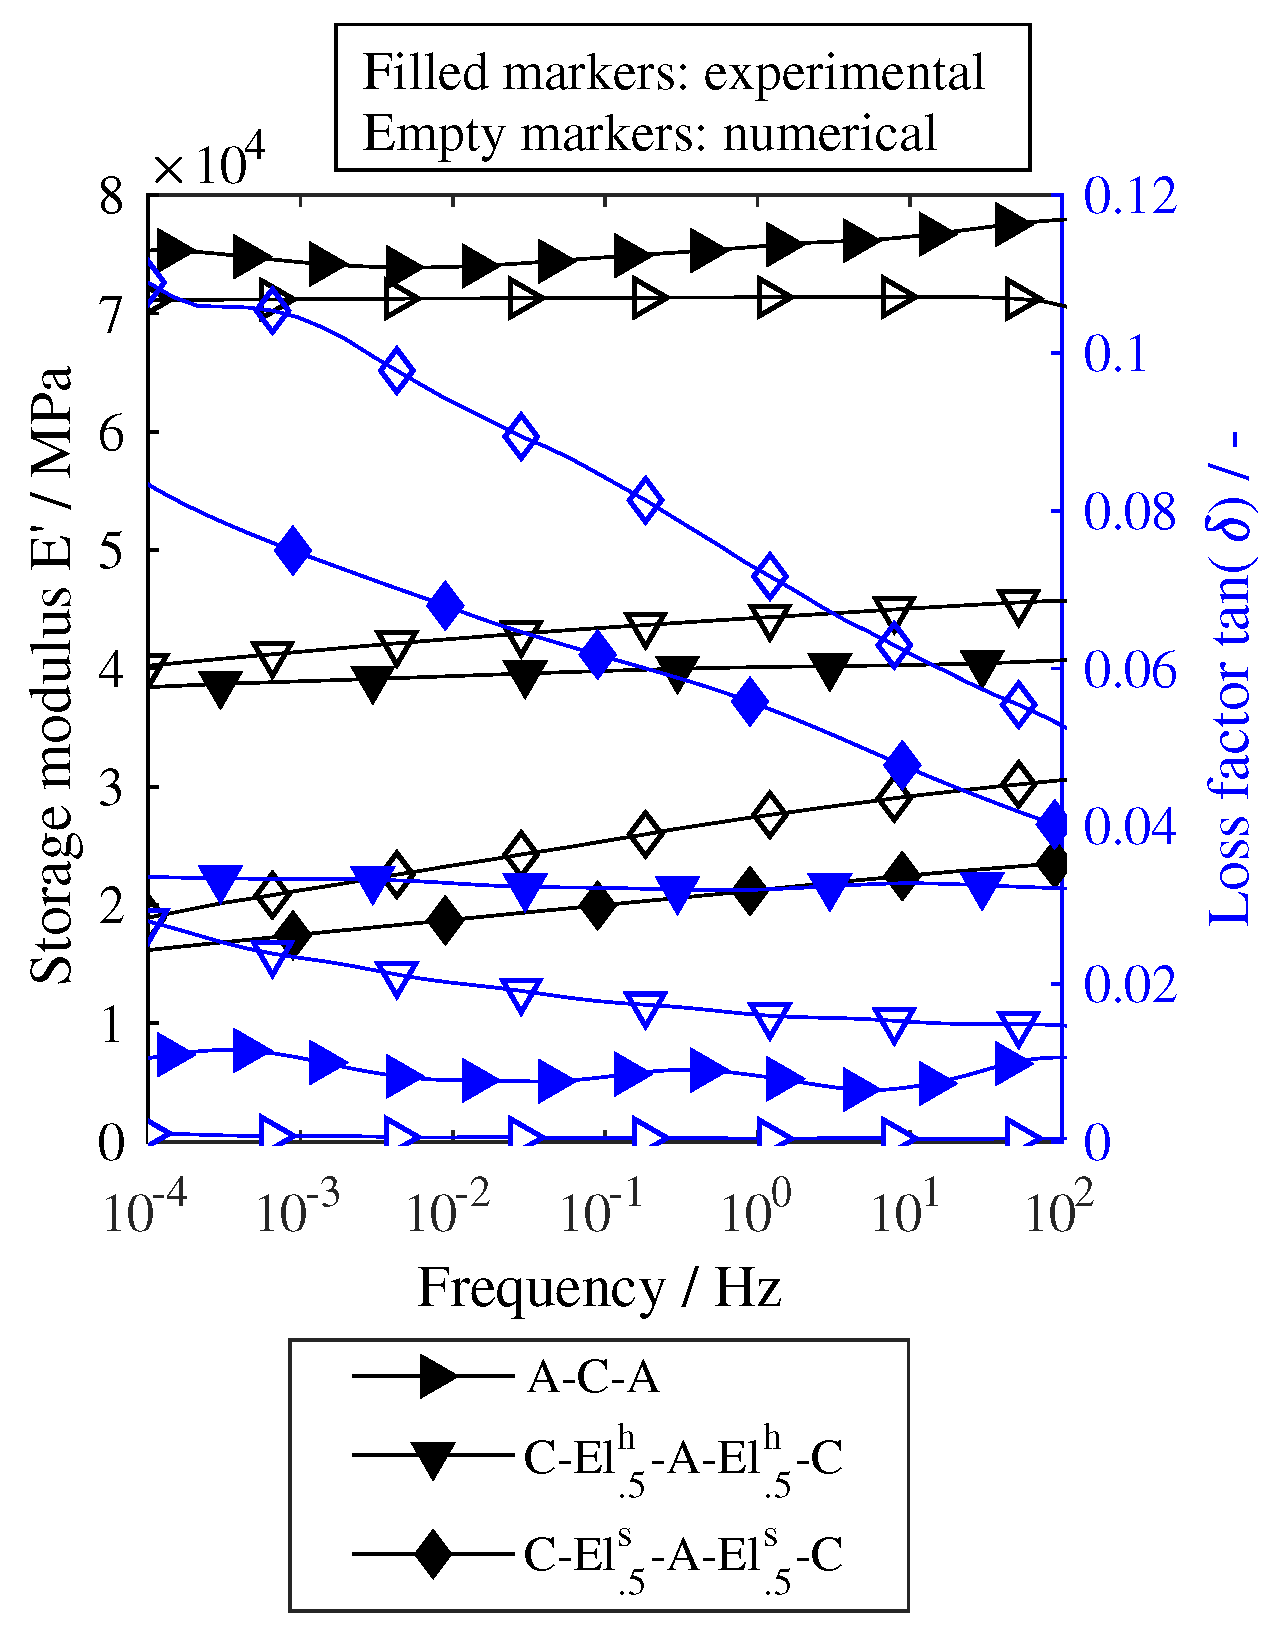
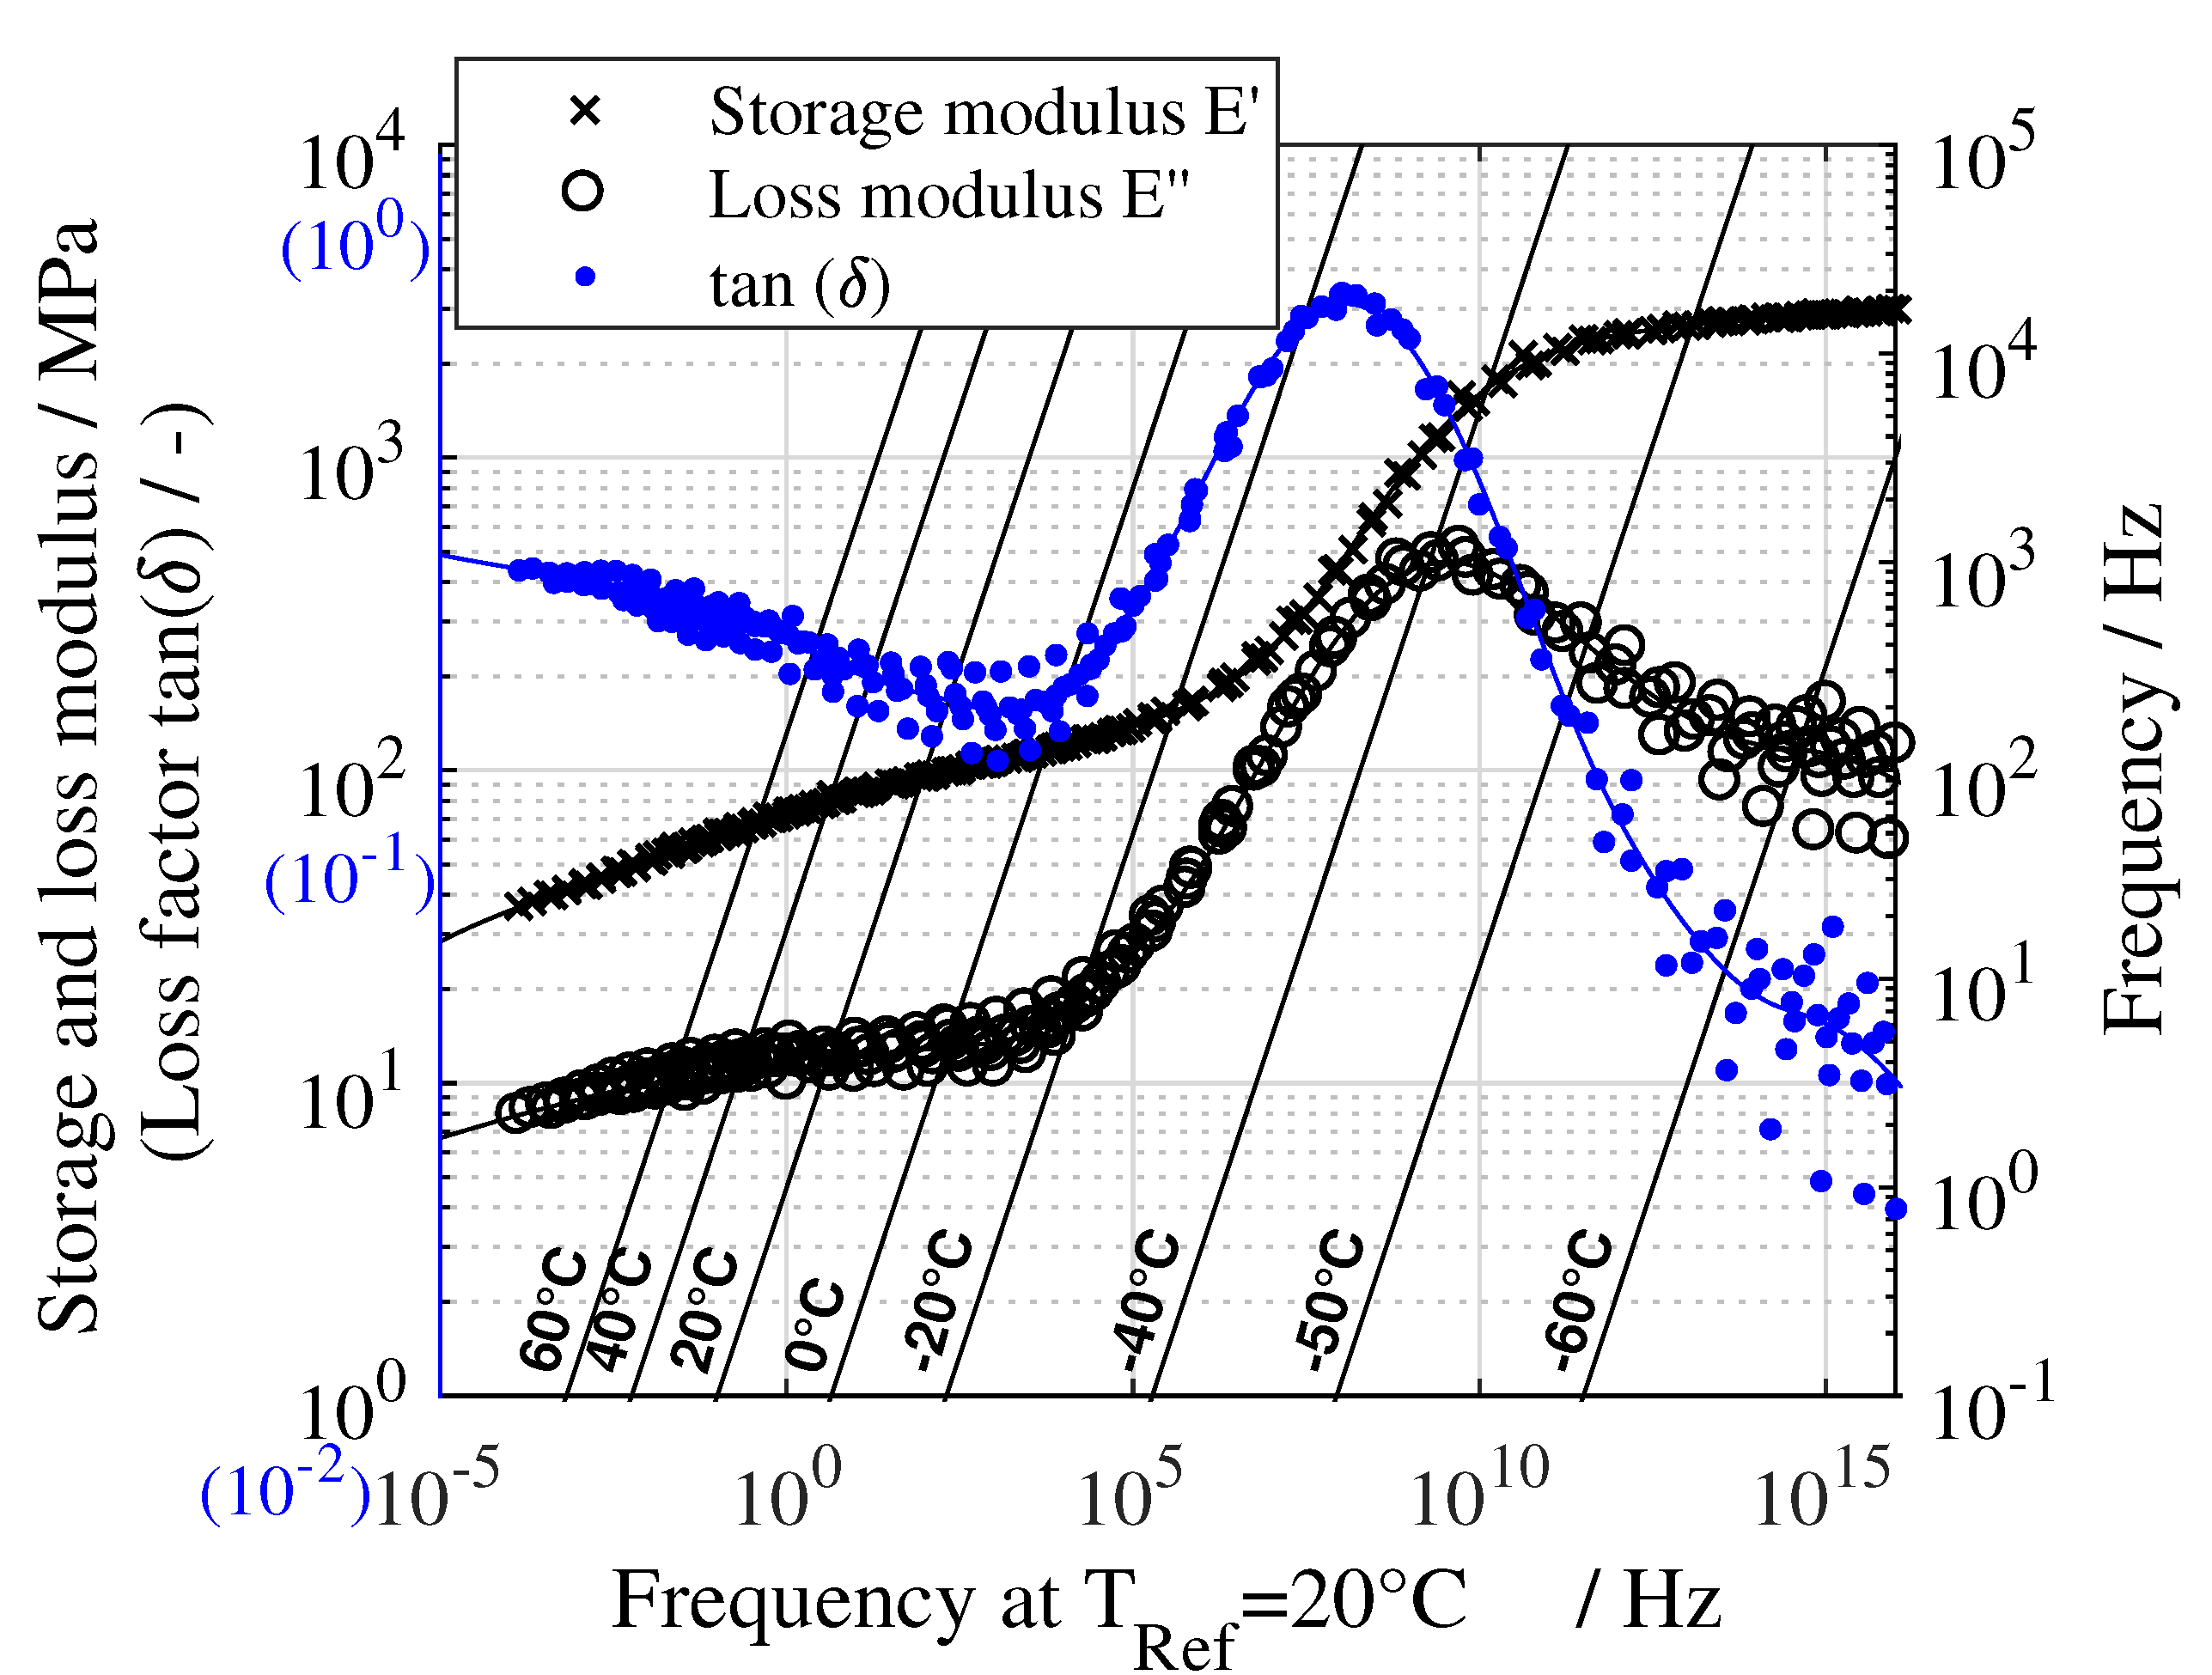
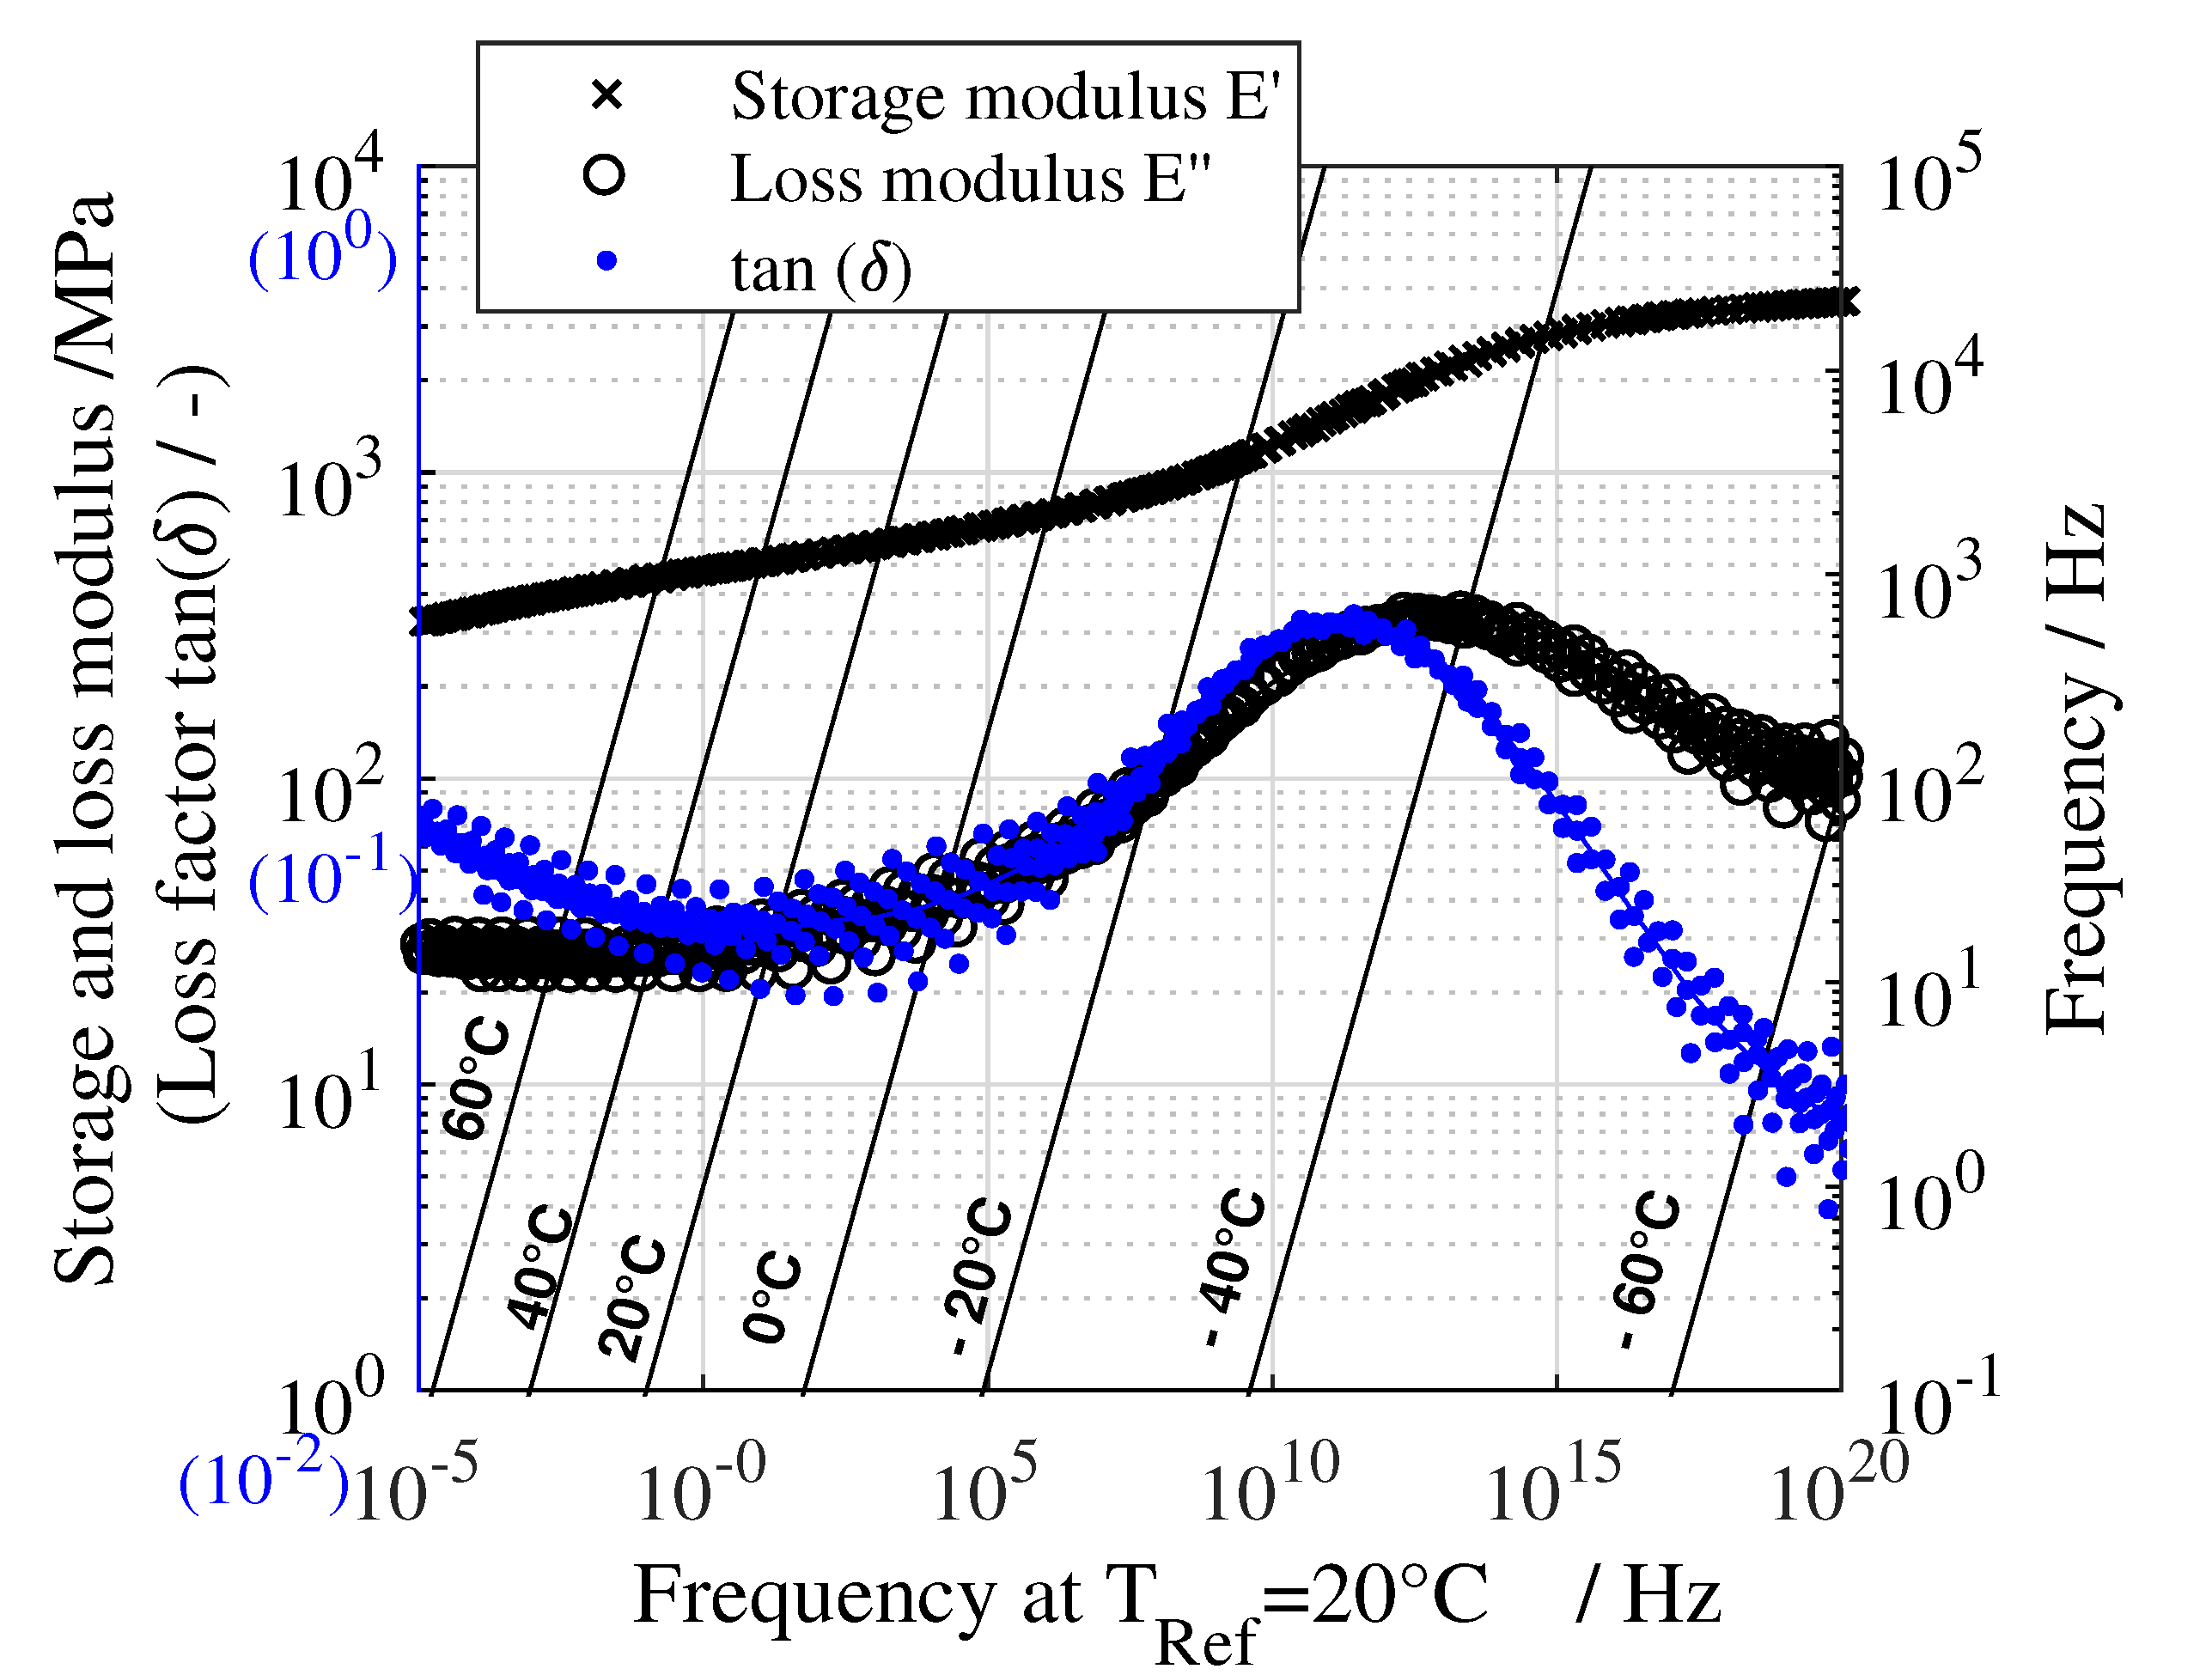
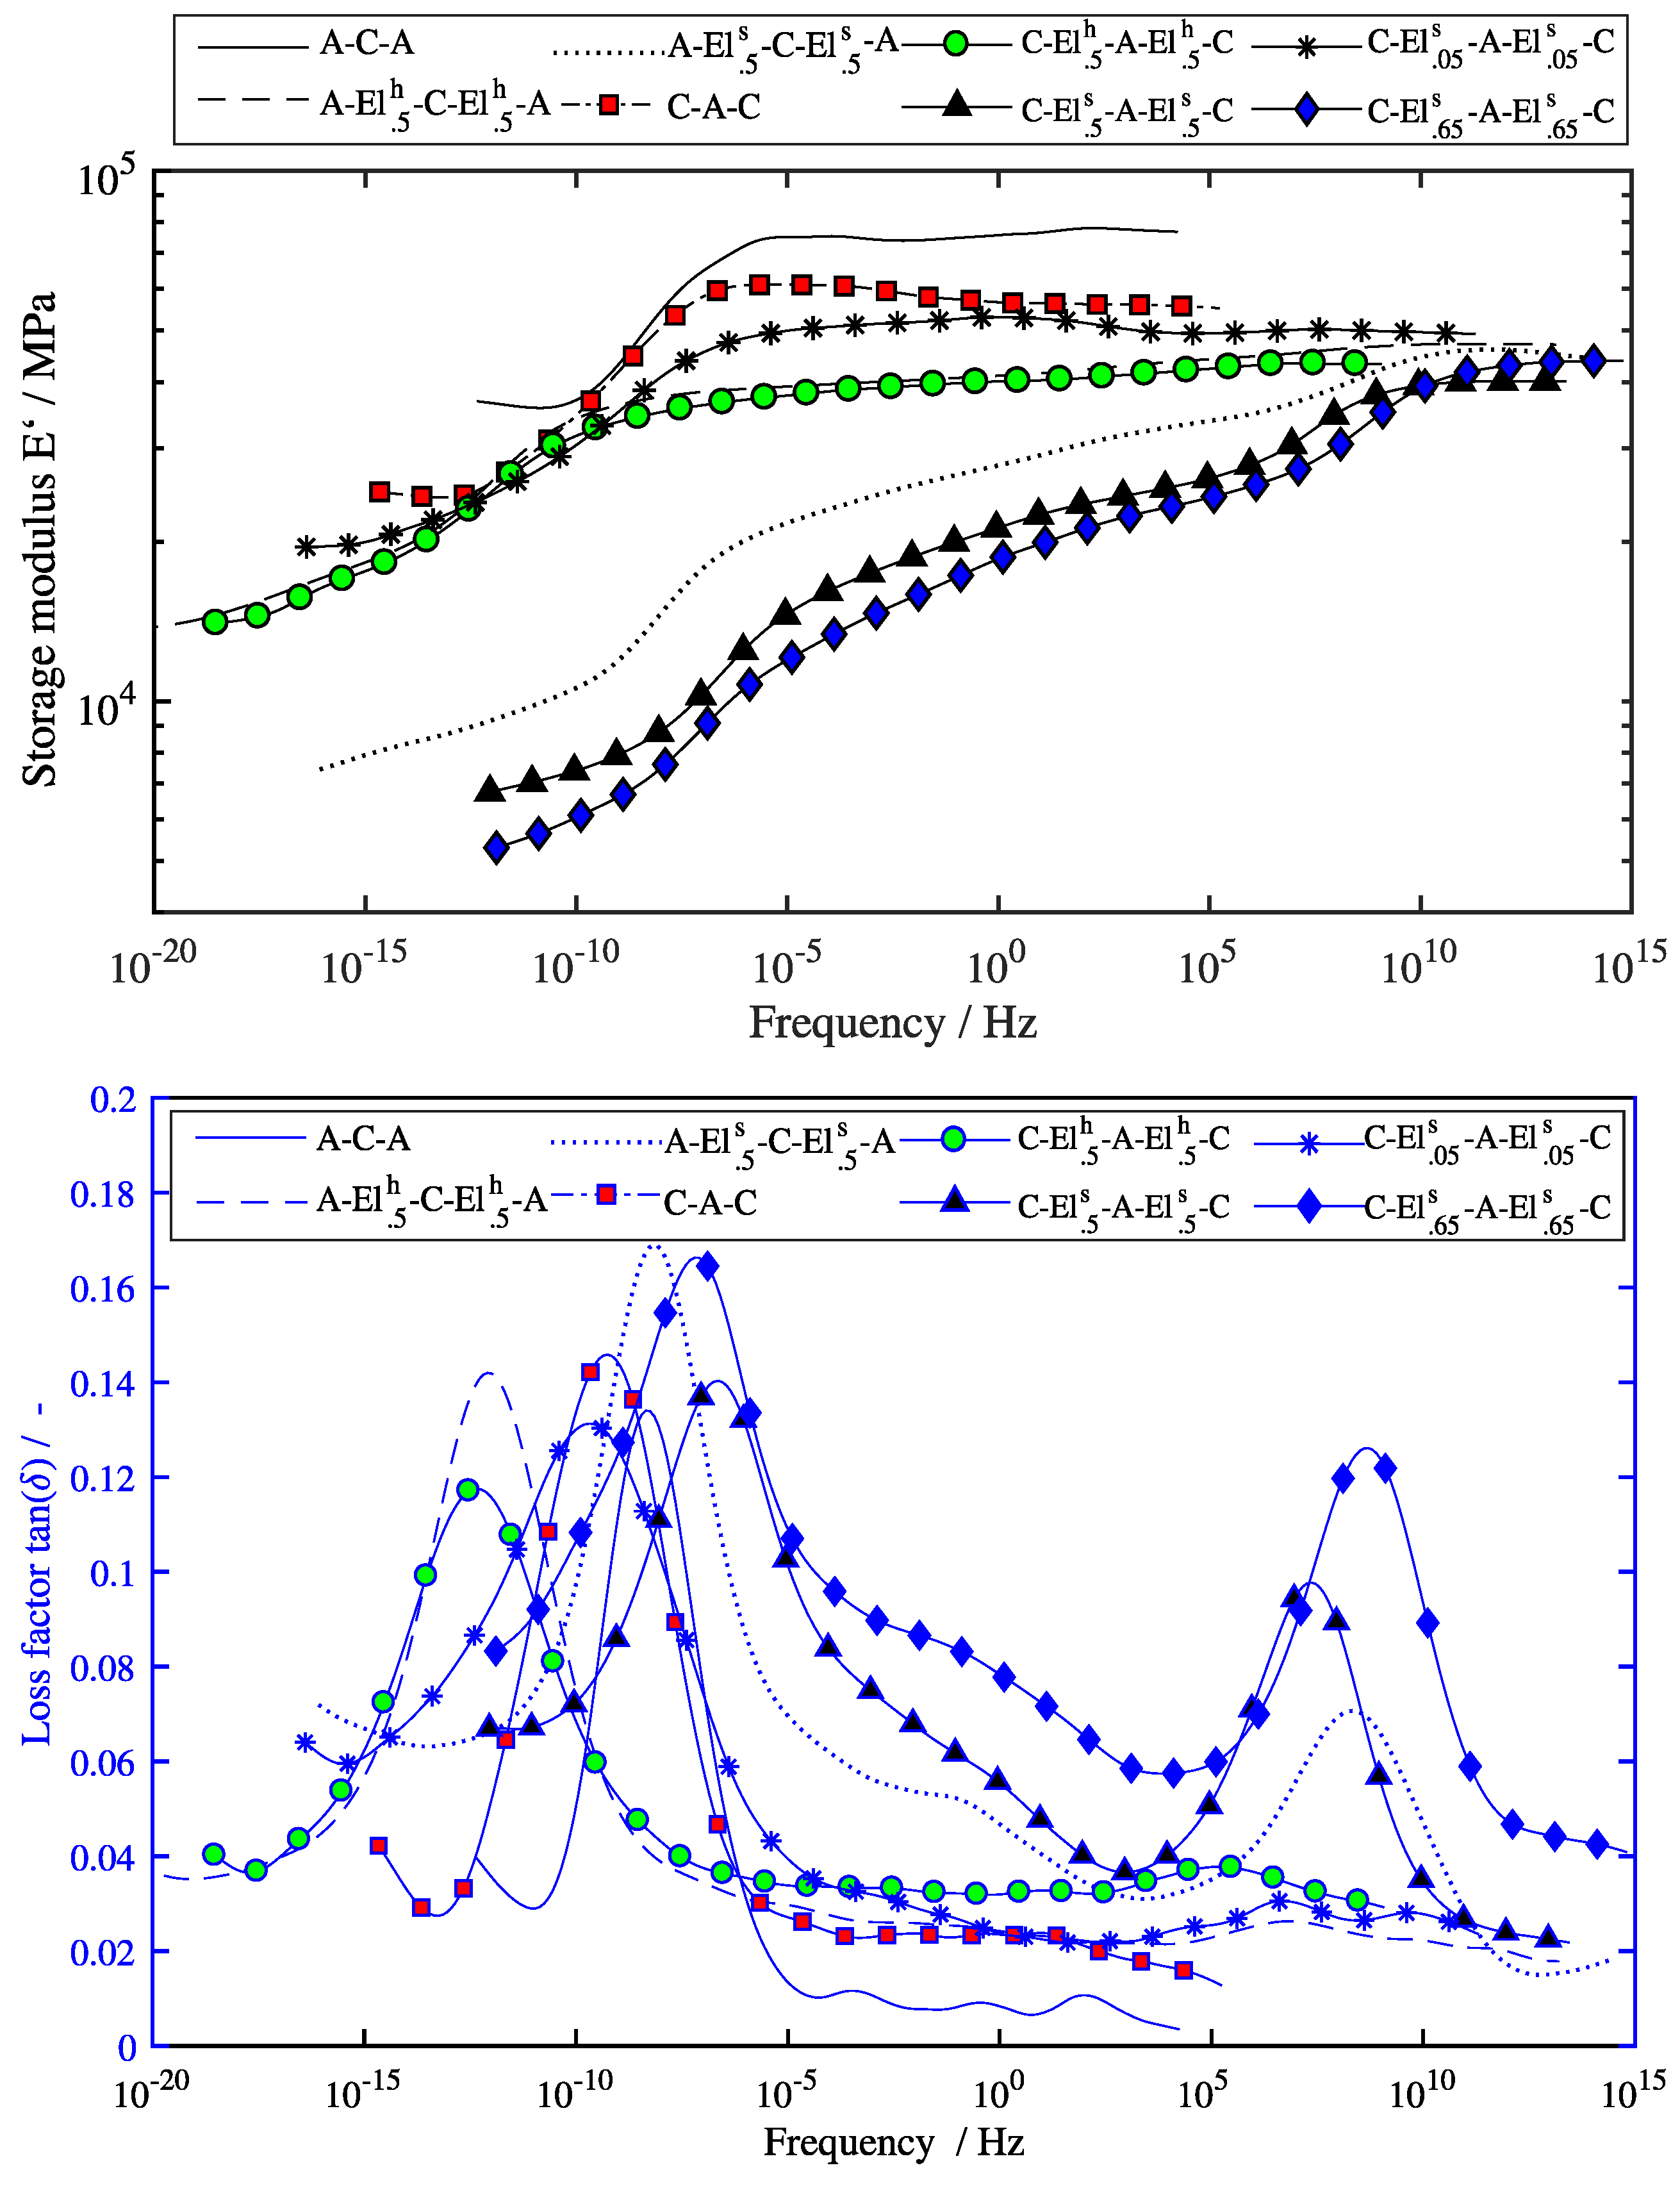
3.2.2. Master Curves

To analyze the frequency dependent damping behavior, master curves were generated at reference temperatures of −40 C, 20 C and 60 C. To be able to compare the different lay-ups the results for each temperature are plotted in one graph for all specimens. It has to be noted, that due to different temperature dependencies of the hybrid specimens the presentation of more than one FMEL in a single frequency nomogram cannot be displayed clearly due to different isotherm lines of each lay-up. Hence, master curves at distinct reference temperatures Tref are chosen to characterize the frequency-dependent behavior.
Figure 9 shows all master curves for a reference temperature of 20 C. The figure shows the fitted master curves with few markers for better visibility. Each curve consists of as many values as the curves of the frequency nomograms in Figure 3 and Figure 4. The master curves show an inverted behavior compared to the temperature sweeps in Figure 5 and Figure 7. It can be seen, that the frequency dependency is of different magnitude for the different lay-ups. As the frequency increases to values of 105 Hz–1010 Hz, the glass transition of the elastomer is responsible for the damping peak and the increase in stiffness. If the frequency decreases to values of 10 7 Hz , the glass transition of the CFRP results in larger loss factor peaks and the decrease in stiffness. However, the frequencies at which these glass transitions have an effect are far from frequencies which occur in most technical applications.
Figure 10 shows the master curves for a reference temperature of −40 C and +80 C. Here, only a small frequency range from 10−4 Hz to 104 Hz is shown which is thought to cover most technical applications. It should be noted, that depending on the selected reference temperature, the master curves have a different position to each other on the horizontal frequency axis. This can be seen, for example, in Figure 9 and Figure 10 on the loss factor peaks for the laminates with soft elastomer (A- El . 5 s -C- El . 5 s -A, C- El . 5 s -A- El . 5 s -C, C- El . 65 s -A- El . 65 s -C). While the glass transitions for a reference temperature of −40 C occur at the same frequency (Figure 10a), they are slightly offset for T ref = 20 C (Figure 9). However, it can be seen, that in the selected frequency range from 10−4 Hz to 104 Hz for the temperatures −40 C and 80 C the loss factor is much more affected by the glass transitions of either the CFRP or the elastomer than for T ref = 20 C.

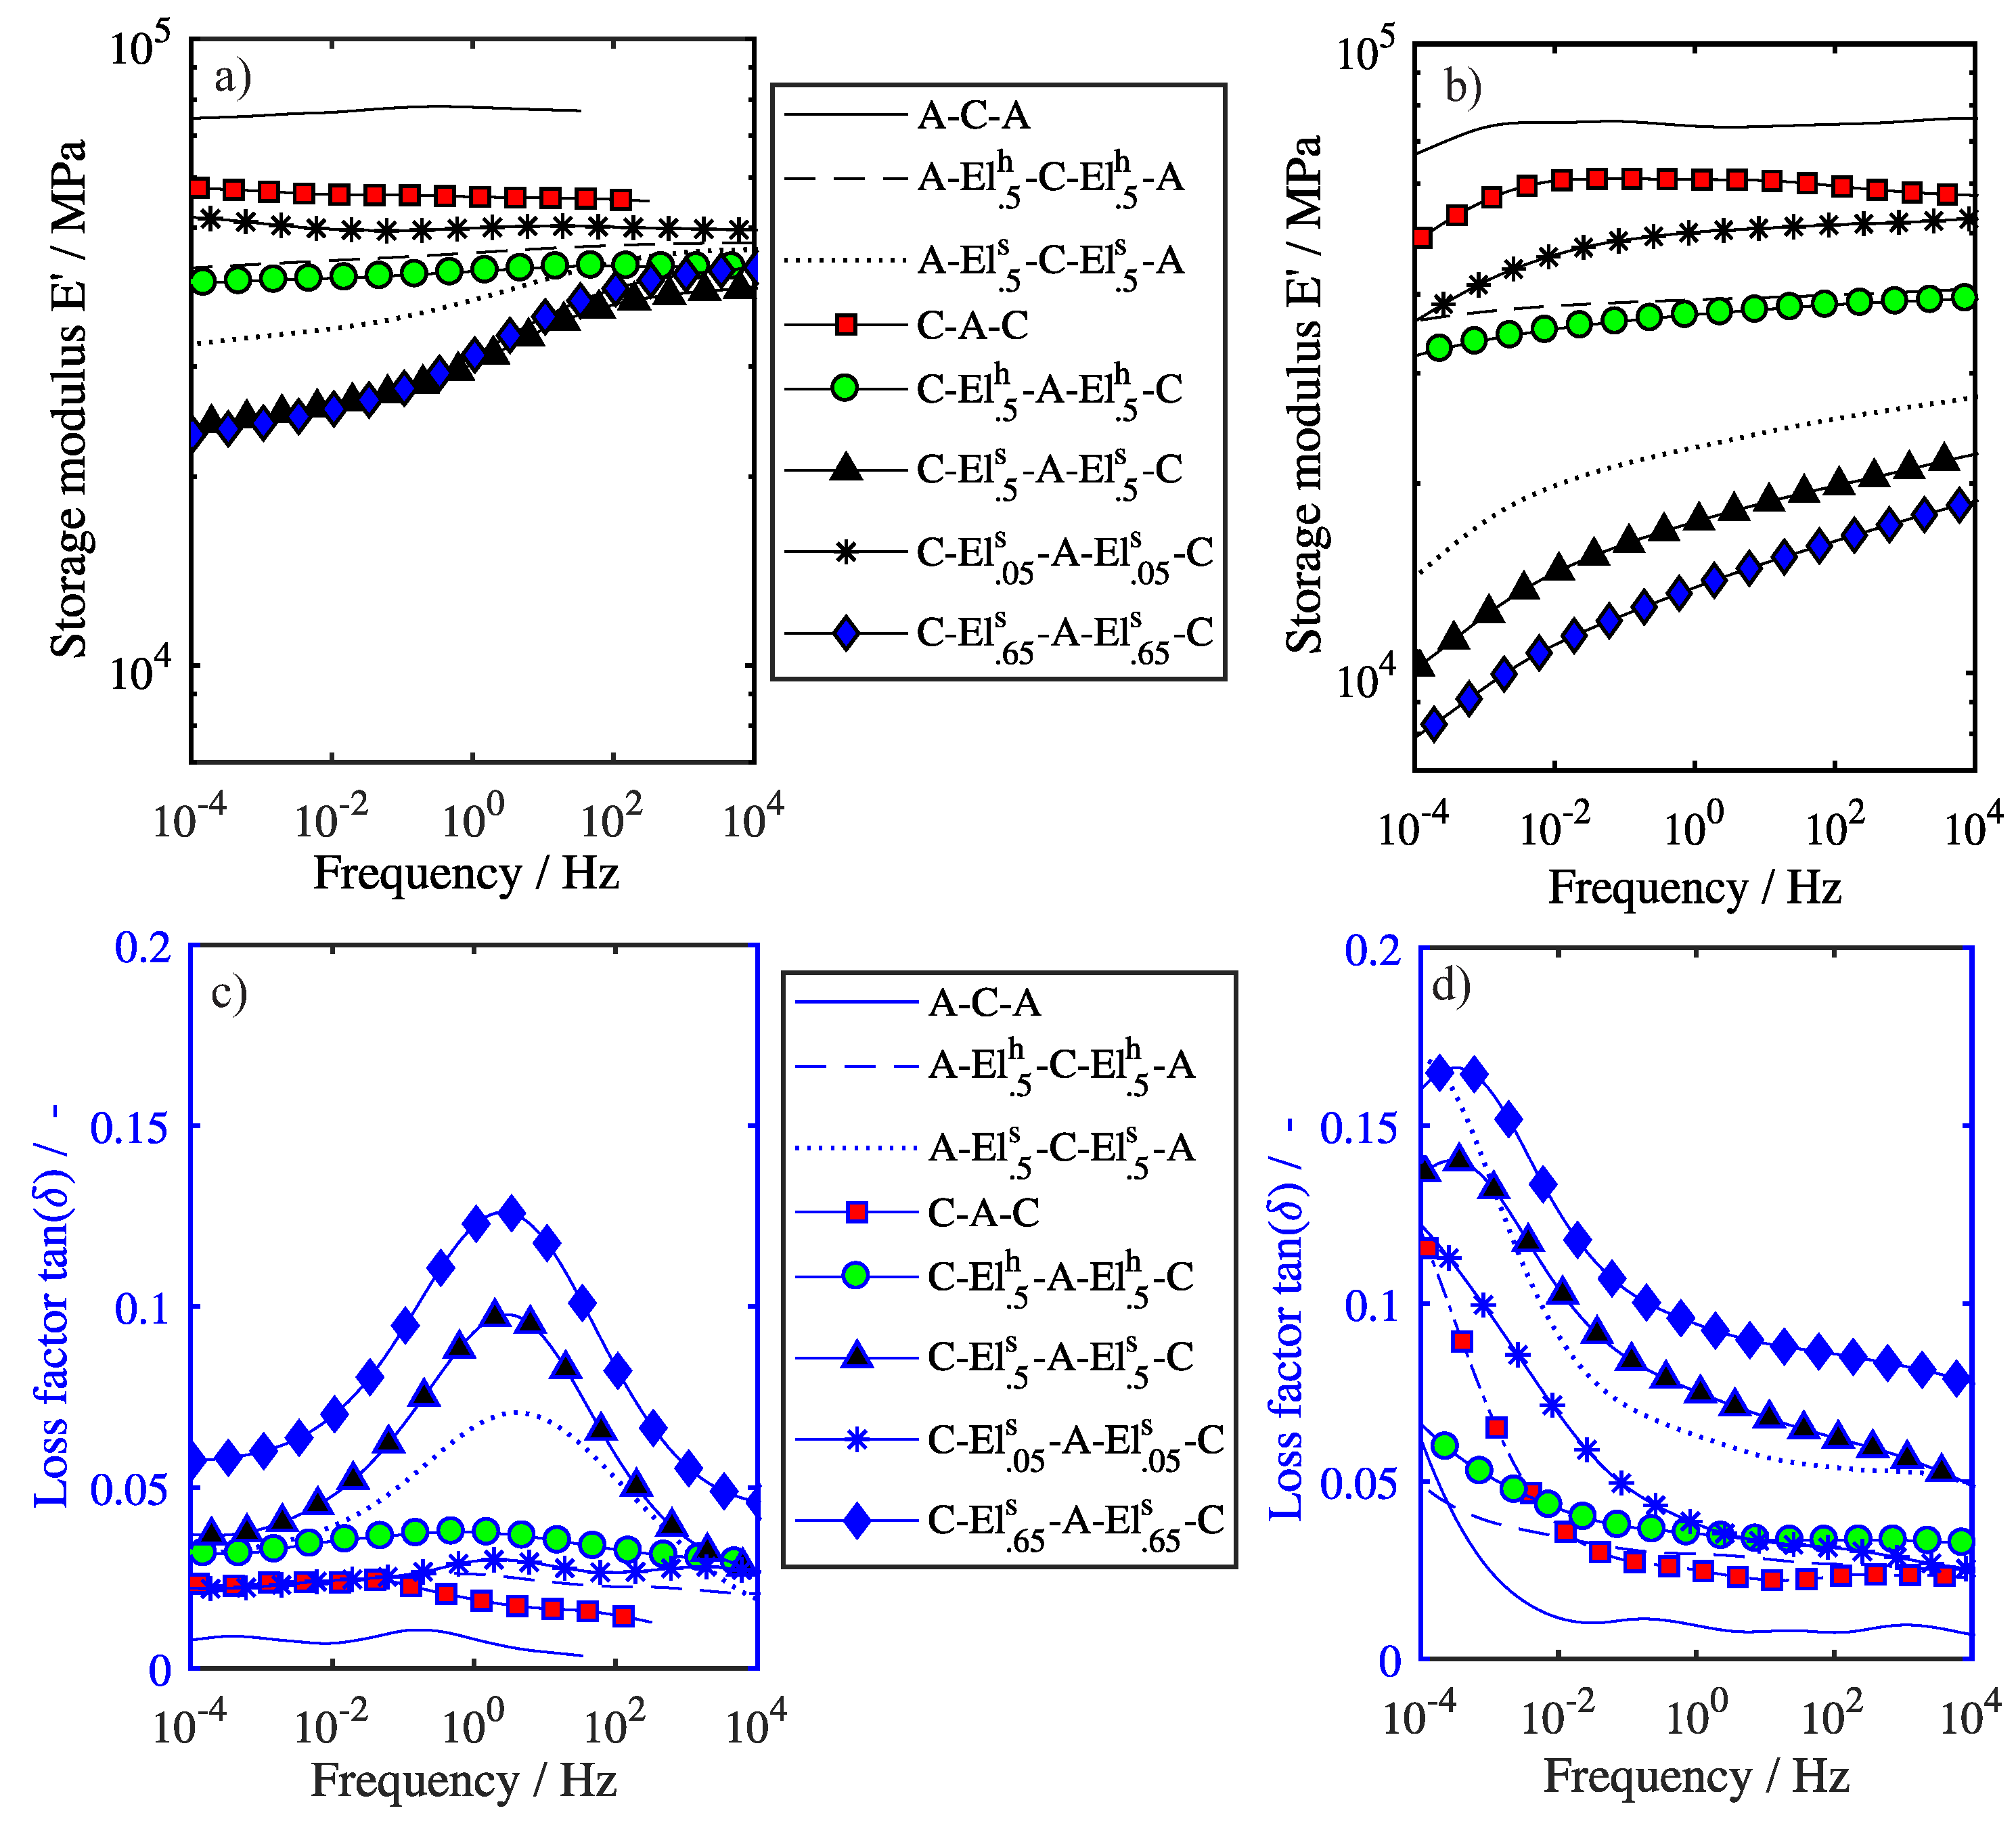
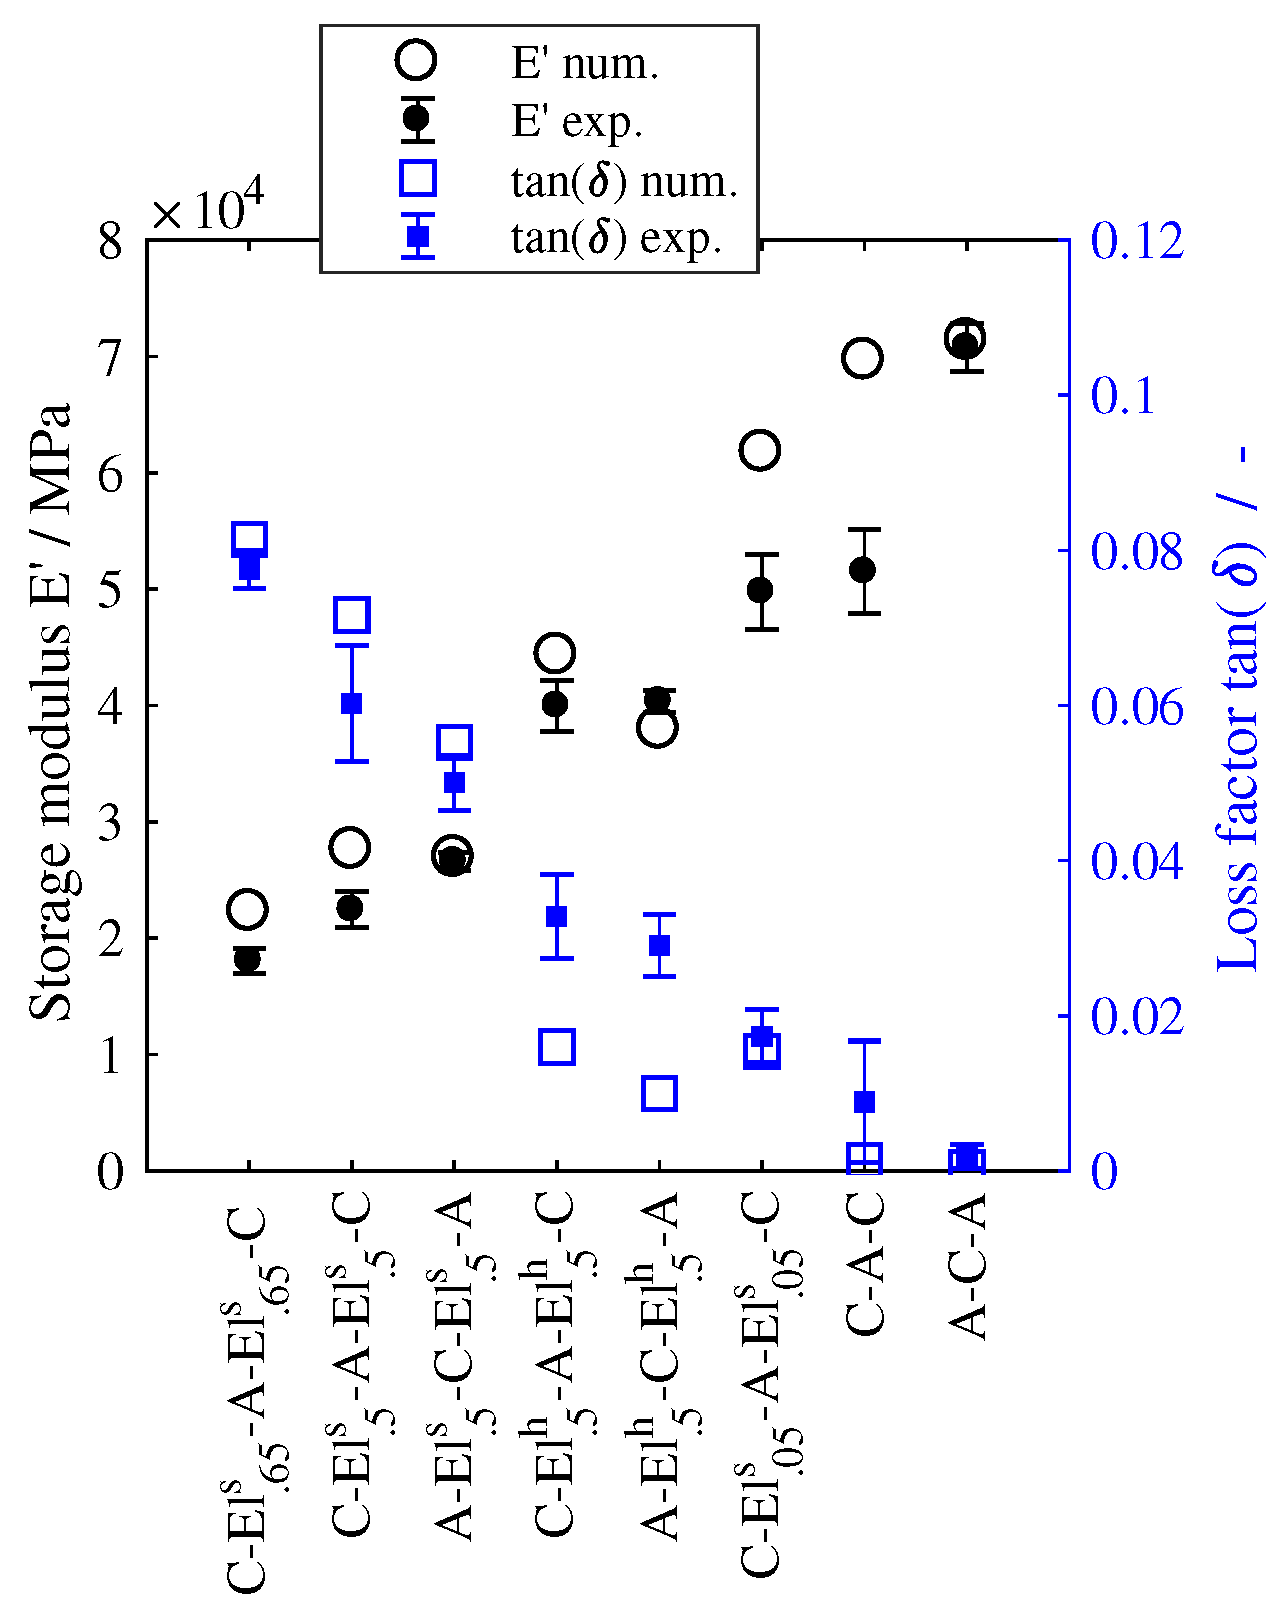
3.2.3. Finite Element Modeling

The results from the numerical modeling described in Section 2.2.3 for a frequency of 1 Hz and a temperature of 20 C can be seen in Figure 11. The results are sorted by increasing storage modulus of the experimentally determined data. It can be seen, that the storage modulus of the experimentally and numerically determined data are in good accordance, except for the C- El . 05 s -A- El . 05 s -C and the C-A-C specimens. Here, an approximately 20% higher storage modulus is predicted by the simulation. For the specimens with the hard elastomer C- El . 5 h -A- El . 5 h -C and A- El . 5 h -C- El . 5 h -A the deviation in storage modulus is less than 10%, however, the loss factor is underestimated by more than 50%. This suggests that the DMA data of the neat hard elastomer shows a higher loss modulus than that of the hard elastomer in the hybrid material. It should also be noted, that the simulation is very sensitive to a change in the loss modulus of the elastomer material.
In addition to the evaluation at 1 Hz also different frequencies in the range of 10−4 Hz to 104 Hz were simulated numerically to compare them to the master curves from the experimental results. It is important to note, that the generation of the master curves for the experimental and the numerical results differs. The experimental master curves were obtained from a shift of the measurements on the hybrid specimens by shifting the behavior of the experimentally tested frequency range from 0.1 Hz to 10 Hz at different temperatures. The numerically determined master curves are calculated from the master curves of the constituents and the specimens were actually excited at the frequency range displayed in the master curve. Because of this reason the numerically determined master curves can only be calculated up to frequencies of a few hundred Hz. Above these frequencies the first natural frequency will be reached leading to different results compared to the shifted experimental curves, which neglect the natural frequencies. In Figure 12 master curves of three different hybrid specimens are shown from the experimental test and the numerical model. It can be seen that the general trend of numerical and experimental curves is similar. The slight offset between the storage moduli remains almost constant over the shown frequency range. The loss factor also shows the same trend for experimental and numerical results, and the dependency on the frequency can be correctly depicted, since the curves have a comparable slope.

4. Discussion

In the following, the effect of temperature and frequency as well as different lay-ups on the damping behavior is discussed. An increase of the damping behavior due to the additional elastomer layer could be proven for all lay-ups and elastomer types over a broad temperature, respectively frequency range by an increase of the loss factor compared to the lay-ups without elastomer. However, the higher loss factor also results in a reduction of the bending stiffness. To be able to describe this influence more accurately, the damping and stiffness values are first compared at room temperature and a frequency of 1 Hz. It is assumed that at this temperature the elastomer is mainly responsible for the damping behavior, since the CFRP at this temperature is still far below the glass transition temperature and also the frequency is not low enough so that creep behavior of the matrix can have a significant effect.

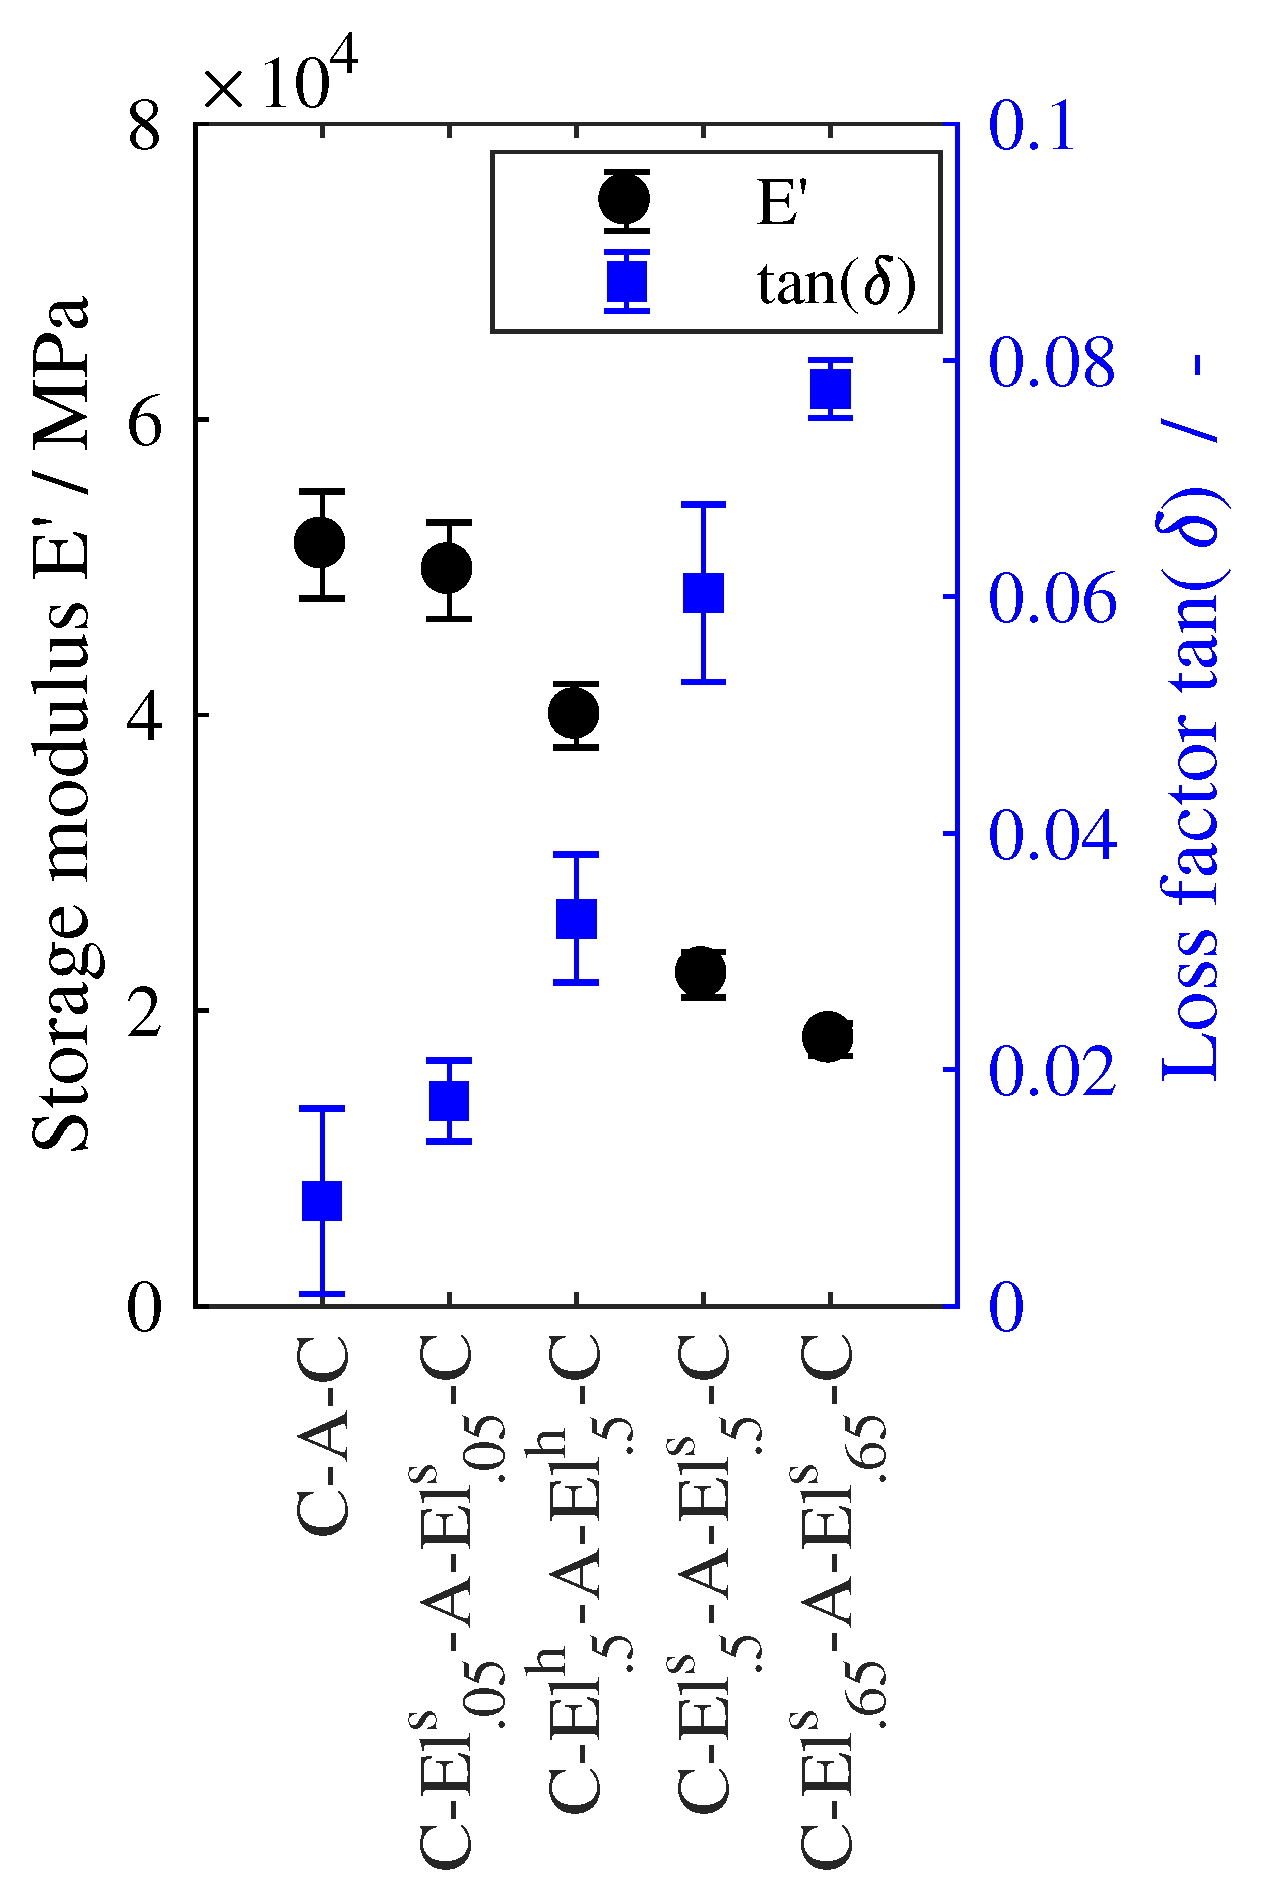
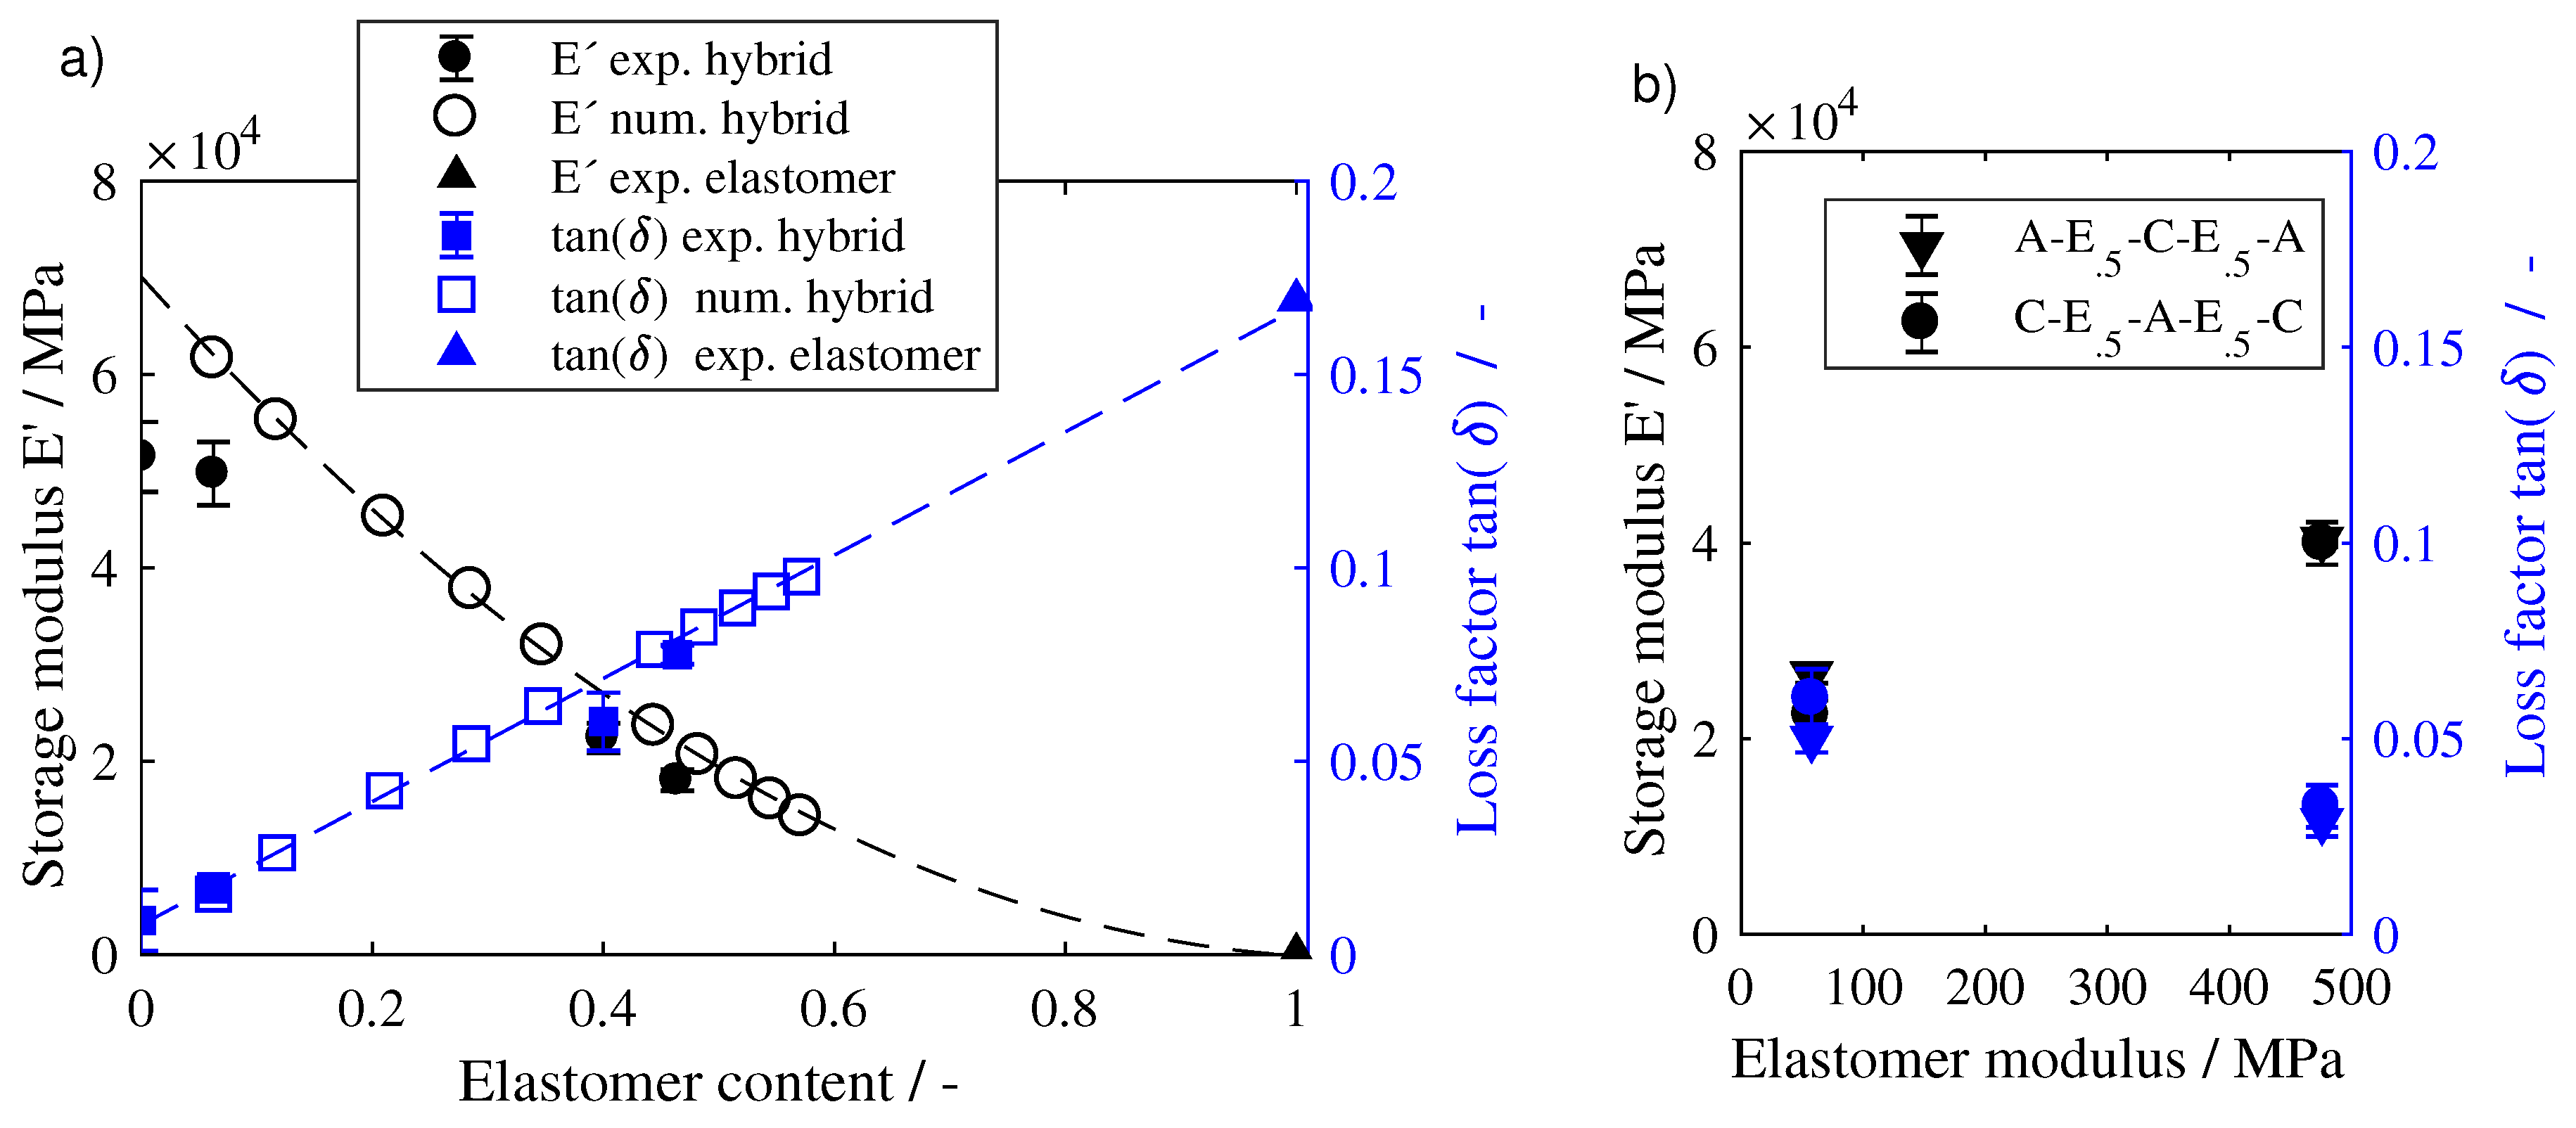
4.1. Influence of Elastomer Content

The influence of the elastomer content is investigated by using the lay-ups with C-A-C structure and the soft elastomer in layer thicknesses of 0.05 mm, 0.5 mm and 0.65 mm as well as the variant without elastomer. Additionally, the results of the numerical parameter study performed with varying elastomer thicknesses from 0.1 mm to 1 mm thickness of each elastomer layer are presented. Figure 13a shows the values for storage modulus and loss factor over the elastomer content, which results from the thickness of the elastomer layer divided by the total laminate thickness. In addition, for a relative elastomer content of one, the values of the neat elastomer from the tensile DMA tests are plotted (triangles). Starting from an elastomer content of zero for the variant without elastomer, a linear increase of the loss factor with increasing elastomer content can be observed for both experimental and numerical results. The values of the loss factor lie on a straight line which meets the loss factor of the neat elastomer at an elastomer content of one. Thus a volumetric mixing rule can be used to roughly determine the loss factor for bending loads. A comparable approach was shown in Sarlin et al. [15], although here the calculation of the mass fractions of the individual constituents provided better results. The decrease of the storage modulus follows a hyperbolic trend, which is slightly overestimated by the numerical simulation compared to the experimental results for low elastomer contents. Again for an elastomer content of one the storage modulus of the neat elastomer is met. As the aluminum and cfrp layers are held constant in thickness, the overall thickness increases with the elastomer content. This leads to a higher bending stiffness due to the increased moment of inertia.

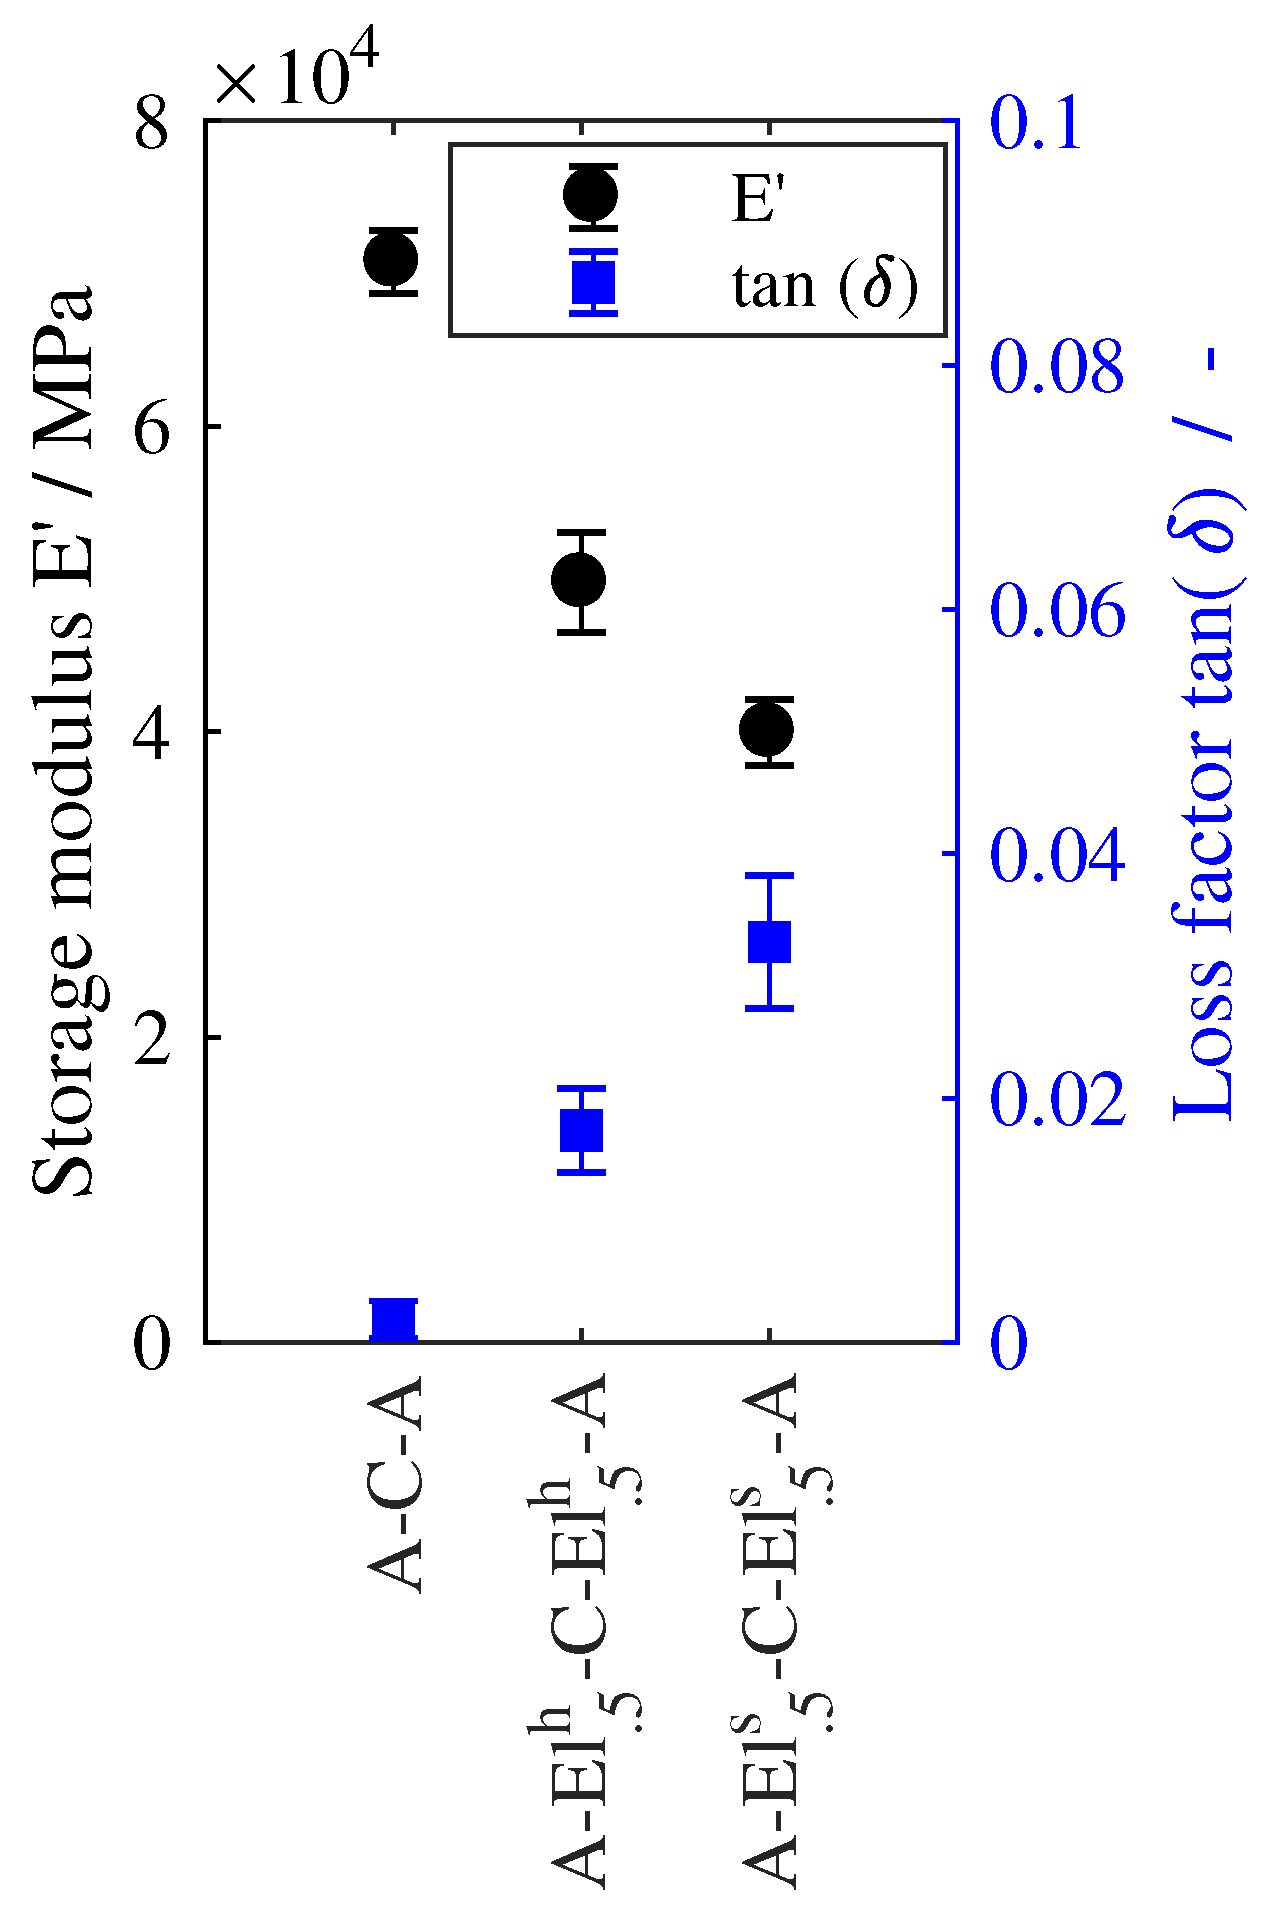
4.2. Influence of Elastomer Modulus

Figure 13b shows all laminates with the same elastomer content ratio of 0.4 (0.5 mm elastomer ply thickness) plotted over the storage modulus of the elastomer at 20 C. Although the loss factor of the soft elastomer at 20 C and 1 Hz is about 3.3 times higher (tan ( δ )E soft = 0.169) than for the hard elastomer (tan( δ )E hard = 0.056), the loss factor of the hybrid specimens with the soft elastomer is only about 1.8 times the loss factor of the hybrid with the hard elastomer. Hence, in the hybrid lay-up the difference in elastomer loss factor has less influence on the overall loss factor, than for the neat elastomer. If one compares the values for storage modulus and loss factor of the hard hard elastomer in the C- El . 5 h -A- El . 5 h -C lay-up from Figure 13b with those in Figure 13a, it can be seen that the same storage modulus can be achieved in a laminate with a soft elastomer, with an elastomer content of about 20%. However, since this laminate is thinner, the bending stiffness is still lower due to the lower moment of inertia. The same bending stiffness with the soft elastomer, as with the hard elastomer at a layer thickness of 0.5 mm, can be achieved for an soft elastomer content of about 60% (elastomer layer thickness of 1.125 mm). With this elastomer thickness a loss factor of about 0.1 would be achieved. Hence, by switching the elastomer from 0.5 mm thick, hard elastomer layers to the soft elastomer, an increase of the loss factor by 300% can be achieved. However, the mass will also increase by about 35% if a comparable bending stiffness is aspired.

4.3. Influence of Lay-up

The influence of the lay-up is also discussed in Figure 13b. While no significant difference can be measured for the two variants with the hard elastomer, the soft elastomer shows a lower damping behavior for the A- El . 5 s -C- El . 5 s -A lay-up compared to the C- El . 5 s -A- El . 5 s -C lay-up. The reason for this is believed to be the more uneven nominal layer thickness of CFRP and aluminum in this configuration. The maximum shear in the elastomer and thus the maximum damping capacity is achieved if the base layer and the constraining layer have the same stiffness and thickness [10]. Since the thicknesses of the CFRP and aluminum layers in the A- El . 5 s -C- El . 5 s -A structure (CFRP: 0.9 mm, AL: 0.3 mm) differ more than in the C- El . 5 s -A- El . 5 s -C lay-up (CFRP: 0.6 mm, AL: 0.3 mm), a higher shear in the elastomer is achieved with the same deflection in this lay-up.

4.4. Influence of Temperature

It should be noted that all the effects described above which improve the damping behavior at the same time result in a decrease in stiffness. If the temperature changes towards the glass transition point of the elastomer, however, both the stiffness of the laminate and the loss factor can be increased. Therefore a broad glass transition region is preferable. A broadening of the transition region can also be achieved by combining different elastomers in the lay-up. Due to the strong increase in the storage modulus of the elastomer below the glass transition point, the deformation behavior of the laminates also changes here. If one compares the temperature dependency of the C- El . 5 s -A- El . 5 s -C and the C- El . 65 s -A- El . 65 s -C lay-ups in Figure 5, it can be seen that the storage moduli below the glass transition of the elastomer are reversed. Since the CFRP layers are further away from the neutral axis at an elastomer thickness of 0.65 mm and shear forces can be effectively transmitted by the stiffer elastomer, hence the thicker lay-up has a higher storage modulus at low temperatures. Interestingly, at these temperatures the loss factor is also higher than at a lower elastomer content. Compared to the C- El . 5 h -A- El . 5 h -C lay-up the stiffness is at a comparable value but the loss factor is about 25% higher with a value of tan( δ ) = 0.4 compared to tan( δ ) = 0.3 for the thick soft elastomer.

4.5. Influence of Frequency

The influence of frequency on the damping behavior is, as explained in Section 3.2.2 derived from master curves. The frequency dependent damping behavior is influenced by the viscoelasticity of the elastomer and the epoxy resin of the CFRP. These two materials have different temperature dependencies, hence show different effects on the master curves. It should be noted, that a warming of the specimens due to the excitation at higher frequencies was not tracked during the DMA, however less than 100 cycles were performed for each frequency to keep heating minimal.
At a reference temperature of 20 C the CFRP is far below its glass transition, hence the damping is mostly affected by the elastomer. In addition, Nakano’s suggestion [22], that in a multi-phase system only one material may show a temperature dependence for the applicability of the TTS can be considered valid in this temperature range. If one compares the curves of the temperature sweeps of the C-A-C and the A-C-A lay-ups in Figure 5 and Figure 7, an increase in the loss factor can only be seen at a temperature of over 80 C. Hence, Figure 10a is regarded as valid in the frequency range shown.
Figure 9 shows that if the master curves are evaluated for very wide frequency ranges, the glass transitions are not reached in the same frequency range leading to the scatter of the loss factor peaks. However, no valid explanation on why the transitions should be reached at different frequencies can be made. Therefore, it is assumed that the application of TTS is only valid within a smaller frequency range and cannot depict the correct behavior for broad frequency ranges of more than ten decades. In this study the range of interest is set from 10−4 Hz to 104 Hz. Within this range, for a reference temperature of 20 C, a constant decrease of the loss factor for all specimens with the soft elastomer can be seen. This can be correlated with the constant increase of the loss factor and decrease of storage modulus with increasing temperature. Also the same behavior can be seen in the frequency nomogram of the neat elastomer in Figure 3. Hence, it is believed that the distinctive decrease of loss factor with increasing frequency results from the behavior of the elastomer at this temperature. The numerical model also predicts the same behavior, despite an vertical offset of the corresponding curves from the experiment and the simulations, the same slope of the curves can be seen. The offset might occur due to different modulus of CFRP in tension and compression which, was not taken into account. The lower values of loss factor for the hard elastomer seem to have less influence on the frequency dependent damping behavior, as the slope for these lay-ups is much lower and is comparable to laminates without elastomer.
The resulting master curve for a reference temperature of −40 C (Figure 10a) shows the same frequency dependency for the specimens with soft elastomer in different thicknesses, as the width of the loss factor peaks is comparable. Only the absolute values depend on the thickness or lay-up. However, for the elastomer thickness of 0.05 mm the peak is so small, it can hardly be distinguished from the horizontal curve outside the glass transition range. Hence, a change in lay-up or thickness does not seem to have an influence on the frequency dependent damping behavior.
For a reference temperature of 80 C the glass transition of the CFRP becomes more significant for frequencies below 10−2 Hz which can be seen in Figure 10b at the rise of the loss factor for lower frequencies. At this point both materials, the CFRP and the elastomer contribute to damping. A dominant behaviour of the CFRP transition cannot be assumed, for specimens with the soft elastomer in particular. For these lay-ups the loss factor peak in Tg CFRP range is always higher than for the specimens without elastomer (see Figure 5 and Figure 7). However, the dominance of one relaxation mechanism is required for the applicability of the time-temperature superposition by horizontal shifts [21,22]. This might lead to the different locations of the loss factor peaks of the CFRP in the master curves in Figure 9 and Figure 10b as the elastomer might also influence the behavior. Therefore, for these temperatures and frequencies, a further validation of the mechanical behavior outside the frequency range of conventional DMA tests must be performed in order to validate the curves for broader frequency ranges.
It should be noted that the described frequency dependence is superimposed by other effects in reality. At higher frequencies, for example, different eigenmodes are excited, which leads to varying shear strains in the elastomer layers. Furthermore, during damping measurements by modal analysis, different amplitudes can occur with the different eigenmodes. The amplitude dependence was not investigated in this study, but was assumed to be linear viscoelastic. Therefore, the results of the experimental investigations can only be compared to a limited extent with damping measurements from other experiments or other components. With the help of the simulation model, however, the different eigenmodes can be calculated and compared with experimental modal analyses. However, this is not part of these investigations, but the possible deviation of the master curves from the actual material behaviour should be mentioned here.

5. Summary and Conclusions

Dynamic mechanical analyses (DMA) were performed on fiber metal elastomer laminates (FMEL) containing carbon fiber reinforces plastics (CFRP) to characterize their temperature and frequency dependent damping behavior. The FMEL were characterized in a bending DMA in order to reproduce the behavior under bending vibrations, which should be damped with these laminates in a particularly efficient way due to the constrained layer mechanism. DMA on neat elastomer and CFRP was performed in tension to characterize the viscoelastic material behavior of the constituents and to obtain material data for a numerical modeling of the hybrid laminates. This was used to perform a parameter study on different lay-ups. Also a numerical approach to generate master curves was used which relies on master curves of each constituent and micromechanical analysis. From the experimental and numerical investigations the following conclusions can be drawn:
  • The additional elastomer layer increases the damping behavior depending on its modulus, thickness and position in the laminate. This results in a decrease in stiffness if the temperature is far from the glass transition range of the used polymers.
  • With increasing thickness of the elastomer layers and decreasing modulus the damping increases and the bending stiffness decreases as well.
  • Laminates with aluminum layers on the outside showed lower damping values at higher bending stiffnesses for the investigated lay-ups due to different positions of the elastomer layer in the laminate and different thickness ratios of the constraining and base layers.
  • With the same bending stiffness, the mass of a lay-up with a soft elastomer increases by around 35% due to a thicker elastomer layer, compared to the same laminate lay-up with a hard elastomer. At the same time, the damping is increased by around 300%.
  • A rule of mixture that takes the elastomer content in the laminate into account can be applied to estimate the loss factor of the hybrid fiber metal elastomer laminate.
  • The glass transition range can be used to increase the damping and the stiffness of the specimens. However, it is limited to a small temperature range of about 30 C for the investigated materials.
  • The numerical model based on the DMA data of the individual materials can reproduce the quasi-static and dynamic material behavior of most lay-ups in good accordance to the experimental results. The frequency dependence of the laminate is also well represented by master curves of the individual materials.
Due to the existence of two glass transitions in the different materials the material behavior in temperature or frequency ranges, where both transitions affect the material behavior, is considered thermorheologically complex. Hence, only small frequency ranges can be depicted with the experimentally determined master curves in these temperature ranges. The depiction of the frequency dependent material behavior with the numerical model in these temperature ranges has to be investigated in future studies.

Author Contributions

V.S. contributed to the Formal analysis, Methodology, Investigation, and Writing original draft; A.J. and W.V.L. contributed to the numerical simulations and data interpretations. L.K. and K.A.W. contributed to the scientific interpretation of the data and were responsible for supervision, and coordination of the project (L.K. numerics, K.A.W. experimental).

Funding

This work is funded by the Deutsche Forschungsgemeinschaft (DFG, German Research Foundation) SPP1897 “Calm, Smooth, Smart–Novel approaches for influencing vibrations by means of deliberately introduced dissipation”, project KA 4224/3-1 and WE 4273/16-1 “HyCEML—Hybrid CFRP/elastomer/metal laminates containing elastomeric interfaces for deliberate dissipation”.

Acknowledgments

The authors kindly acknowledge the Gummiwerk Kraiburg as part of the Kraiburg Holding GmbH & Co. KG for providing the elastomers used in this study and the Institute for Production Science (wbk) at KIT who assisted in the manufacturing of the laminates.

Conflicts of Interest

The authors declare no conflict of interest. The founding sponsors had no role in the design of the study; in the collection, analyses, or interpretation of data; in the writing of the manuscript, and in the decision to publish the results.

Appendix A. Generalized Maxwell Model for CFRP

A transversely isotropic generalized Maxwell model (GMM) is used to model the viscoelastic behavior of the CFRP. Specifically, the complex stiffness tensor components C 1111 * , C 2222 * , C 1122 * , C 2233 * and C 1212 * are assumed to behave according to Equations (A1) and (A2) and the equilibrium material parameters listed in Table A1. The model development and parameter identification is published in [25].
C ( ω ) = C 0 1 m = 1 N c m + C 0 m = 1 N c m ω τ m 2 1 + ω τ m 2
C ( ω ) = C 0 m = 1 N c m ω τ m 1 + ω τ m 2
Table A1. Elastic material parameters of CFRP.
C 1111 * C 2222 * C 1122 * C 2233 * C 1212 *
C 0 = 125.10 GPa C 0 = 12.78 GPa C 0 = 6.28 GPa C 0 = 7.07 GPa C 0 = 3.46 GPa

References

  1. Sinmazçelik, T.; Avcu, E.; Bora, M.Ö.; Çoban, O. A review: Fibre metal laminates, background, bonding types and applied test methods. Mater. Des. 2011, 32, 3671–3685. [Google Scholar] [CrossRef]
  2. Sadighi, M.; Alderliesten, R.C.; Benedictus, R. Impact resistance of fiber-metal laminates: A review. Int. J. Impact Eng. 2012, 49, 77–90. [Google Scholar] [CrossRef]
  3. Alderliesten, R. Solid mechanics and its applications. In Fatigue and Fracture of Fibre Metal Laminates; Springer: Cham, Switzerland, 2017; Volume 236. [Google Scholar]
  4. Botelho, E.C.; Silva, R.A.; Pardini, L.C.; Rezende, M.C. A Review on the Development and Properties of Continuous Fiber/epoxy/aluminum Hybrid Composites for Aircraft Structures. Mater. Res. 2006, 9, 247–256. [Google Scholar] [CrossRef]
  5. Lin, C.T.; Kao, P.W. Effect of fiber bridging on the fatigue crack propagation in carbon fiber-reinforced aluminum laminates. Mater. Sci. Eng. A 1995, 190, 65–73. [Google Scholar] [CrossRef]
  6. Lin, C.T.; Kao, P.W. Fatigue delamination growth in carbon fibre-reinforced aluminum laminates. Compos. Part A 1996, 27, 9–15. [Google Scholar] [CrossRef]
  7. Sarlin, E.; Hoikkanen, M.; Frisk, L.; Vuorinen, J.; Vippola, M.; Lepistö, T. Ageing of corrosion resistant steel/rubber/composite hybrid structures. Int. J. Adhes. Adhes. 2014, 49, 26–32. [Google Scholar] [CrossRef]
  8. Stoll, M.; Stemmer, F.; Ilinzeer, S.; Weidenmann, K.A. Optimization of corrosive properties of carbon fiber reinforced aluminum laminates due to integration of an elastomer interlayer. In 21st Symposium on Composites; Key Engineering Materials Vol. 742, Series; Herrmann, A.S., Ed.; Trans Tech Publications Ltd.: Zurich, Switzerland, 2017; pp. 187–293. [Google Scholar]
  9. Stoll, M.; Weidenmann, K.A. Characterization of interface properties of Fiber-Metal-Laminates (FML) with optimized surfaces. In Internationale Konferenz Euro Hybrid Materials and Structures; Hausmann, J.M., Siebert, M., Eds.; Deutsche Gesellschaft für Materialkunde e.V.: Frankfurt, Germany, 2016; pp. 38–43. [Google Scholar]
  10. Nashif, A.D.; Jones, D.I.G.; Henderson, J.P. Vibration Damping; Wiley: New York, NY, USA, 1985. [Google Scholar]
  11. Ross, D.; Ungar, E.E.; Kerwin, E.M. Damping of plate flexural vibrations by means of viscoelastic laminae. Struct. Damp. 1959, 1959, 49–87. [Google Scholar]
  12. Zhou, X.Q.; Yu, D.Y.; Shao, X.Y.; Zhang, S.Q.; Wang, S. Research and applications of viscoelastic vibration damping materials: A review. Compos. Struct. 2016, 136, 460–480. [Google Scholar] [CrossRef]
  13. Rao, M.D. Recent applications of viscoelastic damping for noise control in automobiles and commercial airplanes. J. Sound Vib. 2003, 262, 457–474. [Google Scholar] [CrossRef]
  14. Ghiringhelli, G.L.; Terraneo, M.; Vigoni, E. Improvement of structures vibroacoustics by widespread embodiment of viscoelastic materials. Aerosp. Sci. Technol. 2013, 28, 227–241. [Google Scholar] [CrossRef]
  15. Sarlin, E.; Liu, Y.; Vippola, M.; Zogg, M.; Ermanni, P.; Vuorinen, J.; Lepistö, T. Vibration damping properties of steel/rubber/composite hybrid structures. Compos. Struct. 2012, 94, 3327–3335. [Google Scholar] [CrossRef]
  16. Botelho, E.C.; Campos, A.N.; de Barros, E.; Pardini, L.C.; Rezende, M.C. Damping behavior of continuous fiber/metal composite materials by the free vibration method. Compos. Part B Eng. 2005, 37, 255–263. [Google Scholar] [CrossRef]
  17. Ferry, J.D. Viscoelastic Properties of Polymers, 3rd ed.; John Wiley & Sons: New York, NY, USA; Chichester, UK; Brisbane, Australia; Toronto, ON, Canada; Singapore, 1980. [Google Scholar]
  18. Takayanagi, M.; Uemura, S.; Minami, S. Application of equivalent model method to dynamic rheo-optical properties of crystalline polymer. J. Polym. Sci. Part C Polym. Symp. 1964, 5, 113–122. [Google Scholar] [CrossRef]
  19. Caruthers, J.M.; Cohen, R.E. Consequences of thermorheological complexity in viscoelastic materials. Rheol. Acta 1980, 19, 606–613. [Google Scholar] [CrossRef]
  20. Kaplan, D.; Tschoegl, N.W. Time-Temperature Superposition in Two-Phase Polyblends. In Recent Advances in Polymer Blends, Grafts, and Blocks; Vol. 4, Polymer Science and Technology; Sperling, L.H., Ed.; Springer: Boston, MA, USA, 1974; pp. 43–49. [Google Scholar] [CrossRef]
  21. Fesko, D.G.; Tschoegl, N.W. Time-temperature superposition in thermorheologically complex materials. J. Polym. Sci. Part C Polym. Symp. 1971, 1971, 51–69. [Google Scholar] [CrossRef]
  22. Nakano, T. Applicability condition of time–temperature superposition principle (TTSP) to a multi-phase system. Mech. Time-Depend. Mater. 2013, 17, 439–447. [Google Scholar] [CrossRef]
  23. DIN. ISO 527-5: Bestimmung der Zugeigenschaften Teil 5: Prüfbedinungen für Unidirektional Faserverstärkte Kunstoffverbundwerkstoffe; Deutsches Institut für Normung e.V.: Berlin, Germany, 1997. [Google Scholar]
  24. DIN EN 6031. Luft-und Raumfahrt–Faserverstärkte Kunststoffe–Prüfverfahren – Bestimmung der Schubeigenschaften (± 45-Zugversuch); Deutsches Institut für Normung e.V.: Berlin, Germany, 2016. [Google Scholar]
  25. Liebig, W.V.; Jackstadt, A.; Sessner, V.; Weidenmann, K.A.; Kärger, L. Multi-Scale Approach Describing the Transversely Isotropic Viscoelastic Material Behaviour of Carbon-Fibre-Reinforced Plastics in the Frequency Domain; Preprint Series of the PP 1897; University of Stuttgart, Institute of Engineering and Computational Mechanics: Stuttgart, Germany, 2018. [Google Scholar]
  26. ISO 37:2017 Rubber, Vulcanized or Thermoplastic—Determination of Tensile Stress-Strain Properties; International Organization for Standardization: Geneva, Switzerland, 2017.
  27. ASM Aerospace Specification Metals, Inc. Data Sheet Aluminum 2024-T3; ASM Aerospace Specification Metals, Inc.: Pompano Beach, FL, USA, 2018. [Google Scholar]
  28. Hexcel Corporation. HexPly® M77/38%/UD150/CHS-12K T700 Datasheet; Hexcel Corporation: Stamford, CT, USA, 2014. [Google Scholar]
  29. Gummiwerk Kraiburg GmbH & Co. KG. Technical Data Sheet SAA9579/52; Gummiwerk Kraiburg GmbH & Co. KG: Waldkraiburg, Germany, 2014. [Google Scholar]
  30. Gummiwerk Kraiburg GmbH & Co. KG. Technical Data Sheet HAA9275-45; Gummiwerk Kraiburg GmbH & Co. KG: Waldkraiburg, Germany, 2014. [Google Scholar]
  31. VDI. 2014-Development of FRP Components (Fibre-Reinforced Plastics) Analysis; Verein Deutscher Ingeniuere: Dusseldorf, Germany, 2006. [Google Scholar]
  32. Jones, D.I.G. An Attractive Method lfor Displaying Material Damping Data. J. Aircr. 1981, 18, 644–649. [Google Scholar] [CrossRef]
Figure 1. Micrographs of the FML and FMEL lay-ups listed in Table 2.
Jcs 03 00003 g001
Figure 2. Finite element model of the 3PB test setup.
Jcs 03 00003 g002
Figure 3. Master curve nomogram for tension DMA on the soft elastomer ( El . 05 s , El . 5 s , El . 65 s ) .
Jcs 03 00003 g003
Figure 4. Master curve nomogram for tension DMA on the hard elastomer El . 5 h .
Jcs 03 00003 g004
Figure 5. 3PB Temperature sweep at 1 Hz for all lay-ups with CFRP on the outside. The solid lines are fitted to the measurement steps every 2.5 C from −70 C to +200 C and every 5 C from −20 C to 200 C. For better visibility, only a few markers are displayed in addition to the fitted solid lines.
Jcs 03 00003 g005
Figure 6. Storage module and loss factor for all specimens with CFRP on the outside at 20 C and 1 Hz. Three specimens for each lay-up.
Jcs 03 00003 g006
Figure 7. 3PB Temperature sweep at 1 Hz for all lay-ups with aluminum on the outside. The solid lines are fitted to the measurement steps every 2.5 C from −70 C to +200 C and every 5 C from −20 C to 200 C. For better visibility, only a few markers are displayed.
Jcs 03 00003 g007
Figure 8. Storage module and loss factor for all specimens with aluminum on the outside at 20 C and 1 Hz. Three specimens for each lay-up
Jcs 03 00003 g008
Figure 9. Master curves for all specimens. For better visibility, fewer markers are displayed for the fitted curves.
Jcs 03 00003 g009
Figure 10. Master curves for all specimens at TRef = −40 C (a,c) and TRef = 80 C (b,d). For better visibility, fewer markers are displayed for the fitted curves.
Jcs 03 00003 g010
Figure 11. Comparison of experimental and numerical results for 20 C and 1 Hz in ascending order of the experimentally determined storage modulus. Three specimens for each lay-up.
Jcs 03 00003 g011
Figure 12. Experimentally and numerically determined master curves for a reverence temperature of 20 C for selected lay-ups.
Jcs 03 00003 g012
Figure 13. (a) Influence of elastomer content = (total thickness of both elastomer layers)/(thickness of specimen)) for a (C- El s -A- El s -C) lay-up; (b) experimental results for the influence of the elastomer modulus.
Jcs 03 00003 g013
Table 1. Quasistatic material data for aluminum, CFRP and elastomer material. Values with * are values from the corresponding data sheets, which can be obtained from the suppliers on request. Aluminum [27], CFRP [28], Elastomer [29,30]
AluminumCFRPElastomer
SoftHard
Elastic modulus/GPaE173.1 *113.7 ( ± 3.1 )0.045 ( ± 3.65 × 10 3 )0.483 ( ± 10.7 × 10 3 )
E27.75 ( ± 0.1 )
E37.75 ( ± 0.1 )
Shear modulus/GPaG2128.0 *3.76 ( ± 5.9 × 10 2 )0.015 ( ± 1.1 × 10 3 )0.15 ( ± 7 × 10 3 )
G313.76 ( ± 5.9 × 10 2 )
G322.75 ( ± 3.6 × 10 3 )
Poisson’s ratio/-v210.31 *0.340.480.45
v310.34
v320.40
Density/kg/m3 ρ 2780 *1496 *1180 *1250 *
Table 2. FML and FMEL lay-up configurations. Nomenclature for hybrid laminates based on VDI 2014 [31]. X y z : X: Material class; y: Thickness; z: Additional information like orientation or different materials within the material class; A: Aluminum; El: Elastomer; C: CFRP; Abbr. lay-up nomenclature will be used to reference the laminate in continuous text and figures.
Nbr.Detailed Lay-UpThickness/mmAbbr. Lay-Up
1. [ A 0.3 / ( C 0.15 0 / C 0.15 90 ) 3 / A 0.3 ] 1.5A-C-A
2. [ A 0.3 / El 0.5 h a r d / ( C 0.15 0 / C 0.15 90 ) 3 / El 0.5 h a r d / A 0.3 ] 2.5A- El . 5 s -C- El . 5 s -A
3. [ A 0.3 / El 0.5 s o f t / ( C 0.15 0 / C 0.15 90 ) 3 / El 0.5 s o f t / A 0.3 ] 2.5A- El . 5 h -C- El . 5 h -A
4. [ ( C 0.15 0 / C 0.15 90 ) s / A 0.3 / ( C 0.15 0 / C 0.15 90 ) s ] 1.5C-A-C
5. [ ( C 0.15 0 / C 0.15 90 ) s / El 0.05 s o f t / A 0.3 / El 0 . 05 s o f t / ( C 0.15 0 / C 0.15 90 ) s ] 1.6C- El . 05 s -A- El . 05 s -C
6. [ ( C 0.15 0 / C 0.15 90 ) s / El 0.5 s o f t / A 0.3 / El 0.5 s o f t / ( C 0.15 0 / C 0.15 90 ) s ] 2.5C- El . 5 s -A- El . 5 s -C
7. [ ( C 0.15 0 / C 0.15 90 ) s / El 0.5 h a r d / A 0.3 / El 0.5 h a r d / ( C 0.15 0 / C 0.15 90 ) s ] 2.5C- El . 5 h -A- El . 5 h -C
8. [ ( C 0.15 0 / C 0.15 90 ) s / El 0.65 s o f t / A 0.3 / El 0.65 s o f t / ( C 0.15 0 / C 0.15 90 ) s ] 2.8C- El . 65 s -A- El . 65 s -C
Table 3. Modeling approaches for different material layers in the laminate.
MaterialSymmetryMaterial Model
Aluminumisotropiclinear elastic
Elastomerisotropiclinear viscoelastic (tabular data)
CFRPtransversely isotropiclinear viscoelastic (GMM)

