Experimental and Numerical Determination of the Local Fiber Volume Content of Unidirectional Non-Crimp Fabrics with Forming Effects


Abstract
:1. Introduction
2. Preform Manufacturing
2.1. Materials
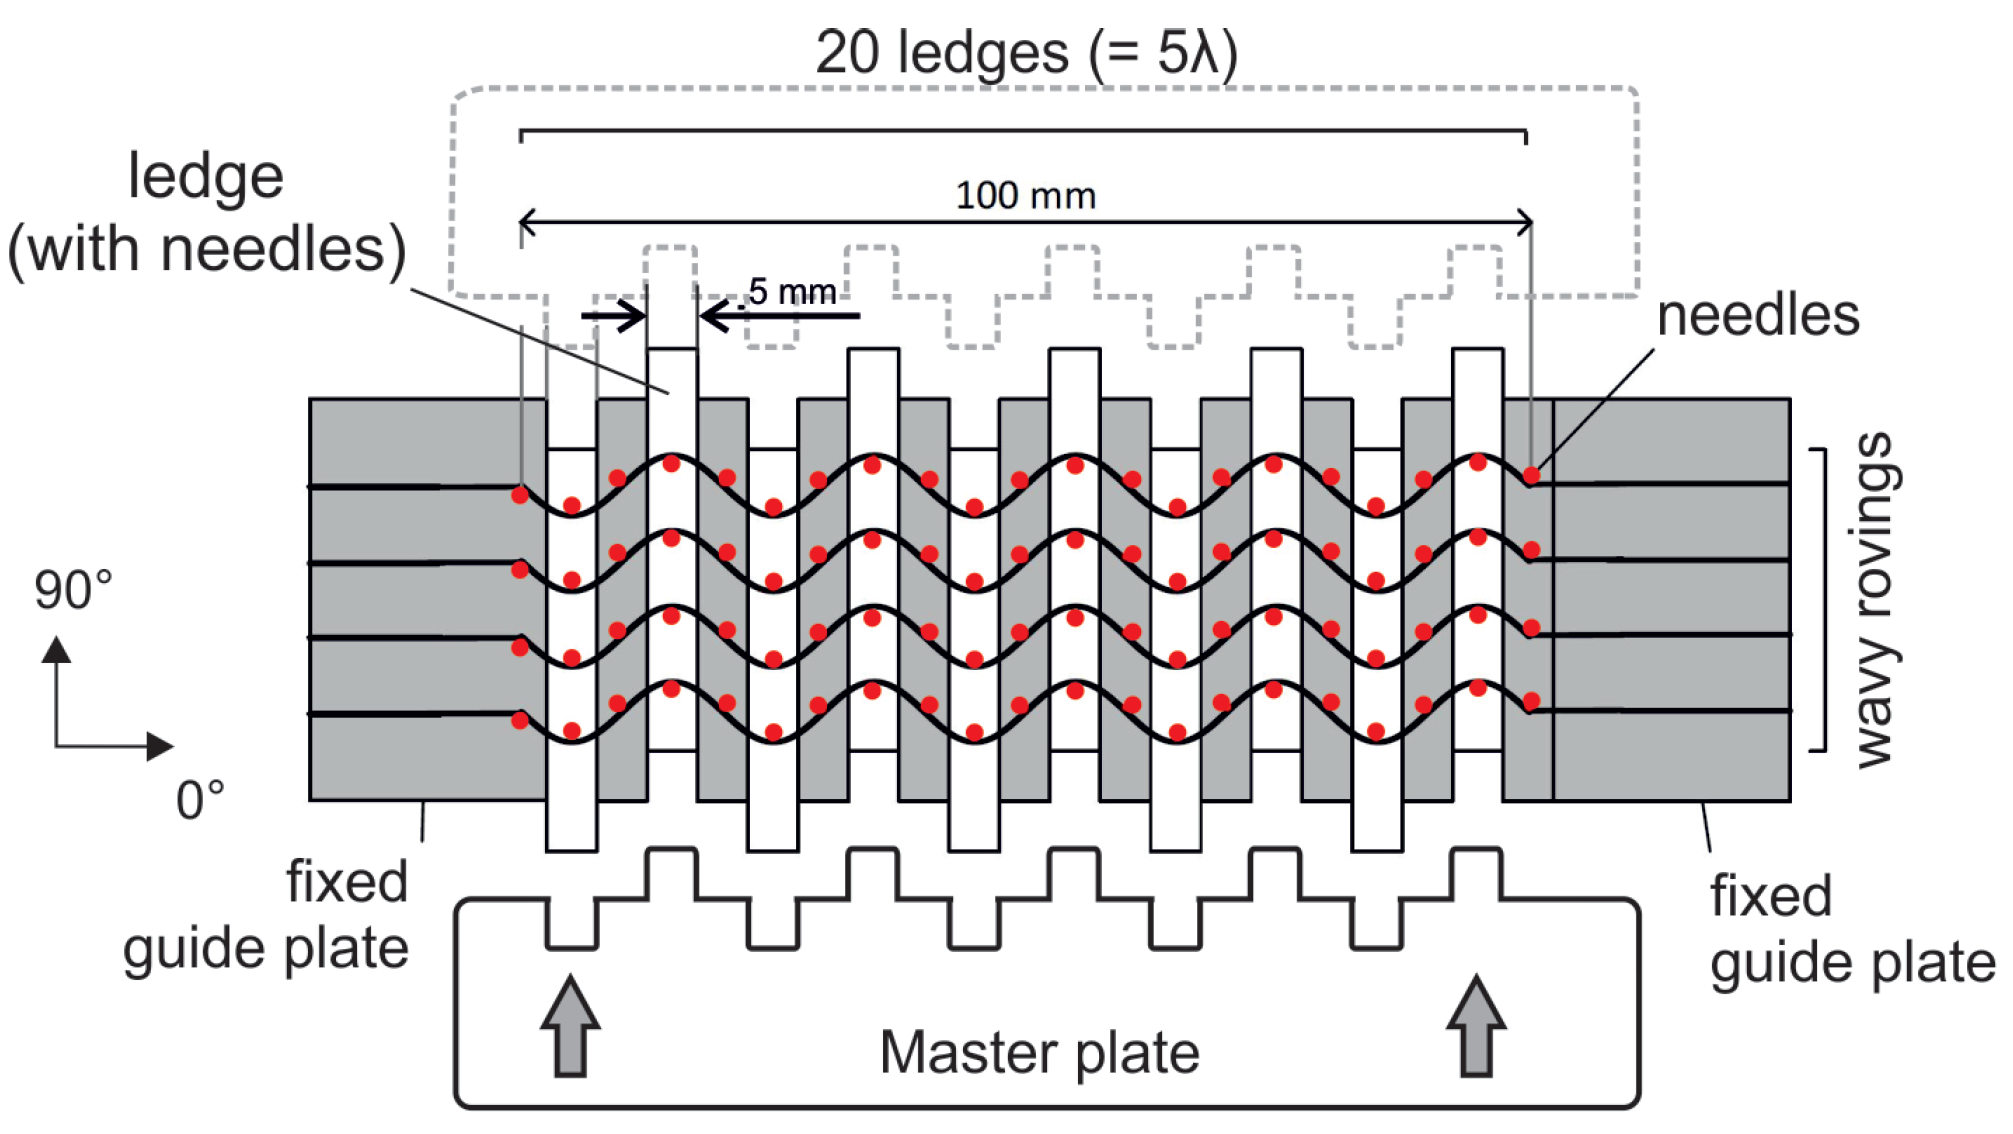
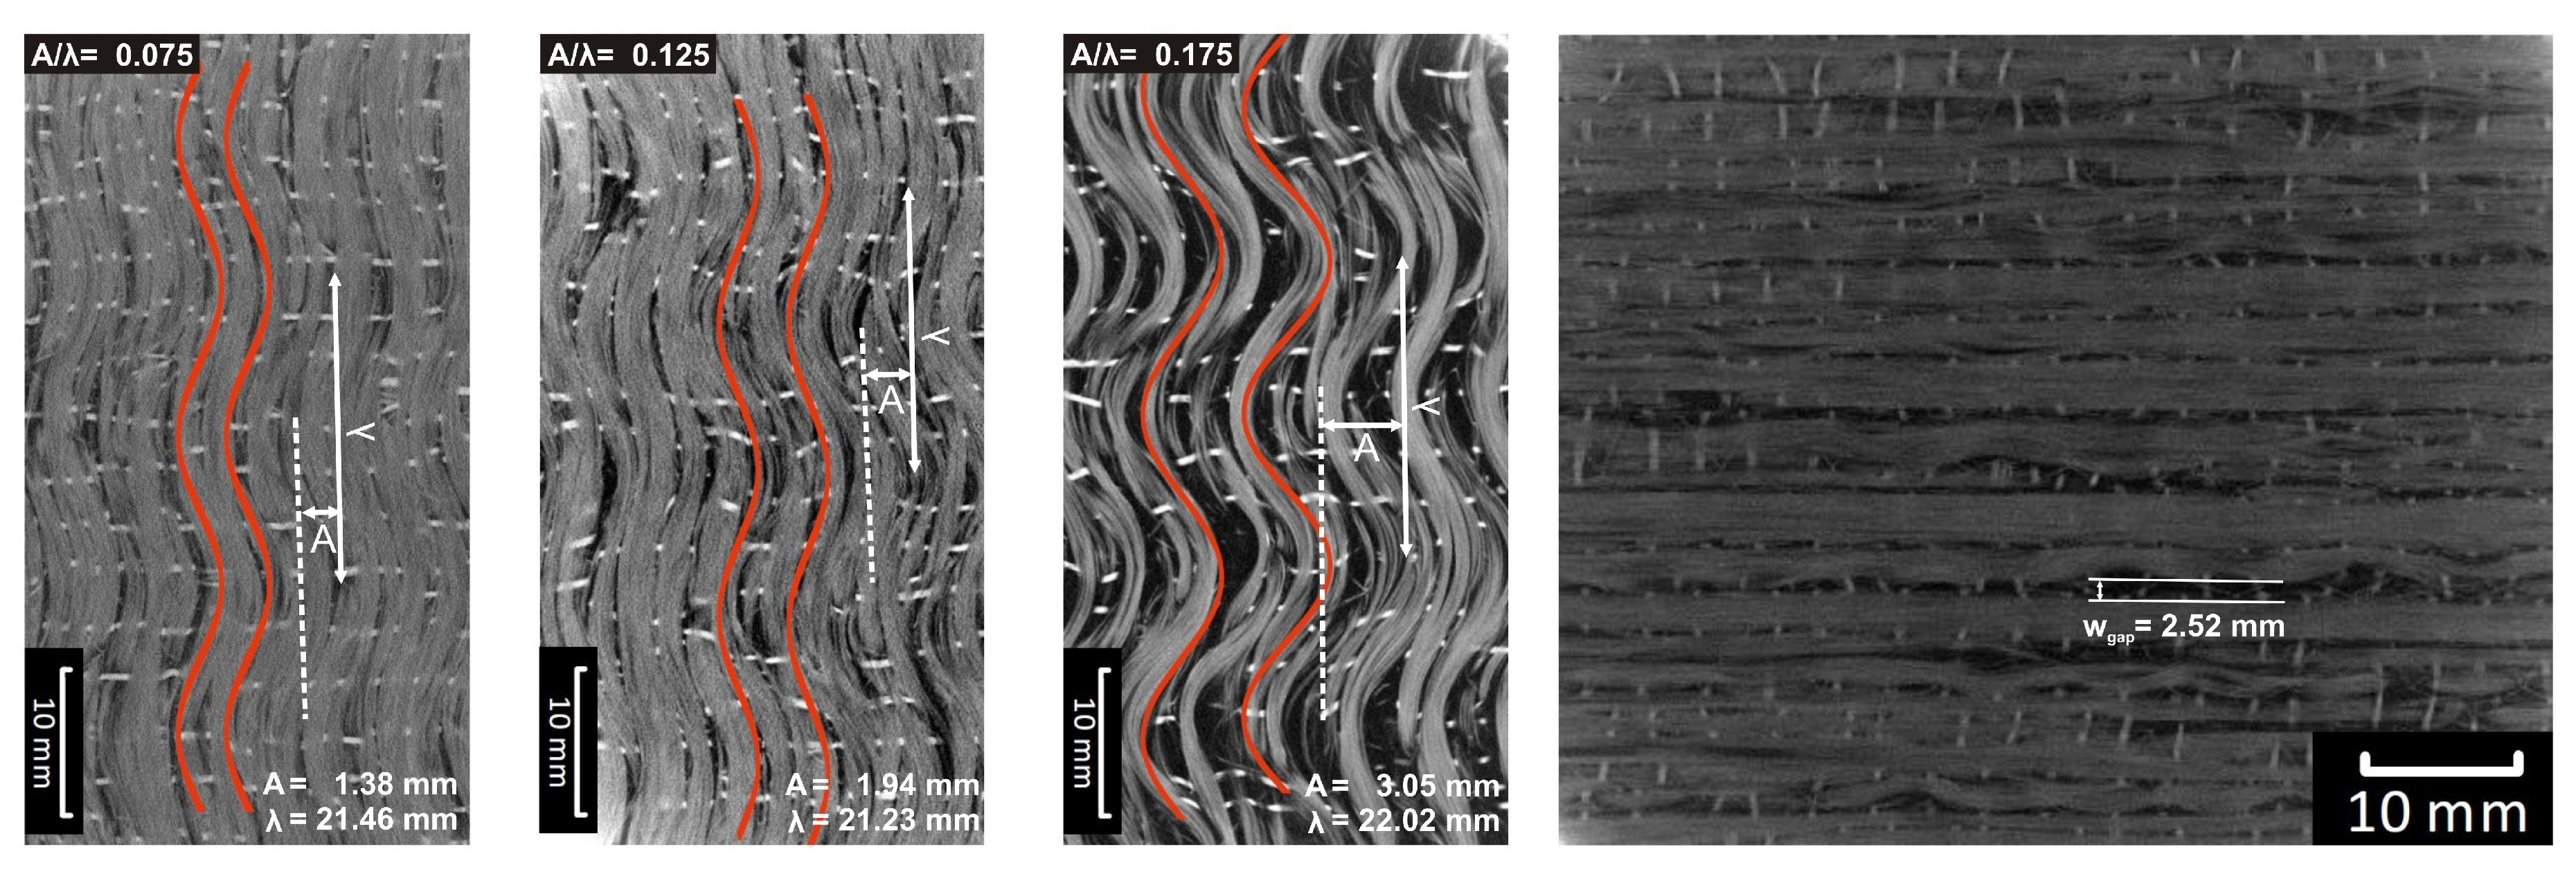
2.2. Wavy Patterns
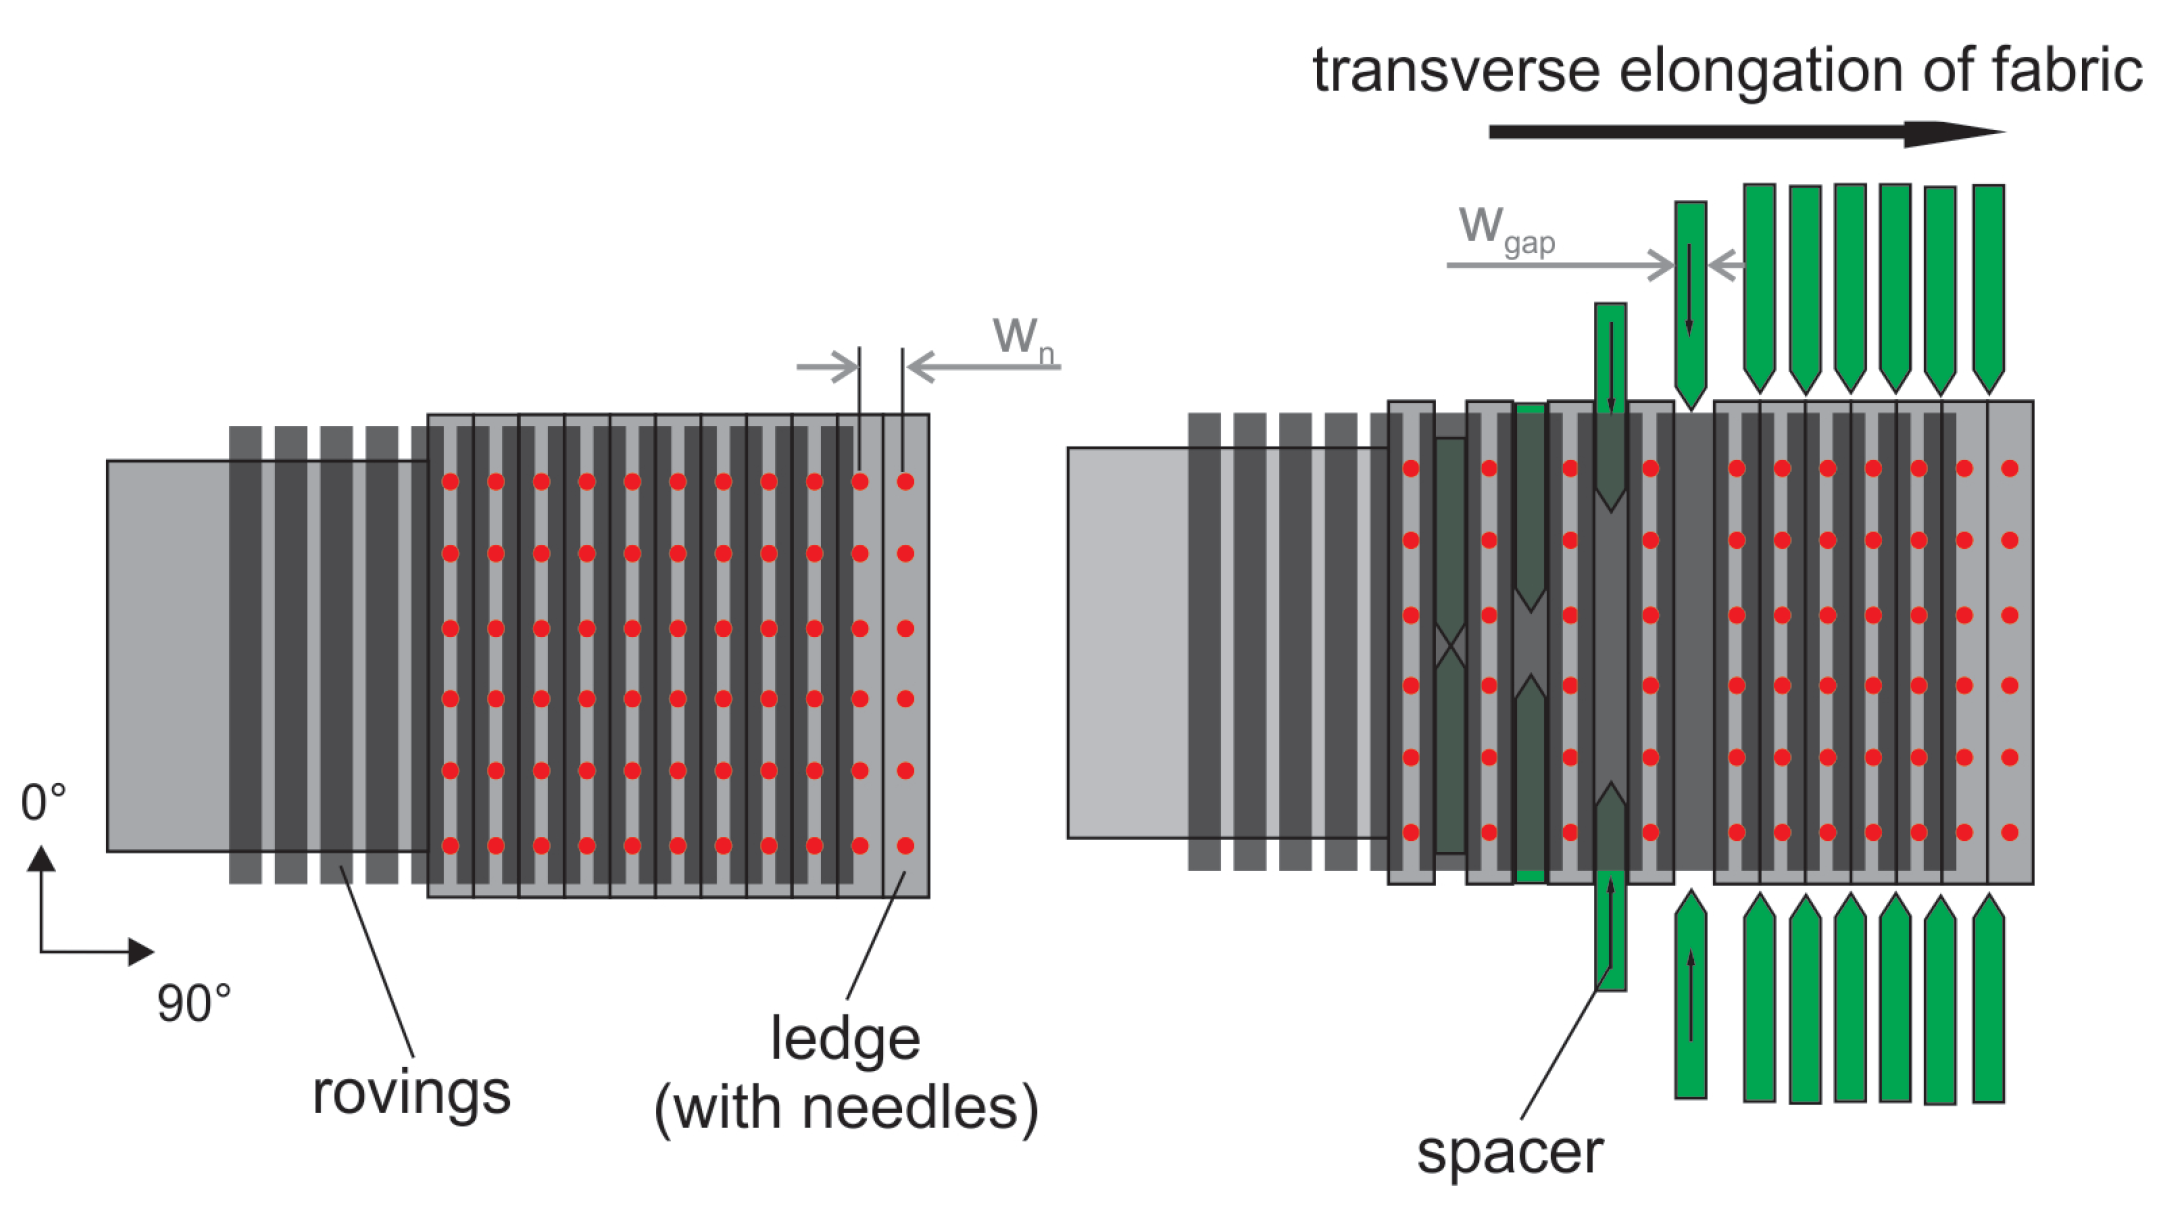
2.3. Fiber Gapping
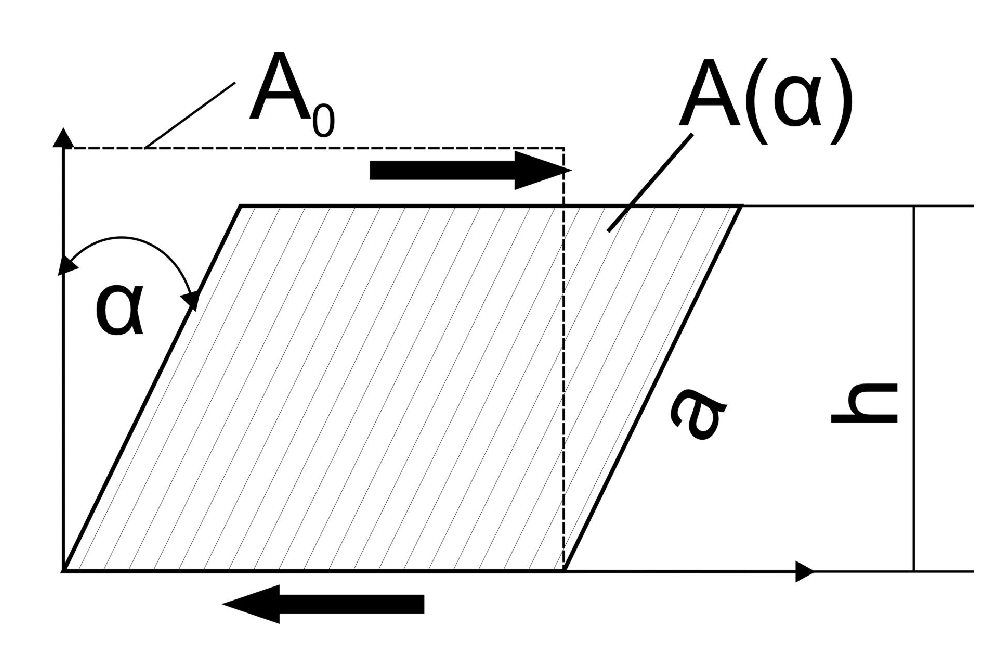
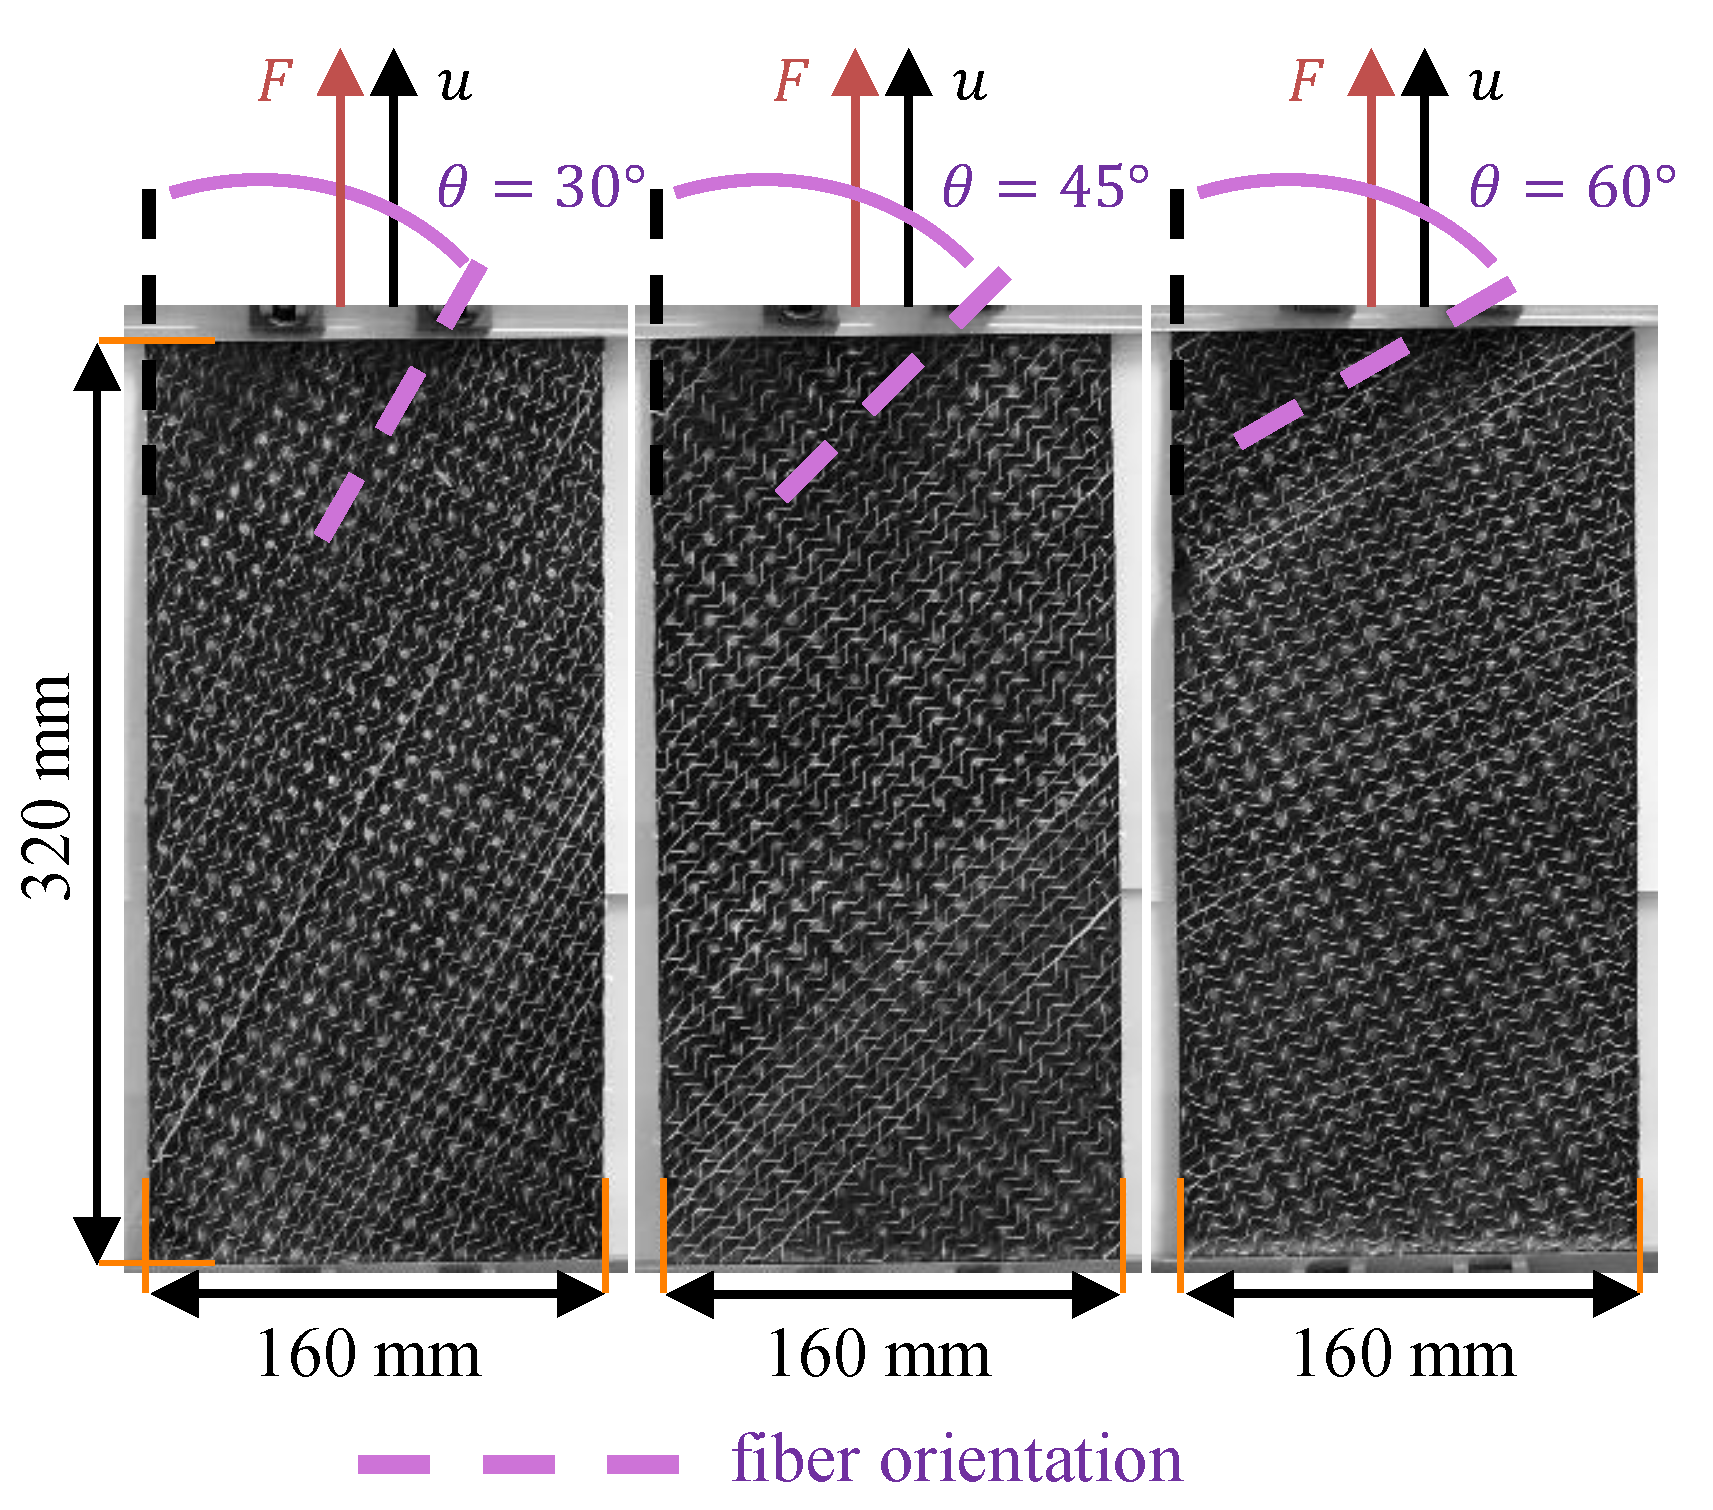
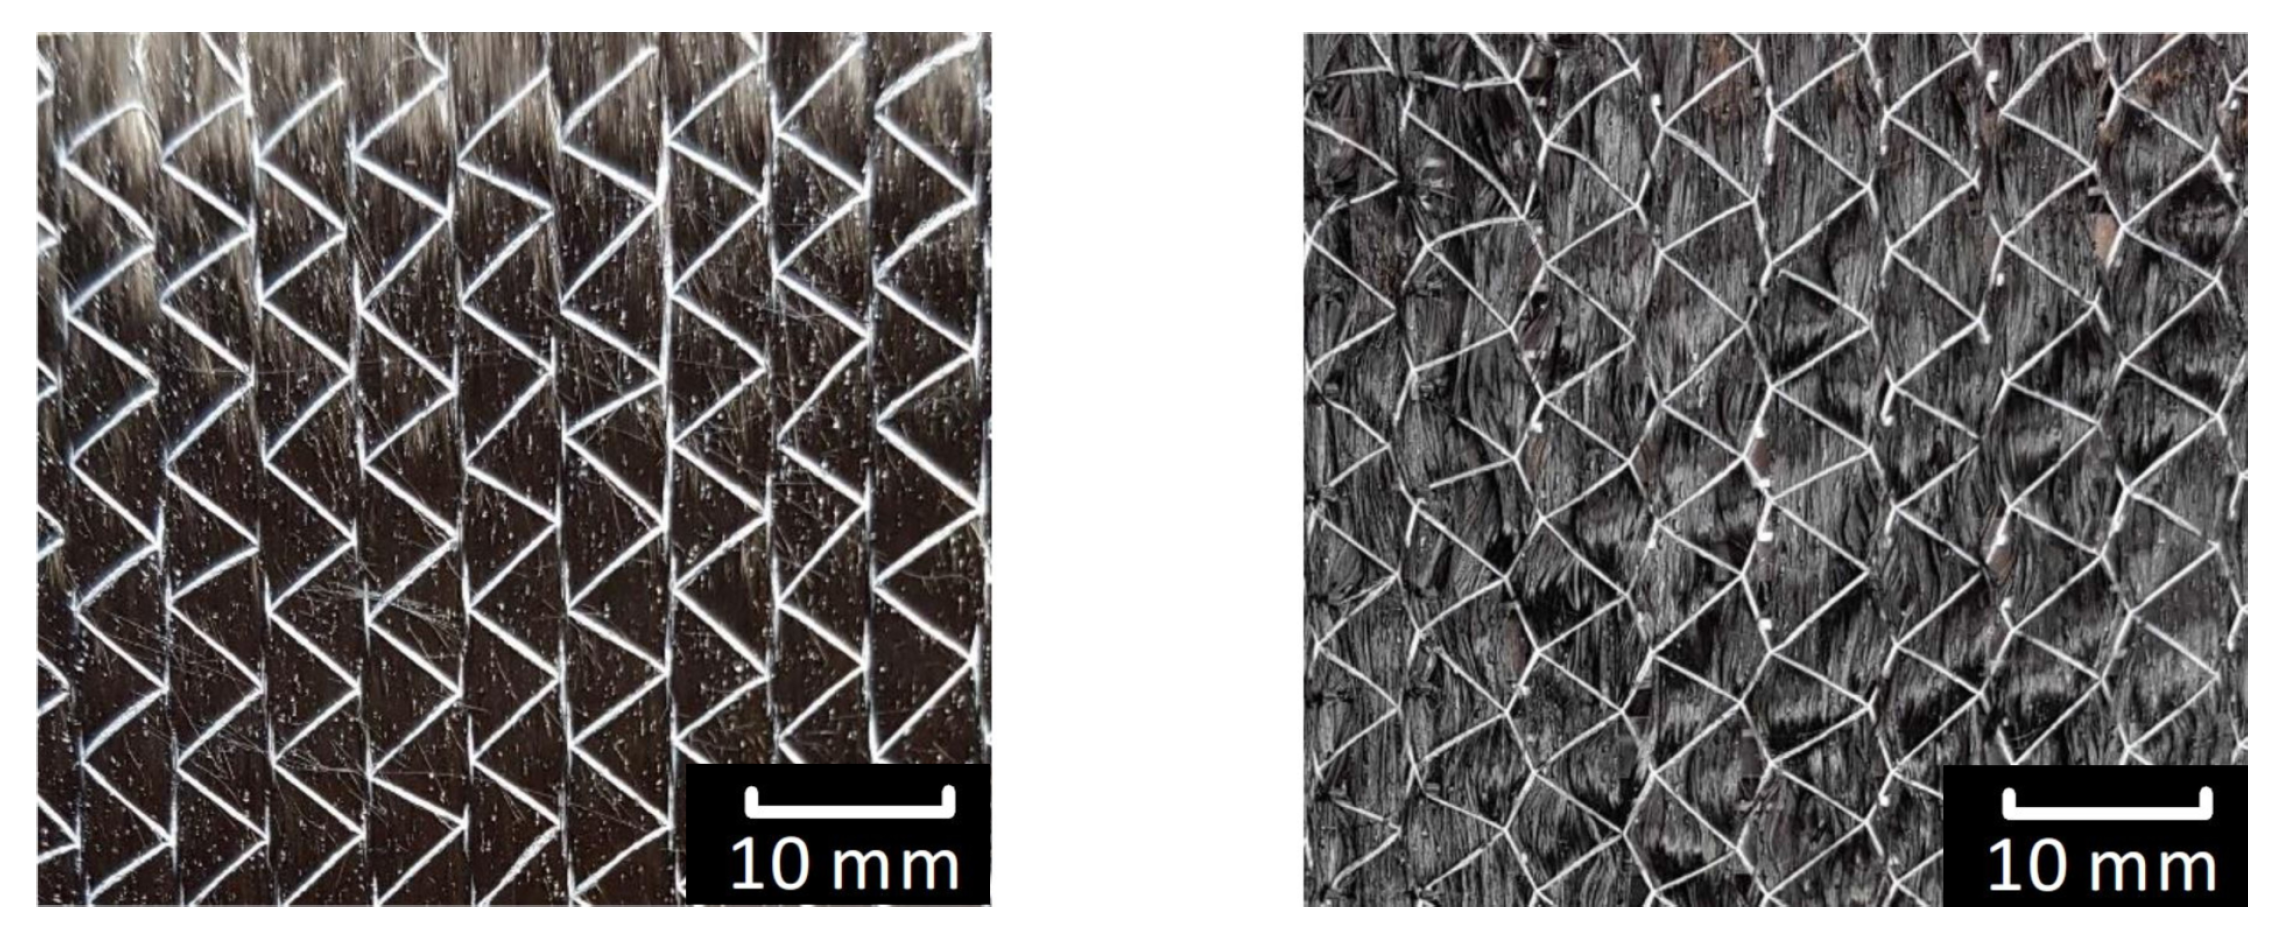
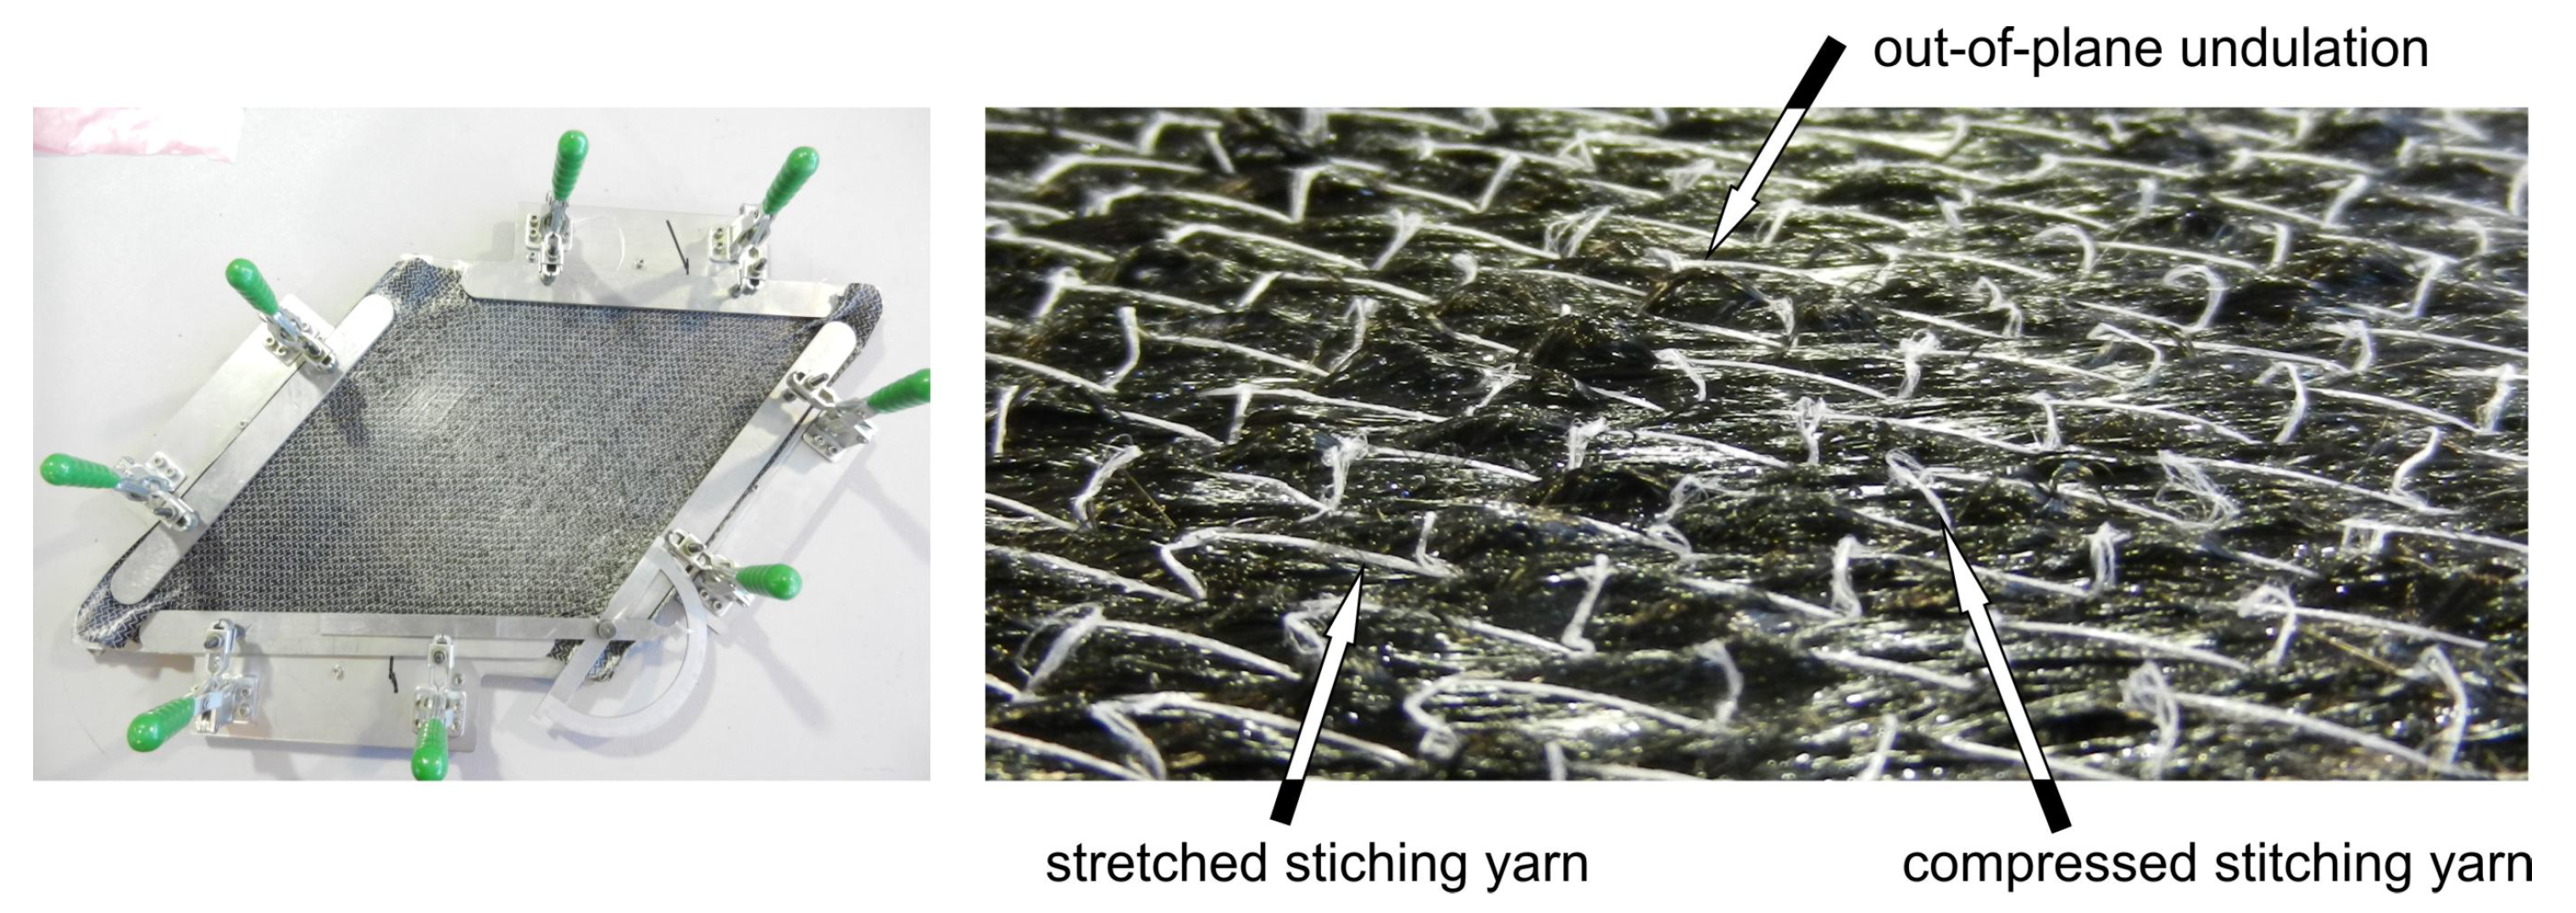
2.4. Fiber Shearing
3. Forming Simulation
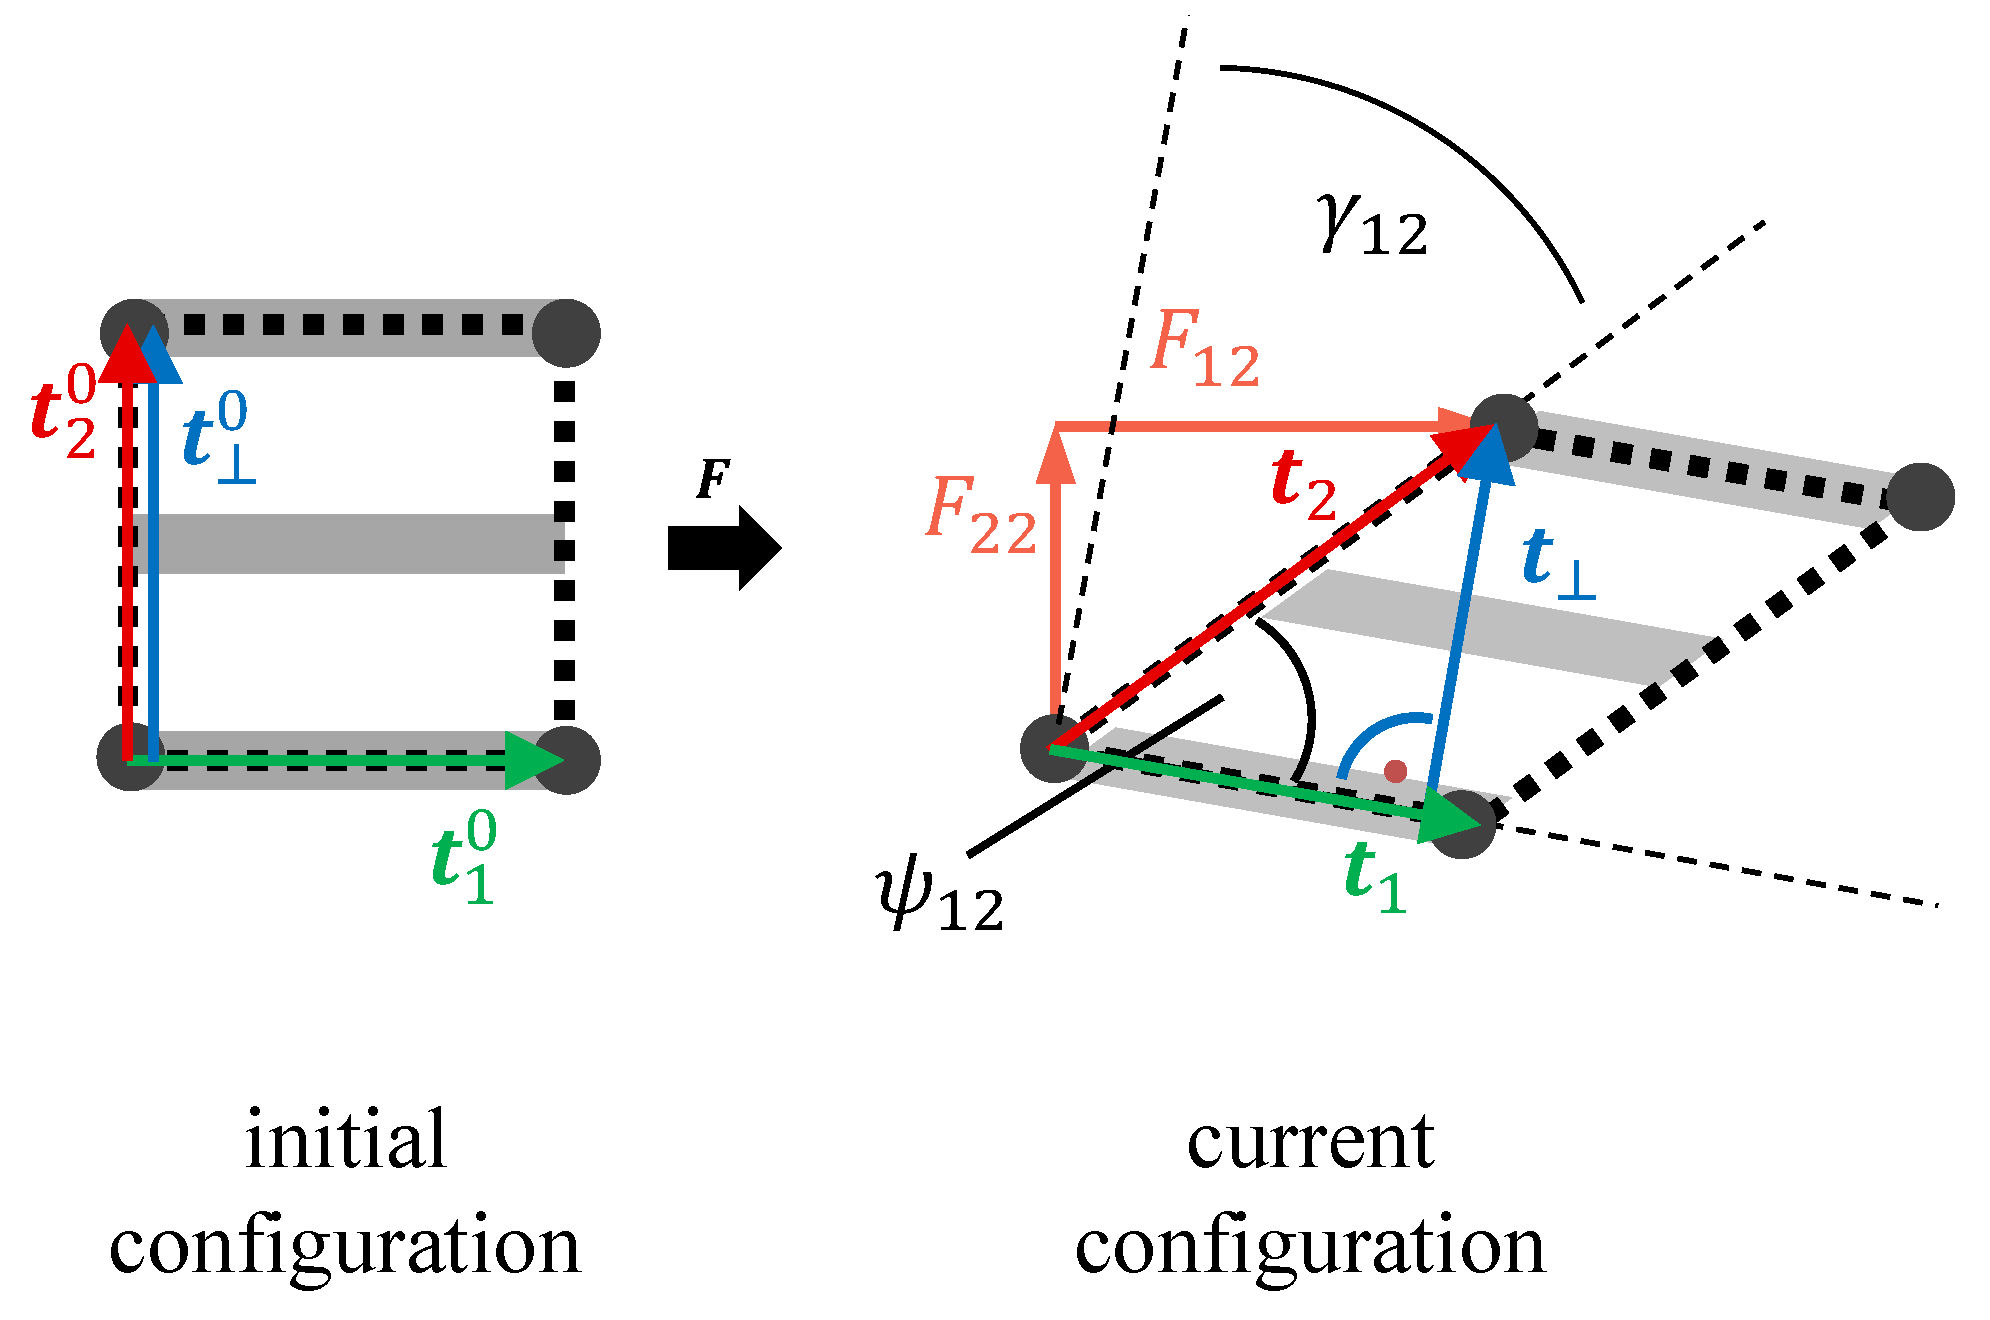
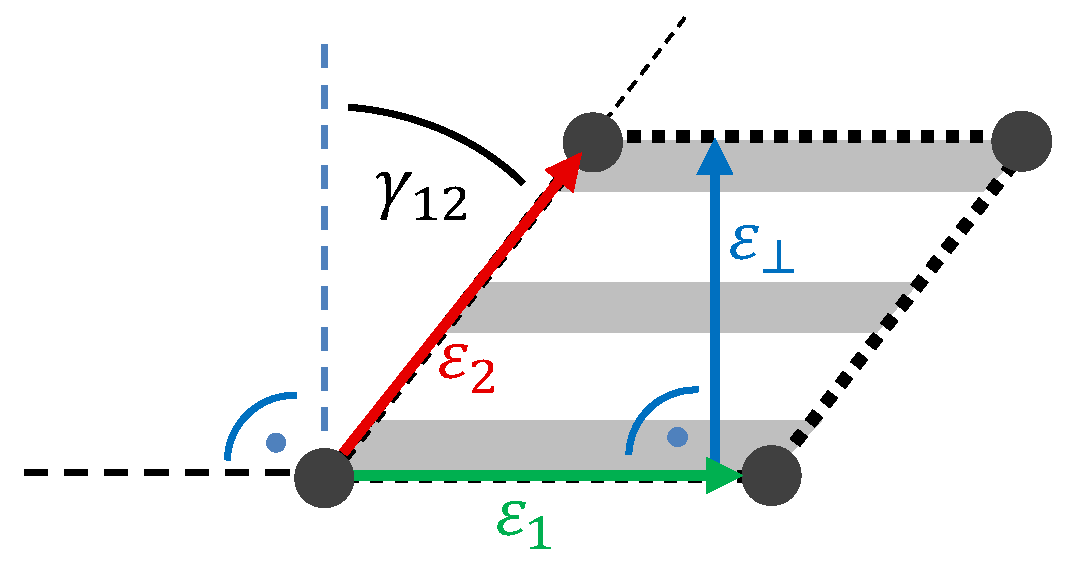
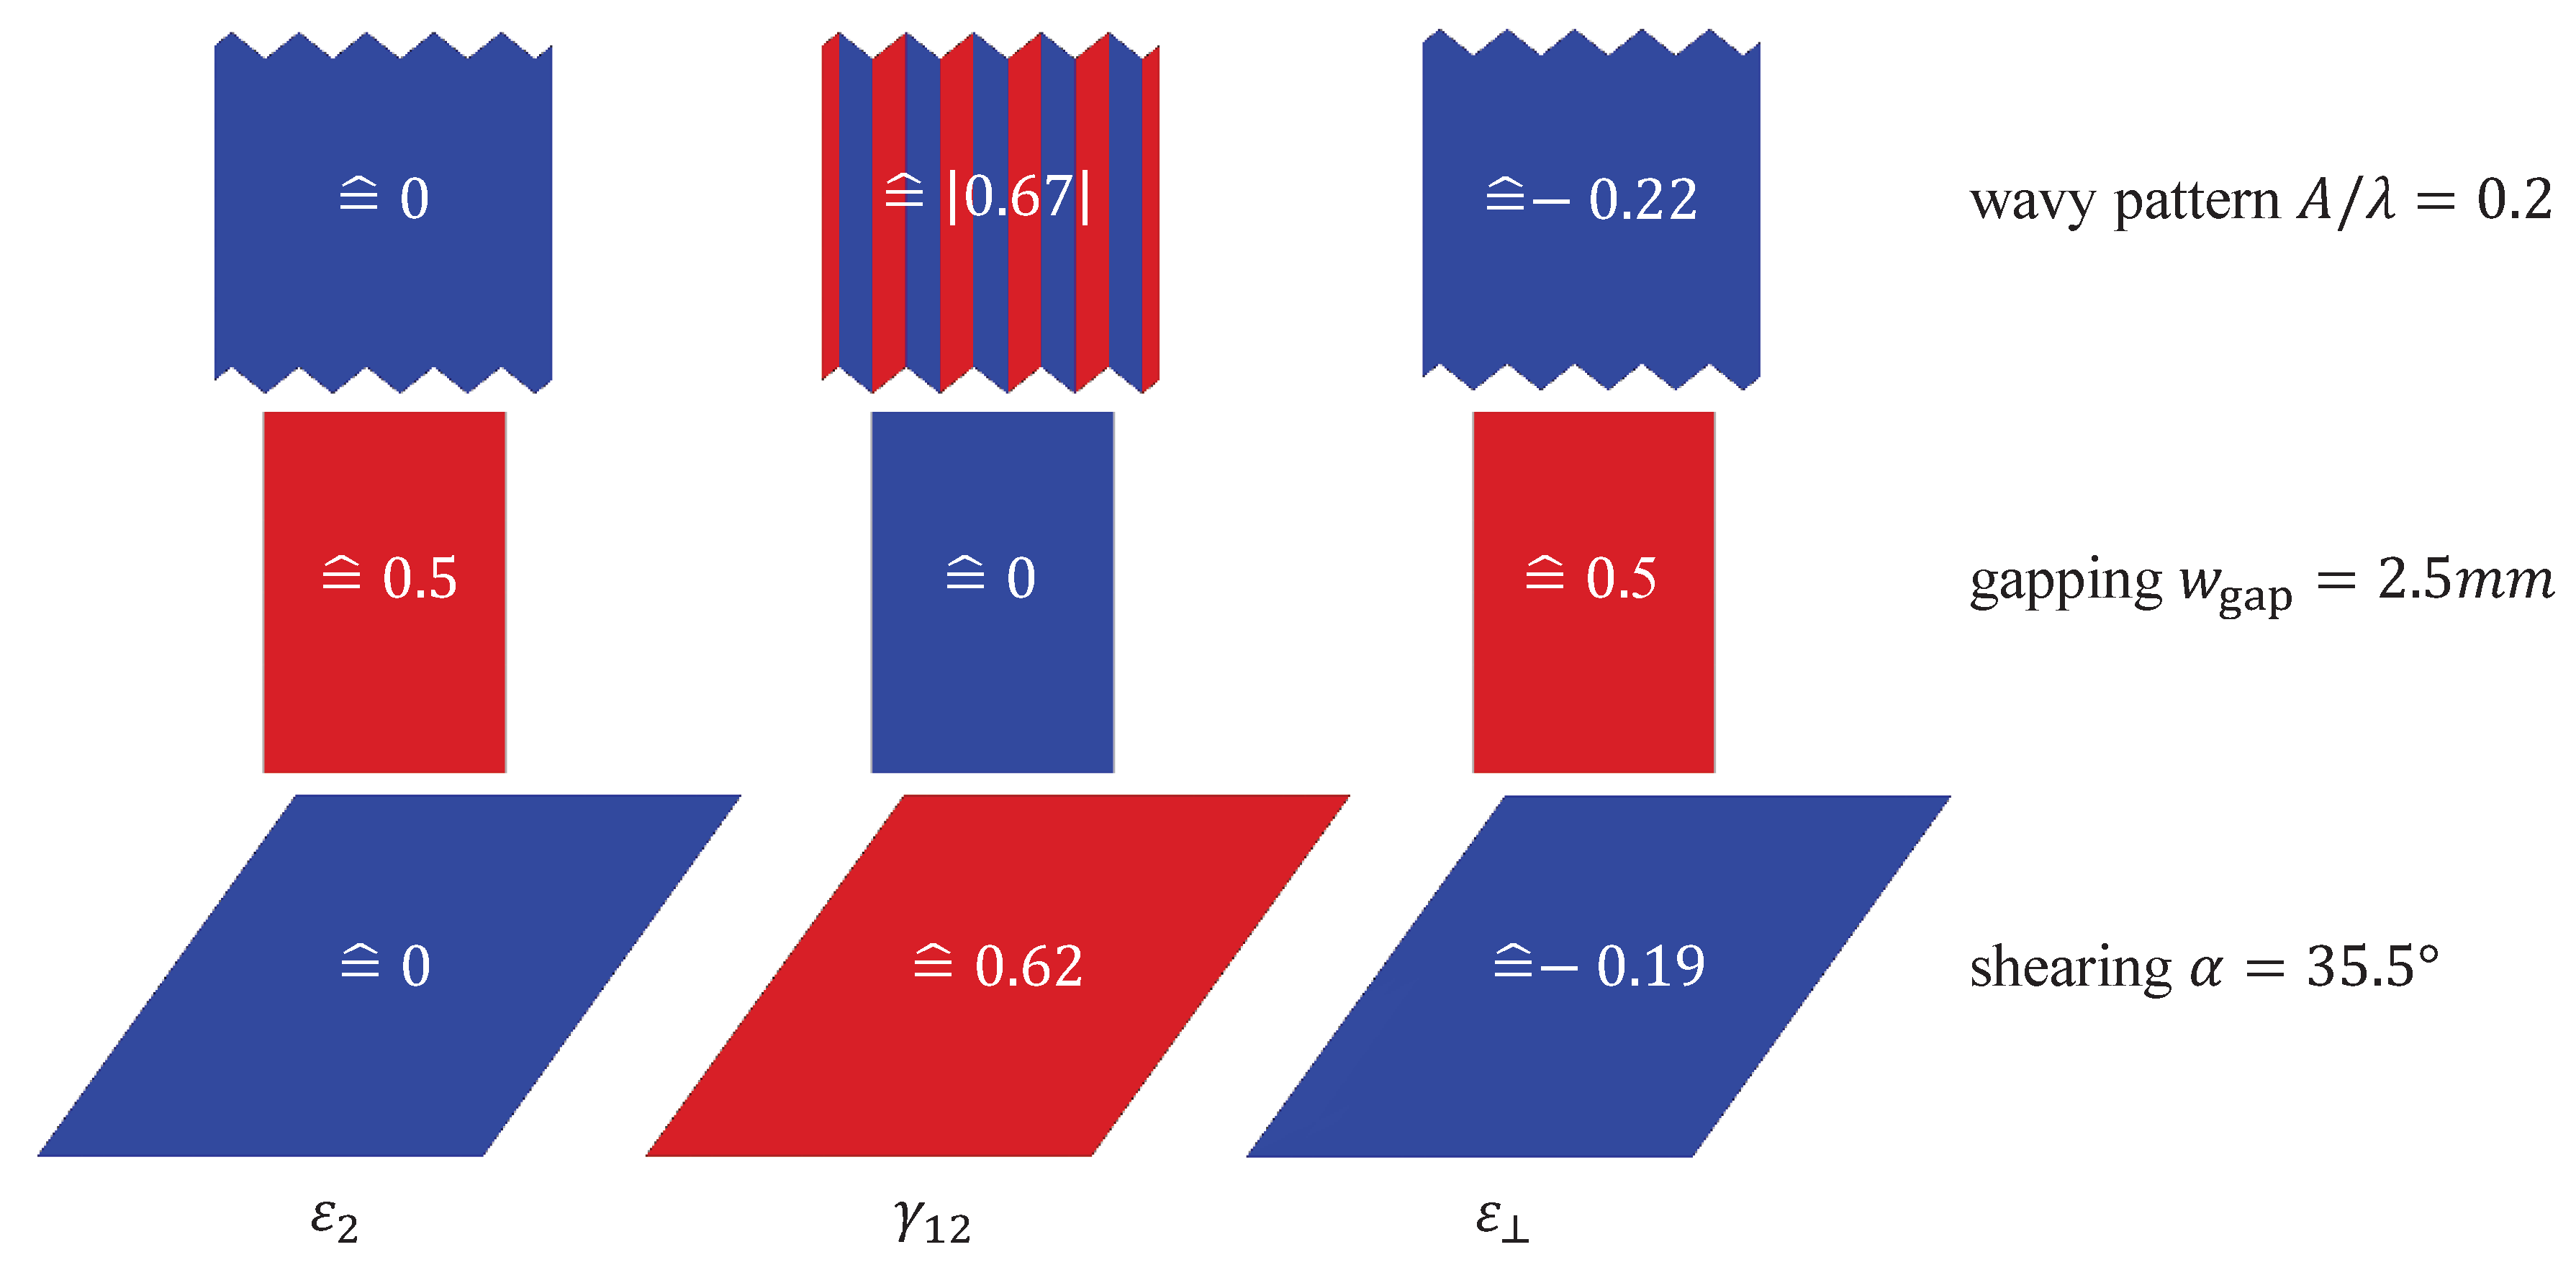
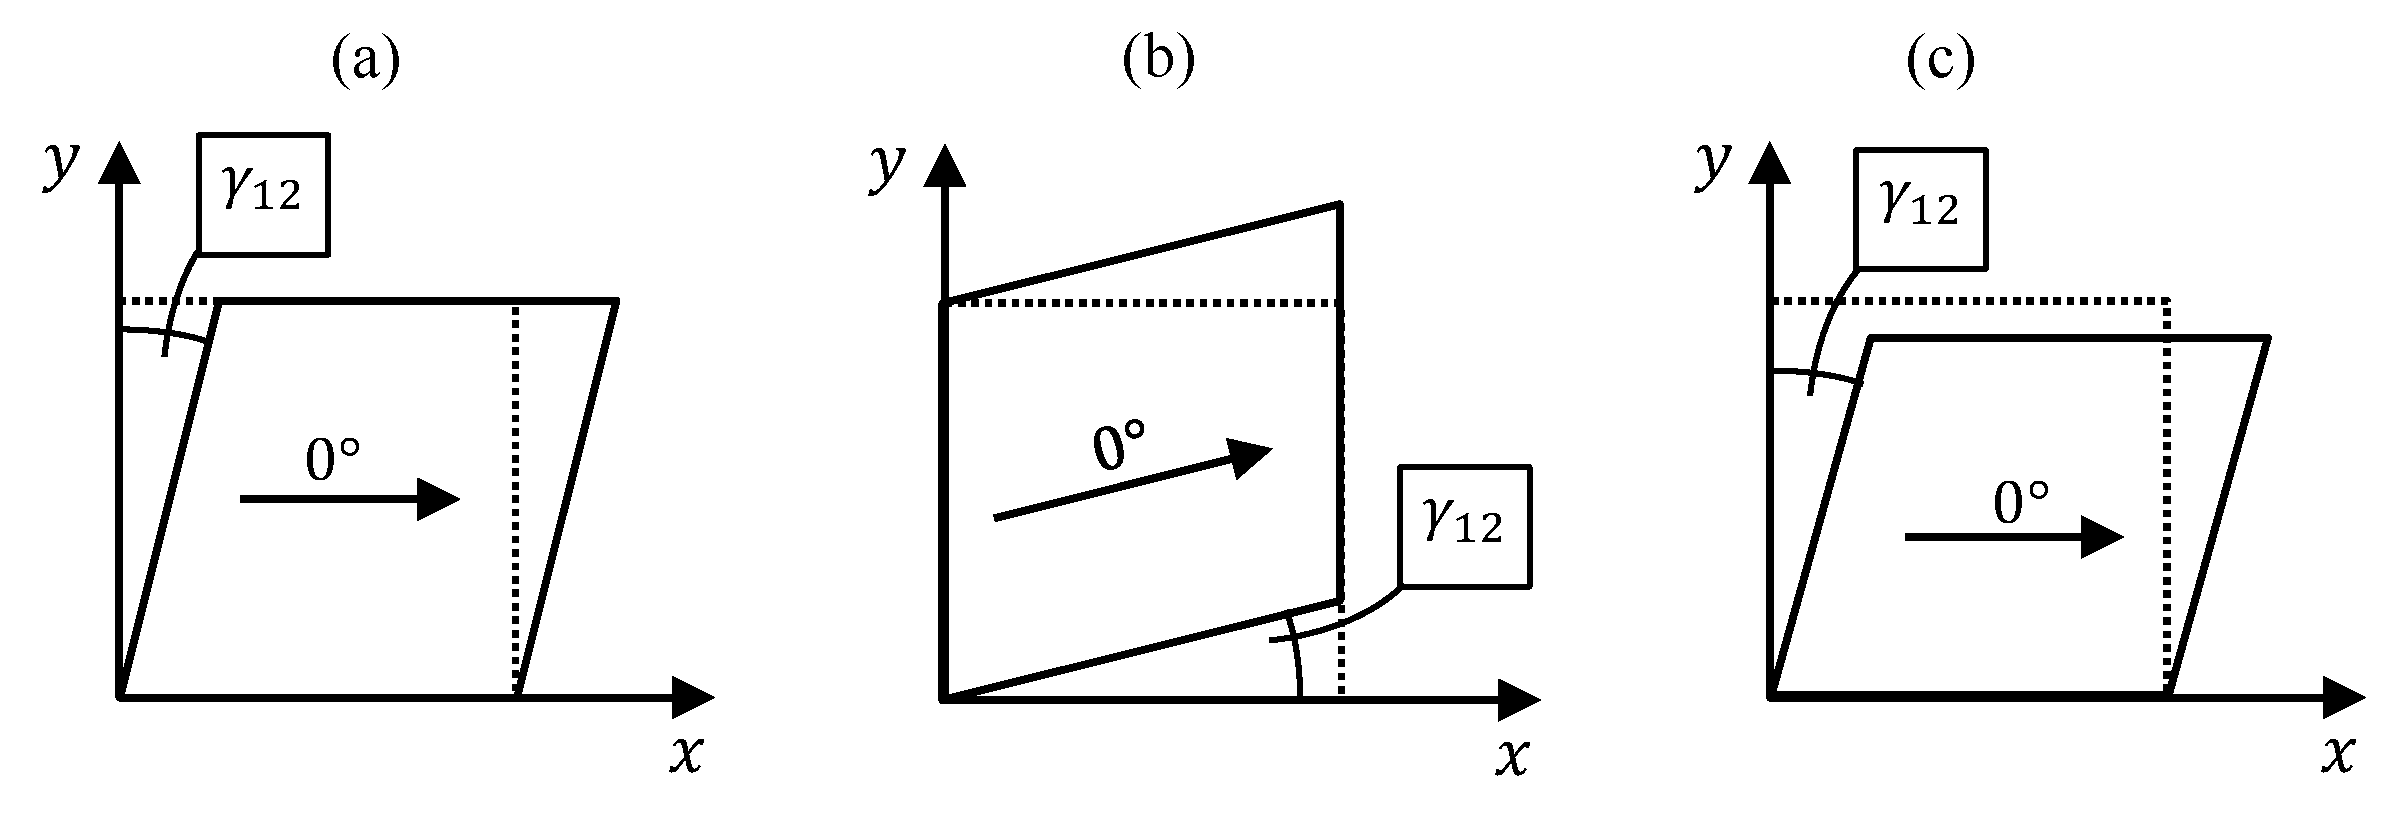
3.1. Strain Measures
3.2. Constitutive Equations
3.3. Model Parameter Identification
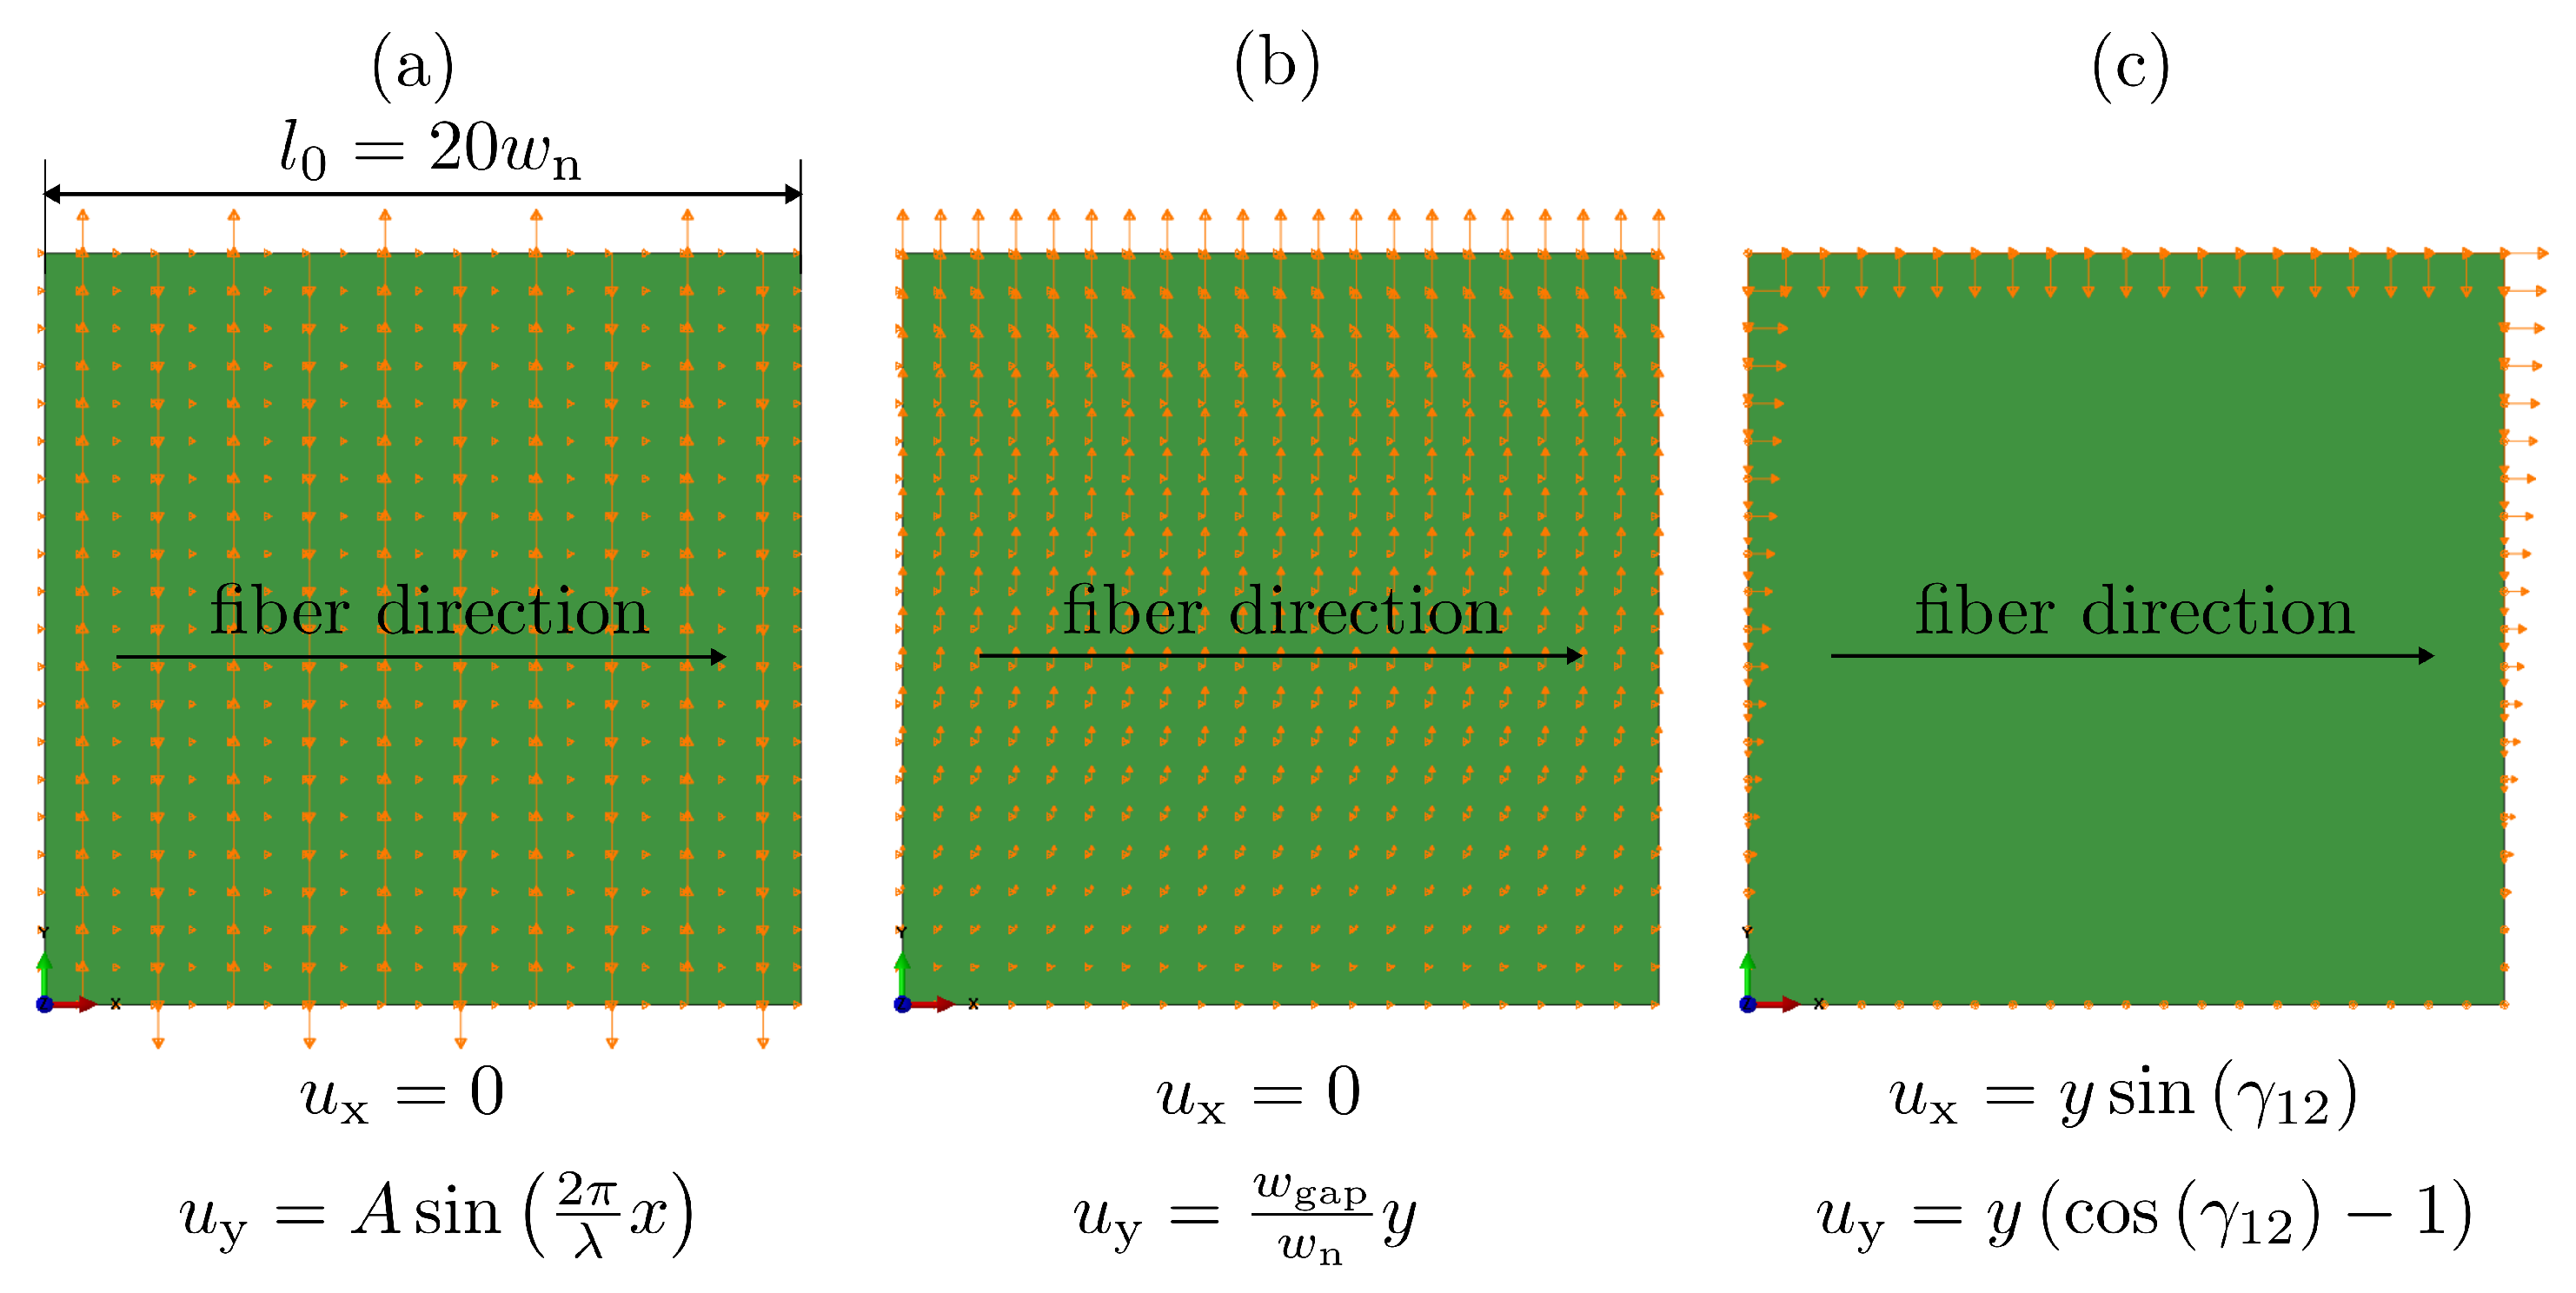
3.4. Simulation Setup
4. Methods to Determine the Resulting Fiber Volume Content
4.1. Determination of the Fiber Volume Content Based on Experiments
4.2. Determination of the Fiber Volume Content Based on Analytical Predictions
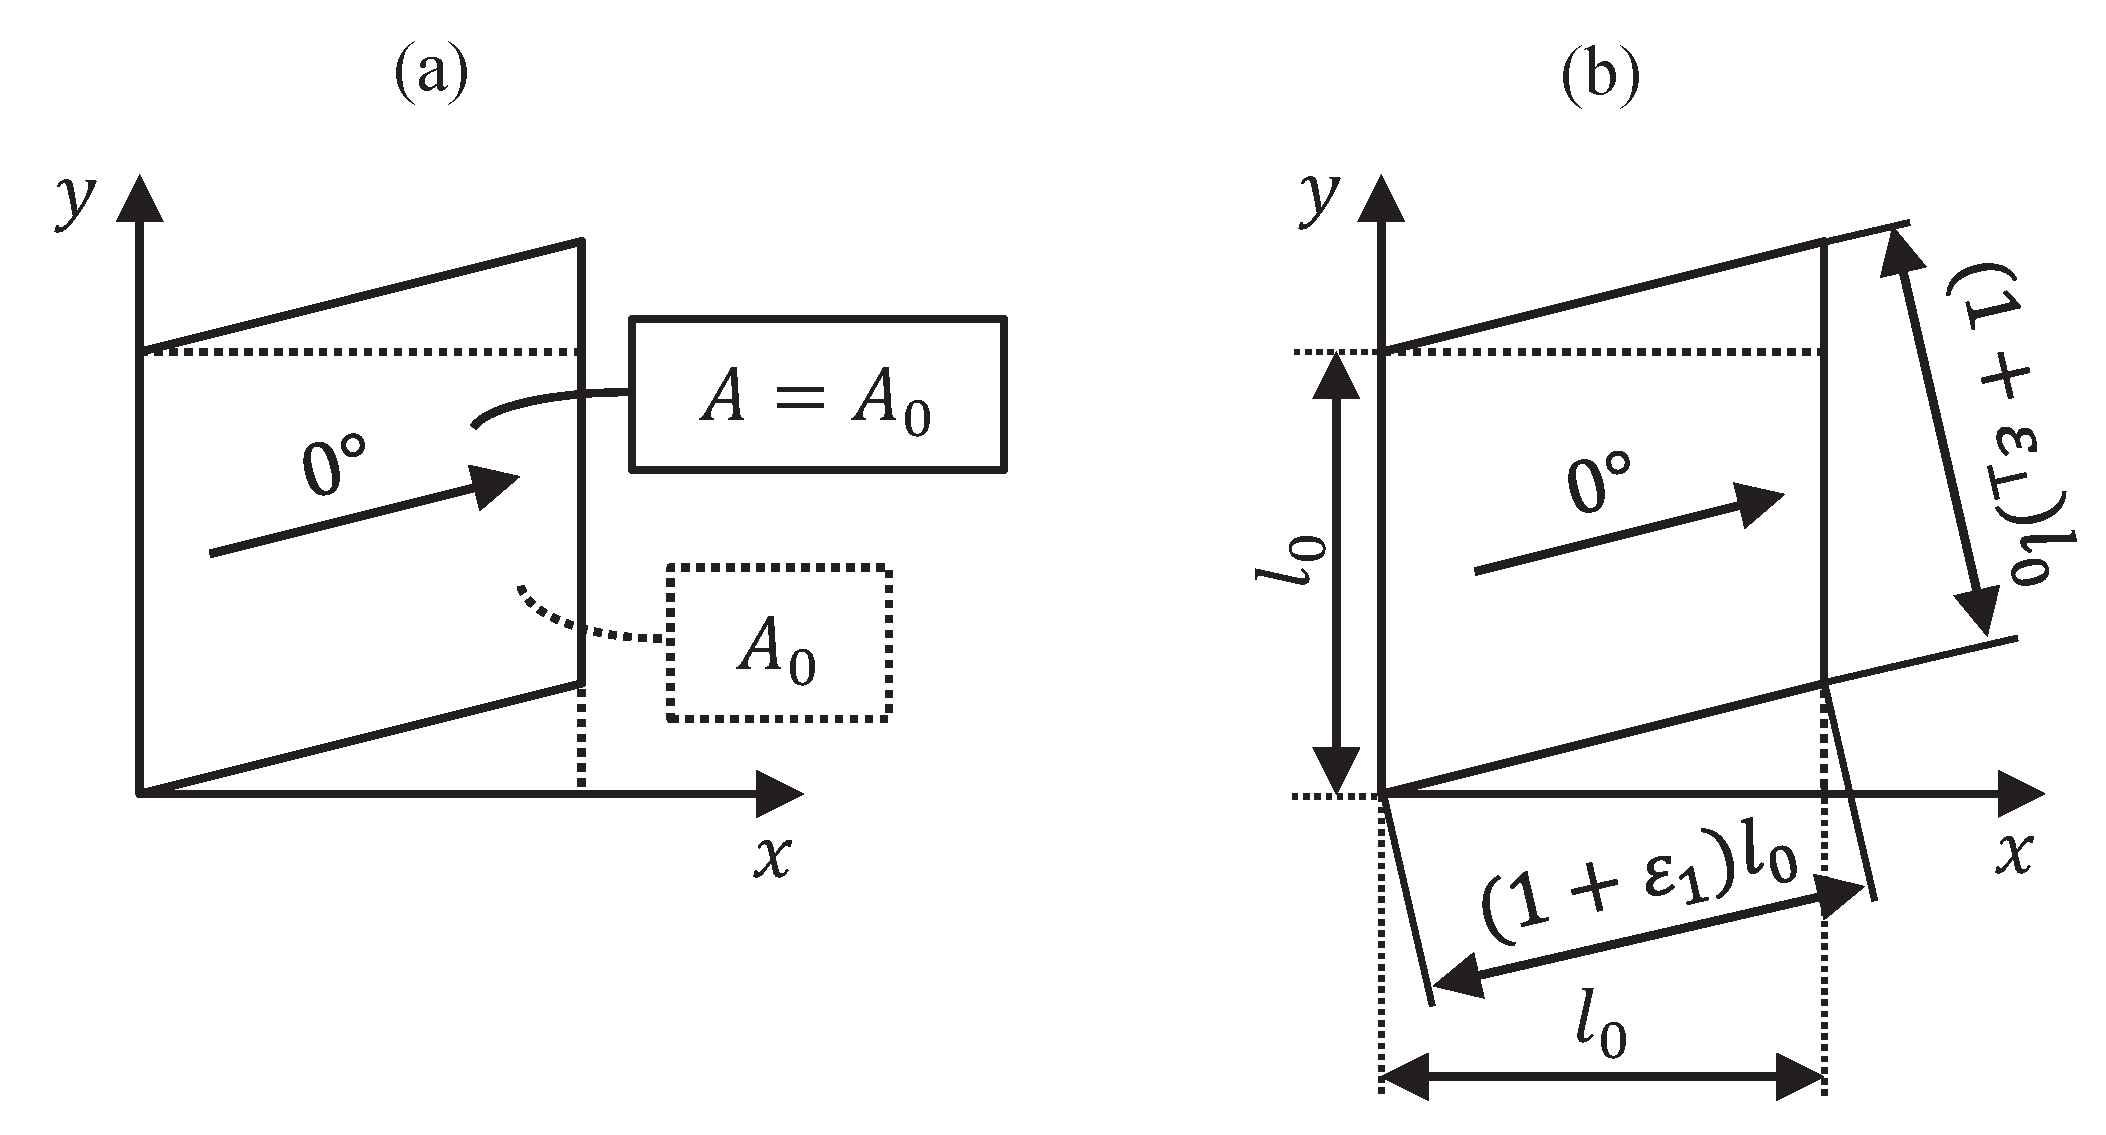
4.2.1. Wavy Pattern
4.2.2. Fiber Gapping
4.2.3. Fiber Shearing
4.3. Determination of the Fiber Volume Content Based on Simulation
5. Results and Evaluation of the Fiber Volume Content Prediction Quality
5.1. Simulation Results
5.2. Experimental Results and Comparison to Simulation Results
5.2.1. Wavy Pattern
5.2.2. Fiber Gapping
5.2.3. Fiber Shearing
6. Interdependency of the Fiber Volume Content at Arbitrary Strain States
7. Conclusions
Author Contributions
Funding
Acknowledgments
Conflicts of Interest
References
- Hufenbach, W.; Böhm, R.; Gude, M.; Berthel, M.; Hornig, A.; Ručevskis, S.; Andrich, M. A test device for damage characterisation of composites based on in situ computed tomography. Compos. Sci. Technol. 2012, 72, 1361–1367. [Google Scholar] [CrossRef]
- Böhm, R.; Stiller, J.; Behnisch, T.; Zscheyge, M.; Protz, R.; Radloff, S.; Gude, M.; Hufenbach, W. A quantitative comparison of the capabilities of in situ computed tomography and conventional computed tomography for damage analysis of composites. Compos. Sci. Technol. 2015, 110, 62–68. [Google Scholar] [CrossRef]
- Kärger, L.; Bernath, A.; Fritz, F.; Galkin, S.; Magagnato, D.; Oeckerath, A.; Schön, A.; Henning, F. Development and validation of a CAE chain for unidirectional fibre reinforced composite components. Compos. Struct. 2015, 132, 350–358. [Google Scholar] [CrossRef]
- Mayer, N.; Prowe, J.; Havar, T.; Hinterhölzl, R.; Drechsler, K. Structural analysis of composite components considering manufacturing effect. Compos. Struct. 2016, 140, 776–782. [Google Scholar] [CrossRef]
- Kärger, L.; Galkin, S.; Zimmerling, C.; Dörr, D.; Linden, J.; Oeckerath, A.; Wolf, K. Forming optimisation embedded in a CAE chain to assess and enhance the structural performance of composite components. Compos. Struct. 2018, 192, 143–152. [Google Scholar] [CrossRef]
- Brunbauer, J.; Stadler, H.; Pinter, G. Mechanical properties, fatigue damage and microstructure of carbon/epoxy laminates depending on fibre volume content. Int. J. Fatigue 2015, 70, 85–92. [Google Scholar] [CrossRef]
- Brunbauer, J.; Pinter, G. Effects of mean stress and fibre volume content on the fatigue-induced damage mechanisms in CFRP. Int. J. Fatigue 2015, 75, 28–38. [Google Scholar] [CrossRef]
- Huang, Z.M. A bridging model prediction of the ultimate strength of composite laminates subjected to biaxial loads. Compos. Sci. Technol. 2004, 64, 395–448. [Google Scholar] [CrossRef]
- Bleier, A. Prüfverfahren zur Ermittlung exakter Werkstoffkennwerte einer unidirektionalen Schicht unter Besonderer Berücksichtigung Physikalischer Nichtlinearitäten. Ph.D. Thesis, RWTH Aachen University, Aachen, Germany, 2011. [Google Scholar]
- Garnich, M.R.; Karami, G. Finite Element Micromechanics for Stiffness and Strength of Wavy Fiber Composites. J. Compos. Mater. 2004, 38, 273–292. [Google Scholar] [CrossRef]
- Karami, G.; Garnich, M. Effective moduli and failure considerations for composites with periodic fiber waviness. Compos. Struct. 2005, 67, 461–475. [Google Scholar] [CrossRef]
- Karami, G.; Garnich, M. Micromechanical study of thermoelastic behavior of composites with periodic fiber waviness. Compos. Part B Eng. 2005, 36, 241–248. [Google Scholar] [CrossRef]
- Hufenbach, W.; Böhm, R.; Thieme, M.; Winkler, A.; Mäder, E.; Rausch, J.; Schade, M. Polypropylene/glass fibre 3D-textile reinforced composites for automotive applications. Mater. Des. 2011, 32, 1468–1476. [Google Scholar] [CrossRef]
- Maron, B.; Garthaus, C.; Hornig, A.; Lenz, F.; Hübner, M.; Gude, M. Forming of carbon fiber reinforced thermoplastic composite tubes—Experimental and numerical approaches. CIRP J. Manuf. Sci. Technol. 2017, 18, 60–64. [Google Scholar] [CrossRef]
- Hufenbach, W.; Hornig, A.; Gude, M.; Böhm, R.; Zahneisen, F. Influence of interface waviness on delamination characteristics and correlation of through-thickness tensile failure with mode I energy release rates in carbon fibre textile composites. Mater. Des. 2013, 50, 839–845. [Google Scholar] [CrossRef]
- Altmann, A.; Taubert, R.; Mandel, U.; Hinterhoelzl, R.; Drechsler, K. A continuum damage model to predict the influence of ply waviness on stiffness and strength in ultra-thick unidirectional Fiber-reinforced Plastics. J. Compos. Mater. 2015, 50, 2739–2755. [Google Scholar] [CrossRef]
- Hsiao, H.M.; Daniel, I.M. Elastic properties of composites with fiber waviness. Compos. Part A Appl. Sci. Manuf. 1996, 27, 931–941. [Google Scholar] [CrossRef]
- Hsiao, H.M.; Daniel, I.M. Effect of fiber waviness on stiffness and strength reduction of unidirectional composites under compressive loading. Compos. Sci. Technol. 1996, 56, 581–593. [Google Scholar] [CrossRef]
- Wang, B.; Uda, N.; Ono, K.; Nagai, H. Effect of micro in-plane fiber waviness on compressive properties of unidirectional fabric composites. J. Compos. Mater. 2018, 52, 2065–2074. [Google Scholar] [CrossRef]
- Takeda, T. Micromechanics Model for Three-dimensional Effective Elastic Properties of Composite Laminates with Ply Wrinkles. Compos. Struct. 2018, 189, 419–427. [Google Scholar] [CrossRef]
- Rudd, C.D.; Middleton, V.; Owen, M.J.; Long, A.C.; McGeehin, P.; Bulmer, L.J. Modelling the processing and performance of preforms for liquid moulding processes. Compos. Manuf. 1994, 5, 177–186. [Google Scholar] [CrossRef]
- McBride, T.M.; Chen, J. Unit-cell geometry in plain-weave fabrics during shear deformations. Compos. Sci. Technol. 1997, 57, 345–351. [Google Scholar] [CrossRef]
- Mohammed, U.; Lekakou, C.; Bader, M.G. Experimental studies and analysis of the draping of woven fabrics. Compos. Part A Appl. Sci. Manuf. 2000, 31, 1409–1420. [Google Scholar] [CrossRef]
- Heardman, E.; Lekakou, C.; Bader, M. In-plane permeability of sheared fabrics. Compos. Part A Appl. Sci. Manuf. 2001, 32, 933–940. [Google Scholar] [CrossRef]
- Louis, M.; Huber, U. Investigation of shearing effects on the permeability of woven fabrics and implementation into LCM simulation. Compos. Sci. Technol. 2003, 63, 2081–2088. [Google Scholar] [CrossRef]
- Demaría, C.; Ruiz, E.; Trochu, F. In-plane anisotropic permeability characterization of deformed woven fabrics by unidirectional injection. Part I: Experimental results. Polym. Compos. 2007, 28, 797–811. [Google Scholar]
- Boisse, P.; Hamila, N.; Madeo, A. The difficulties in modeling the mechanical behavior of textile composite reinforcements with standard continuum mechanics of Cauchy. Some possible remedies. Int. J. Solids Struct. 2018, 154, 55–65. [Google Scholar] [CrossRef]
- Schirmaier, F.J.; Dörr, D.; Henning, F.; Kärger, L. A macroscopic approach to simulate the forming behaviour of stitched unidirectional non-crimp fabrics (UD-NCF). Compos. Part A Appl. Sci. Manuf. 2017, 102, 322–335. [Google Scholar] [CrossRef]
- Dörr, D.; Schirmaier, F.J.; Henning, F.; Kärger, L. A viscoelastic approach for modeling bending behavior in finite element forming simulation of continuously fiber reinforced composites. Compos. Part A Appl. Sci. Manuf. 2017, 94, 113–123. [Google Scholar] [CrossRef]
- Schirmaier, F. Experimentelle Untersuchung und Simulation des Umformverhaltens nähgewirkter unidirektionaler Kohlenstofffasergelege. Ph.D. Thesis, Institut für Fahrzeugsystemtechnik (FAST), Karlsruhe, Germany, 2017. [Google Scholar]
- Cherif, C. Textile Materials for Lightweight Constructions; Springer: Berlin/Heidelberg, Germany, 2016. [Google Scholar]
- Hsiao, H.M.; Wooh, S.C.; Daniel, I.U. Fabrication methods for unidirectional and crossply composites with fiber waviness. J. Adv. Mater. 1995, 26, 19–26. [Google Scholar]
- Brökel, J. Untersuchungen zum Einfluss gezielt Nicht Geradlinig Eingebrachter Faserverstärkungen auf die Mechanischen Eigenschaften einer Nachgiebigen Polymermatrix. Ph.D. Thesis, Lehrstuhl für Konstruktionstechnik und Leichtbau, Rostock, Germany, 2008. [Google Scholar]
- Davidson, P.; Waas, A.; Yerramalli, C.S.; Chandraseker, K.; Faidi, W. Effect of fiber waviness on the compressive strength of unidirectional carbon composites. In Proceedings of the 53rd AIAA/ASME/ ASCE/AHS/ASC Structures, Structural Dynamics and Materials Conference 20th AIAA/ASME/AHS Adaptive Structures Conference 14th AIAA, Honolulu, HI, USA, 23–26 April 2012; p. 1422. [Google Scholar]
- Schirmaier, F.J.; Weidenmann, K.A.; Kärger, L.; Henning, F. Characterisation of the draping behaviour of unidirectional non-crimp fabrics (UD-NCF). Compos. Part A Appl. Sci. Manuf. 2016, 80, 28–38. [Google Scholar] [CrossRef]

| Assumed Fiber Volume Content (FVC) of the Laminate | ||
|---|---|---|
| 48% | 60% | |
| Areal weight 325 /2 (batch 1) | 2.24 | 1.80 |
| Areal weight 338 /2 (batch 2) | 2.33 | 1.87 |
| Experimental | Analytical | Simulation | ||||
|---|---|---|---|---|---|---|
| Amplitude | Ratio | FVC | FVC | Deviation | FVC | Deviation |
| /mm | /- | /% | /% | /% | /% | /% |
| 0.0 | 0.000 | 47.9 | 48.0 | 0.2 | 48.0 | 0.2 |
| 0.5 | 0.025 | 48.2 | 48.3 | 0.3 | 48.2 | 0.2 |
| 1.0 | 0.050 | 49.1 | 49.2 | 0.1 | 49.0 | −0.3 |
| 1.5 | 0.075 | 50.4 | 50.6 | 0.4 | 50.1 | −0.5 |
| 2.0 | 0.100 | 52.0 | 52.4 | 0.9 | 51.7 | −0.6 |
| 2.5 | 0.125 | 52.3 | 54.7 | 4.6 | 53.7 | 2.6 |
| 3.0 | 0.150 | 52.3 | 57.3 | 9.6 | 56.0 | 7.0 |
| 3.5 | 0.175 | 52.3 | 60.2 | 15.3 | 58.6 | 12.1 |
| 4.0 | 0.200 | 52.4 | 63.4 | 20.9 | 61.5 | 17.3 |
| Experimental | Analytical | Simulation | |||
|---|---|---|---|---|---|
| Gap Size | FVC | FVC | Deviation | FVC | Deviation |
| /mm | /% | /% | /% | /% | /% |
| 0.0 | 59.7 | 60.0 | 0.6 | 60.0 | 0.6 |
| 1.1 | 54.5 | 54.6 | 0.2 | 54.6 | 0.2 |
| 2.5 | 51.9 | 50.0 | −3.7 | 50.0 | −3.7 |
| Experimental | Analytical | Simulation | |||
|---|---|---|---|---|---|
| Shear Angle | FVC | FVC | Deviation | FVC | Deviation |
| / | /% | /% | /% | /% | /% |
| 0.0 | 48.1 ± 0.0 | 48.0 | −0.2 | 48.0 | −0.2 |
| 25.0 | 53.3 ± 0.4 | 53.0 | −0.7 | 53.0 | −0.7 |
| 35.5 | 61.2 ± 0.6 | 59.0 | −3.7 | 59.0 | −3.7 |
© 2019 by the authors. Licensee MDPI, Basel, Switzerland. This article is an open access article distributed under the terms and conditions of the Creative Commons Attribution (CC BY) license (http://creativecommons.org/licenses/by/4.0/).
Share and Cite
Galkin, S.; Kunze, E.; Kärger, L.; Böhm, R.; Gude, M. Experimental and Numerical Determination of the Local Fiber Volume Content of Unidirectional Non-Crimp Fabrics with Forming Effects. J. Compos. Sci. 2019, 3, 19. https://doi.org/10.3390/jcs3010019
Galkin S, Kunze E, Kärger L, Böhm R, Gude M. Experimental and Numerical Determination of the Local Fiber Volume Content of Unidirectional Non-Crimp Fabrics with Forming Effects. Journal of Composites Science. 2019; 3(1):19. https://doi.org/10.3390/jcs3010019
Chicago/Turabian StyleGalkin, Siegfried, Eckart Kunze, Luise Kärger, Robert Böhm, and Maik Gude. 2019. "Experimental and Numerical Determination of the Local Fiber Volume Content of Unidirectional Non-Crimp Fabrics with Forming Effects" Journal of Composites Science 3, no. 1: 19. https://doi.org/10.3390/jcs3010019
APA StyleGalkin, S., Kunze, E., Kärger, L., Böhm, R., & Gude, M. (2019). Experimental and Numerical Determination of the Local Fiber Volume Content of Unidirectional Non-Crimp Fabrics with Forming Effects. Journal of Composites Science, 3(1), 19. https://doi.org/10.3390/jcs3010019