Article

Optimising WC-25Co Feedstock and Parameters for Laser-Directed Energy Deposition

by
Helder Nunes
1,2,
José Nhanga
1,
Luís Regueiras
2,
Ana Reis
1,2,
Manuel F. Vieira
1,2,
Bruno Guimarães
3,
Daniel Figueiredo
3,
Cristina Fernandes
3 and
Omid Emadinia
2,*
1
Faculty of Engineering, University of Porto, R. Dr. Roberto Frias, 4200-465 Porto, Portugal
2
LAETA-INEGI—Instituto de Ciência e Inovação em Engenharia Mecânica e Industrial, R. Dr. Roberto Frias 400, 4200-465 Porto, Portugal
3
R&D Department, Palbit, S.A., P.O. Box 4, 3854-908 Branca, Portugal
*
Author to whom correspondence should be addressed.
J. Manuf. Mater. Process. 2025, 9(8), 279; https://doi.org/10.3390/jmmp9080279
Submission received: 2 July 2025 / Revised: 5 August 2025 / Accepted: 13 August 2025 / Published: 14 August 2025

Abstract

Laser-Directed Energy Deposition (L-DED) is an additive manufacturing technique used for producing and repairing components, mainly for coating applications, depositing metal matrix composites such as cemented carbides, composed of hard metal carbides and a metallic binder. In this sense, this study evaluated the preparation of a ready-to-press WC-25Co powder as a reliable feedstock for L-DED process. This powder required pre-heat treatment studies to prevent fragmentation during powder feeding, due to the absence of metallurgical bonding between WC and Co particles. In the current study, the Taguchi methodology was used, varying laser power, powder feed rate, and scanning speed to reach an optimised deposition window. The best bead morphology resulted from 2400 W laser power, 11 mm/s scanning speed, and 9 g/min feed rate. Moreover, defects such as porosity and cracking were mitigated by applying a remelting strategy of 2400 W and 9 mm/s. Therefore, a perfect deposition is obtained using the optimised processing parameters. Microstructural analysis of the optimised deposited line revealed a fine structure, comprising columnar and equiaxed dendrites of complex carbides. The average hardness of the deposited WC-25Co powder on a AISI 1045 steel was 854 ± 37 HV0.2. These results demonstrate the potential of L-DED for processing high-performance cemented carbide coatings.

1. Introduction

Cemented carbides (also known as hardmetals) such as tungsten carbide–cobalt (WC-Co) are a composite material widely used in wear-resistant applications, due to high hardness, toughness, and wear resistance. Cemented carbides are crucial in the tooling industry, such as in mining or high-speed machining, where extreme performance is necessary [1]. These materials are traditionally produced through powder metallurgy routes or thermal spray processes. The application of additive manufacturing (AM) processes, mainly Laser-Directed Energy Deposition (L-DED), can provide more advantages such as producing complex geometries, generating gradients of chemical composition and/or microstructure, and even locally defined compositions/microstructure [2,3].
In recent years, AM technologies, particularly the directed energy deposition approach, have emerged as promising alternatives for fabricating WC-Co parts. L-DED offers unique advantages, including tailoring microstructures in situ, in addition to repairing purposes. Nevertheless, DED processing of cemented carbides poses significant challenges, thus requiring adequate definitions of optimal production parameters to avoid defects like cracks and porosity, providing a good balance between hardness and toughness, etc. [4,5,6]. To achieve this, two approaches have been implemented: depositing parameter optimisation and modifying chemical composition.
Several studies used design-of-experiment (DoE) methodologies, like Taguchi orthogonal arrays, to find optimal processing parameters, like laser power, feeding rate, and scanning speed, producing single and multiple tracks of WC-12Co by L-DED with only a small quantity of defects. These studies [7,8,9] reported that a narrow processing window could produce defect-free tracks. For example, Erfanmanesh et al. [7] state that for minimal porosity, the laser power should range from 200 to 250 W, with a feeding-rate-to-scanning-speed ratio between 50 and 75 g/m. The authors also established statistical relations of several track characteristics, such as track height and width, penetration depth, and wetting angle, with the deposition parameter. In a later study [10], the authors examined the microstructure of WC–12Co tracks and observed a significant difference between the near-interface region and the middle and upper regions of the coating. At the interface, the microstructure primarily consisted of (Co,Fe)3W3C and a eutectic mixture of WC and α-(Fe,Co). This formation was mainly attributed to the dilution of the 316L substrate, dissolution of WC, and carbon oxidation. In contrast, the microstructures of the middle and upper regions of the claddings were mainly composed of a mixture of large and small WC particles, ranging in size from 1 to 20 μm. Additionally, η-phase and W2C phase were dispersed within the matrix. This complex microstructure contributed to the high microhardness of the WC–12Co cladding, reaching approximately 1750 HV, in the upper region of the cladding.
Other studies focused on changing the composition of the deposited material, mainly by adding Ni or alloying in situ with Ni powder [11], by creating a functional graded material along the building direction [12], or by coating the WC-Co powder through electroless technique before L-DED [10]. Moreover, the application of post-processing treatments such as laser remelting or heat treatments was also useful to enhance the overall qualities of the deposited tracks for the mitigation of defects. Liverani et al. [13] found that remelting with a laser power of ~650 W produced smoother and less wavy track surfaces.
Regarding the performance of WC-Co, it is mainly influenced by the cobalt content, which dictates mechanical behaviour. Cemented carbides containing approximately 12 wt.% cobalt feature a high proportion of hard WC particles, resulting in superior hardness (~1500 HV) and wear resistance, which is ideal for fabricating precision cutting and abrasion-intensive tools. In contrast, the increase in cobalt, e.g., WC-25Co, enhances toughness and resistance to mechanical shocks, and it is attributed to the higher fraction of the ductile binder matrix. Although this increase in cobalt reduces overall hardness (~800 HV), it significantly improves the material’s ability to withstand impact and fracture, making it better suited for heavy-duty applications such as mining, cold forming, and construction tools [14,15,16]. The exceptional WC-Co properties make it a promising material for application in protective coatings and repair of wear components through surface hardening and wear protection. Moreover, WC-Co is applied for the components used in the oil and moulding industries, providing wear and corrosion resistance. Furthermore, only a few L-DED applications using WC-Co have been directed at repairing [17,18], and most have been on coatings [7,9,10,12,13,19,20,21,22,23,24,25,26,27,28,29,30,31]. Since increased Co content in WC-25Co also enhances coating integrity by reducing brittleness, cracking, and porosity during processing. These advantages are particularly relevant in additive manufacturing, where thermal and mechanical stresses are high [32,33]. In the context of AM, WC-25Co thus offers great potential since it may enhance toughness and processability to produce long-lasting coatings for demanding applications.
Regarding the granule size range, as an essential parameter affecting powder processability, these studies used WC-Co granulated powders with a minimum of 10 µm to 45 µm and a maximum of 32 µm to 270 µm granule sizes. The chemical compositions used were mostly 12 wt.% of Co, with a few using 8%, 10%, and 25% of Co, independently of the application [34,35,36]. Besides L-DED, the second most used AM process is laser powder bed fusion, using a range of Co content from 6% to 32%, mostly 17 wt.%, and the granule size range from 10 µm as the minimum to 125 µm as the maximum [37,38,39,40,41,42,43,44,45,46,47,48,49].
This study explores the feasibility of using WC-25Co ready-to-press granules (that is normally used in powder metallurgical routes in Palbit S.A.) in an L-DED process. An experimental framework based on Taguchi orthogonal arrays optimised key processing parameters—laser power, scan speed, powder feed rate, substrate preheating, and remelting strategies—to obtain crack-free and pore-free deposits, ensuring adequate adhesion with the substrate, which means defect-free as well. Hence, this study mainly involves microstructural characterisations.
The motivation was also to explore a new application for the ready-to-press (RTP) WC-Co hard metal compositions, besides the powder metallurgical routes, and investigate the feasibility of using the spray drier process for production of powders for DED. This will open a new opportunity to fulfil the gap market of WC-Co compositions with different Co contents.

2. Materials and Methods

2.1. WC-Co Granules

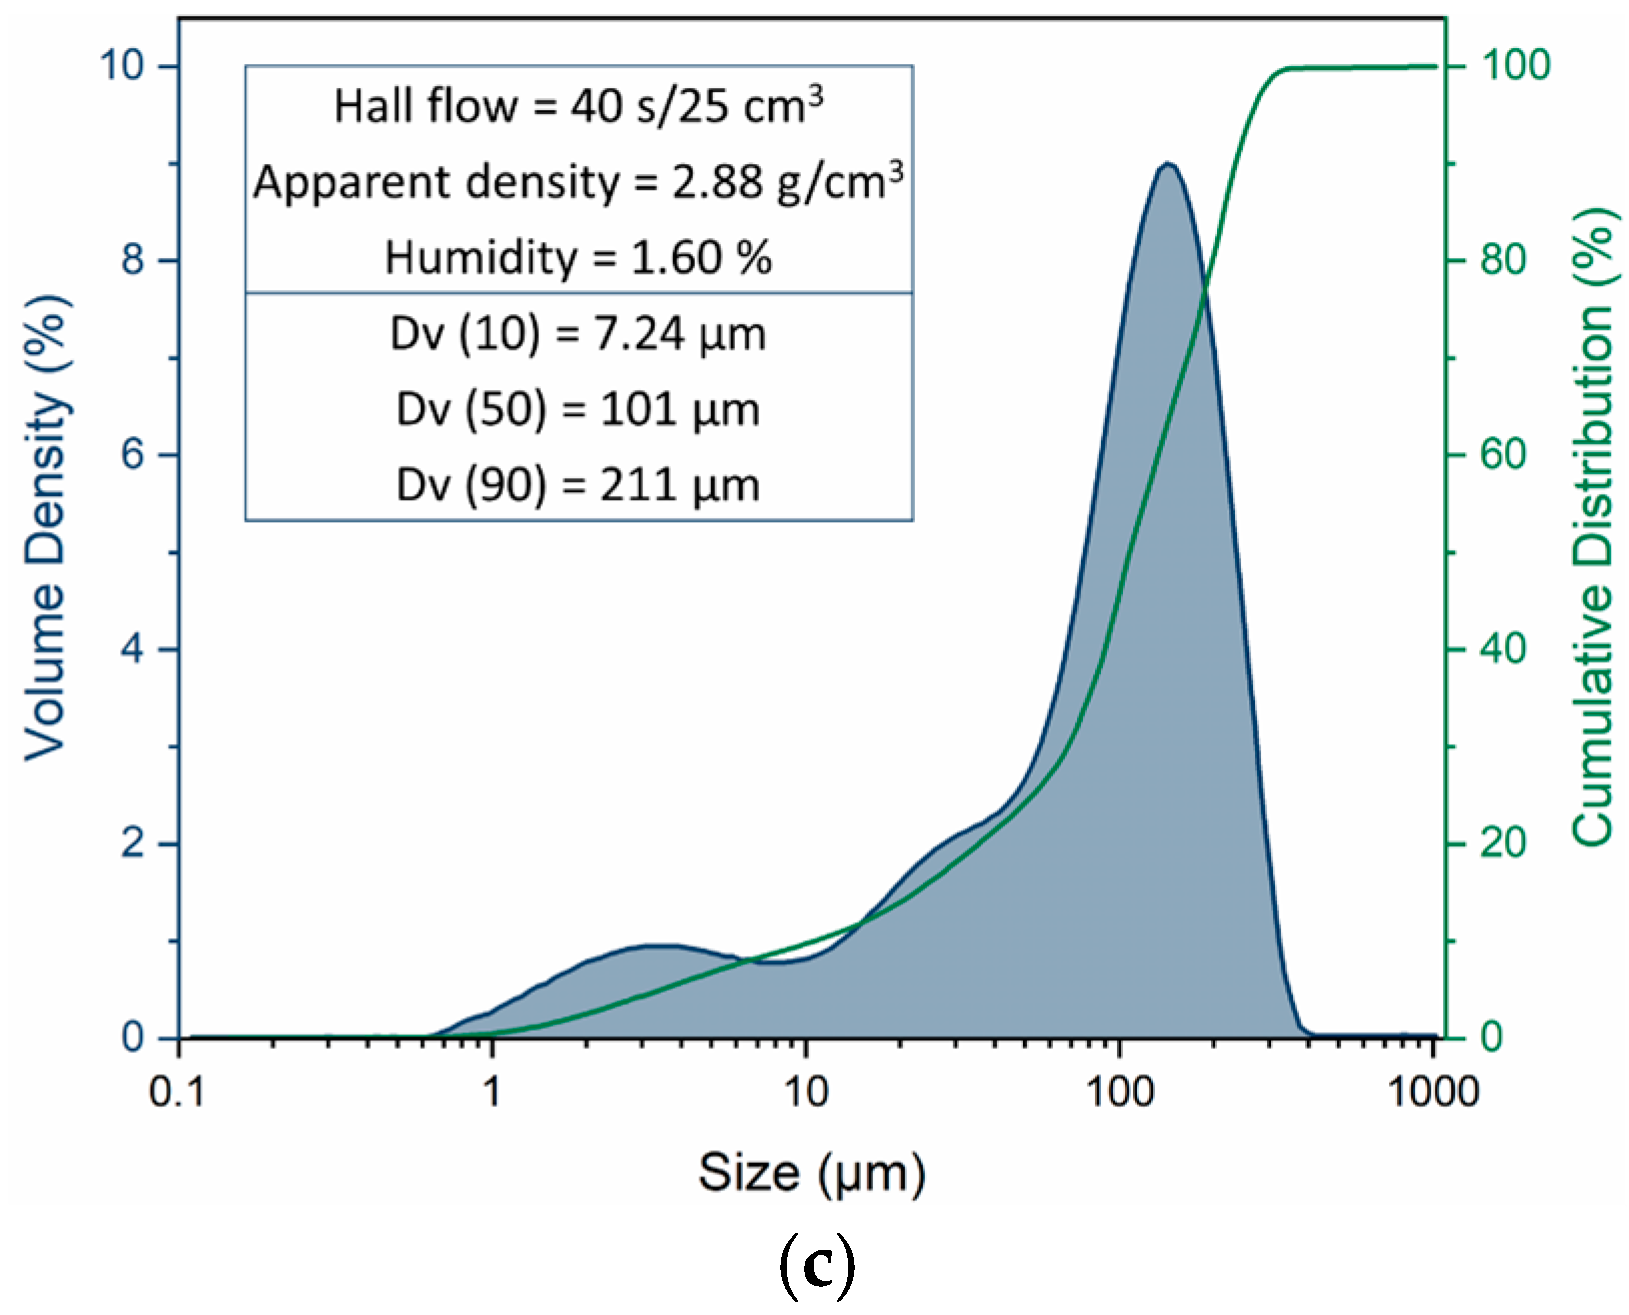
The starting material in the current study was RTP WC-25Co granules (Figure 1a). Each of these granules consists of medium size WC particles (~3 μm) and even smaller Co particles (<1 μm) (Figure 1b) containing 2 wt.% paraffin wax produced by spray drying, a process where an aqueous based suspension of WC and Co powders with pressing binder (paraffin wax) is rapidly dried into spherical granules. This process produces granules with good compressibility and flowability. The average size (D50) of the WC-25Co RTP granules is almost 100 μm, while D90 is close to 210 μm, as depicted in Figure 1c. Other characteristics are also indicated in Figure 1c, as density and flowability, with values 2.88 g/cm3 and 40 s/25 cm3, respectively.
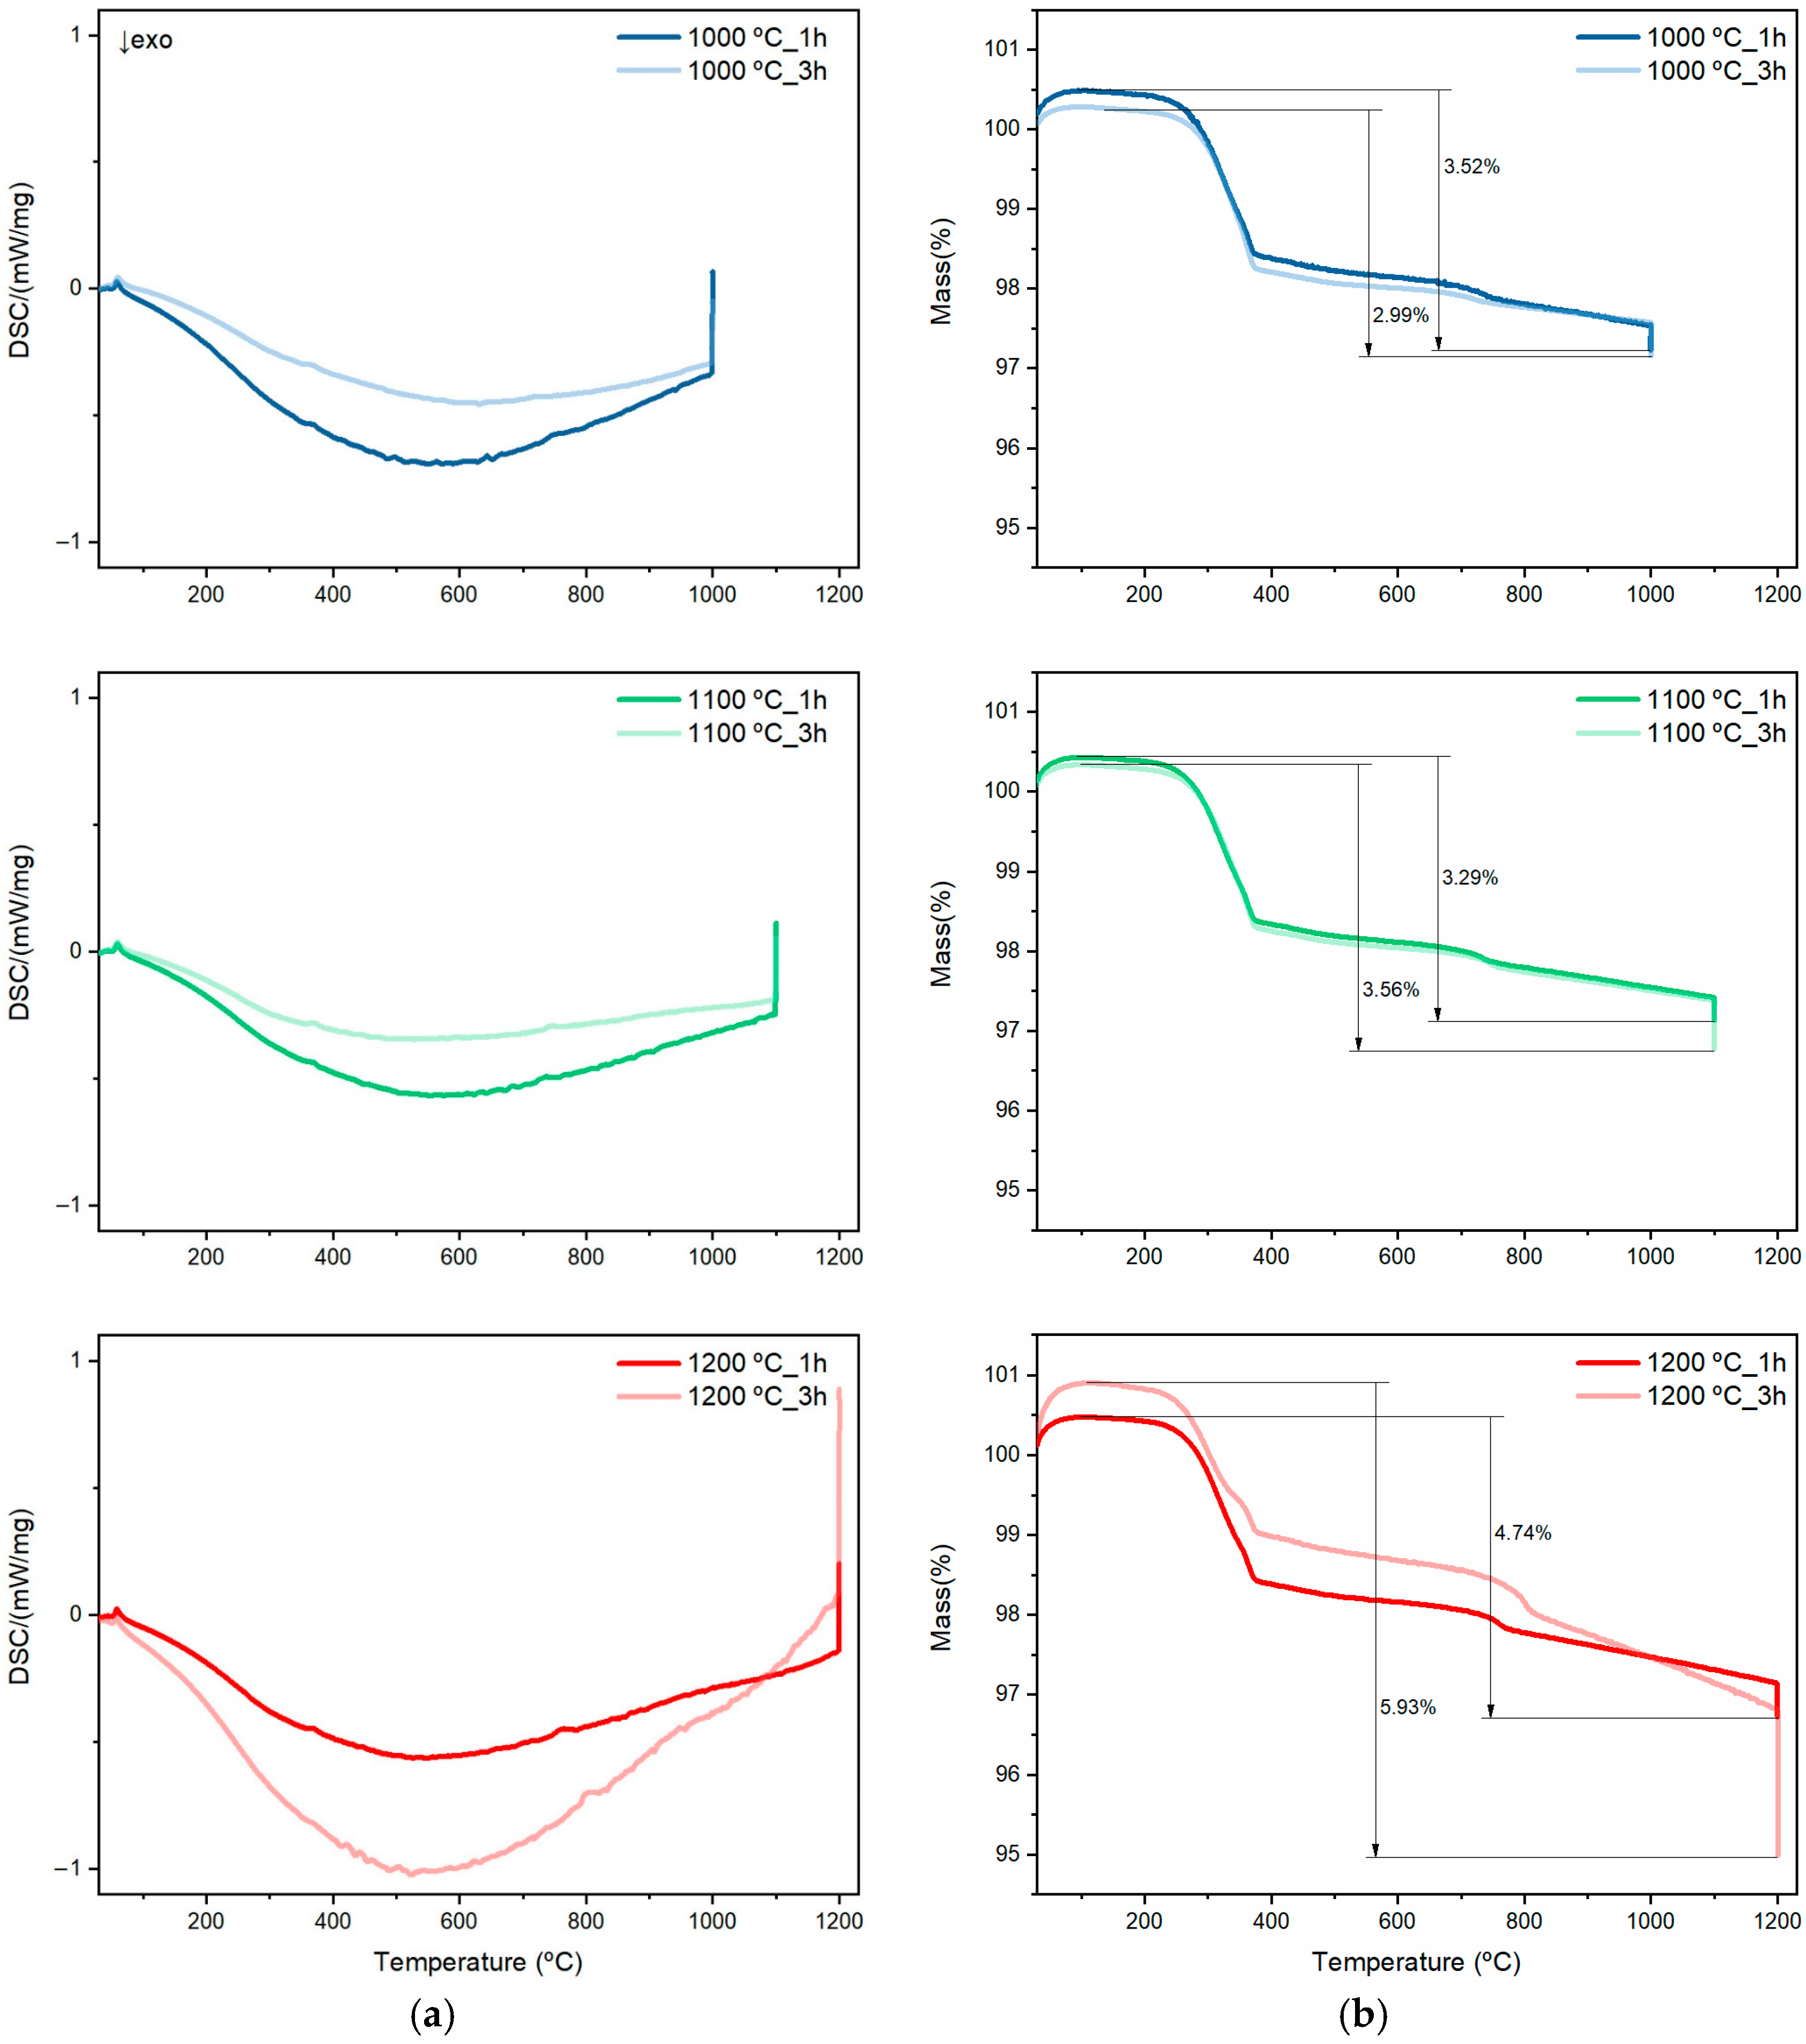
As illustrated in the inset in Figure 1b, the granules consist of non-bonded very fine particles that do not allow them to be stable during the feeding process from the hopper to the laser head in the L-DED process. The granules are extremely prone to breaking down into individual, very fine particles of WC and Co, clogging the nozzle. Thus, the creation of some metallurgical bonding between the particles was needed. The solution can be achieved via a thermal treatment such as a partial sintering cycle, since otherwise, complete sintering will cause the WC-Co granules to strongly agglomerate with each other, losing flowability and depositability. Hence, this study was conducted with differential scanning calorimetry–thermogravimetric analysis (DSC-TGA) using NETZSCH STA 449F5 (NETZSCH Analyzing & Testing: Selb, Germany) with a single-stage thermal cycle to optimise a heat-treating process to obtain adequate feedstock for the L-DED process, which means having flowability and the ability to withstand the feeding process. Three different temperatures (1000, 1100, and 1200 °C) and two durations (1 h and 3 h) for the isothermal stage were studied. Thus, six DSC studies were carried out with different thermal cycles. The heating and cooling rate was constant at 10 °C/min, and an Ar flux of 80 mL/min was used in all cycles to avoid oxidation. Every DSC-TGA test involved ~100 mg of WC-25Co powder, filled in an alumina crucible, using an empty crucible as a reference. The results were analysed using the NETZSCH Proteus software V8.0. With the optimal condition chosen from DSC-TGA analysis, an industrial heat-treating furnace was used to produce a large quantity of powder, which was then sieved to collect a particle size ranging from 20 µm to 150 µm for depositing by L-DED. The particle size distribution (PSD) of the dry powder was measured by the laser diffraction technique with the Mastersizer Aero Malvern equipment (Malvern Panalytical, Malvern, Worcestershire, UK), which employs a Mie scattering method. The powder’s flowability was measured using the Hall flowmeter method.

2.2. DED Deposition

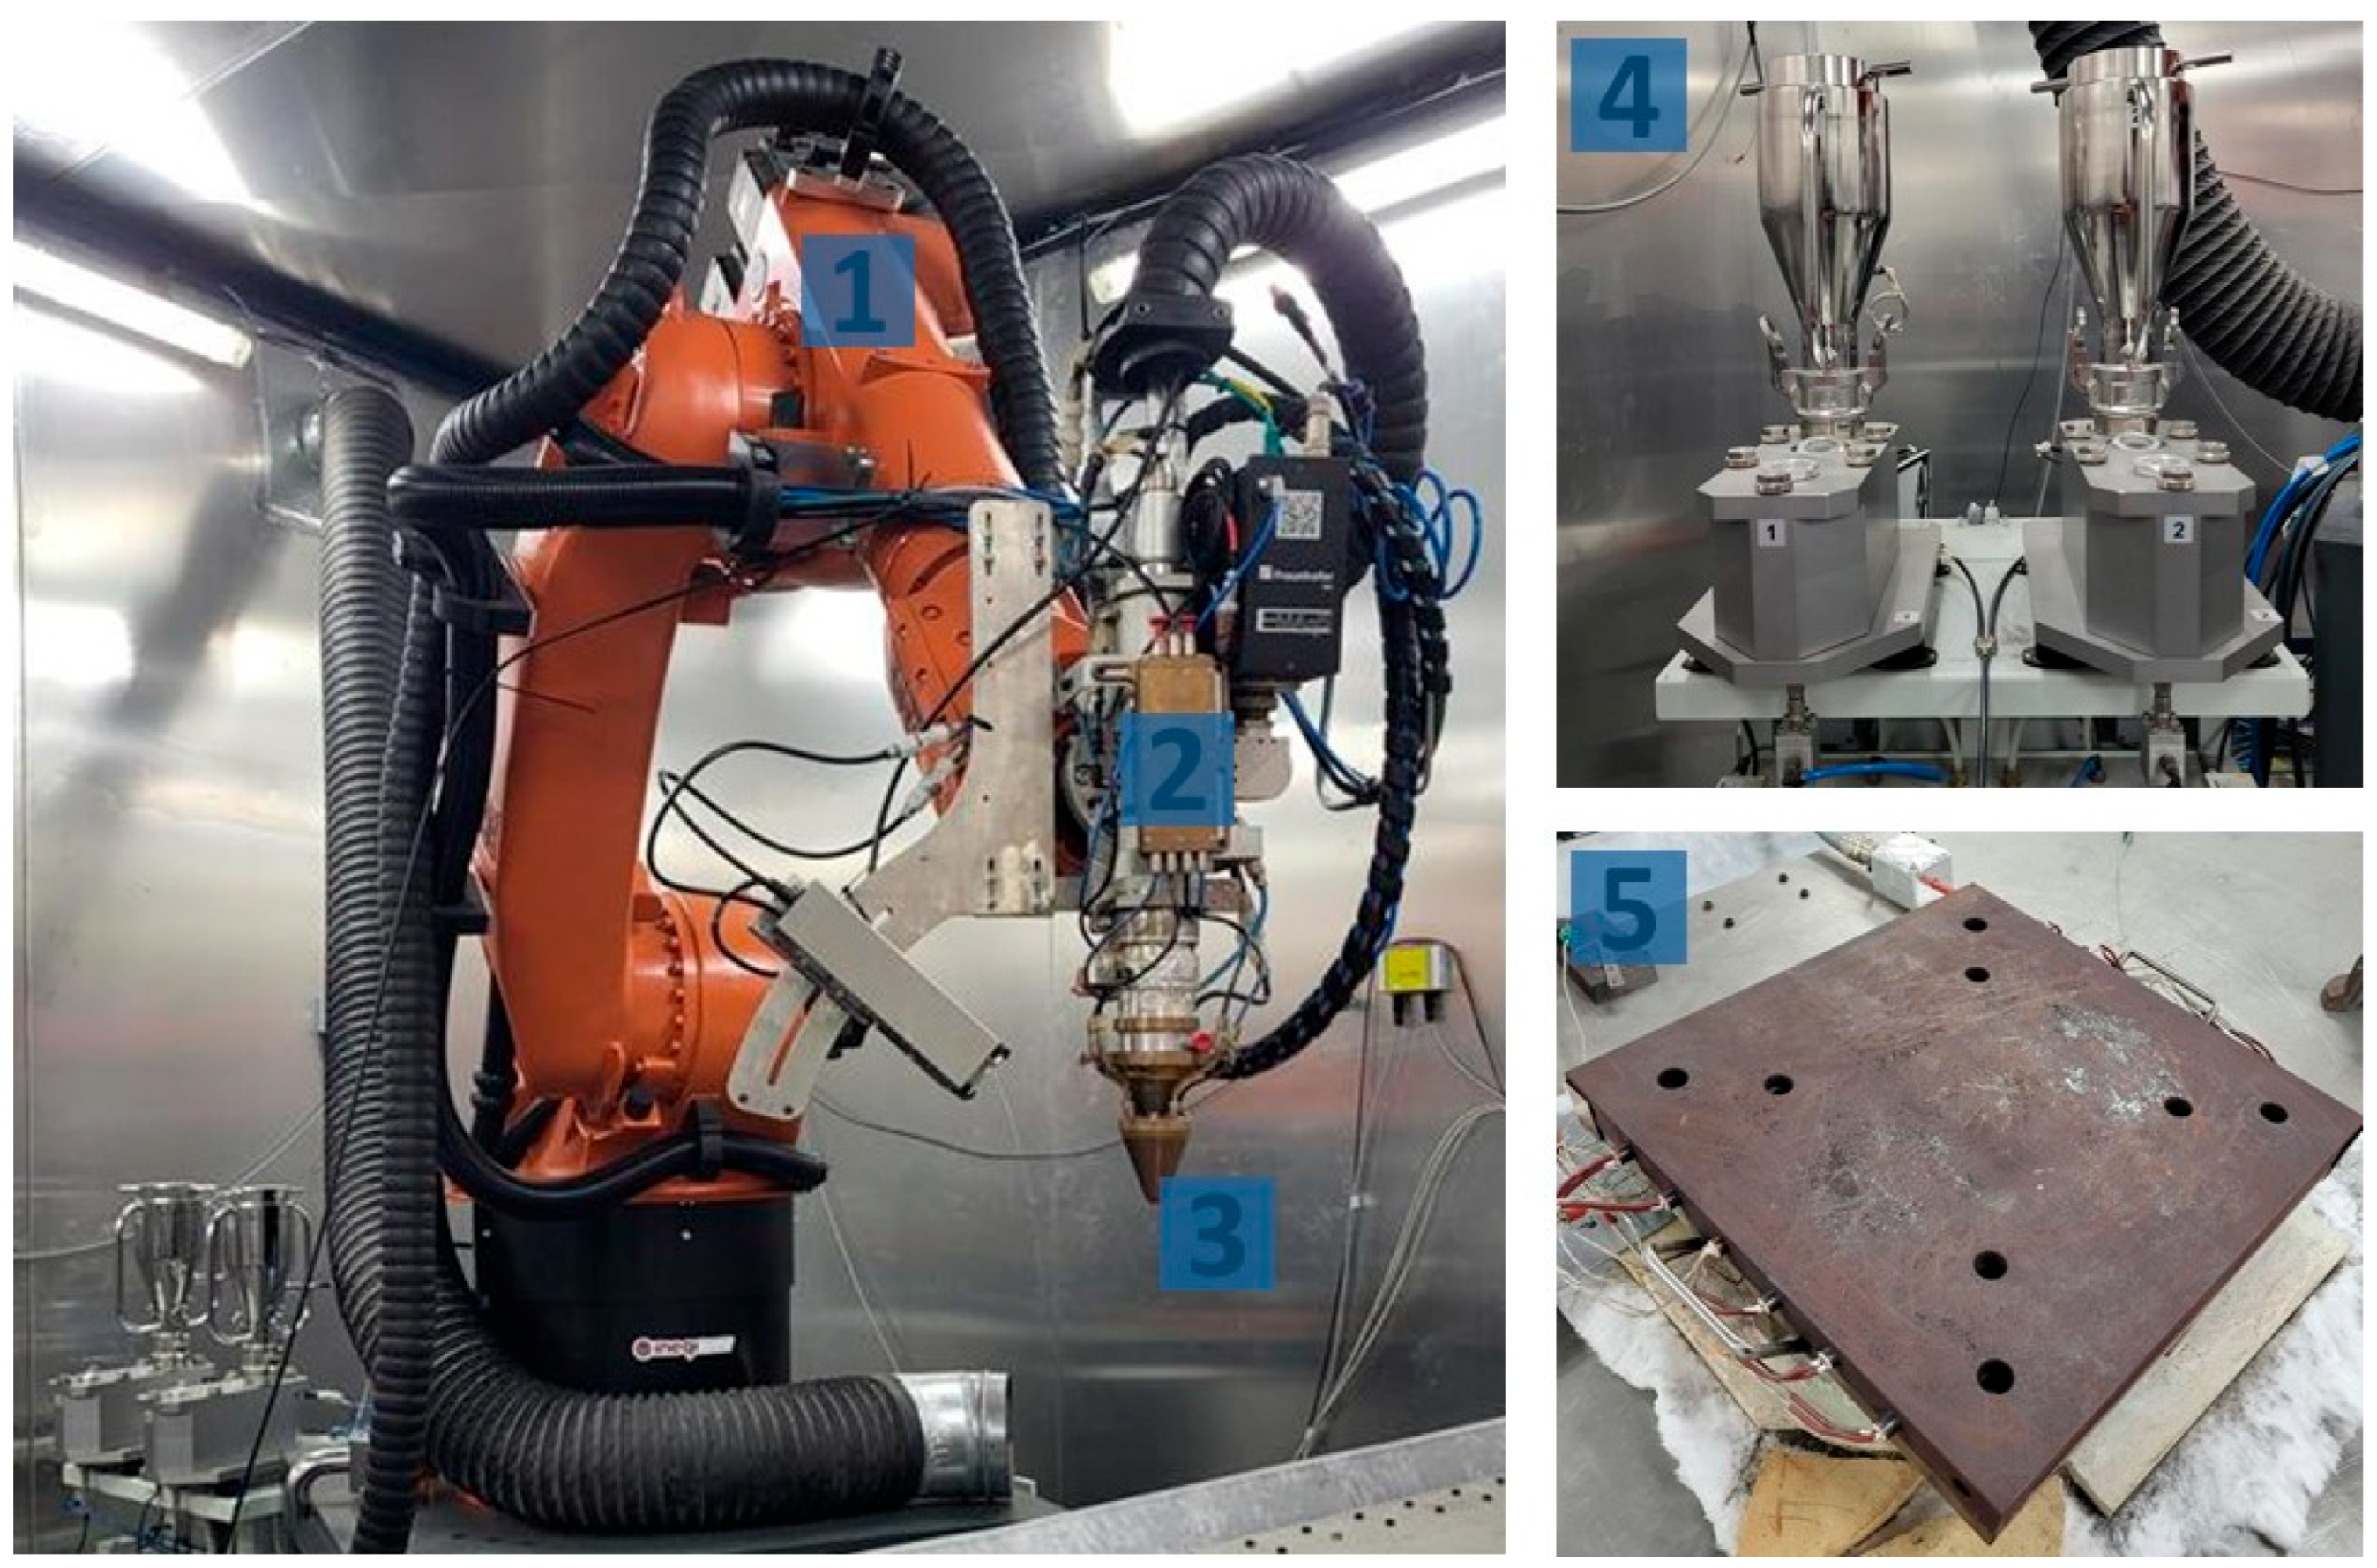
The L-DED equipment used to produce the samples—including parameter definition tracks and coatings—consists of an integrated system that ensures precise control of powder delivery, energy input, and robot motion, encompassing the following main elements (as shown in Figure 2):
  • Six-axis KUKA industrial robot (Augsburg, Germany), on which the nozzle and powder splitter are assembled (1);
  • Powder splitter from Fraunhoffer IWS (Dresden, Germany), used to distribute the powder through four output channels (2);
  • COAX12V6 nozzle head from Fraunhoffer IWS (Germany), featuring cooling capacity up to 6000 W, when working in continuous mode (3);
  • Two Medicoat AG disc powder feeders (Mägenwil, Switzerland), that allow smooth powder flow (without pulsation) between 0.5 g/min and 100 g/min (4);
  • Coherent Highlight FL3000 laser source (Santa Clara, CA, USA), capable of delivering 3000 W in continuous wave, producing a laser with a spot size of 2.1 mm.
  • Argon as shielding gas regulated to 6 bar pressure and a constant flow of 10 L/min in all deposits;
The preparation of the deposit jobs, namely the robot coordinates and selected parameters, was defined manually by writing KRL (KUKA Robot Language) code using an open-source code editor. The lines were deposited on AISI 1045 steel substrate (steel block with dimensions of 150 × 100 × 30 mm prepared by stone grinding), which was preheated to 200 °C using the heating plate, presented as 5 in Figure 2.

2.3. Taguchi Metodology

Taguchi methodology was used for DoE to find the optimal conditions for L-DED of WC-25Co granules. The DoE used consisted of an initial orthogonal array composed of three parameters: laser power (W), scanning speed (mm/s), and feeding rate (g/min). The first orthogonal array had five levels for each parameter. Thus, an L25 (53) orthogonal array was created. After each deposition, a visual assessment of the deposited line was performed. This evaluation focused on three qualitative features: the presence of cracks, surface roughness, and track morphology. Each feature was rated on a scale from 0 (worst) to 5 (best), and the total score was used as a simplified quality index to facilitate rapid parameter screening. This approach enabled an efficient narrowing of the parameter range. While for the first three arrays, one line was printed for each run, for the final orthogonal array, which was composed of three levels for each parameter, leading to an L9, each run was repeated three times. Table 1 summarises the four Taguchi orthogonal arrays that were used. The global energy density (GED) was calculated for each run following Equation (1):
G E D   J m m 2 = L a s e r   P o w e r   W S c a n n i n g   S p e e d   m m s × L a s e r   S p o t   S i z e   m m  
After optimising the deposition parameters, it was necessary to investigate post-deposition processing methods to minimise defects such as porosity. The approach selected was to remelt the deposited lines immediately after deposition using the same L-DED equipment. Two strategies were implemented to identify the optimal combination of laser power and scanning speed for remelting. These aimed to enhance track quality and reduce internal defects. The specific parameters tested are summarised in Table 2.

2.4. Material Characterisation

Cross-sectional (transverse and longitudinal) samples were prepared using a conventional metallographic preparation procedure. Microstructural analysis was carried out with a scanning electron microscope FEI Quanta 400 FEG in backscatter electron mode (Thermo Fisher Scientific, Hillsboro, OR, USA). Localised chemical composition was determined using energy-dispersive X-ray spectroscopy (EDS) with the EDAX Genesis X4M system (Oxford Instrument, Abingdon, Oxfordshire, UK). Quantitative image analysis for porosity was carried out using the FIJI 1.54 [50] software and the BAR plugin [51].
Hardness testing was performed on depth profiles of several indentations, using Vickers microhardness tests (test force of 1.961 N), following standard ISO 6507-1:2023 [52], conducted with EMCO-TEST Zwick/Roell equipment (ZwickRoell, Ulm, Germany).

3. Results and Discussion

3.1. Thermal Treatment

Figure 3a shows the DSC curves of the different cycles. No significant endothermic peaks are observed during heating, since the eutectic point for WC-Co (~1280 °C) was not reached. Analysing the TGA results in Figure 4b, it is possible to observe that the mass loss is more intense as the stage time and temperature increase. The first significant dip, almost 370 °C, is similar between all curves and corresponds to vaporisation of the paraffin wax. As the temperature increases, the mass loss slows, reaching its maximum at the stage level. This mass loss is due to the outgassing of the WC, which means the formation of CO2 gas is from the reduction of the metal carbides, which is in accordance with the results already reported by Eso [53]. It is also important to note that at the end of the 1200 °C for 3 h cycle, the material was stuck together to the crucible, mainly due to sintering between the granules, which is not the objective of this thermal treatment.
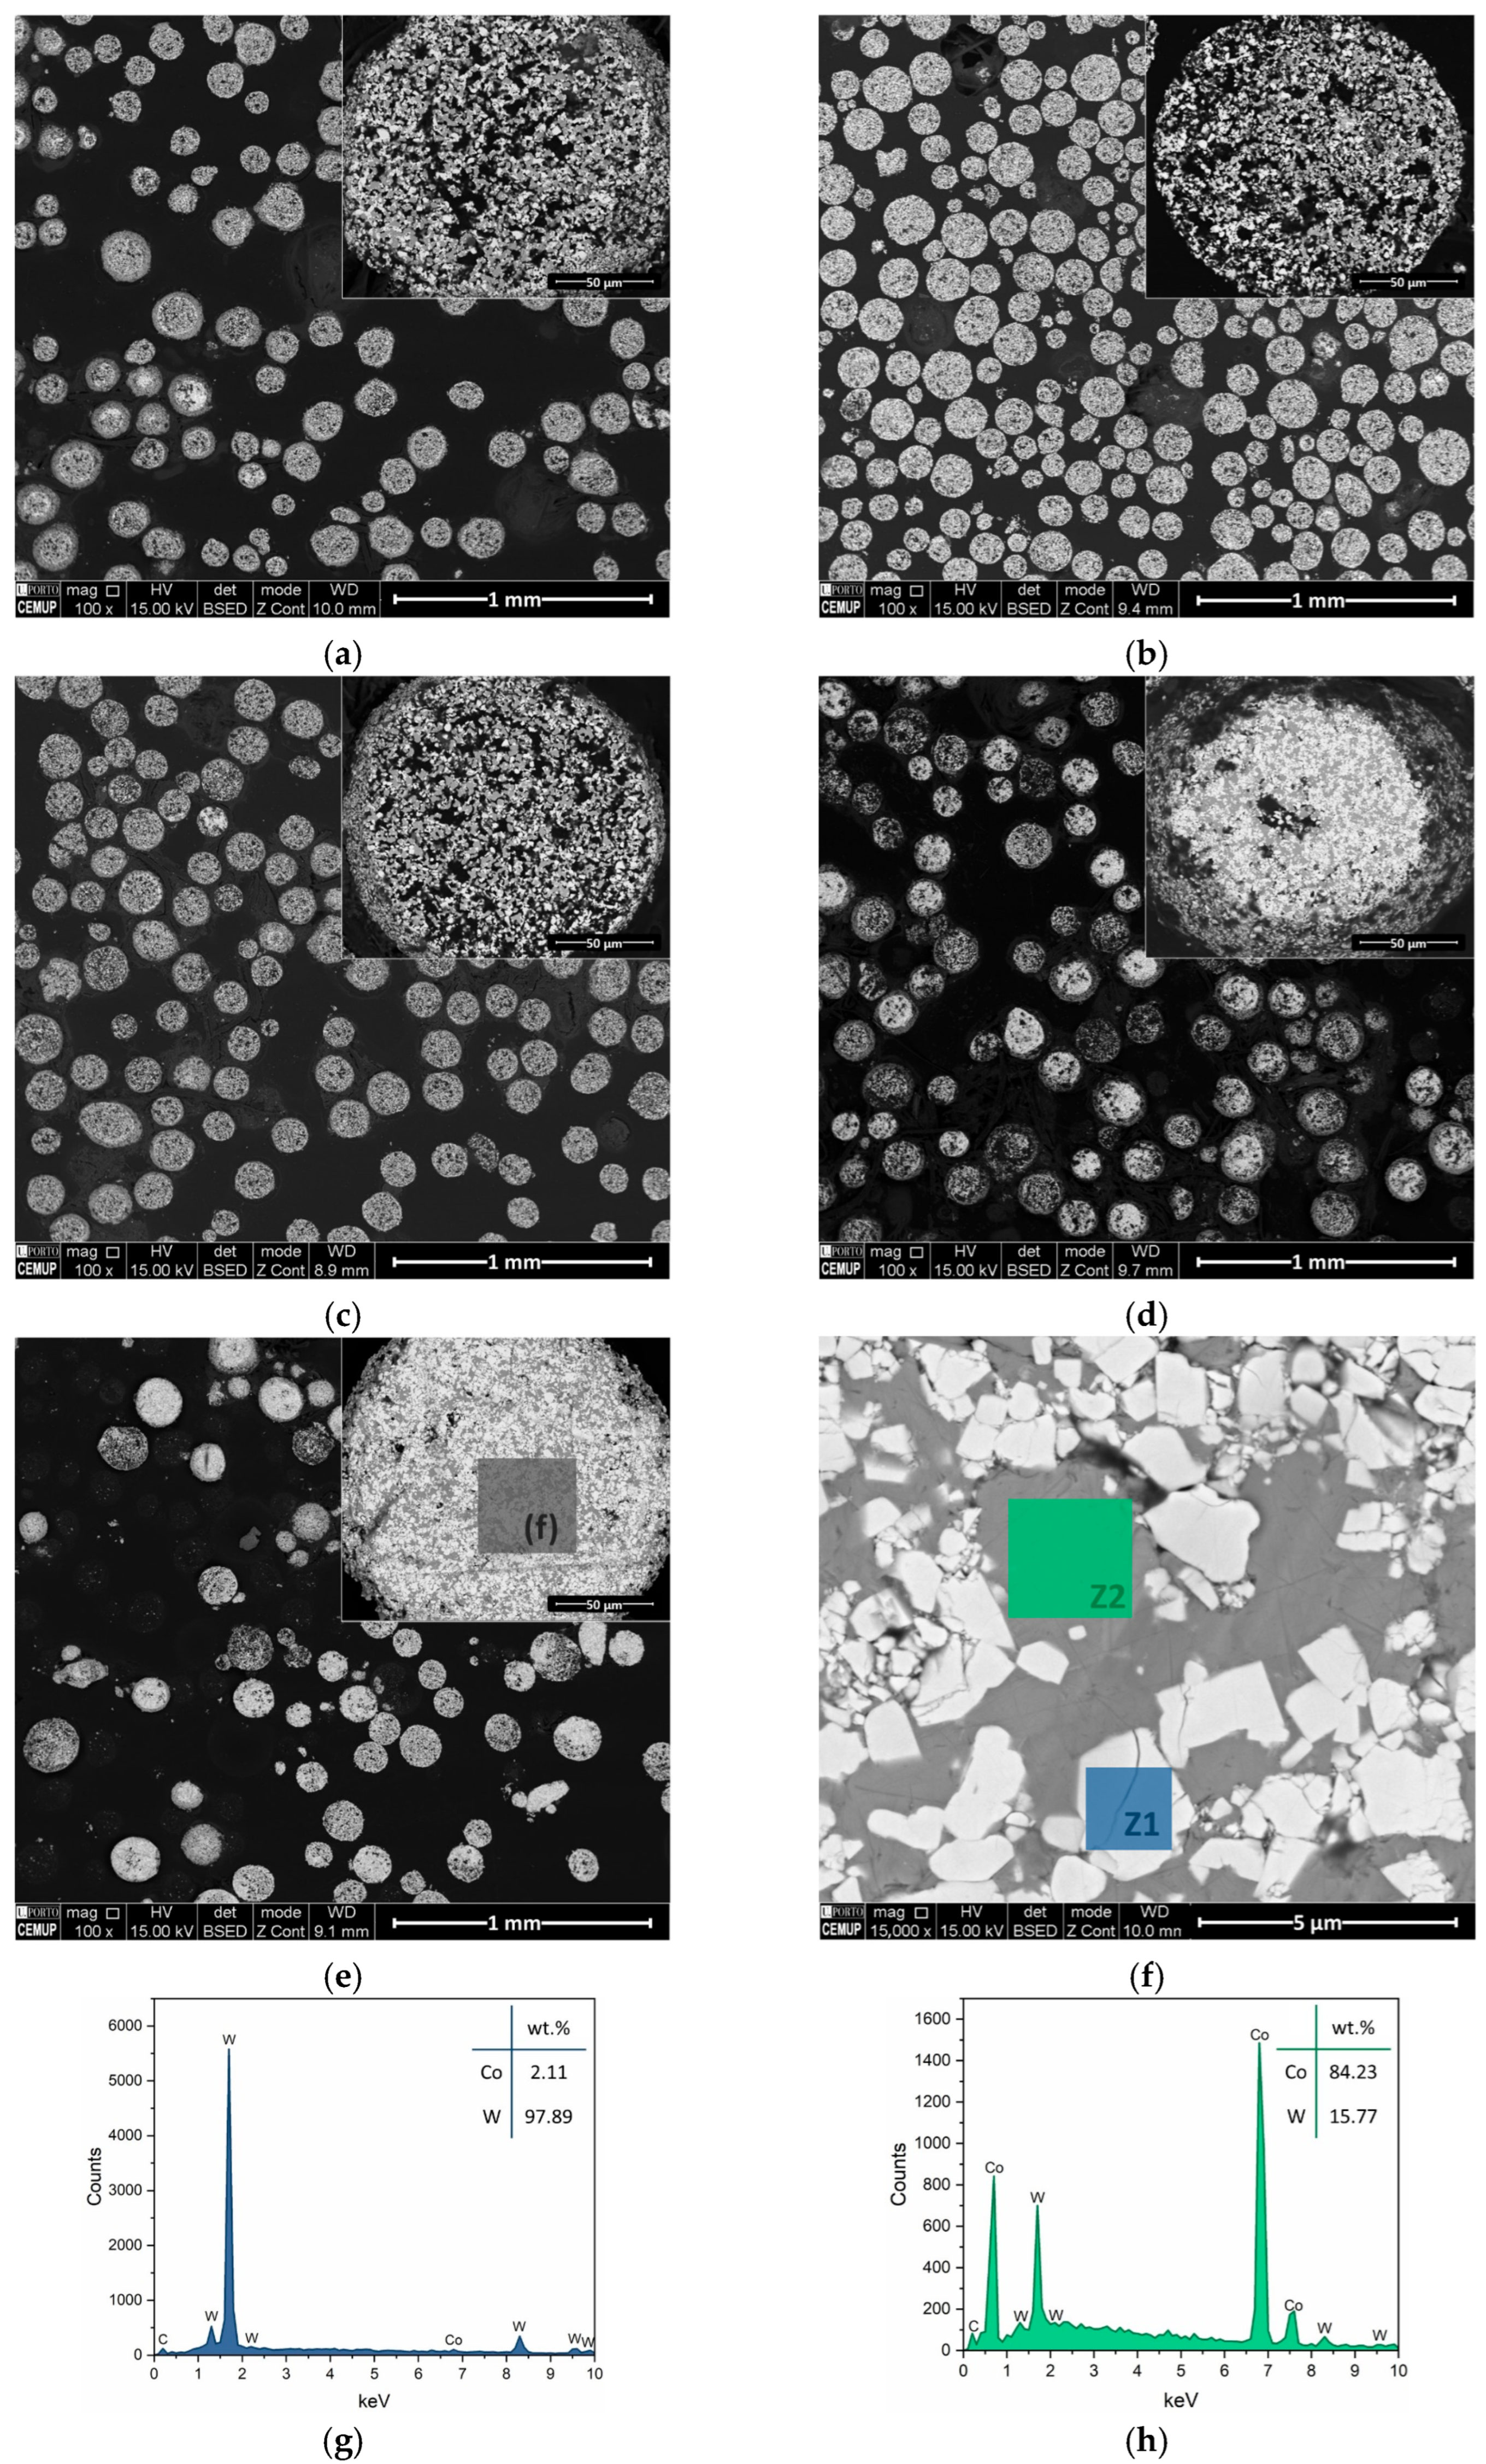
Figure 4 shows SEM images of the granules’ cross-sections, where it is possible to see a clear evolution of the powder’s densification with temperature increase. From only agglomerates of submicron particles in Figure 4a–c to more typical WC-Co microstructures in Figure 4f of WC grain embedded in Co. Even though some porosity is still present, the EDS results in Figure 4g,h, performed on the zones identified in Figure 4f, show clearly that white particles (Z2) are WC and that the grey Z1 phases are the binder phase Co, without any intermediate phases being detected.
Since the thermal treatment cycle with a stage at 1200 °C for 1 h presents the best densification and the least agglomeration, this was chosen to be reproduced on an industrial scale. Then, the powder (Figure 5a) was sieved between 20 µm and 150 µm, and an average particle size (D50) of 103 µm was attained (Figure 5b). As depicted in Figure 5a, the powder morphology maintains a spherical shape.

3.2. DED Depositing Optimisation

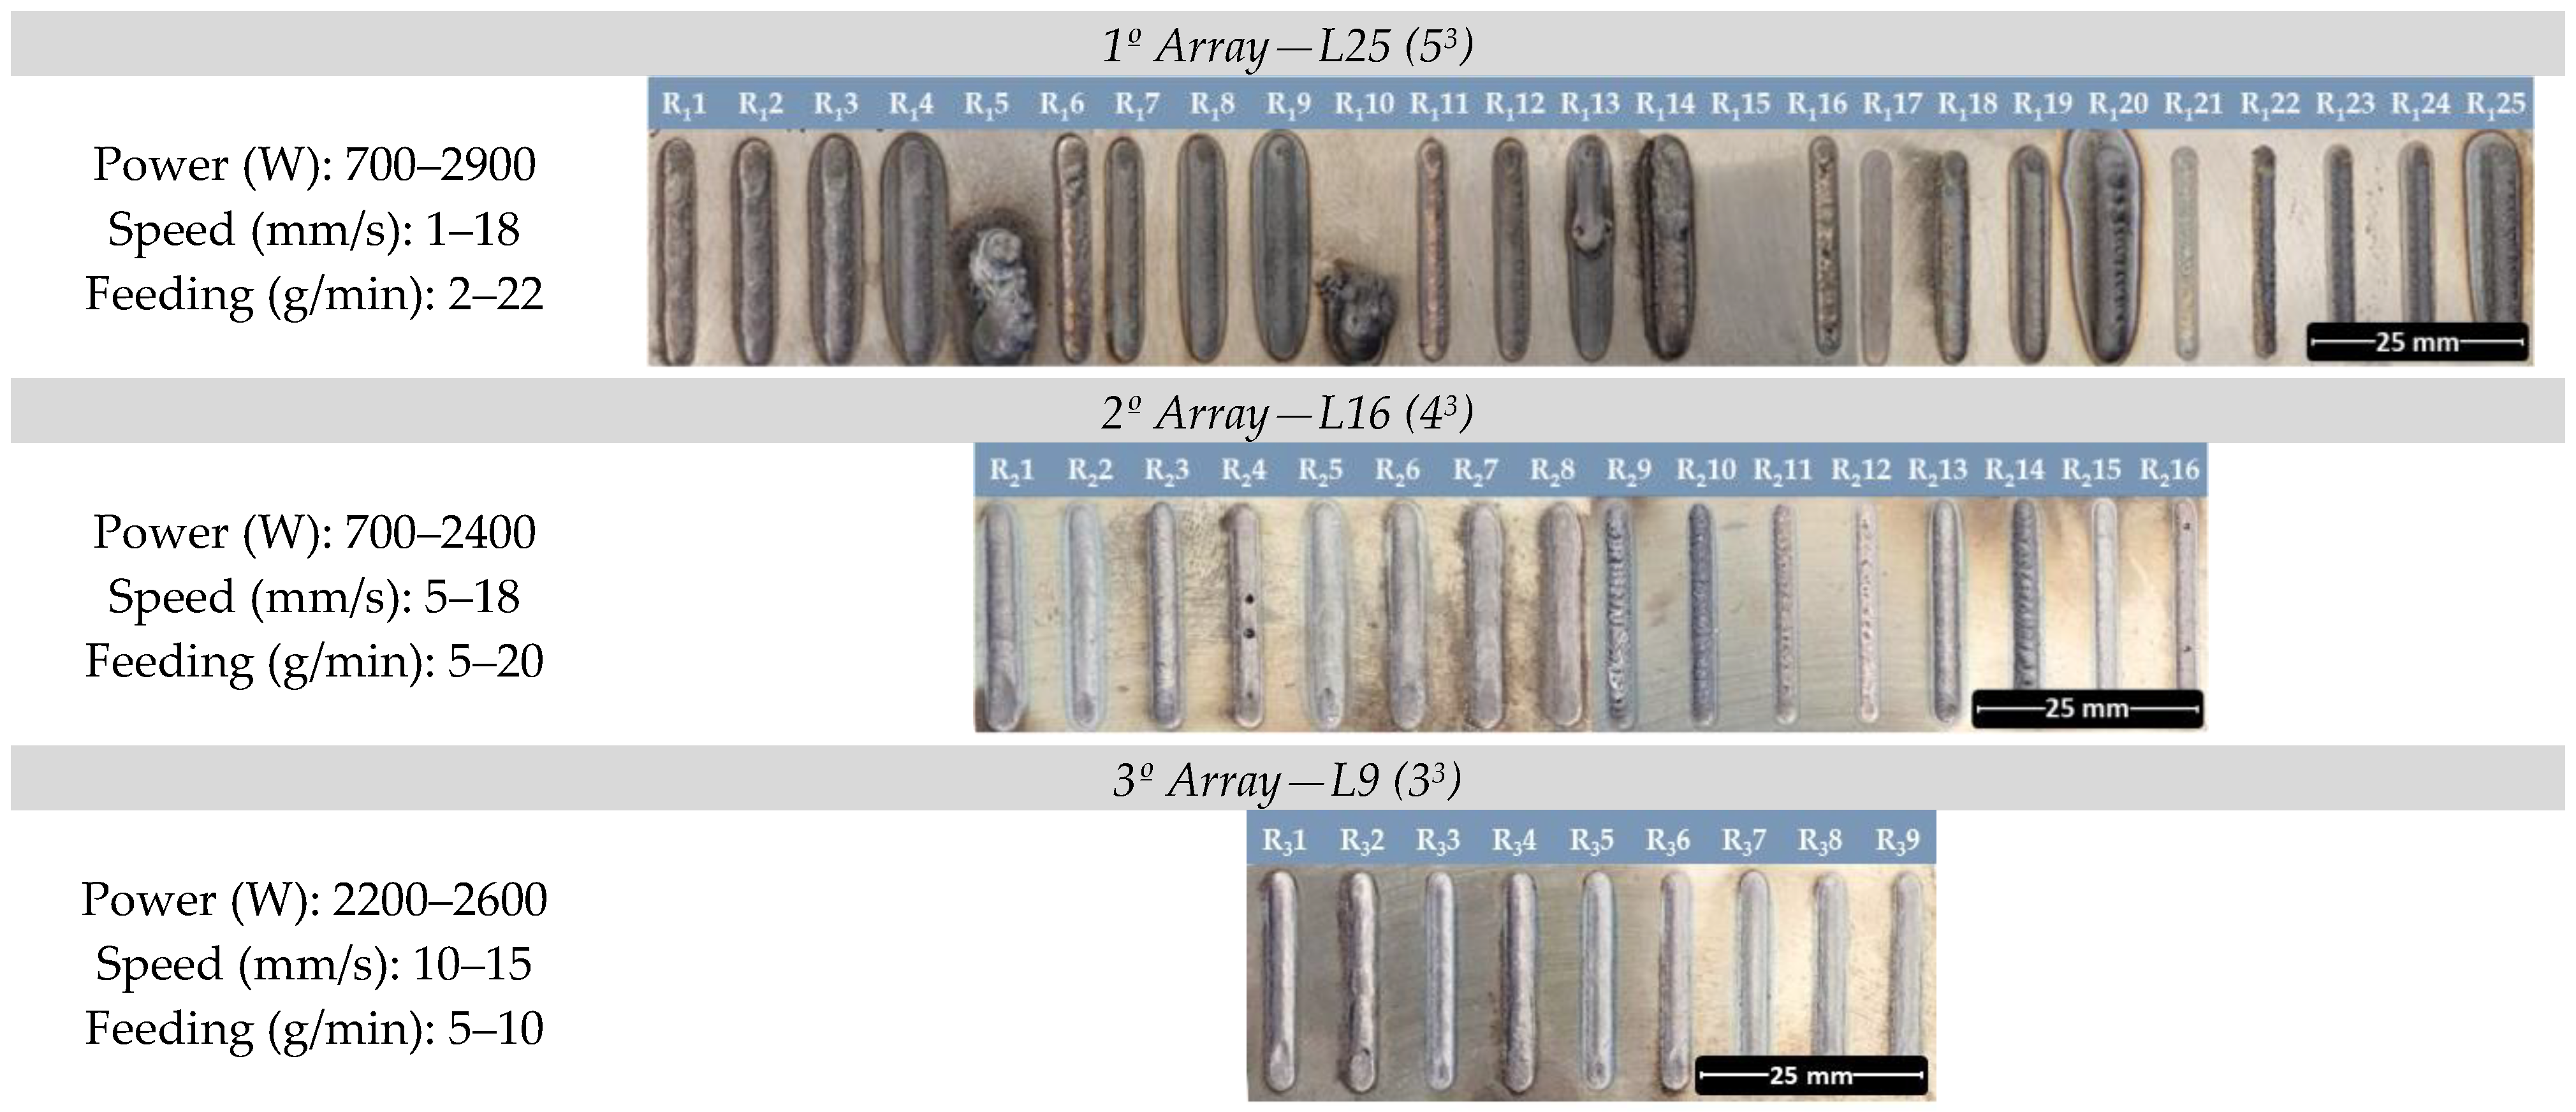
As presented, the optimisation of WC-25Co depositing parameters was carried out through successive experimental runs. Figure 6 shows the visual results from the first three orthogonal arrays tested (L25, L16, and L9), which progressively narrowed the range of laser power, scanning speed, and feeding rate. A clear evolution in track morphology and overall depositing quality can be observed across the three arrays, which helped identify the optimal depositing conditions.
In the initial array, the three runs that had the highest GED values were R15, R110, and R115, with measurements of 1381, 1143, and 905 J/mm2, respectively. The first two runs exhibited a line morphology characterised by an irregular deposition of excessive material, whereas R115 did not have any material deposited, as the deposition was stopped due to excessive sparking, which was a result of high GED and a low powder feeding rate. Runs like R14, R19, R120, and R125, which have GED values between 200 and 600 J/mm2, present somewhat good deposition; however, the surrounding substrate was thermally affected. Thus, GED values below 150 J/mm2 seem to present better line morphologies.
In the second array deposited, both the excessive material deposited and the excessive thermal effect on the substrate were minimised. However, the main defect becomes the rough line surface, like in R29 and R214, and large porosities, like in R24 and R216. Surface roughness seems to be associated with low values of GED (32 J/mm2 for R29 and 26 J/mm2 for R214), with a high feeding rate, like 20 g/min for R214. For porosity, it seems that the combination of slow scanning speed with low feeding rate is the main cause since the GED values for the two runs are very distant: 229 J/mm2 for R4 and 67 J/mm2 for R216. The third array presents an overall good visual quality for all the lines since the range of both the parameters and the GED values was narrowed.
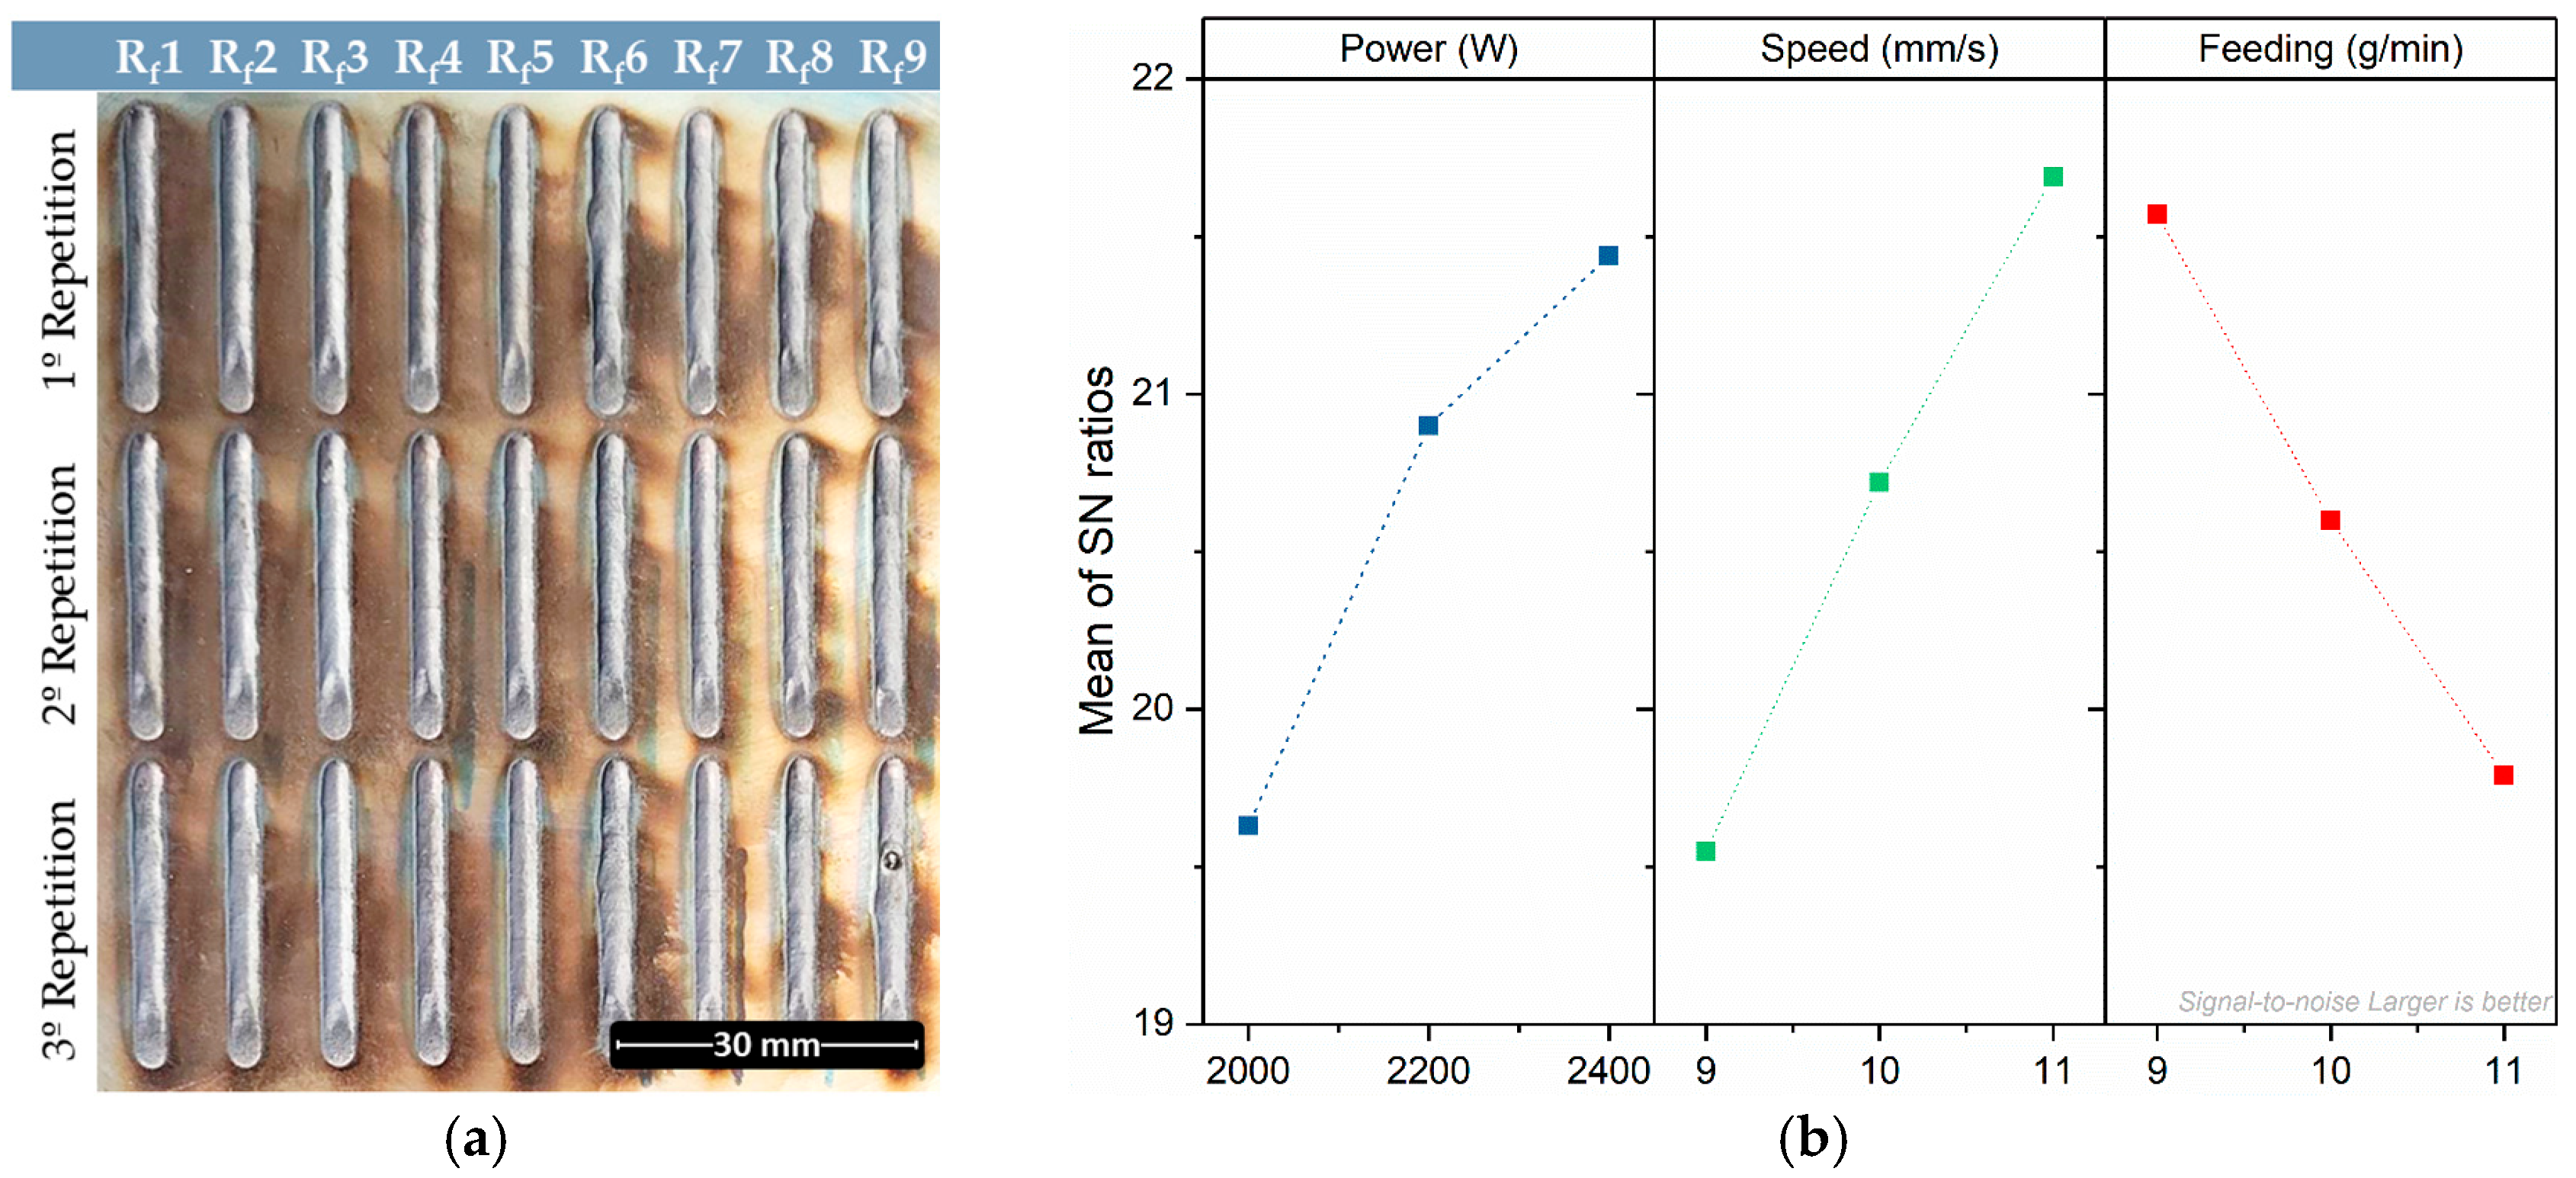
The final L9 Taguchi array with three repetitions, resulting in tracks presented in Figure 7a, shows good track morphologies and smooth surfaces. Figure 7b presents a plot of the main effects of the signal-to-noise (SN) ratios on the line quality. The signal-to-noise ratio of the line quality is a metric used to evaluate both the consistency and the average printed line’s quality index. Since the goal of the experiment was to maximise the line’s quality and SN ratio, a “larger is better” approach was chosen, which is calculated by Equation (2).
S N   r a t i o = 10     log 10 1 n i = 1 n 1 y i 2  
where n is the number of observations and yi is the observed value for the ith trial. While SN ratios tend to increase with the increase in both power and scanning speed, they tend to decrease with the rise in feeding rate. Since a “larger-is-better” approach in the Taguchi design was chosen, the goal is to maximise the response. Therefore, the highest S/N ratio indicates the highest line quality. Optimal results are achieved at 2400 W power, 11 mm/s speed, and 9 g/min feeding rate with a GED value of 104 J/mm2.
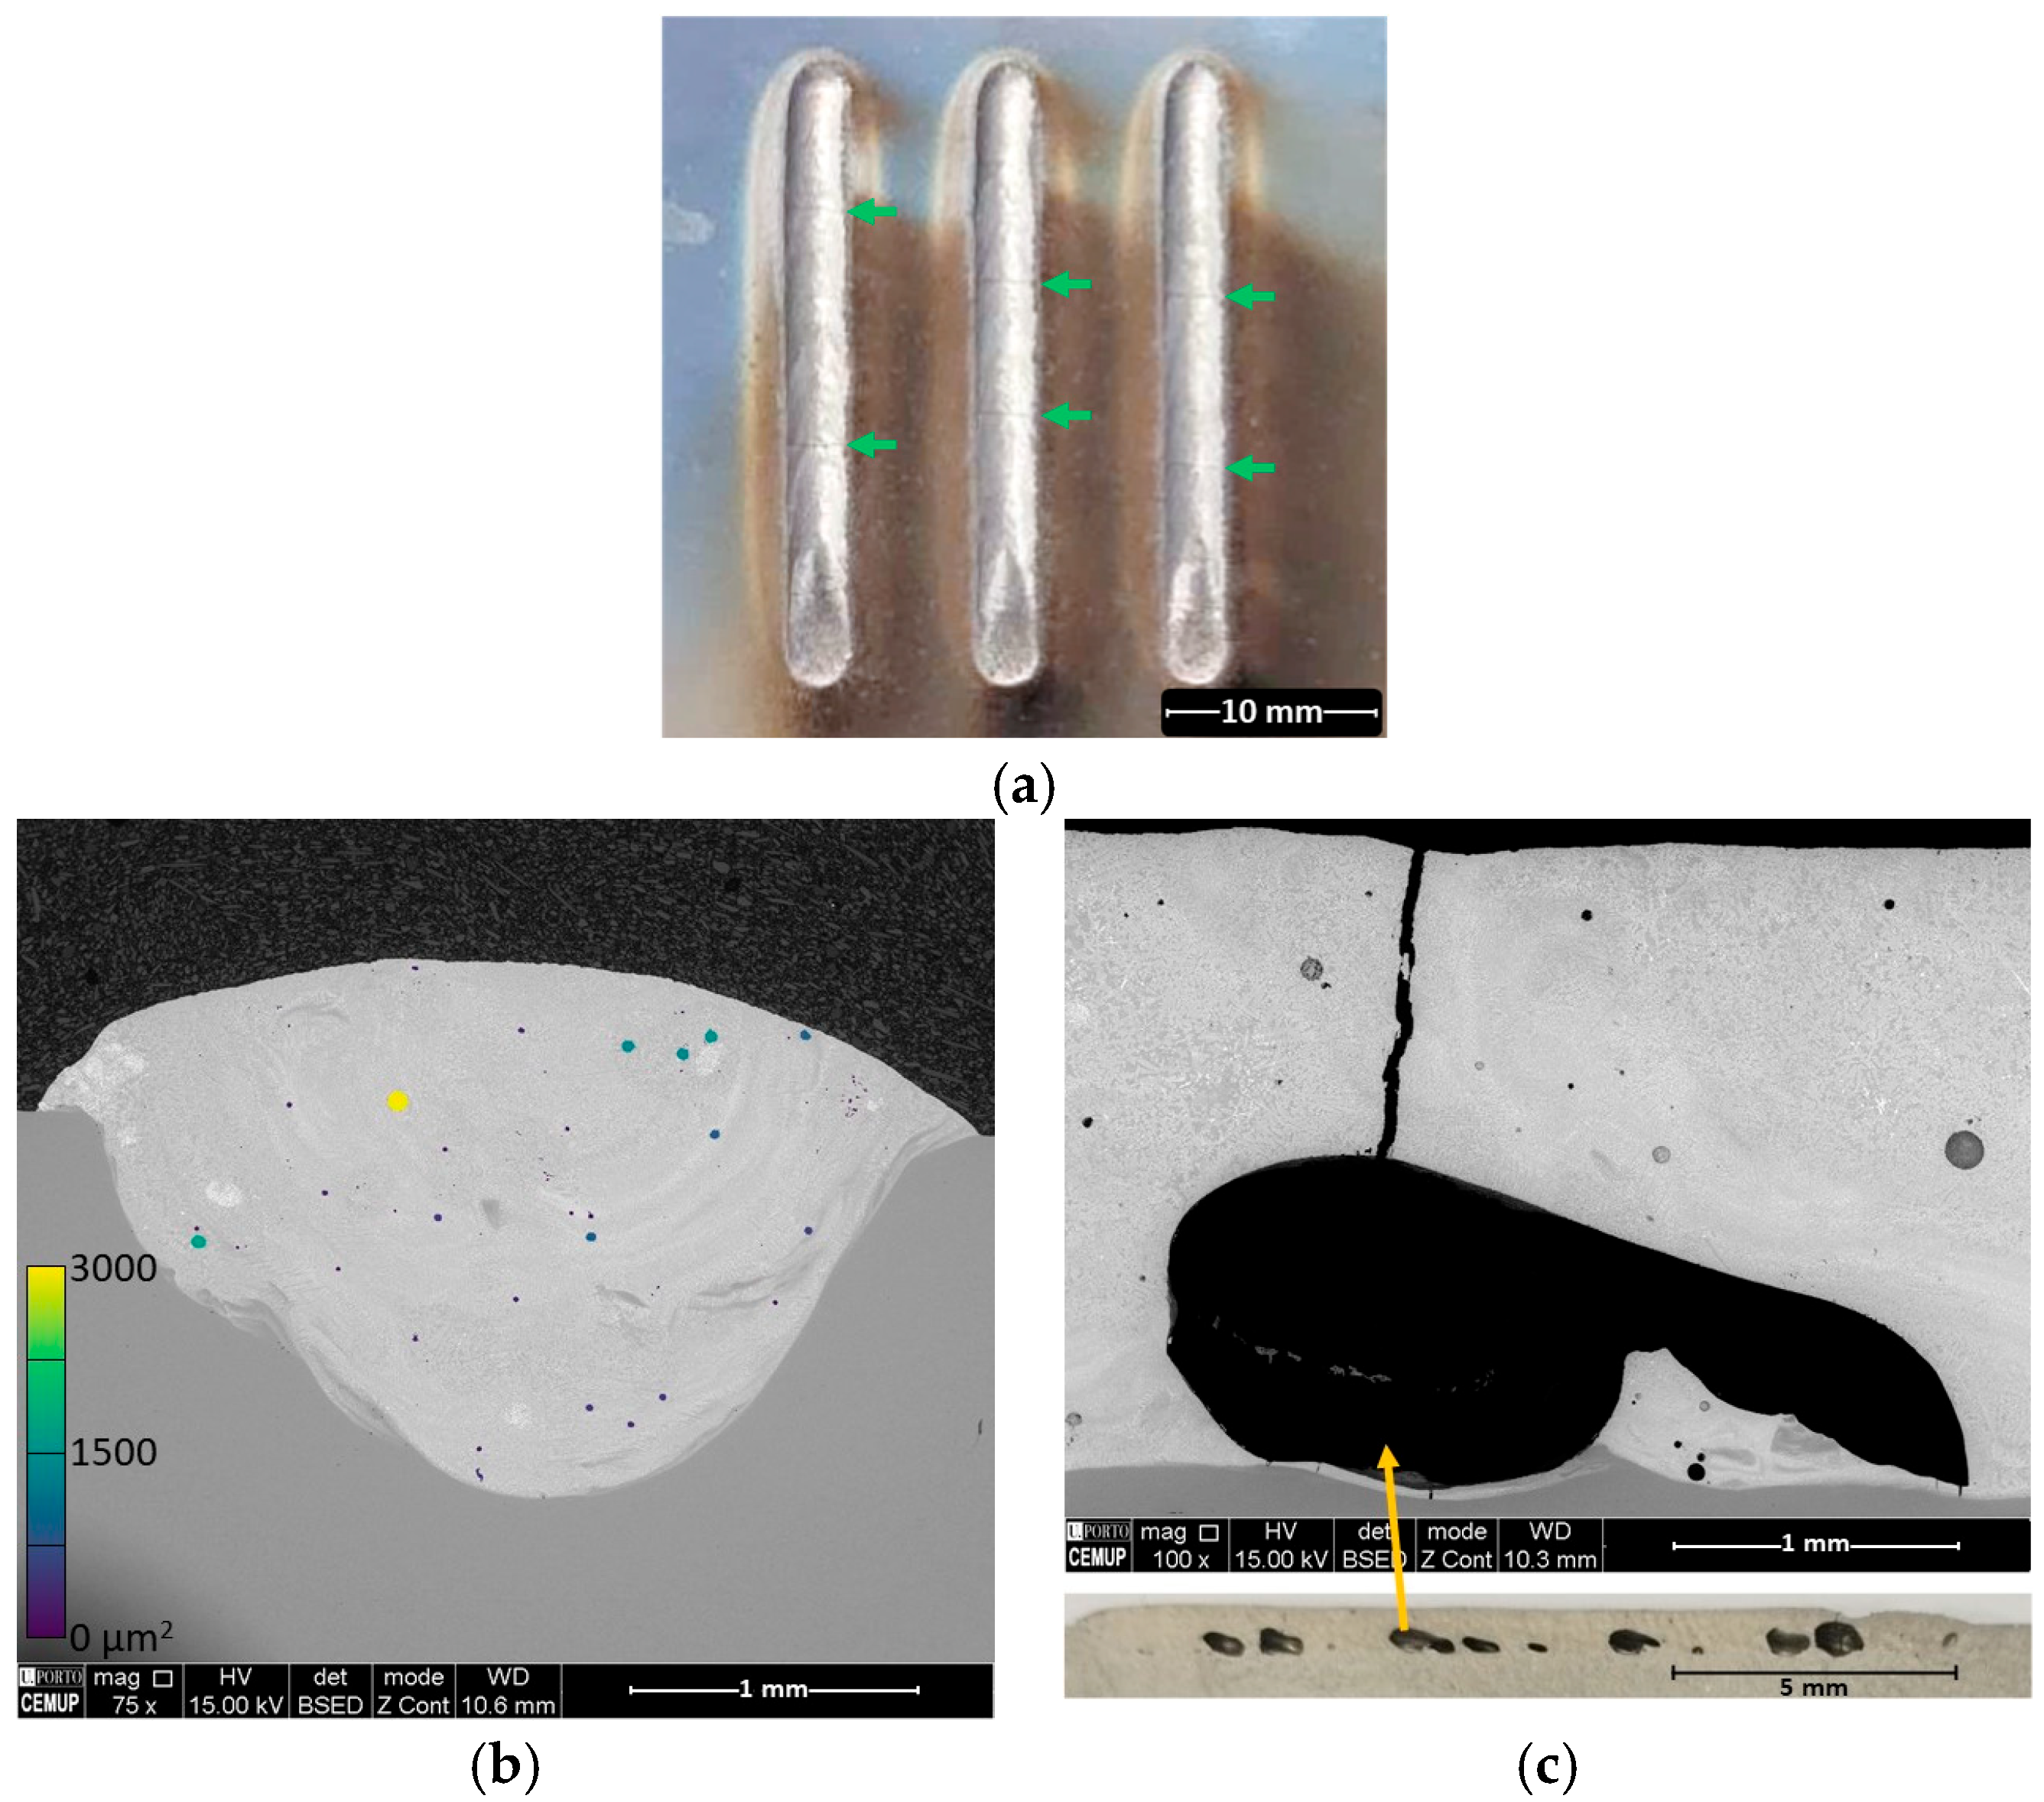
Figure 8a presents the resulting tracks produced with the optimal processing parameters, with metallic, smooth, straight, and uniform bead geometry, but still present some cracks (green arrows in Figure 8a). Figure 8b,c show SEM images of the two different sections of the optimal line. The transversal shows a relatively high quantity of small pores (~30 pores) with a maximum area size of 0.003 mm2, whereas the longitudinal section presents 10 very large pores with an average area size of 0.216 ± 0.147 mm2, always located under the cracks (orange arrow in Figure 8c). These pores are attributed to CO gas formation due to the decomposition of WC and the reaction with oxygen present in the melt pool due to the powder’s intrinsic porosity and ambient oxygen, as proven by Yamaguchi et al. [54,55]. The cracks can be related to gas pressure release or thermal stress [56]. This makes it necessary to take further steps to improve the internal quality of the tracks.

3.3. Remelting Strategies

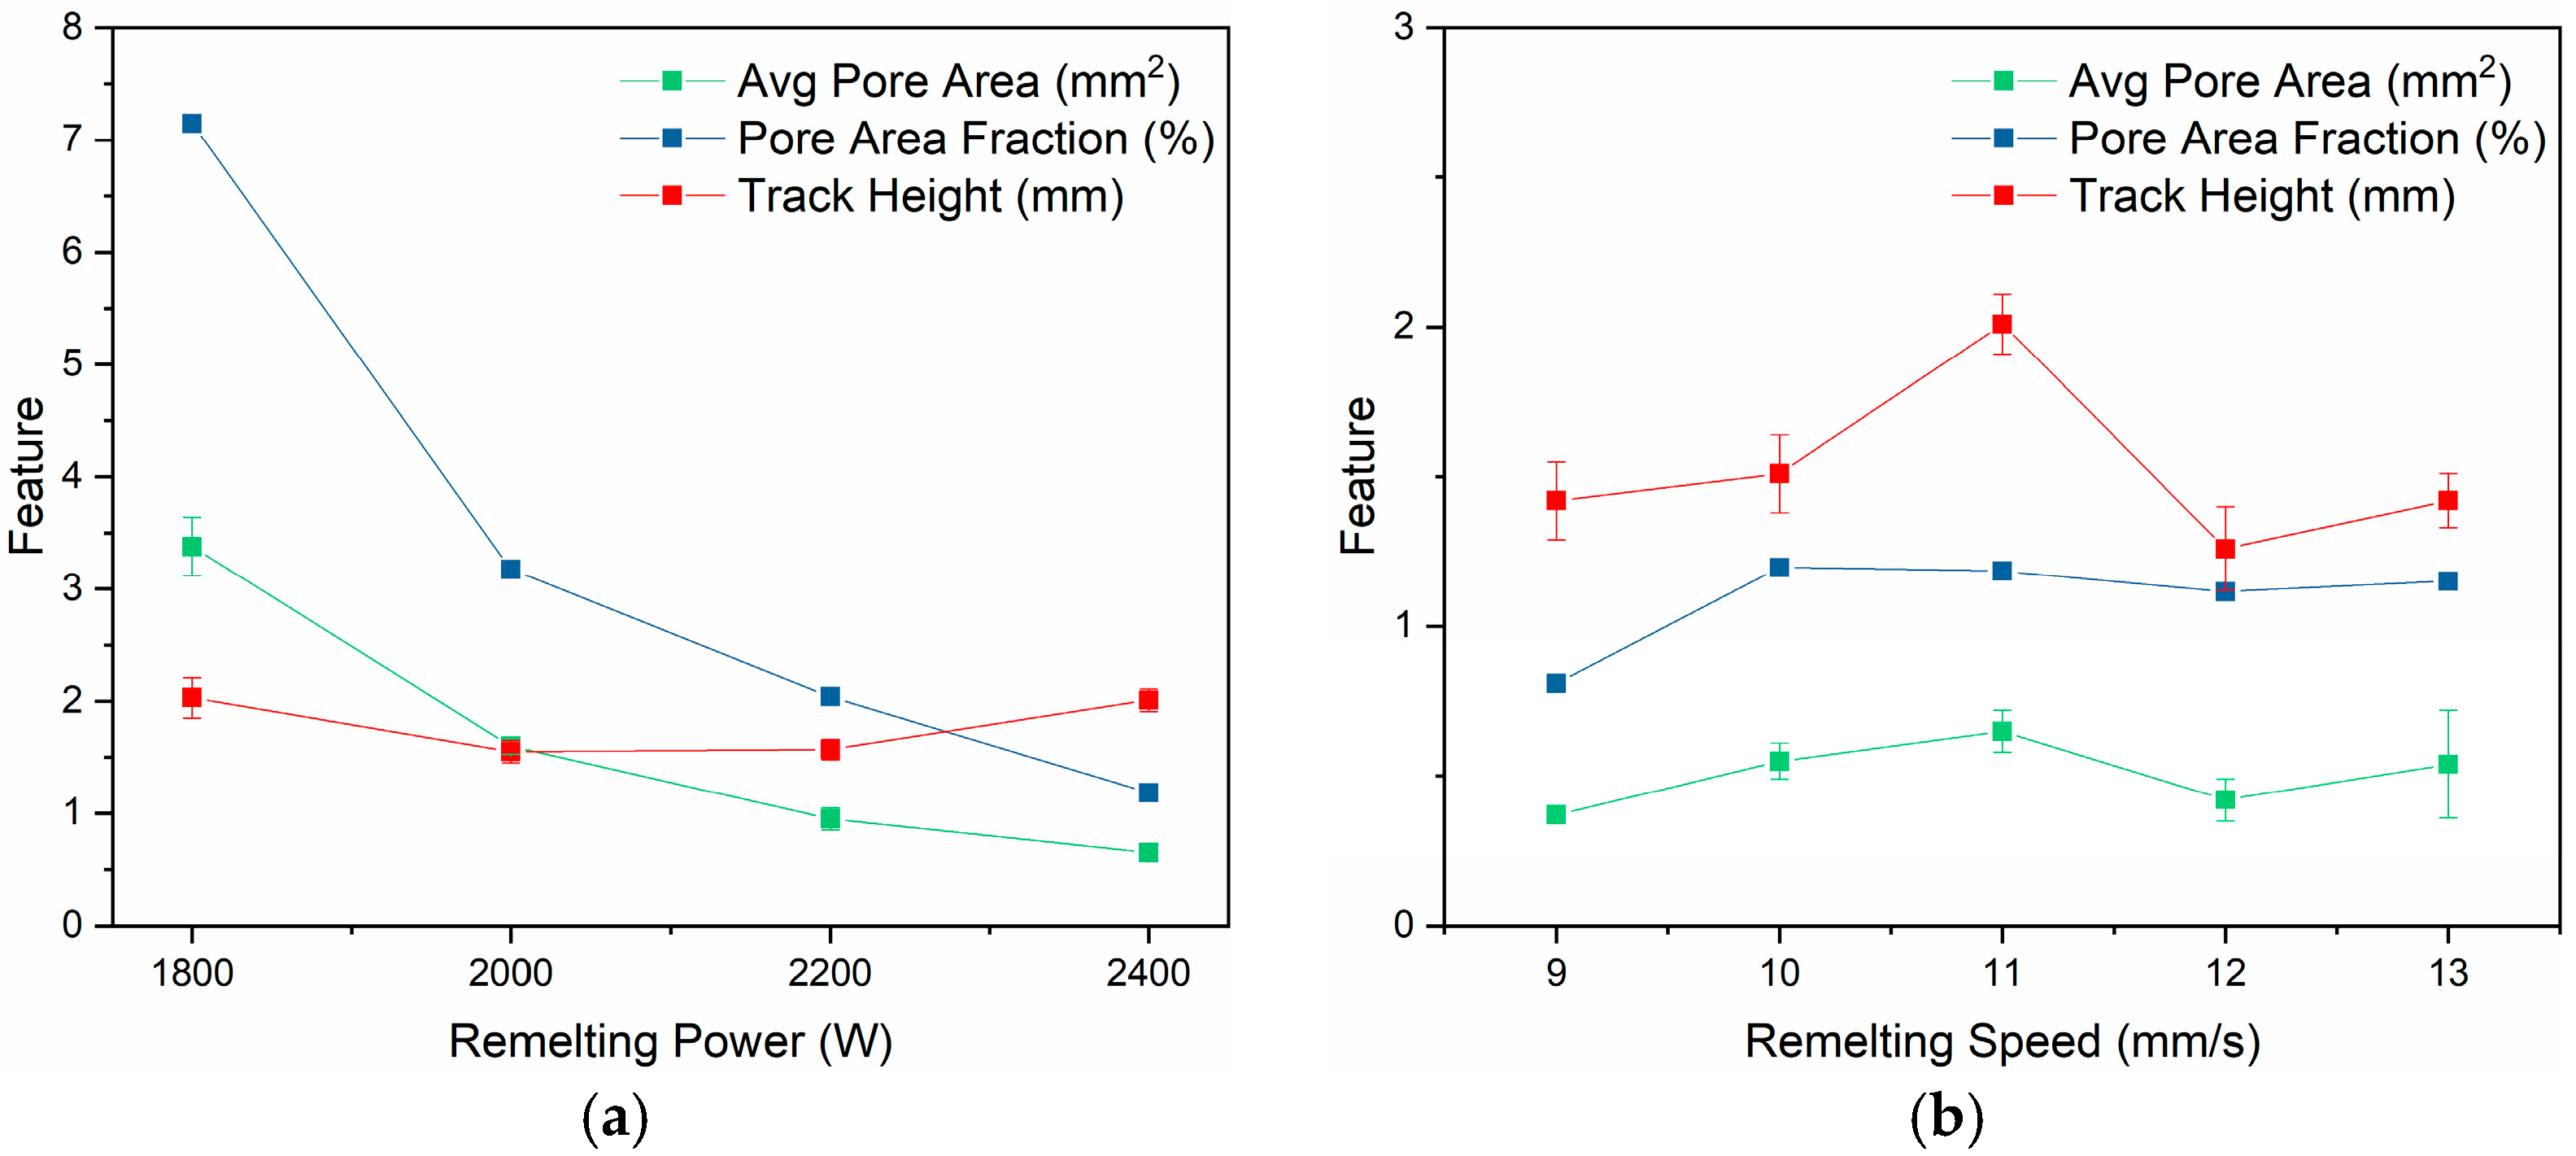
The method to eliminate line porosities was remelting the line with the laser. Two approaches were applied, one varying the laser power with the same scanning speed of 11 mm/s, and the other fixing 2400 W of power and changing the scanning speed. The longitudinal cross-sections of the tracks are presented in Figure 9, as well as the quantitative analysis of the track height and porosity evolution (with average pore area and pore area fraction) in Figure 10. The increase in laser power reduced the pores and cracking, with the best result obtained for 2400 W, with the pore area fraction reducing to ~83% while the track height slightly increased. The decrease in scanning speed resulted in smaller porosities. For the lowest speed, 9 mm/s, almost all porosities were eliminated, with a porosity of only 0.81 and the smallest average pore area of 0.37 ± 0.02 µm. Therefore, the optimal line (2400 W, 11 mm/s, 9 g/min) with remelting at 2400 W and 9 mm/s was chosen as the best optimised depositing parameter and strategy, and for deeper characterisation.

3.4. Final Optimal Line Characterisation

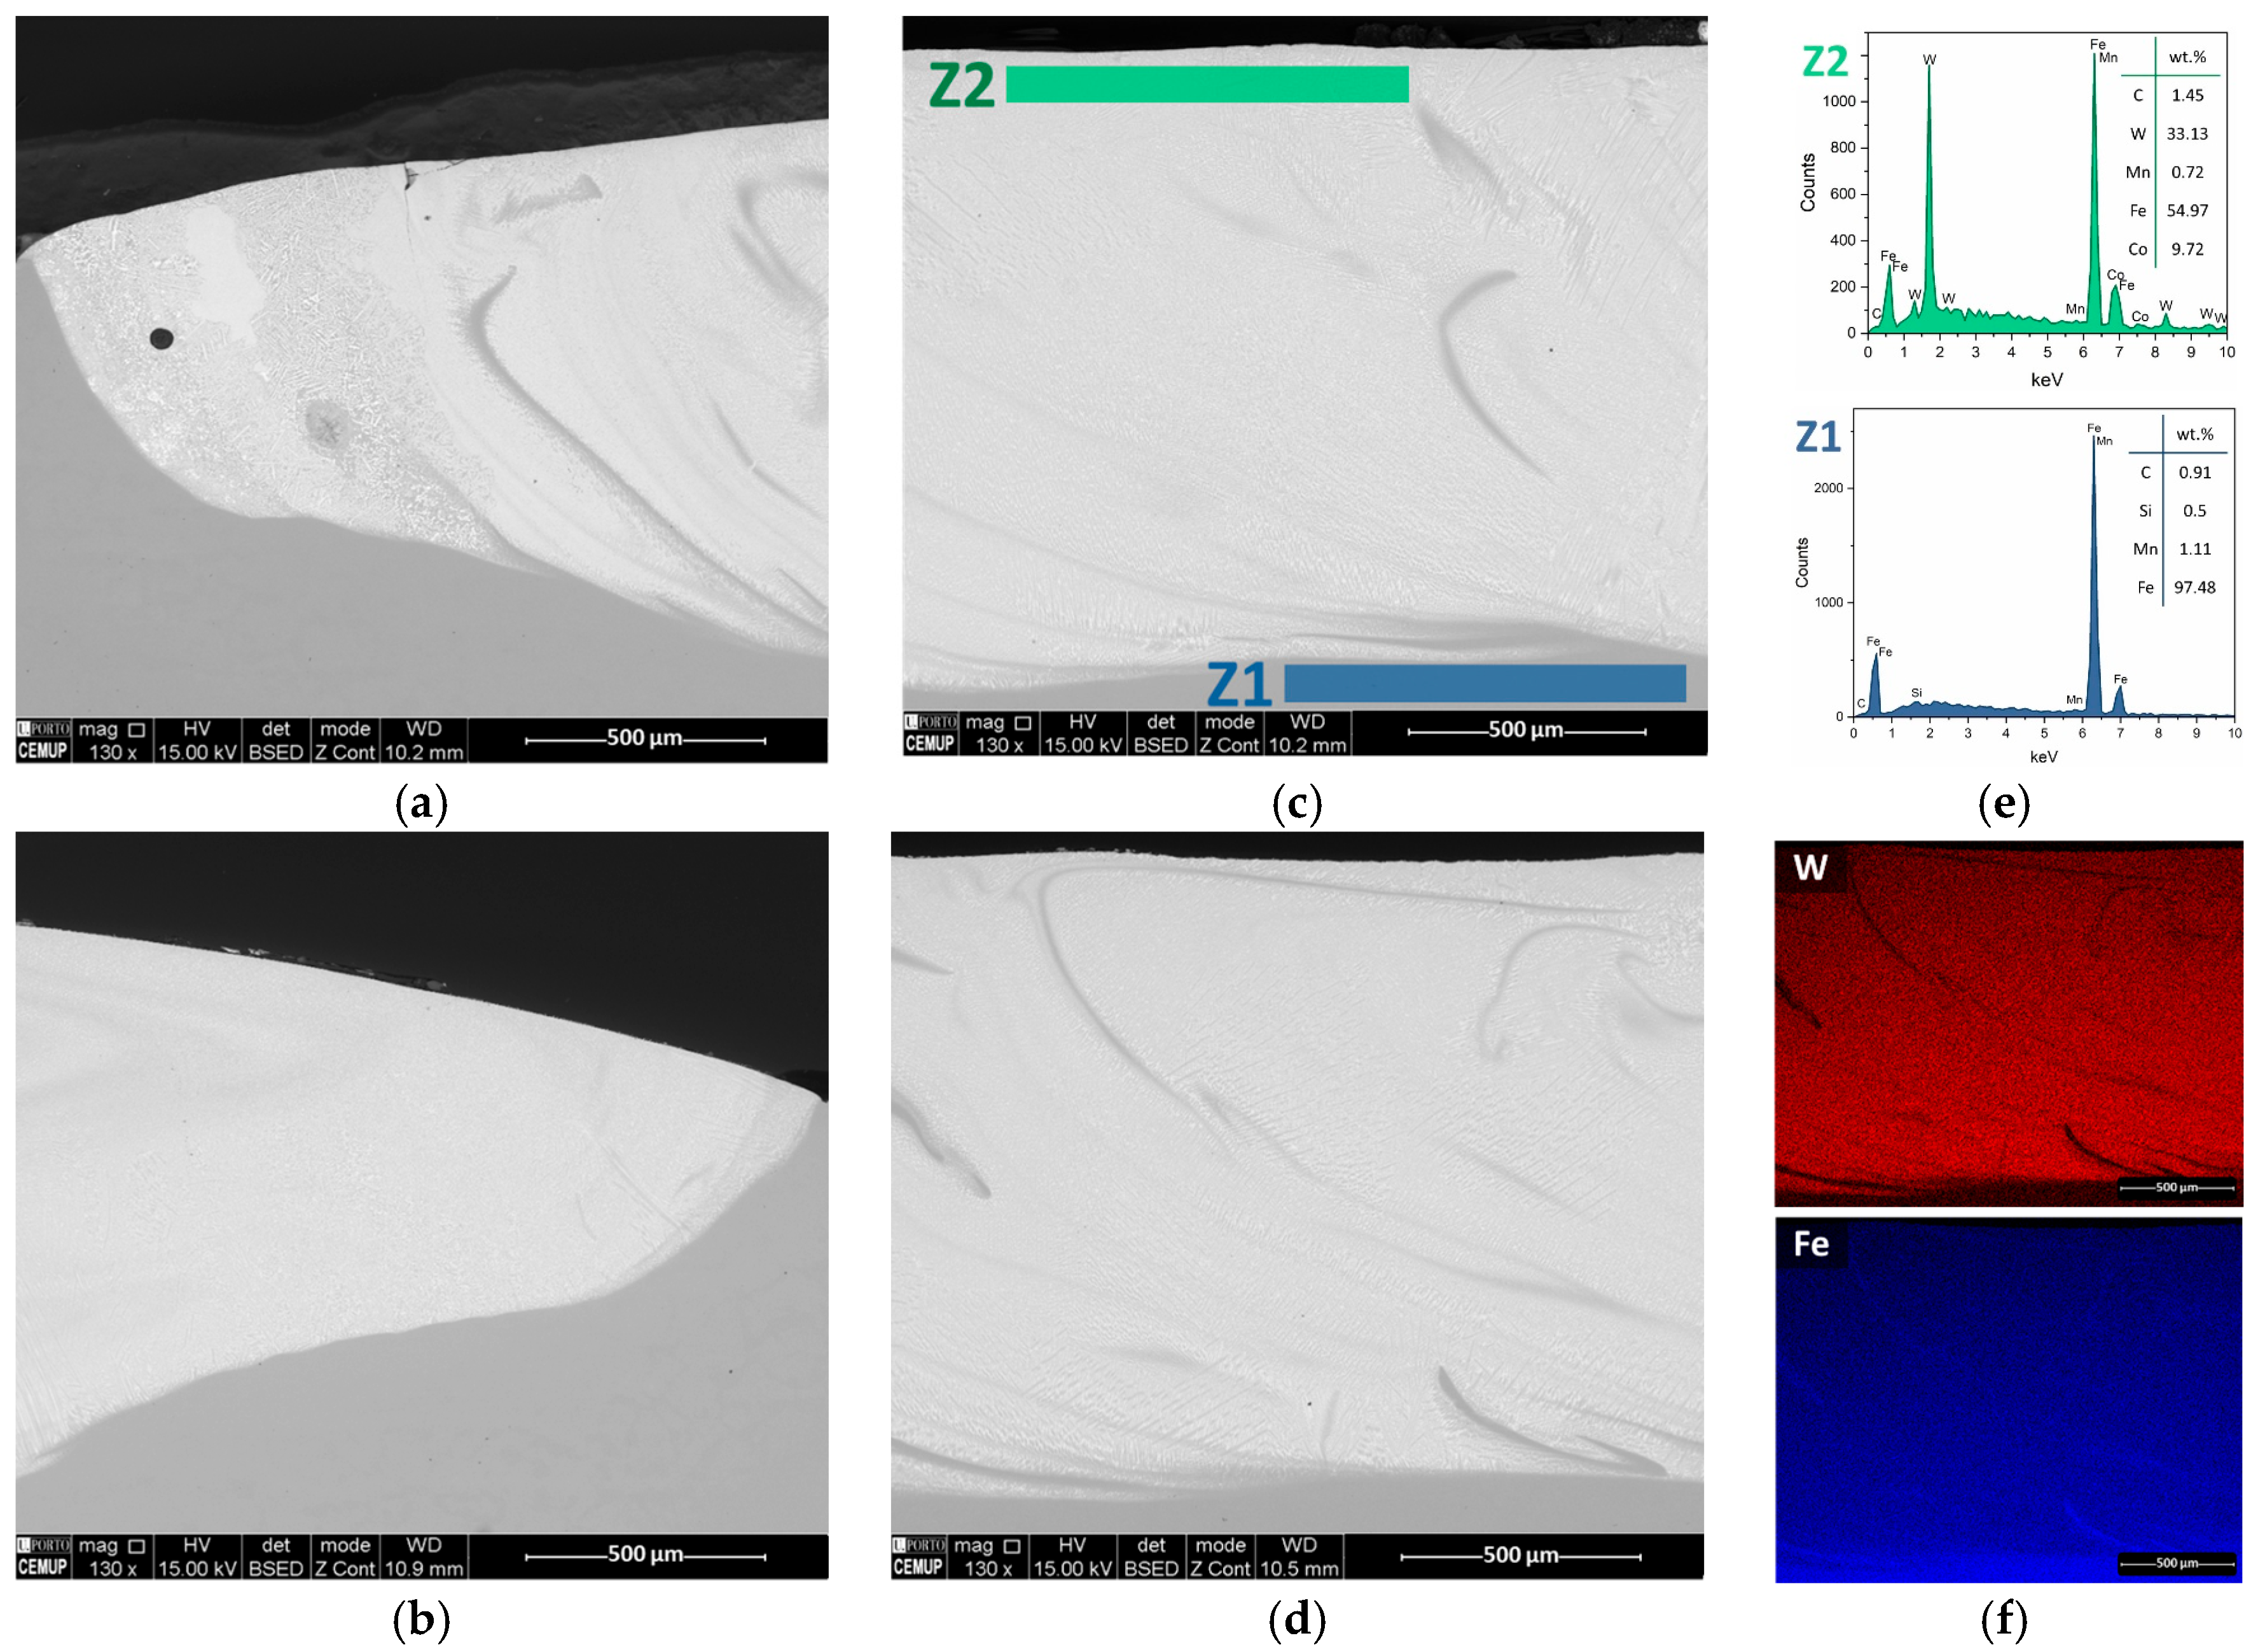
Figure 11 shows SEM images of the macrostructure of the optimal line (2400 W, 11 mm/s, 9 g/min) remelted at 2400 W and 9 mm/s. Figure 11a shows the presence of some defects only at the end of the deposited track, and the rest of the deposit has significantly reduced defects, as seen in Figure 11b,c. The Marangoni effect [57] in the deposited material between the substrate and the topmost layer of the track is seen in Figure 11c. This effect is also confirmed by the EDS local analysis, i.e., the substrate close to the interface does not present any traces of W nor of Co (Z1 in Figure 11e), whereas traces of Fe and Mn are detected on the topmost layer (Z2 in Figure 11e). The elemental EDS maps (Figure 11f) show the typical traces of the Marangoni effect, with the darker areas being richer in Fe.
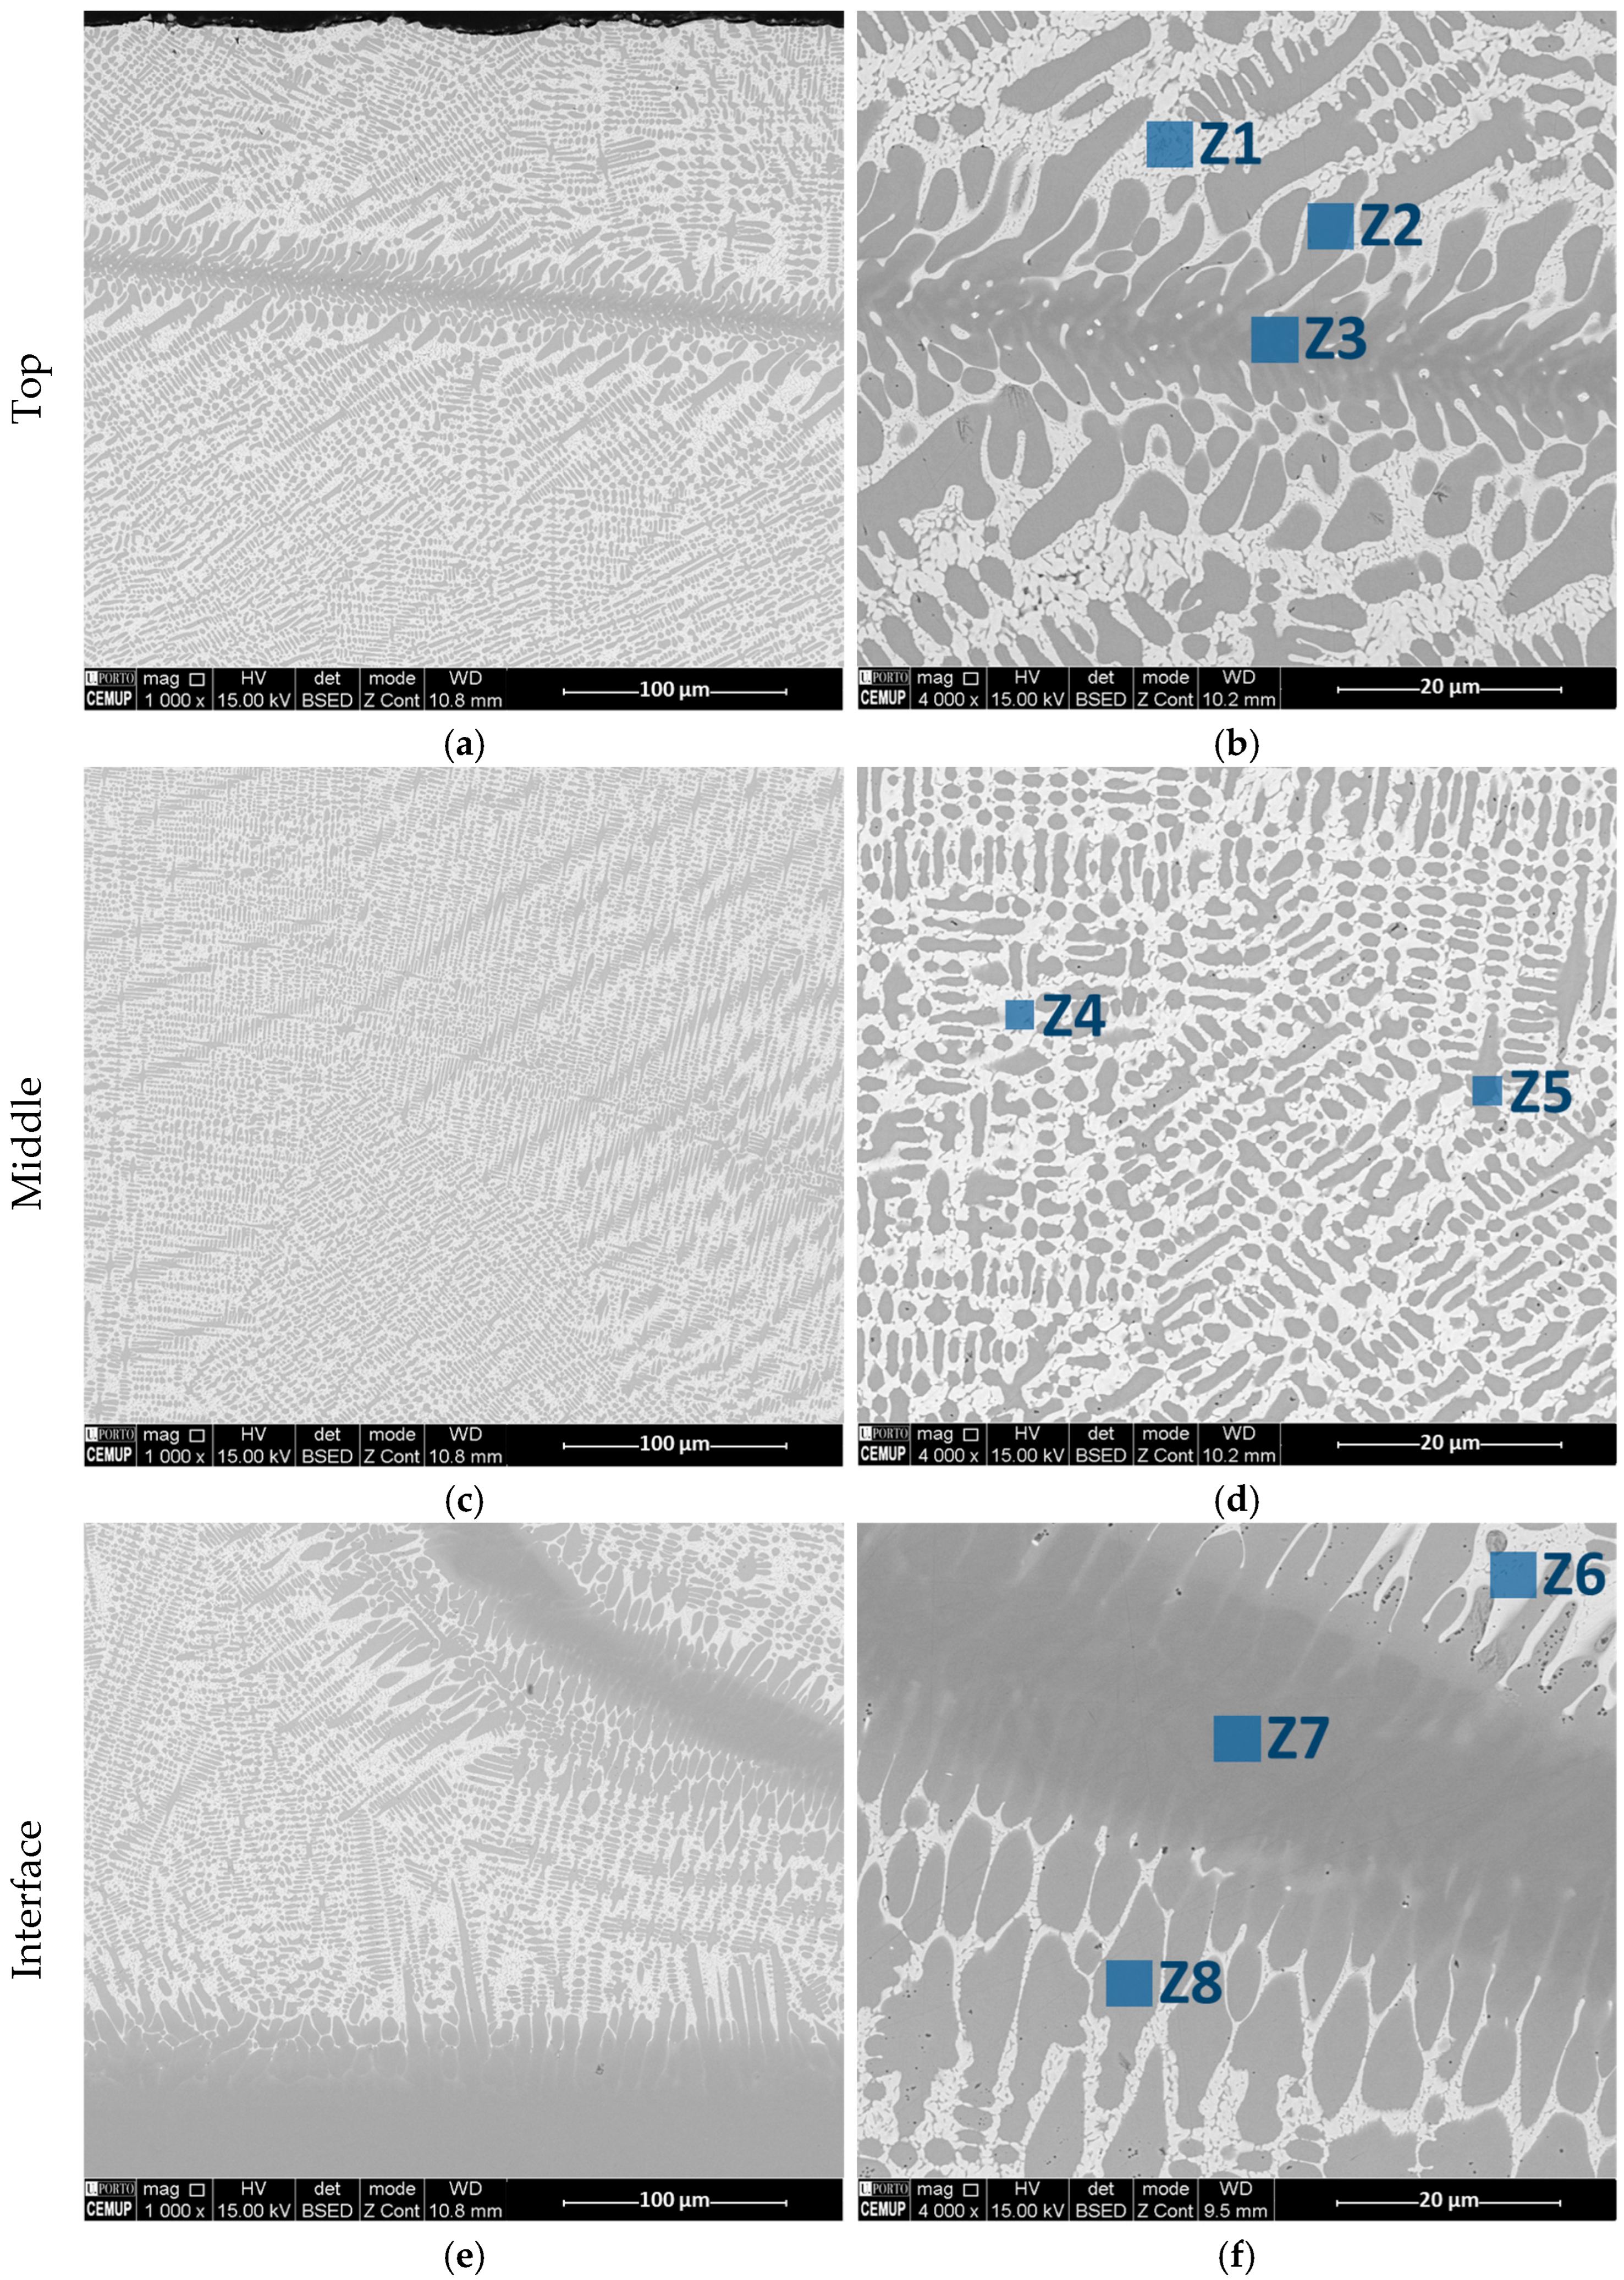
The microstructures of three different zones of the tracks, interface, middle, and top close to the surface, were observed by SEM, and these results are presented in Figure 12. Generally, the microstructure is composed of a fine columnar dendritic structure regardless of the zone. Though with higher magnification, the phases tended to vary slightly in morphology and chemical composition (Table 3) depending on the zone. The microstructure is mainly composed of herringbone and eutectic complex carbides as observed by Liverani et al. [13]. At the interface with the substrate, it is possible to analyse planar grain growth, which leads to smaller columnar dendrites, similar to what was observed in a similar study [58]. The traces of the Marangoni convection effect are seen in dark grey curvy lines in the microstructure since they are richer in Fe, representing a smaller atomic density than dendrites. Z3 and Z7 are the zones richer in Fe without the presence of W or Co, which then form dendrites of complex phases. In the middle of the track, the microstructure is composed of finer eutectic carbides seen as lighter zones richer in W (like Z4) than the dark phases (like Z5), with higher Fe%. However, the typical WC-Co microstructure of hard WC grains embedded in a ductile cobalt matrix is completely lost. This may be due to the complete dissolution of the WC by the high deposition temperatures and remelting [24], as was concluded by Singh et al. [9] that the optimised clad track presented more intense diffusion of the WC into the matrix.
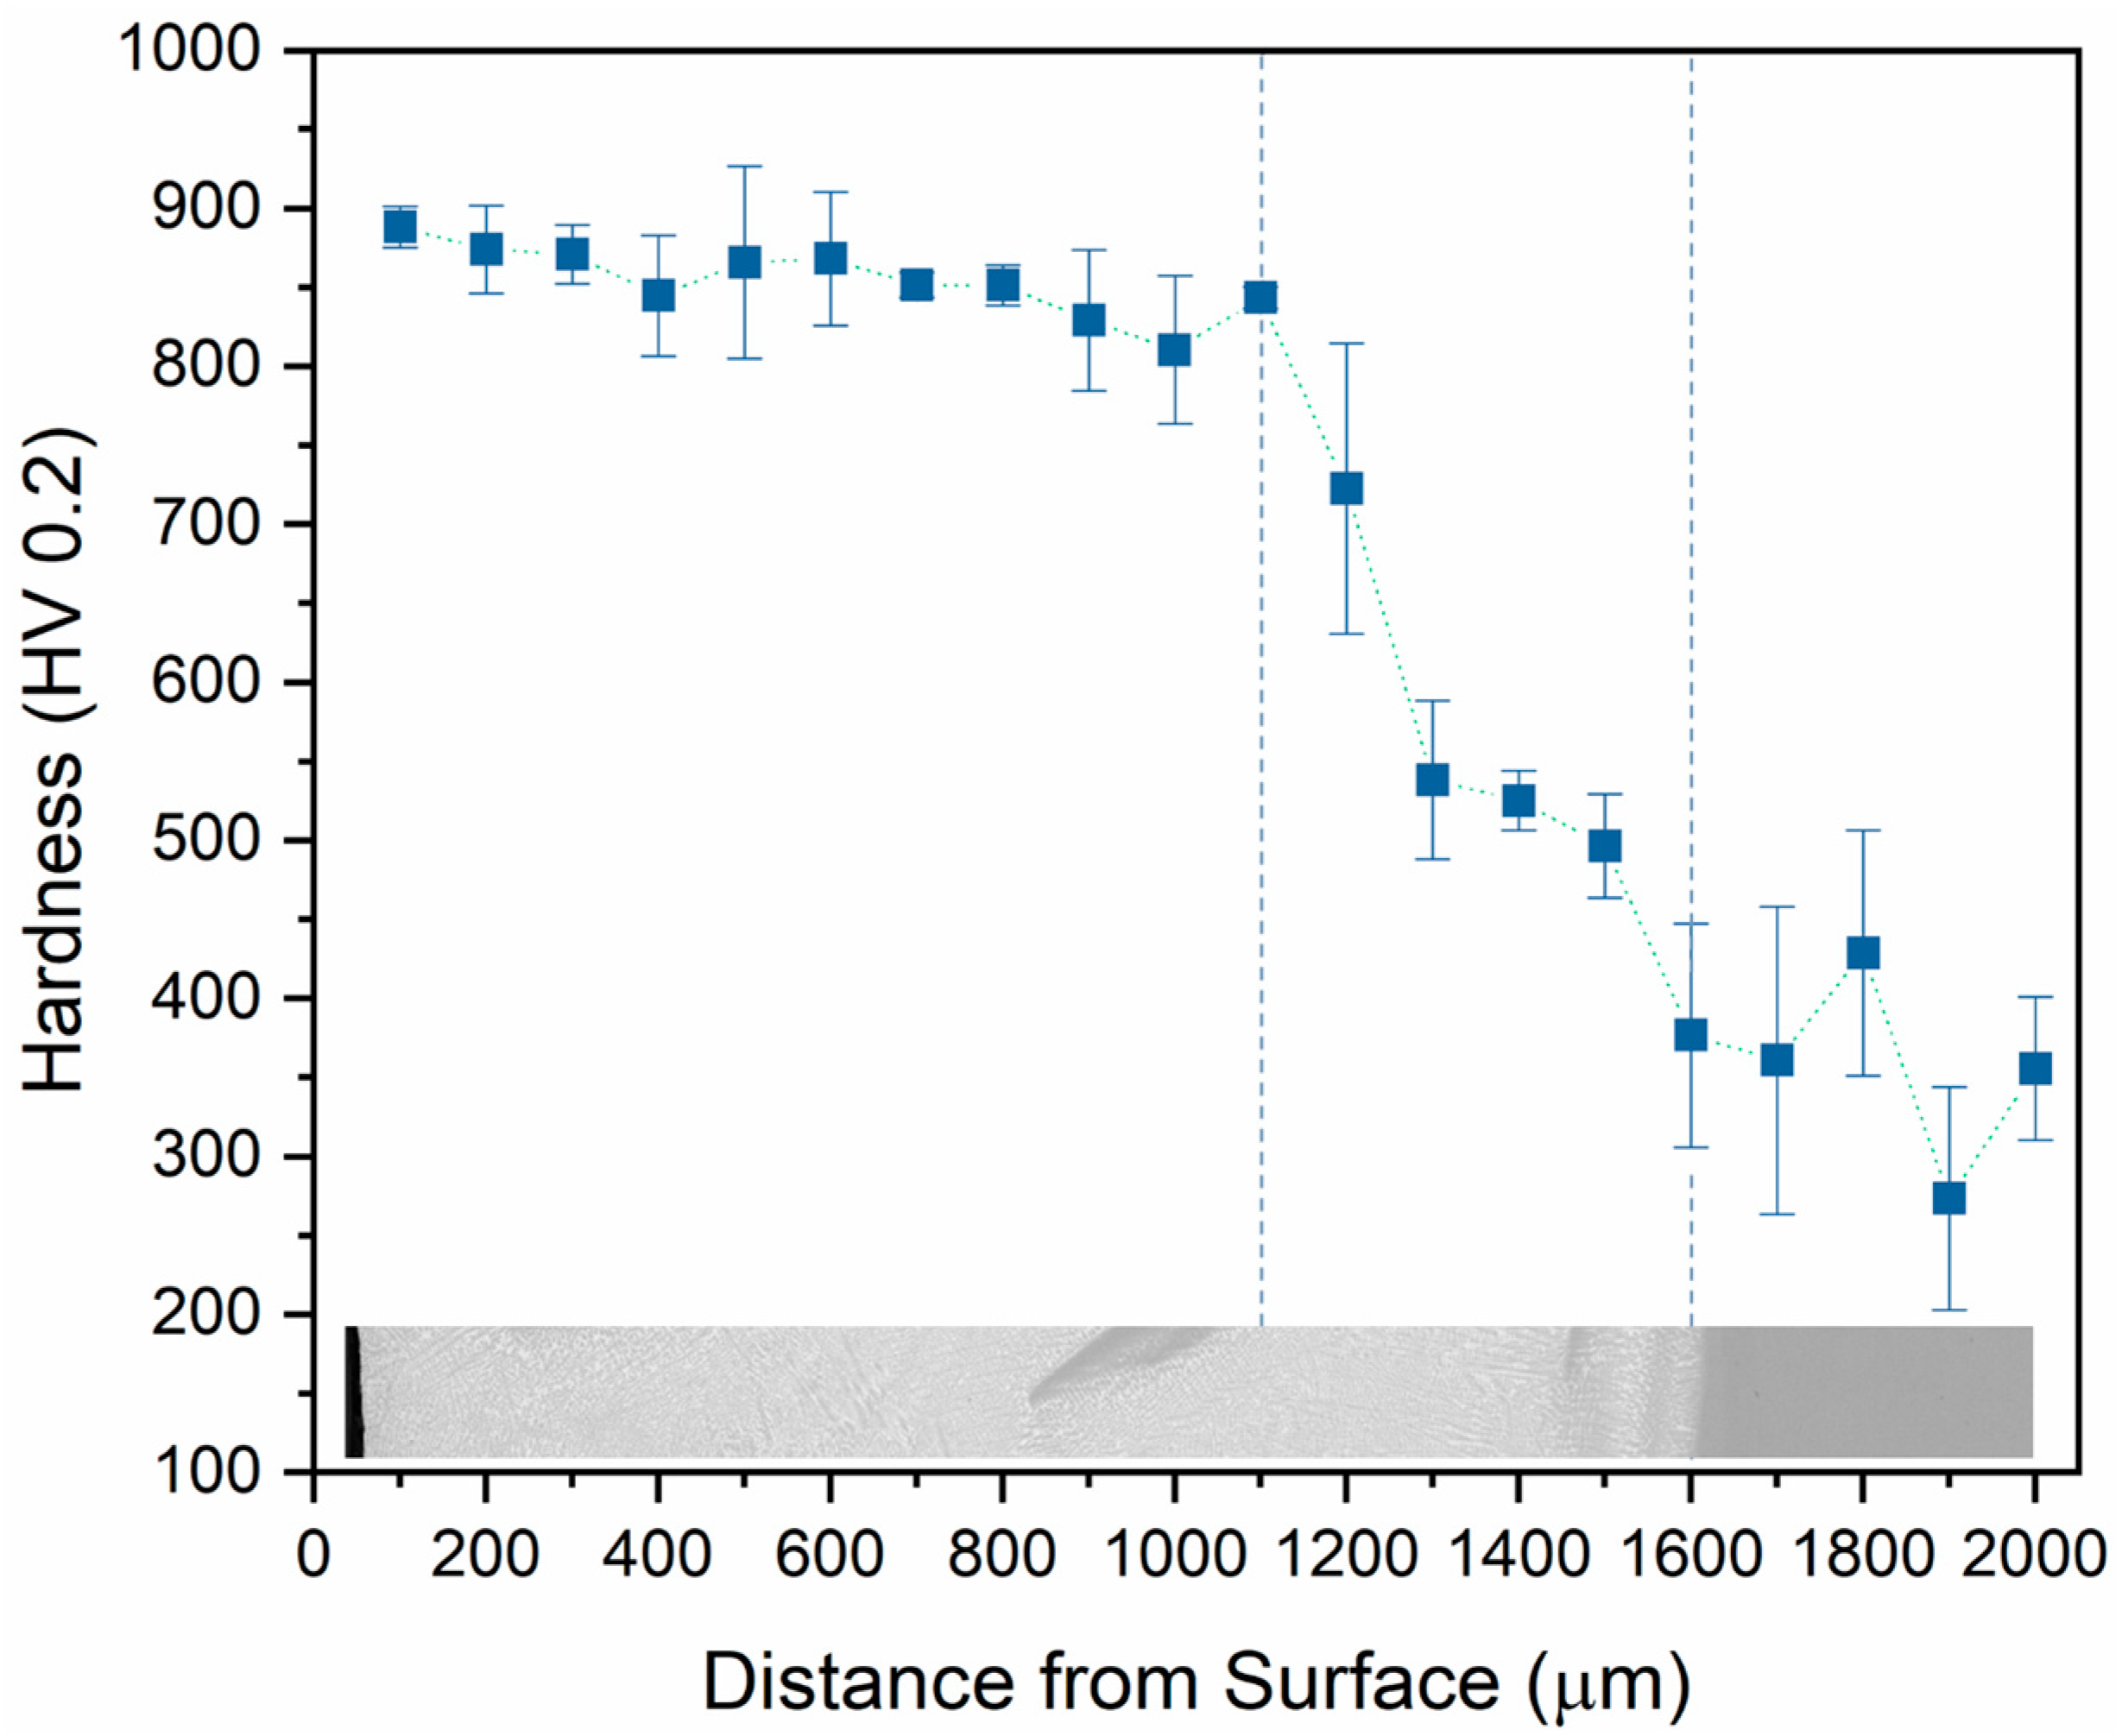
Figure 13 presents the Vickers microhardness as a function of the distance from the interface. The hardness is generally constant from the top surface to almost 1100 µm, reaching the interface with substrate, with an average of 854 ± 37 HV0.2, similar to what is reported in the literature for these materials [37,59,60]. Between 1100 and 1600 µm, due to the Marangoni effect and dissolution of the substrates into the deposited material, the hardness starts to drop from 669 to 465 HV0.2. Above 1600 µm entering the substrate, the hardness becomes somewhat constant again at 360 ± 84 HV0.2, but some variation occurs mainly due to the thermal effects of deposition. This wide range of hardness values correlates with the structure’s heterogeneity at the interface, which is justified by the presence of a rich zone of Fe and W that can lead to a significant change in hardness.

4. Conclusions

The findings of this study confirm that it was possible to produce a reliable powder feedstock from ready-to-press WC-25Co granules for L-DED application. A thermal treatment at 1200 °C for 1 h was sufficient to provide intimate bonding between WC and Co particles to withstand the feeding process for L-DED without agglomeration of granules. The deposition of these composite materials with minimal defects required a strict optimisation of laser power, scanning speed, and feeding rate: 2400 W of laser power, 11 mm/s of scanning speed, and 9 g/min of feeding rate. These iterative experiments following Taguchi arrays were crucial to overcoming challenges, such as poor line morphologies and a lack of deposition. However, due to the large number of tests required to obtain a satisfactory line, the evaluation of the quality of each individual test was necessarily simplified. This was done to enable a rapid narrowing of the parameter range, which may have limited the depth of analysis for each configuration. Moreover, applying an optimised remelting strategy at 2400 W and 9 mm/s was crucial for the elimination of porosity and cracking. The optimal line with remelting strategy showed a microstructure of mainly fine columnar and eutectic dendrites of complex metal carbides due to the dissolution of both WC-Co and the steel substrate. The deposited materials’ average hardness was 854 ± 37 HV0.2, which is comparable to that produced by conventional powder metallurgy routes. Further investigation should be carried out to coat a larger area with adjacent lines and then test its performance, mainly with water tests.
This study highlights the optimisation of single-track processing parameters as a critical first step toward coating development. However, because practical applications require multiple overlapping tracks, the current microstructural and phase analysis remains preliminary. Further work, including residual stress measurements, X-ray diffraction, and multi-layer testing, is needed to fully establish the link between processing conditions, microstructure, and resulting properties.

Author Contributions

Conceptualization, O.E., A.R. and B.G.; methodology, O.E., L.R. and M.F.V.; software, H.N. and L.R.; validation, O.E., C.F., B.G. and D.F.; formal analysis, H.N. and O.E.; investigation, H.N., O.E. and J.N.; resources, O.E., C.F. and M.F.V.; data curation, H.N., J.N. and L.R.; writing—original draft preparation, H.N. and J.N.; writing—review and editing, O.E., C.F. and B.G.; visualisation, H.N. and O.E.; supervision, O.E. and C.F.; project administration, D.F.; funding acquisition, D.F. and A.R. All authors have read and agreed to the published version of the manuscript.

Funding

This research was funded by Project Hi-rEV—Recuperação do Setor de Componentes Automóveis, Portugal (C644864375-00000002), cofinanced by Plano de Recuperação e Resiliência (PRR), República Portuguesa, Portugal, through NextGeneration EU and SNexT- Nova geração de ferramentas híbridas (MPr-2023-7 Project I&DT (SI) n. 14419 with application number COMPETE2030-FEDER-00582100), financed by COMPETE 2030—Thematic Program for Innovation and Digital Transition and FEDER funds.

Data Availability Statement

The raw data supporting the conclusions of this article will be made available by the authors upon request.

Acknowledgments

The authors thank CEMUP (Centro de Materiais da Universidade do Porto) for their professional SEM assistance. Helder Nunes acknowledges Portuguese Foundation for Science and Technology (FCT) 2022.11466.BD grant.

Conflicts of Interest

The authors declare no conflicts of interest.

Abbreviations

The following abbreviations are used in this manuscript:
AMAdditive Manufacturing
L-DEDLaser-Directed Energy Deposition
DoEDesign of Experiments
DSCDifferential Scanning Calorimetry
TGAThermogravimetric Analysis
PSDParticle Size Distribution
GEDGlobal Energy Density
RTPReady-to-press
SNSignal-to-noise

References

  1. García, J.; Ciprés, V.C.; Blomqvist, A.; Kaplan, B. Cemented carbide microstructures: A review. Int. J. Refract. Met. Hard Mater. 2019, 80, 40–68. [Google Scholar] [CrossRef]
  2. Ortner, H.M.; Ettmayer, P.; Kolaska, H. The history of the technological progress of hardmetals. Int. J. Refract. Met. Hard Mater. 2014, 44, 148–159. [Google Scholar] [CrossRef]
  3. He, J.; Schoenung, J.M. A review on nanostructured WC–Co coatings. Surf. Coat. Technol. 2002, 157, 72–79. [Google Scholar] [CrossRef]
  4. Aramian, A.; Razavi, N.; Sadeghian, Z.; Berto, F. A review of additive manufacturing of cermets. Addit. Manuf. 2020, 33, 101130. [Google Scholar] [CrossRef]
  5. Yang, Y.; Zhang, C.; Wang, D.; Nie, L.; Wellmann, D.; Tian, Y. Additive manufacturing of WC-Co hardmetals: A review. Int. J. Adv. Manuf. Technol. 2020, 108, 1653–1673. [Google Scholar] [CrossRef]
  6. Zhao, Z.; Ni, X.; Hu, Z.; Yang, W.; Deng, X.; Wu, S.; Li, Y.; Nie, G.; Wu, H.; Liu, J.; et al. A Short Review of Advancements in Additive Manufacturing of Cemented Carbides. Crystals 2025, 15, 146. [Google Scholar] [CrossRef]
  7. Erfanmanesh, M.; Abdollah-Pour, H.; Mohammadian-Semnani, H.; Shoja-Razavi, R. An empirical-statistical model for laser cladding of WC-12Co powder on AISI 321 stainless steel. Opt. Laser Technol. 2017, 97, 180–186. [Google Scholar] [CrossRef]
  8. Al-Thamir, M.; McCartney, D.G.; Simonelli, M.; Hague, R.; Clare, A. Processability of Atypical WC-Co Composite Feedstock by Laser Powder-Bed Fusion. Materials 2020, 13, 50. [Google Scholar] [CrossRef] [PubMed]
  9. Singh, A.K.; Bal, K.S.; Dey, D.; Das, A.K.; Pal, A.R.; Pratihar, D.K.; Choudhury, A.R. Experimental investigation and parametric optimization for minimization of dilution during direct laser metal deposition of tungsten carbide and cobalt powder mixture on SS304 substrate. Powder Technol. 2021, 390, 339–353. [Google Scholar] [CrossRef]
  10. Erfanmanesh, M.; Shoja-Razavi, R.; Abdollah-Pour, H.; Mohammadian-Semnani, H. Influence of using electroless Ni-P coated WC-Co powder on laser cladding of stainless steel. Surf. Coat. Technol. 2018, 348, 41–54. [Google Scholar] [CrossRef]
  11. Kim, G.; Kim, Y.-C.; Cho, J.-E.; Yim, C.-H.; Yun, D.-S.; Lee, T.-G.; Park, N.-K.; Chung, R.-H.; Hong, D.-G. Microstructural Evolution, Hardness and Wear Resistance of WC-Co-Ni Composite Coatings Fabricated by Laser Cladding. Materials 2024, 17, 2116. [Google Scholar] [CrossRef] [PubMed]
  12. Angelastro, A.; Campanelli, S.L. Direct laser metal deposition of WC/Co/Cr powder by means of the functionally graded materials strategy. Surf. Topogr. Metrol. Prop. 2017, 5, 044002. [Google Scholar] [CrossRef]
  13. Liverani, E.; Ascari, A.; Fortunato, A. Multilayered WC–Co coatings by Direct Energy Deposition-based cladding: Effect of laser remelting on interface defects. Surf. Coat. Technol. 2023, 464, 129556. [Google Scholar] [CrossRef]
  14. Heydari, L.; Lietor, P.F.; Corpas-Iglesias, F.A.; Laguna, O.H. Ti(C,N) and WC-Based Cermets: A Review of Synthesis, Properties and Applications in Additive Manufacturing. Materials 2021, 14, 6786. [Google Scholar] [CrossRef]
  15. Nie, H.; Zhang, T. Development of manufacturing technology on WC–Co hardmetals. Tungsten 2019, 1, 198–212. [Google Scholar] [CrossRef]
  16. Kresse, T.; Meinhard, D.; Bernthaler, T.; Schneider, G. Hardness of WC-Co hard metals: Preparation, quantitative microstructure analysis, structure-property relationship and modelling. Int. J. Refract. Met. Hard Mater. 2018, 75, 287–293. [Google Scholar] [CrossRef]
  17. Ostolaza, M.; Arrizubieta, J.I.; Queguineur, A.; Valtonen, K.; Lamikiz, A.; Ituarte, I.F. Influence of process parameters on the particle–matrix interaction of WC-Co metal matrix composites produced by laser-directed energy deposition. Mater. Des. 2022, 223, 111172. [Google Scholar] [CrossRef]
  18. Traxel, K.D.; Bandyopadhyay, A. Diamond-reinforced cutting tools using laser-based additive manufacturing. Addit. Manuf. 2021, 37, 101602. [Google Scholar] [CrossRef]
  19. Kim, K.-W.; Ham, G.-S.; Park, S.-H.; Cho, J.-W.; Lee, K.-A. Direct energy deposition of ultrastrong WC-12Co cemented carbide: Fabrication, microstructure and compressive properties. Int. J. Refract. Met. Hard Mater. 2021, 99, 105591. [Google Scholar] [CrossRef]
  20. Morales, C.; Fortini, A.; Soffritti, C.; Merlin, M. Effect of Post-Fabrication Heat Treatments on the Microstructure of WC-12Co Direct Energy Depositions. Coatings 2023, 13, 1459. [Google Scholar] [CrossRef]
  21. Yamashita, Y.; Nakamura, M.; Kunimine, T.; Sato, Y.; Funada, Y.; Tsukamoto, M. Effects of WC ratios on bead size and crack initiation in forming WC-Co cemented carbides by the laser metal deposition. J. Laser Appl. 2023, 35, 042010. [Google Scholar] [CrossRef]
  22. Liu, Z.; Jian, L.; Tao, W. Preparation of WC–Co composite powder by electroless plating and its application in laser cladding. Mater. Lett. 2006, 60, 1956–1959. [Google Scholar] [CrossRef]
  23. Erfanmanesh, M.; Abdollah-Pour, H.; Mohammadian-Semnani, H.; Shoja-Razavi, R. Kinetics and oxidation behavior of laser clad WC-Co and Ni/WC-Co coatings. Ceram. Int. 2018, 44, 12805–12814. [Google Scholar] [CrossRef]
  24. You, A.; Wang, N.; Chen, Y.; Jiang, C.; Zhang, Y.; Zhao, Q.; Shi, Y.; Li, Y.; Zhang, F.; Zhao, Y. Effect of linear energy density on microstructure and wear resistance of WC-Co-Cr composite coating by laser cladding. Surf. Coat. Technol. 2023, 454, 129185. [Google Scholar] [CrossRef]
  25. Wang, J.; Meng, H.; Yu, H.; Fan, Z.; Sun, D. Surface hardening of Fe-based alloy powders by Nd:YAG laser cladding followed by electrospark deposition with WC-Co cemented carbide. Rare Met. 2010, 29, 380–384. [Google Scholar] [CrossRef]
  26. Xiong, Y.; Smugeresky, J.E.; Ajdelsztajn, L.; Schoenung, J.M. Fabrication of WC–Co cermets by laser engineered net shaping. Mater. Sci. Eng. A 2008, 493, 261–266. [Google Scholar] [CrossRef]
  27. Xiong, Y.; Smugeresky, J.E.; Schoenung, J.M. The influence of working distance on laser deposited WC–Co. J. Mater. Process. Technol. 2009, 209, 4935–4941. [Google Scholar] [CrossRef]
  28. Angelastro, A.; Campanelli, S.L.; Casalino, G.; Ludovico, A.D. Optimization of Ni-Based WC/Co/Cr Composite Coatings Produced by Multilayer Laser Cladding. Adv. Mater. Sci. Eng. 2013, 2013, 615464. [Google Scholar] [CrossRef]
  29. Valsecchi, B.; Previtali, B.; Vedani, M.; Vimercati, G. Fiber Laser Cladding with High Content of WC-Co Based Powder. Int. J. Mater. Form. 2010, 3, 1127–1130. [Google Scholar] [CrossRef]
  30. Kunimine, T.; Miyazaki, R.; Yamashita, Y.; Funada, Y. Effects of Laser-Beam Defocus on Microstructural Features of Compositionally Graded WC/Co-Alloy Composites Additively Manufactured by Multi-Beam Laser Directed Energy Deposition. Sci. Rep. 2020, 10, 8975. [Google Scholar] [CrossRef]
  31. Xu, M.; Tang, J.; Ye, N.; Chen, X.; Hu, M. Microstructure and mechanical properties of laser-cladded WC–Co composite coatings on Ti–6Al–4V. Mater. Res. Express 2019, 6, 1265k2. [Google Scholar] [CrossRef]
  32. Hazzan, K.E.; Pacella, M.; See, T.L. Understanding the surface integrity of laser surface engineered tungsten carbide. Int. J. Adv. Manuf. Technol. 2022, 118, 1141–1163. [Google Scholar] [CrossRef]
  33. Bidare, P.; Jiménez, A.; Hassanin, H.; Essa, K. Porosity, cracks, and mechanical properties of additively manufactured tooling alloys: A review. Adv. Manuf. 2022, 10, 175–204. [Google Scholar] [CrossRef]
  34. Lee, S.W.; Kim, Y.W.; Jang, K.M.; Lee, J.W.; Park, M.-S.; Koo, H.Y.; Ha, G.-H.; Kang, Y.C. Phase control of WC–Co hardmetal using additive manufacturing technologies. Powder Metall. 2022, 65, 13–21. [Google Scholar] [CrossRef]
  35. Konyashin, I.; Hinners, H.; Ries, B.; Kirchner, A.; Klöden, B.; Kieback, B.; Nilen, R.; Sidorenko, D. Additive manufacturing of WC-13%Co by selective electron beam melting: Achievements and challenges. Int. J. Refract. Met. Hard Mater. 2019, 84, 105028. [Google Scholar] [CrossRef]
  36. Sykora, J.; Sedlmajer, M.; Schubert, T.; Merkel, M.; Kroft, L.; Kucerova, L.; Rehor, J. Additive Manufacturing of WC-Co Specimens with Internal Channels. Materials 2023, 16, 3907. [Google Scholar] [CrossRef]
  37. Ibe, H.; Kato, Y.; Yamada, J.; Kato, M.; Suzuki, A.; Takata, N.; Kobashi, M. Controlling WC/Co two-phase microstructure of cemented carbides additive-manufactured by laser powder bed fusion: Effect of powder composition and post heat-treatment. Mater. Des. 2021, 210, 110034. [Google Scholar] [CrossRef]
  38. Bricín, D.; Kříž, A. Processability of WC-CO Powder Mixtures Using SLM Additive Technology. MM Sci. J. 2019, 2019, 2939–2945. [Google Scholar] [CrossRef]
  39. Liu, J.; Chen, J.; Lu, Y.; Deng, X.; Wu, S.; Lu, Z. WC Grain Growth Behavior During Selective Laser Melting of WC–Co Cemented Carbides. Acta Metall. Sin. (Engl. Lett.) 2023, 36, 949–961. [Google Scholar] [CrossRef]
  40. Campanelli, S.L.; Contuzzi, N.; Posa, P.; Angelastro, A. Printability and Microstructure of Selective Laser Melting of WC/Co/Cr Powder. Materials 2019, 12, 2397. [Google Scholar] [CrossRef] [PubMed]
  41. Uhlmann, E.; Bergmann, A.; Gridin, W. Investigation on Additive Manufacturing of Tungsten Carbide-cobalt by Selective Laser Melting. Procedia CIRP 2015, 35, 8–15. [Google Scholar] [CrossRef]
  42. Grigoriev, S.; Tarasova, T.; Gusarov, A.; Khmyrov, R.; Egorov, S. Possibilities of Manufacturing Products from Cermet Compositions Using Nanoscale Powders by Additive Manufacturing Methods. Materials 2019, 12, 3425. [Google Scholar] [CrossRef] [PubMed]
  43. Chen, J.; Huang, M.; Fang, Z.Z.; Koopman, M.; Liu, W.; Deng, X.; Zhao, Z.; Chen, S.; Wu, S.; Liu, J.; et al. Microstructure analysis of high density WC-Co composite prepared by one step selective laser melting. Int. J. Refract. Met. Hard Mater. 2019, 84, 104980. [Google Scholar] [CrossRef]
  44. Zhao, Y.; Wang, H.; Zhang, L.; Li, X.; Guo, Z.; Zhang, J.; Yi, D.; Liu, B.; Bai, P. Study on the microstructure and properties of WC-12Co cemented carbide fabricated by selective laser melting. J. Mater. Res. Technol. 2022, 20, 3512–3521. [Google Scholar] [CrossRef]
  45. Khmyrov, R.S.; Shevchukov, A.P.; Gusarov, A.V.; Tarasova, T.V.; Grigoriev, S.N. Phase composition and microstructure of WC–Co alloys obtained by selective laser melting. Mech. Ind. 2017, 18, 714. [Google Scholar] [CrossRef]
  46. Agyapong, J.; Czekanski, A.; Boakye-Yiadom, S. Effect of Process Parameters on Part Quality, Microstructure, and Mechanical Properties of a WC-Co-Hexagonal Boron Nitride Alloy Prepared by Laser Power Bed Fusion Process. J. Mater. Eng. Perform. 2024, 33, 410–426. [Google Scholar] [CrossRef]
  47. Schaak, C.; Kleszczynski, S.; Tillmann, W.; Witt, G. Investigation of LBM-processed bimodal powder mixtures of the nickel base alloy HX and WC–Co. Prog. Addit. Manuf. 2019, 4, 43–54. [Google Scholar] [CrossRef]
  48. Fries, S.; Vogelpoth, A.; Kaletsch, A.; Broeckmann, C. Influence of post heat treatment on microstructure and fracture strength of cemented carbides manufactured using laser-based additive manufacturing. Int. J. Refract. Met. Hard Mater. 2023, 111, 106085. [Google Scholar] [CrossRef]
  49. Fries, S.; Genilke, S.; Wilms, M.B.; Seimann, M.; Weisheit, A.; Kaletsch, A.; Bergs, T.; Schleifenbaum, J.H.; Broeckmann, C. Laser-Based Additive Manufacturing of WC–Co with High-Temperature Powder Bed Preheating. Steel Res. Int. 2020, 91, 1900511. [Google Scholar] [CrossRef]
  50. Schindelin, J.; Arganda-Carreras, I.; Frise, E.; Kaynig, V.; Longair, M.; Pietzsch, T.; Preibisch, S.; Rueden, C.; Saalfeld, S.; Schmid, B.; et al. Fiji: An open-source platform for biological-image analysis. Nat. Methods 2012, 9, 676–682. [Google Scholar] [CrossRef]
  51. Ferreira, T.; Hiner, M.; Rueden, C.; Miura, K.; Eglinger, J.; Chef, B. tferr/Scripts: BAR 1.5.1.; Zenodo: Geneva, Switzerland, 2017. [Google Scholar] [CrossRef]
  52. ISO 6507-1; Metallic Materials—Vickers Hardness Test, in Part 1, Test Method. ISO: Geneva, Switzerland, 2023.
  53. Eso, O.O. Densification and sintering shrinkage of Zinc Reclaimed WC-Co. Int. J. Refract. Met. Hard Mater. 2016, 54, 445–454. [Google Scholar] [CrossRef]
  54. Yamaguchi, T.; Hagino, H. Effects of the ambient oxygen concentration on WC-12Co cermet coatings fabricated by laser cladding. Opt. Laser Technol. 2021, 139, 106922. [Google Scholar] [CrossRef]
  55. Yamaguchi, T.; Tanaka, K.; Suyama, T. In-situ observation of CO gas bubble behavior in molten pool during direct laser deposition of WC-Co cermet material. Opt. Laser Technol. 2025, 180, 111561. [Google Scholar] [CrossRef]
  56. Li, M.; Huang, K.; Yi, X. Crack Formation Mechanisms and Control Methods of Laser Cladding Coatings: A Review. Coatings 2023, 13, 1117. [Google Scholar] [CrossRef]
  57. Liu, T.; Qu, X.; Zheng, Y.; Wang, Y.; Yu, C.; Lu, H. Revealing multiphysics effects on microstructure characteristics in powder-fed laser cladding based on a comprehensive model. J. Mater. Res. Technol. 2024, 29, 3673–3685. [Google Scholar] [CrossRef]
  58. Hu, M.; Tang, J.-C.; Chen, X.-G.; Ye, N.; Zhao, X.-Y.; Xu, M.-M. Microstructure and properties of WC-12Co composite coatings prepared by laser cladding. Trans. Nonferrous Met. Soc. China 2020, 30, 1017–1030. [Google Scholar] [CrossRef]
  59. Dosta, S.; Couto, M.; Guilemany, J.M. Cold spray deposition of a WC-25Co cermet onto Al7075-T6 and carbon steel substrates. Acta Mater. 2013, 61, 643–652. [Google Scholar] [CrossRef]
  60. Yin, S.; Ekoi, E.J.; Lupton, T.L.; Dowling, D.P.; Lupoi, R. Cold spraying of WC-Co-Ni coatings using porous WC-17Co powders: Formation mechanism, microstructure characterization and tribological performance. Mater. Des. 2017, 126, 305–313. [Google Scholar] [CrossRef]
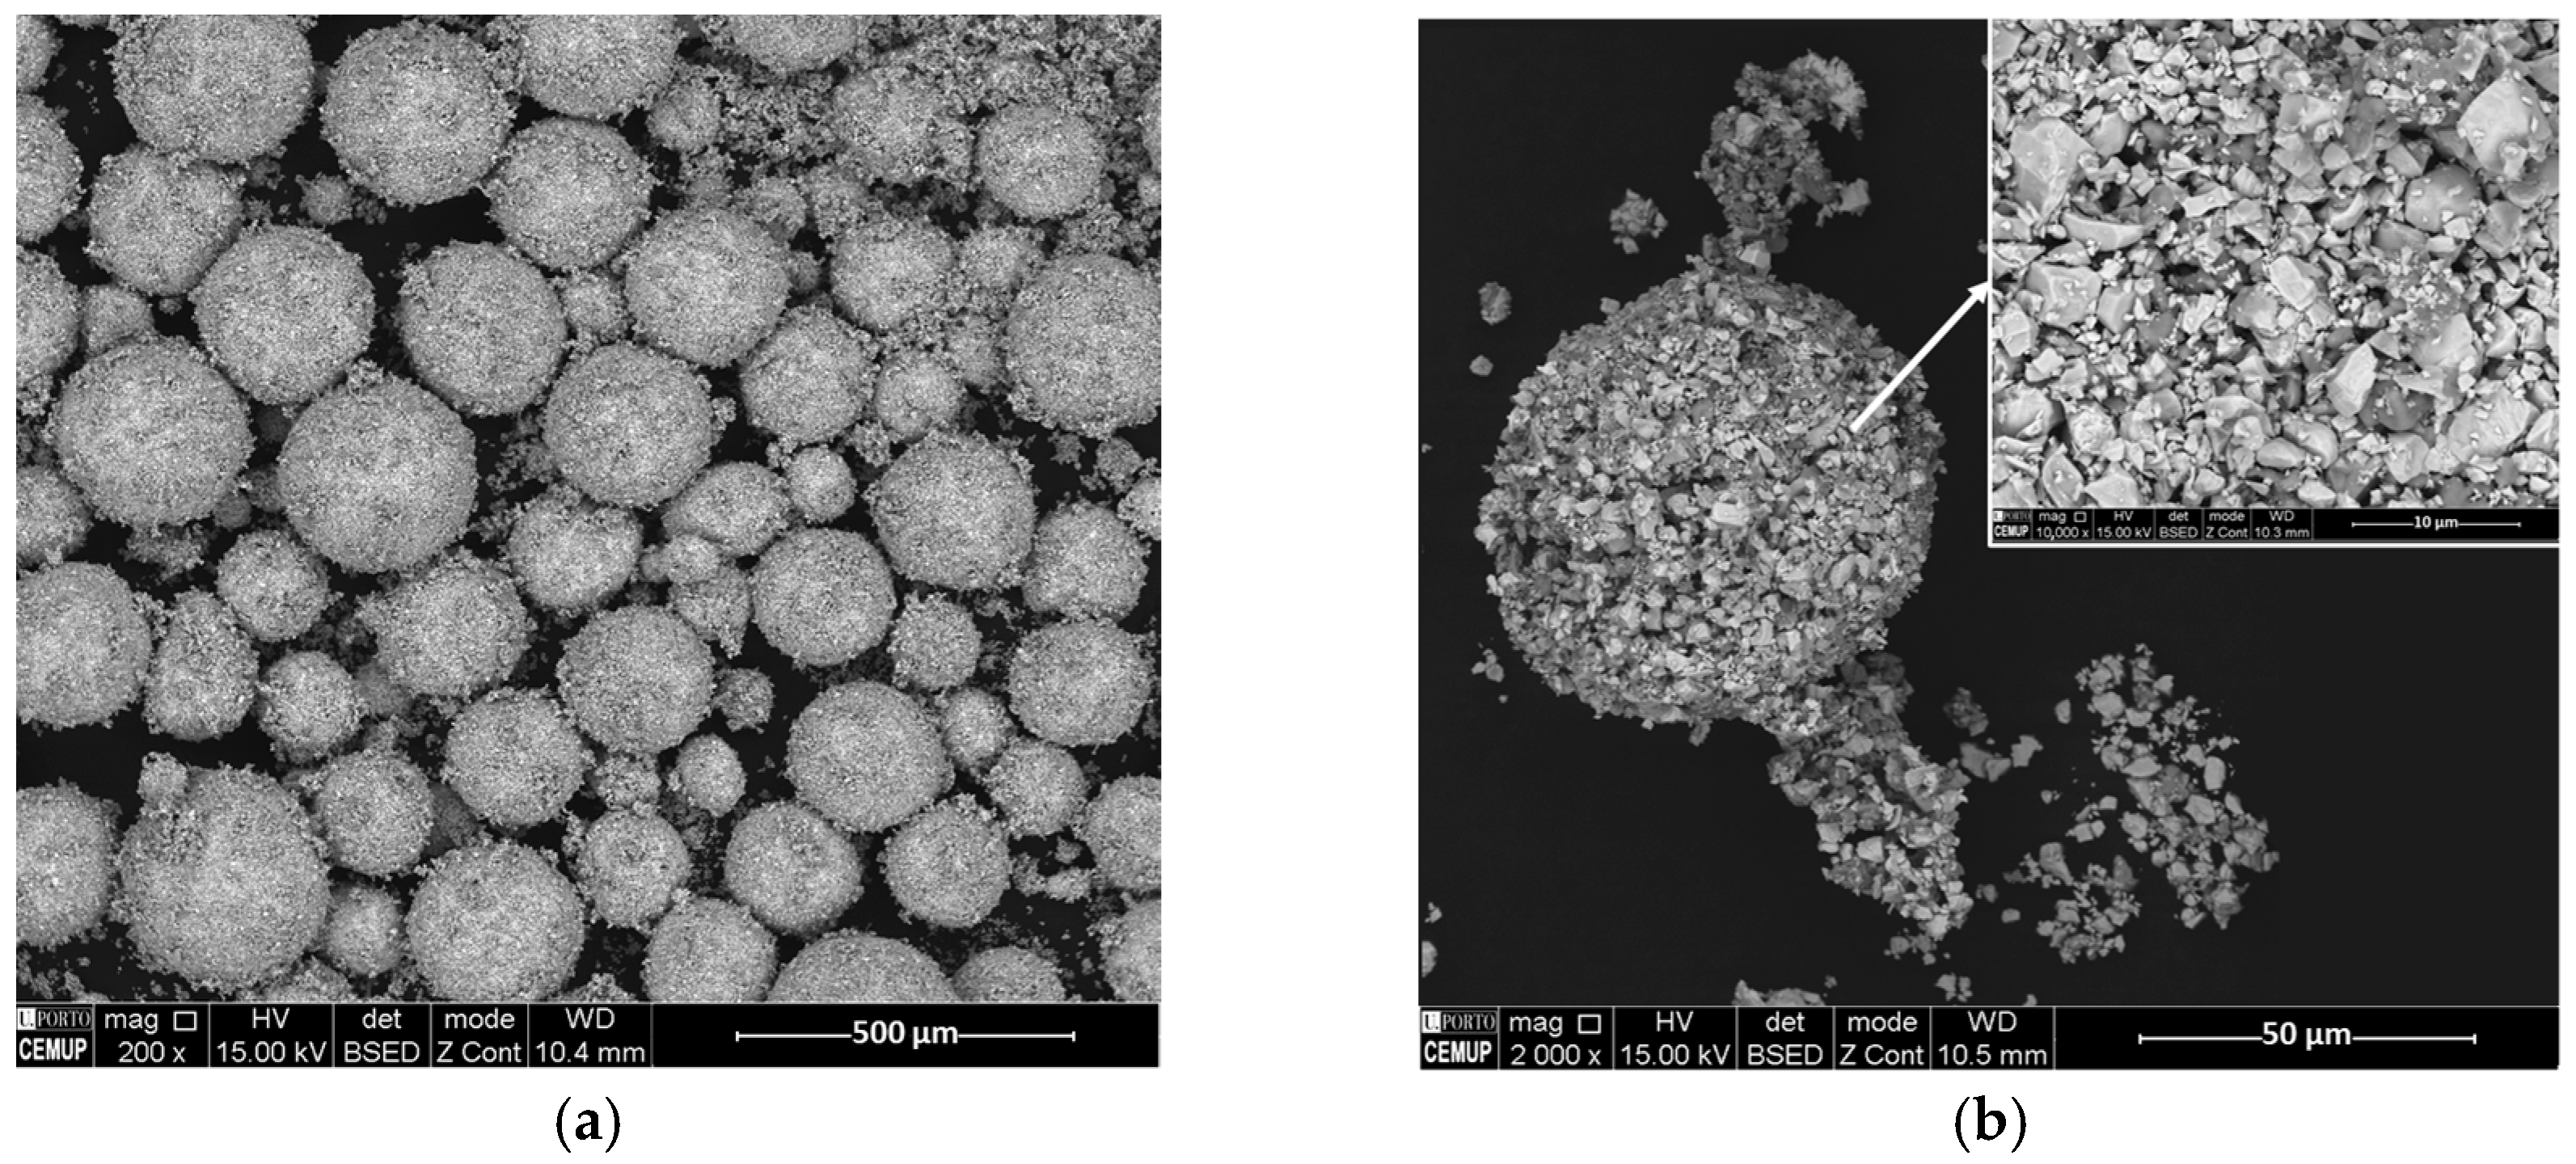
Figure 1. (a,b) SEM images of the WC-25Co granules used in this study. (c) Powder PSD and characteristics.
Jmmp 09 00279 g001aJmmp 09 00279 g001b
Figure 2. L-DED depositing system: (1) KUKA industrial robot; (2) powder splitter; (3) nozzle head; (4) powder feeders; and (5) heating plate.
Jmmp 09 00279 g002
Figure 3. Calorimetry studies varying temperatures (1000, 1100, 1200 °C) and stages of time (1 and 3 h): (a) DSC and (b) TGA.
Jmmp 09 00279 g003
Figure 4. SEM images of the DSC powders: (a) 1000 °C–1 h; (b) 1000 °C-3 h; (c) 1100 °C-1 h; (d) 1100 °C-3 h; (e) 1200 °C-1 h. (f) Higher magnification of the powder in (e). EDS results of Z1 (g) and Z2 (h) are represented in (f).
Jmmp 09 00279 g004
Figure 5. SEM image (a) and size distribution curve (b) of PSD of the powder used in DED.
Jmmp 09 00279 g005
Figure 6. Results of the first three arrays of DED experiments.
Jmmp 09 00279 g006
Figure 7. (a) Final L9 Taguchi array with three repetitions. (b) Main effects plot for signal-to-noise ratios of the line quality.
Jmmp 09 00279 g007
Figure 8. (a) Three repetitions of the optimal line (2400 W, 11 mm/s, 9 g/min). (b) Transversal (with pore area analysis overlayed and (c) longitudinal cross-section of the line, with a magnified view of one pore highlighted by a yellow arrow.
Jmmp 09 00279 g008
Figure 9. Longitudinal cross-section of tracks by varying the power and speed of remelting.
Jmmp 09 00279 g009
Figure 10. Track and defect features (average pore size in mm2, pore area fraction in (%), and track height in mm) evolution with remelting: (a) varying the power, and (b) varying the laser speed.
Jmmp 09 00279 g010
Figure 11. SEM backscattered electron image mode showing longitudinal cross-section of the optimal line (2400 W, 11 mm/s, 9 g/min) with remelting at 2400 W and 9 mm/s: (a,b) line extremities and (c,d) middle of the line. (e) EDS spectra of the Z1 and Z2 in (c). (f) Elemental maps for W and Fe in image (d).
Jmmp 09 00279 g011
Figure 12. Higher-magnification SEM images of three zones of the longitudinal section of the optimal line (2400 W, 11 mm/s, 9 g/min) with remelting at 2400 W and 9 mm/s: (a,b) top—close to the surface; (c,d) middle; (e,f) close to the interface.
Jmmp 09 00279 g012
Figure 13. Vickers hardness as a function of the distance from the topmost surface measured on the optimal line (2400 W, 11 mm/s, 9 g/min) with remelting at 2400 W and 9 mm/s.
Jmmp 09 00279 g013
Table 1. Different Taguchi orthogonal arrays were used in this study.
1 º Array—L25 (53)2 º Array—L16 (43)3 º Array—L9 (33)Final Array—L9 (33)
Run (R1)PowerSpeedFeedGEDQIRun (R2)PowerSpeedFeedGEDQIRun (R3)PowerSpeedFeedGEDQIRun (Rf)PowerSpeedFeedGEDQI
1290018227771240018206310126001510831312400111110412.0 ±1.0
213181067213158892128103132101011411.8 ± 1.2
3814173738101431231051241439912711.8 ± 1.2
4582767455229154240015876104220011109512.7 ± 0.8
5122138115220018155095125959510910512.3 ± 0.8
624001818638613107012610101141169111169.2 ± 2.3
7131488978511311722001557011720001198712.0 ± 1.0
888143108520181108121087881011959.0 ± 1.0
95222989120018103299108105999101068.3 ± 0.7
1012211431101354414
111900181450811820718
12138709125151149
1382113613700185193
145221816141320265
15118905015815425
16120018832716510673
17132445
18822719
1951811410
201145714
21700182194
221322264
23818424
24514674
25183337
Table 2. Parameters used for the remelting studies.
1º Test—Varying Speed2º Test—Varying Power
Laser Power (W)Scanning Speed (mm/s)Laser Power (W)Scanning Speed (mm/s)
Constant at 240091800Constant at 11
102000
122200
132400
Table 3. EDS results in wt.% of the zones identified in Figure 12.
ZoneWCoFeMnSiC
Z148.017.0943.74--1.15
Z217.8412.2169.05--0.89
Z312.45.8380.83--0.93
Z447.67.5243.52--1.36
Z521.5312.7664.030.7-0.98
Z645.955.4946.790.78-6.46
Z7--97.311.10.770.81
Z812.936.9677.920.690.580.91
Disclaimer/Publisher’s Note: The statements, opinions and data contained in all publications are solely those of the individual author(s) and contributor(s) and not of MDPI and/or the editor(s). MDPI and/or the editor(s) disclaim responsibility for any injury to people or property resulting from any ideas, methods, instructions or products referred to in the content.