Article

Extrusion 3D-Printed Kaolinite Ceramic Filters for Water Applications

by
Rawan Elsersawy
,
Romina Donyadari
and
Mohammad Abu Hasan Khondoker
*
Industrial Systems Engineering, Faculty of Engineering and Applied Sciences, University of Regina, Regina, SK S4S 0A2, Canada
*
Author to whom correspondence should be addressed.
J. Manuf. Mater. Process. 2025, 9(8), 278; https://doi.org/10.3390/jmmp9080278
Submission received: 1 July 2025 / Revised: 30 July 2025 / Accepted: 7 August 2025 / Published: 14 August 2025

Abstract

Ceramic materials have been utilized for centuries across a range of industries due to their chemical stability and porous microstructure. One prominent application is water filtration, where ceramics offer an effective medium for removing contaminants. Ceramic filters can operate under either pressure-driven or gravity-driven mechanisms. While traditional fabrication techniques, such as pottery, have been historically employed to produce ceramic filters, these methods are limited by user skills, lack of reproducibility, and geometric constraints. In contrast, modern additive manufacturing techniques provide enhanced precision, repeatability, and customization. This study employs extrusion-based 3D printing to fabricate gravity-driven ceramic filters with tailored geometries to meet specific performance requirements. The use of 3D printing allows for efficient production of uniform filters with optimized internal structures. The selected ceramic material, derived from natural sources, offers environmental compatibility, as it is both sustainable and biodegradable. The fabricated filters were evaluated for their effectiveness in treating water. The filtration tests showed significant improvements in water quality, including reduced turbidity, color, iron, manganese, and total and calcium hardness. pH increased from 6.23 to 7.26, and conductivity dropped from 7.43 mS to 4.5 mS, indicating effective ion removal. These findings highlight the potential of 3D-printed ceramic filters as an environmentally friendly and effective solution for decentralized water purification applications.

1. Introduction

Access to clean water is considered one of the most important challenges in the world, especially when it comes to low-resource, and rural areas. Several techniques have been developed to solve this issue, one of which is ceramic water filtration. Ceramic filtration has the ability to remove both chemical and physical impurities, which makes it one of the most reliable and cost-effective methods of water treatment. What makes it a good candidate for water filtration is the voids in its structure, as during the firing process of ceramic filters, water and binder leave the initial structure with voids [1,2,3]. Other ceramic properties, such as porosity, thermal stability, and chemical resistance, make it a promising solution for filtration applications. In particular, for off-grid and household-scale water treatment, gravity-driven ceramic filters are desirable, due to their simple operating conditions and lack of energy requirement.
Kaolinite-based ceramics are known for their sustainability, biodegradability, and plasticity, which are key properties in water filtration. Kaolinite is a clay-based mineral that has a low affinity for water, which gives it a low plasticity and compressive strength; however, its microstructure makes it favourable for developing Expanded Clay Aggregates (ECAs), which are used in water filtration applications. Important features, such as moisture content, chemical composition, and plasticity, are essential for water treatment, making kaolinite a leading material, with its distinctive behaviour among other clay minerals [4,5]. Kaolinite is an effective adsorbent for the removal of specific contaminants such as fluoride and cadmium in water. Kaolinite effectively adsorbs fluoride at pH 4.5–6, where the process is endothermic and not affected by nitrate and chloride ions but susceptible to sulfate and carbonate, which can reduce adsorption due to competition [6,7]. Acid activation of kaolinite increases its heavy metal adsorption capacity for cadmium but is less efficient in comparison to montmorillonite [8,9].
Historically, ceramic filters have been produced using traditional techniques such as hand molding and slip casting. While these are established procedures, they are typically marred with challenges related to repeatability, precision, and design freedom. Additive manufacturing has brought new possibilities for the manufacture of intricate ceramic structures with high dimensional accuracy and repeatability. Among such techniques, 3D printing by extrusion can potentially produce customized ceramic parts, e.g., filtration equipment, with architected pore structures [10,11].
Three-dimensional printing facilitates the fabrication of ceramic filters with complex geometries and specified porosity, which is difficult to fabricate through traditional methods [12]. Techniques such as Direct Ink Writing (DIW), binder jetting, and robocasting are often utilized in the fabrication of ceramic filters, allowing the customization of filter structure and function [13,14]. However, achieving the right density and mechanical characteristics in 3D-printed ceramics is difficult, often requiring the optimization of printing parameters and post-processing techniques [2,15]. Ensuring constant poverty along with structural integrity is critical for filter efficiency. The flexibility of 3D printing enables the manufacture of functionally graded materials and composite structures, opening new possibilities for next-generation advanced filtration devices. Present research focuses on the optimization of material formulation, process control, and integration of new functionality into kaolinite and ceramic filters [16,17].
This study explores the fabrication of gravity-driven water filters using extrusion-based 3D printing of kaolinite-based ceramic materials. The novelty of this research lies in the integration of extrusion-based 3D printing with naturally sourced kaolinite clay to develop gravity-driven ceramic water filters with controlled geometry, reproducibility, and enhanced performance. Unlike conventional ceramic filter fabrication methods, which are often artisanal and suffer from variability and structural limitations, this study demonstrates a scalable and sustainable approach for producing uniform, mechanically stable filters tailored for decentralized water purification. The work not only identifies the optimal material composition for balancing printability and strength but also evaluates the effects of filter structure on water treatment efficiency, including reductions in turbidity, heavy metals, and ionic content. This approach, combining material science, advanced manufacturing, and environmental performance assessment, positions the study as a significant step toward customizable, low-cost, and eco-friendly water purification technologies. The results demonstrate the effectiveness of the printed ceramic filters and underscore their potential for sustainable water treatment applications.

2. Materials

The main material used is kaolinite, which is an alumina–silica clay with the formula AL2O3.2SiO2.2H2O. It was purchased from Sigma Aldrich (MilliporeSigma Canada Ltd., https://www.sigmaaldrich.com, Oakville, ON, Canada) and was used for filter production using a ceramic 3D printer (Tronxy; Moore 2 Pro; https://www.tronxy3d.com/ (accessed on 1 July 2025); Shenzhen, China). In order to optimize the water percentage in the powder, the powder was mixed with different percentages of water, which, in return, resulted in better printability and filtration. Water was added to kaolinite based on previously specified ratios, then the mixture was mechanically mixed using a Vevor mixer (Vevor; JJ-1, https://www.vevor.ca/ (accessed on 1 July 2025), Shanghai, China). Kaolinite was then left in a sealed container for 24 h to allow for full water absorption. After that, another step of mixing was completed for kaolinite to be used in printing.
Fusion 360 “https://www.autodesk.com/ca-en/products/fusion-360/overview (accessed on 1 July 2025)” was the main design software for compression test samples, as well as water filters. A solid, cylinder-shaped design with a height of 15 mm and a diameter of 35 mm was prepared for the compression test to determine the mechanical properties of the ceramic based on its water percentage, following the ASTM C1424-15 standard [18]. A hollow cylinder with 50 mm width × 50 mm height, 1 mm wall thickness, and 0.5 mm base thickness was designed to be able to hold water inside.

3. Methodology

To ensure the robustness and applicability of the experimental design, three types of water were selected to represent a spectrum of water qualities. First is the demineralized water, in which all ions and microbes were removed. Demineralized water was used as a control to provide a baseline condition with minimal interference. The second source is city water, which was taken from tap water in the city of Regina to compare the results of the filters used in this research. Tap water represents a low-contaminant municipal water source, typically containing residual chlorine (0.85 mg/L), turbidity (0.17 NTU), and total dissolved solids (TDSs) in the range of 376 mg/L [19]. The last source is the contaminated water taken from the return side of a cooling tower from the Co-op refinery in Regina. In a refinery, treated water is introduced to heat exchangers to cool down the process chemicals. This water passes through the heat exchangers and the pipes and goes to a cooling tower to lose its temperature and cool down. While passing through the system, microbes and ions dissolve in water, and once it returns to the cooling tower, it is contaminated and needs to be treated again. Refinery wastewater was chosen due to its high complexity and pollutant load. Refinery water can become contaminated through various pathways. Hydrocarbons from crude oil may enter the water due to leakage in heat exchangers, allowing refinery chemicals to seep into the water system. Additionally, microbial contaminants such as microbes, yeast, mold, and fungi can proliferate in a moist environment. Heavy metals like iron are also commonly found in refinery water, often because of pipeline corrosion. To manage system integrity, refinery water is typically treated with a range of chemicals aimed at controlling corrosion, microbial activity, and scaling; however, these treatment chemicals often remain in the water that returns to the cooling tower. Commonly detected substances in this returned water include silica (Si), calcium (Ca), and magnesium (Mg), contributing to hardness, as well as dissolved solids that affect turbidity and color [20]. This contaminated water was used as a source for the filtration tests to see how ceramic filters can improve the quality of this water. The selected materials enable evaluation of the system’s performance under varying levels of water purity and contaminant complexity, thereby enhancing the generalizability of the findings.

3.1. Printer Preparation

Kaolinite was added to the barrel in small portions to avoid air trapping. The filled barrel was then secured in place using a rack and screws, and the supporter was screwed onto the motor and plunger. Before connecting the hose to the other side of the barrel, the plunger was activated, and kaolinite was pushed throughout the barrel to ensure homogeneity and the release of any trapped air. Then, the hose was connected to the barrel, and the same procedure was conducted until no air was present in the hose, making kaolinite flow freely from the other side. Finally, the other opening of the hose was attached to the 3D printing body and the nozzle. It is an essential step to do a step-by-step assembly in order to prevent kaolinite from drying or having air trapping, which necessitates reassembly. Additionally, if air remains in the hose or barrels, it can easily cause defects in the sample during the printing process.

3.2. Printer Parameters

The printing parameters for ceramic extrusion 3D printing have been studied in previous research using the same 3D printer [14]. A nozzle size of 1.6 mm (14G) was chosen for this research and was not changed throughout the research. To control the printing parameters, UltiMaker Cura 5.4.0 was used as a slicing software. An extrusion flow rate of 1% and 0.7 mm/s was chosen on the Cura and printer’s screen settings, respectively. The speed was 20 mm/s. Layer height of 1.5 mm, line width of 1 mm, and infill density of 40% were also selected in the Cura software v5.0.

3.3. Effect of Water Content

An essential part of this research is to determine the optimal water-to-kaolinite ratio based on the desired properties of the final samples in mechanical and water filtration testing. Based on preliminary tests, a range of 36% to 40 wt% of water was selected for more detailed comparison. Three cylindrical samples were printed using each water percentage. The samples were left in the lab to air dry for one week after printing and then sintered in a furnace to produce the final ceramic samples. For sintering, the samples were heated at a rate of 3 °C/min up to 550 °C, held for 1 h, and then heated again at the same rate to 1100 °C, where they were kept for another hour. Finally, the furnace was turned off, and the samples were left to cool overnight. The water and kaolinite contents used for each sample are listed below in Table 1.
To realize the effect of kaolinite water content, the three ratios of 36, 37, and 40 wt% water content were selected, and 3 samples were printed for each. These samples were used as gravity-driven water filters.

3.4. Effect of Sintering on Dimension Stability

Three cylindrical samples were printed for each water percentage, as specified in Table 2. The samples were then weighed and dimensionally checked to quantify the shrinkage based on water content before and after sintering. All samples are shown in Table 2.

3.5. X-Ray Diffraction (XRD)

For crystalline materials such as ceramics, structural characterization using X-ray diffraction (XRD) is a powerful technique for identifying the crystalline phases present in the sample. When X-rays are directed at the material, they produce diffraction patterns that reveal valuable insights into its atomic structure and composition. For XRD testing, a sintered kaolinite sample was sanded, and then the resulting powder was used for XRD testing. The positions of the peaks were compared with standard reference patterns to reveal the crystal structure and present phases.
The XRD analysis was conducted using a Rigaku Ultima IV diffractometer equipped with a copper X-ray source (Kα1 = 1.54060 Å, Kα2 = 1.54443 Å), Crossbeam Optics (CBO), and a scintillation counter detector. The instrument operated at 40 kV and 44 mA. Measurements were performed using the multipurpose sample attachment and parafocusing geometry. A nickel (Ni) Kβ filter was placed at the detector side to eliminate Kβ radiation. Diffraction patterns were recorded over a 2θ range of 10–100°, with a step size of 0.01° and a scan rate of 1°/min, corresponding to an exposure time of 0.6 s per step.

3.6. Scanning Electron Microscopy (SEM)

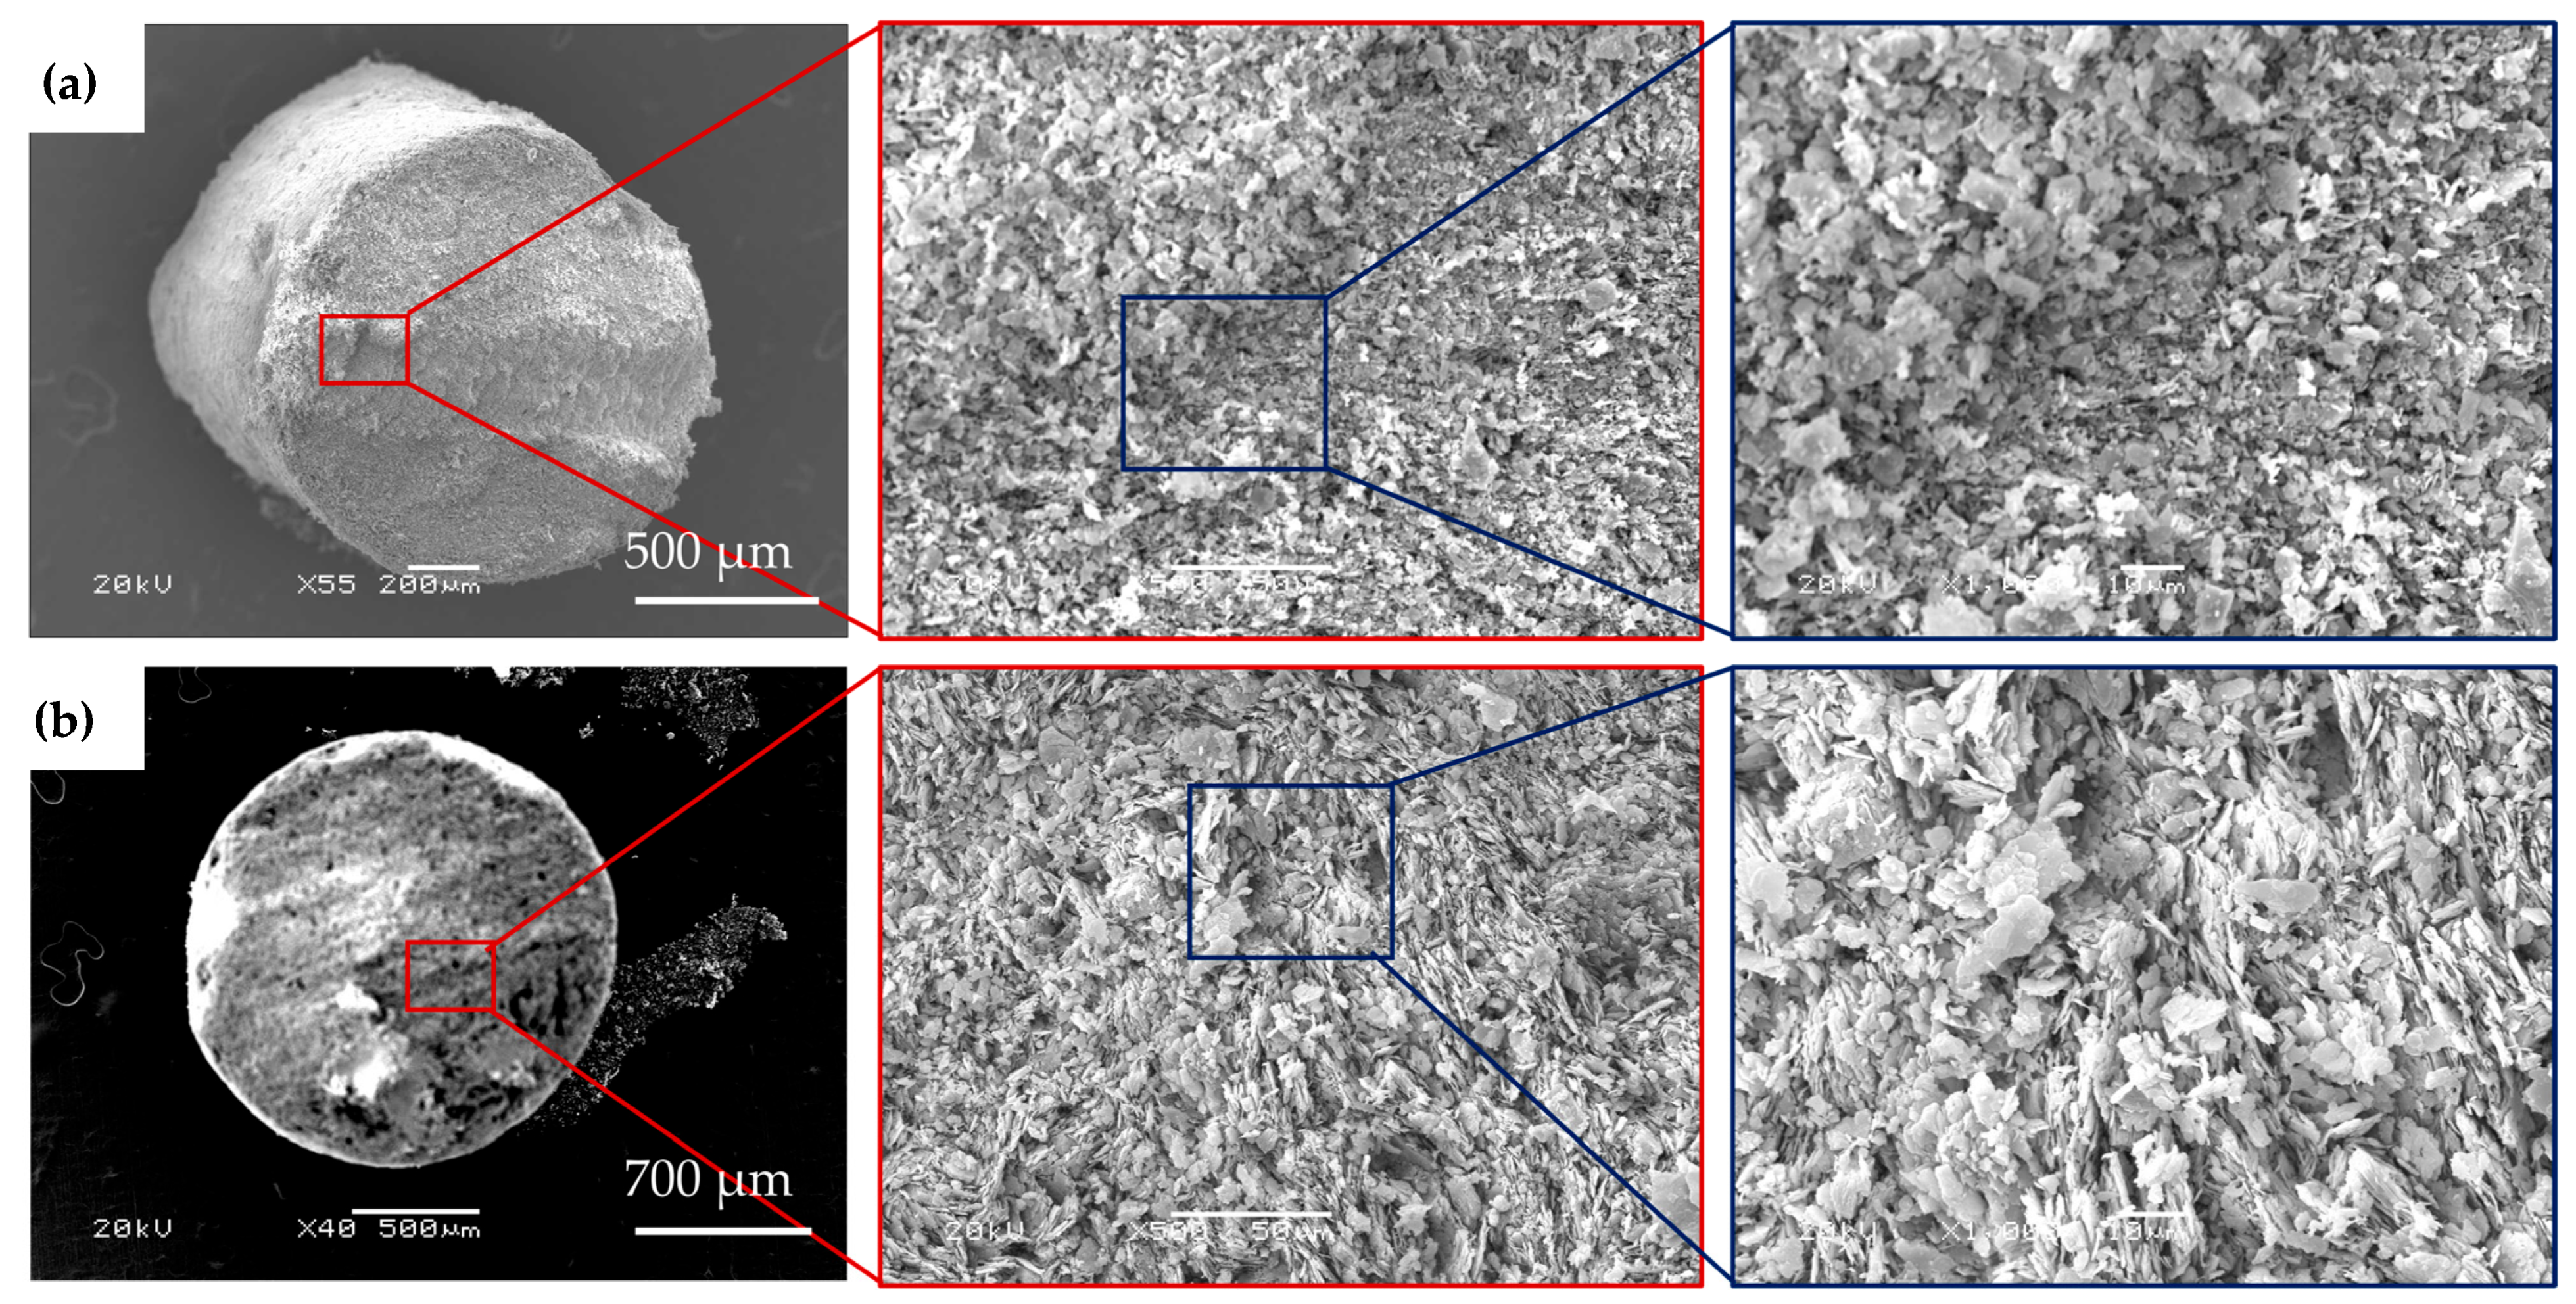
Scanning Electron Microscopy (SEM) is a vital technique for analyzing the surface morphology and microstructural characteristics of materials. In this study, kaolinite clay samples containing 35% and 40% water were extruded using a syringe, then dried and sintered. The samples were subsequently mounted vertically on an SEM holder and secured with carbon tape to ensure stability during imaging. SEM images were taken to observe how the surface morphology and amount of porosity can be changed as the water content increases in the sample. Also, if there are any micro-cracks in the samples, they will be visible in SEM pictures. The analysis was conducted with a JEOL Scanning Electron Microscope (JSM-6360) series at 20 kV.

3.7. Compression Test

Compression tests, as a mechanical testing method, can help identify samples with a higher ability to withstand loads without failure. The machine used for this testing was an Instron 5969 Material Testing machine (INSTRON, Ottawa, ON, Canada) with 50 KN capacity. Sample dimensions and shapes were chosen based on ASTM C1424-15, a standard for compression strength for ceramics. The loading was applied under displacement control, following the standard’s recommended rate of 0.5 mm/min. To investigate the effect of water content on the strength of ceramic samples, three cylindrical samples for each water content from 36% to 40% were 3D printed. Samples were exposed to compression tests until failure occurred.

3.8. Water Filtration

Some water parameters were tested for both contaminated water and filtered water to determine the performance of the filters. These water tests include a turbidity test, color test, pH test, conductivity test, ClO2 test, manganese test, iron test, silica test, total hardness test, calcium hardness test, M-alkalinity test, and microbial tests. pH, conductivity, and turbidity meters from the NALCO water company were used. A DR1900 spectrophotometer was also used for other iron and silica tests. Titration was used for hardness and alkalinity tests.

3.8.1. Turbidity Test

Turbidity is quantified in Nephelometric Turbidity Units (NTUs) using a turbidity meter that measures the scattering of light through a liquid sample. In this study, turbidity measurements were performed using a Hach 2100Q turbidity meter. A 5 mL sample was collected in a clean vial, inserted into the device, and the displayed NTU value was recorded.

3.8.2. Watercolor Test

For this test, two cuvettes were acid-washed and rinsed with distilled water, followed by a rinse with the sample water to ensure accuracy. One cuvette was then filled with 10 mL of distilled water to serve as the blank, while the other was filled with 10 mL of the sample water. The blank was first inserted into the DR1900 spectrophotometer (manufactured by NALCO), and the ‘zero’ function was initiated. Subsequently, the sample cuvette was placed in the device, and the absorbance value was recorded. A wavelength of 455 nm (blue region) was used for the analysis, as many organic compounds exhibit significant absorbance in this range.

3.8.3. pH Test

The pH of the samples was measured using an Oakton pH450 pH meter. Prior to measurement, the pH probe was calibrated using standard buffer solutions of pH 4, 7, and 10. The probe was then rinsed with distilled water, followed by a rinse with the sample water. It was subsequently immersed in a beaker containing the water sample. After allowing approximately one minute for the readings to stabilize, the pH value was recorded.

3.8.4. Conductivity Test

An Oakton conductivity meter was used to measure the conductivity of the water samples. The conductivity probe was first rinsed with distilled water, followed by a rinse with the sample water. It was then immersed in a beaker containing the sample. After allowing approximately one minute for the readings to stabilize, the conductivity was recorded in mS/cm.

3.8.5. Mineral Concentration Test

Six 10 mL containers were prepared with water samples. Three of these were designated as blank samples and used to zero the spectrophotometer. To determine iron concentration, Ferro reagent powder was added to one of the remaining containers and thoroughly mixed. After a 3 min reaction period, the sample was analyzed, and the iron concentration was recorded.
For silica measurement, HR molybdate and HR acid reagents were added to a second container and mixed thoroughly. After a 10 min reaction period, citric acid reagent was added, and the solution was swirled to ensure proper mixing. Following an additional 2 min wait, the sample was placed in the spectrophotometer, and the silica concentration was recorded.
To measure manganese concentration, MN-1P reagent powder was added to the final container and mixed, followed by the addition of MN-2P reagent. After a 2 min reaction period, the device was first zeroed using a blank sample. The prepared manganese sample was then inserted into the device, and the manganese concentration was recorded.

3.8.6. Total Hardness and Calcium Hardness Test

Titration is a standard method used to determine the total hardness in water samples. For this test, 10 mL of the sample was placed in a casserole dish. To measure total hardness, appropriate indicators, 2 mL of H1 and 1 mg of H3, were added while the solution was stirred on a magnetic stirrer until it turned pink. The sample was then titrated dropwise with H1 until the color shifted to blue. The volume of H1 used (in mL) was multiplied by 100 to calculate total hardness in parts per million (ppm).
On the other hand, to determine calcium hardness, another 10 mL water sample was prepared similarly. Indicators, 2 mL of H6, and 1 mg of H7, were added while stirring until the solution turned pink. It was then titrated with H1 until the color changed to purple. The volume of titrant used was again multiplied by 100 and reported in ppm.
Hardness classification is as follows: 0–50 ppm indicates soft water, 50–150 ppm is slightly hard, 150–300 ppm is hard, and values above 300 ppm represent very hard water.

3.8.7. M-Alkalinity Test

Calcium hardness can be measured using a titration method. In this procedure, 10 mL of the water sample is placed in a casserole dish. While stirring the sample with a magnetic stirrer, 5 drops of M indicator were added until the solution turned blue. The solution is then titrated drop by drop with sulfuric acid until the color changes to orange. The volume of sulfuric acid used (in mL) is multiplied by 100 to determine the total calcium hardness, reported in parts per million (ppm).

3.8.8. Microbiological Filtration

Two types of microbiological Petrifilms can be used to detect aerobic microorganisms, as well as a separate group, including yeast, mold, and fungi. In this study, the primary water source showed no presence of yeast, mold, or fungi, making it impractical to evaluate the filters’ effectiveness for removing these organisms. To conduct the aerobic test, 1 mL of the water sample was drawn using a disposable pipette and deposited at the center of a Petrifilm. A spreader was then used to evenly distribute the sample in a circular pattern. The Petrifilm was incubated at 30 °C for 48 h. After incubation, red colonies that appeared were counted using the standard colony counter method and reported as colony-forming units per milliliter (cfu/mL) to indicate the level of aerobic microbial presence.

4. Results

4.1. Kaolinite Powder Size Distribution

Kaolinite powder was tested for size distribution, as shown in Figure 1. Based on the result, a total of 3957 particles were detected, and the maximum number of particles was detected in the 20–30 µm range, which is 27.42% of particles. After that, 30–40 µm and 10–20 µm had the greatest number of particles, with 20.14% and 17.72% of particles, respectively.

4.2. Printing Substrate

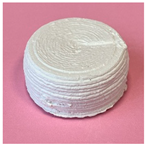
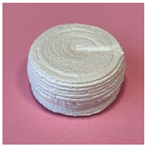
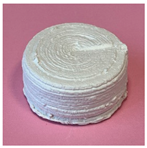
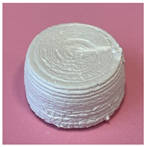
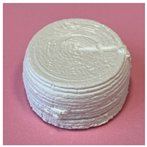
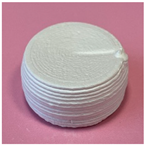
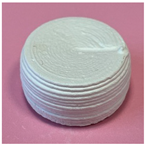
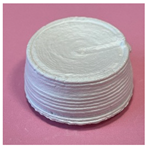
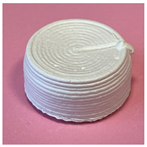
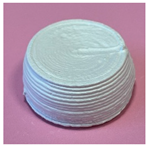
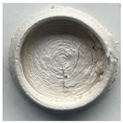
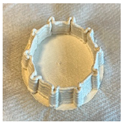
To check the effect of the substrate on sample attachment and final resolution, four different materials were used as the printing substrate. Fiberglass, aluminum foil, cardstock paper, and tissue paper, as shown in Table 3. Among these, the tissue paper substrate showed the best result in absorbing excess water while drying the samples slowly and uniformly. Other substrates caused cracks and detachment in the sample.
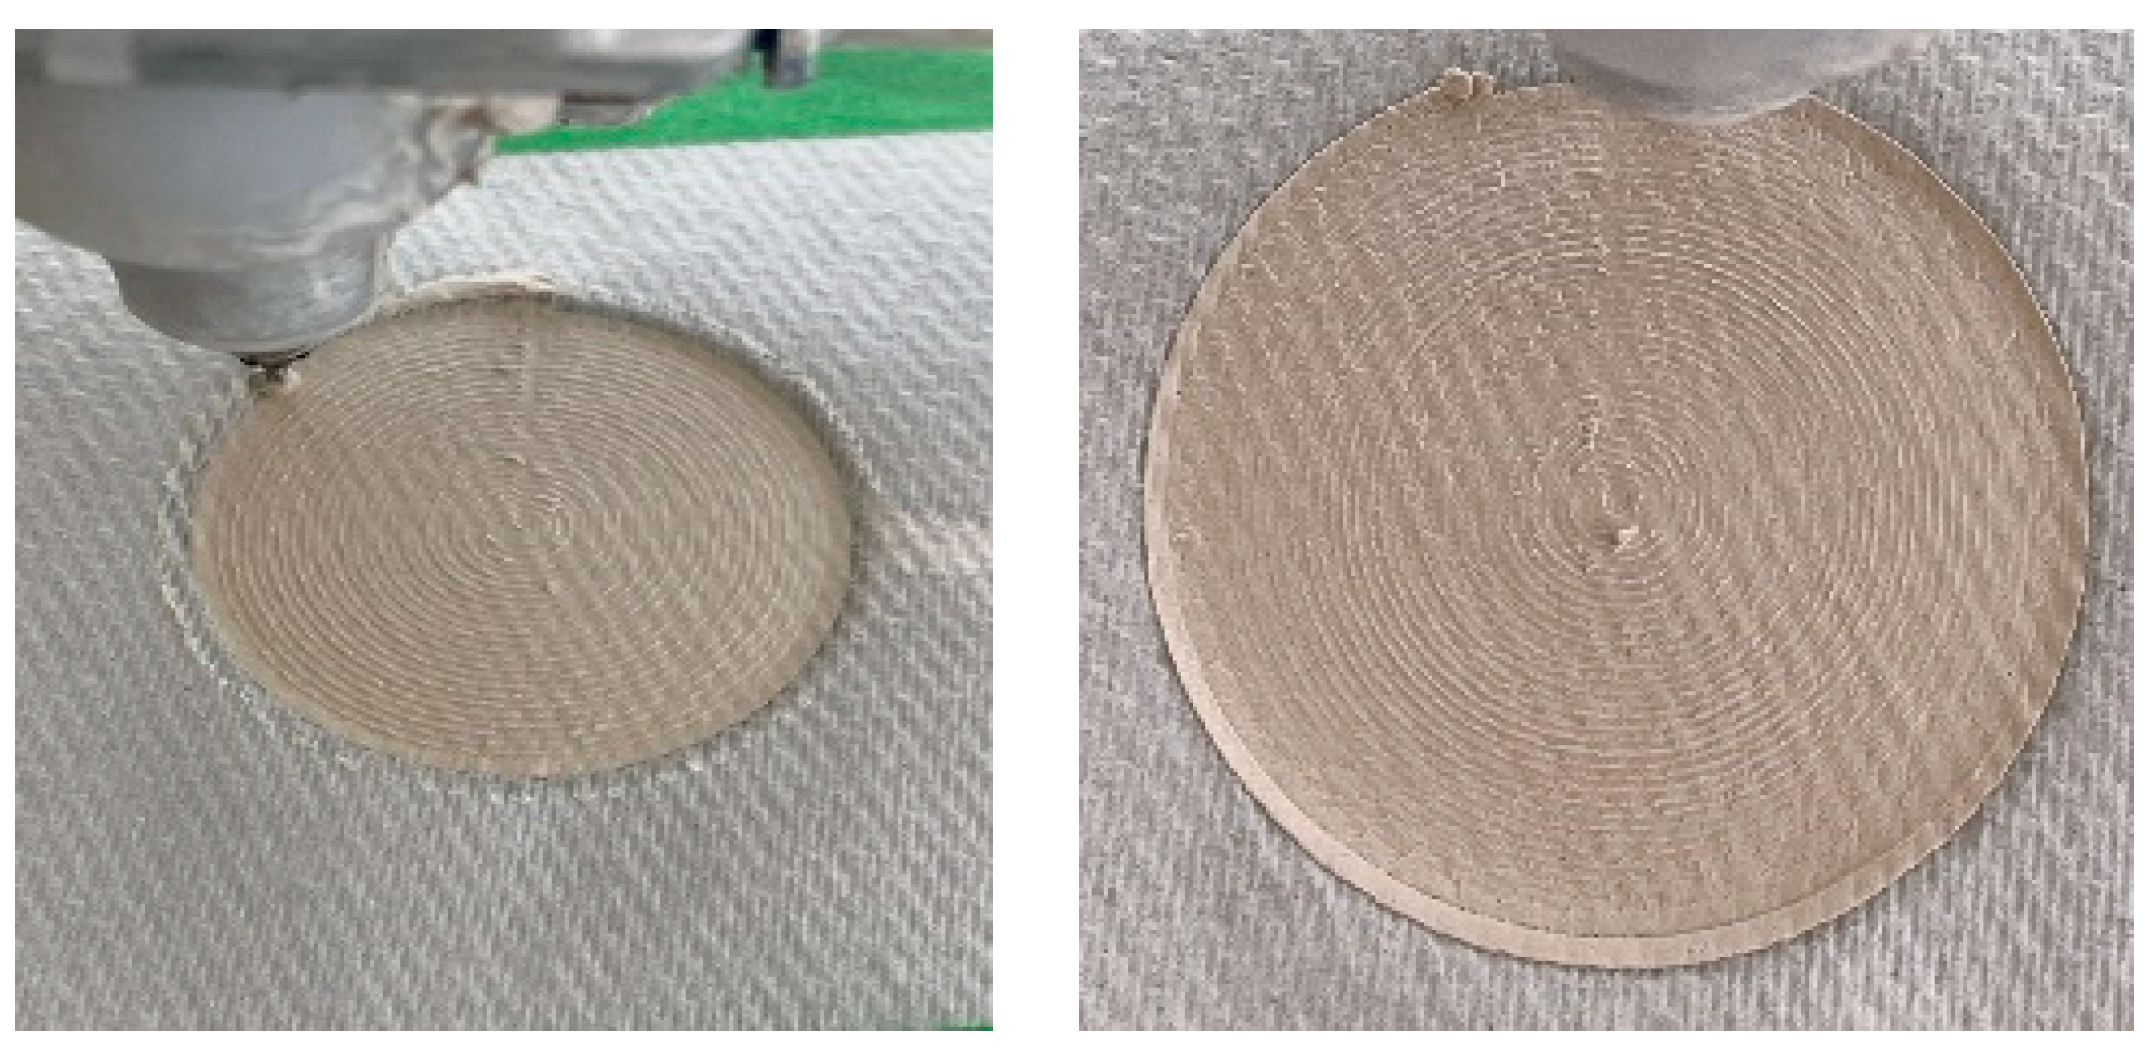
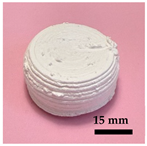
For water filtration, the base thickness of the filter surface was reduced, allowing the water to pass. As appears in Figure 2, a thin, smooth, and uniform base was printed based on the previously mentioned optimized parameters.

4.3. Dimension Stability After Sintering

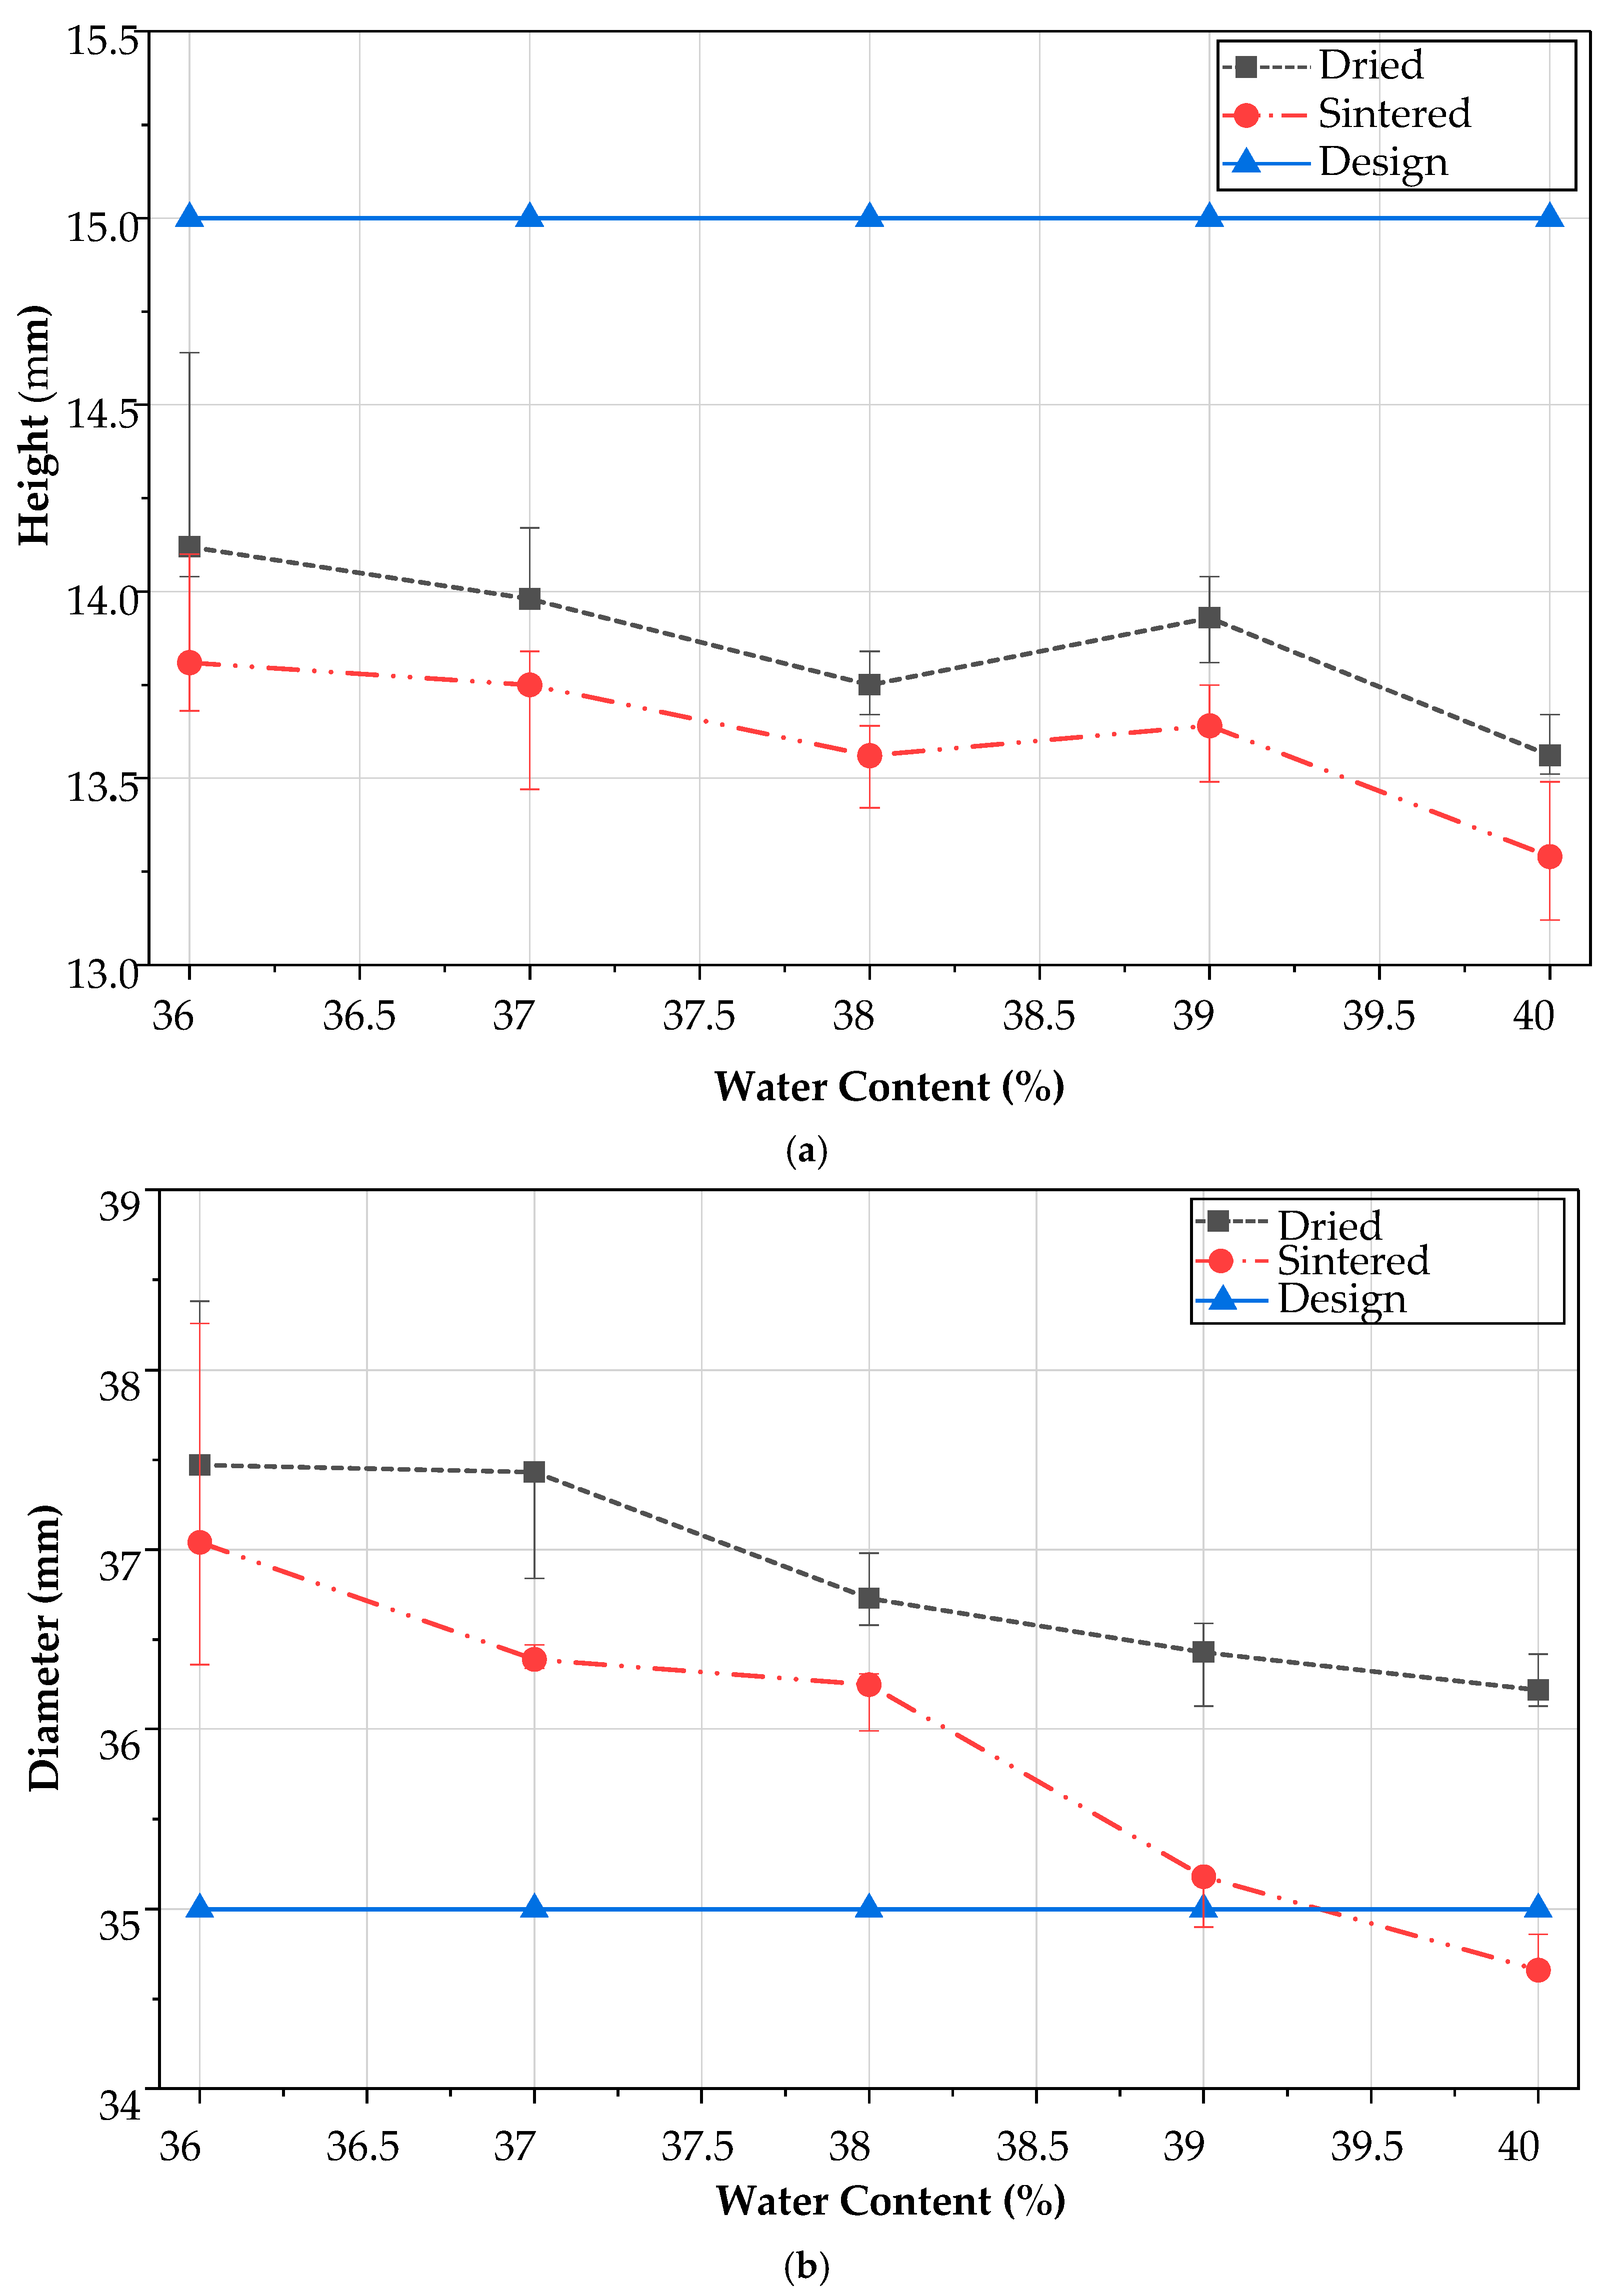
Samples were measured in diameter and height once after drying and once after sintering. The measured dimensions were then compared with the original designed dimensions, as can be seen in Table 4.
The results of the above table are summarized in the plots in Figure 3. Figure 3a shows the height of the sample with respect to the water content. Each point on the plots is the average of 3 data points from 3 samples, with standard deviation bars showing the variation limits. The three dashed lines represent the design height after drying, and height after sintering. The results show that the lower the water content in the sample, the more it can maintain its shape and have similar dimensions to those of the initial design. Samples’ shrinkage was 8% after drying and 2% after sintering. This can help future designers to consider a total 10% shrinkage for the final sample.
Figure 3b shows the same trends for the diameter of the samples. After drying, the water in kaolinite tends to settle down, which causes the height to be less than designed and the diameter to be larger than designed.

4.4. X-Ray Diffraction (XRD)

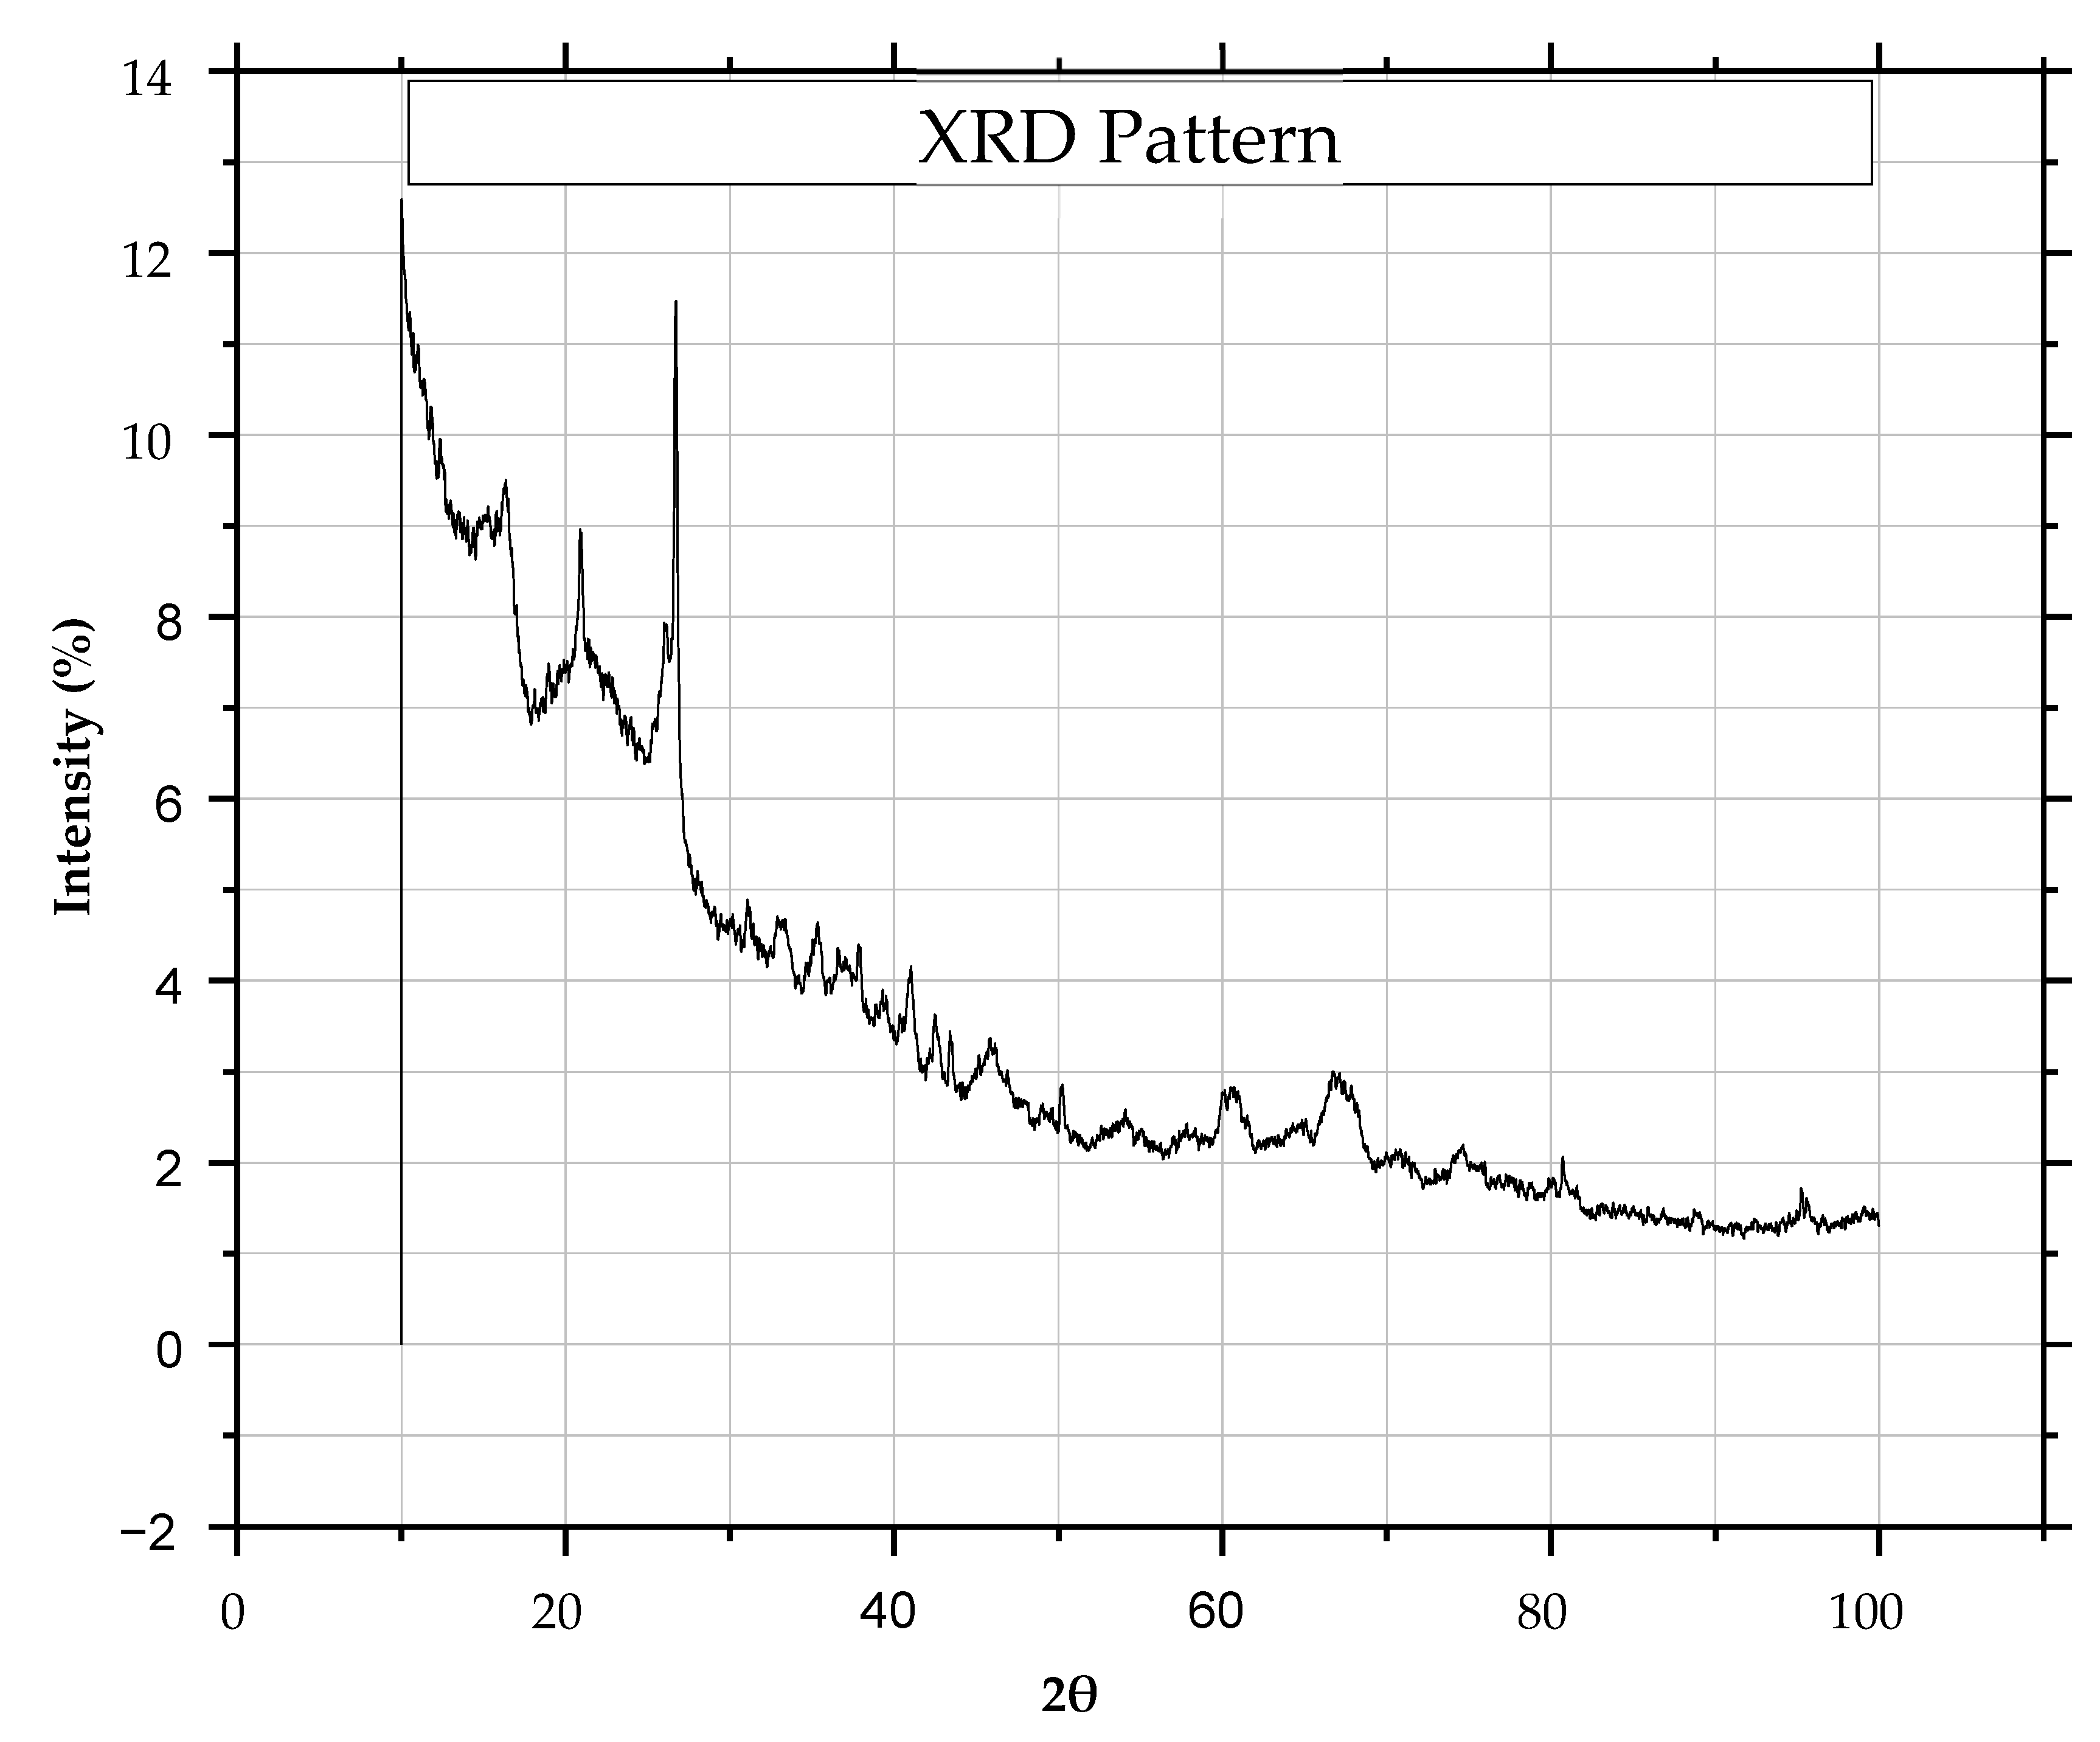
The sintered kaolinite powder X-ray diffraction results are shown in Figure 4. The pattern was compared to kaolinite peaks from the literature [21].
The XRD results in Figure 4 confirm that the material tested has kaolinite clay as the most dominant phase. When comparing the reported data in the literature and the results in this paper, similar patterns are observed. A sharp, prominent peak appears at approximately 12°, defining the (001) basal plane of kaolinite, which also appears around the same angle in the reference literature. The peak characteristics, such as intensity and sharpness, reveal a high degree of crystallization given that the kaolinite is structurally ordered within the sample.
Other trends in the plot show peaks between 20° and 26°, which correspond to kaolinite reflections such as (020), (110), and (111) prism peaks. It can also be said that quartz (silicon oxide) exists in the sample, as it is a natural impurity present in clay deposits and is defined by peaks around 25°, which can be seen in the plots. The supplementing reduced intensity peaks observed between 30° and 70° are mainly due to reasons such as disordered phases, trace amounts of impurities, or partial amorphization due to mechanical processing or natural weathering.
There is a loss in intensity with increasing angle, which suggests the presence of crystalline and amorphous phases in coexistence. Small particle size, the existence of stacking disorder, or thermal/mechanical treatment are some reasons for that. The patterns shown are considered consistent with the natural kaolinite clay behaviors that appear in the literature. These findings are essential in determining whether the material is suitable for applications such as ceramics, composite polymers, or adsorbents, where purity and crystallization of the minerals determine the performance.

4.5. Scanning Electron Microscopy (SEM)

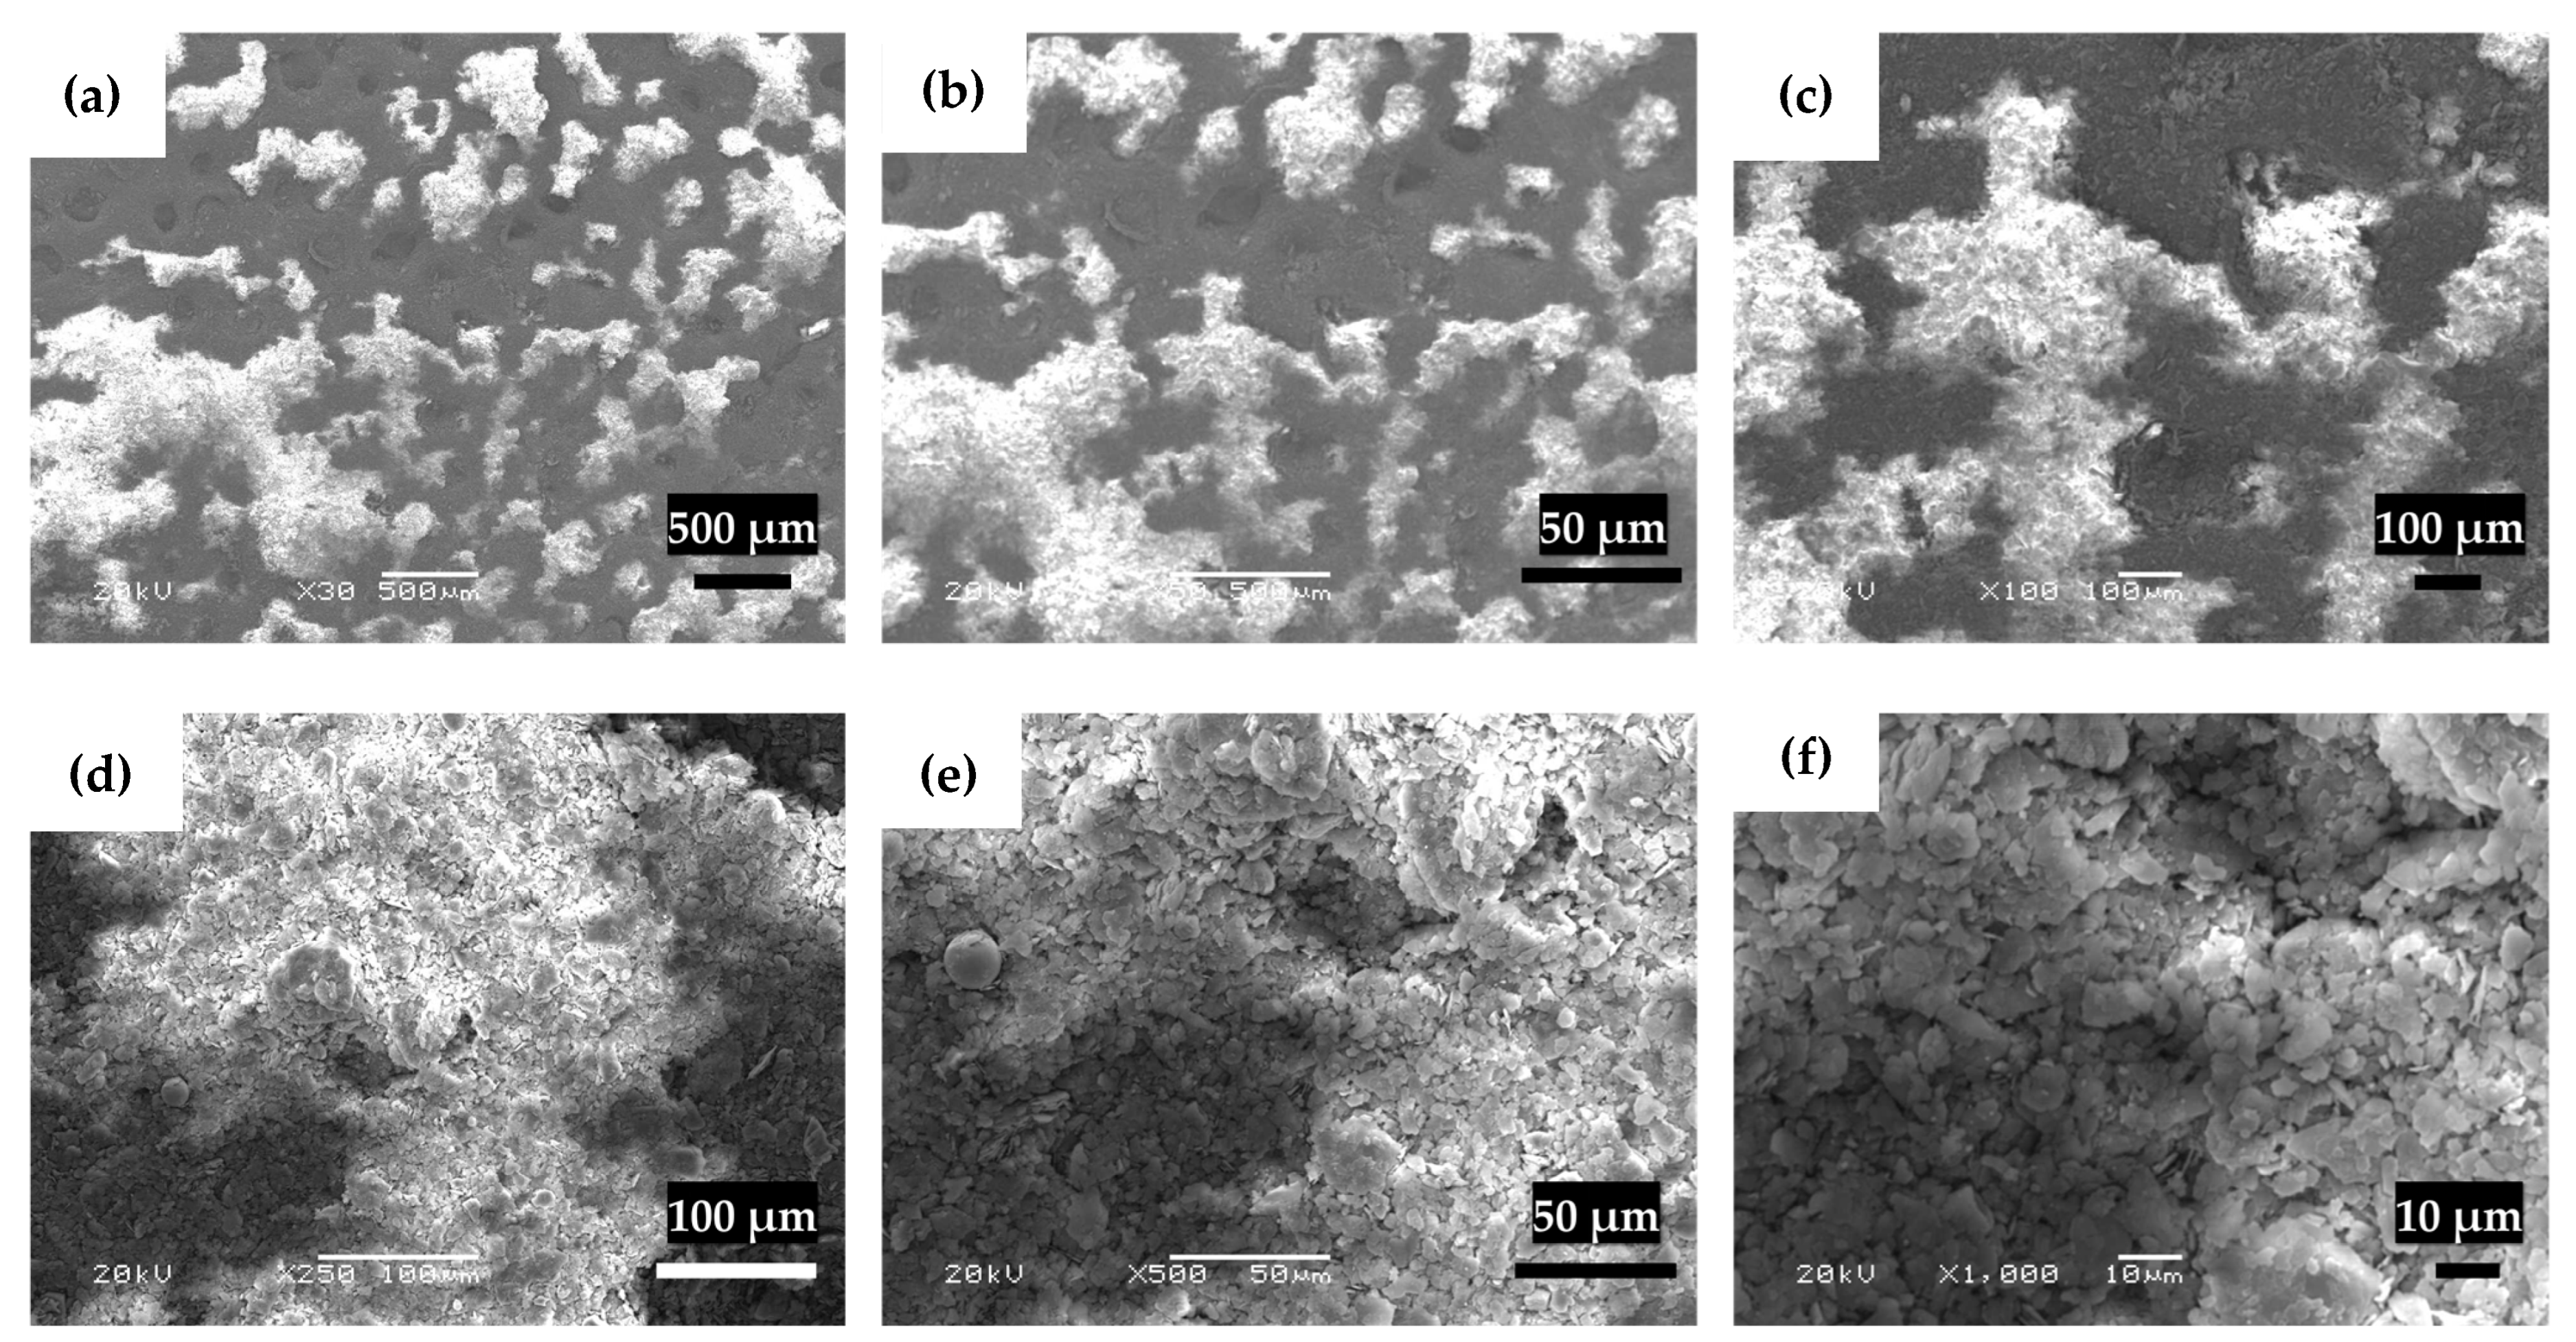
Figure 5 shows kaolinite powder under an SEM microscope. They tend to stick to each other and form bigger particles. This being the case, estimating the powder size is not feasible. It is assumed that the particles absorb the moisture in the air and do not stay dry and separated.
A syringe was used to extrude two samples with 36 and 40 wt% kaolinite. The cross-section of the samples was then examined by SEM to search for any possible micro-cracks, and the morphology and porosity of the ceramics were compared as the water content increased (Figure 6). No cracks were observed, and the size of the voids was almost 5 microns. It was also found that the 40 wt% sample had higher porosity than the 36% wt% sample, which is due to the higher water content. When samples are placed in the furnace, water evaporates and leaves some voids behind, which makes the final ceramic volume porous. The higher the water content in the sample, the greater the porosity detected in the final ceramic.

4.6. Compression Test

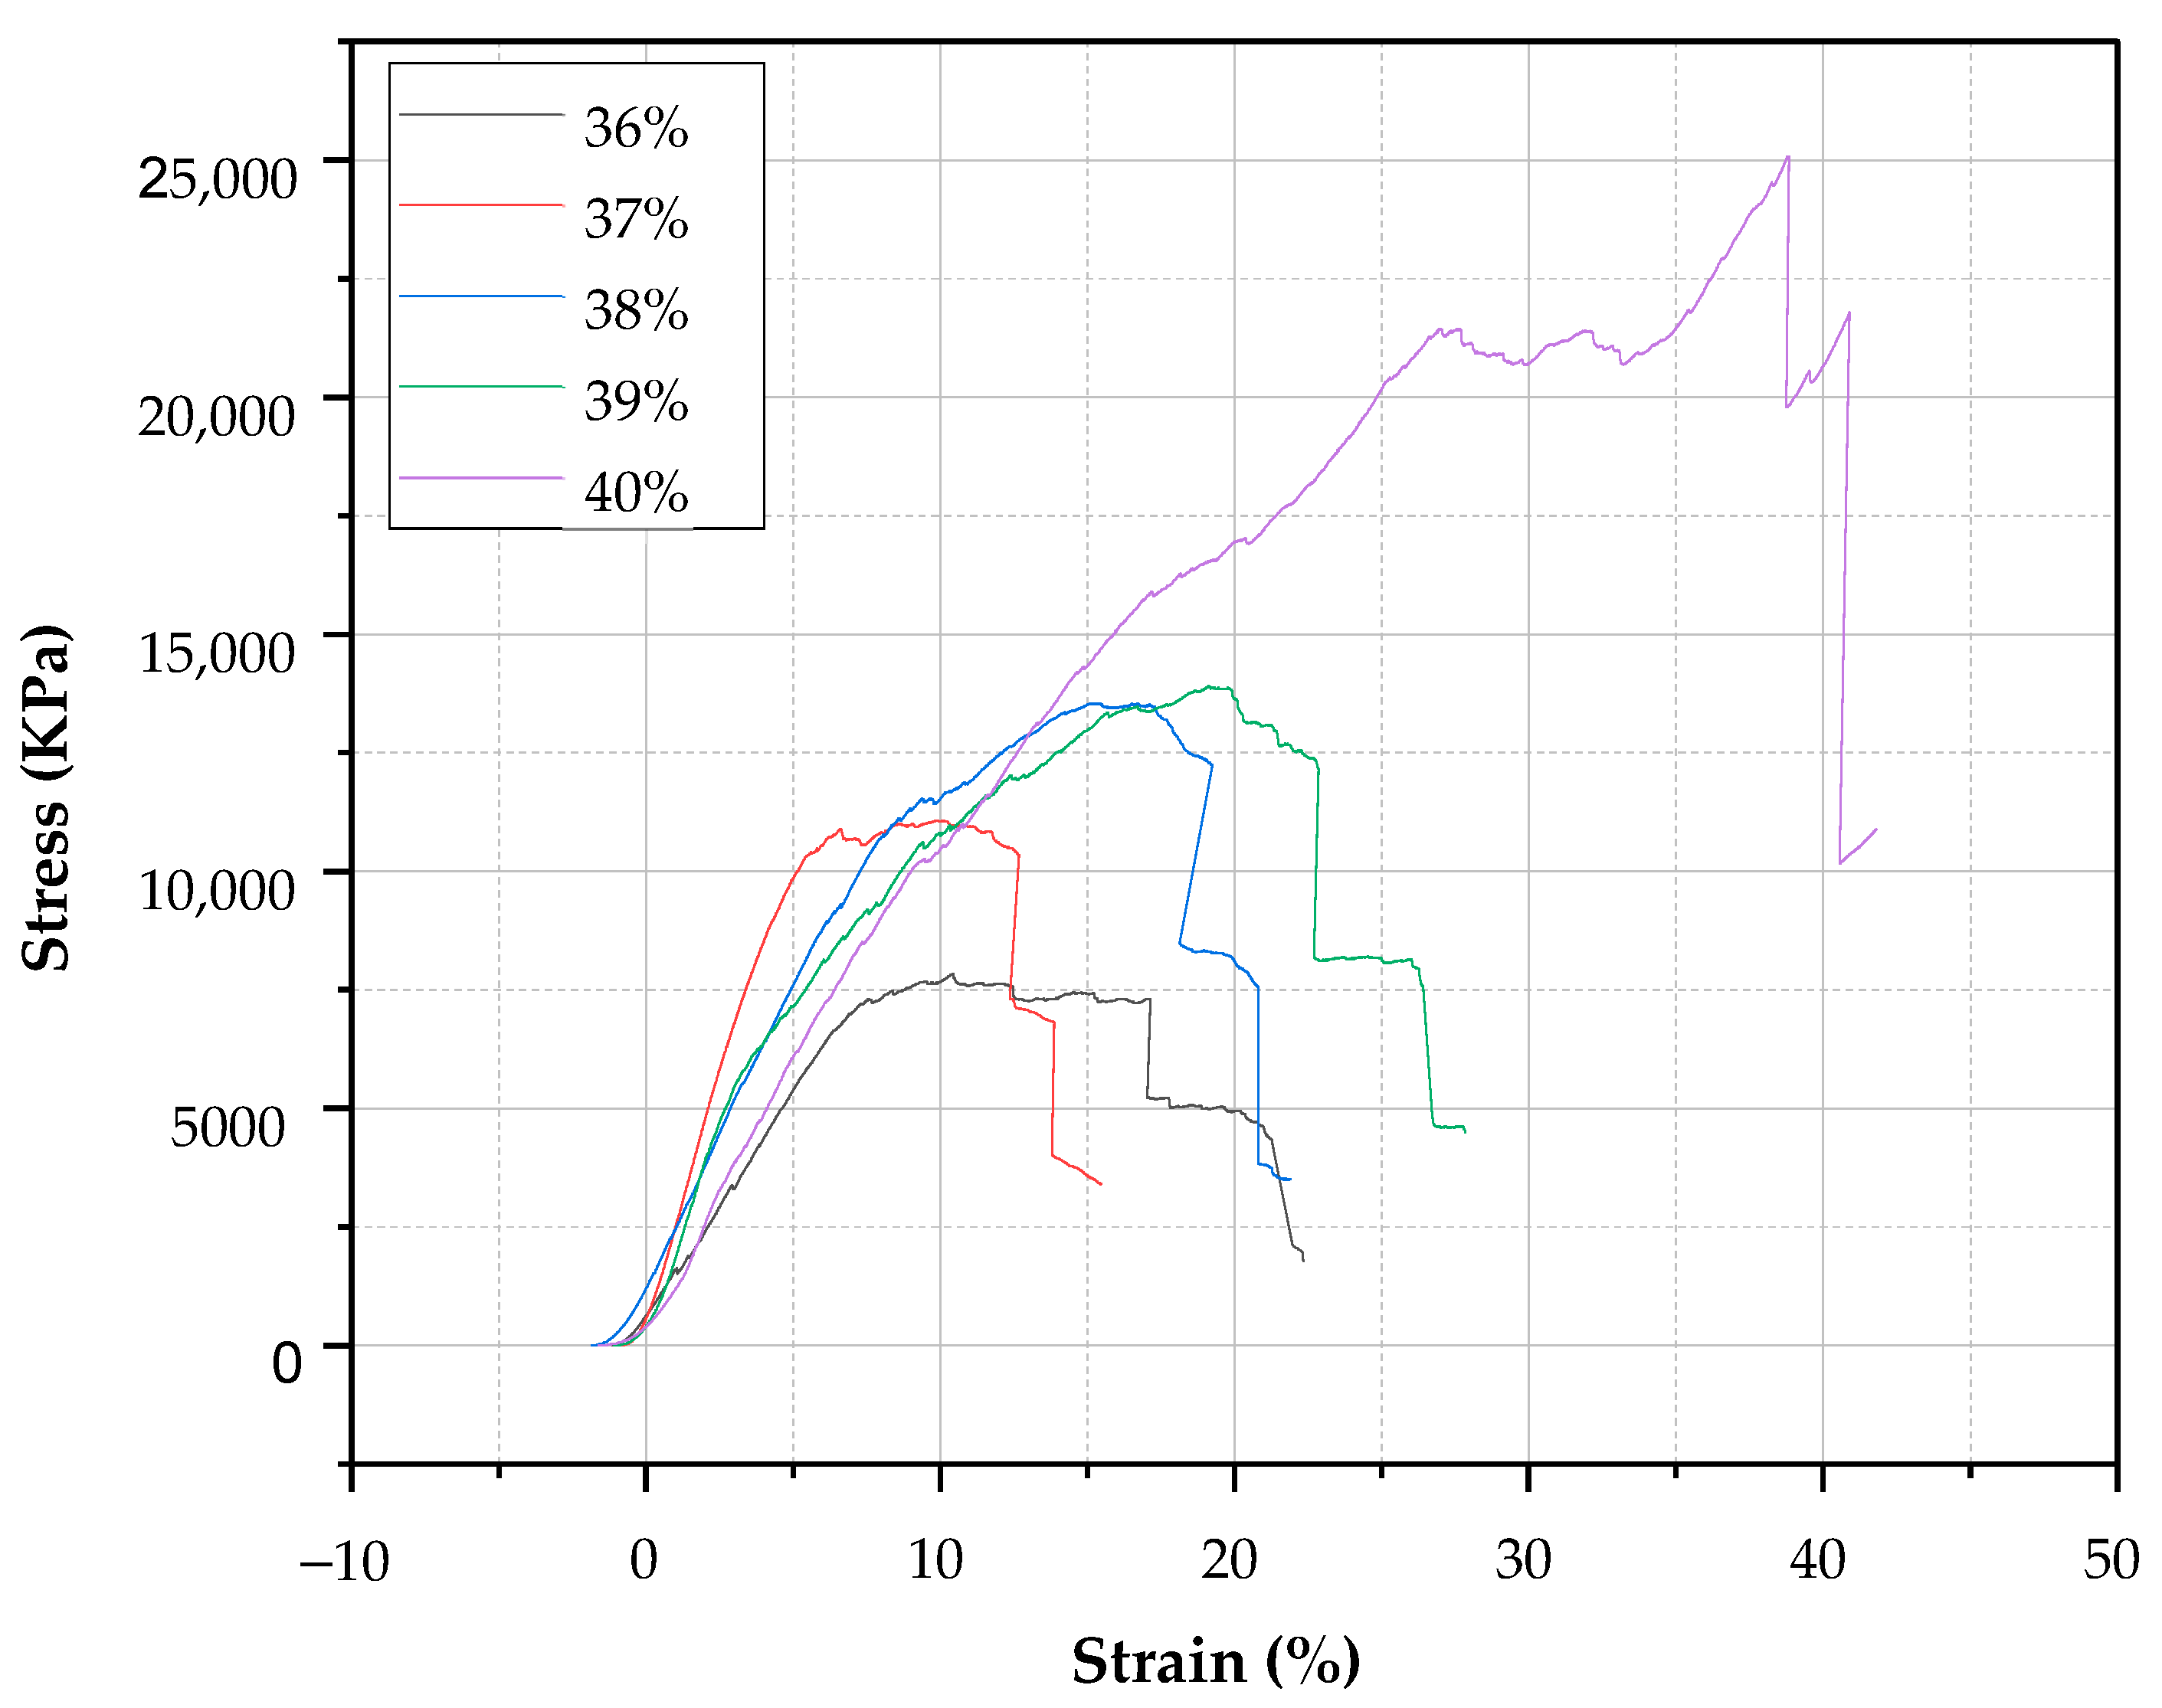
Samples were tested using the Instron 5969 Material Testing machine (INSTRON, Ottawa, Canada). Results are shown in Table 5. The average stress–strain curve results for each water content sample are shown in Figure 7. The area under the curve shows the toughness of the sample. Based on these results, it is found that samples with 36 wt% showed the least toughness, and samples with 40 wt% showed the highest toughness among samples. The slope of the curve shows Young’s modulus, which increases with the increase in water content. Based on that, the 40 wt% samples, theoretically, are the strongest samples; however, during the test, the samples were smashed as the force was applied, and there was no resistance or breaking point. That can be due to the higher water content they have, which leaves more porosity while sintering as the water evaporates; on the other hand, 36% was more rigid, fragile, and not resilient.

4.7. Filtration Results

Filters with 36, 37, and 40 wt% of water were tested based on various parameters, and the results are shown in Table 6, as well as Figure 8.

4.7.1. Turbidity Test

Turbidity is a measure of water cloudiness due to suspended particles; the turbidity of drinking water should be less than 5 NTU. The results in this research decreased from 27.4 NTU for contaminated water to 4.1 NTU, 3.8 NTU, and 2.9 NTU for 36, 37, and 40% filters, respectively. This shows that kaolinite with a higher water percentage is able to decrease turbidity more effectively.

4.7.2. Watercolor Test

The water color test gives an indication of impurities present in the water sample. The results of filtration showed that the contaminated water color intensity was also decreased from a wavelength of 490 nm before filtration to 153 nm, 180 nm, and 201 nm for the 36, 37, and 40% filters, respectively. This suggests that kaolinite with lower water percentages is able to decrease color intensity more effectively, which in turn decreases impurities.

4.7.3. pH Test

The pH test gives an indication of the alkalinity or acidity of water on a scale from 0 to 14, which is also an indication of water quality and safety to drink. The results showed that the pH of contaminated water was 6.23 before filtration, which is slightly acidic. However, it was found that the pH was increased to neutral after filtration; the new pH values are 7.26, 7.16, and 7.18 for 36%, 37%, and 40% filters, respectively.

4.7.4. Conductivity Test

The conductivity of drinking water should be in the range of 0.05 mS/cm to 0.5 mS/cm. The conductivity of refinery water was 7.43 mS/cm, which is high due to the high ion concentration. Conductivity was decreased to 4.5 mS/cm, 6.8 mS/cm, and 6.52 mS/cm for 36%, 37%, and 40% filters, respectively. Kaolinite with a lower water percentage is able to decrease conductivity more effectively.

4.7.5. Mineral Concentration Test

The iron content in contaminated water was found to be 0.78 ppm and decreased after filtration to 0.48 ppm, 0.24 ppm, and 0.28 ppm for 36%, 37%, and 40% filters, respectively. A 1.2 ppm manganese concentration in contaminated water was decreased after filtration to 0.6 ppm, 0.7 ppm, and 0.4 ppm for 36%, 37%, and 40% filters, respectively.
The results were different for the silica content in the tested water, as the filter itself contains a great amount of silica, which may allow the silica in water to pass through the filter along with the filtered water. The amount of silica in refinery water was 43 ppm and increased after filtration to 61 ppm, 74.8 ppm, and 82.4 ppm for 36, 37, and 40% filters, respectively, showing an increasing trend with increasing water content in the kaolinite.
The prevention of silicon leaching from kaolinite-based water filters is essential for ensuring water safety and long-term operation of the filter. While few studies directly related to silicon leaching in kaolinite filters, increased knowledge of kaolinite surface chemistry, ceramic processing, and water interactions is beneficial.
Optimizing sintering is one of the more successful strategies in preventing silicon leaching, as higher firing temperatures strengthen the structure of the ceramic and reduce solubility in silicon-containing compounds. In addition, surface treatments with polymeric or mineral-based coatings can also act as protective barriers, precluding silicon–oxygen bonds from exposure to water. The pH of the water also plays a critical role, with the leaching of silicon increasing in more alkaline conditions; thus, a neutral to weakly acidic pH during use acts to reduce this effect.
Furthermore, the inclusion of additives or formation of mineral composites, for example, blending kaolinite and quartz, can reduce porosity and alter the filter microstructure to minimize leach pathways. Another aspect is post-sintering water treatment using distilled water to strip away any loosely attached silicon remaining on the filter surface prior to filtration testing. The operation further consolidates the filter and reduces initial silicon release during operation.

4.7.6. Total Hardness and Calcium Hardness Test

Total hardness in contaminated water was 304 mg/L of CaCO3 and decreased after filtration to 116 mg/L, 138 mg/L, and 144 mg/L of CaCO3 for 36, 37, and 40% filters. Calcium hardness in refinery water was 140 mg/L of CaCO3 and reduced to 42 mg/L, 38 mg/L, and 35 mg/L of CaCO3 for 36, 37, and 40% filters, respectively.

4.7.7. M-Alkalinity Test

M-Alkalinity is preferred to be low in boiler applications so that the water is resistant to pH changes. However, drinking water has higher M-alkalinity and is more sensitive to pH change. M-alkalinity in refinery water was 2 mg/L of CaCO3 and decreased to 11, 10.5, and 12 mg/L of CaCO3 for 36%, 37%, and 40% filters.

4.7.8. Microbiological Filtration

Microbiological filtration of the ceramic filters, which is another aspect of water filtration, was examined, and Figure 9a–d shows microbio petrifilms on which the aerobic microbio appear as red dots after leaving 1 mL of water for 48 h of incubation at 30 °C. Contaminated water was diluted 10 times, so the numbers of red dots were multiplied by 10. The results of contaminated water microbio showed 337 red dots, meaning 3370. Three filtered samples using 37% of water were used. One of the samples, 37%–1, did not show any decrease in the number of microbes. However, the second sample, 37%–2, showed only 30 red dots. On the other hand, there were no red dots on the 37%–3 sample. This shows the potential of these filters in filtering microbes if produced and used properly. The variation in microbial filtration performance is likely due to internal voids or micro-defects within the printed filters. These voids, while not visible externally, can create unintended flow paths that allow wastewater to bypass the filtration matrix, as seen in sample 37%–1. Such inconsistencies may result from minor printing defects like uneven extrusion or weak layer bonding.
The filters also have the potential to be developed into various shapes and sizes based on the final need, as appears in Figure 9e.

4.7.9. Comparison with Traditional Filters

Traditional ceramic filters of kaolinite clay have shown excellent performance in suspended particles and pathogen removal. Ceramic pot filters produced in Cameroon achieved 99.9% turbidity removal, decreasing turbidity from 100 NTU to less than 0.1 NTU, and eliminating total coliform bacteria. In addition, under optimized conditions, the filters had a high heavy metal removal capacity of up to 96% for chromium and 91% for cadmium [22,23,24]. In contrast, 3D printed kaolinite ceramic filters achieve greater design precision and structural consistency, allowing for the realization of more complex and custom pore geometries. While incipient 3D-printed filters have shown promising bacterial filtration, performance variation was noted due to internal voids or printing defects. However, with greater refinement, 3D printing can achieve custom porosity and directional flow paths, with the potential to equal or surpass traditional filters in targeted filtration applications.
Traditionally made filters are quite cheap at around USD 3.30 per unit when based on a production batch of 50 units. The reason for this cheapness is that they use locally sourced materials and simple fabrication procedures, which make them appropriate for low-resource communities [22]. In comparison, presently, 3D-printed ceramic filters are more expensive to produce due to specialized equipment, computer preparation of the design, and post-processing steps such as firing and glazing. In the future, when technology is more accessible and scalable, the cost will decrease. Mass production with accuracy and minimal material loss makes it worth the initial cost.
Traditional kaolinite filters have good stability, mechanical strength of about 6.8 MPa, and excellent resistance to alkaline and acidic conditions. The filters can be washed thoroughly and recycled multiple times without reducing their performance [22,23]. The 3D-printed ceramic filters also have the potential to outdo traditional filters with regard to uniformity of structure and layer bonding, while their dependability is strongly dependent on printing parameters and sintering. Unlike hand-molded filters, the customized structure in 3D printing allows for the possibility of internal support and reinforcement, which could enhance mechanical stability if properly designed. While hand-made kaolinite filters are low-cost, efficient, and reliable, 3D-printed ceramic filters allow design flexibility, replicability, and potential for enhanced performance through optimized structures. Conventional methods are presently more easily accessible in low-resource settings, but future filtration systems where precision, scalability, and innovation matter promise to be enhanced by 3D printing.

5. Conclusions

This work demonstrates the performance and viability of 3D-printed kaolinite-based ceramic water filters in gravity filtration. By optimizing material composition, print parameters, and filter design, functional and recyclable ceramic filters were synthesized and evaluated for physical, mechanical, and water purification properties. Among all test substrates to print 3D, the tissue paper substrate was found to be the optimal substrate for uniform drying without delamination or cracking. The 37 wt% water content kaolinite mixture gave the best printability, mechanical strength, and dimensional stability with a combined linear shrinkage of around 8% when drying and 2% when sintering, which are important considerations for potential design compensation.
XRD confirmed the crystalline nature of kaolinite by clear peaks of quartz and alumina, determining material purity and structure integrity. SEM images also guaranteed that printed and sintered structures were free of any detectable micro-cracks, with pore dimensions around 5 µm. Higher water contents showed greater porosity caused by evaporation during sintering, which was directly proportional to reduced mechanical performance. Compression tests revealed that 40 wt% water samples were the toughest in stress–strain properties but lacked structural hardness and buckled under load because of high porosity. The 36 wt% samples offered less strength and were also brittle and breakable. The best consistency of performance was encountered using a 37 wt% composition, as well as structural hardness.
Water filtration experiments confirmed the efficacy of these filters in improving water quality. The filters successfully reduced turbidity, color, iron, manganese, and total and calcium hardness. Of special interest, pH levels of contaminated water increased from acidic (6.23) to near-neutral values (as high as 7.26), and conductivity dropped from 7.43 mS to a low of 4.5 mS, indicating a significant reduction in dissolved ionic species. However, there was a rise in silica content post-filtration because of leaching from the filter material itself. The increased porosity and structural mobility associated with higher water content may contribute to the release of soluble silica species. To mitigate this effect, future work could explore several options, such as surface modification of the filter materials, enhancing the sintering process, pH control, and post-sintering treatment by distilled water, thereby limiting silica dissolution. This will be investigated in subsequent phases of the study. Therefore, 37 wt% water content is the optimum composition for the production of kaolinite ceramic filters with structural hardness and functional ability based on these results. These filters are reusable, affordable, and can be customized using 3D printing for direct application.
Future innovations could focus on maximizing the surface area of the filter by exploring new geometries and flow patterns to enhance throughput and filtration efficiency. Surface treatment or coating methods could be used to reduce silica leaching and further tailor filtration properties for target water pollutants.

Author Contributions

Conceptualization, R.D. and M.A.H.K.; methodology, R.D., R.E. and M.A.H.K.; validation, R.D.; formal analysis, R.E. and R.D.; investigation, R.E., R.D. and M.A.H.K.; resources, M.A.H.K.; data curation, R.E.; writing—original draft preparation, R.E. and R.D.; writing—review and editing, M.A.H.K.; visualization, R.E.; supervision, M.A.H.K.; project administration, M.A.H.K.; funding acquisition, M.A.H.K. All authors have read and agreed to the published version of the manuscript.

Funding

The work was funded by the Natural Sciences and Engineering Research Council of Canada (NSERC), Mitacs, and the Faculty of Graduate Studies and Research at the University of Regina (FGSR).

Data Availability Statement

All data underlying the results are available as part of the article, and no additional sources are required.

Conflicts of Interest

The authors declare no conflicts of interest.

References

  1. Motalebi, A.; Khondoker, M.A.H.; Kabir, G. A systematic review of life cycle assessments of 3D concrete printing. Sustain. Oper. Comput. 2024, 5, 41–50. [Google Scholar] [CrossRef]
  2. Chen, Z.; Li, Z.; Li, J.; Liu, C.; Lao, C.; Fu, Y.; Liu, C.; Li, Y.; Wang, P.; He, Y. 3D printing of ceramics: A review. J. Eur. Ceram. Soc. 2019, 39, 661–687. [Google Scholar] [CrossRef]
  3. Chen, Z.; Sun, X.; Shang, Y.; Xiong, K.; Xu, Z.; Guo, R.; Cai, S.; Zheng, C. Dense ceramics with complex shape fabricated by 3D printing: A review. J. Adv. Ceram. 2021, 10, 195–218. [Google Scholar] [CrossRef]
  4. Dong, Y.; Wu, H.; Yang, F.; Gray, S. Cost and efficiency perspectives of ceramic membranes for water treatment. Water Res. 2022, 220, 118629. [Google Scholar] [CrossRef] [PubMed]
  5. Rimašauskas, M.; Kuncius, T.; Rimašauskienė, R.; Simokaitis, T. Evaluation of Conditions for Self-Healing of Additively Manufactured Polymer Composites with Continuous Carbon Fiber Reinforcement. J. Manuf. Mater. Process. 2025, 9, 179. [Google Scholar] [CrossRef]
  6. Ihekweme, G.O.; Obianyo, I.I.; Orisekeh, K.I.; Kalu-Uka, G.M.; Nwuzor, I.C.; Onwualu, A.P. Plasticity characterization of certain Nigeria clay minerals for their application in ceramic water filters. Sci. Prog. 2021, 104, 00368504211012148. [Google Scholar] [CrossRef] [PubMed]
  7. Liu, H.; Chang, L.; Liu, W.; Xiong, Z.; Zhao, Y.; Zhang, J. Advances in mercury removal from coal-fired flue gas by mineral adsorbents. Chem. Eng. J. 2020, 379, 122263. [Google Scholar] [CrossRef]
  8. Sheikhi, M.; Arzani, M.; Mahdavi, H.R.; Mohammadi, T. Kaolinitic clay-based ceramic microfiltration membrane for oily wastewater treatment: Assessment of coagulant addition. Ceram. Int. 2019, 45, 17826–17836. [Google Scholar] [CrossRef]
  9. Pang, R.; Lai, M.K.; Teo, H.H.; Yap, T.C. Influence of Temperature on Interlayer Adhesion and Structural Integrity in Material Extrusion: A Comprehensive Review. J. Manuf. Mater. Process. 2025, 9, 196. [Google Scholar] [CrossRef]
  10. Revelo, C.F.; Colorado, H.A. 3D printing of kaolinite clay ceramics using the Direct Ink Writing (DIW) technique. Ceram. Int. 2018, 44, 5673–5682. [Google Scholar] [CrossRef]
  11. Kwiatkowski, M.; Przybyła, S.; Kwiatkowski, M.; Hebda, M. The Concept of Using 3D Printing Technology in Ceramic Foundry Filter Manufacturing. J. Mater. Eng. Perform. 2024, 33, 14426–14432. [Google Scholar] [CrossRef]
  12. del Bosque, A.; Fernández-Arias, P.; Vergara, D. Advances in the Additive Manufacturing of Superalloys. J. Manuf. Mater. Process. 2025, 9, 215. [Google Scholar] [CrossRef]
  13. Elsersawy, R.; Rahman, A.; Sakib-Uz-Zaman, C.; Khondoker, M.A.H. Multifunctional inks in aerosol jet printing: Performance, challenges, and applications. Front. Manuf. Technol. 2025, 5, 1558209. [Google Scholar] [CrossRef]
  14. Donyadari, R.; Ortiz, B.F.; Khondoker, M.A.H. Optimization of Printing Parameters for Extrusion 3D Printing of Ceramic Clay. In Proceedings of the 1st International Conference on Industrial, Manufacturing, and Process Engineering (ICIMP-2024), Regina, SK, Canada, 27–29 June 2024; p. 47. [Google Scholar] [CrossRef]
  15. Habib, M.A.; Elsersawy, R.; Khondoker, M.A.H. Pellet-Based Extrusion Additive Manufacturing of Lightweight Parts Using Inflatable Hollow Extrudates. J. Manuf. Mater. Process. 2025, 9, 37. [Google Scholar] [CrossRef]
  16. Guo, J.; Zeng, Y.; Li, P.; Chen, J. Fine lattice structural titanium dioxide ceramic produced by DLP 3D printing. Ceram. Int. 2019, 45, 23007–23012. [Google Scholar] [CrossRef]
  17. Frontmatter. In Ceramic Materials; Wiley: Hoboken, NJ, USA, 2007. [CrossRef]
  18. ASTM C1424-15(2019); Test Method for Monotonic Compressive Strength of Advanced Ceramics at Ambient Temperature. American Society for Testing and Materials: West Conshohocken, PA, USA, 2019. [CrossRef]
  19. 2024 Drinking Water Quality Report. Available online: https://www.regina.ca/home-property/water/water/quality-protection/ (accessed on 1 July 2025).
  20. Co-Op Refinery. Available online: https://www.fcl.crs/our-business/refinery (accessed on 1 July 2025).
  21. Sachan, A.; Penumadu, D. Identification of microfabric of kaolinite clay mineral using X-ray diffraction technique. Geotech. Geol. Eng. 2007, 25, 603–616. [Google Scholar] [CrossRef]
  22. Yanu, C.A.; Nguiamba, N.; Sieliechi, J.M.; Ngassoum, M.B. Elaboration of Ceramic Pot Filter from Kaolinite (Cameroon Clay) for the Elimination of Suspended Particles from Domestic Drinking Water. J. Mater. Sci. Chem. Eng. 2023, 11, 43–60. [Google Scholar] [CrossRef]
  23. Yusuf, K.O.; Abadunmi, T.; Adeola, A.; Giegbefumwen, S.O. A Simple Ceramic Water Filter for Water Purification in the Rural Area. Technium 2023, 12. [Google Scholar] [CrossRef]
  24. Heikal, G. Removal of heavy metals using kaolinite and Bentonite filter media. Int. J. Curr. Eng. Technol. 2018, 8, 1535–1541. [Google Scholar] [CrossRef]
Figure 1. Kaolinite powder particle size distribution.
Jmmp 09 00278 g001
Figure 2. Optimized filter base surface.
Jmmp 09 00278 g002
Figure 3. Sample dimension comparison: (a) the effect of water content on sample height and (b) the effect of water content on sample diameter.
Jmmp 09 00278 g003
Figure 4. XRD pattern of sintered kaolinite sample.
Jmmp 09 00278 g004
Figure 5. SEM micrographs of kaolinite powder: (a) ×30 (500 µm); (b) ×50 (500 µm); (c) ×100 (100 µm); (d) ×250 (100 µm); (e) ×500 (50 µm); and (f) ×1000 (10 µm).
Jmmp 09 00278 g005
Figure 6. SEM micrograph of samples: (a) with 36% water content and (b) with 40% water content.
Jmmp 09 00278 g006
Figure 7. Compression test stress–strain curves.
Jmmp 09 00278 g007
Figure 8. Water filtration: (a) filters after passing demineralized water, city water, and contaminated water, respectively, from left to right and (b) contaminated water before (left vial) and after (right vial) filtration.
Jmmp 09 00278 g008
Figure 9. Aerobic microbio results for (a) refinery water: (b) 37%–1, (c) 37%–2, (d) 37%–3, and (e) filters printed in different shapes.
Jmmp 09 00278 g009
Table 1. Kaolinite sample formulations.
Mix (g)Water (wt%)Kaolinite (wt%)Water/Kaolinite Ratio
70036640.56
70037630.59
70038620.61
70039610.64
70040600.67
Table 2. Samples for water percentages 36 to 40 wt% (all images follow the same scale).
36%Jmmp 09 00278 i001Jmmp 09 00278 i002Jmmp 09 00278 i003
37%Jmmp 09 00278 i004Jmmp 09 00278 i005Jmmp 09 00278 i006
38%Jmmp 09 00278 i007Jmmp 09 00278 i008Jmmp 09 00278 i009
39%Jmmp 09 00278 i010Jmmp 09 00278 i011Jmmp 09 00278 i012
40%Jmmp 09 00278 i013Jmmp 09 00278 i014Jmmp 09 00278 i015
Table 3. Effect of printing substrate on the sample’s drying.
Jmmp 09 00278 i016Jmmp 09 00278 i017Jmmp 09 00278 i018Jmmp 09 00278 i019
Fiber GlassAluminum FoilCardstock PaperTissue Paper
Table 4. Sample dimensions after drying (height, diameter) and after sintering (H’, D’).
Water (wt%)Designed HeightHeightH’Designed DiameterDiameterD’
36%1514.1213.813537.4336.36
14.0413.6838.3837.04
14.6414.137.4738.26
37%13.9813.8437.4336.39
13.9813.7536.8436.34
14.1713.4737.4736.47
38%13.8413.4236.9835.99
13.7513.6436.7336.31
13.6713.5636.5836.25
39%13.8113.4936.4335.18
13.9313.6436.5934.9
14.0413.7536.1335.18
40%13.5613.4936.2234.64
13.6713.2936.4234.86
13.5113.1236.1334.66
Table 5. Compression test results.
Water%Maximum Force (KN)Area (m2)Max Stress (KN/m2)Max Strain (%)Force at Peak 1Force at Peak 2Force at Peak 3
36%9.710.001096235885817.359.529.71
10.10.001077536937320.571.92.153.71
8.090.001077536750822.347.748.09
37%11.560.00110034710,50613.9611.5311.5611.38
13.230.00103719312,75615.4713.23----------
11.790.00104462711,28613.311.7911.42-----
38%14.630.00103491114,13621.4811.6114.63-----
15.380.00110505513,91821.0515.38----------
14.450.00110505513,07621.911.8914.4514.14
39%13.910.00093590414,86323.1711.3111.6212.23
9.660.00092886810,40026.096.378.359.13
16.040.00095662316,76727.8315.9116.04-----
40%14.250.00089780115,87239.026.8710.1512.41
30.360.00092886832,68541.8225.6627.85-----
33.90.00097203434,87541.2425.4923.96-----
Table 6. Water testing results.
Water SampleRefinery WaterCity Water36%37%40%
Turbidity (NTU)29.3 ± 1.90.67 ± 0.114.1 ± 0.33.8 ± 1.42.9 ± 0.2
Color (455 nm)470 ± 2032 ± 4153 ± 11180 ± 19201 ± 15
pH6.38 ± 0.157.44 ± 0.037.26 ± 0.057.16 ± 0.057.18 ± 0.05
Conductivity (mS)8.02 ± 0.590.915 ± 0.0254.5 ± 0.356.8 ± 0.4556.52 ± 0.655
Iron (ppm)0.735 ± 0.0450.205 ± 0.0150.48 ± 0.0750.24 ± 0.120.28 ± 0.03
Silica (ppm)39.5 ± 3.59.1 ± 0.461 ± 1074.8 ± 7.582.4 ± 5.05
Manganese (ppm)1.15 ± 0.050.115 ± 0.0150.6 ± 0.060.7 ± 0.1250.4 ± 0.075
TH292 ± 1225 ± 3116 ± 3138 ± 3144 ± 12
CaH135 ± 58 ± 142 ± 338 ± 335 ± 2
M-Alkalinity1.85 ± 0.1524.5 ± 1.1511 ± 210.5 ± 0.512 ± 1
Disclaimer/Publisher’s Note: The statements, opinions and data contained in all publications are solely those of the individual author(s) and contributor(s) and not of MDPI and/or the editor(s). MDPI and/or the editor(s) disclaim responsibility for any injury to people or property resulting from any ideas, methods, instructions or products referred to in the content.