1. Introduction
Resistance spot welding (RSW) is a very frequently used joining process in body-in-white. In the RSW process, two or more flat workpieces are placed overlapping between two electrodes. A short, high-current pulse partially melts the workpieces and forms a bond between the workpieces if the parameters are set correctly. In addition to good efficiency, the welding process of RSW can be easily automated. Further advantages of RSW are the short welding times and the frequent elimination of rework [
1]. Due to the increasing regulatory control of carbon dioxide emissions from vehicles [
2], the focus in recent years has been increasingly on the body-in-white in addition to the drive types [
3]. Lightweight materials such as aluminum alloys are increasingly being used [
4,
5,
6]. In general, aluminum alloys are increasingly employed in sustainable lightweight applications across mechanical engineering and aerospace and automotive industries, aiming to significantly reduce CO
2 emissions [
7]. Instead of steel, aluminum alloys are often used due to their low density and high ratio between strength and modulus of elasticity [
3]. Aluminum alloys of the series 5xxx and 6xxx are mainly used for the body-in-white [
3,
4,
8].
The RSW of steel has been researched much longer and much more intensively than that of aluminum. This is also reflected in the understanding of the behavior of the total dynamic electrical resistance and the respective resistance components (volume and surface). In RSW, the dynamic resistance is one of the most important influencing variables and has a significant impact on the quality of the welded joint and the formation of the spot diameter [
9,
10]. The dynamic resistance consists of the contact resistance at all contact surfaces of the workpieces and the electrodes, the bulk resistance of the workpieces and electrodes, and the system resistance of the welding machine. The dynamic resistance changes during welding and behaves differently depending on the workpiece material. A characteristic feature of aluminum is the steadily decreasing dynamic resistance during welding, which differs from steel (Ref. [
11,
12] cited from [
13]). There are many studies on the resistance of steel [
14,
15,
16], whereas little is known about this for aluminum alloys. In particular, very little is known about the division of the total electrical resistance (dynamic resistance R
dyn) into its components of contact resistance R
cont and bulk resistance R
bulk of the bulk material. One of the differences between aluminum and steel is the lower bulk resistance of aluminum, which necessitates the generation of a great proportion of heat through the contact resistance when welding aluminum. Due to the collapse of the contact resistance during welding [
3], no significant heat can be generated due to the low bulk resistance of aluminum, which is why short welding times with high amperages are necessary. When welding aluminum, the amperages are approximately twice as high as with steel, which is also due to the higher thermal conductivity of aluminum [
3]. The dynamic resistance is therefore a dynamic variable and changes over the welding time. The dynamic resistance is also referred to as total resistance [
17,
18,
19] or transition resistance [
20]. In this paper, the dynamic resistance is referred to as the total resistance R
tot (or R) if the dynamic resistance is considered at a specific point in time, e.g., at the beginning of a weld.
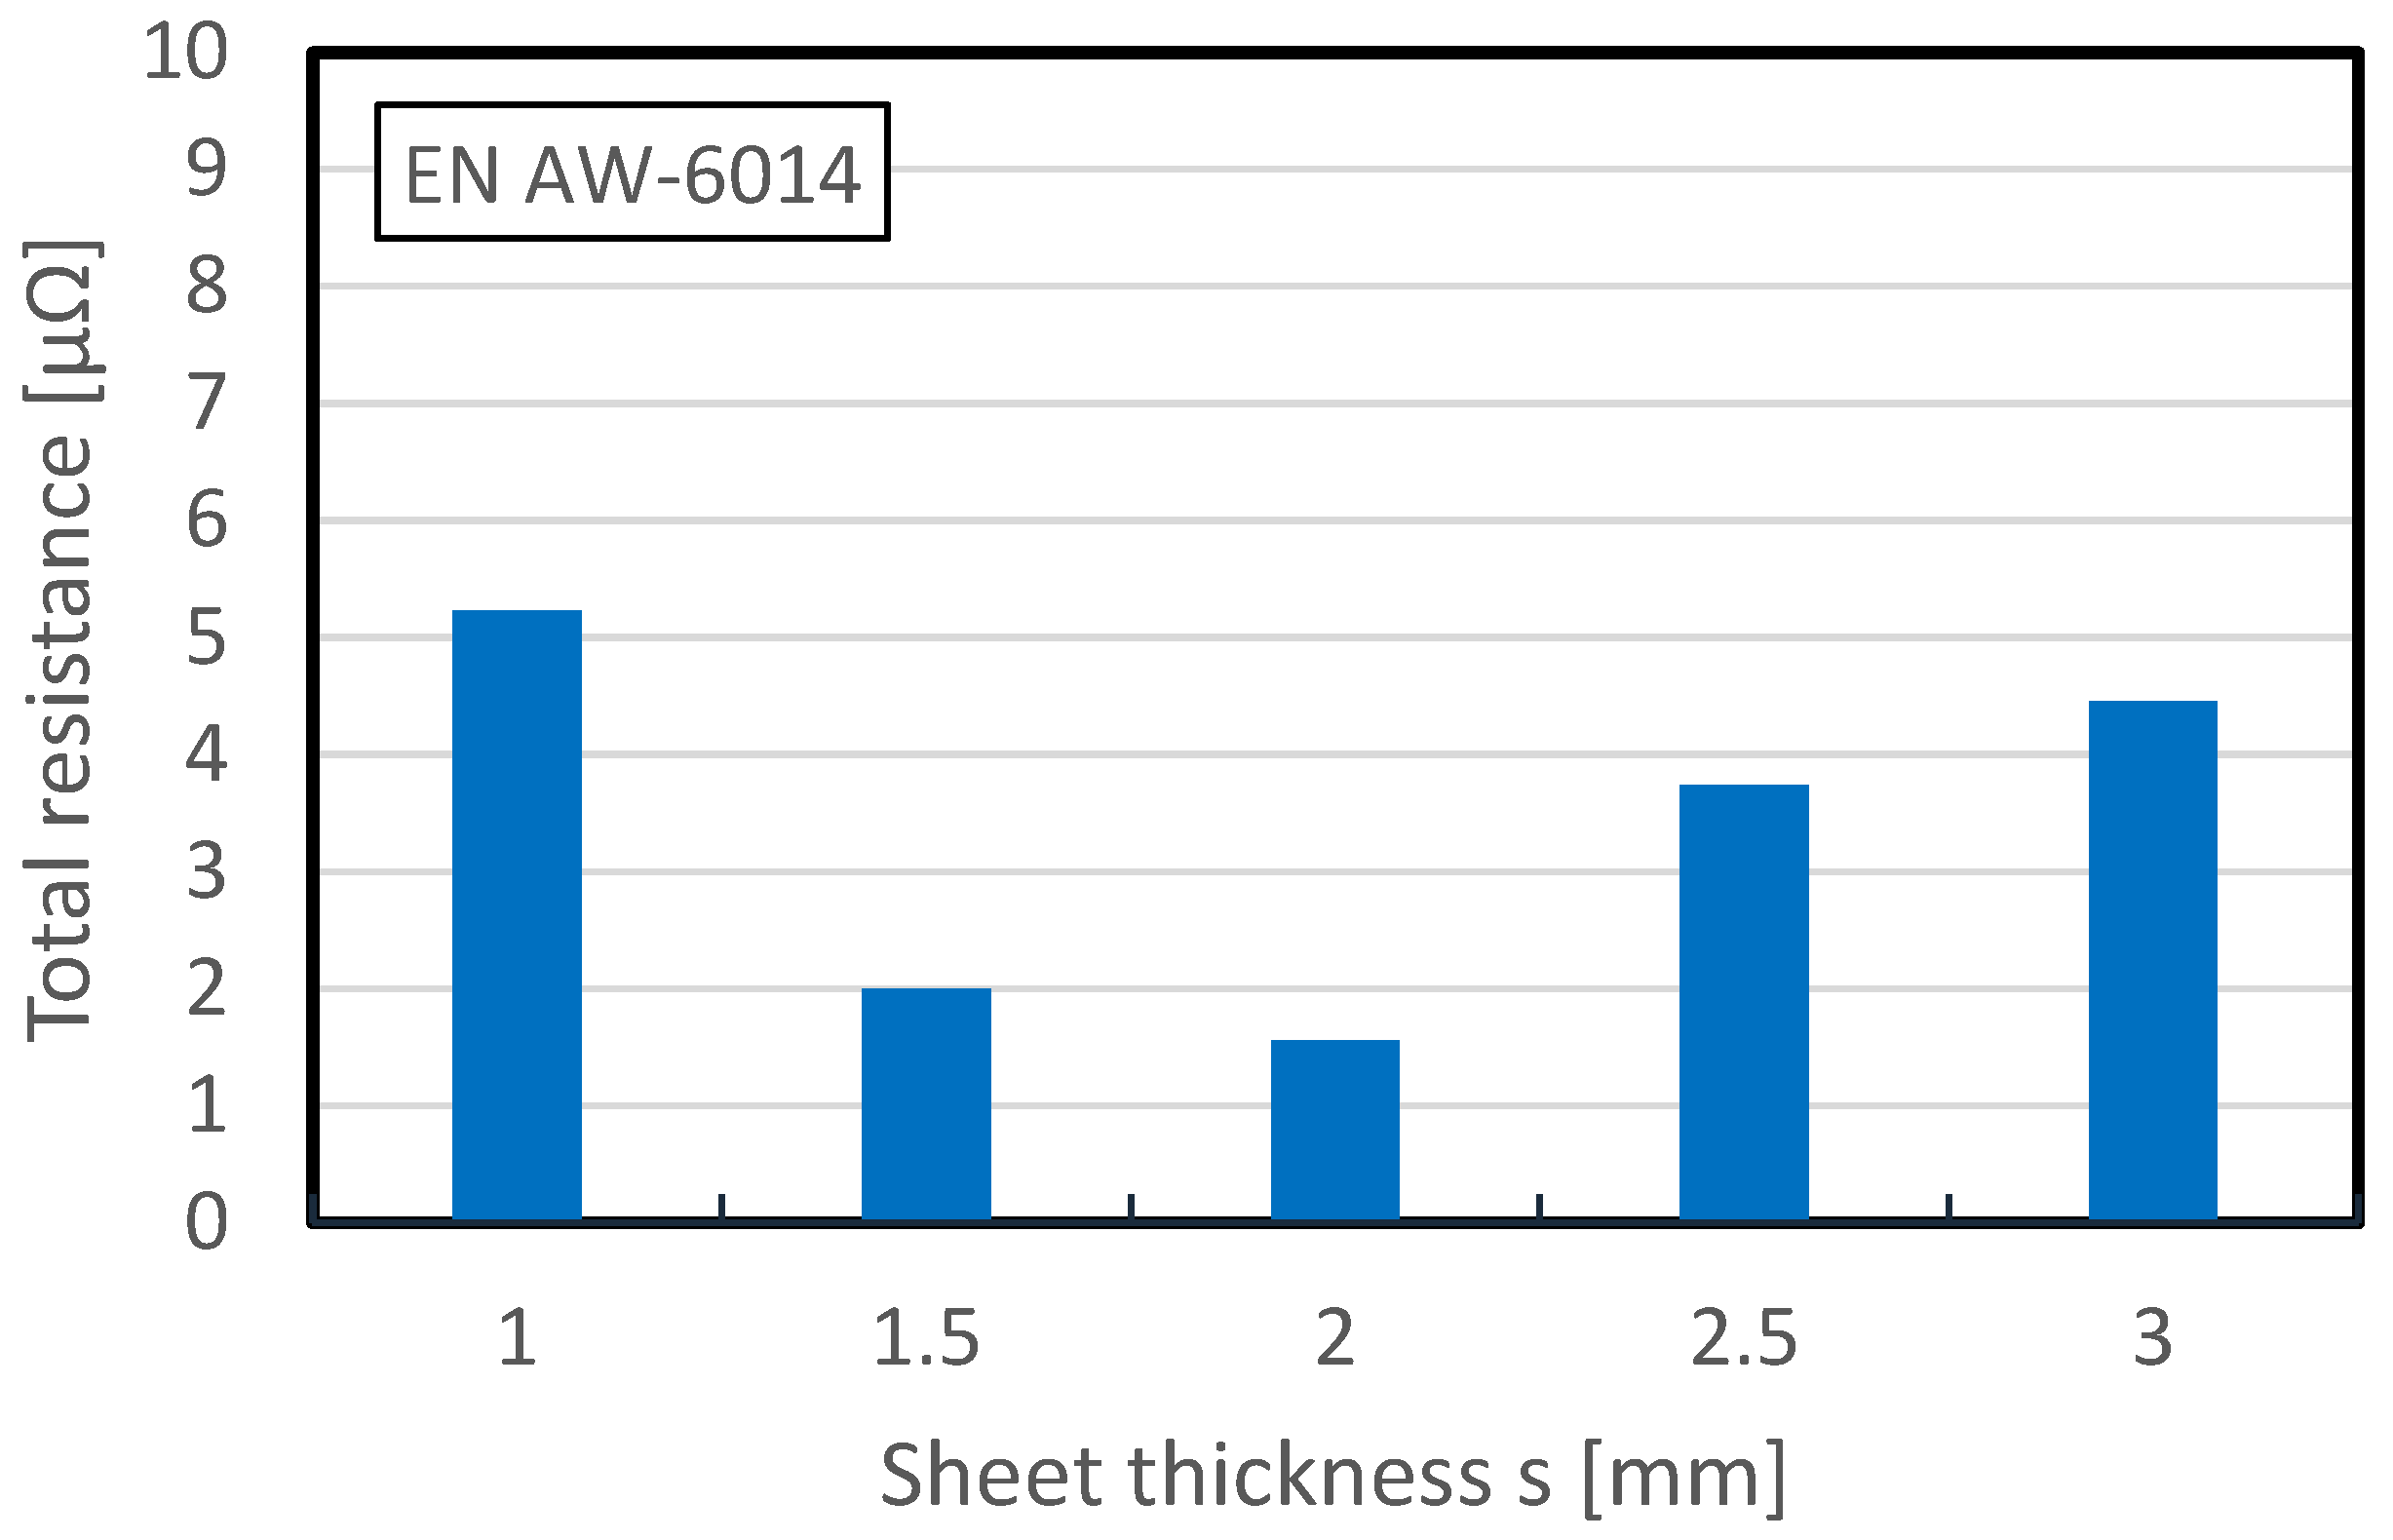
The division of the total resistance into contact and bulk resistance is of particular interest, as large, sometimes inexplicable fluctuations occur in the RSW of aluminum. For this purpose, the total resistance of aluminum sheets (EN AW-6016) of different thicknesses was measured at the Materials Testing Institute of the University of Stuttgart (MPA) in accordance with data sheet DVS 2929-1 [
20]. According to the data sheet, these sheets all had the same surface configuration (passivation, dry lubricant, roll texturing). However, these measurements yielded unexpected results (see
Figure 1). The total resistance varies greatly and it appears that the total resistance does not depend on the sheet thickness. A thorough exposition of the measurements and the measurement method employed is provided in the ensuing chapters.
Nowadays, the dynamic resistance is determined by many welding control systems during welding. This resistance curve can be used to control steel but not aluminum. The qualitative progression of steel and aluminum can be seen in Andrews et al. (Ref. [
12] cited from [
13]). However, a division into contact and bulk resistance is not possible with the welding controller. Numerical simulation models taking assumptions into account [
21] can realize this division into the respective resistance components. However, an experimental determination of the resistance components during welding is not known in the literature.
In the initial state, the total resistance of one or two sheets can be determined experimentally according to DVS data sheet 2929-1 [
20] or DIN EN ISO 18594 [
22]. This only allows the total resistance to be determined, but not the contact or bulk resistance. In this study, an approach is shown how the resistance components in the initial state of the sheet can be determined using experiments and numerical simulation.
The aim of this study is to determine the contact and bulk resistance as well as their ratio to the total resistance in the initial state of an aluminum sheet. Although there are measurement data of contact resistance or bulk resistance, which were determined separately from each other, a measurement of both resistance components of the same material batch for a quantitative comparison is not available in the literature. In addition to the qualitative, theoretical comparison of the resistance components (Ref. [
12] cited from [
13]), there is also the possibility of simulative comparison [
21], which, however, can only represent real conditions to a limited extent. The study shown here is intended to demonstrate a way of determining real sheet metal by measurement and comparing it with simulative support so that a quantitative comparison of a real sample can be carried out. In addition, the aim is to create a basis for characterizing different sheets in order to analyze their measurement data in future work using AI methods and to identify the influence of the initial condition on the welding behavior and welding quality.
2. Materials and Methods
This chapter describes two experimental setups to characterize aluminum alloy sheets. One setup can be used to determine the total resistance, the other the bulk resistance. The sheet material investigated were the alloy EN AW-5182-O and EN AW-6014-T4, which are typically used in body-in-white (see
Table 1 for the chemical composition of the alloys). All aluminum sheets used in this work have an EDT surface (Electron Discharge Texturing), a TiZr passivation layer, and the dry lubricant “Multidraw Drylube E1”. Finally, the comparability of the measured values is discussed.
2.1. Measurement of the Total Resistance
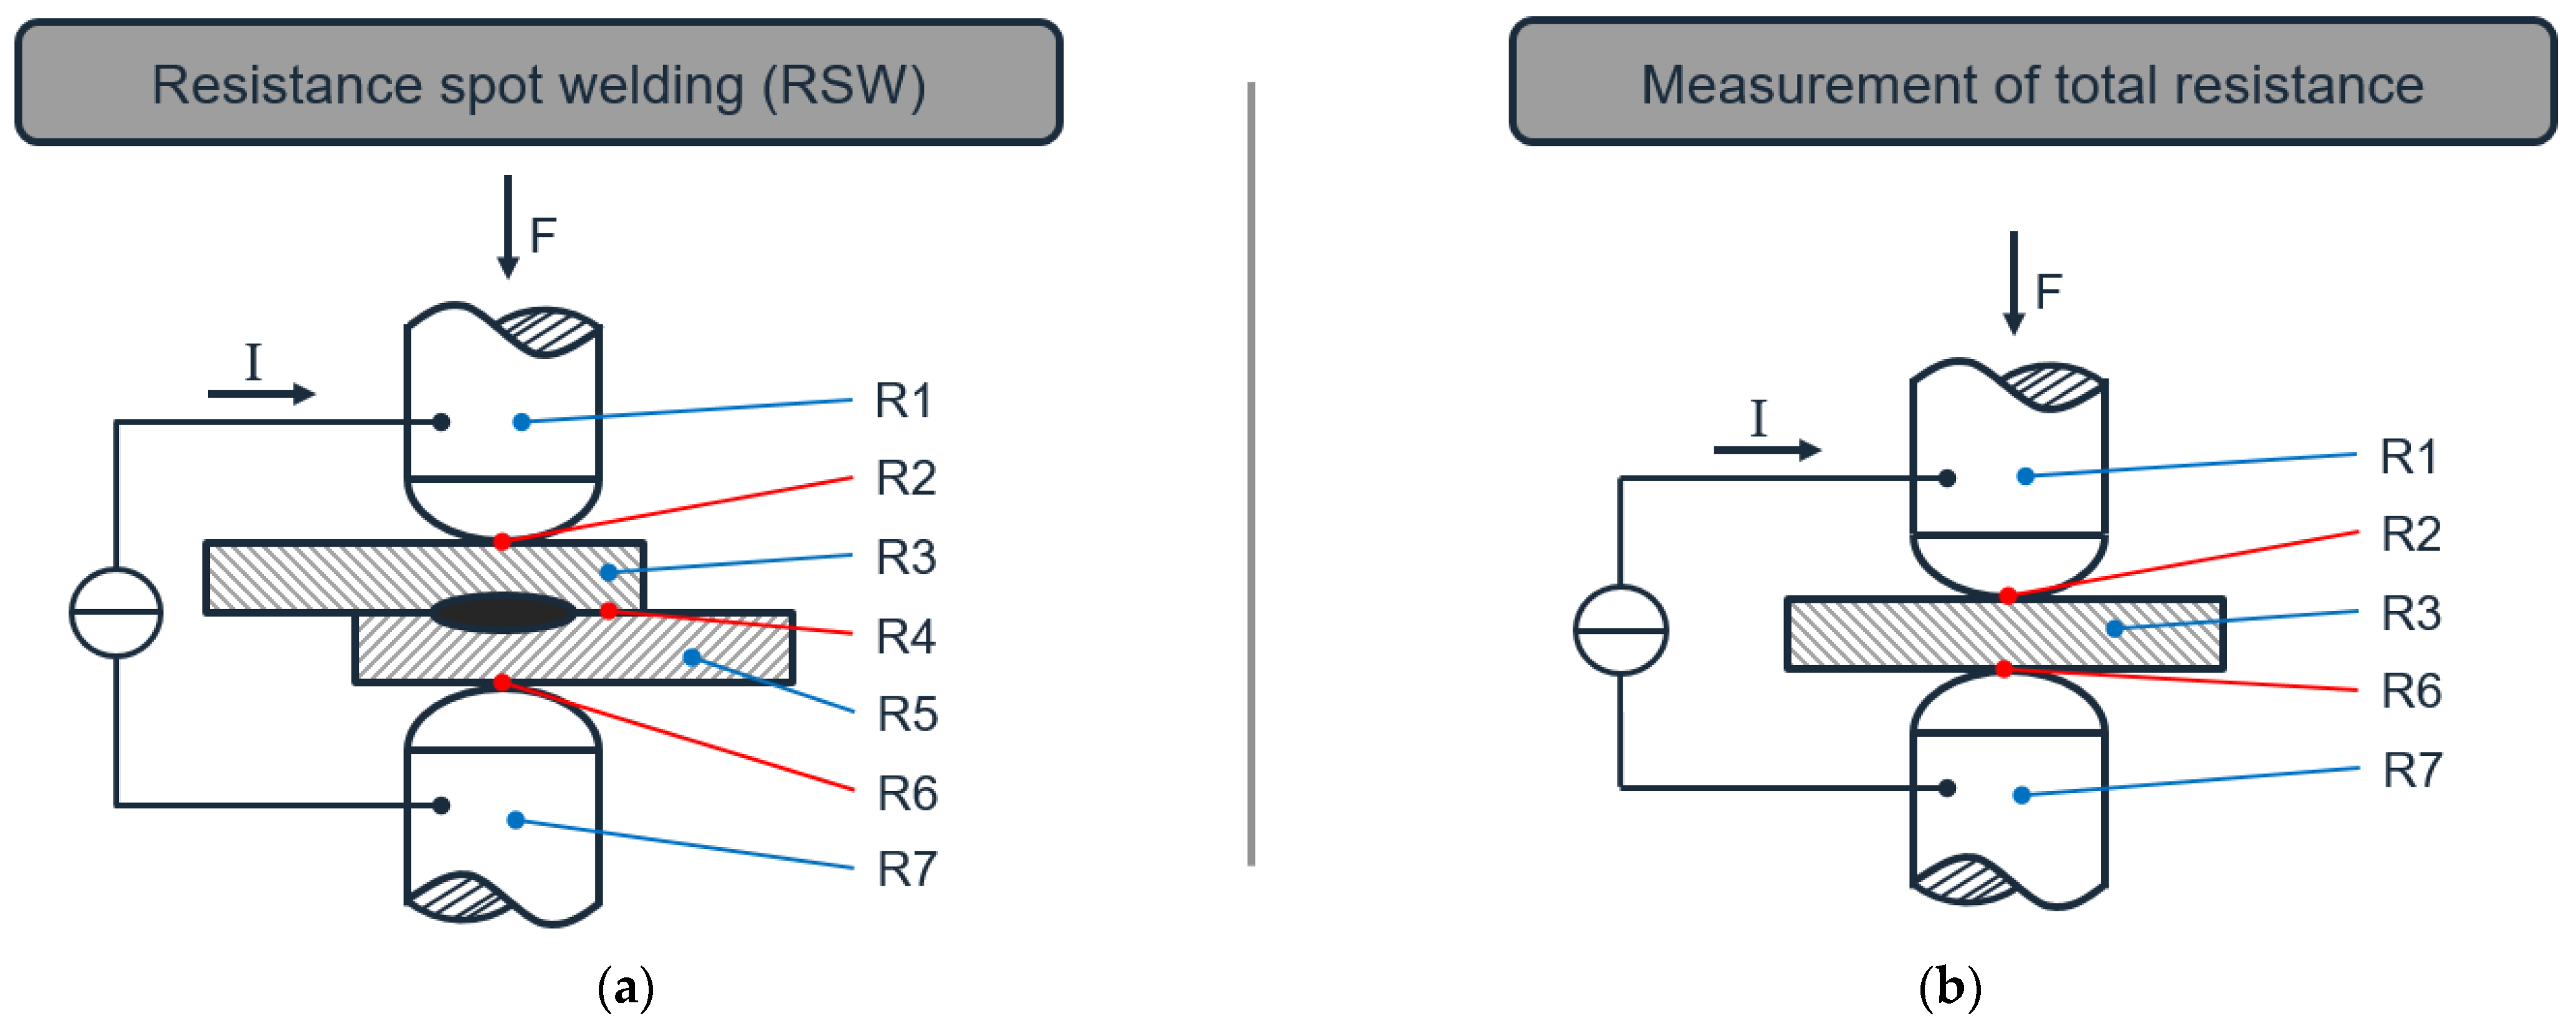
In RSW, at least two sheets are welded together. As shown in
Figure 2, the total resistance is made up of the bulk resistance and the contact resistance. Using two sheets, the bulk resistance includes the resistances R1 and R7 for the electrodes and the resistances R3 and R5 for the sheets. The contact resistances include the resistances R2 and R6 between the electrodes and the sheets and the resistance R4 for the contact surface between the sheets. A single sheet measurement was selected here to characterize the sheet material. This eliminates the contact resistance R4 between the sheets and the bulk resistance R5 of the second sheet.
A standardized method was used to characterize an aluminum sheet according to DVS 2929-1 [
20]. The measurements were conducted using a force of 7.5 kN and a measuring current of 10 A. The sample geometry is 100 mm × 50 mm, and the samples were cut with guillotine shears. To characterize a single batch, five sheets were always measured one after the other. Seven measurements were carried out on each sheet at different positions on the sheet (see DVS data sheet 2929-1), i.e., the mean value was ultimately calculated from 35 measured values per batch. The test setup for determining the total resistance can be seen in
Figure 3. The tests were carried out on a Zwick Roell 10 kN universal testing machine with an electrode setup and an ohmmeter RESISTOMAT 2304 from Burster.
2.2. Measurement of the Bulk Resistance
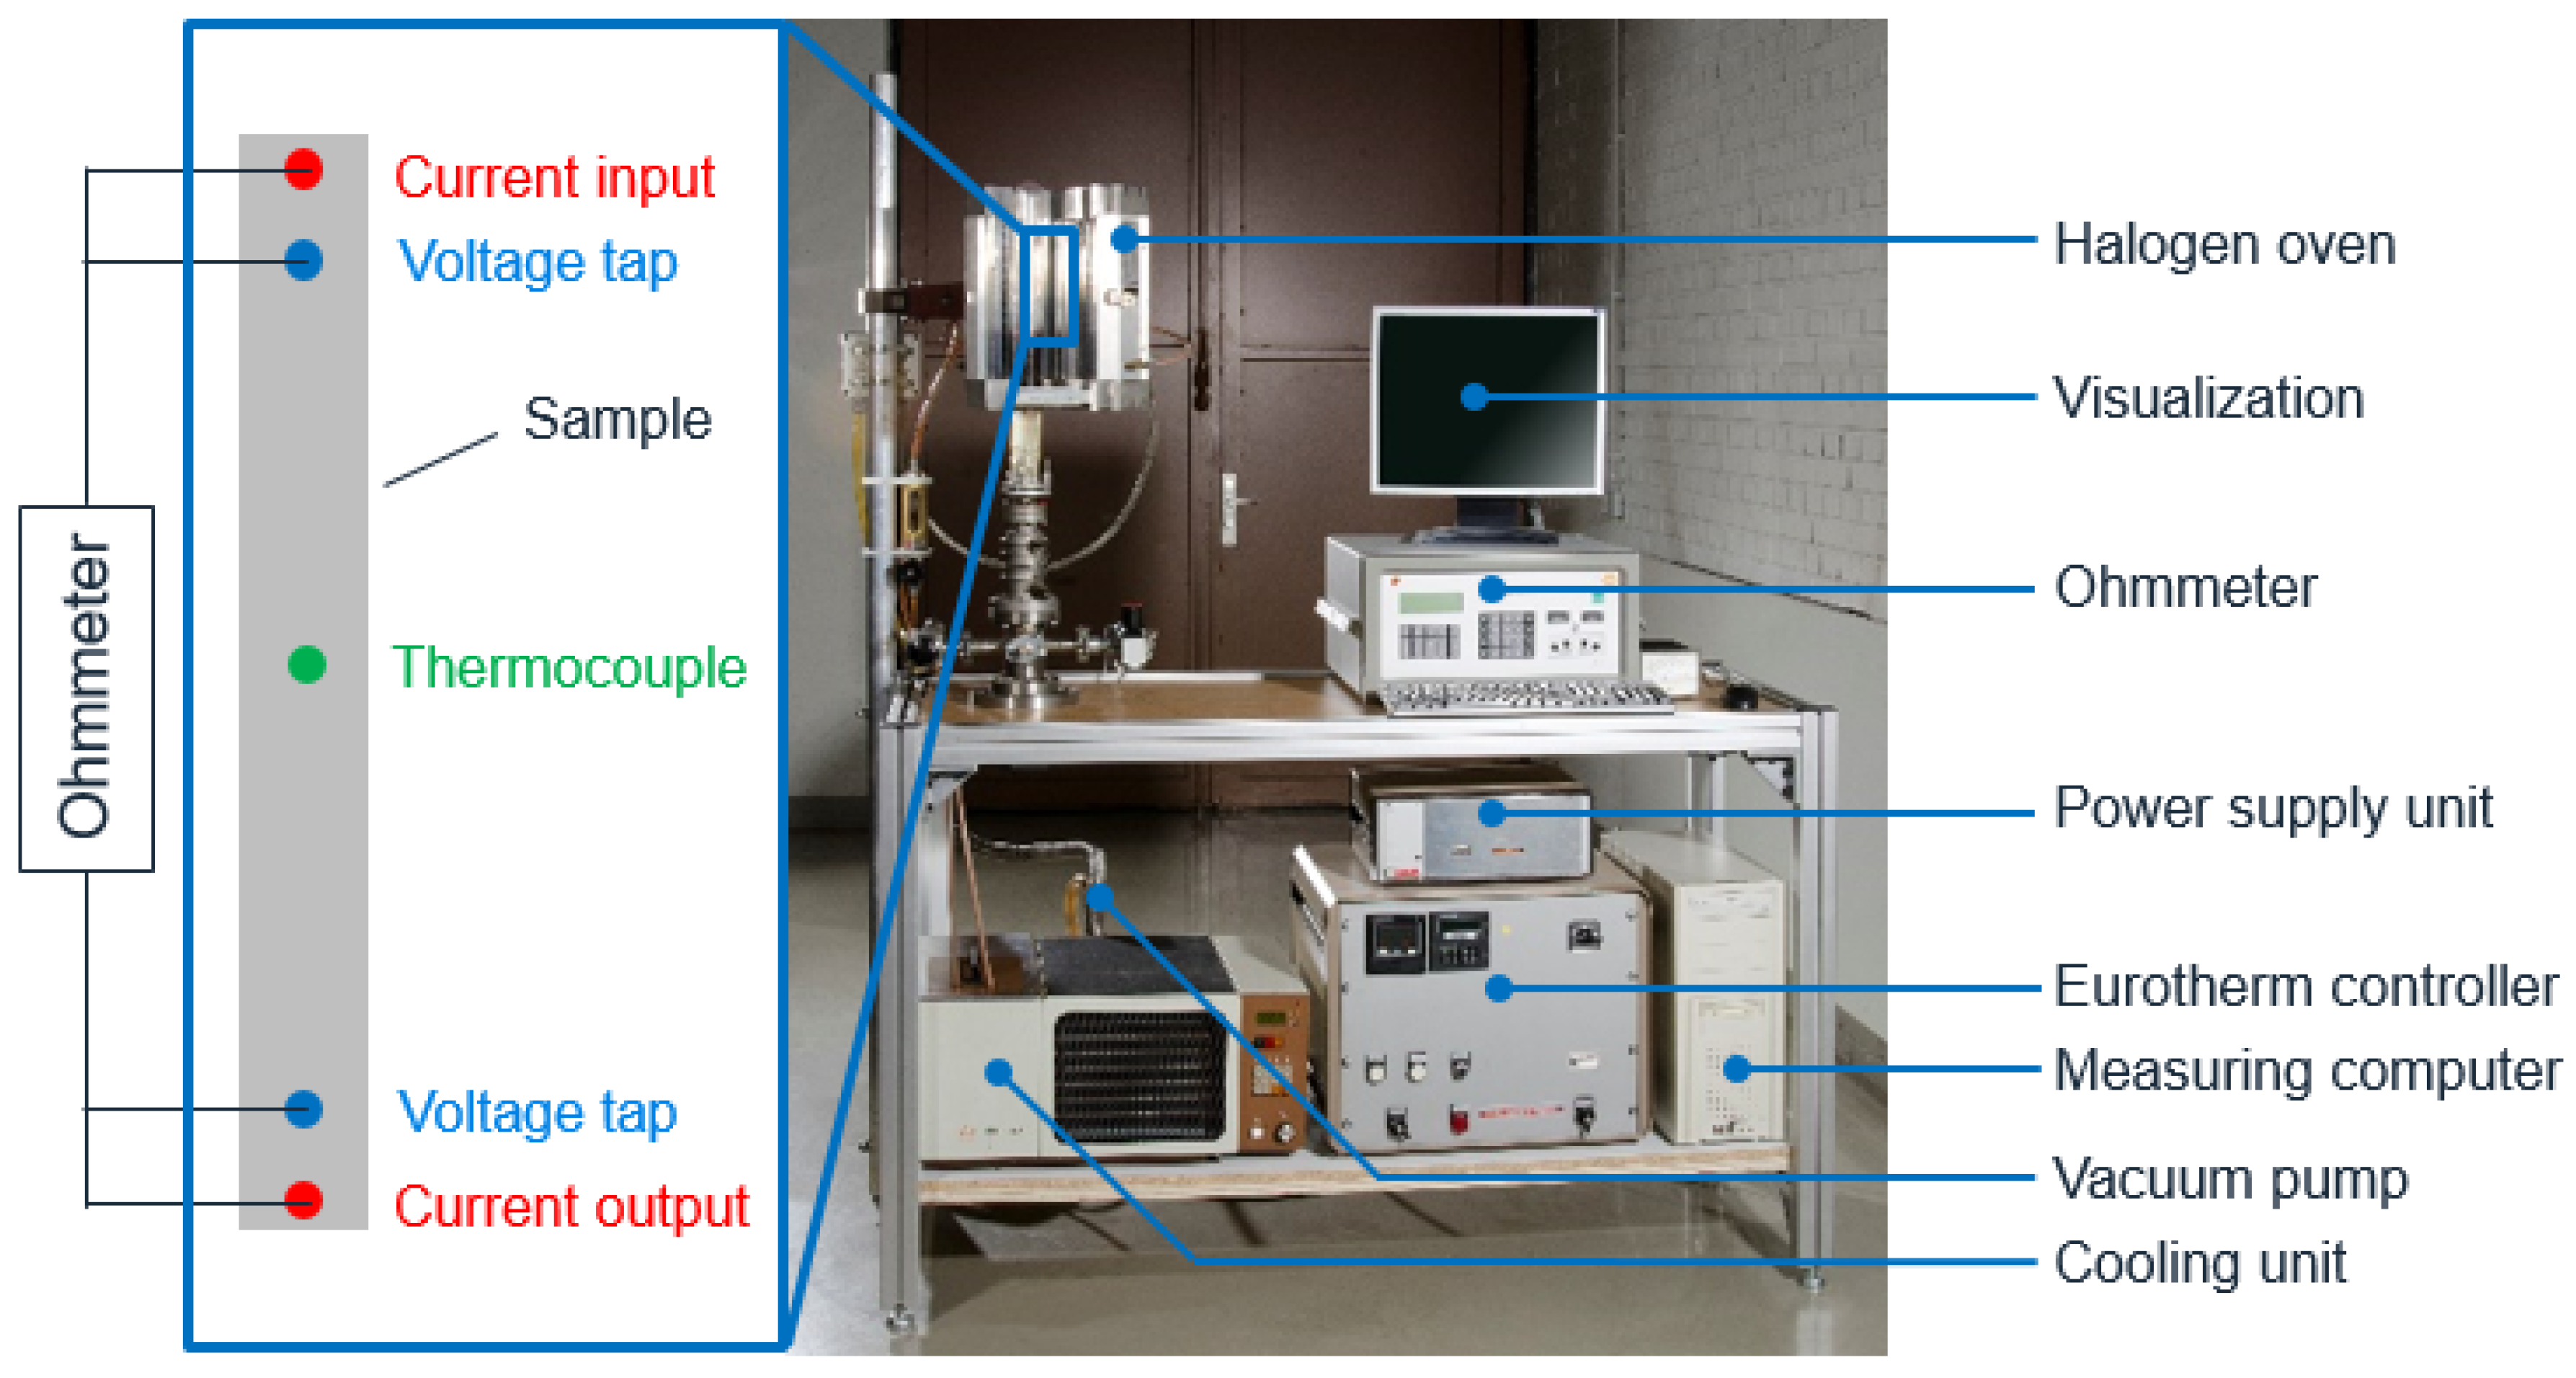
The test setup, as shown in
Figure 4, was used to measure the bulk resistance R
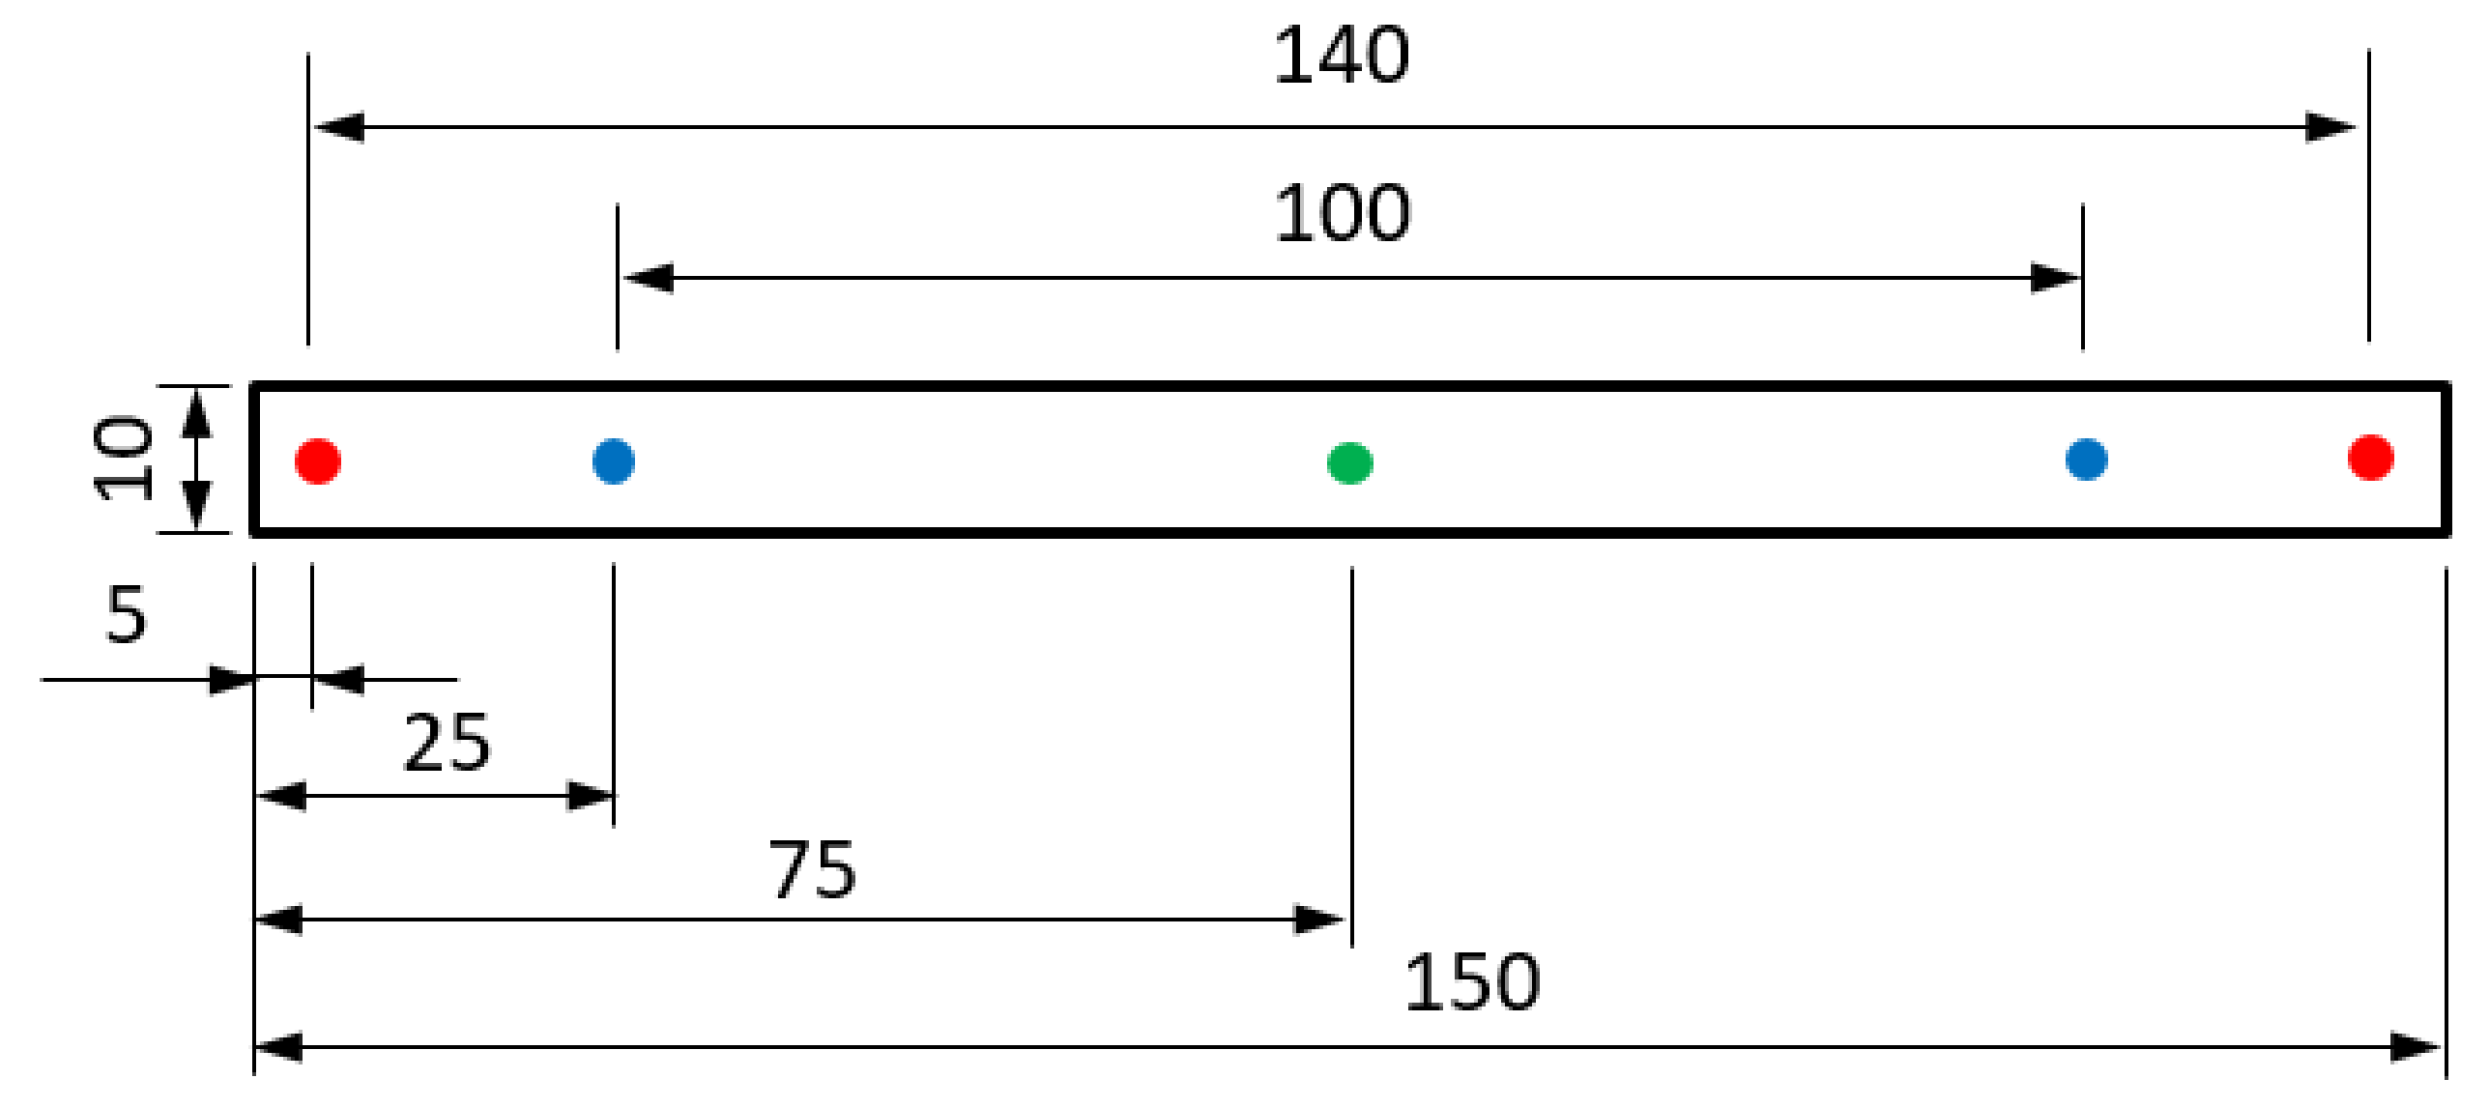
bulk of the samples. The ohmmeter RESISTOMAT 2304 from Burster (Gernsbach, Germany) was used for this purpose. An eroded aluminum sample is provided with current contacts, voltage taps, and thermocouples and is then heated in a vacuum oven (see
Figure 4 and
Figure 5). The measuring current used is 1 A. The resistance and temperature are measured continuously during heating. This allows the calculation of the temperature-dependent specific resistance. An oven would not have been necessary to determine the bulk resistance at room temperature. However, the bulk resistance was measured up to over 500 °C in order to use the measurement data also for advanced simulations, such as RSW process simulations, and to be able to apply the method presented here in future investigations at higher temperatures. However, only the measurement data at room temperature are used in this work.
2.3. Comparability of the Experimental Data
The geometries and test conditions of the two measurements provide different information. The latter test is suitable for determining the bulk resistance of the aluminum samples. The first test determines the total resistance, which includes bulk and contact resistance. With the help of these two complementary tests, the total resistance R
tot and the bulk resistance R
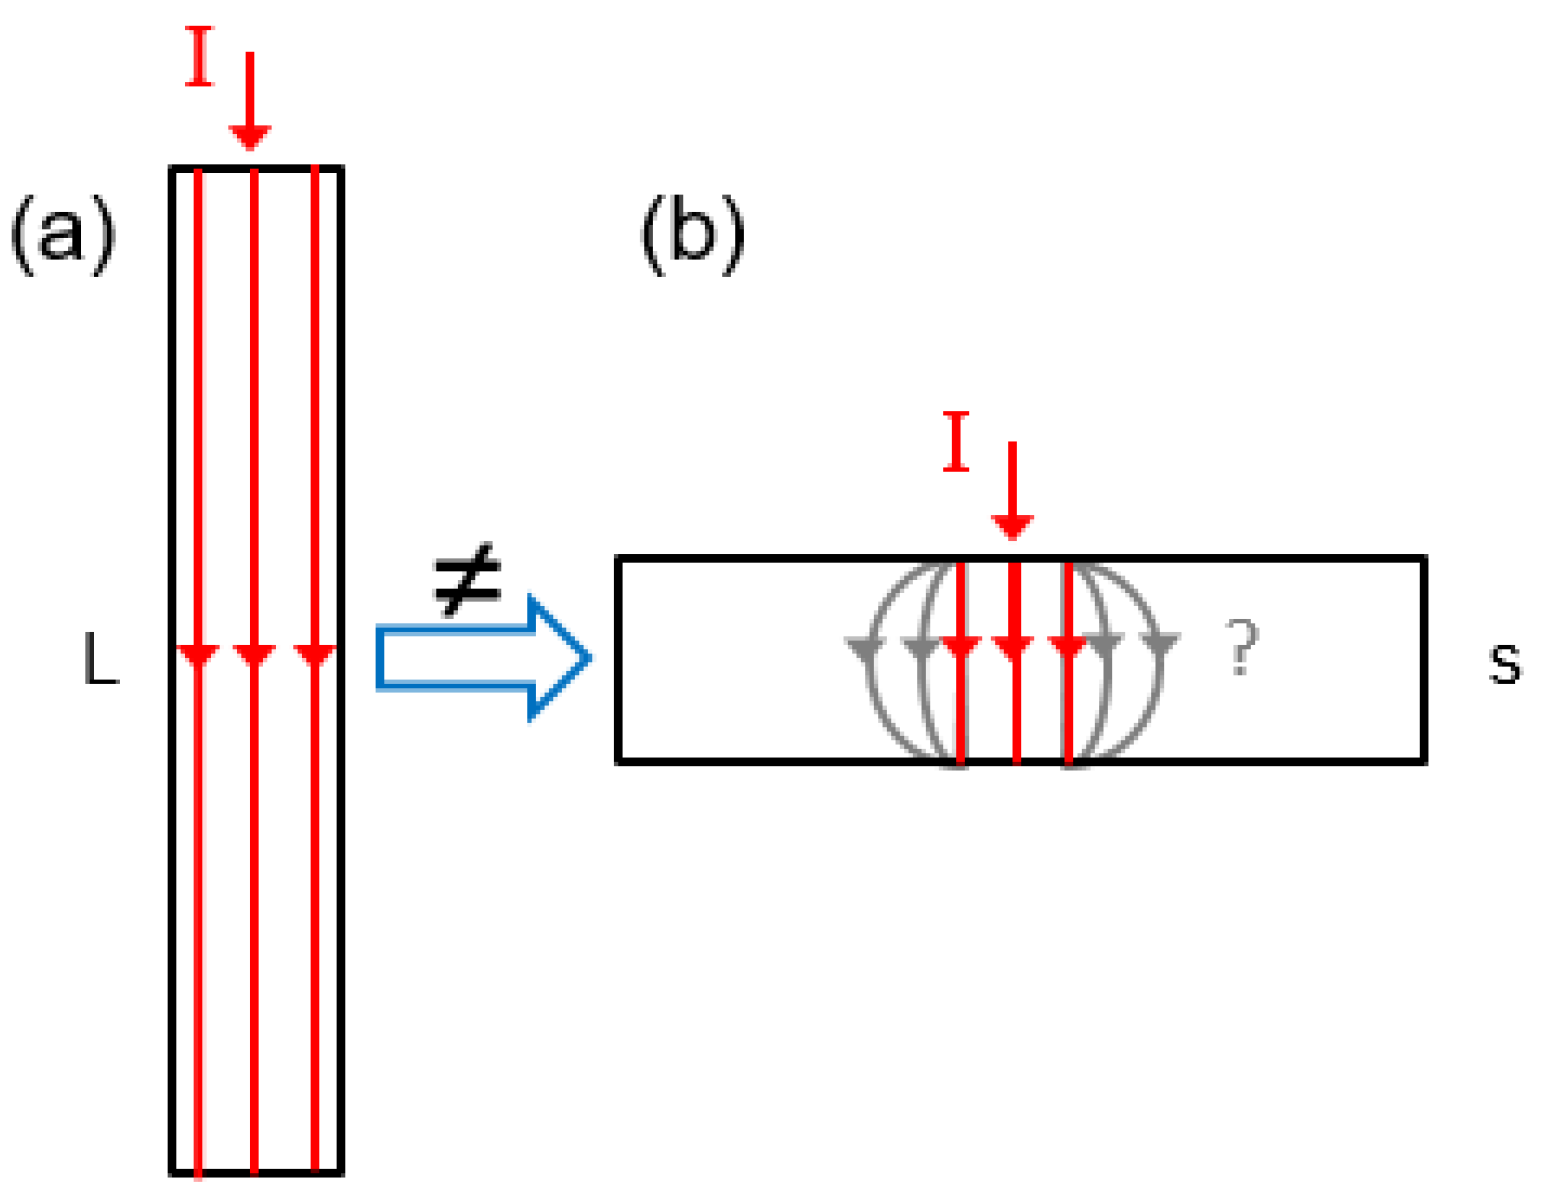
bulk are now available. However, these are limited to the sample geometry used in each case, since the current flow behaves differently depending on the sample geometry (see
Figure 6). A uniform, standardized sample geometry that can be used for both measurement methods cannot be found in the standards.
When measuring the bulk resistance, a narrow sample geometry was selected (L × W × s = 150 mm × 10 mm × s) in order to obtain a current flow through the entire cross-sectional area of the sample. This assumption can represent a potential source of error if the current does not require the entire sample cross-section for the current flow. However, with this assumption, the specific bulk resistance Rbulk,spec can be calculated from the absolute bulk resistance Rbulk,abs. The current flows parallel to the long side L.
When measuring the total resistance, the sample geometry was selected using the standardized method according to DVS 2929-1 [
20] and DIN EN ISO 18594 [
22] (L × W × s = 100 mm × 50 mm × s). Here, analogous to the RSW, the sheet lies perpendicular to the electrode tips so that the current flows in the direction of the sheet thickness s. A current density distribution occurs due to the geometry at the contact surface between the electrode and the sheet. This means that the current flow path does not have to be directly vertical, but the paths may well be curved (see gray arrows in
Figure 6). The exact area or volume through which the current flows is not known in detail. However, as the measured total resistance depends on the volume through which the current flows, it is not possible to convert the absolute total resistance into a specific one, or only with a great deal of effort. Therefore, the measured total and bulk resistances cannot simply be offset against each other using the equation R
cont = R
tot − R
bulk.
To illustrate the aforementioned, two different fictitious and oversimplified hypotheses were drawn up to show the two extremes (see
Figure 7). The first hypothesis assumes that the current flows directly from the upper to the lower electrode tip without changing the cross-sectional area of the current flow. In the second hypothesis, the current flows through the entire cross-sectional area of the sheet. For this purpose, the sample geometry of the total resistance measurement is used and the measured specific bulk resistance is converted into the absolute bulk resistance using the hypotheses.
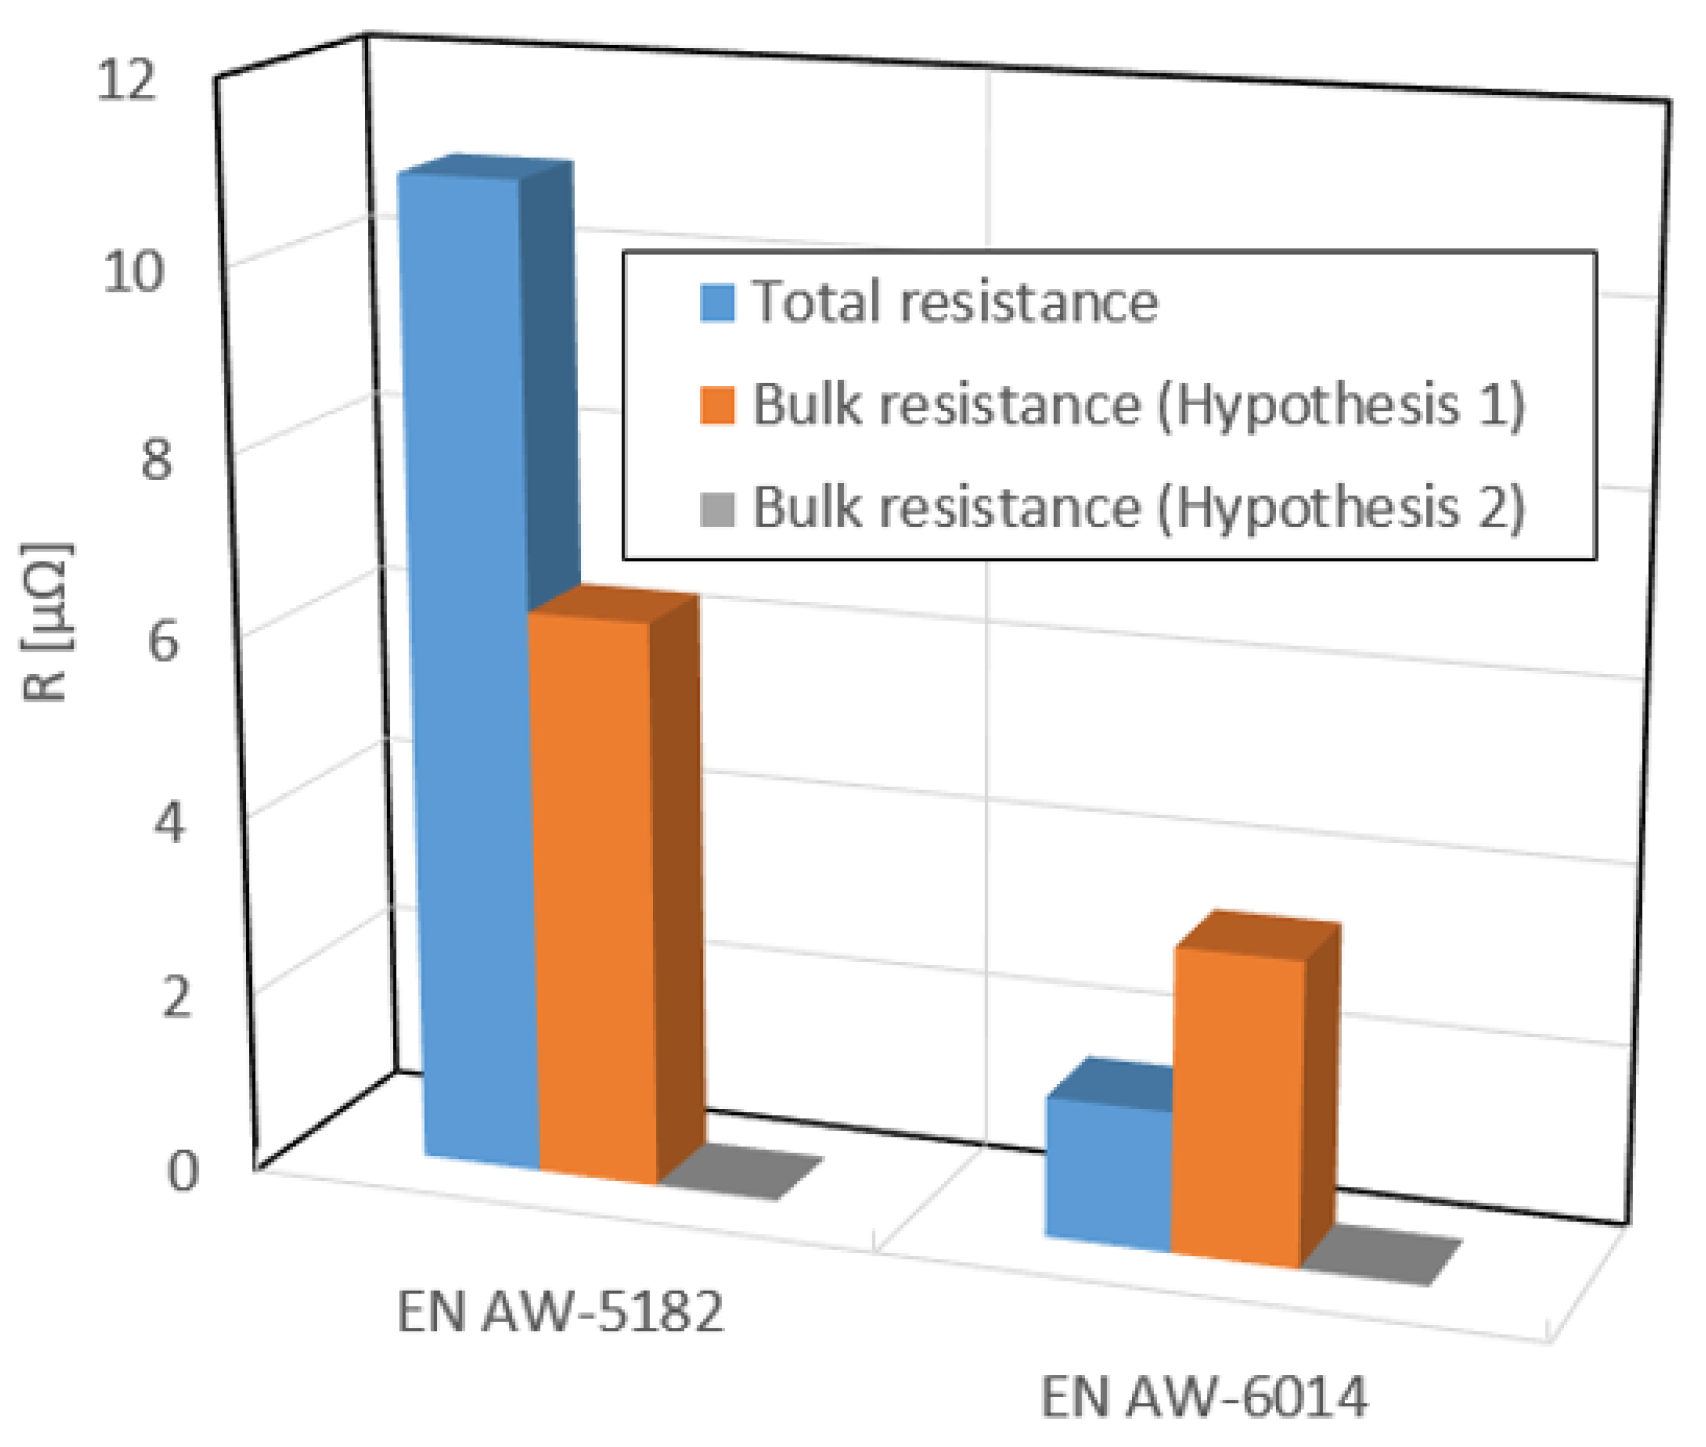
The hypotheses were tested on both alloys, with the results illustrated in
Figure 8. The total resistance is the measured total resistance. The measured specific bulk resistance R
bulk,spec was converted to an absolute bulk resistance according to the respective hypothesis using the following formula:
The results show that the bulk resistance of hypothesis 2 yields very low values (bulk resistance ≈ 0) and therefore, a negligible bulk resistance should be assumed. In the case of hypothesis 1, a bulk resistance is calculated for E AW-6014 that is greater than the measured total resistance. This is not physically possible. As both hypotheses do not reflect reality, the truth lies between the two hypotheses. Consequently, a methodology is now being sought that would enable the true current density distribution and the resulting resistance of the geometric arrangement to be determined and taken into account.
2.4. Combined Method (Experiment and Simulation)
As shown in the previous chapter, the measurement results of the two test setups cannot be easily compared. For this reason, a procedure will be developed in this study that takes the different test conditions into account and determines the contact resistance based on the difference between the resistances.
An analytical approach does not lead to a solution without in-depth physical knowledge of the current flow. A simulation model was therefore created in order to compare the measurement data. The aim is to use the simulation to calculate the absolute bulk resistance based on the specific bulk resistance (see
Figure 9). For this purpose, a bulk resistance measurement is simulated with the test boundary conditions of the total resistance setup.
A three-dimensional (3D) fully coupled thermal–electrical–structural model with the hexahedral mesh element type Q3D8 was set up in Abaqus 2018 for this purpose (see
Figure 10). The finite element model (FEM) reflects the test setup of the total resistance measurement. This includes two electrode tips and a metal sheet. The measuring current I
in and the electrode force F were selected analogously to the total resistance measurement. As the material properties can affect the simulation result, the aim was to use the material properties as close as possible to the sample alloy. The specific electrical conductivity of the sheet σ
el,Sh comes from the bulk resistance test, as the conductivity can be calculated from the specific bulk resistance. Young’s modulus was taken from the literature [
25,
26]. The contact resistances R
cont between the electrode and the sheet were set to almost zero, so that the model only considers the bulk resistances. Abaqus does not allow a contact resistance of exactly zero, so the resistance was set to a very small value (R
cont,spec = 10
−15 Ω × mm
2). A sensitivity analysis was used to check and prove that this value is small enough and does not negatively affect the simulation result. The simulation result provides the electrical potential U
out. The absolute bulk resistance can be calculated using Ohm’s law R = U/I.
3. Results and Discussion
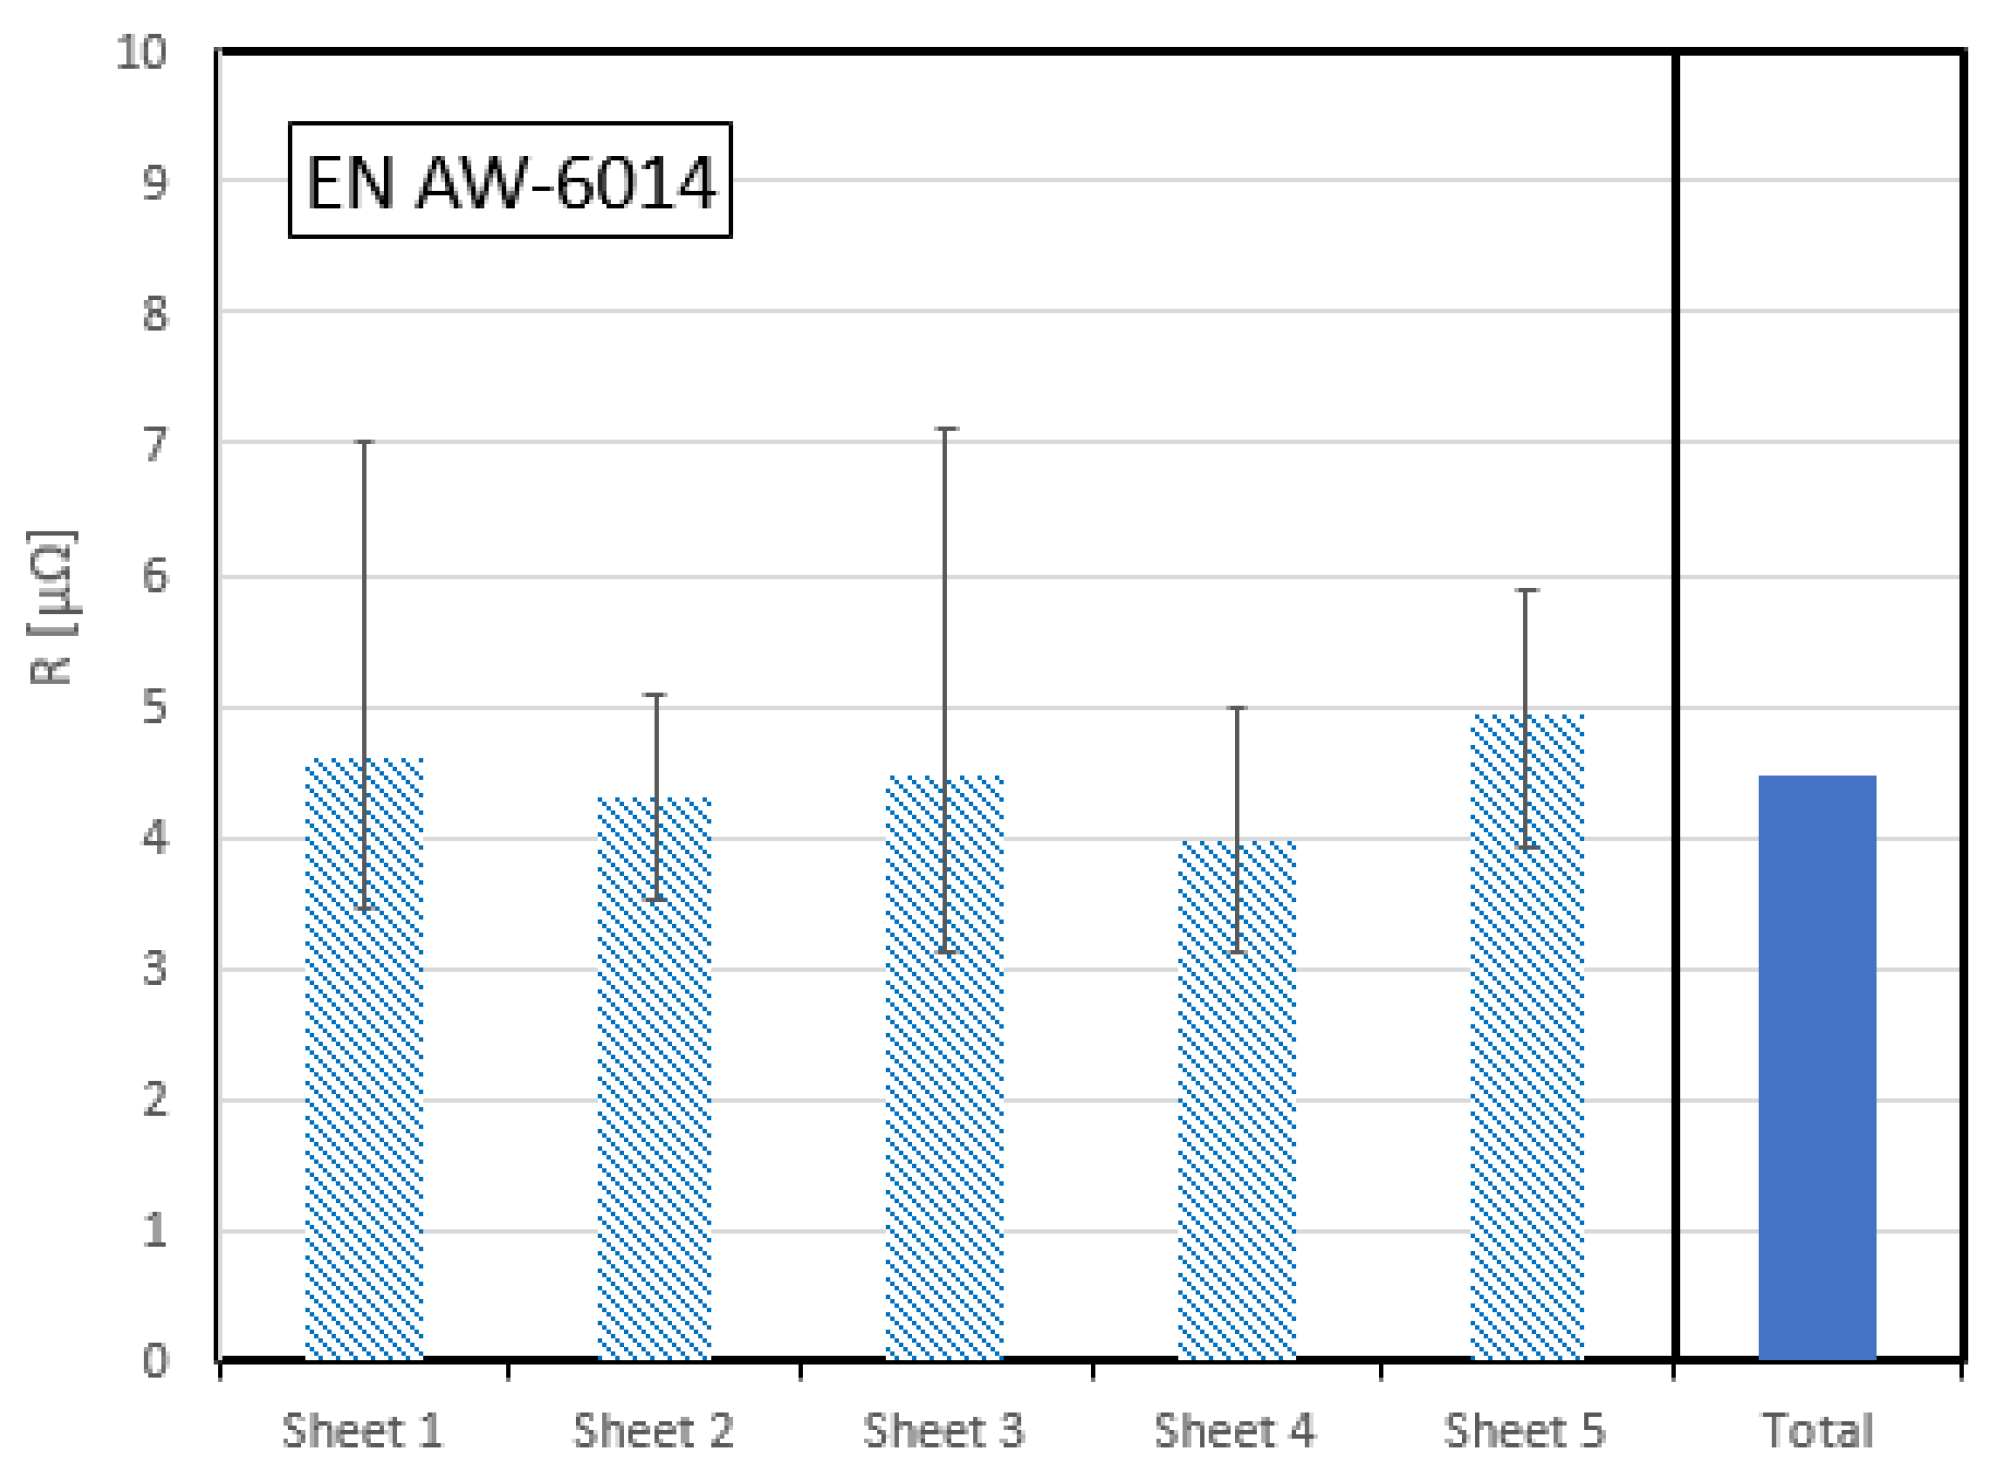
Figure 11 shows the results of five sheets of EN AW-6014 alloy with a sheet thickness of 3 mm from the same batch. The fluctuations on each sheet can be seen, which vary in size. The fluctuations can be caused by contamination, as the sheets were not cleaned before the measurement to ensure production conditions. Scratches or other surface damage also affect the measurement result. Special care was taken during the measurements to ensure that sheets with clearly visible scratches and contamination were not measured. Seven individual measurements were carried out on each sheet, which are represented by the scatter bar. The total resistance calculated from the mean value of the five sheets (blue bar) gives the characteristic total resistance for a single material batch.
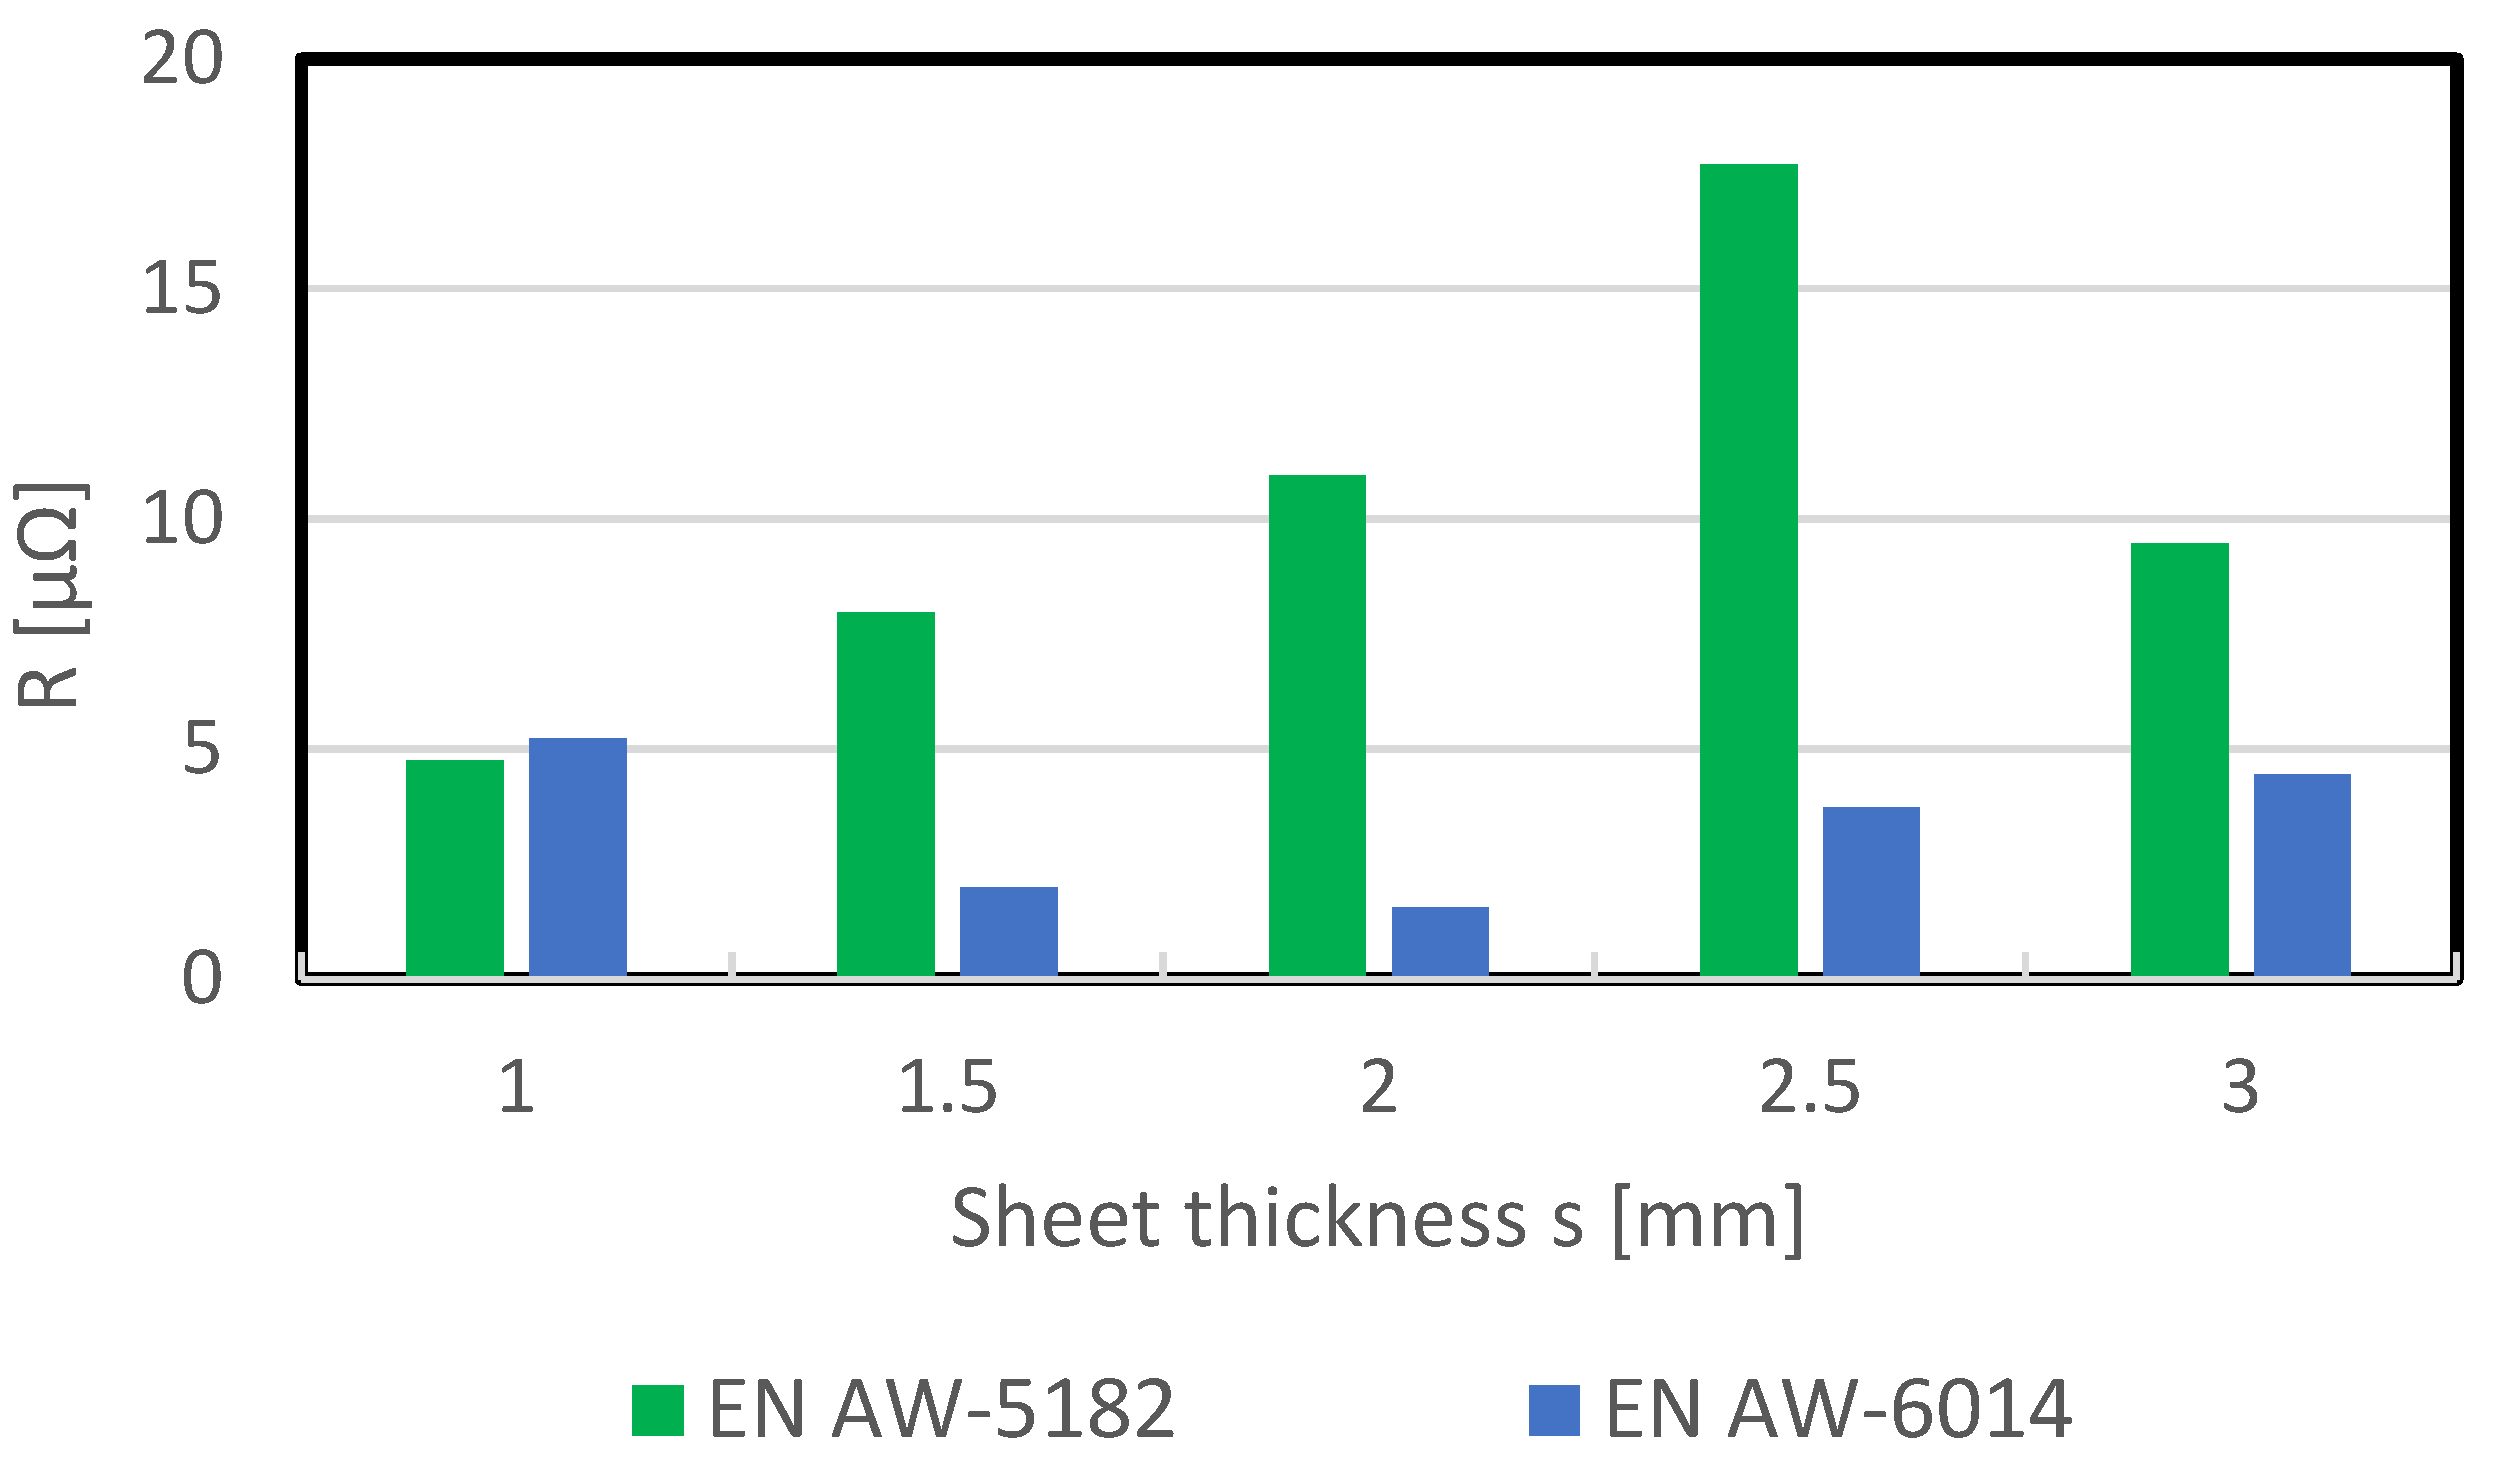
These measurements were carried out for the sheet thicknesses of 1.0–1.5–2.0–2.5–3.0 mm of EN AW-5182 and EN AW-6014 alloys. The results are shown in
Figure 12. The measurement results agree with the findings of Eichhorn et al. (Ref. [
27] cited from [
11]), where the total resistances of passivated sheets were less than 30 µΩ. In the resistances measured here, no apparent dependence between the sheet thickness and the total resistance is recognizable. This means that the bulk resistance cannot have the main influence on the total resistance because the bulk resistance increases with increasing sheet thickness and there is no monotonic increase in the total resistance with increasing sheet thickness. From this it can be concluded that it is mainly the contact resistance that influences the total resistance. This can depend on many factors, such as oxide layer, passivation, dry lubricant, sheet storage time, sheet rolling direction, etc. Therefore, the results shown here only apply to this specific measured batch at the respective time of measurement and cannot be transferred to other sheets, even if they are made of the same alloy.
The simulation described above can now be used to calculate the absolute bulk resistance R
bulk,abs. This allows the absolute contact resistance R
cont,abs to be calculated using the following equation:
The absolute values of all three resistances are shown in
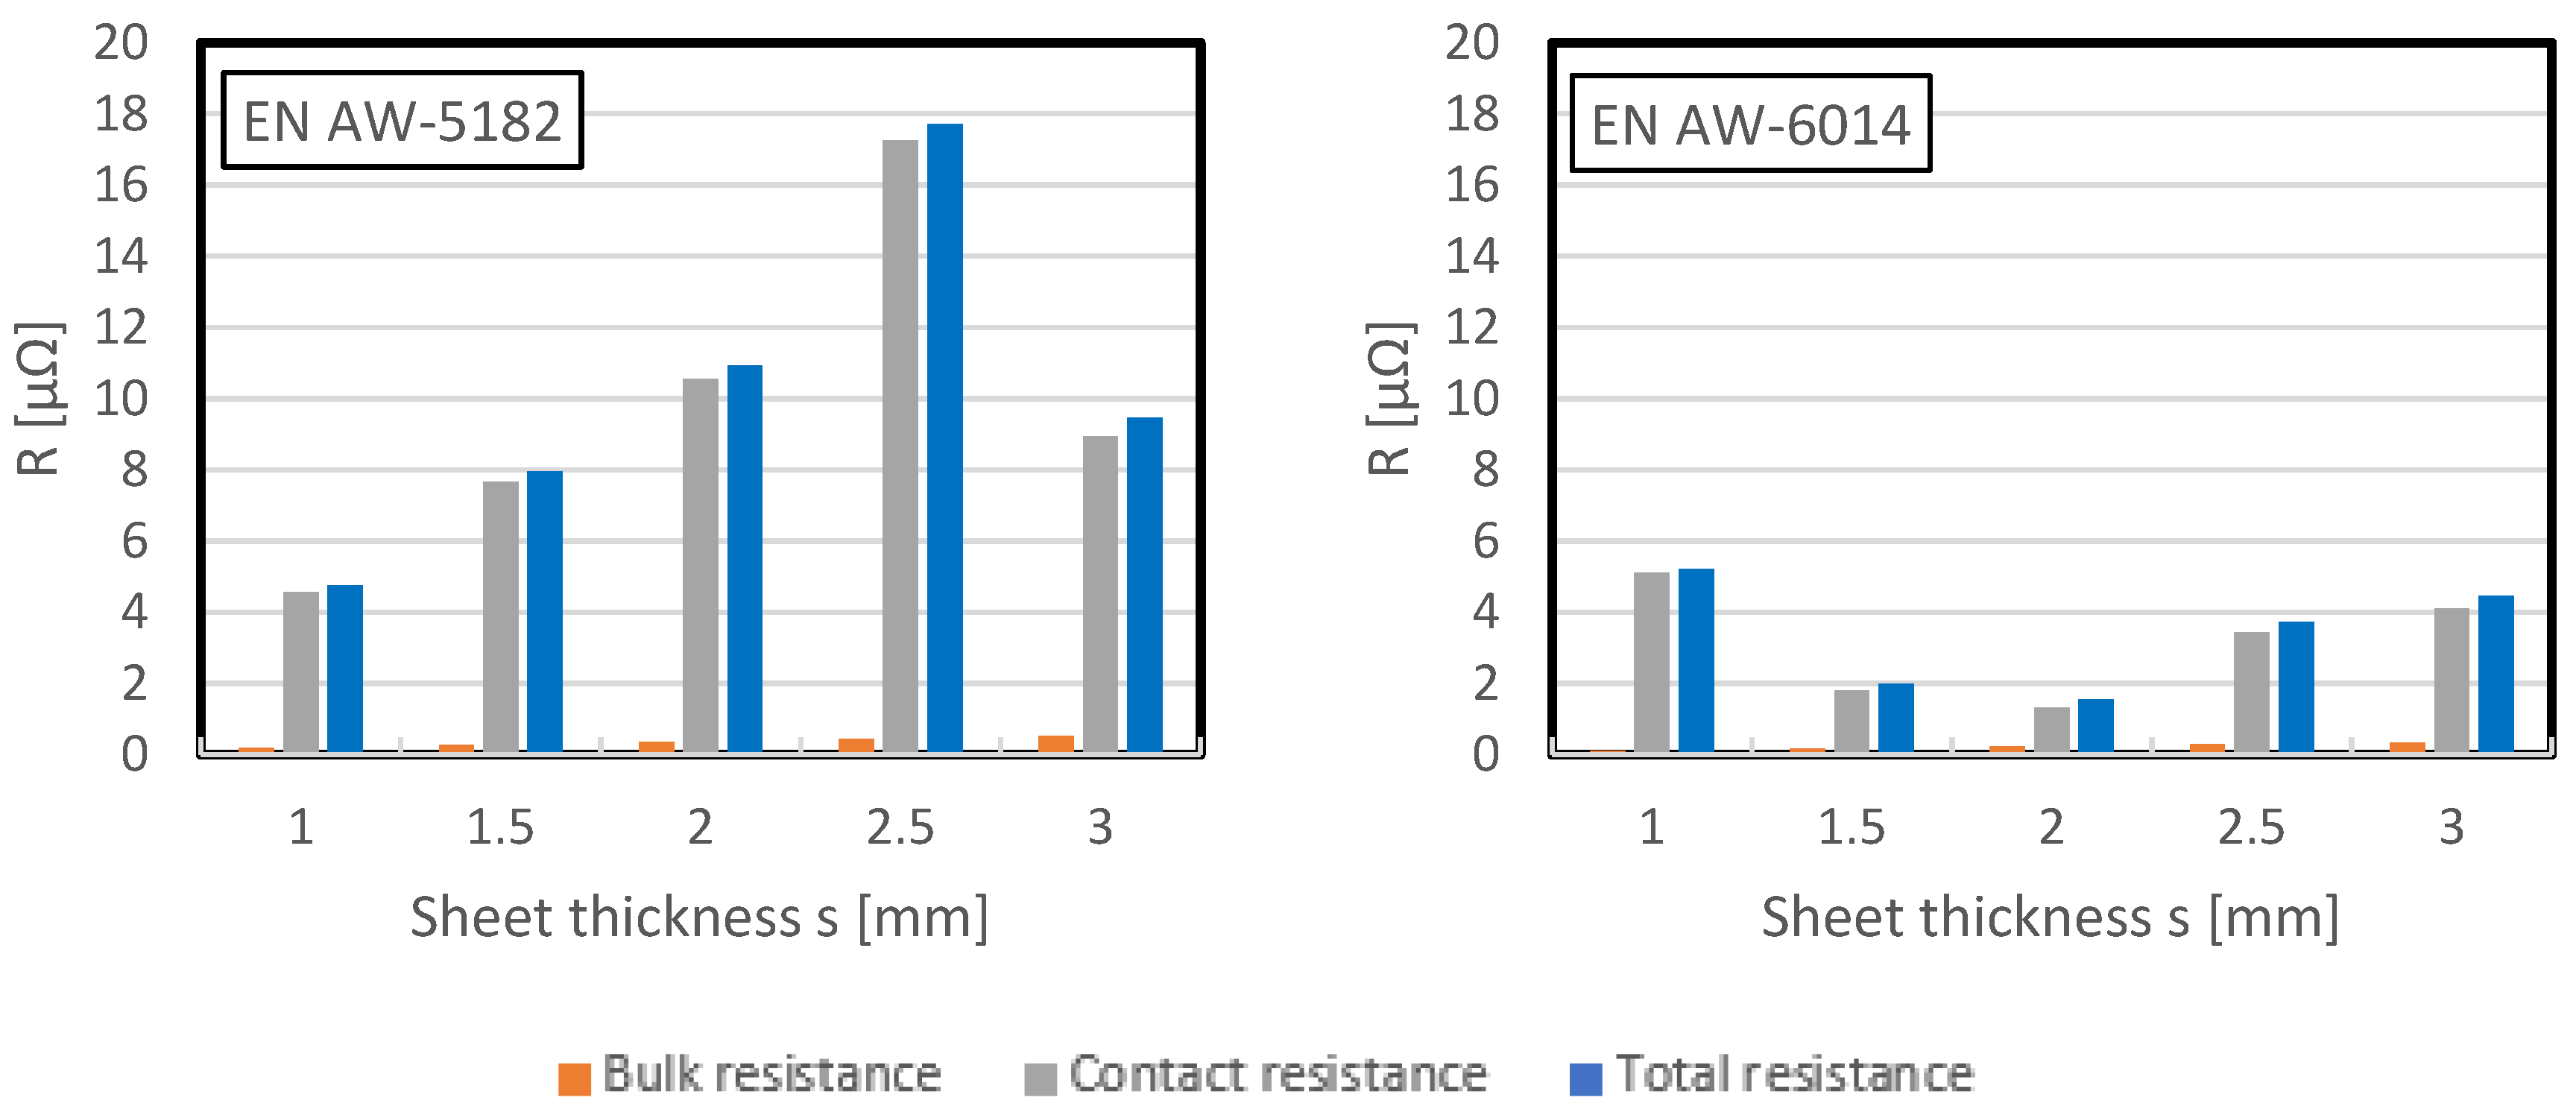
Figure 13. It is evident that the contact resistance is significantly greater than the bulk resistance for both alloys. The method also shows that the contact resistance of EN AW-5182 is higher than that of EN AW-6014 for almost all sheet thicknesses shown here. However, the method cannot provide an explanation for the different resistance behavior. Further investigations are necessary to explain these differences.
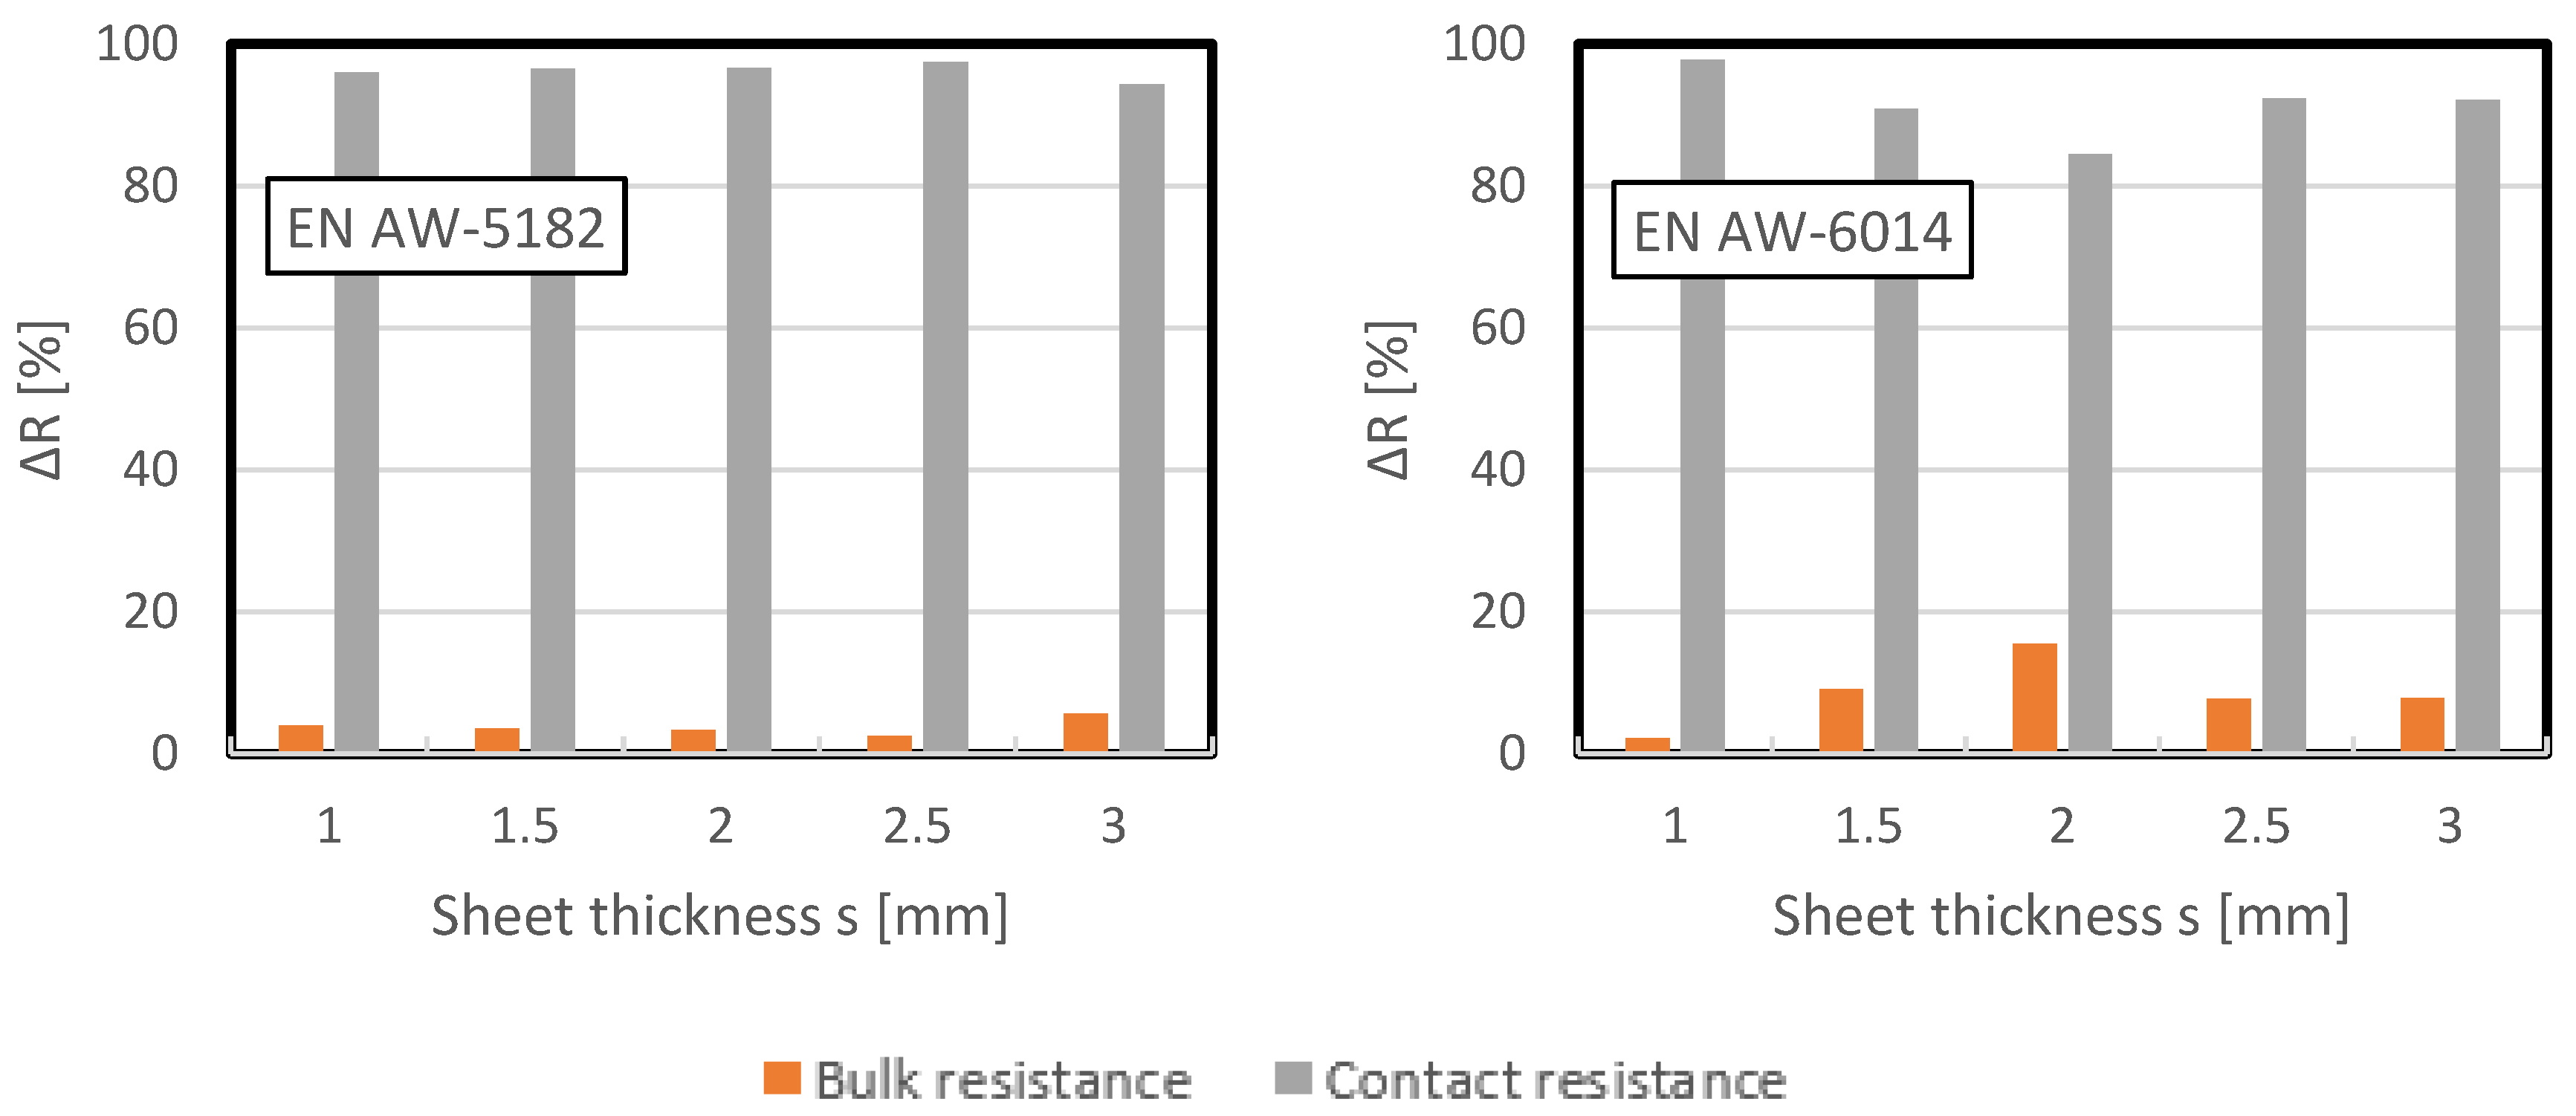
The resistance percentages for each sheet thickness are shown in
Figure 14. It is clear that the bulk resistance for EN AW-6014 accounts for less than 20% of the total resistance and for EN AW-5182 even less than 10%.
As the results show, at the beginning of a weld, the contact resistance is the dominant resistance component of the total resistance. This has been confirmed qualitatively several times in the literature [
3,
11,
13,
21]. However, the exact proportion of resistance can also be determined quantitatively using the method presented here. This makes it possible to determine whether the material in question contains a pronounced oxide layer or a passivation layer if the passivation is unknown. According to Eichhorn et al. (Ref. [
27] cited from [
11]), the contact resistances without a passivation layer are significantly higher due to the oxide layer. Fluctuations in the contact resistance are already apparent with the measurement of the total resistance due to the low proportion of bulk resistance, which is significantly lower with passivated sheets than with unpassivated sheets (Ref. [
3,
27] cited from [
11]).
4. Conclusions
Experimental tests were carried out to determine the total resistance and the bulk resistance of the aluminum alloy EN AW-5182 and EN AW-6014. An analytical comparison of the two measurement results is not possible due to the different sample shapes and the lack of knowledge about the current flow propagation. Therefore, a simulation model was set up to be able to compare the measurement results with each other. This method, encompassing two experimental tests and a simulation model, has the following characteristics:
The total resistance can be divided into bulk and contact resistance in the initial state before welding;
The resistance division only applies to the initial state of a sheet metal;
Easy to use, but time-consuming (two different experiments and one simulation);
It can also be applied at higher temperatures if measurement data are available;
It can also be applied for other electrically conductive materials, such as steel, provided measurement data are available;
Cannot be applied for non-conductive materials;
The quality of the results is only as good as the quality of the measurement data;
It does not provide information on the resistance components regarding welding behavior.
The method demonstrated that the contact resistance before welding (in the initial state of a sheet metal) is significantly greater than the bulk resistance. With the help of this method, the influence of surface conditions, such as oxide layer, impurities, or surface roughness, can also be investigated more precisely in future work. To obtain information at higher temperatures, experimental data at higher temperatures are required. In order to draw conclusions about the welding process, the use of AI methods is sought. The characterization data must be linked to the welding process data and made accessible to AI.
In order to avoid the use of simulations to compare measurement data, it would make sense to design a standardized sample geometry for both measurement methods in future research. This would simplify the comparison of measurement data enormously and save time and resources.
