Abstract
Friction stir lap welding has been utilized across research and industry for over a decade. However, difficulties in welding in the lap configuration without an interface-related defect have prevented the process from moving beyond low feed rates (generally less than 1.5 m per minute). As a means of making a huge leap in welding productivity, this study will evaluate friction stir welds made at 10 m per minute (mpm), detailing the changes to tool geometries and weld parameters that result in fully consolidated welds. Characterization of the subsequent material properties, namely through optical microscopy, CT scanning, microhardness testing, tensile and fatigue testing, hermetic seal pressure tests, and electron backscattered diffraction, is presented as a means of demonstrating the quality and repeatability of friction stir lap welds made at 10 mpm. Fully consolidated welds were produced at spindle speeds 5.5% faster and 2.9% slower than nominal values and weld depths ranging from 1% shallower to 8.2% deeper than nominal values. Additionally, the loading direction of the weld had a significant impact on tensile properties, with the advancing side of the weld measured to be 16% stronger in lap-shear tensile and 289% fatigue life improvement under all loading conditions measured when compared to the retreating side.
1. Introduction
Electric vehicles (EVs) are becoming more prominent worldwide, with demand increasing every year [1]. Unfortunately, while EVs produce no emissions during use, their manufacturing processes still do, and the pollution produced has a major impact on the environment [2]. This is specifically relevant to the fabrication of EV batteries and battery structures. For instance, the traditional method of joining the cooling tray to the EV battery case is brazing, a joining method that releases pollutants into the environment, especially when performed on industrial scales [3]. Friction stir welding (FSW) is a welding process that would be a suitable replacement for brazing aluminum alloys as it is ostensibly a green process, but, historically, the low feed rates have proved to be a roadblock to implementation for high-volume production.
Since its invention in 1991 by TWI [4], FSW has progressively been implemented for welding various materials at increasingly faster feed rates. In the literature, FSW feed rates of 3 mpm and higher have been defined as “high speed FSW”; however, recent significant increases in feed rates to 10 mpm and beyond have constituted a new definition of “ultra-high-speed FSW” (UHSFSW) [5]. Specifically in joining aluminum, FSW and friction stir lap welding (FSLW) have been extensively researched and implemented in automotive and aerospace areas for their relative weld strength and properties [5,6,7,8,9,10,11,12,13,14,15,16,17,18,19,20,21,22,23,24,25,26,27,28,29,30,31,32,33,34,35,36,37,38,39,40,41,42,43,44,45,46,47,48,49,50,51,52,53,54]. Figure 1 shows diagrams of both the butt weld and lap weld configurations. FSLW and UHSFSW discussed in this study both refer to friction stir welds that have been made in the lap configuration.
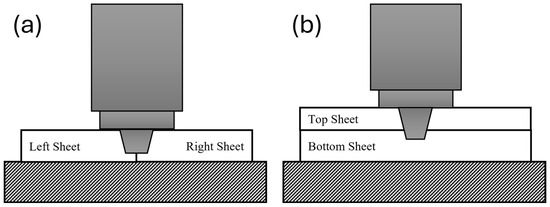
Figure 1.
Diagram of (a) butt configuration and (b) lap configuration friction stir welding.
As different aluminum alloys and thicknesses require unique weld parameters to efficiently weld, one parameter set cannot be utilized for every application. However, a look into the feed rates and spindle speeds of the various applications in the literature for both the butt and lap configurations can lend insight into the general trends and further improvements to the process. Figure 2 depicts the feed rates and associated spindle speeds of parameter sets utilized across the literature for various applications and materials with the current work denoted by an orange triangle [5,6,7,8,9,10,11,12,13,14,15,16,17,18,19,20,21,22,23,24,25,26,27,28,29,30,31,32,33,34,35,36,37,38,39,40,41,42,43,44,45,46,47,48,49,50,51,52,53,54].
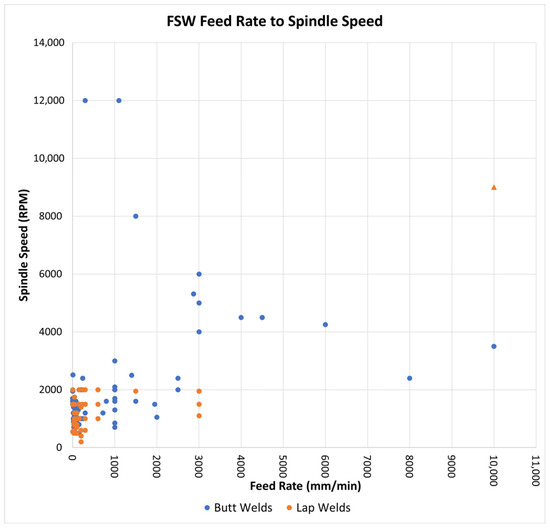
Figure 2.
Collection of weld parameters used in research across the literature. Blue denotes the butt weld configuration; orange denotes the lap weld configuration.
Figure 2 demonstrates that welds made in the butt configuration, shown in blue, have moved beyond 1 mpm into high-speed FSW. Patel et al. performed research on AA6063-T6 towards manufacturing EV battery cooling packs at 4 and 4.5 mpm [6,7]. Zhang et al. characterized welds made at 6 mpm in AA6111-T4 [8]. Von Strombeck et al. performed void-free welds made at 10 mpm in AA5754 H111 and fully characterized welds made at 8 mpm in AA6184-T4 [9].
Figure 2 depicts that few studies in the literature that have utilized FSLW at feed rates above 1 mpm. Das et al. welded a multi-stack aluminum setup made of AA7055, AA7055, and AA6022 at 1.5 mpm, aiming to reduce the weight of car frames [10]. Hovanski et al. characterized welds in AA5182-O at 3 mpm, exploring the effects different tool geometries have at such high speeds [11]. Upadhyay et al. performed welds made in AA7055-T765 and AA5754-O at 3 mpm, documenting the effects of weld parameters and tool geometries on material properties [12]. Lainhart et al. performed welds in AA6061-T4 at 10 mpm, defining welds made at this feed rate as ultra-high-speed friction stir welding and is a precursor to the current study [5].
A challenge facing FSLW is the formation of an interfacial defect known as hooking. A hook defect is an unbonded section in the weld that is similar to a crack. Depicted in Figure 3, this defect type occurs when the oxidized surfaces of the interfacing sides do not get broken up and stirred sufficiently [13].

Figure 3.
Example of hooking defects present in an FSLW interface.
Hooking has been documented to appear as an upturn or downturn in the weld interface [12,14,15,16,17,19]. The defect thins and weakens the weld material and is often a focal point for cracks when the weld is put under load. Various measures have been implemented across the literature to reduce or eliminate the defect, from performing a second weld to fill in the hooking defect [14,15,18] to changing process parameters such as spindle speed and feed rate to reduce the heat input in the weld [13,17,18,19].
Gao et al. made an FSLW that contained a hooking defect and then performed a second pass over the location of the hook in an attempt to eliminate the defect [15]. It was reported that a second FSLW over the hook eliminated the defect and led to an increase in mechanical properties compared to welds containing the hook defect. Ericsson et al. demonstrated that welds made over the same location as a previous FSLW experienced a similar strengthening in mechanical properties compared to welds known to contain hooking [14].
Ghiasvand et al. reported that, as the heat input decreased through an increase in the feed rate and a decrease in spindle speed, the hook height decreased [18]. When comparing the effects of a single pass or double pass weld, the hooking height was smaller, with a single pass at high feed rates and low spindle speeds. Fadaeifard et al. demonstrated that the hooking defect increased in size with faster spindle speeds, beginning at 900 RPM, and could be mitigated by welding at slower rotational speeds [19]. Zhou et al. also demonstrated the hooking defect forming at 800 RPM and increasing in size as the spindle speed increased [17]. Song et al. made an in-depth analysis of hook defects and void defects, observing the characteristics, causes, and potential methods of avoiding defects. They recommended that the heat input be lowered to decrease the hook propagation [13].
This study demonstrates that the requirement to reduce the spindle speed to eliminate the hooking defect is detrimental to faster feed rates, as welding at feed rates beyond 3 mpm requires a near proportional increase in spindle speed. Similarly, while performing a secondary weld over the first weld has been demonstrated to be successful at eliminating the hooking defect, it doubles the cycle times in production. This study demonstrates that tool design and process parameters can be used to eliminate the hooking defect while simultaneously enabling an increase in weld productivity. Furthermore, the characterization of welds performed at 10 mpm demonstrates repeatability and process stability at these high production speeds. As the conclusions of this study are contrary to previously accepted trends for FSLW, namely demonstrating that increasing speed and rotational velocity can be achieved without inducing a hooking defect, significant details regarding tooling, fixturing, and process parameters are presented to fully establish these trends. Finally, the findings in this study will alter our understanding of how to significantly increase linear velocities for FSLW, as a basis for more widespread industrial applications.
2. Methodology
2.1. Material
The material used for this study was AA6061-T4 sheet. Both 1.2 mm sheet (top) and 1.8 sheet (bottom), as depicted in Figure 4, were used as the baseline stack up. In all subsequent figures, the advancing side (AS) of the weld will be labeled, with the retreating side (RS) included as necessary.
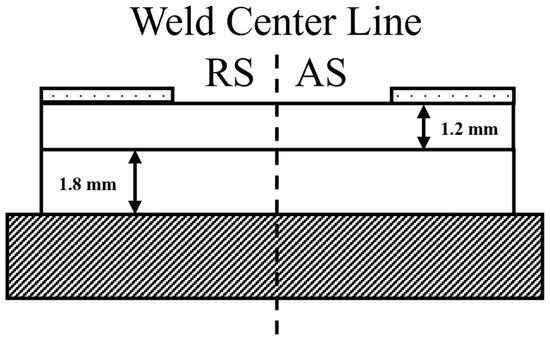
Figure 4.
Baseline weld stack up.
The chemical composition and relative strength of the AA6061-T4 material are provided in Table 1 and Table 2, respectively. The strength of the base material was assessed in compliance with standardized specimens per ASTM E8/E8M-24 [55].

Table 1.
Chemical composition of AA6061-T4 [56].

Table 2.
Base material strengths.
2.2. Machine
The machine used to perform welds throughout this study was a Mazak VTC-300C FSW located in Mazak Megastir’s facility in Provo, Utah, USA, depicted in Figure 5, with the machine specs provided in Table 3. The machine contained a built-in function for FSW that originally had a soft feed rate limit of 7 mpm. Working with Mazak, that soft limit was lifted to allow FSW at ultra-high feed rates up to 11 mpm. Initial validation of the machine capabilities demonstrated no distinguishable changes in feed rate while moving around corners as small as a 13 mm radius during welding. As the machine is a three-axis gantry-style frame, there is no available option to impose tool tilt, requiring the use of zero-tilt tools. Due to its high-speed capabilities, large capacity, rigidity, and precision, this machine was well suited to perform UHSFSW.
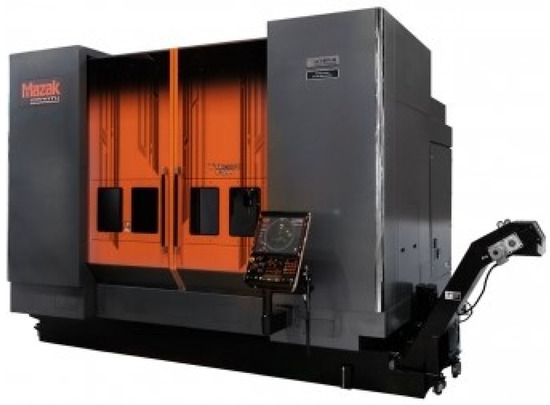
Figure 5.
Mazak VTC-300C FSW.

Table 3.
Specs for Mazak VTC-300C FSW.
2.3. Weld Setup
2.3.1. Welding Anvil
The anvil upon which all welds were made was a 25 mm thick A36 Low-Carbon Steel plate surface machined for flatness. To protect the machine table and lift the anvil to a height at which the machine can weld, steel square tubes were surface ground for flatness and placed under the anvil. Figure 6 depicts holes threaded through the tubes and around the perimeter of the anvil to aid in securing the system to the machine table and clamping along the anvil surface. Push pins were utilized to create an origin point for standardization of weld setups.

Figure 6.
600 mm × 450 mm welding anvil lifted on steel tubes with push pins inserted into surface.
The resulting welding area available on the anvil was 500 mm × 300 mm, measuring a maximum variation in flatness of 0.09 mm across the entire surface. The clamps depicted in Figure 7, Figure 8, Figure 9 and Figure 10 and utilized in all setups were standard finger clamps, holding down varying lengths of 25 mm wide, 12.5 mm thick steel bars on the top sheet. Apart from the Tensile Sample Setup described later, all setups were similarly arranged, as depicted in Figure 4.

Figure 7.
Weld setup with 250 mm × 300 mm weld area. The steel bar clamps around the perimeter provided sufficient support to run welds from top to bottom and around the perimeter of the weld area.
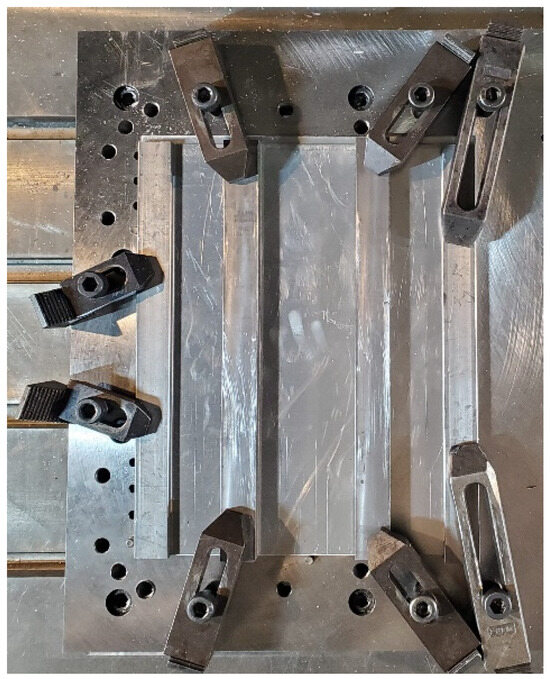
Figure 8.
Setup with four clamps down the length of the weld area. A maximum of five line-path welds made from top to bottom could fit in the weld area.
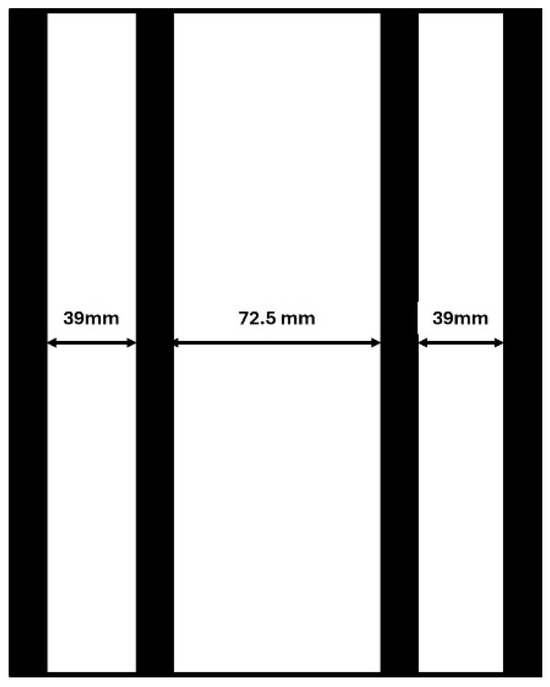
Figure 9.
The setup from Figure 8 with space between steel strips dimensioned.

Figure 10.
Weld setup with 180 mm long welding area between clamps. The weld area allowed for a single weld made from left to right.
2.3.2. Weld Setups
Three main setups were used to perform testing throughout the duration of this study. Figure 7 depicts a setup later denoted as “parameter set up” or “box path set up”. The setup was clamped around the perimeter with a weld area of 250 mm × 300 mm.
Figure 8 depicts a setup denoted as the “4-clamp set up”. The setup had steel strips spaced out, as diagramed in Figure 9, and could have a maximum of 5 welds made per setup. The added clamps around the welds prevented crimping and buckling around the welds and aided in maintaining the weld quality vital for retrieving different material properties for each test run, including microhardness, grain refinement and orientation, and weld interface consolidation.
The setup utilized for creating weld samples to obtain tensile and fatigue properties is depicted in Figure 10. Labeled as “Tensile Sample set up”, the setup consisted of 100 mm wide, 500 mm long sheets clamped just over the edge of the sheets to prevent interface upturn. This setup contained two configurations, as shown in Figure 11.
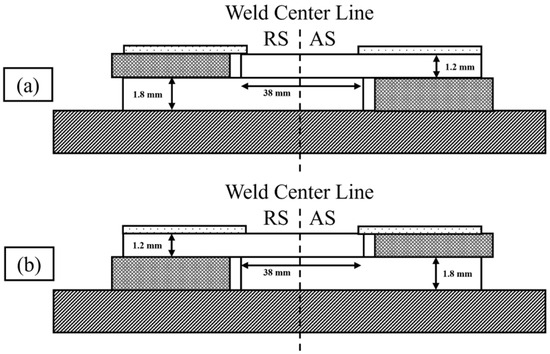
Figure 11.
Weld setup configurations that alternated the position of the AS on the top sheet. The weld configuration in (a) contained the AS in the majority of the top sheet while (b) contained the AS in the majority of the bottom sheet.
The weld configurations were inspired by the work performed by Buffa et al. [20] and D’Urso et al. [21]. In each configuration, the AS of the weld was in different areas of the top sheet. The sheets in both weld configurations were positioned to create a 38 mm area of overlap between the bottom and top sheets with the weld made in the center of the overlap area.
2.3.3. Tooling
In 2006, Fuller et al. patented an FSLW tool design that was proven to eliminate the hooking defect commonly present in FSLW. The patent was later made available for everyone with no restrictions. The pseudo-shoulder tool geometry exemplified in Figure 12 included a wide tool shoulder that sits on the top surface of the material, a pseudo shoulder that sits between the top and bottom sheets, and a smaller pin extending into the bottom sheet [57].
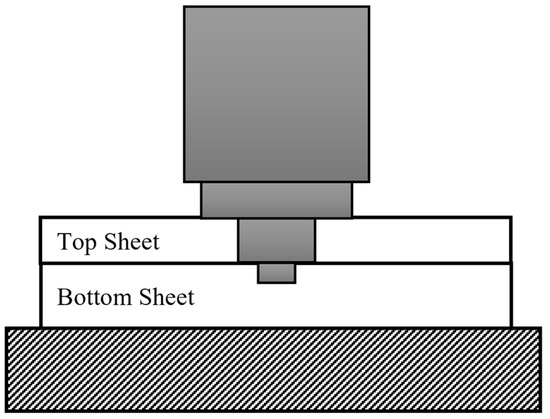
Figure 12.
Diagram of tool geometry patented by Fuller et al. intersects material interface.
The design increased the mixing of the material around the joint and decreased deformation. The tool was originally tested at feed rates under 3 mpm in high-speed steel (HSS) but had not been broadly adopted and lacked implementation and further development at faster feed rates. The tool utilized in all welds characterized in this study was made of Polycrystalline Diamond (PCD) and based on the Fuller et al. design. Table 4 contains the manufactured dimensions of the tool after the laser ablation manufacturing process, associated with Figure 13.

Table 4.
Measured post-production dimensions of tool utilized in UHSFSW.

Figure 13.
Top view of UHSFSW tool after manufacture.
The tool geometry included counterclockwise threads to aid in material mixing, resulting in the AS of each weld being on the right and is denoted as such in resultant weld figures.
2.4. Weld Test Descriptions
All welds were performed in position control. Recognizing that the actual tool depth and the commanded tool depth are slightly different, the actual tool depth during welding is unknown beyond what was commanded. All tests began and ended with at least 25 mm of material between the weld and the edges of the sheet.
2.4.1. MPM Testing
To validate the tool design, 240 mm long welds were initially conducted at a 4 mpm feed rate using both HSS and PCD tool materials on the parameter setup depicted in Figure 7. The parameters for these welds ranged drastically in both spindle speed and weld depth. The weld depth refers to the distance from the surface of the stack up to the tip of the tool. Once the tool design produced fully consolidated and defect-free welds at 4 mpm, some welds were performed at 7 mpm to observe tool and material behavior before welding at 10 mpm. Within this study, “defect-free” indicates the absence of prominent hooking and void defects. At the 10 mpm feed rate, the weld parameters ranged in spindle speed and weld depth until the weld quality was achieved. These welds were cut and polished, then observed via optical microscopy for confirmation of weld consolidation.
2.4.2. Spindle Speed Range Test
Tests were conducted on the 4-clamp setup shown in Figure 8. Two welds were made on the sides of the setup with a 39 mm space between clamps depicted in Figure 9 to ensure the heat produced by each weld did not affect the other weld. The 230 mm long welds were first made at the nominal parameter set as a baseline, then ranged around the nominal spindle speed in 250 RPM intervals up to 1000 RPM above and below the nominal spindle speed, keeping the weld depth at the nominal weld value. Welds were observed via CT scanning and optical microscopy for void detection, then sectioned and analyzed for property characterization.
2.4.3. Weld Depth Range Test
Welds 230 mm in length were made on the 4-clamp setup depicted in Figure 8. The weld placements for this test were the same as the spindle speed range test discussed above. Each test stack up contained a weld made at the nominal parameter set as a baseline, then weld in 0.102 mm intervals around the nominal depth until the weld depth reached 0.306 mm above and below the nominal depth, keeping the spindle speed at the nominal weld value. Up to four welds were made close to the clamps to gain the added support of the clamps. Welds were then analyzed similarly to the procedure described for the spindle speed tests.
2.4.4. Low- and High-Energy Weld Tests
Recognizing that baseline parameters were developed first within the tests discussed previously, the next phase of defining the operational window for the weld procedure specification was to evaluate welds at high- and low-energy inputs. Low-energy-input welds were nominally set to reduce the rotational velocity and minimize the weld depth. High-energy-input welds were designed to maximize the rotational velocity and the weld depth. Table 5 reiterates the parameters of both the low- and high-input energy utilized during welding.

Table 5.
Description of the parameters to be utilized in making low- and high-energy welds.
Under these varying conditions, the entire operational range of parameters for effective welding, defined as minimal variation in weld properties without the appearance of volumetric defects, was defined. Characterization of these welds underwent CT scanning and optical microscopy to validate at which point voids developed within the changing weld parameters.
2.4.5. Tensile Sample Creation Test
As mentioned above, welds used in unguided lap-shear tensile and fatigue testing were made in two separate configurations, placing the AS in different sections on the top sheet. A single weld 460 mm long was made with nominal weld parameters per stack up. These welds were sectioned and analyzed, as described in Section 2.5.8.
2.4.6. Box Path Test
The welds for this test were made at nominal weld parameters and performed on the box path setup. The welds depicted in Figure 14 were coded to form a box with 13 mm radius corners with a crossover 25 mm from the start of the weld. The top sheet for these tests had a section of aluminum refill friction stir welded on the top sheet to create a hermetically sealed thicker section of material that was drilled and tapped for pipe fittings, indicated by the blue circle in the middle of the weld pack in Figure 14.
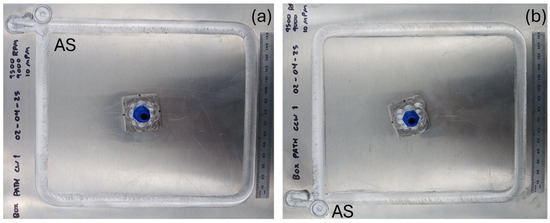
Figure 14.
Box path welds 240 mm × 215 mm in size made in (a) the clockwise direction and (b) the counterclockwise direction.
One path put the AS on the inside of the hermetically sealed material, and another path placed the RS on the inside. Initial weld packs demonstrated that path corners were defect-free with optical cross-sections and CT scans. Subsequent weld packs were pressurized to evaluate the weld strength and hermetic seal.
2.5. Post-Weld Procedures
2.5.1. CT Scanning
To aid in void detection, welds were observed in a Rigaku R_mCT2 CT Scanner. Each scan was four minutes long and was run in high resolution at a 90 kV voltage, an 88 μA current, and a 72 μm voxel size. Any range test had the entire weld scanned before proceeding with further analysis and processing.
2.5.2. Sample Preparation
With few exceptions, welds characterized at the weld interface were sectioned into various lengths on a band saw according to Figure 15. Weld sections 3 and 5 were 9.5 mm long and embedded in 3.78 cm diameter Bakelite pucks.

Figure 15.
Diagram of 250 mm × 12 mm welds cut into seven sections.
The Bakelite was cured at 155 °C for 12 min at 24 MPa pressure. All following post-weld procedures are performed on these pucks unless otherwise specified.
2.5.3. Polishing
Polishing was performed by hand on LECO PX300 Manual Polishers. Samples were polished starting at 400 grit up to 1200 fine on LECO pads. After each grit, the sample was flushed with water and placed in an ultrasonic cleaner for one minute and then flushed again with water to dislodge any debris stuck in the interface around the weld. If a sample was solely observed via optical microscopy, the samples concluded polishing at that point. If samples were to undergo microhardness testing or etching, they were further polished on a LECO felt pad with 1-micron slurry. Finally, for samples observed via Electron Backscatter Diffraction (EBSD), samples were further polished on LECO felt pads to 0.3 microns. Samples were then placed on a vibratory pad with 0.05-micron fluid and polished for at least four hours before analysis.
2.5.4. Etching
Samples were etched for the purpose of achieving a more refined optical observation at the weld interface that depicted the mixing induced by the tool and defect formations (such as voids, hooking, etc.). Samples were etched by Keller’s etchant, for which the chemical make-up is denoted in Table 6, for at least 30 s.

Table 6.
Chemical composition of Keller’s etchant.
2.5.5. Optical Microscopy
Optical microscopy was performed via a Keyence VHX-7000 Microscope. The main use of this technique was to observe defect formation at the weld interface along with the width of the consolidated area at the interface. Most imaging was performed at 10× magnification (mag), with some instances reaching 100× mag, with the area observed being stitched through the microscope’s software. Surface topography of the weld was observed with particular attention paid to 25 mm at the beginning and end of the weld. Additionally, tool profilometry also occurred at 100× mag along with the creation of 3D maps of the tool tip.
2.5.6. Microhardness Testing
Samples that were tested for microhardness were placed in a Suntec CM-402 AT Vickers (HV) microhardness indenter. With the origin in the top-left corner, the hardness test was performed with a 0.25 mm spacing between indents, a 300 g load held for 10 s, and then read at 50× magnification. The resulting hardness map was used in conjunction with EBSD scans to display the hardness of the base material (BM), the heat-affected zone (HAZ), the top area of the weld nugget, and the bottom of the weld nugget in comparison with the respective grain structures.
2.5.7. Electron Backscatter Diffraction
The Electron Backscatter Diffraction of samples made at nominal parameters was performed using an APREO C Scanning Electron Microscope (SEM). After samples were polished as described in Section 2.5.3, they were scanned via EBSD with the microscope settings at a beam voltage of 20 kV, a 6.4 nA beam current, and a 0.2-micron step size in scanning. The scanning locations were determined by the hardness map and are scans of the base material, the HAZ, and the weld nugget.
2.5.8. Tensile and Fatigue Testing
The machine used for both tensile and fatigue testing was an MTS Series 809 Axial/Torsional test system. All samples were clamped with 5.35 cm between grips on the machine, as depicted in Figure 16. Welds were sectioned on a water jet into 25 mm wide, 150 mm long samples, as shown in Figure 17. The sections were 3 mm thick at the weld nugget, as depicted in Figure 11.

Figure 16.
Sample clamped in Axial/Torsional test system.

Figure 17.
Diagram of 450 mm × 12 mm welds cut into 17 sections.
Section 2 was held for optical microscopy, and sections 1 and 17 were not considered due to weld entry and exit features. Sections 3, 4, 9, 10, 15, and 16 were used for tensile coupons. Sections 5, 6, 8, 11, 12, and 14 were used in fatigue testing. Quasi-static testing was performed through unguided lap-shear tensile testing and dynamic testing through unguided lap-shear fatigue testing. For simplicity, these tests will further be mentioned as tensile and fatigue testing.
Tensile tests run until an 80% drop from the peak load condition is detected, terminating the tensile test. The max load was documented for each sample tensile tested and then averaged to obtain the average max load.
The average max load was used to determine the force applied in fatigue testing. There were two fatigue tests performed: the first was loaded at a peak of 60% and cycled to a minimum of 10% (R-value of 0.1) of the average max load (60% max load); the second condition was loaded from 30% to 10% of the average max load (30% max load). Sections 6, 8, and 12 were used in the 60% max load test, and sections 5, 11, and 14 were used in the 30% max load test.
2.5.9. Pressure Testing
The weld packs containing the FSW path in the shape of a box had an air nozzle threaded into the pack with Teflon tape to seal the interface. They were then submerged and pressurized via regulated shop air beginning at 200 kPa. The pressure increased in 70 kPa intervals and maintained pressure for 30 s before continuing to the next pressure interval. At each interval stage, the packs were observed for air bubble formation indicative of hermetic seal leaks. The packs were pressurized up to 760 kPa (maximum of shop air) or until material rupture.
3. Results and Analysis
3.1. Finalized Tool Design
To modify the tool geometry explained in the patent, as described in Section 2.3.3, to run UHSFSW, tools with various feature dimensions were evaluated for weld performance. Initially, HSS tools were made with a pseudo-shoulder tool design diameter ratio of 12 mm–6 mm–3 mm and 18 mm–6 mm–3 mm, both depicted in Figure 18.

Figure 18.
Dimensioned sketches of experimental tool geometries. (a) is a 12 mm–6 mm–3 mm diameter ratio and (b) is a 18 mm–6 mm–3 mm diameter ratio.
The resulting weld interfaces were too wide and did not consistently contain the stirred material under the widest shoulder. Altering the design ratio to 12 mm–4 mm–2 mm solved the issue. The resultant tool dimensions are given in Table 4. The UHSFSW made with the finalized tool geometry demonstrated the versatility of the tool design created by Fuller et al. [57] in welding across various feed rates.
Welds were initially performed with HSS tools up to 7 mpm to determine the adequacy of the tool geometry before producing a tool with a 12 mm–4 mm–2 mm design ratio in PCD. The HSS tool produced fully consolidated welds, but at 7 mpm, the surface quality decreased due to excessive heating of the tool while welding and material sticking to the tool. Tools made with PCD have an advantage over HSS due to the increased hardness, increased heat transferability of the PCD material, and lower coefficient of friction than the HSS. These material property differences between PCD and HSS allowed for a PCD tool to weld (translate and rotate) faster and for a longer time without damaging the tool or the weld, crucial for welding at UHSFSW.
3.2. Nominal Weld Parameters
Through the performance of tests to determine the weld parameters, as discussed in Section 2.4.1, a nominal parameter set was established and verified through optical microscopy before advancing to a faster feed rate. The optimized nominal parameter sets for the various feed rates evaluated are included in Table 7. All consecutive figures and tables relate to welds performed at nominal parameter values at a 10 mpm feed rate unless otherwise stated.

Table 7.
Weld parameters that resulted in fully consolidated FSLW at various feed rates.
Initially, the tool dwelled at the commanded weld depth for 1 s before moving. Further evaluation of the weld startup demonstrated a need to reduce the rotational velocity of the tool with respect to the commanded rotational velocity during the linear portion of the weld. While several ranges of the plunge rotational velocity were evaluated, a setting of 3000 RPM less than the transversal rotational velocity of the weld was used for all welding reported herein. Furthermore, eliminating the dwell time at the start of the traverse improved the startup sequence, so all welds reported herein had no dwell between the plunge and transverse phases of the welding process. Surface finish was improved when an initial translation spindle speed of 9500 RPM was decreased to 9000 RPM after 100 mm of travel. This change in spindle speed occurred at the end of the weld from Section 4, as indicated in Figure 15 and Figure 17. Finally, the tool extraction spindle speed was reduced from 9000 RPM during the traverse to 2000 RPM to minimize any rapid heat up associated with the time it takes to transition from a horizontal translation to a vertical move.
Welds made with the aforementioned parameters were demonstrated to be fully consolidated through CT scanning and optical microscopy. All welds discussed in this study were made with these nominal parameters, as reiterated in Table 8, unless otherwise indicated.

Table 8.
Nominal weld parameters that produced fully consolidated welds at 10 mpm.
The singular tool utilized in UHSFSW throughout this study is presented in Figure 19. When comparing the tool to its original state depicted in Figure 13, a chip in the wide shoulder is noticeable. It was undetermined whether the chip occurred during welding or through mishandling during transport or storage. Despite this chip, welds were still demonstrated to be defect-free, depicted later in this study, a testament to the capabilities of the tool design.
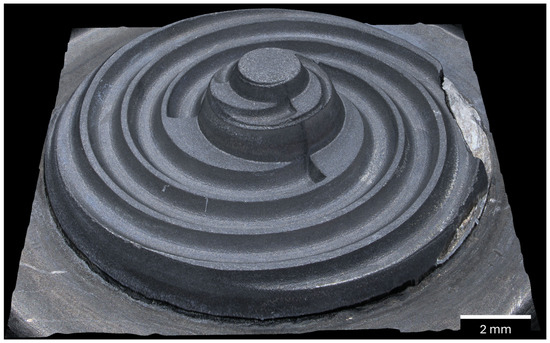
Figure 19.
Optical scan of tool utilized in welding every weld made at 10 mpm.
3.2.1. Optical Microscopy of the Weld Interface
CT scans of welds made at 10 mpm demonstrated there are no voids present throughout the weld interface. Figure 20 depicts an etched optical micrograph of the weld interface, highlighting the mixing present in the weld and further demonstrating a fully consolidated interface with no hooking present. In addition to a lack of a hooking defects at the weld interface, it was apparent through dimensioning the interface, as seen in Figure 21, that neither sheet is thinned during the welding process. Figure 21 also depicts the area of consolidation to be ~10 mm in width, centering around the location of the pseudo shoulder.

Figure 20.
Etching of a weld interface centered around the weld nugget made at nominal parameters, highlighting the notable absence of any hooking or void defects.

Figure 21.
Weld interface dimensioned to highlight the area of consolidation and a lack of thinning of the materials.
Visual analysis of welds made at nominal parameters at 10 mpm and at slower feed rates demonstrated defect-free weld interfaces, proving the tool geometry to be successful at eliminating the hooking defect without sacrificing the feed rate or spindle speed. Furthermore, no additional processing was required to eliminate interfacial defects. As discussed above, the traditional method for eliminating the hooking defect requires lowering the spindle speed and reducing the heat of the weld [13] or running additional welds over the same location [15]. The capability of the FSLW process to create welds with no interfacial defects present allows research and manufacturing processes to be conducted at faster feed rates without the need to moderate process parameters to eliminate the hooking and thinning defects.
3.2.2. Microhardness of the Weld Interface
Microhardness maps of the weld interface of sections 3 and 5, as diagramed in Figure 15, are depicted in Figure 22. Despite a spindle speed change between the weld sections, the microhardness maps demonstrate the weld nugget form, both sections maintaining a hardness of about 60–70 Vickers (HV). The weld nugget is contained in an inverted pyramid shape within the 9–20 mm position at the top of the weld and the 12–17 mm position at the bottom of the weld. The HAZ is ~80–100 HV, contained on the edges of the weld nugget about 3 mm in width. The BM is ~70–90 HV and is any material not contained in the areas previously described.
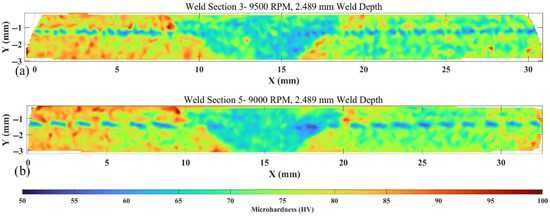
Figure 22.
Microhardness maps of a weld interface made at nominal parameters. (a) depicts the section of the weld made at 9500 RPM, while (b) depicts a weld section made at 9000 RPM.
Based on the starting temper of the AA6061-T4 material, the weld nugget is expected to be the softest area of the weld. Notably, the HAZ is demonstrated to be harder than the base material. The increased hardness in the HAZ is likely caused by the heat input induced on the HAZ while welding, resulting in the material being aged from the T4 state towards a more fully aged temper. Due to the feed rate being so high, the weld is made so quickly that excessive heating of the weld nugget did not occur, explaining the difference in hardness values between the HAZ and weld nugget.
The linear area of low hardness depicted at Y-1 in both microhardness maps in Figure 22 refers to the interface between the material sheets. Figure 22b further depicts the material interface extending into the HAZ, indicating that while Figure 21 demonstrates a consolidation area ~10 mm wide, the true width is ~5 mm, aligning closer to the width of the pseudo shoulder of the tool. It is believed that the discrepancy is caused by a combination of heat and force on the weld nugget creating a visual consolidation of ~10 mm, while mechanical testing demonstrates the area, in actuality, to be ~5 mm.
3.2.3. EBSD of the Weld Interface
The microhardness map of the weld interface was utilized in determining the location of each area of the weld to perform EBSD on the interface of a nominal weld made from the parameters described in Table 7. Figure 23 and Table 9 describe the areas of the weld that underwent EBSD.

Figure 23.
Microhardness map with fiduciary marks overlayed to locate areas of interest for EBSD.

Table 9.
Locations of fiduciary marks to locate areas of interest for EBSD.
Each EBSD scan was made near the fiduciary mark to observe the grain structure of the various areas of the weld. The scan made in the weld nugget section was made between the two fiduciary marks in order to observe the mixing of both the top and bottom of the weld nugget. Figure 24, Figure 25 and Figure 26 are representative of the grain sizes of the various areas of the weld.
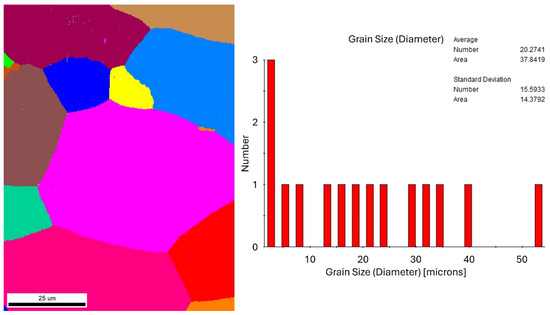
Figure 24.
Grain sizes of the BM of a UHSFSW.
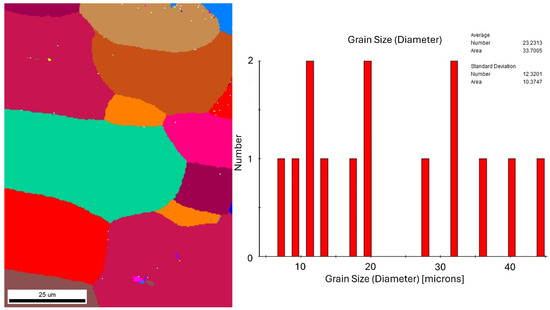
Figure 25.
Grain sizes of the HAZ of an UHSFSW.

Figure 26.
Grain sizes of the weld nugget of an UHSFSW.
The grain sizes in the base material and HAZ average around 33–37 microns, which demonstrates that the heat input into the HAZ is not causing abnormal grain growth. A comparison of the grain sizes in Figure 24 and Figure 25 further demonstrates that the stress and heat induced through welding had no adverse effect on the material surrounding the weld beyond aging the HAZ from the T4 state towards a more fully aged temper.
The weld nugget has an average grain size of 2 microns across the interface between material sheets. This grain refinement is on par with grain sizes recorded in other studies [10,15] utilizing AA6061 to perform FSLW at slower feed rates. The refined grain sizes of the weld nugget demonstrate that welds made at UHSFSW maintain the material characteristics also found at slower feed rates.
3.2.4. Unguided Lap-Shear Tensile Testing
Figure 27 depicts the typical fracture modes the samples utilized in tensile testing experienced.
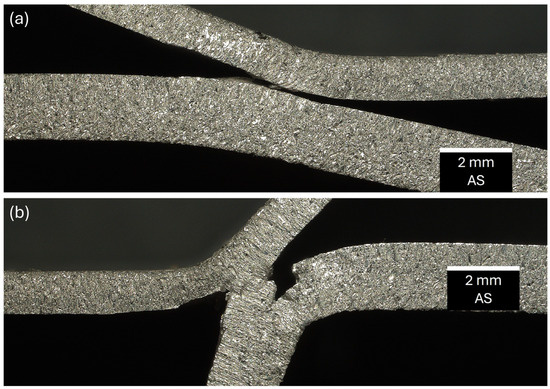
Figure 27.
Fracture modes of weld tensile samples. (a) was made in Configuration A and experienced full interfacial shear fracture. (b) was made in Configuration B and experienced nugget fracture before full interfacial shear.
The sections of the weld made in Configuration A (when the AS is loaded), as depicted in Figure 11, experienced full interfacial shear. This fracture was typical of all welded tensile coupons from Configuration A. For weld coupons made in Configuration B (when the RS is loaded), the samples fractured at the weld nugget. Tensile testing continued after the initial fracture until a load drop of 80% from the peak loading condition was measured, which triggered the end of the tensile program.
The tensile data of each sample tensile tested are recorded in Table 10. The results indicate a consistency of strength across the length of the weld for each weld configuration, despite the spindle speed change after weld section 4. Additionally, Configuration A was demonstrated to have a max load ~900 N stronger than Configuration B. A difference in max loads between weld configurations has also been shown in research by Buffa et al. [20] and D’Urso et al. [21]. This difference in the max load between weld configurations is caused by loading the AS on the top sheet as in Configuration A or the RS on the top sheet as in Configuration B. The difference in material properties was further made apparent when observing the fatigue properties of the weld.

Table 10.
Unguided lap-shear tensile results.
3.2.5. Unguided Lap-Shear Fatigue Testing
The forces utilized to perform the fatigue tests were calculated from the average max load of the tensile samples and are contained in Table 11. The samples were kept in tension for the duration of the test to prevent buckling. Figure 28 depicts the typical fracture modes experienced by the samples that underwent fatigue testing.

Table 11.
Forces utilized for unguided lap-shear fatigue testing.

Figure 28.
Fracture modes of weld fatigue samples. (a,c) were made in Configuration A. (b,d) were made in Configuration B. (a,b) were loaded at 60% max load. (c,d) were loaded at 30% max load. (a) fractured at the nugget in the top sheet. (b–d) fractured at the nugget in the bottom sheet.
For the 60% max load fatigue tests, the samples taken from Configuration A typically shear fractured in the top sheet at the nugget without significant deformation of the weld interface compared to samples from Configuration B. The samples from Configuration B typically shear fractured at the nugget in the bottom sheet. The 5 mm wide area of consolidation in the weld nugget appeared to be wide enough to force cracks to propagate from top to bottom through the weld interface, instead of across.
For the 30% max load fatigue tests, both configurations shear fractured at the nugget in the bottom sheet, with Configuration A experiencing less deformation than Configuration B at the weld interface.
In both the 60% max load and 30% max load fatigue tests, Configuration A was proven to have a longer fatigue cycle than Configuration B. Table 12 contains the results for both fatigue tests and indicates that Configuration A has a ~9000 longer average lifecycle than Configuration B in the 60% max load fatigue test and a ~350,000 longer average lifecycle in the 30% max load fatigue test.

Table 12.
Results for unguided lap-shear fatigue testing.
Figure 28 demonstrates that the fracture point in UHSFSW occurred in the nugget, as opposed to in the HAZ, which is traditionally the softest part of the FSW in AA6xxx [9,15]. In lap welds experiencing hooking in the HAZ, this was also a typical fracture focal point [15]. Based on the grain sizes portrayed in Figure 25 and Figure 26, and the microhardness maps depicted in Figure 22, it is determined that due to the increased hardness and the larger grain sizes the HAZ has over the weld nugget, the weld nugget is the prime location for fracture points occur. The benefit to this phenomenon is that the refined grain structure inherent in the weld nugget requires an extended load time to propagate a crack across the entirety of the interface, resulting in an extended fatigue lifecycle.
The tensile and fatigue properties of the different weld configurations indicate that the AS has a clear advantage over the RS when put under load and should be acknowledged when planning the welding direction in production.
3.2.6. Box Path Pressurization
To simulate the pressure that welds would undergo in an EV cooling pack, weld packs with a weld made around the perimeter in a box path were pressurized with shop air. Figure 29 depicts the weld packs before and after pressurization.
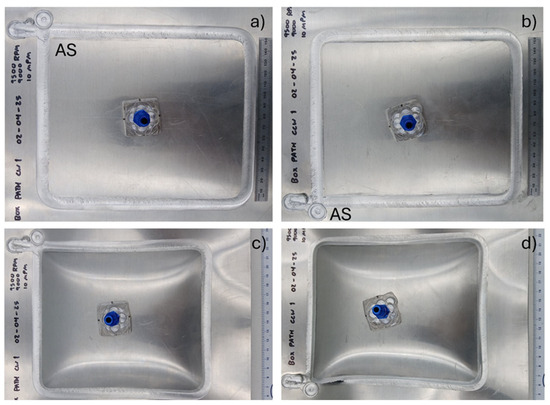
Figure 29.
Weld packs with a weld in a box path before and after pressurization. Each box path was 240 mm × 215 mm in size. (a,c) were made in a clockwise direction. (b,d) were made in a counterclockwise direction. (c,d) depict the weld packs post-pressurization.
The clockwise path (CWP) with the AS on the inside of the area pressurized withstood pressures up to 758 kPa without rupture, although deformation began at 275 kPa. The counterclockwise path (CCWP) with the AS on the outside of the area also began deforming at 275 kPa before it ruptured at 655 kPa. The CCWP fractured at the corner created by the crossover of the weld path, depicted in the bottom-left corner of Figure 29d, which is a natural stress concentrator. Regardless, the CWP withstood these stresses without fracturing. The pressurization results are a further testament to the strength effect of the directionality of loading on Configurations A and B that was first alluded to in the discussion on tensile and fatigue properties. Despite added heat and stress from the tool remaining in the corners for a longer duration, the weld corners of both weld paths withstood the pressure induced on the weld pack.
With EV battery cooling packs often rated up to 200 kPa, even the CCWP has a safety factor of 3 before rupture. The weld behaviors under pressurization are consistent with the findings in the tensile and fatigue tests that demonstrated the stronger sample orientation is when the AS is on the side being tested. Ensuring that the welds crucial for structural integrity follow the design path of Configuration A and the CWP path in Figure 29a will be critical for manufacturers, as designs are made towards the lower strengths inherent in the weak side of the weld but utilize the increased strength that the AS side provides.
3.3. Weld Parameter Ranges
To account for natural variations in production, a set of weld parameters above and below nominal values was determined that resulted in fully consolidated and defect-free welds. The respective results from the spindle speed and weld depth range tests provided a set of parameters, noted in Table 13.

Table 13.
Weld parameters that resulted in defect-free FSLW from the spindle speed and weld depth range tests.
In previous reports of this work, defect-free welds were notably achieved at weld depths ± 0.203 mm around the nominal depth [5]. At that point in the study, CT scanning had only been performed on welds made at nominal weld parameters, and parameter ranges were only validated through optical microscopy. Since then, CT scanning of welds made at shallower weld depths has demonstrated intermittent voids throughout the length of the weld, resulting in sporadic areas of full consolidation, one of which was unknowingly utilized in validating the aforementioned weld depth. All current welds utilized in validating weld parameter ranges were CT scanned before performing additional analysis.
The weld range parameters were combined to determine whether defect-free welds could be produced. Welds made at a spindle speed of 9500 RPM and weld depth of 2.693 mm were determined to result in fully consolidated welds. These welds are later discussed as high-energy welds. However, welds made at 8500 RPM spindle speed and 2.438 weld depth were proven via CT scanning to contain intermittent void formation along the weld length. Through additional testing, it was determined that the lightest weld depth and lowest spindle speed that result in a fully consolidated weld are 2.464 mm and 8750 RPM, respectively. These welds are further discussed as low-energy welds.
Table 14 contains the weld parameters that are recommended for fully consolidated and defect-free welds when implementing UHSFSW in production. While all welds made during testing were through position control, the process would benefit greatly from heat and load control implementation within the recommended parameters.

Table 14.
Weld parameters that result in fully consolidated, defect-free welds.
Figure 30 and Figure 31 depict the weld interfaces of the high- and low-energy welds, respectively. Notable in both interfaces is the area of consolidation, measuring about 4.5–5.5 mm in width, closely aligning with the width of the pseudo shoulder.

Figure 30.
Weld interface of high-energy weld with area of consolidation dimensioned.
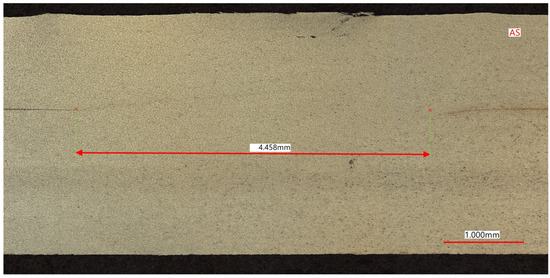
Figure 31.
Weld interface of low-energy weld with area of consolidation dimensioned.
The areas of consolidation of these welds are similar to the area of consolidation of welds made at nominal parameters, indicating that any weld made with parameters within the boundaries denoted by Table 14 will have inherent material properties similar to those described for nominal welds, allowing manufactures to run weld parameter control programs and natural parameter variation in the production process while maintaining fully consolidated welds.
3.4. Weld Surface Defect
First observed on welds made at 7 mpm, there appeared to be a lack of consolidation (LOC) defects along with excessive flash along the edges of the weld at the beginning 25 mm of every weld. This startup defect was present in all welding conditions at feed rates of 7 mpm and above. Figure 32 depicts this LOC defect.

Figure 32.
Profilometry measurements of surface LOC defect found at the beginning of UHSFSW.
This defect occurred due to a combination of excessive plunging, excessive heat, and fast feed rates. In FSW, as the feed rate increases, the tool tends to rise in the material. Force control algorithms account for this phenomenon and keep the tool at the commanded depth. As the welds performed throughout this study were made in position control, the excessive weld depth was required to allow the tool to rise to the desired position at the material interface. Before action was taken to remove the LOC defect, it ranged from 20 mm to 44 mm in length. Another effect of the excessive weld depth is excessive flash around the extraction point of every weld. Depicted in Figure 33, the circular hole is a common feature in most FSW processing, known as a keyhole.

Figure 33.
Surface profilometry of keyhole defect found at the end of UHSFSW.
The flash occurred due to the tool settling at the end of the weld process, as the feed rate decreased and the tool dropped back to the commanded weld depth. Figure 33 demonstrates a profile in the keyhole closely resembling the shape of the tool geometry, with the main shoulder settling 800 microns below the surface of the weld. The tool deposited the material displaced by settling around the edge of the keyhole as it extracts from the material.
Tests were conducted to reduce the heat input at the beginning of the weld, aiming to eliminate the LOC defect, by reducing the plunge dwell time. Welds were made at the lowest spindle speed parameter range, provided by the spindle speed range tests at nominal weld depth, on the four-clamp setup. Five welds 24 cm long were made per weld pack, starting with the nominal parameters and reducing the weld plunge time by 0.1 s for each subsequent weld. As the focus on the test was on the surface quality and not interfacial, simple weld observations and CT scanning were sufficient for quality confirmation. The parameters and results of these tests are contained in Table 15. To further reduce the heat input at the beginning of the weld, a tool-cooling procedure was implemented, where shop air was blown on the tool spinning at 100 RPM for ~1 min.

Table 15.
Parameters and results of the plunge dwell time reduction tests.
The LOC defects consistently remained ~ 20 mm in length once the plunge dwell time was 0.1 s and the tool cooling procedure was implemented. There were no detrimental effects observed from eliminating the plunge dwell time, which led to all welds characterized in this study to be made with no plunge dwell time. Thorough CT scanning of multiple welds with various weld parameters demonstrated that the initial LOC defect was contained within 25 mm at the start of the weld and did not affect the consolidation further along the weld. The keyhole defect at the end was contained around the dimensions of the tool at the end point and did not affect the quality of the rest of the weld.
Although the LOC defect remained, a shorter dwell time during the plunge resulted in the LOC maintaining a length of ~20 mm and notably demonstrated that the dwell time was not essential to welding. Demonstrating that UHSFW did not require dwell time during the plunge led to additional time savings. Both the LOC defect and keyhole could be removed with ramping programs affecting the spindle speed and weld depth. Attempts were made to implement these programs throughout various tests, but initial attempts at manual code overloaded the PLC controller and caused stalls during the weld.
Assumptions made for this work were based on the start and end points of the weld being located in areas of negligible importance or on runoff tabs to maintain the high cycle times inherent in UHSFSW.
4. Conclusions and Future Work
Historically, FSLW was not viable at feed rates beyond 3 mpm due to prevalent defects such as hooking and thinning in the welds. These defects often required reducing the tool spindle speed or making additional weld passes to eliminate them completely. Utilizing a pseudo-shoulder tool demonstrated an ability to eliminate the hooking defect in FSLW in a single pass weld. Fully consolidated welds were achieved at feed rates of 4 mpm to 10 mpm. A more widespread implementation of the tool geometry would allow researchers and manufacturers to allocate resources from achieving defect-free welds to additional efforts on research and production.
Welding at faster speeds allows FSW to become a viable joining process in high-volume automotive production, replacing welding techniques that contribute to the pollution of the environment. As FSW is an ostensible green process, its expanded implementation in manufacturing allows car manufacturers to achieve zero emissions at a lower cost and pushes towards the further manufacturing of clean vehicles.
Future work in implementing force and heat control algorithms for UHSFSW would be beneficial to account for process variation in production. Implementing ramping programs for both spindle speed and weld depth to eliminate the LOC defect at the beginning and the keyhole defect at the end of UHSFSW would also benefit the process. Understanding and quantifying the wear put on the PCD tool would also provide more information to manufacturers implementing UHSFSW in production.
This study demonstrated the following specific conclusions:
- The pseudo-shoulder tool geometry of 12 mm–4 mm–2 mm made from PCD was capable of welding defect-free at 4 mpm to 10 mpm feed rates.
- Fully consolidated and defect-free welds were made at 10 mpm, with a nominal parameter set of 9000 RPM spindle speed and a 2.489 mm weld depth with the PCD tool material.
- The HAZ of AA6061-T4 welds produced using nominal parameters was ~20 HV harder than other sections of the weld and, thus, prevented fracture points originating in the HAZ.
- Weld nuggets of UHSFSW were demonstrated to have a refined grain structure of ~2 microns that provide resistance against crack propagation in comparison to the base material, which demonstrated a grain size of ~38 microns.
- The AS of UHSFSW demonstrated superior performance compared to the RS in all loading conditions evaluated in this study, under both quasi-static and dynamic loading conditions.
Author Contributions
Conceptualization, T.L. and Y.H.; data curation, T.L.; formal analysis, T.L.; funding acquisition, J.R., J.C. and Y.H.; investigation, T.L. and J.S.; methodology, T.L. and J.S.; project administration, T.L. and Y.H.; resources, Y.H.; supervision, Y.H.; validation, T.L. and J.S.; visualization, T.L.; writing—original draft, T.L.; writing—review and editing, T.L., J.R., J.C. and Y.H. All authors have read and agreed to the published version of the manuscript.
Funding
This research was funded by the NSF IUCRC—Center for Friction Stir Processing under account #GR00277 through Brigham Young University Friction Stir Research Lab.
Data Availability Statement
Data are contained within the article. The original contributions presented in this study are included in the article. Further inquiries can be directed to the corresponding author.
Acknowledgments
Sponsoring organizations within the Center for this project included Toyota, Mazak-MegaStir, and TWB Company. These organizations provided funding, equipment, material, project management and engineering expertise that were vital to the success of this study. Additional thanks to Russell Steel and Dale Fleck from Mazak-MegaStir for providing use of the welding machine and technical expertise in welding. We also acknowledge the BYU Electron Microscopy Facility for providing access to the equipment and expertise that allowed this project to be performed, with a special thanks to Paul Minson and Miachael Standing for lending their expertise in obtaining EBSD scans.
Conflicts of Interest
Authors Jeremy Russell and Jeremy Coyne were employed by Toyota Motor North America company. The remaining authors declare that the research was conducted without any commercial or financial relationships that could be construed as a potential conflict of interest.
References
- Connelly, E.; Jenness, E. Electric Vehicles. Available online: https://www.iea.org/energy-system/transport/electric-vehicles (accessed on 13 May 2025).
- Schnakenberg, J.H. Deciphering the Carbon Footprint of Car Manufacturing. Available online: https://go.ipoint-systems.com/blog/carbon-footprint-car-manufacturing (accessed on 13 May 2025).
- EAA, EAA Aluminium Automotive Manual—Joining. Available online: https://aec.org/sites/default/files/2022-05/6-Brazing_2015.pdf (accessed on 13 May 2025).
- Thomas, W.M.; Nicholas, E.D.; Needham, J.C.; Murch, M.G.; Temple-Smith, P.; Dawes, C.J. Friction Welding. U.S. Patent No. 5,460,317, 24 October 1995. [Google Scholar]
- Lainhart, T.; Sheffield, J.; Gariety, D.; Namola, K.; Steel, R.; Coyne, J. Hovanski, Characterizing Welds and Parameters of Ultra High-Speed Friction Stir Welding in the Lap Welding Configuration. In Friction Stir Welding and Processing XIII; Hovanski, Y., Sato, Y., Upadhyay, P., Kumar, N., Naumov, A.A., Eds.; Springer Nature: Cham, Switzerland, 2025; pp. 27–41. [Google Scholar]
- Patel, V.; De Backer, J.; Hindsefelt, H.; Igestrand, M.; Azimi, S.; Andersson, J.; Säll, J. High-speed friction stir welding in light weight battery trays for the EV industry. Sci. Technol. Weld. Join. 2022, 27, 250–255. [Google Scholar] [CrossRef]
- Patel, V.; De Backer, J.; Hindsefelt, H.; Igestrand, M.; Azimi, S.; Andersson, J.; Säll, J. High speed friction stir welding of AA6063-T6 alloy in lightweight battery trays for EV industry: Influence of tool rotation speeds. Mater. Lett. 2022, 318, 132135. [Google Scholar] [CrossRef]
- Zhang, J.; Hovanski, Y.; Upadhyay, P.; Field, D.P. Local Texture Evolution and Mechanical Performance of Ultra-High-Speed Friction Stir Weld of AA 6111-T4 Sheets. In Characterization of Minerals, Metals, and Materials; The Minerals, Metals & Materials Series; Springer International Publishing: Cham, Switzerland, 2018; pp. 249–257. [Google Scholar]
- Von Strombeck, A.; Sheikhi, S.; Dos Santos, J. Effect of welding speed on the properties of friction stir welded tailored blanks. In Proceedings of the 4th International Symposium on Friction Stir Welding, Park City, UT, USA, 14–16 May 2003. [Google Scholar]
- Das, H.; Kalsar, R.; Shukla, S.; Anaman, S.Y.; Upadhyay, P.; Cho, H.-H. Microstructure and texture evolution of friction stir lap welded dissimilar multi-aluminum stack. Mater. Charact. 2023, 206, 113398. [Google Scholar] [CrossRef]
- Hovanski, Y.; Upadhyay, P.; Carsley, J.; Luzanski, T.; Carlson, B.; Eisenmenger, M.; Soulami, A.; Marshall, D.; Landino, B.; Hartfield-Wunsch, S. High-Speed Friction-Stir Welding to Enable Aluminum Tailor-Welded Blanks. JOM 2015, 67, 1045–1053. [Google Scholar] [CrossRef]
- Upadhyay, P.; Li, X.; Roosendaal, T. High-Speed Friction Stir Lap Welding of Al Alloys. In Friction Stir Welding and Processing X.; Hovanski, Y., Mishra, R., Sato, Y., Upadhyay, P., Yan, D., Eds.; Springer International Publishing: Cham, Switzerland, 2019; pp. 67–75. [Google Scholar]
- Song, Y.; Yang, X.; Cui, L.; Hou, X.; Shen, Z.; Xu, Y. Defect features and mechanical properties of friction stir lap welded dissimilar AA2024–AA7075 aluminum alloy sheets. Mater. Des. 2014, 55, 9–18. [Google Scholar] [CrossRef]
- Ericsson, M.; Jin, L.-Z.; Sandström, R. Fatigue properties of friction stir overlap welds. Int. J. Fatigue 2007, 29, 57–68. [Google Scholar] [CrossRef]
- Gao, K.; Zhang, Z.; Wang, G.; Sun, X.; Zhang, Y. Enhancing metallurgical and mechanical properties of friction stir lap welding of aluminum alloys by microstructure reconstruction. Sci. Rep. 2024, 14, 31987. [Google Scholar] [CrossRef]
- Huang, Z.; Sun, S.; Meng, Q.; Wang, J.; Xu, L.; Wang, Z.; Zhou, L.; Guo, N.; Zhao, H.; Dong, J. A study of flow behavior and fracture modes of alclad 2A12 aluminum alloy FSLW joints at different rotational speeds. Eng. Fail. Anal. 2024, 164, 108669. [Google Scholar] [CrossRef]
- Zhou, N. Microstructure-Property Development and Defect Characterization of Al-X Friction Welds for Automotive Applications. Ph.D. Thesis, University of Birmingham, Birmingham, UK, March 2020. [Google Scholar]
- Ghiasvand, A.; Ranjbarnodeh, E.; Mirsalehi, S.E. The microstructure and mechanical properties of single-pass and double-pass lap joint of Al 5754H-11 and Mg AZ31-O alloys by friction stir welding. J. Mater. Res. Technol. 2023, 23, 6023–6038. [Google Scholar] [CrossRef]
- Fadaeifard, F.; Matori, K.A.; Toozandehjani, M.; Daud, A.R.; Ariffin, M.K.A.M.; Othman, N.K.; Gharavi, F.; Ramzani, A.H.; Ostovan, F. Influence of rotational speed on mechanical properties of friction stir lap welded 6061-T6 Al alloy. Trans. Nonferrous Met. Soc. China 2014, 24, 1004–1011. [Google Scholar] [CrossRef]
- Buffa, G.; Campanile, G.; Fratini, L.; Prisco, A. Friction stir welding of lap joints: Influence of process parameters on the metallurgical and mechanical properties. Mater. Sci. Eng. A 2009, 519, 19–26. [Google Scholar] [CrossRef]
- D’Urso, G.; Giardini, C. The influence of process parameters and tool geometry on mechanical properties of friction stir welded aluminum lap joints. Int. J. Mater. Form. 2010, 3, 1011–1014. [Google Scholar] [CrossRef]
- Cantin, G.M.D.; David, S.A.; Thomas, W.M.; Lara-Curzio, E.; Babu, S.S. Friction Skew-stir welding of lap joints in 5083–0 aluminium. Sci. Technol. Weld. Join. 2005, 10, 268–280. [Google Scholar] [CrossRef]
- Dellal, N.; Merzoug, M.; Mimmi, A.; Ghazi, A.; Lousdad, A. Experimental based determination and analysis of mechanical properties of AA 3003 alloy welded with friction stir lap welding process. J. Appl. Eng. Sci. 2023, 21, 451–461. [Google Scholar] [CrossRef]
- Derbiszewski, B.; Obraniak, A.; Rylski, A.; Siczek, K.; Wozniak, M. Studies on the Quality of Joints and Phenomena Therein for Welded Automotive Components Made of Aluminum Alloy—A Review. Coatings 2024, 14, 601. [Google Scholar] [CrossRef]
- Salari, E.; Jahazi, M.; Khodabandeh, A.; Ghasemi-Nanesa, H. Influence of tool geometry and rotational speed on mechanical properties and defect formation in friction stir lap welded 5456 aluminum alloy sheets. Mater. Des. 2014, 58, 381–389. [Google Scholar] [CrossRef]
- Sharma, A.; Dwivedi, V.K.; Singh, Y.P. Effect on ultimate tensile strength on varying rotational speed, plunge depth and welding speed during friction stir welding process of aluminium alloy AA7075. Mater. Today Proc. 2020, 26, 2055–2057. [Google Scholar] [CrossRef]
- Yadava, M.K.; Mishra, R.S.; Chen, Y.L.; Carlson, B.; Grant, G.J. Study of friction stir joining of thin aluminium sheets in lap joint configuration. Sci. Technol. Weld. Join. 2010, 15, 70–75. [Google Scholar] [CrossRef]
- Ahmed, S.; Rahman, R.A.U.; Awan, A.; Ahmad, S.; Akram, W.; Amjad, M.; Yahya, M.Y.; Rahimian Koloor, S.S. Optimization of Process Parameters in Friction Stir Welding of Aluminum 5451 in Marine Applications. J. Mar. Sci. Eng. 2022, 10, 1539. [Google Scholar] [CrossRef]
- Balasubramanian, V. Relationship between base metal properties and friction stir welding process parameters. Mater. Sci. Eng. A 2008, 480, 397–403. [Google Scholar] [CrossRef]
- Barcellona, A.; Buffa, G.; Fratini, L.; Palmeri, D. On microstructural phenomena occurring in friction stir welding of aluminium alloys. J. Mater. Process. Technol. 2006, 177, 340–343. [Google Scholar] [CrossRef]
- Cavaliere, P.; De Santis, A.; Panella, F.; Squillace, A. Effect of welding parameters on mechanical and microstructural properties of dissimilar AA6082–AA2024 joints produced by friction stir welding. Mater. Des. 2009, 30, 609–616. [Google Scholar] [CrossRef]
- Chen, X.; Chen, S.; Liu, Z.; Gao, Y.; Zhang, H. Magnetic field-assisted ultra-high-speed friction stir welding. Mater. Lett. 2023, 331, 133447. [Google Scholar] [CrossRef]
- Elangovan, K.; Balasubramanian, V. Influences of pin profile and rotational speed of the tool on the formation of friction stir processing zone in AA2219 aluminium alloy. Mater. Sci. Eng. A 2007, 459, 7–18. [Google Scholar] [CrossRef]
- Fehrenbacher, A.; Duffie, N.A.; Ferrier, N.J.; Pfefferkorn, F.E.; Zinn, M.R. Effects of tool–workpiece interface temperature on weld quality and quality improvements through temperature control in friction stir welding. Int. J. Adv. Manuf. Technol. 2014, 71, 165–179. [Google Scholar] [CrossRef]
- Golubev, I.; Meyer, A. Process Comparison of Friction Stir Welding, MIG, Laser Beam Welding and Laser Hybrid Welding in Joining Aluminium EN AW-6063 T6. In 2nd International Conference on Advanced Joining Processes (AJP 2021); Springer International Publishing: Cham, Switzerland, 2022; pp. 115–125. [Google Scholar]
- Heidarzadeh, A.; Khodaverdizadeh, H.; Mahmoudi, A.; Nazari, E. Tensile behavior of friction stir welded AA 6061-T4 aluminum alloy joints. Mater. Des. 2012, 37, 166–173. [Google Scholar] [CrossRef]
- Hovanski, Y.; Carsley, J.; Carlson, B.; Hartfield-Wunsch, S.; Pilli, S. Comparing Laser Welding Technologies with Friction Stir Welding for Production of Aluminum Tailor-Welded Blanks. SAE Int. J. Mater. Manuf. 2014, 7, 537–544. [Google Scholar] [CrossRef]
- Hunt, J.; Larsen, B.; Hovanski, Y. Line Nondestructive Testing for Sheet Metal Friction Stir Welding; SAE International: Warrendale, PA, USA, 2023. [Google Scholar]
- Jia, H.; Wu, K.; Sun, Y. Numerical and experimental study on the thermal process, material flow and welding defects during high-speed friction stir welding. Mater. Today Commun. 2022, 31, 103526. [Google Scholar] [CrossRef]
- Jia, H.; Wu, K.; Sun, Y.; Hu, F. Experimental Research on Process Optimization for High-Speed Friction Stir Welding of Aluminum Alloy. JOM 2023, 75, 941–953. [Google Scholar] [CrossRef]
- Kluz, R.; Bucior, M.; Kubit, A. Identifying Optimal FSW Process Parameters for 2024 Al Alloy Butt Joints. Adv. Sci. Technol. Res. J. 2019, 13, 48–53. [Google Scholar] [CrossRef]
- Kumar Rajak, D.; Pagar, D.D.; Menezes, P.L.; Eyvazian, A. Friction-based welding processes: Friction welding and friction stir welding. J. Adhes. Sci. Technol. 2020, 34, 2613–2637. [Google Scholar] [CrossRef]
- Li, H.; Gao, J.; Li, Q. Fatigue of Friction Stir Welded Aluminum Alloy Joints: A Review. Appl. Sci. 2018, 8, 2626. [Google Scholar] [CrossRef]
- Liu, F.; Fu, L.; Chen, H. High speed friction stir welding of ultra-thin AA6061-T6 sheets using different backing plates. J. Manuf. Process. 2018, 33, 219–227. [Google Scholar] [CrossRef]
- Naumov, A.; Morozova, I.; Rylkov, E.; Obrosov, A.; Isupov, F.; Michailov, V.; Rudskoy, A. Metallurgical and Mechanical Characterization of High-Speed Friction Stir Welded AA 6082-T6 Aluminum Alloy. Materials 2019, 12, 4211. [Google Scholar] [CrossRef] [PubMed]
- Rodrigues, D.M.; Leitão, C.; Louro, R.; Gouveia, H.; Loureiro, A. High speed friction stir welding of aluminium alloys. Sci. Technol. Weld. Join. 2010, 15, 676–681. [Google Scholar] [CrossRef]
- Sadeesh, P.; Venkatesh Kannan, M.; Rajkumar, V.; Avinash, P.; Arivazhagan, N.; Devendranath Ramkumar, K.; Narayanan, S. Studies on Friction Stir Welding of AA 2024 and AA 6061 Dissimilar Metals. Procedia Eng. 2014, 75, 145–149. [Google Scholar] [CrossRef]
- Sheikhi, S.; dos Santos, J.F. Effect of process parameter on mechanical properties of friction stir welded tailored blanks from aluminium alloy 6181-T4. Sci. Technol. Weld. Join. 2007, 12, 370–375. [Google Scholar] [CrossRef]
- SHEKHI, S. On the formability of friction stir welded aluminium tailored welded blanks. In Proceedings of the 5th International FSW Symposium, Metz, France, 14–16 September 2004. [Google Scholar]
- Singh, V.P.; Kumar, R.; Kumar, A.; Dewangan, A.K. Automotive light weight multi-materials sheets joining through friction stir welding technique: An overview. Mater. Today Proc. 2023, 2, 171. [Google Scholar] [CrossRef]
- Squillace, A.; De Fenzo, A.; Giorleo, G.; Bellucci, F. A comparison between FSW and TIG welding techniques: Modifications of microstructure and pitting corrosion resistance in AA 2024-T3 butt joints. J. Mater. Process. Technol. 2004, 152, 97–105. [Google Scholar] [CrossRef]
- Vairis, A.; Papazafeiropoulos, G.; Tsainis, A.-M. A comparison between friction stir welding, linear friction welding and rotary friction welding. Adv. Manuf. 2016, 4, 296–304. [Google Scholar] [CrossRef]
- Wright, A.; Munro, T.R.; Hovanski, Y. Evaluating Temperature Control in Friction Stir Welding for Industrial Applications. J. Manuf. Mater. Process. 2021, 5, 124. [Google Scholar] [CrossRef]
- Zhang, J.; Upadhyay, P.; Hovanski, Y.; Field, D.P. High-Speed Friction Stir Welding of AA7075-T6 Sheet: Microstructure, Mechanical Properties, Micro-texture, and Thermal History. Metall. Mater. Trans. A 2018, 49, 210–222. [Google Scholar] [CrossRef]
- ASTM E8/E8M-24; Standard Test Methods for Tension Testing of Metallic Materials. ASTM International: West Conshohocken, PA, USA, 2024.
- Aluminum Alloy 6061 General Description. Available online: https://unitedaluminum.com/6061-aluminum-alloy/ (accessed on 8 January 2025).
- Fuller, C.B.; Mahoney, M.W.; Bingel, W.H. Friction Stir Weld Tool and Method. U.S. Patent No. 6,994,242, 7 February 2006. [Google Scholar]
Disclaimer/Publisher’s Note: The statements, opinions and data contained in all publications are solely those of the individual author(s) and contributor(s) and not of MDPI and/or the editor(s). MDPI and/or the editor(s) disclaim responsibility for any injury to people or property resulting from any ideas, methods, instructions or products referred to in the content. |
© 2025 by the authors. Licensee MDPI, Basel, Switzerland. This article is an open access article distributed under the terms and conditions of the Creative Commons Attribution (CC BY) license (https://creativecommons.org/licenses/by/4.0/).