Article

Advancements in Hole Quality for AISI 1045 Steel Using Helical Milling

by
Pedro Mendes Silva
1,*,
António José da Fonseca Festas
1,
Robson Bruno Dutra Pereira
2 and
João Paulo Davim
1
1
Departmento de Engenharia Mecânica, TEMA, Universidade de Aveiro, Campus Santiago, 3810-193 Aveiro, Portugal
2
Departament of Mechanical and Industrial Engineering, Federal University of São João del-Rei, Praça Frei Orlando 36307-352, Minas Gerais, Brazil
*
Author to whom correspondence should be addressed.
J. Manuf. Mater. Process. 2025, 9(8), 256; https://doi.org/10.3390/jmmp9080256 (registering DOI)
Submission received: 14 June 2025 / Revised: 21 July 2025 / Accepted: 29 July 2025 / Published: 31 July 2025

Abstract

Helical milling presents a promising alternative to conventional drilling for hole production, offering superior surface quality and improved production efficiency. While this technique has been extensively applied in the aerospace industry, its potential for machining common engineering materials, such as AISI 1045 steel, remains underexplored in the literature. This study addresses this gap by systematically evaluating the influence of key process parameters—cutting speed (Vc), axial depth of cut (ap), and tool diameter (Dt)—on hole quality attributes, including surface roughness, burr formation, and nominal diameter accuracy. A full factorial experimental design (23) was employed, coupled with analysis of variance (ANOVA), to quantify the effects and interactions of these parameters. The results reveal that, with a higher Vc, it is possible to reduce surface roughness (Ra) by 30% to 40%, while an increased ap leads to a 50% increase in Ra. Additionally, Dt emerged as the most critical factor for nominal diameter accuracy, reducing geometrical errors by 1% with a larger Dt. Burr formation was predominantly observed at the lower end of the hole, highlighting challenges specific to this technique. These findings provide valuable insights into optimizing helical milling for low-carbon steels, offering a foundation for broader industrial adoption and further research.

1. Introduction

Hole making is typically one of the final operations performed in machining sequences. It is therefore of extreme importance that operators exercise increased caution to avoid process failure, which could result in significant financial losses. Such losses include not only the material cost but also the added value derived from previous machining processes [1]. Conventional drilling (CD) is a widely used technique for hole making, but it is prone to tool deflection and dimensional deviations due to the null cutting speed at the Tool Centre Point (TCP) [2]. As a result, alternative methods to CD have been proposed, one of them being helical milling (HM).
In HM, a milling tool with a diameter smaller than the desired hole diameter (DB) is used, and a circular motion is performed while the tool advances into the workpiece [2]. This difference in diameters offers several advantages, such as improved heat dissipation, as lubrication can be effectively directed to the cutting zones [3,4], and enhanced chip evacuation efficiency [2,4]. Additionally, HM offers economic benefits in tool costing, as a single tool can produce holes of various diameters, thereby reducing the necessity for a multitude of tools [3].
Regarding the formation of chips, the presence of both continuous and discontinuous cutting results in chips from HM processes exhibiting a range of attributes, namely broken chips in peripheral cutting and short, conical chips in front cutting [1,5,6].
Surface topography in HM holes has been investigated by analysing roughness, particularly focusing on the arithmetical mean roughness value (Ra). Costa et al. [7] conducted experiments on AISI 1045 steel, achieving Ra values ranging from 0.44 μm to 1.78 μm for holes with a DB of 35 mm using tools with a diameter (Dt) of 20 mm. Saadatbakhsh et al. [8] also examined roughness in holes machined with the HM technique in AISI 4340 alloy steel, reporting Ra values between 0.27 μm and 1.45 μm for DB of 8.1 mm and Dt of 6 mm.
Moreover, studies have indicated that an increasing ap results in higher Ra values due to increased amounts of uncut material [8,9]. Additionally, Li et al. [10] observed that an increasing Vc reduces the yield stress of the workpiece material, which in turn facilitates plastic deformation, ultimately resulting in lower Ra values. The influence of Dt on Ra has also been explored by Li et al. [10], who concluded that using a smaller Dt increases tool paths, thereby resulting in smaller Ra values.
The variation of cutting parameters also significantly impacts the nominal diameter of holes. Kharka et al. [11] achieved nominal diameters ranging from 9.87 mm to 10.03 mm when machining 10 mm diameter holes in SS304. Wang et al. [12] studied hole machining in CFRP/titanium alloy stacks with a diameter of 4.50 mm, obtaining nominal diameters between 4.45 mm and 4.49 mm.
In terms of the impact of cutting parameters on nominal diameter, Amini et al. [13] reached the conclusion that a higher Vc leads to improved diameter accuracy, whereas an increasing ap has the opposite effect. Nonetheless, increasing the Dt reduces tool deflection, resulting in more-precise nominal hole diameters [14].
A burr is the result of uncut material that deforms near the top and bottom of the hole. Shanmugam et al. [1] conducted research on Ti-6Al-4V and measured burr sizes ranging from 21 μm to 72 μm. Similarly, Jiao et al. [15] investigated burr formation in TC4 titanium alloy, observing burr sizes ranging from 10 μm to 22 μm.
It is established that increasing the ap leads to greater burr formation due to increased thrust forces impacting the workpiece, which promotes material deformation [1]. Moreover, a higher Vc results in larger burrs attributed to elevated temperatures that induce thermal softening of the material [1].
Despite its advantages, HM has primarily been employed in machining difficult-to-cut materials, such as titanium alloys [16,17] and Carbon-Fibre-Reinforced Polymers (CFRPs) used in aerospace structures and fuselages [18]. In contrast, materials like AISI 1045 steel, widely employed in mechanical construction, fasteners, and automotive components, have not been comprehensively studied. Given its versatility and the frequent need for precision holes in applications such as bearings, bushings, and sensors mounting, the use of HM to obtain precision holes in non-standard dimensions represents a beneficial solution when applied to the manufacture of AISI 1045 steel components.
Consequently, the present study involved the machining of holes in AISI 1045 steel using helical milling, with the parameters systematically varied in each test to ascertain their respective effects. The objective is to address the existing gap in the literature regarding the use of helical milling for common engineering materials by generating specific, quantitative insights into how Vc, ap, and Dt influence key hole quality indicators, thereby providing critical data to support the optimization of helical milling in machining operations involving widely used low-carbon steels and contributing to its broader application in general engineering contexts.

2. Experimental Methodology

The experimental procedure entailed machining holes in AISI 1045 steel using HM while systematically varying Vc, ap, and Dt.

2.1. Equipment

The machining tests were conducted on a Mikron VCE500 (Department of Mechanical Engineering, TEMA, University of Aveiro, Portugal) machining centre, with a spindle power of 11 kW and a maximum spindle speed of 7500 RPM. The holes were machined with flood lubrication with a 6% emulsion and down milling strategy.

2.2. Material

AISI 1045 steel is classified as a low-alloy steel, characterized by its chemical composition presented in Table 1. The specific AISI 1045 steel used in this work has a hardness of 207 HB and a Young’s modulus of 200 GPa. It features a Yield Strength of 355 MPa and has 16% of elongation. The machining tests consisted in making holes with a DB of 9 mm and a depth of 15 mm.

2.3. Cutting Tools

The machining tests were conducted using four-flute carbide end mills. The tools have a Dt of 5 mm (tool reference HC35PS 4 050 10 PHU910, manufactured by Palbit S.A.) and 8 mm (tool reference HC35PS 4 080 19 PHU910, also from Palbit S.A., Aveiro, Portugal). Both tools are coated with a 3 μm thick layer of Al-Cr-Ni applied through Physical Vapour Deposition (PVD) and are classified as ISO P10.

2.4. Cutting Parameters and Experimental Design

The experimental procedure followed a 23 full factorial design. In other words, there are three parameters (Vc, ap, and Dt) that will be changed between two levels (a high and a low level), resulting in eight different machining tests. The machining tests were randomly replicated, making a total number of 24 tests, adding statistical significance and randomizing possible experimental errors in the study. The hole quality indicators were then measured and subjected to an analysis of variance (ANOVA) to investigate the significance of the effect of Vc, ap, and Dt. The statistical analysis was carried out using R Studio©.
For the CNC programme used in the machining tests, it was necessary to define the tool spindle speed, S, which corresponds to n [rpm] (Equation (1)); the feedrate F [mm/min]; and the depth of cut, ap [mm/rev].
For determining F, corresponding to Vf, Equation (2) was used to calculate Vfp, which represents the tool feed speed at its periphery. The variables fz and z are used in this equation, where the fz used was 0.1 mm/tooth, representing the feed per tooth, and z was the number of tool teeth. To determine F or Vf, Equation (3) was used, where Dh is the helix diameter [mm], which is the diameter of the tool’s circular trajectory. Table 2 shows the parameters used in each test. Figure 1 presents a summary of the experimental procedure.
S = n = 1000 × V c π × D t [ rpm ]
V f p = f z × z × n [ mm/min ]
F   = V f = V f p D h D B [ mm/min ]

2.5. Quality Indicators

Surface topography was analysed using Ra, Rt, and Ra/Rp, with roughness measurements at three equally spaced locations (120° apart) on each hole. A Hommelwerke Hommel T1000 profilometer from the Department of Mechanical Engineering, TEMA, University of Aveirowas used for the roughness measurements that are classified under precision category level one according to DIN 4772 standards [18].
A systematic monitoring of tool wear was conducted after each machining operation, with the aim of ensuring minimal impact on the final quality of the holes. The assessment of tool wear was conducted using a Leica EZ4W optical microscope, from the Department of Mechanical Engineering, TEMA, University of Aveiro in conjunction with Leica Microsystems CMS GmbH’s Las X version 5.2.27831.1 software. In accordance with the ISO 8688-2:1989 standards [19]., the precision and geometrical accuracy of the workpiece may be compromised when flank wear reaches 300 μm. For this work, it was decided that whenever the flank wear was close to 250 μm or in cases of more severe failure, such as the formation of craters, the cutting tool was replaced to avoid the potential effect of tool wear on the experimental outcomes.

3. Results and Discussion

As previously mentioned, for surface topography and nominal diameter, ANOVA tests were used to determine the influence of each parameter on the final quality of holes, as well as the influence of the parameter combination for each machining test. For burr width only, a qualitative analysis was possible, since the results for burr formation showed high variability, which was attributed to the material properties and the unpredictable nature of the burr formation process.

3.1. Surface Topography

Table 3 presents the arithmetic means and corresponding standard deviations (SDs) of measurements from each hole, which were utilized for the subsequent ANOVA analysis (Adjusted R2 = 0.991), detailed in Table 4. Analysis of Table 4 reveals that ap was the most substantial influential factor, followed by Vc and the combined effect of ap and Dt. In addition, Dt showed no significant impact on Ra, as indicated by p-values higher than 0.05. The lack of fit proved to not be significant.
The dominant influence of ap can be attributed to roughness measurements being aligned with the axial direction, which is consistent with the helical pitch. Furthermore, the notable plasticity of AISI 1045 steel eases the surface imprinting by the cutting tool, in contrast to harder materials that exhibit reduced plasticity and a reduced likelihood of such indentation.
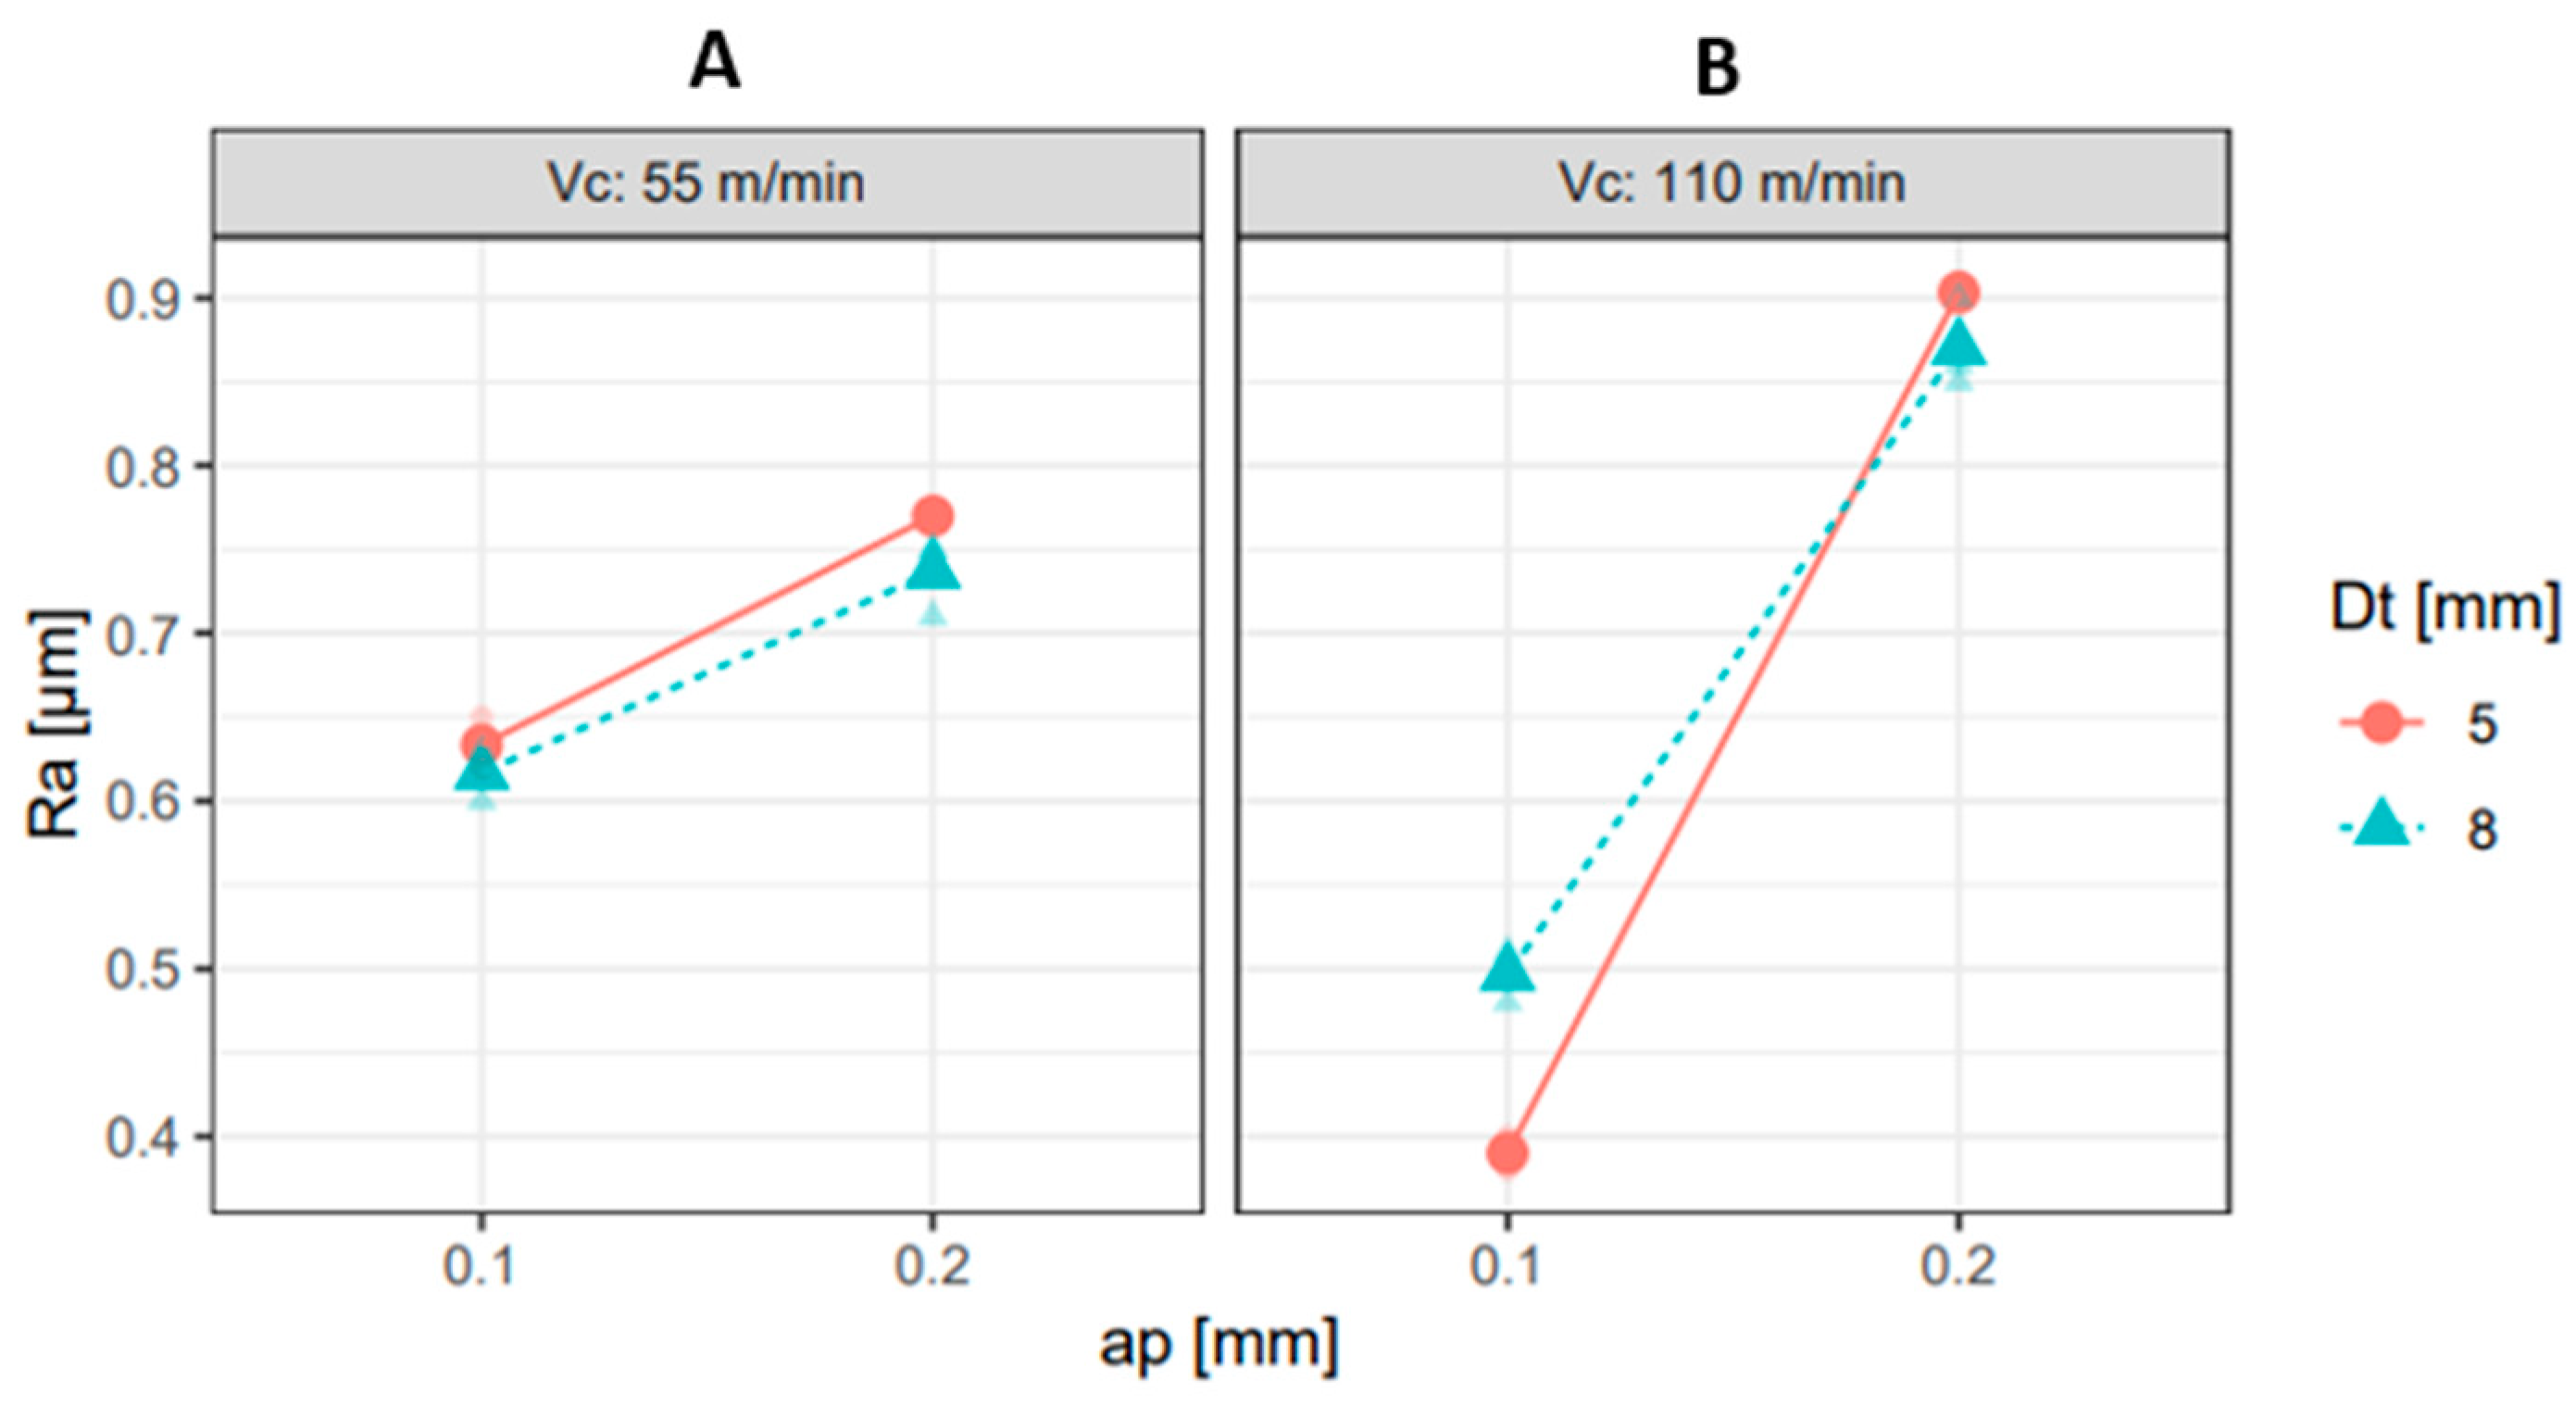
To illustrate the relationship between parameters on Ra, interaction plots were generated. Figure 2A presents the relationship between ap and Dt for Vc = 55 m/min. It can be observed that the line plots do not intersect, indicating that, at this level of Vc, the ap and Dt do not exert a significant influence on one another’s effect on Ra. It can be observed that as Vc increases, Ra levels decrease. Conversely, the plot for ap and Dt, for Vc = 110 m/min (Figure 2B), demonstrates that there is an interaction between ap and Dt, as evidenced by the intersection of the plot lines. Furthermore, Figure 2 shows that a higher Vc can result in a reduction in Ra, while an increase in ap leads to an elevated Ra.
Contour plots were utilized to depict the combined effects of two factors on Ra. Figure 3A shows the interaction between ap and Vc. Analysis of the plot reveals a pronounced variance in Ra, particularly in the vertical direction, putting forward the significant influence of ap on roughness outcomes. Additionally, at higher levels of Vc (110 m/min), the plot exhibits reduced line spacing and more distinct colour changes, indicating heightened variability in Ra. Conversely, Figure 3B demonstrates minimal colour scale transition and fewer contour lines, suggesting negligible effects of both Vc and Dt on Ra. In Figure 3C, the contour plot highlights the interaction between Dt and ap. A substantial colour scale transition horizontally and numerous vertically oriented lines indicate a strong influence of ap on Ra. Notably, for lower ap values, the effect of Dt on Ra becomes more apparent, as evidenced by noticeable changes in the colour scale and the inclination of contour lines, resulting in growing Ra values as Dt increases.
Similarly, the ratio between Ra and Rp was used for a more comprehensive analysis of surface roughness. The results were found to be consistent across all holes, despite variations in the cutting parameters. The low ratios (ratios between Ra and Rp) were observed to be between 0.14 and 0.25, indicating that the peaks are significant in comparison to the average roughness of the surface. Upon closer examination of the surface roughness, it becomes evident that the Rt values are not consistent between holes made with the same parameters. Nevertheless, it is possible to obtain a numerical reference of the surface topography left on the hole walls by the HM process, with Rt values ranging from 3.73 μm to 9.66 μm.
Furthermore, the Ra values enabled the determination of dimensional tolerances. Considering the hole height of 15 mm and the smallest average Ra (0.38 µm), it was possible to determine that the HM process was able to produce an IT7 (between 11 µm and 18 µm for nominal dimensions of 10 mm to 18 mm) tolerance hole. This result is in accordance with the findings of F. J. Puerta-Morales et al. [17].
A comparison of the Ra results obtained in this study with those of Costa et al. [7] in the tests designated as “rough interpolated helical milling” reveals that the former are in an inferior range (0.40–1.0 μm) when compared with the latter (0.40–2.0 μm). In contrast, Costa et al. state that Vc is the sole parameter that exhibits significant influence in their “rough interpolated helical milling” tests. This assertion is in alignment with the findings of the present study. However, it is important to note that the other parameters evaluated in both studies differ, rendering a direct comparison between them unfeasible.

3.2. Nominal Diameter

The nominal diameters were measured at the upper and lower end of the hole and are presented in Table 5 and Table 6, respectively, along with the corresponding relative error (ER), calculated using Equation (4), where DB theoretical is the hole’s nominal diameter and DB measured is the hole’s real diameter. A comparison of the data in the following tables indicates that geometric accuracy was more significant at the hole’s upper end than at the lower end.
E R = | D B   t h e o r e t i c a l D B   m e a s u r e d |   D B   t h e o r e t i c a l × 100 % [ % ]
The results of the ANOVA tests were based on the ER values for nominal diameters at the upper (Adjusted R2 0.8852) and lower (Adjusted R2 0.9675) end, as presented in Table 7 and Table 8, respectively. In both cases, it can be observed that the most influential parameter was Dt, also the lack of fit was non-significant in the models used.
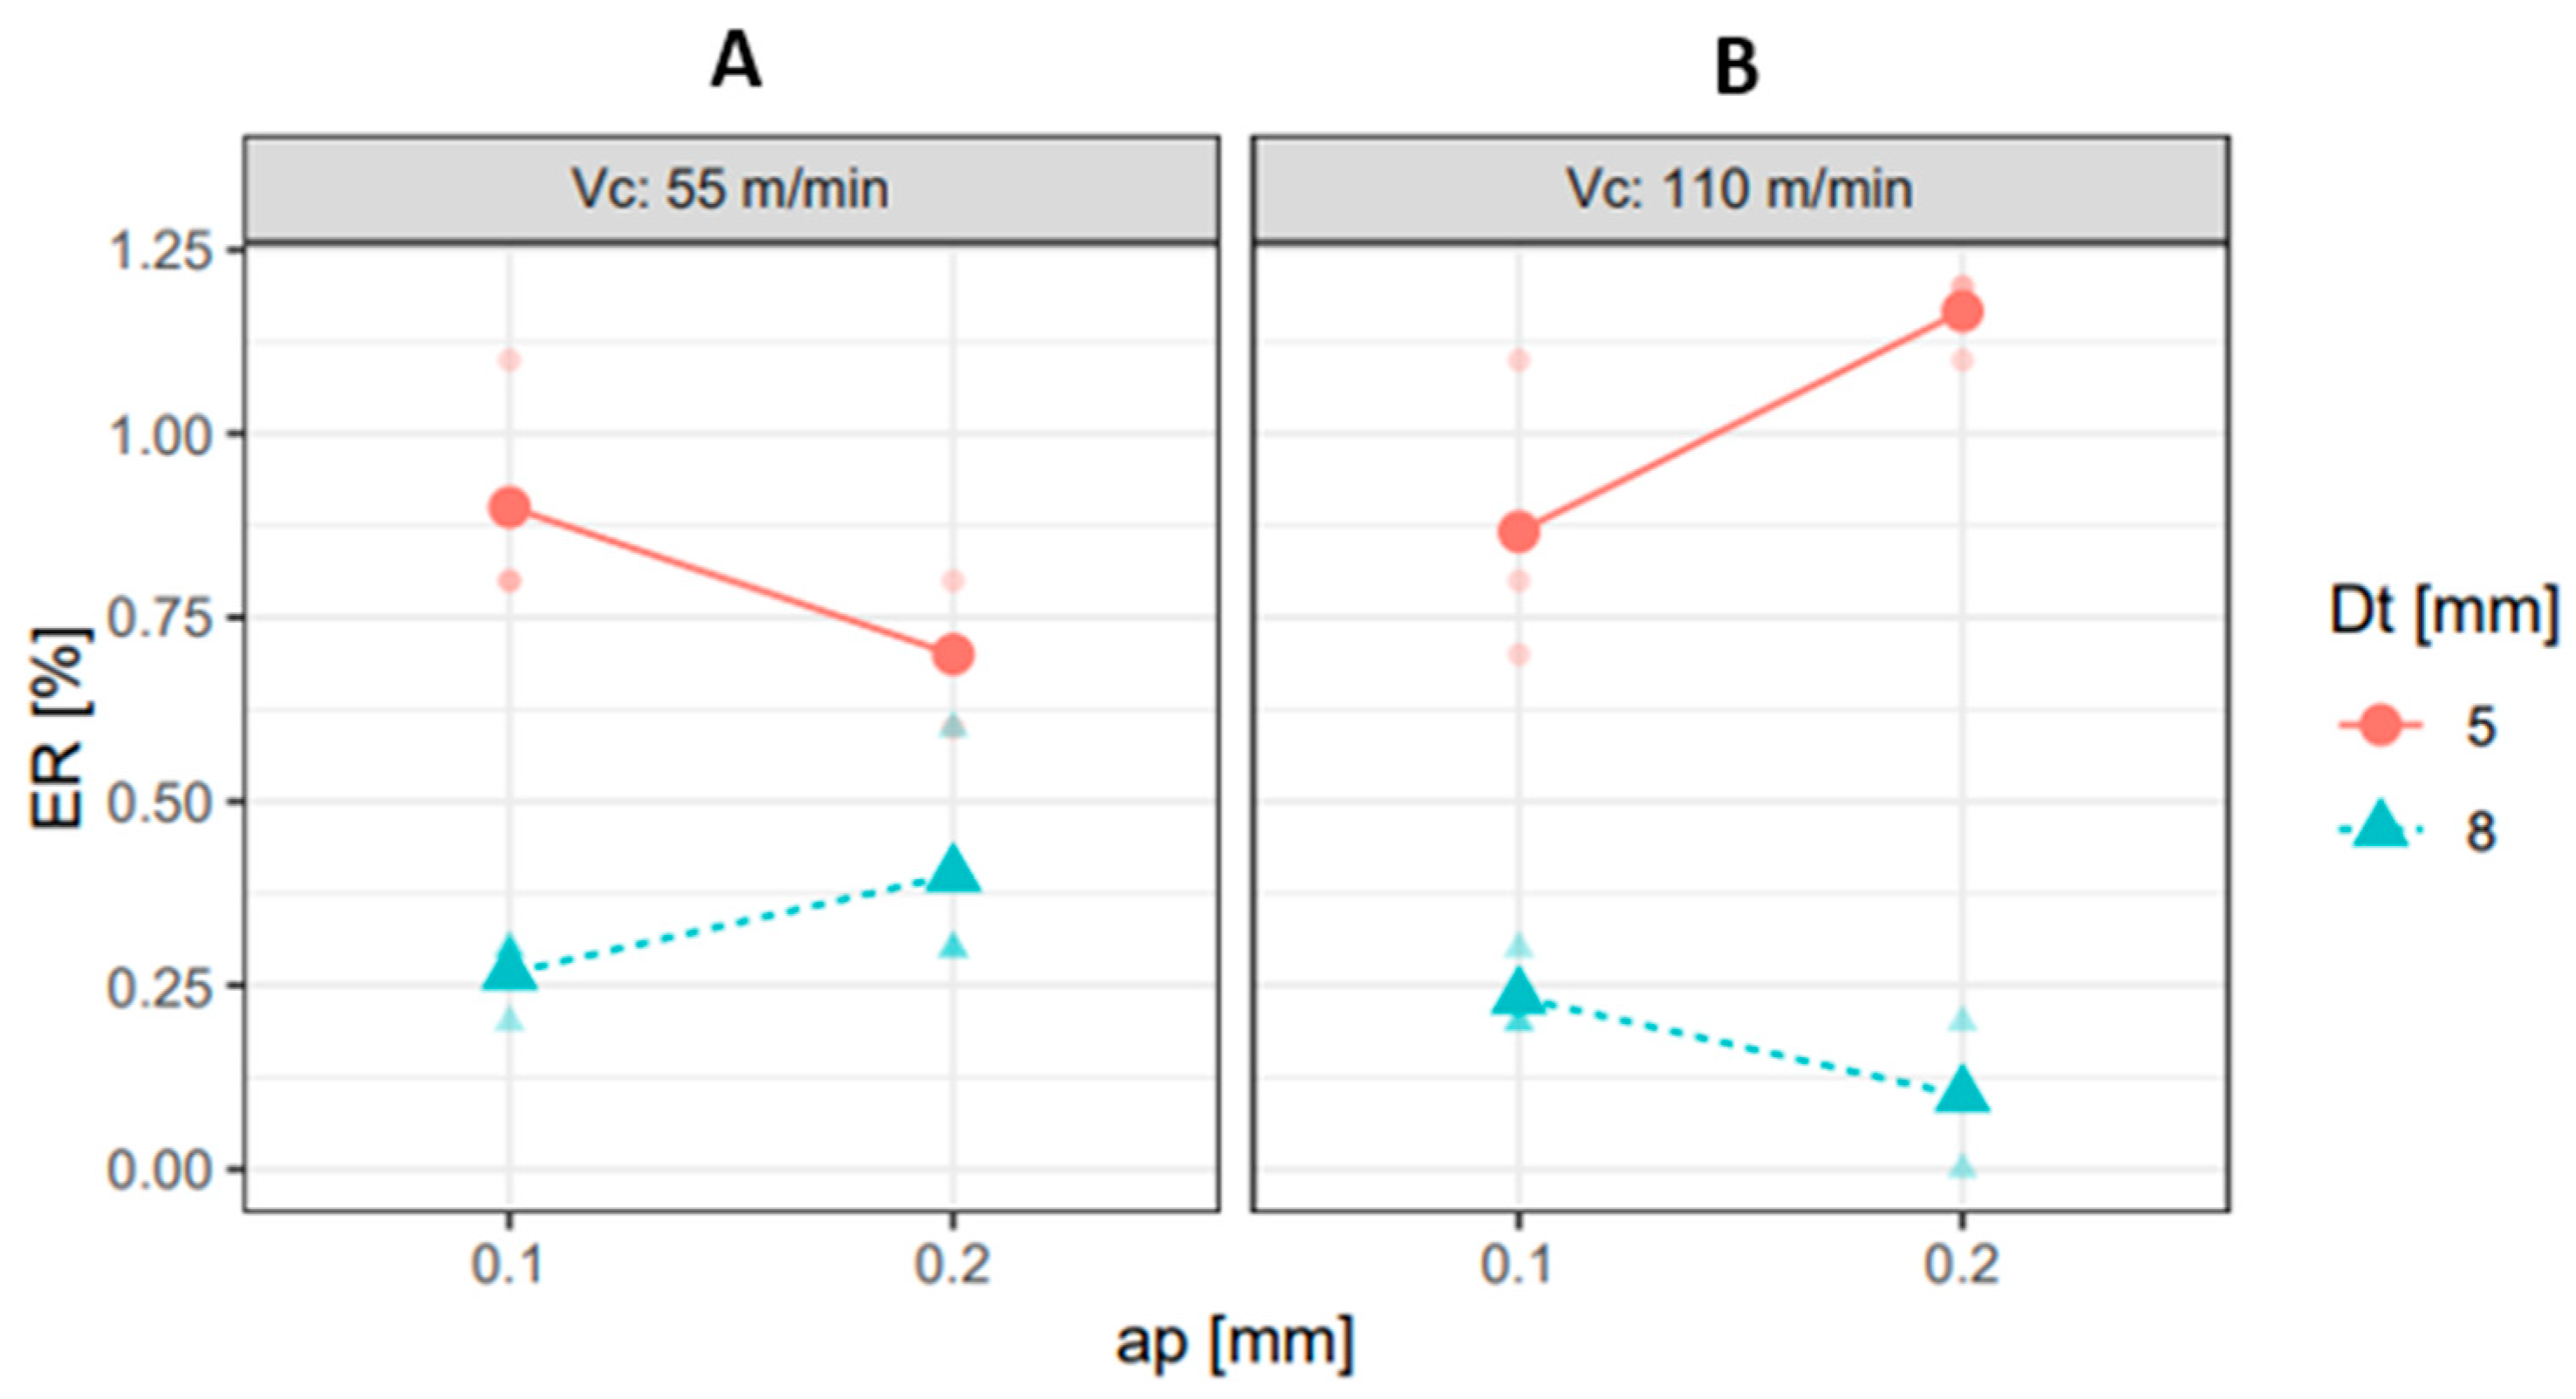
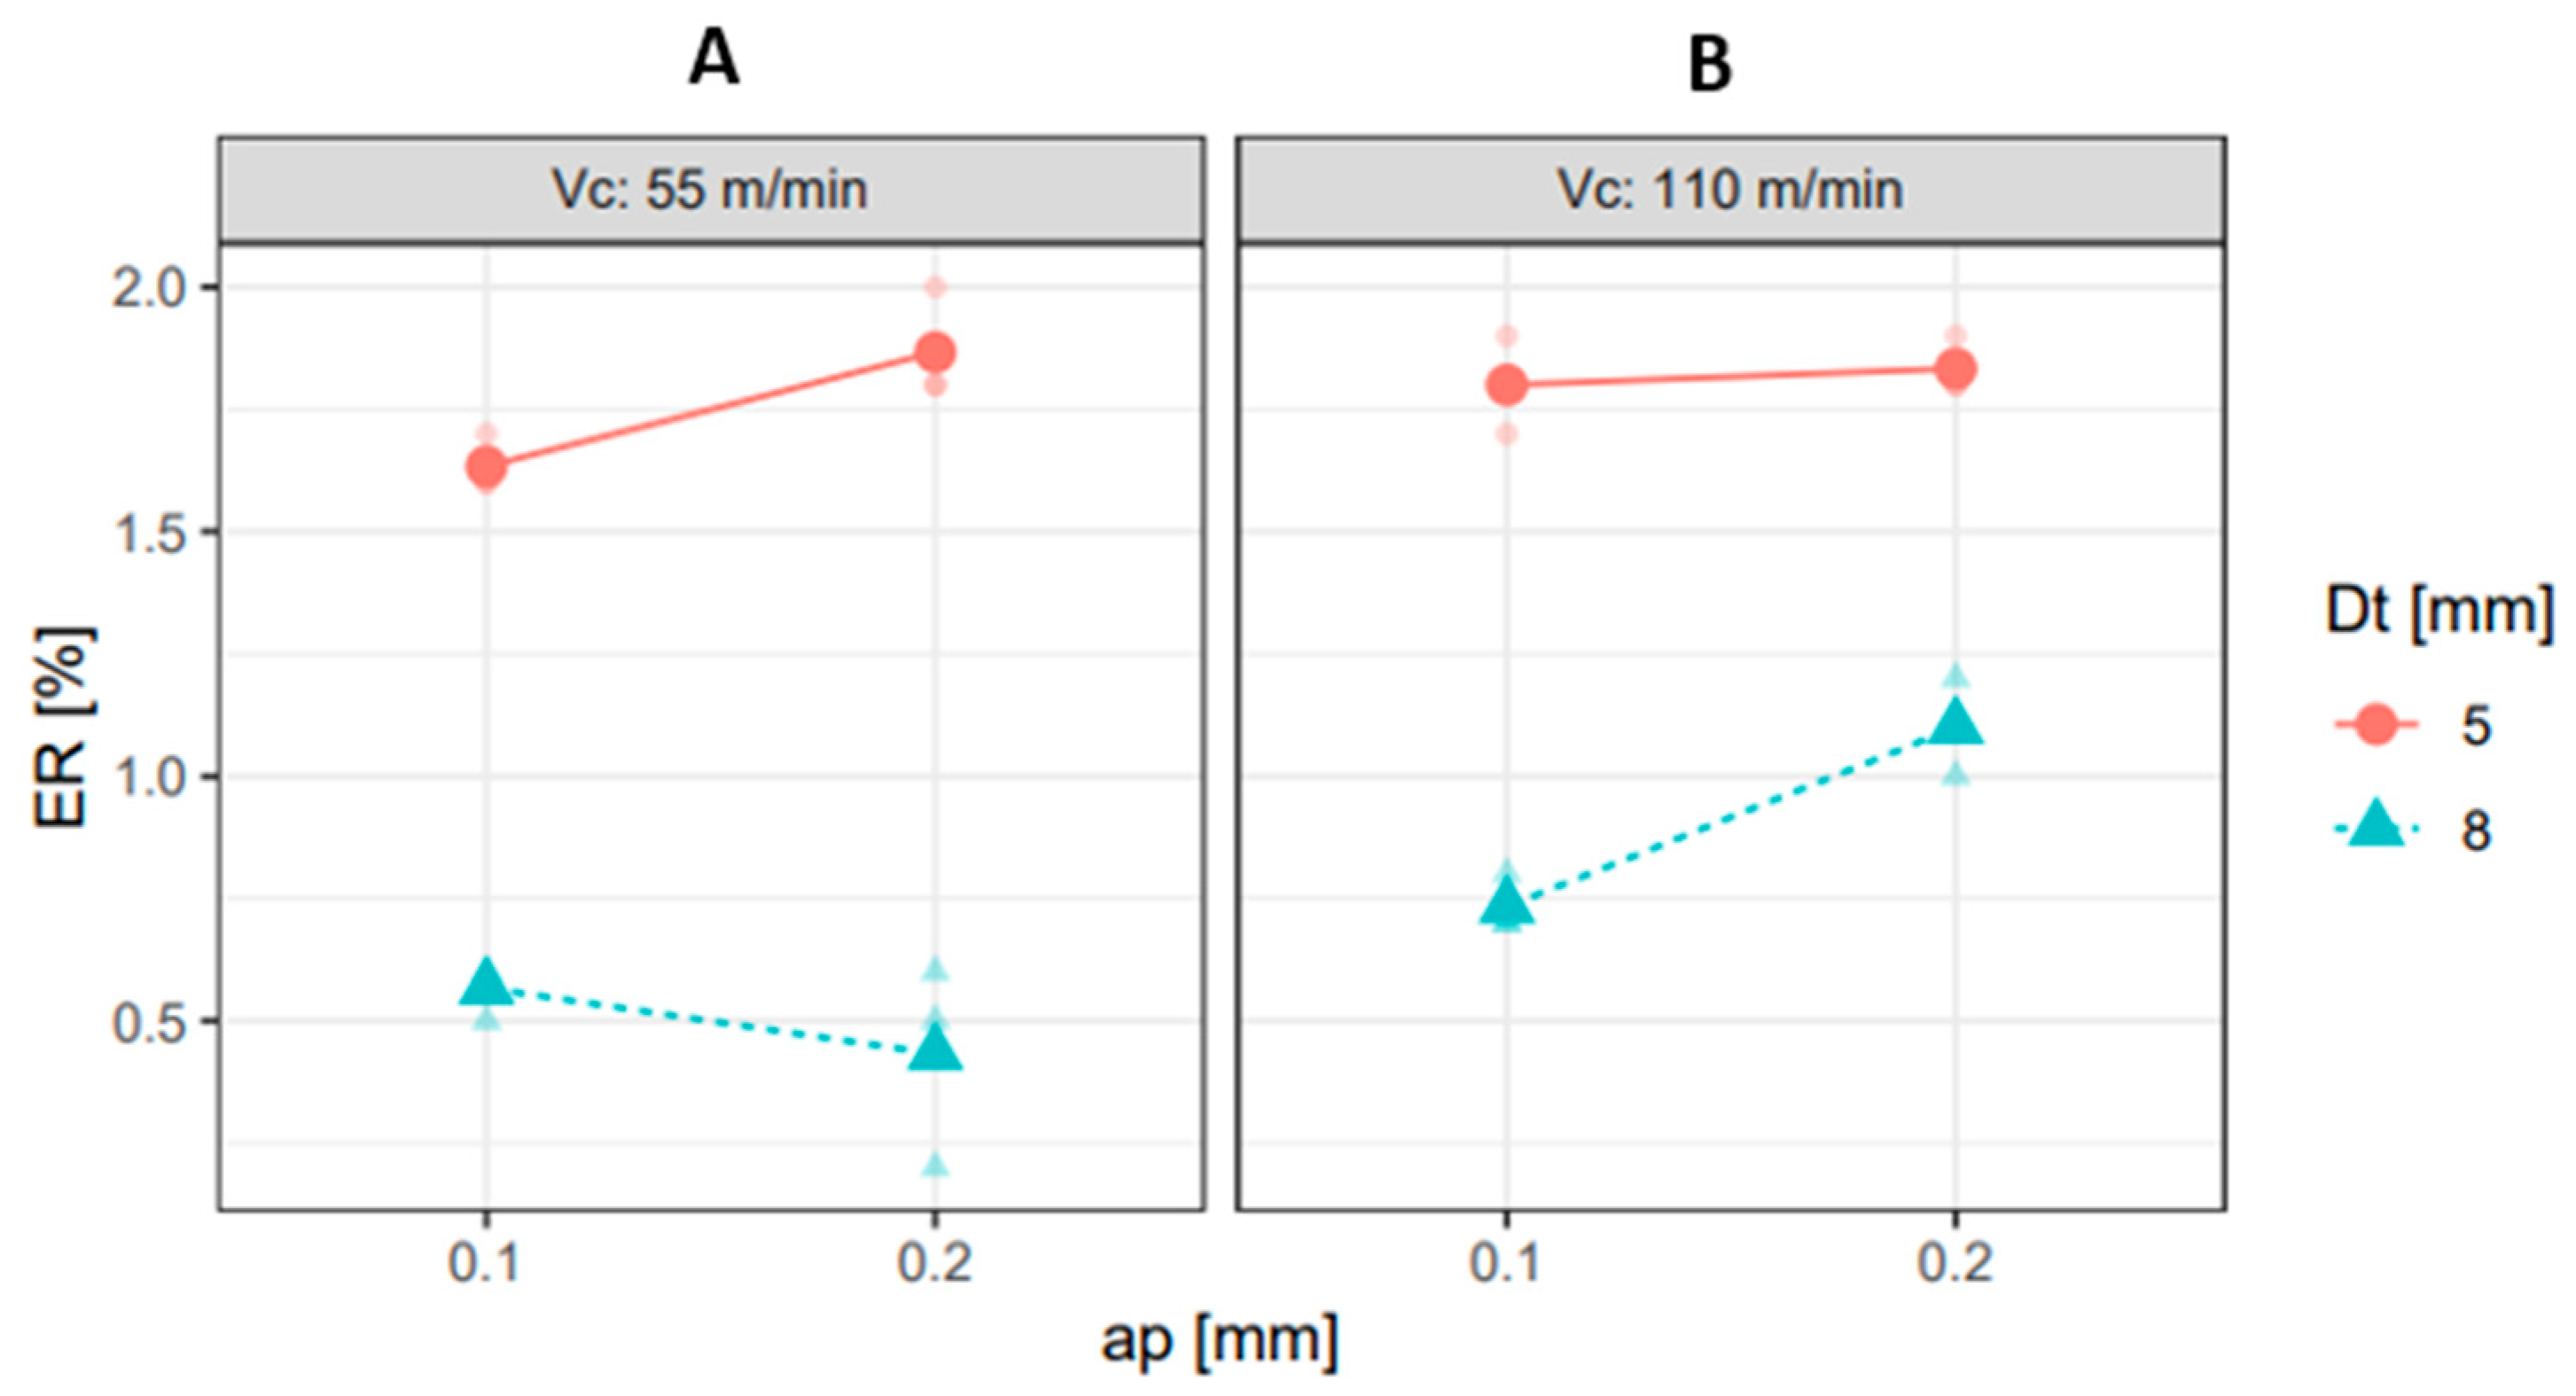
Regarding the interaction plots concerning upper and lower nominal diameter measurements, it was observed that higher Vc values resulted in increased ER (Figure 4 and Figure 5). This might be attributed to chatter during milling, as previously reported in the literature [20], but will be left for analysis in a future study. Similarly, higher ap values led to greater geometric errors at the upper and lower end of the hole (Figure 4B and Figure 5B).
Conversely, a larger Dt led to a reduction in geometric errors (Figure 4 and Figure 5), as the increased diameter provided greater resistance to deflection during machining.
Furthermore, Figure 4A and Figure 5A show that, for Vc = 55 m/min, there is a notable interaction between ap and Dt. This indicates that modifying one of these independent variables will influence the effect of the other independent variable on the hole’s nominal diameter. A similar trend is observed in Figure 4B and Figure 5B for Vc = 110 m/min.
The contour plot depicting the interaction between Vc and ap on the upper-end diameter (Figure 6A) reveals minimal significance, characterized by subtle colour transitions and a sparse number of contour lines. In contrast, contour plots illustrating the interaction of Dt with other parameters (Figure 6B for Vc and Dt, and Figure 6C for ap and Dt) display pronounced colour variations vertically and a higher density of more vertically oriented lines, which highlight the notable influence of Dt.
The contour plot for the lower-end diameter error of the holes indicates minimal colour variation in the interaction between ap and Vc (Figure 7A), with more noticeable effects observed at higher Vc values. Conversely, contour plots depicting the interaction of Vc with Dt (Figure 7B) and ap with Dt (Figure 7C) for geometric error at the lower-end diameter exhibit similar patterns, emphasizing the significant impact of Dt. In both cases, the contour lines are predominantly vertically inclined, and there is substantial colour variation in the vertical direction, with minimal changes horizontally.

3.3. Burr and Chip Formation

As previously stated, the burr formation analysis was of a more qualitative nature due to the uncertainty related to burr formation. The burr width at the upper end of the hole ranged between 39.80 μm and 84.00 μm and was, in general, smaller than that measured at the lower end, which ranged between 51.43 μm and 350.88 μm, as presented in Table 9 and Table 10. This observation is consistent with the findings of Bolar et al. [21], which noted that the amount of material remaining to be cut at the end of the operation is less than that remaining at the beginning. Consequently, the material is more susceptible to deformation, as the cutting tool penetrates deeper into the material, resulting in a reduction in resistance to the axial force and an increase in burr formation. The largest burr width measurement was obtained with the parameter combination of Vc = 55 m/min, ap =0.1 mm/rev, and Dt = 5 mm, at the lower end of the hole.
As previously stated, there are two distinct types of chips that can be produced during the HM process. In accordance with ISO 3685 [22], front cutting results in the formation of short and conical chips, whereas peripheral cutting generates broken chips (Figure 8). In addition, the lower caps, which are a consequence of deformed material with reduced thickness that was not cut, are also presented in Figure 8.

3.4. Tool Wear

The findings indicate that initial flank wear was more pronounced at the tool’s nose, aligning with observations reported by Robson et al. [23]. However, as the machining tests progressed, and flank wear at the front cutting edge overcame the maximum allowable Vbmax threshold, a replacement of the cutting tool was made in order not to compromise results of the succeeding machining tests (on average, three holes could be machined for each tool used before a new tool was used). Nevertheless, flank wear at the tool’s nose and peripheral cutting edge also reached values close to 250 µm, defined as a limit to Vbmax.

4. Conclusions

As initially proposed, this study aimed to contribute to a more profound comprehension of the impact that the cutting parameters Vc, ap, and Dt may have on hole making quality. The conclusions drawn from the machining tests and subsequent analysis are as follows:
1.
The doubling of ap resulted in a 50% increase in Ra, whereas the doubling of Vc resulted in a 30% to 40% (100% − 100 % ×   ( R a   110 m / m i n R a   55 m / m i n ) decrease in Ra (relatively speaking when), while Dt had no significant effect on Ra. The effect of ap is the most significant according to the ANOVA, followed by the combination of Vc and ap and then ap and Dt.
2.
When relating Ra values with dimensional tolerances, the HM process was able to achieve an IT7 grade.
3.
The diameter’s geometric accuracy improved with higher Dt values (reduction of around 1% in geometric error, 100% − 100 % ×   ( E R   8 m m E R   5 m m )), while it decreased with increased ap and Vc (increases of 0.5% in the geometric error at the hole’s lower end). The most influential parameter was Dt, due to its impact on tool deflection.
4.
The most influential parameter for geometric accuracy was Dt, according to the ANOVA test. It was also found that the geometric accuracy was closer to the desired dimension DB at the upper end of the hole than at the lower end, meaning that the relative error was reduced at the upper end.
5.
For burr formation, the results demonstrated that the burr width was generally higher at the lower end of the hole than at the upper end.

Author Contributions

Conceptualization, P.M.S., A.J.d.F.F., R.B.D.P. and J.P.D.; Methodology, P.M.S., A.J.d.F.F. and R.B.D.P.; Writing—original draft, P.M.S. and A.J.d.F.F.; Writing—review & editing, R.B.D.P. and J.P.D.; Supervision, J.P.D. All authors have read and agreed to the published version of the manuscript.

Funding

This research received no external funding.

Data Availability Statement

The original contributions presented in this study are included in the article. Further inquiries can be directed to the corresponding author(s).

Conflicts of Interest

The authors who are involved in this work certify that they have NO affiliations with or involvement in any organization or entity with any financial interests (such as honoraria; educational grants; participation in speakers’ bureaus; membership, employment, consultancies, stock ownership, or other equity interest; and expert testimony or patent-licensing arrangements) or non-financial interests (such as personal or professional relationships, affiliations, knowledge or beliefs) in the subject matter or materials discussed in this manuscript.

Nomenclature

AISIAmerican Iron and Steel Institute
AlAluminium
ANOVAAnalysis of variance
apAxial depth of cut
CCarbon
CDConventional drilling
CNCComputer numeric control
CrChromium
DBHole diameter
DhHelix diameter
DtTool diameter
ERRelative error
FFeed speed in the CNC programme
fzFeed per tooth
HMHelical milling
m/minMetre per minute
MmMillimetre
mm/minMillimetre per minute
mm/revMillimetre per revolution
mm/toothMillimetre per tooth
MnManganese
MoMolybdenum
μmMicrometre
ΝiNickel
PPhosphorus
PVDPhysical vapour deposition
RPMRotation per minute
RaArithmetic average roughness
RtTotal height of the roughness profile
RpMaximum profile peak height
SSulphur
SDStandard deviation
SiSilica
TCPTool centre point
TiTitanium
VcCutting speed
VfFeed velocity
VfpPeripheral feed velocity
VbmaxMaximum tool flank wear
zTool’s teeth number

References

  1. Shanmugam, R.; Baloor, S.S.; Koklu, U.; Polishetty, A.; Bolar, G. Machining Temperature, Surface Integrity and Burr Size Investigation during Coolant-Free Hole Milling in Ti6Al4V Titanium Alloy. Lubricants 2023, 11, 349. [Google Scholar] [CrossRef]
  2. Pereira, R.B.D.; Brandão, L.C.; de Paiva, A.P.; Ferreira, J.R.; Davim, J.P. A review of helical milling process. Int. J. Mach. Tools Manuf. 2017, 120, 27–48. [Google Scholar] [CrossRef]
  3. Iyer, R.; Koshy, P.; Ng, E. Helical milling: An enabling technology for hard machining precision holes in AISI D2 tool steel. Int. J. Mach. Tools Manuf. 2007, 47, 205–210. [Google Scholar] [CrossRef]
  4. Akula, S.; Nayak, S.N.; Bolar, G.; Managuli, V. Comparison of conventional drilling and helical milling for hole making in Ti6Al4V titanium alloy under sustainable dry condition. Manuf. Rev. 2021, 8, 12. [Google Scholar] [CrossRef]
  5. Brinksmeier, E.; Fangmann, S.; Meyer, I. Orbital drilling kinematics. Prod. Eng. 2008, 2, 277–283. [Google Scholar] [CrossRef]
  6. Denkena, B.; De Leon, L.; Dege, J.H. Kinematik und Spanungsformen beim Zirkularfräsen. Materwiss. Werksttech. 2008, 39, 610–615. [Google Scholar] [CrossRef]
  7. Costa, D.D.D.; Marques, A.; Amorim, F.L. Hole quality and cutting time evaluation in the interpolated helical milling. Int. J. Manuf. Res. 2015, 10, 313. [Google Scholar] [CrossRef]
  8. Saadatbakhsh, M.H.; Imani, H.; Sadeghi, M.H.; Farshi, S.S. Experimental study of surface roughness and geometrical and dimensional tolerances in helical milling of AISI 4340 alloy steel. Int. J. Adv. Manuf. Technol. 2017, 93, 4063–4074. [Google Scholar] [CrossRef]
  9. Cao, S.; Zhang, X.; Wu, C.; Tang, Y.; Yang, M.; Huang, W.; Zhu, D.; Zhan, W. Experimental investigation on tool wear and hole quality in helical milling of CFRPs. Int. J. Adv. Manuf. Technol. 2024, 130, 4791–4803. [Google Scholar] [CrossRef]
  10. Li, Z.; Liu, Q. Surface topography and roughness in hole-making by helical milling. Int. J. Adv. Manuf. Technol. 2012, 66, 1415–1425. [Google Scholar] [CrossRef]
  11. Kharka, V.; Mujumdar, S.; Shukla, S. Manufacturing Letters Study on Helical Milling of SS 304 with Small Diameter Tools Under the Influence of Minimum Quantity Lubrication (MQL)-NC-ND License. Available online: https://creativecommons.org/licenses/by-nc-nd/4.0 (accessed on 12 June 2024).
  12. Wang, J.; Ge, J.; Chen, G.; Liu, J.; Wang, Z.; Ren, C. Sustainable cooling/lubrication induced thermo-mechanical effects on ultrasonic vibration helical milling of CFRP/Ti–6Al–4V stacks. Int. J. Light. Mater. Manuf. 2023, 6, 311–328. [Google Scholar] [CrossRef]
  13. Amini, S.; Baraheni, M.; Hakimi, E. Enhancing dimensional accuracy and surface integrity by helical milling of carbon fiber reinforced polymers. Int. J. Light. Mater. Manuf. 2019, 2, 362–372. [Google Scholar] [CrossRef]
  14. Zhou, L.; Ke, Y.; Dong, H.; Chen, Z.; Gao, K. Hole diameter variation and roundness in dry orbital drilling of CFRP/Ti stacks. Int. J. Adv. Manuf. Technol. 2016, 87, 811–824. [Google Scholar] [CrossRef]
  15. Jiao, A.; Yuan, J.; Zhang, Y.; Zhang, J.; Miao, Y.; Liu, G. Study on Variable Parameter Helical Milling of TC4 Titanium Alloy Tube. Int. J. Precis. Eng. Manuf. 2023, 24, 1947–1959. [Google Scholar] [CrossRef]
  16. Pan, Z.; Wang, L.; Fang, Q.; Sun, Z.; Qu, W. Study on tool deflection compensation method based on cutting force observer for orbital drilling of CFRP/Ti stacks. J. Manuf. Process. 2022, 75, 450–460. [Google Scholar] [CrossRef]
  17. Puerta-Morales, F.J.; Gomez, J.S.; Fernandez-Vidal, S.R. Study of the influence of helical milling parameters on the quality of holes in the UNS R56400 alloy. Appl. Sci. 2020, 10, 845. [Google Scholar] [CrossRef]
  18. DIN 4772:1979-11; Electrical Contact (Stylus) Instruments for the Measurement of Surface Roughness by the Profile Method. Deutsches Institut für Normung (DIN)—German Institute for Standardisation: Berlin, Germany, 1979.
  19. ISO 8688-2:1989; Tool Life Testing in Milling—Part 2: End Milling. International Organisation for Standardization (ISO): Geneve, Switzerland, 1989.
  20. Li, Z.; Liu, Q.; Ming, X.; Wang, X.; Dong, Y. Cutting force prediction and analytical solution of regenerative chatter stability for helical milling operation. Int. J. Adv. Manuf. Technol. 2014, 73, 433–442. [Google Scholar] [CrossRef]
  21. Bolar, G.; Sridhar, A.K.; Ranjan, A. Drilling and helical milling for hole making in multi-material carbon reinforced aluminum laminates. Int. J. Light. Mater. Manuf. 2022, 5, 113–125. [Google Scholar] [CrossRef]
  22. ISO 3685; Tool-Life Testing with Single-Point Turning Tools. International Organisation for Standardization (ISO): Geneve, Switzerland, 1993.
  23. Pereira, R.B.D.; Lauro, C.H.; Brandão, L.C.; Ferreira, J.R.; Davim, J.P. Tool wear in dry helical milling for hole-making in AISI H13 hardened steel. Int. J. Adv. Manuf. Technol. 2018, 101, 2425–2439. [Google Scholar] [CrossRef]
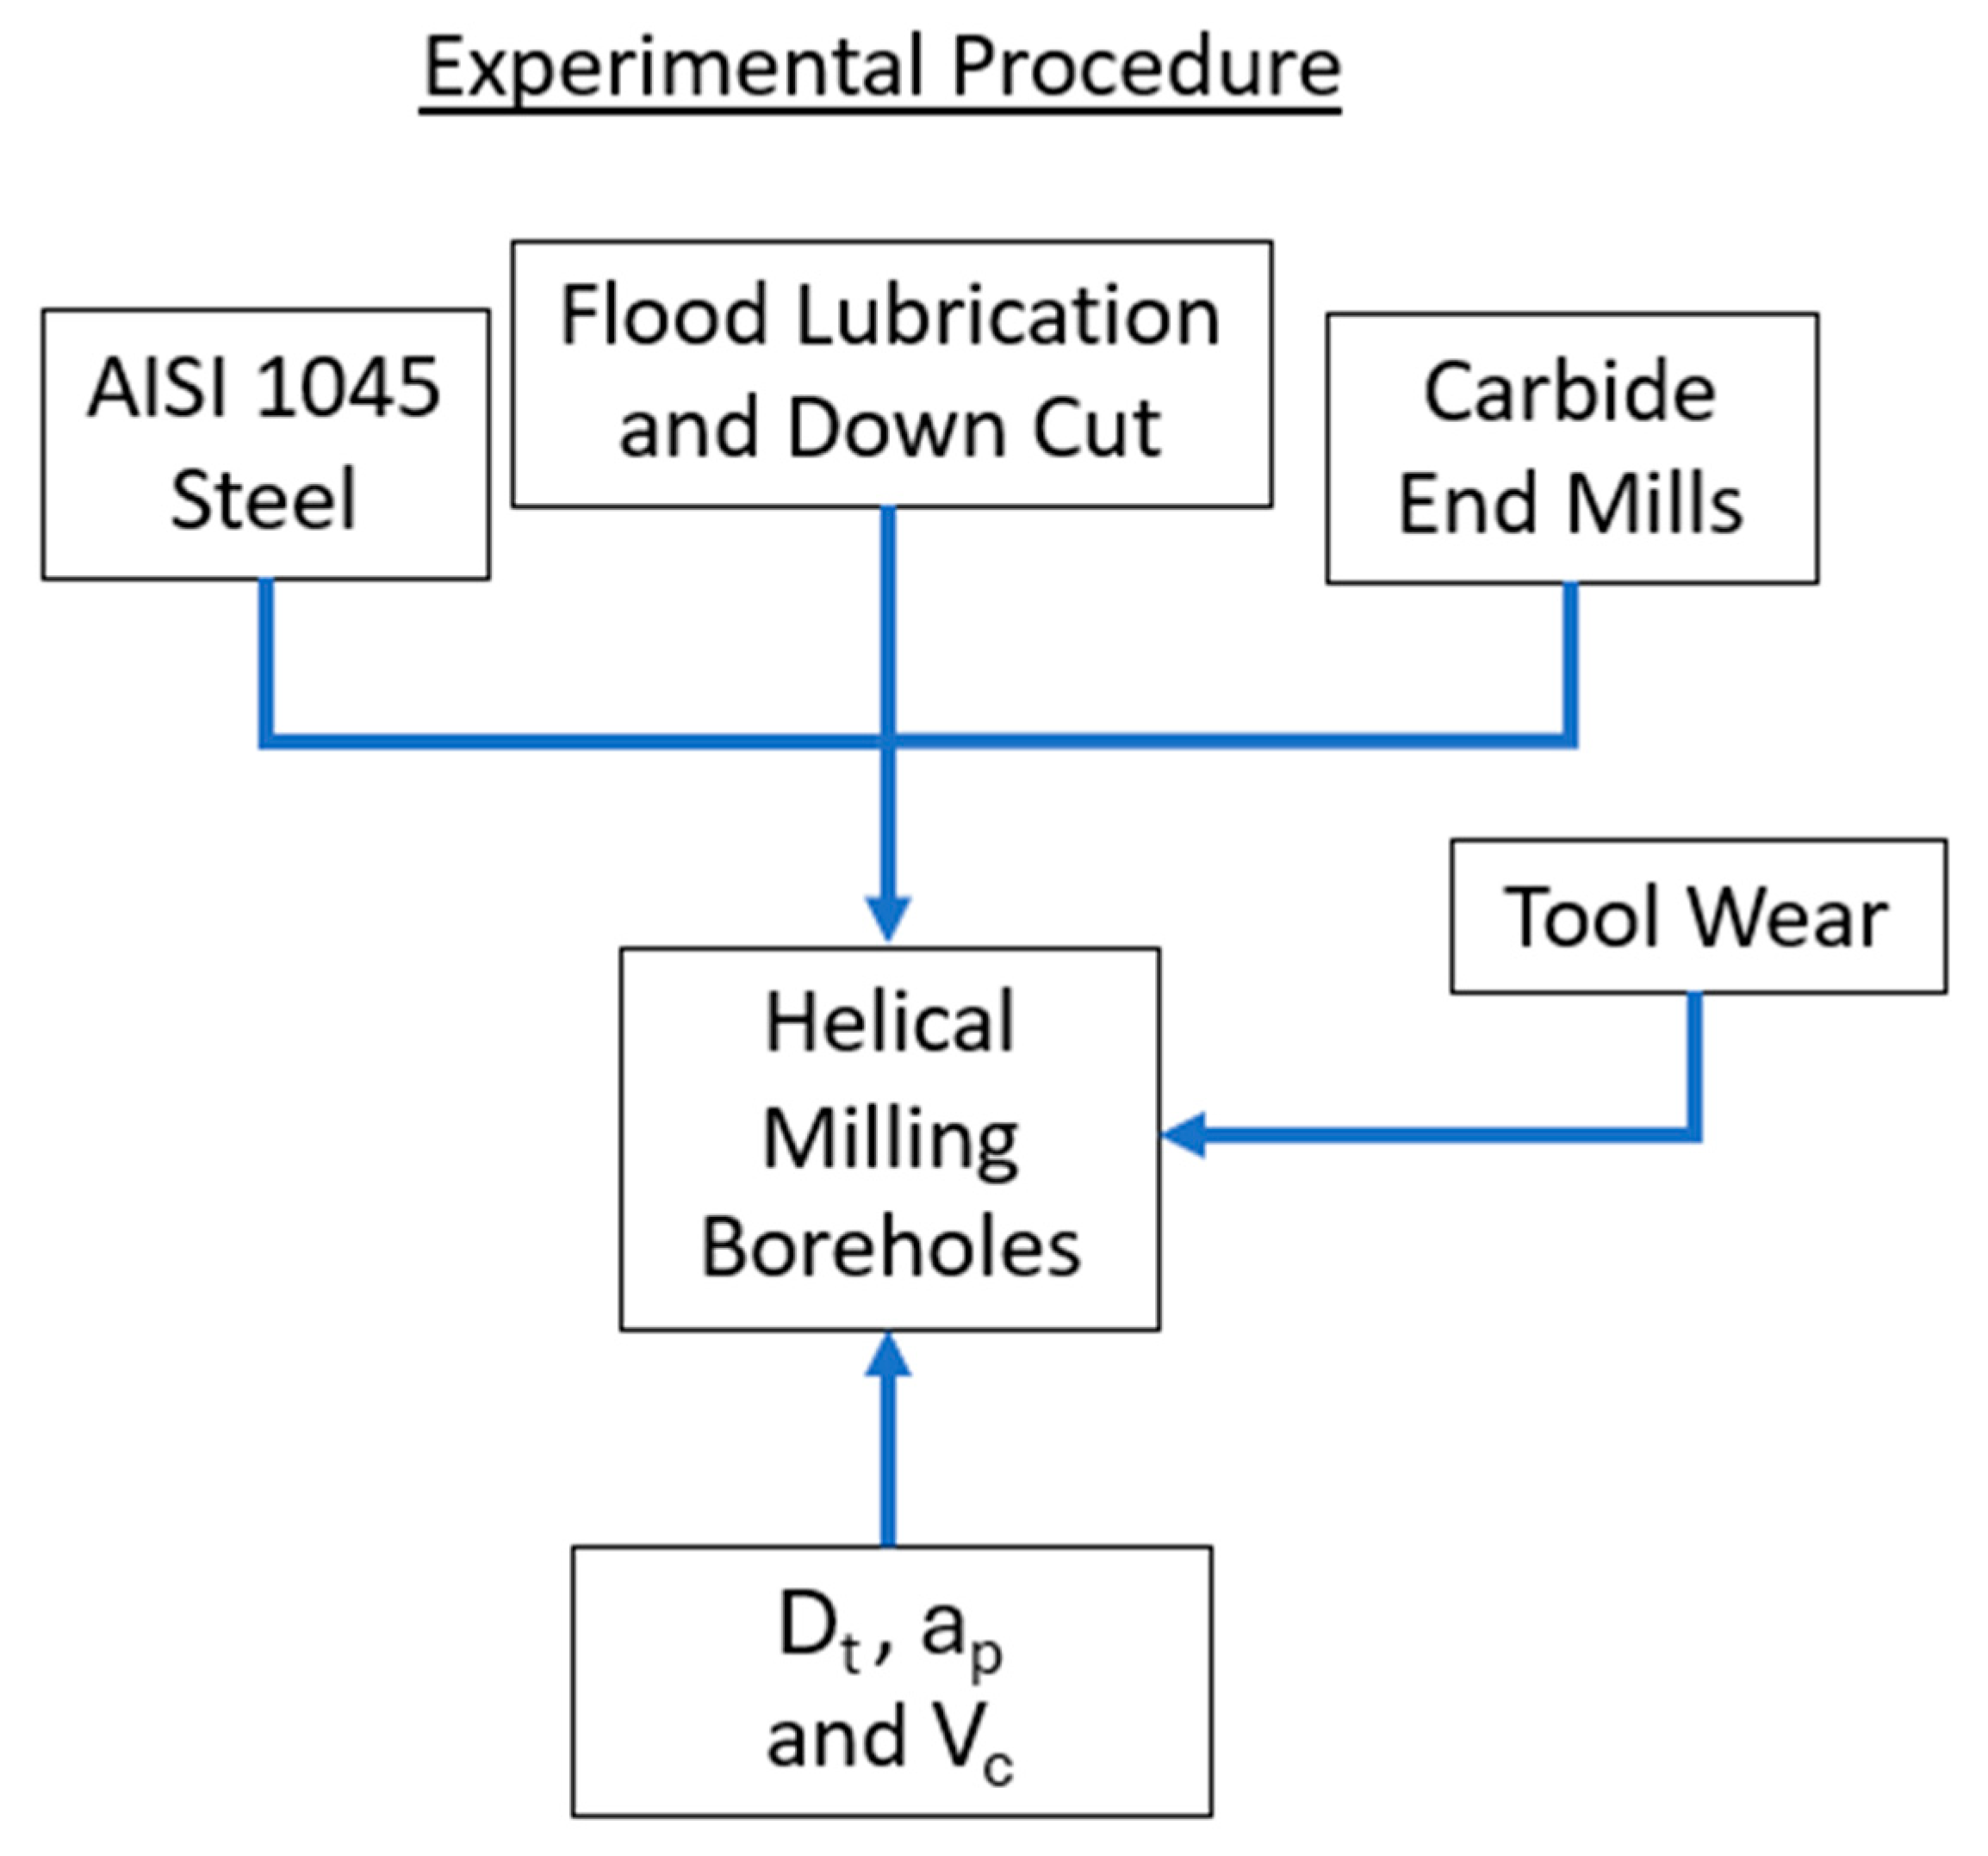
Figure 1. Experimental procedure description.
Jmmp 09 00256 g001
Figure 2. Interaction plots for Ra, for Vc = 55 m/min (A) and for Vc = 110 m/min (B), highlighting the combined effects of Dt and ap.
Jmmp 09 00256 g002
Figure 3. Contour plots showing the combined effects of Vc, ap, and Dt on Ra, Vc, and ap interaction (A); Vc and Dt interaction (B); and ap and Dt interaction (C).
Jmmp 09 00256 g003
Figure 4. Interaction plots for nominal diameter error at the upper end, for Vc = 55 m/min (A) and for Vc = 110 m/min (B), highlighting the combined effects of Dt and ap.
Jmmp 09 00256 g004
Figure 5. Interaction plots for nominal diameter error at the lower end, for Vc = 55 m/min (A) and for Vc = 110 m/min (B), highlighting the combined effects of Dt and ap.
Jmmp 09 00256 g005
Figure 6. Contour plots showing the combined effects of Vc, ap, and Dt on diameter error at upper end of the hole measurements: Vc and ap interaction (A), Vc and Dt interaction (B) and ap and Dt interaction (C).
Jmmp 09 00256 g006
Figure 7. Contour plots showing the combined effects of Vc, ap, and Dt on diameter error at lower end of the hole measurements: Vc and ap interaction (A), Vc and Dt interaction (B), and ap and Dt interaction (C).
Jmmp 09 00256 g007
Figure 8. Helical milling chips generated during front and peripheral cutting and caps.
Jmmp 09 00256 g008
Table 1. AISI 1045 steel chemical composition.
CSiMnPSCr+Mo+Ni
Min %0.42-0.50---
Max %0.500.400.800.0350.0350.063
Table 2. The 23 factorial design used in the HM tests.
TestVc
(mm/min)
ap
(mm/rev)
Dt
(mm)
A1100.15
B550.15
C1100.25
D550.25
E1100.18
F550.18
G1100.28
H550.28
Table 3. Ra average values and standard deviation for each machining test.
Test1st Hole2nd Hole3rd Hole
Ra (μm)SD (μm)Ra (μm)SD (μm)Ra (μm)SD (μm)
A0.400.030.390.050.380.04
B0.620.010.630.020.650.02
C0.900.030.910.020.900.05
D0.770.040.770.030.770.03
E0.480.010.510.020.500.03
F0.620.040.630.040.600.04
G0.900.050.850.010.860.06
H0.750.060.750.030.710.06
Table 4. ANOVA test summary for Ra values.
FactorsDegrees of FreedomSum of SquaresMean of SquaresF-Valuep-Value
Vc1.004.00 × 10−34.00 × 10−31.36 × 1012.00 × 10−3
ap1.004.90 × 10−14.90 × 10−118.97 × 10²<2.00 × 10⁻¹⁶
Dt1.001.00 × 10−31.00 × 10−37.90 × 10−1<3.87 × 10⁻¹
Vc × ap1.001.49 × 10−11.49 × 10−157.61 × 1025.65 × 10−14
Vc × Dt1.006.00 × 10−36.00 × 10−32.21 × 1011.00 × 10−3
ap × Dt1.009.00 × 10−39.00 × 10−33.56 × 1011.96 × 10−5
Vc × ap × Dt1.006.00 × 10−36.00 × 10−32.21 × 1011.00 × 10−3
Residuals16.004.00 × 10−33.00 × 10⁻³Not calculated
Total23.006.67 × 10−12.90 × 10⁻²
Table 5. Diameter averages and relative errors at the upper end, used for the ANOVA test.
TestDtop 1 (mm)ER 1 (%)Dtop 2 (mm)ER 2 (%)Dtop 3 (mm)ER 3 (%)
A8.901.18.930.808.940.7
B8.930.808.930.808.911.1
C8.901.28.911.18.891.2
D8.950.608.930.808.940.7
E8.970.308.980.208.980.2
F8.980.308.980.308.980.2
G9.0008.980.209.000.1
H8.950.608.980.308.980.3
Table 6. Diameter averages and relative errors at the lower end, used for the ANOVA test.
TestDbottom 1 (mm)ER 1 (%)Dbottom 2 (mm)ER 2 (%)Dbottom 3 (mm)ER 3 (%)
A8.831.908.851.708.841.80
B8.851.708.861.608.861.60
C8.841.808.841.808.831.90
D8.841.808.822.008.841.80
E8.930.808.940.708.940.70
F8.960.508.950.608.950.60
G8.980.208.960.508.950.60
H8.911.008.901.108.911.00
Table 7. ANOVA test results for the upper-end hole’s diameters.
FactorsDegrees of FreedomSum of SquaresMean of SquaresF-Valuep-Value
Vc1.004.00 × 10−34.00 × 10−32.25 × 10−16.42 × 10⁻¹
ap1.004.00 × 10−34.00 × 10−32.25 × 10−16.42 × 10⁻¹
Dt1.000.26 × 1010.26 × 1011.56 × 1021.15 × 10−9
Vc × ap1.002.00 × 10−22.00 × 10−20.12 × 1012.85 × 10−1
Vc × Dt1.002.20 × 10−12.20 × 10−11.32 × 1012.00 × 10−3
ap × Dt1.004.00 × 10−34.00 × 10−32.25 × 10−16.42 × 10⁻¹
Vc × ap × Dt1.002.20 × 10−12.20 × 10−11.32 × 1012.00 × 10−3
Residuals16.002.67 × 10−11.70 × 10⁻²Not calculated
Total23.004.50 × 10−11.34 × 10⁻¹
Table 8. ANOVA test results for the lower-end hole’s diameters.
FactorsDegrees of FreedomSum of SquaresMean of SquaresF-Valuep-Value
Vc1.003.50 × 10−13.50 × 10−10.31 × 1014.14 × 10−5
ap1.009.40 × 10−29.40 × 10−20.83 × 1011.00 × 10−2
Dt1.000.69 × 1010.69 × 1016.16 × 1023.34 × 10−14
Vc − ap1.003.40 × 10−23.40 × 10−20.30 × 1011.02 × 10−1
Vc − Dt1.001.84 × 10−11.84 × 10−11.63 × 1011.00 × 10−3
ap − Dt1.00003.37 × 10−28.50 × 10⁻¹
Vc − ap − Dt1.001.84 × 10−11.84 × 10−11.63 × 1011.00 × 10−3
Residuals16.001.80 × 10−11.10 × 10⁻²Not calculated
Total23.003.37 × 10−13.29 × 10⁻¹
Table 9. Burr width measurements and respective SD at the upper end of the hole.
TestBurr Width 1 (μm)SD 1
(μm)
Burr Width 2 (μm)SD 2
(μm)
Burr Width 3 (μm)SD 3
(μm)
A53.849.9558.228.4350.5911.01
B64.0521.3639.802.1339.415.65
C48.081.5447.178.5168.7530.77
D54.377.1356.145.2884.001.00
E60.798.7170.9724.5158.029.80
F53.7513.8354.268.0758.556.84
G75.6515.7147.703.7549.6110.84
H68.708.758 82.8615.5174.537.08
Table 10. Burr width measurements and respective SD at the lower end of the hole.
TestBurr Width 1 (μm)SD 1
(μm)
Burr Width 2 (μm)SD 2
(μm)
Burr Width 3 (μm)SD 3
(μm)
A257.6310.12274.5531.52164.6939.75
B350.8888.20270.1517.11195.4135.81
C76.351.28115.815.51113.5937.92
D153.05102.1873.8712.8973.4323.26
E63.2414.42222.5318.56149.2714.85
F51.438.3555.559.8364.1711.60
G89.2321.4473.272.7656.079.94
H132.1339.7470.1018.8084.9911.59
Disclaimer/Publisher’s Note: The statements, opinions and data contained in all publications are solely those of the individual author(s) and contributor(s) and not of MDPI and/or the editor(s). MDPI and/or the editor(s) disclaim responsibility for any injury to people or property resulting from any ideas, methods, instructions or products referred to in the content.