Article

Impact of Laser Power and Scanning Speed on Single-Walled Support Structures in Powder Bed Fusion of AISI 316L

by
Dan Alexander Gallego
1,2,*,
Henrique Rodrigues Oliveira
1,
Tiago Cunha
3,
Jeferson Trevizan Pacheco
1,
Oksana Kovalenko
1 and
Neri Volpato
2
1
Additive Manufacturing Laboratory, Laser Processing SENAI Innovation Institute (ISI-Laser), Joinville 89218-153, Brazil
2
Departament of Mechanical Engineering, Federal Univesity of Technology—Paraná (UTFPR), Curitiba 81290-000, Brazil
3
Welding Technology Laboratory, Federal University of Santa Catarina (UFSC), Joinville 89219-600, Brazil
*
Author to whom correspondence should be addressed.
J. Manuf. Mater. Process. 2025, 9(8), 254; https://doi.org/10.3390/jmmp9080254
Submission received: 13 June 2025 / Revised: 10 July 2025 / Accepted: 24 July 2025 / Published: 30 July 2025
(This article belongs to the Special Issue Recent Advances in Optimization of Additive Manufacturing Processes)

Abstract

Laser beam powder bed fusion of metals (PBF-LB/M, or simply L-PBF) has emerged as one of the most competitive additive manufacturing technologies for producing complex metallic components with high precision, design freedom, and minimal material waste. Among the various categories of additive manufacturing processes, L-PBF stands out, paving the way for the execution of part designs with geometries previously considered unfeasible. Despite offering several advantages, parts with overhang features require the use of support structures to provide dimensional stability of the part. Support structures achieve this by resisting residual stresses generated during processing and assisting heat dissipation. Although the scientific community acknowledges the role of support structures in the success of L-PBF manufacturing, they have remained relatively underexplored in the literature. In this context, the present work investigated the impact of laser power and scanning speed on the dimensioning, integrity and tensile strength of single-walled block type support structures manufactured in AISI 316L stainless steel. The method proposed in this work is divided in two stages: processing parameter exploration, and mechanical characterization. The results indicated that support structures become more robust and resistant as laser power increases, and the opposite effect is observed with an increment in scanning speed. In addition, defects were detected at the interfaces between the bulk and support regions, which were crucial for the failure of the tensile test specimens. For a layer thickness corresponding to 0.060 mm, it was verified that the combination of laser power and scanning speed of 150 W and 500 mm/s resulted in the highest tensile resistance while respecting the dimensional deviation requirement.

1. Introduction

Over the past years, laser beam powder bed fusion of metals (PBF-LB/M, or simply L-PBF) has been attracting the attention of several industry sectors for manufacturing complex parts for final application [1,2,3]. L-PBF enables the production of geometries that would be difficult or impossible to achieve through traditional manufacturing techniques. This technology also enables parts to be manufactured on-demand, ensuring continuous operation of critical systems without the need for spare parts inventory. L-PBF also allows producing components near net shape, requiring less or even no allowance material. Due to these advantages, L-PBF has been gaining the attention of several different industries, such as automotive, aerospace, custom service, healthcare, oil and gas, and military [2,3,4].
In spite of these advantages, support structures are required to build overhanging features. An overhanging feature is defined as a region of a building part that is not printed over any solidified material nor substrate [5]. For most cases, overhanging features can be self-supported as long as the angle between the downskin surface and the substrate, known as critical overhanging angle, is higher than 45° [5,6]. In the absence of support structures, defects such as excessive roughness, dimensional deviation, delamination, and dross effect are often reported [7,8]. These defects can be so pronounced that they might lead to a part failure while it is being produced, as well as interrupt the fabrication [9]. To address these problems, the most common approach is orienting the part in such a way that the overhang surfaces are minimized [8,10] or through the adoption of processing strategies that result in lower critical overhanging angles [6,8,11], but these solutions are not always suitable.
Support structures have two roles during L-PBF processing: aid heat dissipation and resist the residual stresses induced by the rapid heating and cooling cycles [12]. These structures are not integral parts of the final component, so they must be removed in post-processing stages, yet they can be useful for dimension stability while the part is heat treated or machined [13]. This removal process may involve manual methods or traditional techniques such as milling, drilling or grinding [13,14]. Consequently, while they must be resistant enough to hold residual stresses, they need to be easily removable, the tools used for their detachment must have access to them, and they need to allow powder removal, also expressed as depowdering [10].
Generally, support structures are classified into two main categories: volume (sometimes referred to as solid) or single-walled (sometimes referred to as non-solid) [15,16]. Volume support structures are characterized by a 3D representation comprising a closed set of surfaces with a predefined volume. They are processed using an overlapped scanning track strategy in the same way parts are, and applied in large surfaces. On the other hand, single-walled support structures are represented as an open set of surfaces with no thickness nor volume in their 3D representation, and used to manage heat locally. These structures are processed as an arrangement of single-layer tracks, where the actual thickness corresponds to the width of a track obtained by the laser scanning. Among the various types of single-walled support structures, the most popular is the block type due to its versatility [10]. It consists of an arrangement of parallel and perpendicular scanning tracks in a 2D mesh grid form, orthogonal with the building direction. Their geometry can be described by design parameters and features, such as teeth, perforations, and fragmentation, as well as the adjustment of their scanning path pattern parameters. The configuration of these features can be used to add specific characteristics to the support structures, such as weakening the interface between the part support and facilitating depowdering.
Regarding the processing parameters involved in L-PBF, they need to be in compliance to ensure the build job is successfully reproduced. These parameters can be optimized in such a way that the desired characteristics and properties of the built materials are achieved, while processing constraints are respected [3,17]. There are strategies and approaches with specific sets of parameters for the part’s inside fill (bulk) and surface (contour), as well as for the support structures [17,18]. In the literature, several studies can be found aiming to develop a suitable processing window and/or scanning strategies concerning the bulk and contour; however, methodologies that examine processing parameters for support structures are scarce [10,17,18,19].
Therefore, there is a differentiation between design parameters and processing parameters in the context of support structures. The study conducted by Calignano [20] was pioneering in investigating the influence of design parameters on single-walled block type support structures made of AlSi10Mg and Ti6Al4V, although it relied primarily on qualitative criteria. Subsequently, the study published by Bobbio [21] developed a method for testing the tensile strength of lattice structures to characterize the tensile strength of support structures using AlSi10Mg. However, the influence of how processing aspects could affect the dimensions of support structures was not considered in the study. Next, Lindecke [22] and Leary [23] examined L-PBF specimens manufactured with Ti6Al4V and AlSi10Mg, studying how design parameters affect the tensile strength using the measured dimensions of the processed geometry for the computation of strengths. In these works, Lindecke [22] used a digital microscope to characterize the quality of the as-manufactured support structure geometry, and Leary [23] used micro-computed tomography. Regarding of the impact of processing parameters on support structures, Gong [24] and Morgan [25] examined how laser power and scanning speed impact the continuity, straightness, consistency, spatter formation, and width of scanning lines in samples made of 316L and Ti6Al4V, yet without a clear definition of what each of these criteria means. Additionally, they do not evaluate how this may affect the mechanical strength of support structures. Lastly, the work of Schmitt [26] stands out as the most comprehensive, addressing both design and processing parameters on specimens made of 16MnCr5. It was the only one to conduct mechanical tests based on standard procedures, allowing comparison with other works. However, the process parameters are indirectly evaluated in the form of the volumetric energy density and it does not assess how processing influences the dimensioning of support structures.
Studying the impact of processing parameters on the integrity of designed support structures is important because it can be adjusted to optimize productivity or mechanical strength, while building constraints are respected. Excessive dimensional deviation can compromise functional requirements, including support removability and depowdering [10,19]. However, a systematic investigation into the effects of key parameters—particularly laser power and scanning speed—on the dimensional accuracy and mechanical performance of support structures remains lacking in the literature [19,20,21,22,23]. Lastly, the scarcity of works implementing optimization methods to find the best combination of both parameters in order to maximize the mechanical strength is noted [24,25,26].
In face of this research opportunity, this paper studies the impact of laser power and scanning speed on dimensioning and tensile resistance of stainless steel 316L single-walled block type support structures. In addition, it proposes a method of optimizing a set of processing parameters to build support structures for a given layer thickness, focusing on finding the maximum tensile resistance while respecting dimensional constraints based on experimental results. The method presented in this paper is divided in two stages: processing parameter exploration, and mechanical characterization.

2. Materials and Methods

In this study, single-walled block type support structures with perforation were used, as shown in Figure 1, and the nominal geometry was kept constant. In Figure 1a, it is possible to see a top perspective ( x y plane) from support structure type implemented in this work. It shows the mesh grid formed by the parallel scanning lines, each one of them separated by a distance h s , and the rotation angle ϕ , around the z direction. Still on the image, w is the scanning line width. In single-walled structures, it depends only on the processing parameters [24,27,28]. In Figure 1b, a front or side view is displayed ( x z or y z plane). It highlights the angle of the perforation θ p , the thickness of the perforation elements b p , the height of the perforation elements s p and the distance between the perforated region and the solid region s h , which can be the interface between support and substrate or support and part. Furthermore, the compensation offset between the support structure and part contour [ x y ] o is shown, as well as the re-entrant offset of the support in the part, which may be different for the upper ( [ z ] o u ) and lower interfaces ( [ z ] o l ). The software used for designing the support structure was Magics, version 26.02, from Materialise.
Figure 2 illustrates the processing parameters that are relevant for this study. As shown, the laser beam with power P and focal spot diameter d s scans the predefined vector lines at a speed v for a respective layer with thickness t. In this work, t was arbitrated as 0.060 mm, since it is a slice thickness already used in similar studies, but focused on different powder materials [21,22,26]. Compared to thinner layers, such as 0.030 mm, it significantly reduces the total number of layers required, thereby shortening the build time and improving manufacturing efficiency [3,29].
The volumetric energy density ( E V ) is expressed in Equation (1) and it is an experimental formulation that allows measure in the form of different energy combinations of processing parameters, L-PBF systems and material suppliers [30], according to the following expression
E V = P v × h d × t ,
although for some studies d s is used instead of h d [26,30]. It is possible to express it in the linear energy density ( E L ), shown in Equation (2) as
E L = P v .
Some studies have evaluated how dimensional characteristics of the melt pool (i.e., width, depth, and fusion pool dilution) are influenced by processing parameters in scan lines or lattice-type structures [27,28]. Although these studies were not focused on support structures, they contribute to the theoretical basis of this research. The study conducted by Großmann [28] proposed using dimensional analysis through the Buckingham Π -theorem to model the relation between melt pool width and processing parameters while neglecting Marangoni convection, Plateau–Rayleigh instability and laser recoil pressure. The approach revealed experimentally that, as Equation (3) expresses, the scanned line width (w) is directly proportional to the square root of E L . As in this work both t and d s were fixed, w can also be express proportionally to the square root of E V according to
w E L E V .
The feedstock material used during processing was the gas-atomized stainless steel 316L (Höganäs Belgium SA, Ath, Belgium) with nominal particle size distribution (PSD) ranging from 0.020 mm to 0.053 mm. The PSD of the powder was measured by dynamic image analysis based on the equivalent circular diameter (ECD) method with the Particle Insight analyzer (Particle Measuring Systems, Boulder, CO, USA). Sphericity was characterized qualitatively through a scanning electron microscope (SEM) analysis using a Phenom Pro X (model 800-07334; Thermo Fisher Scientific, Waltham, MA, USA). Figure 3 shows the 316L used in this experiment. Figure 3a displays a histogram with the ECD distribution of the particles. According to the image analysis calculation, 80% of the powder has a particle size within the range of D10 = 0.0173 mm to D90 = 0.0542 mm. The average value was D50 = 0.0299 mm. Figure 3b shows an image obtained by SEM with a 500× magnification of the morphology of the AISI 316L stainless steel metal powder used. It is possible to observe that while many particles appear nearly spherical, some exhibit irregularities, including elongated shapes, agglomerates, and partially fractured surfaces.
Finally, the substrates used were made of forged stainless steel 316L. All experiments were conducted in a Concept Laser M2 Cusing (2012; GE Additive, Lichtenfels, Germany). This system is equipped with a continuous Yd:YAG laser fiber with a wave length of 1070 nm and a d s of 0.080 mm. The processes were carried out in an argon inert atmosphere, in such a manner that the machine was capable of keeping oxygen concentrations below 0.5%. It is important to note that all results were evaluated in the as-built condition. After every build job was concluded, the parts were separated from the substrate via a wired electrical discharging machine (WEDM) from Agie Charmilles Holding, model CUT 20P, Zug, Switzerland.

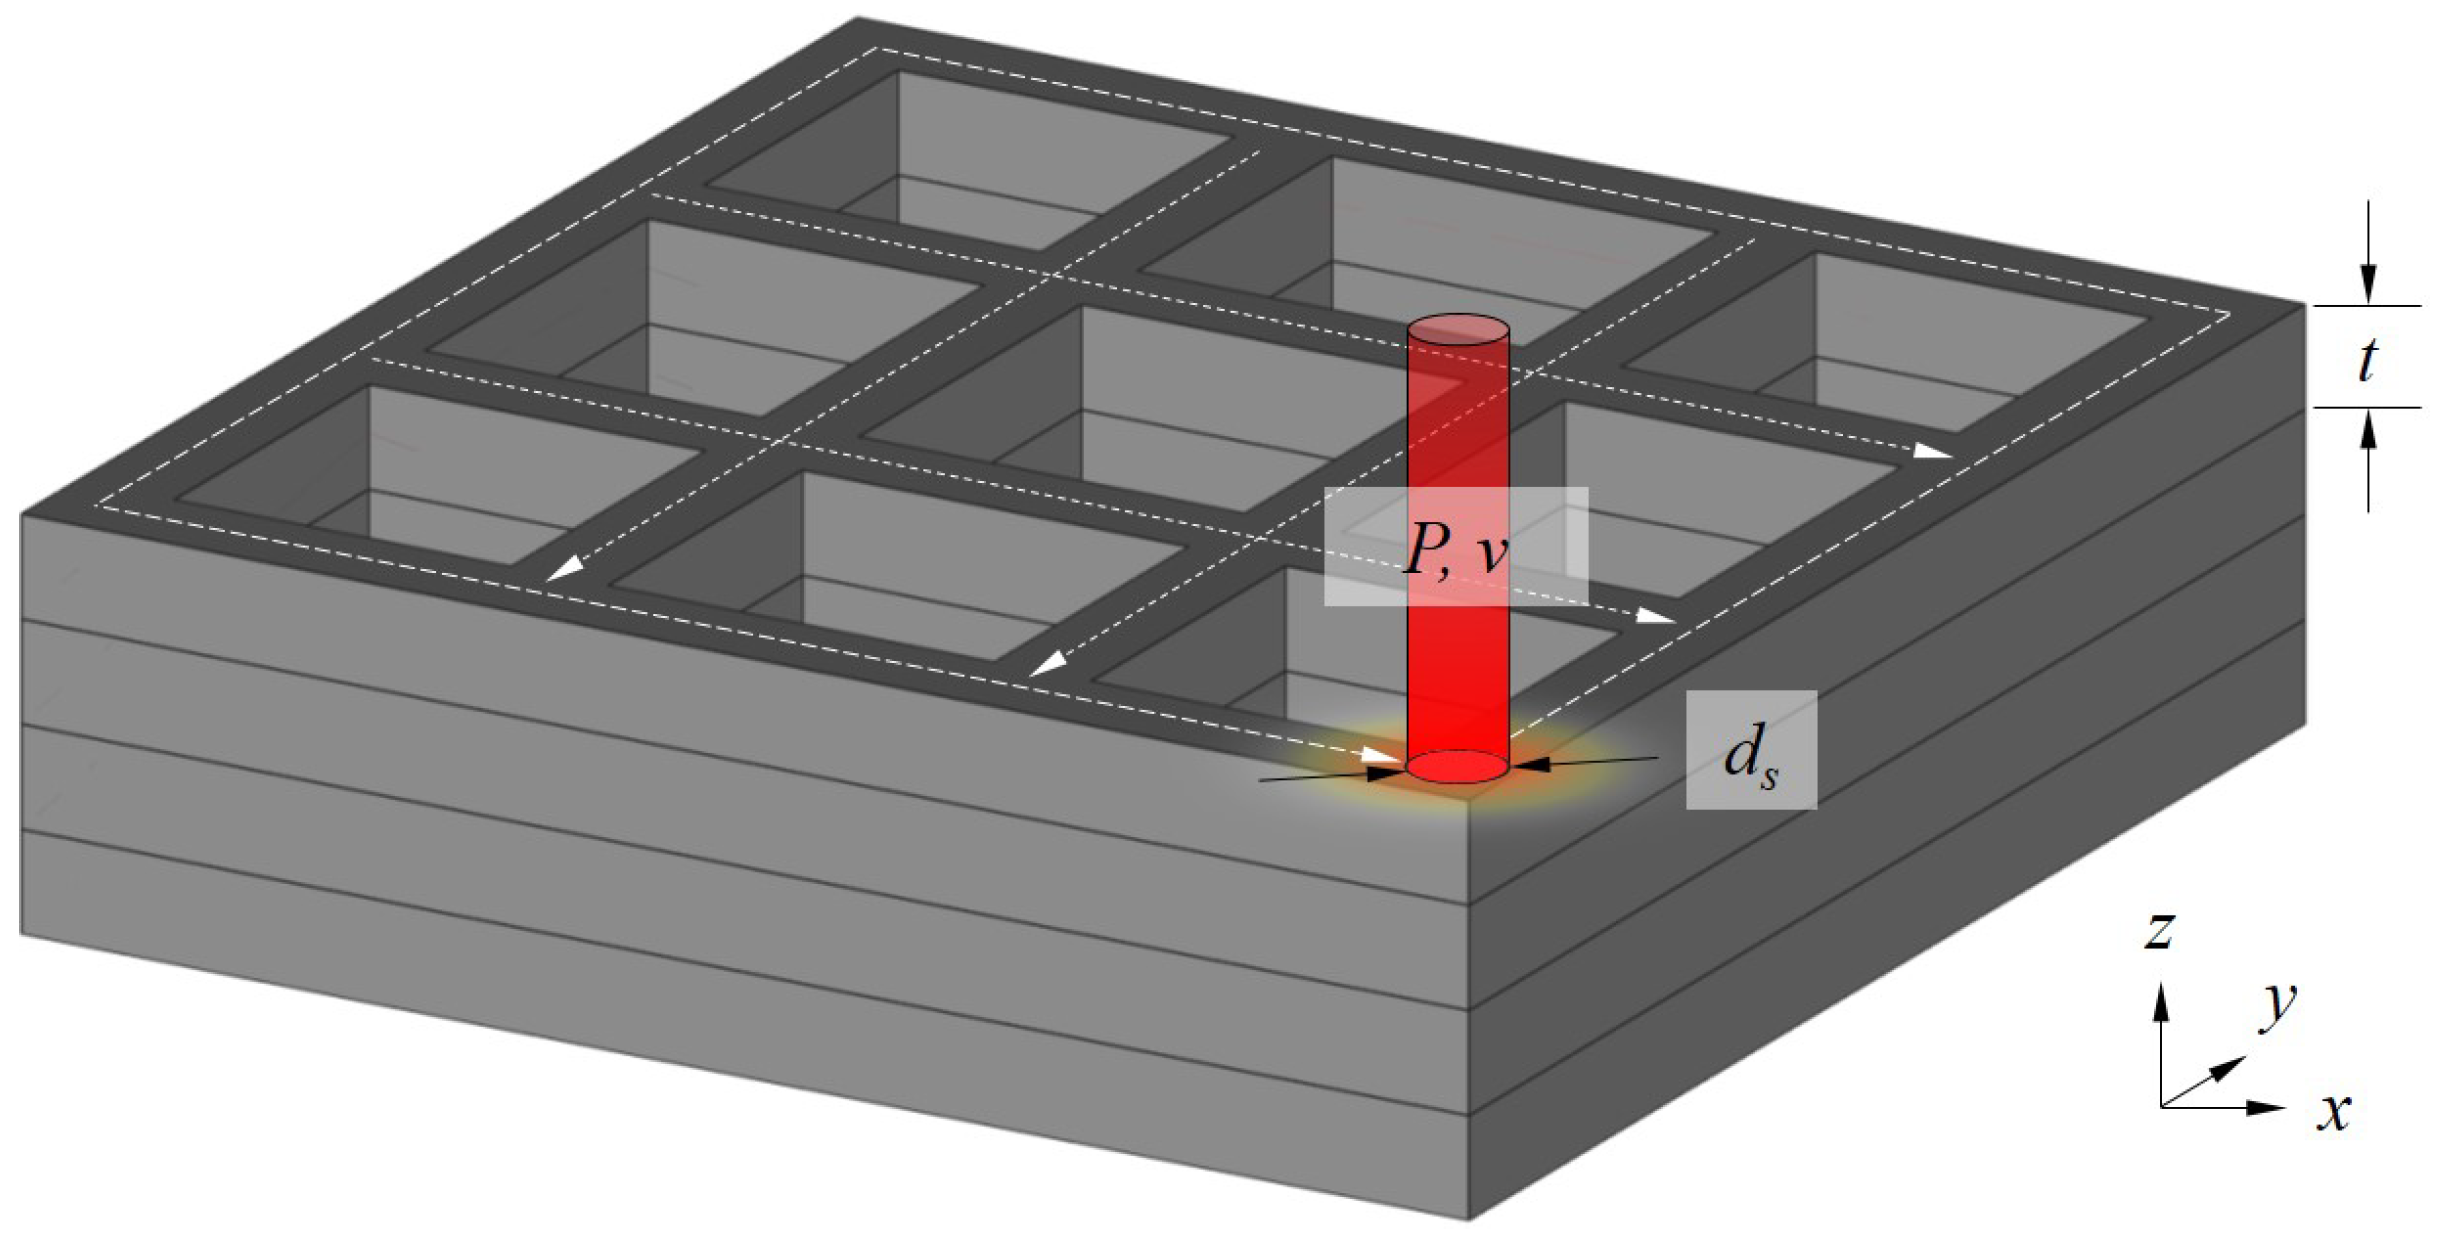
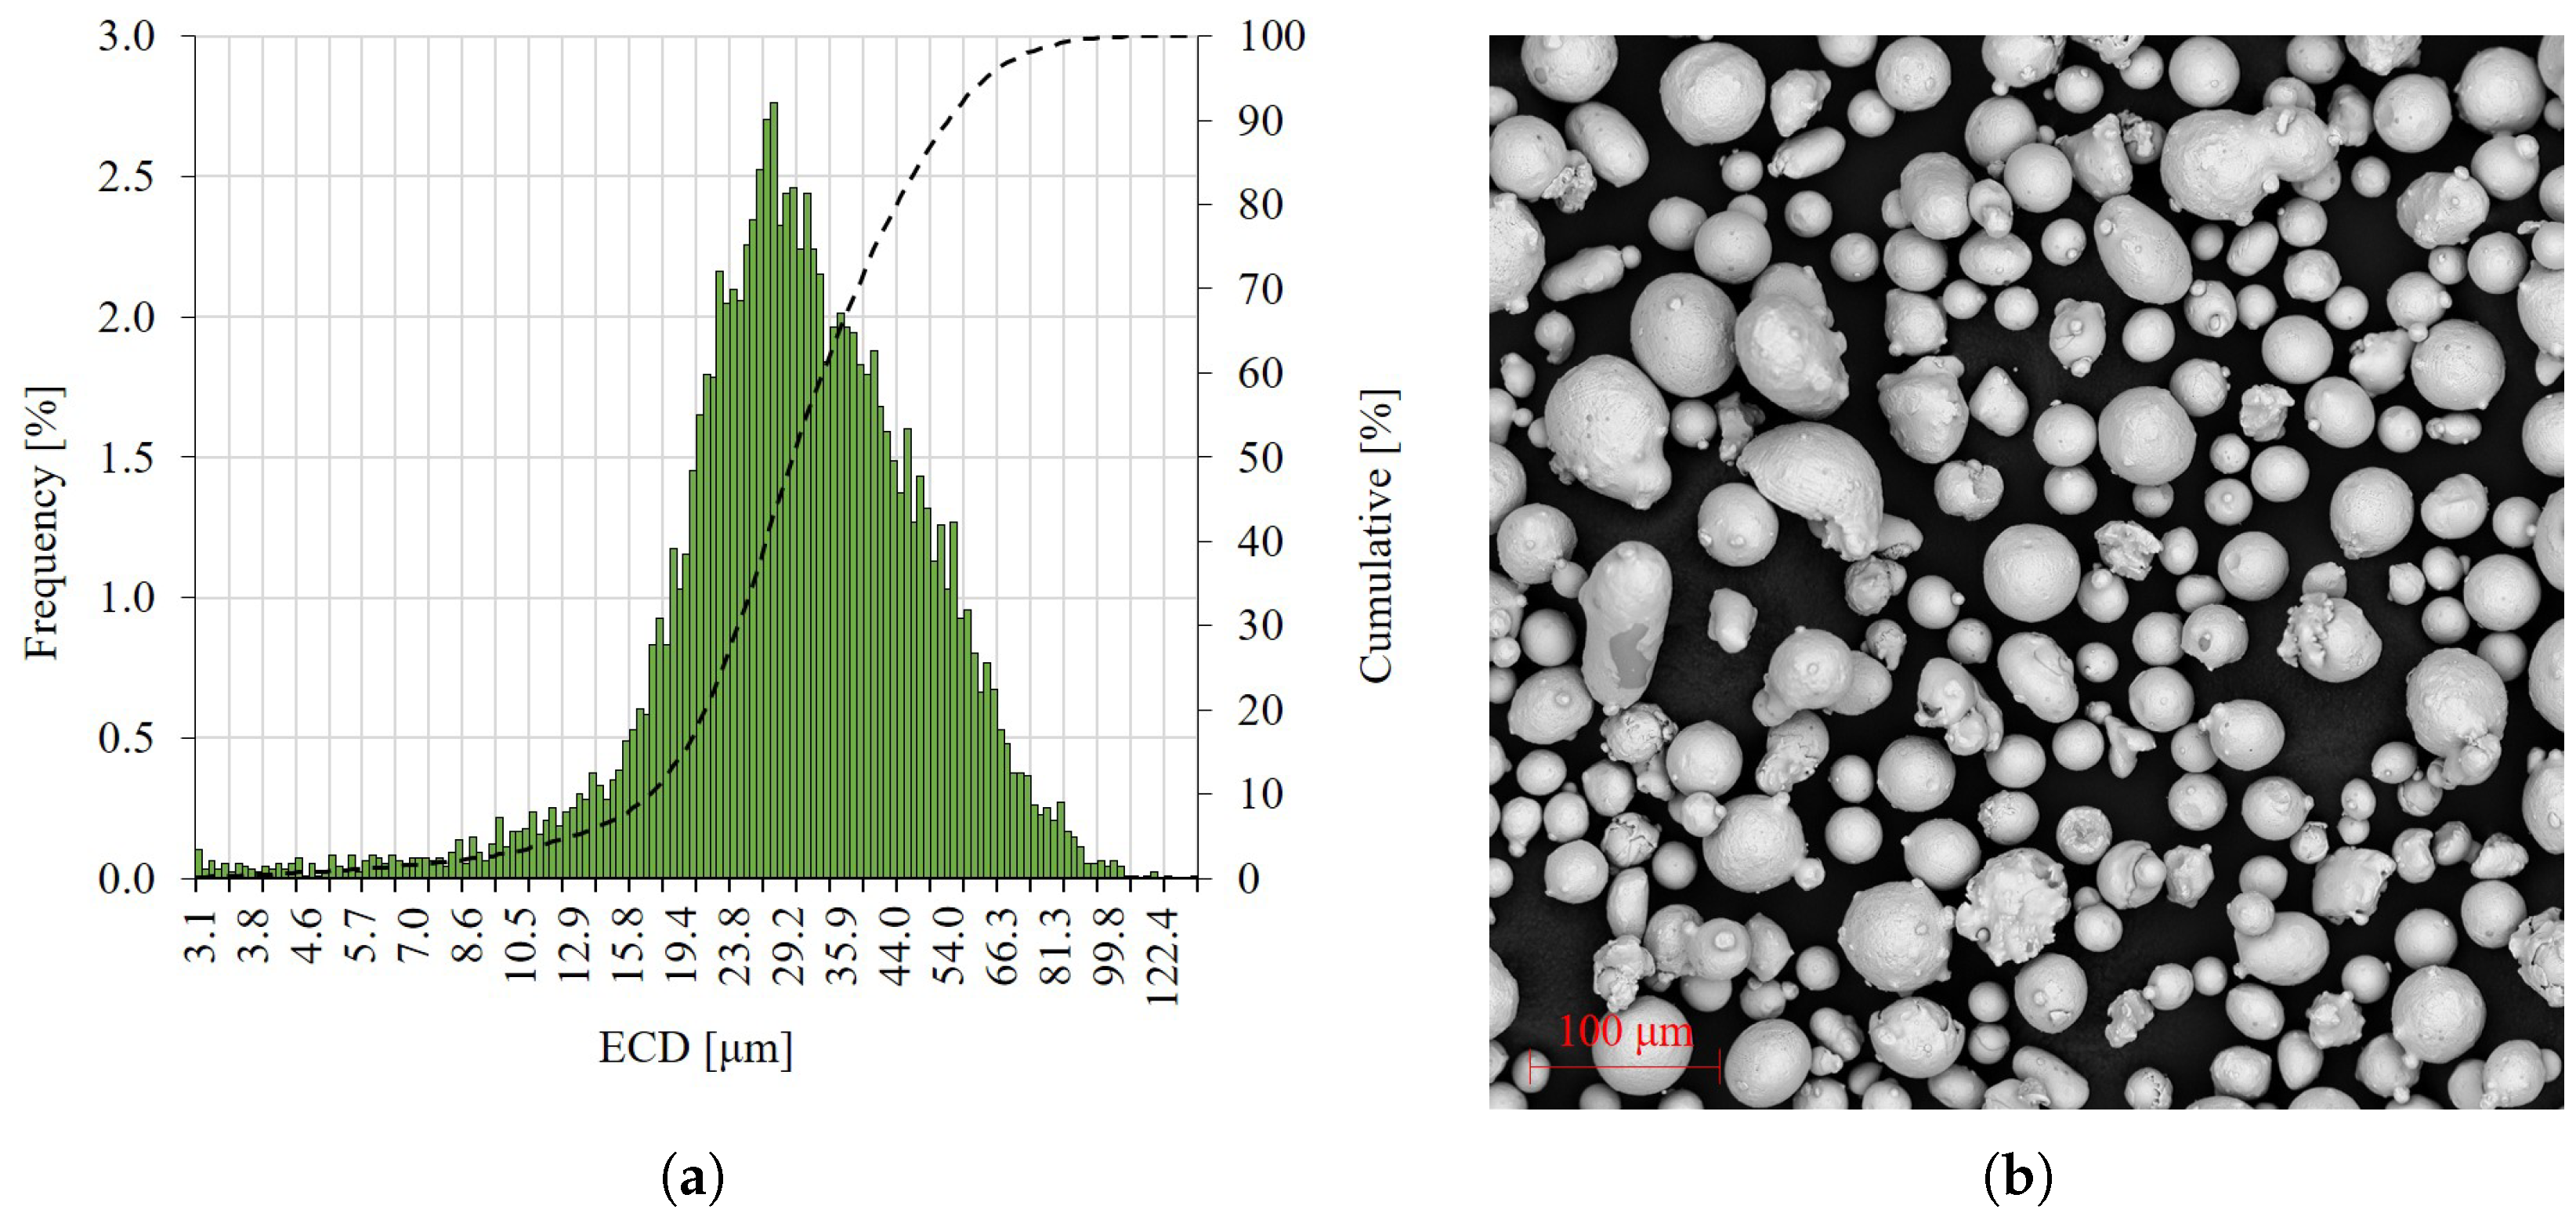
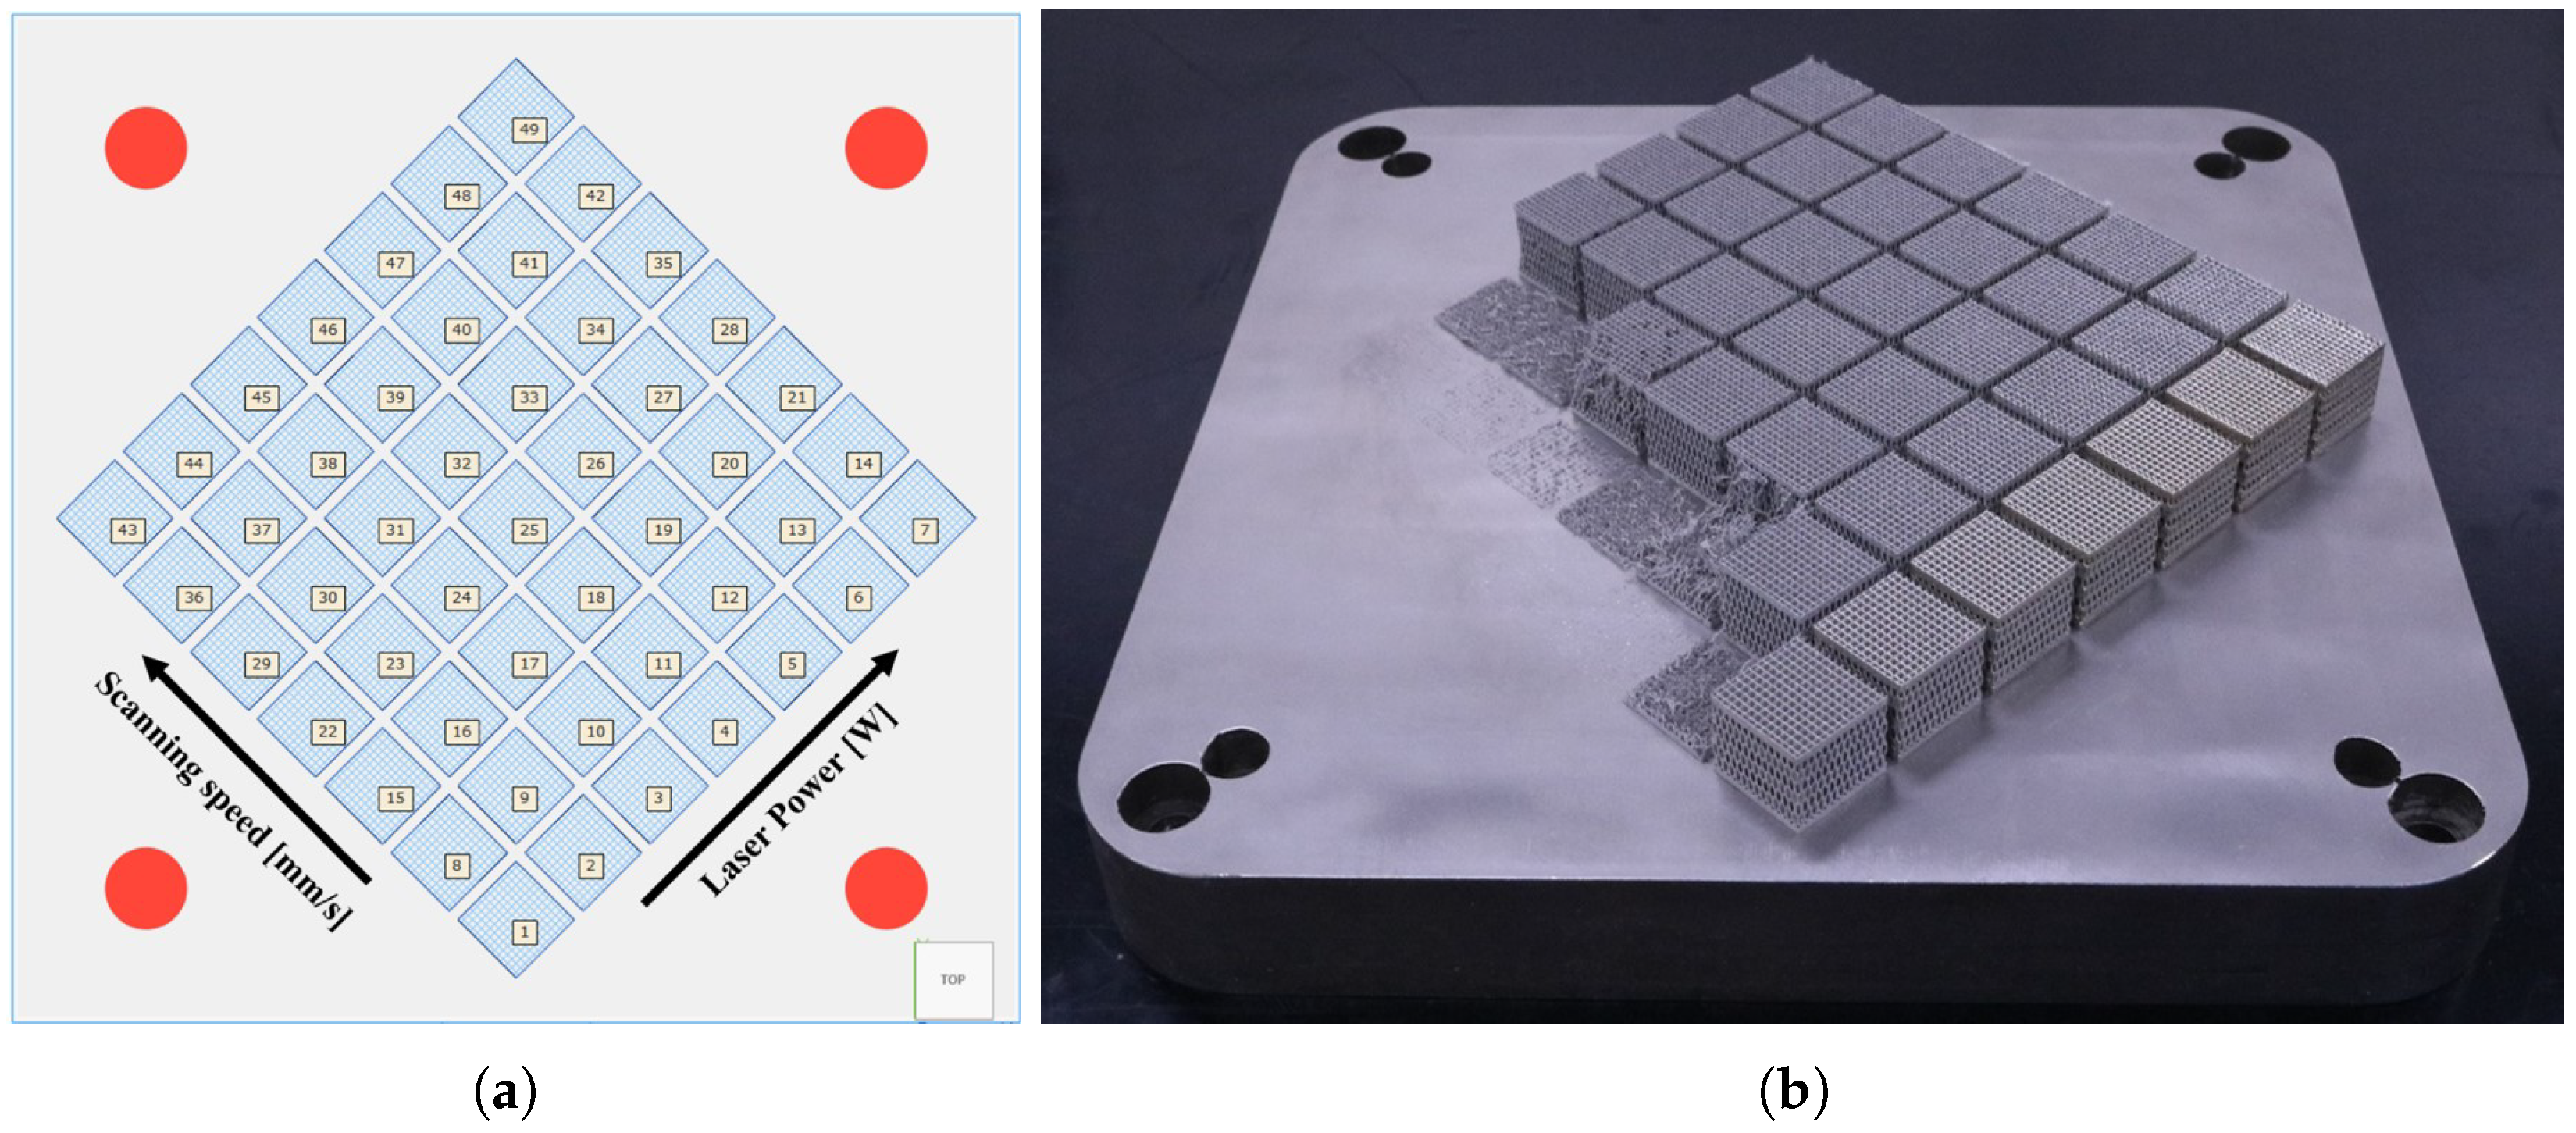
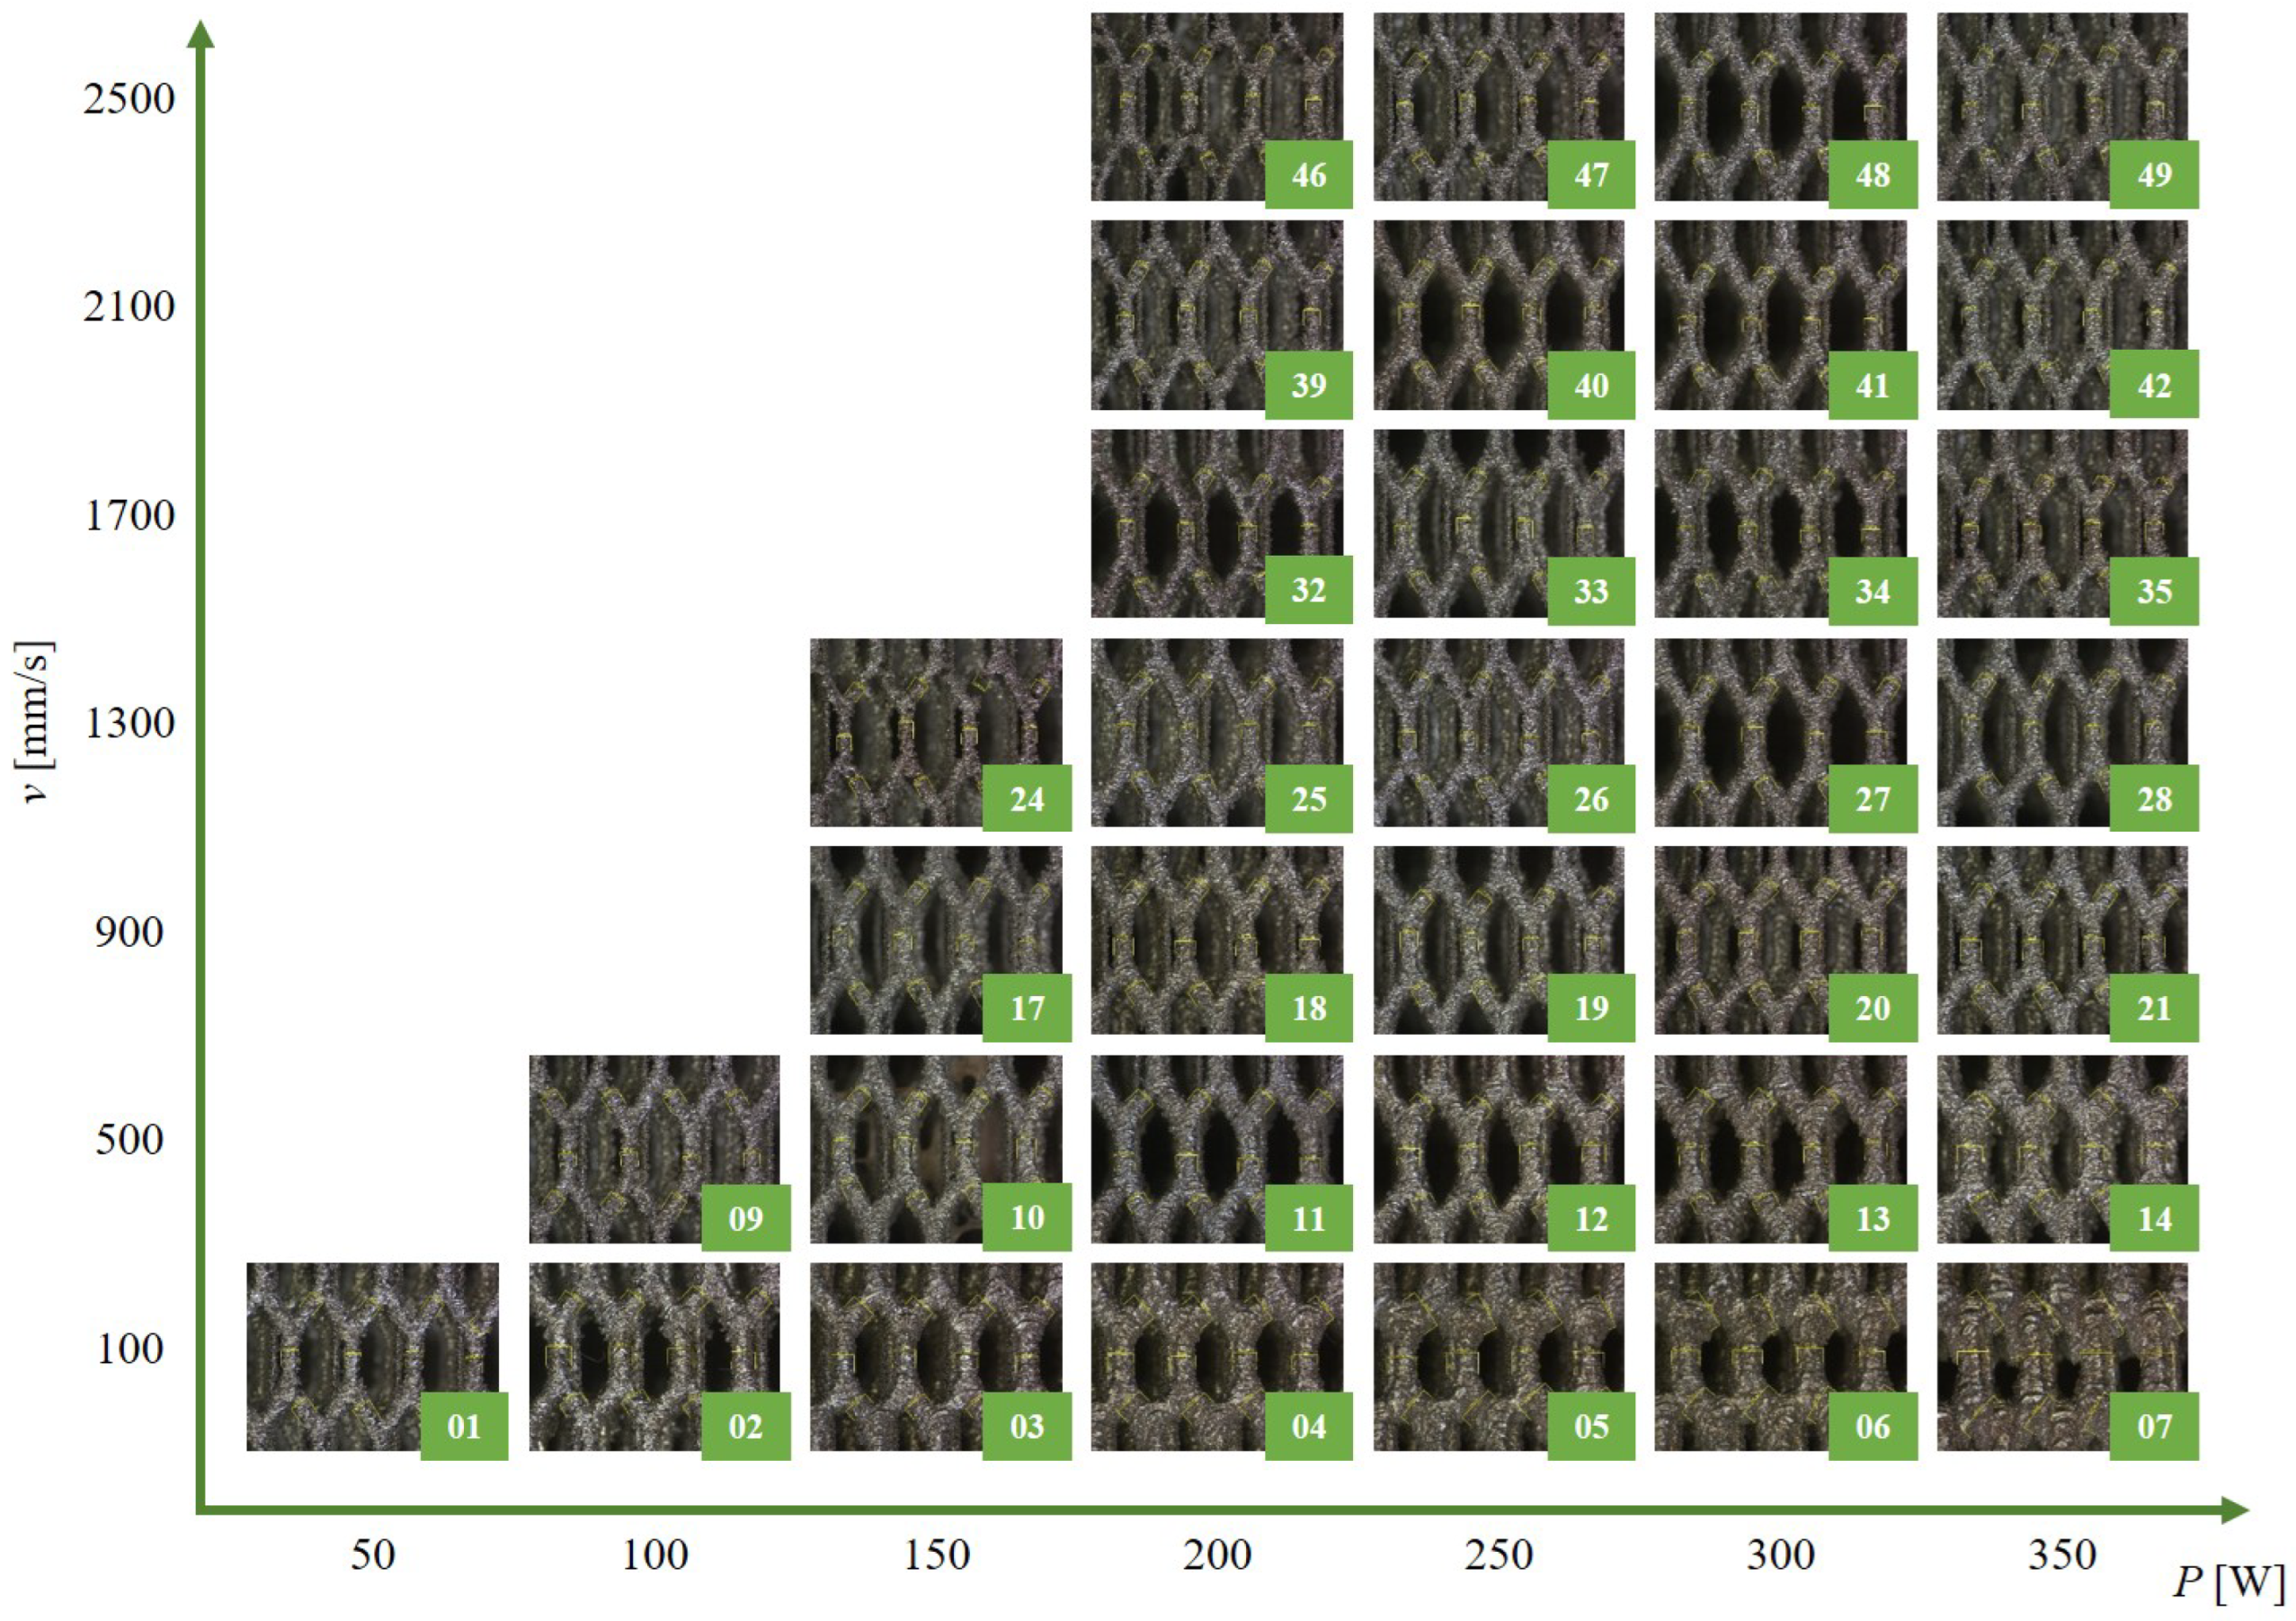
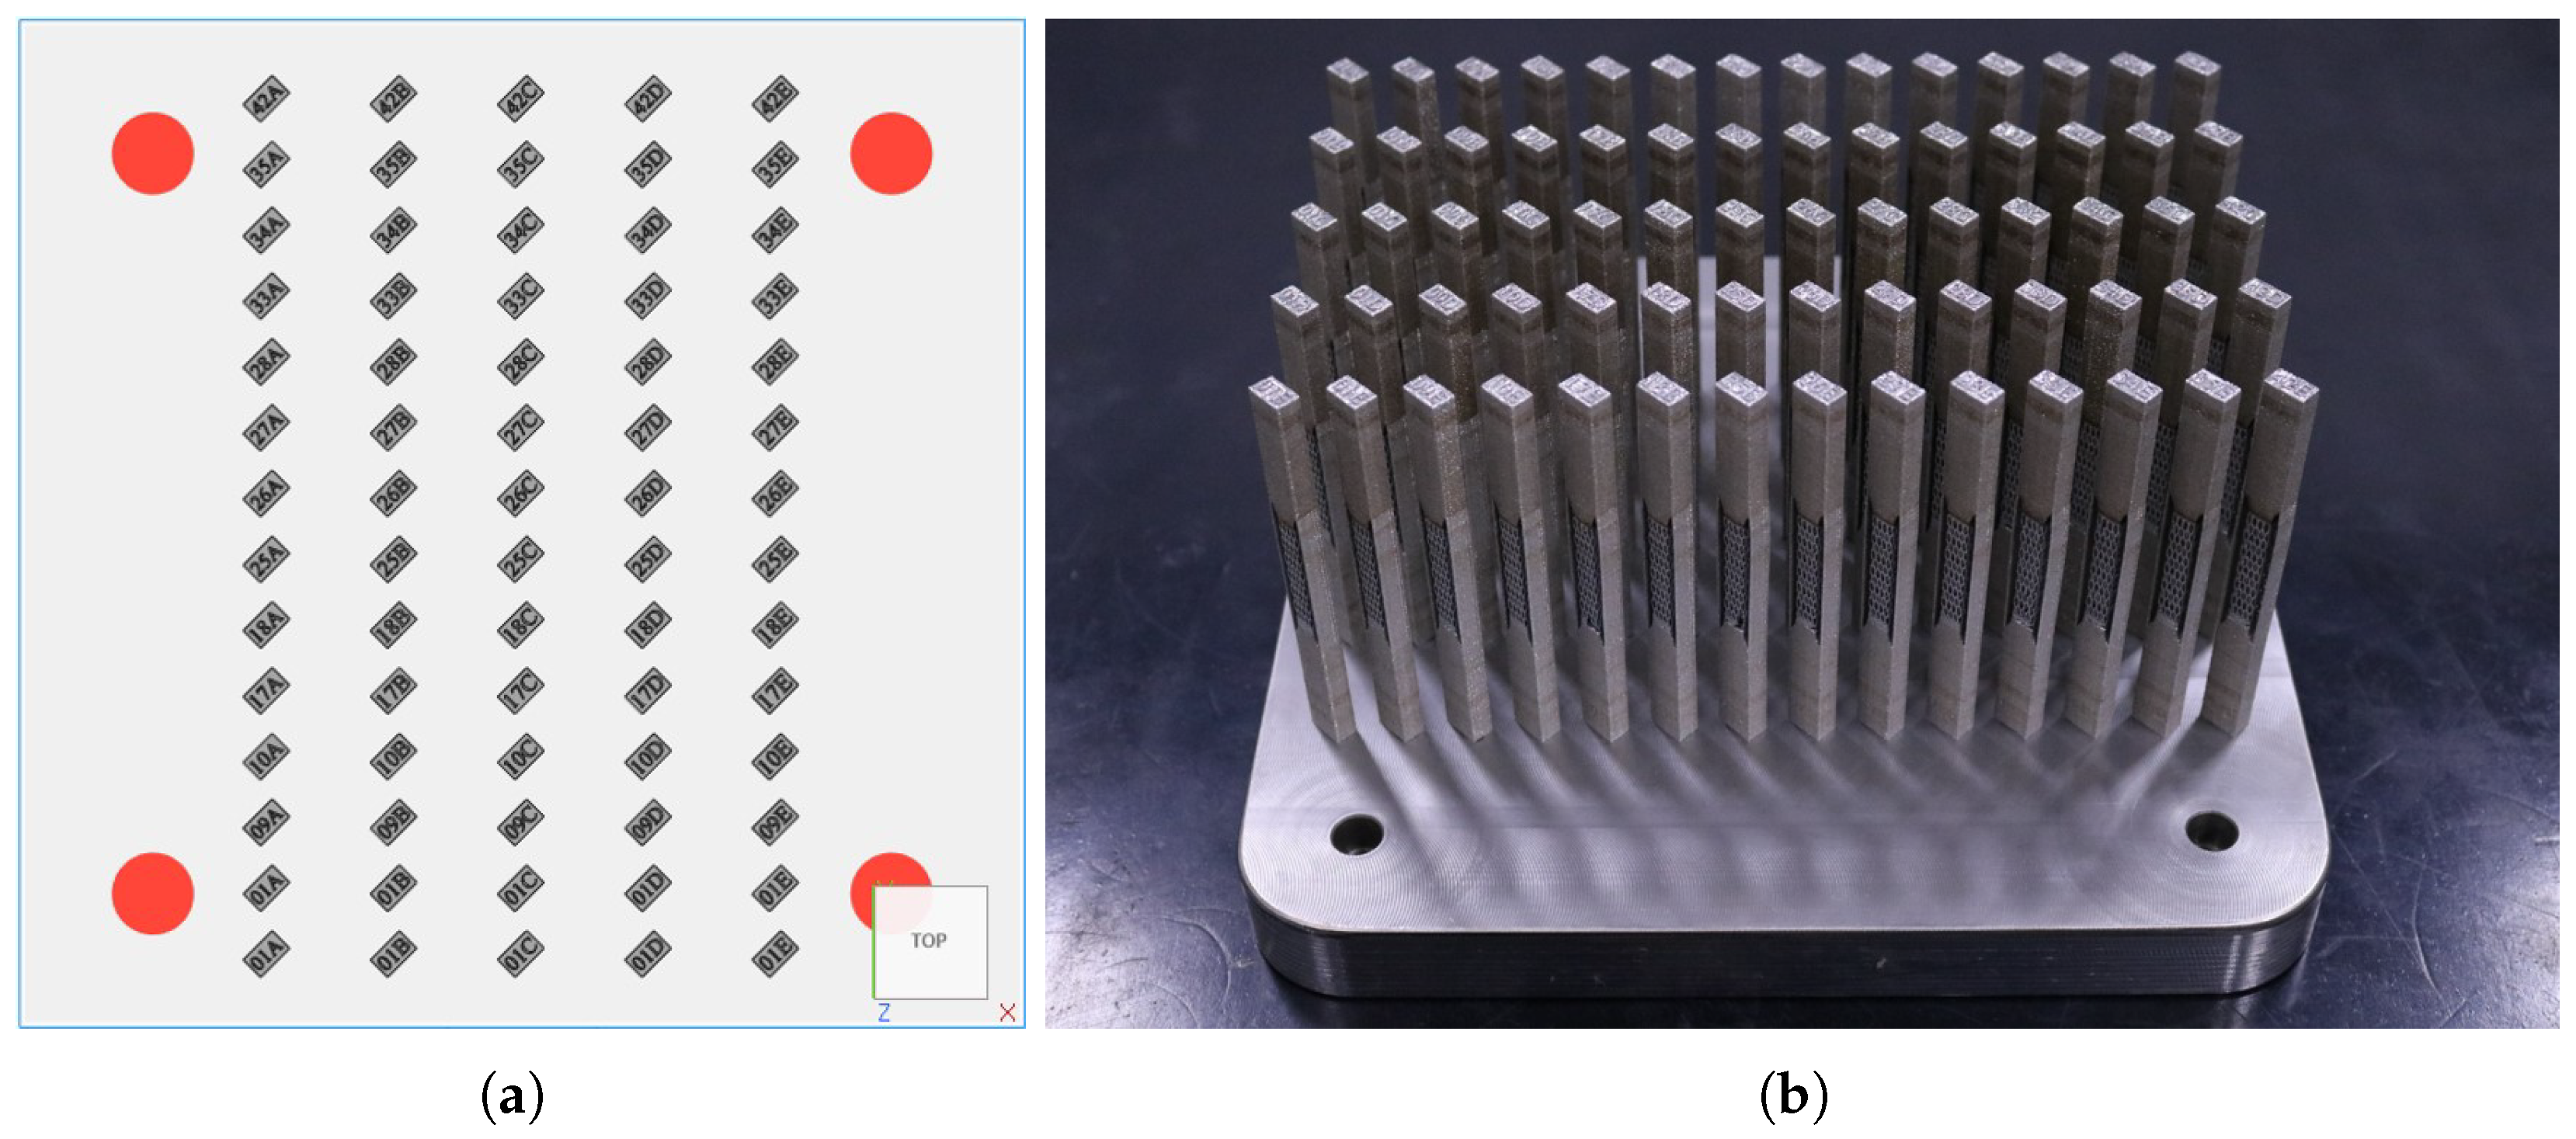
2.1. Processing Parameter Exploration

Since the processing of L-PBF can occur in a wide combination of values for P and v, the objective of the first stage was to build only the support structures and understand the impact of these parameters on the mass, processed dimensions, and comparing with their nominal dimensions. Table 1 shows the design parameters that were fixed in the whole work. In this experiment, P varied from 50 W to 350 W and v from 100 mm/s to 2500 mm/s, which results in an E L ranging from 0.020 J/mm to 3.500 J/mm, according to Equation (2). Planning a complete factorial design of experiments with two factors and seven levels results in 49 (72) different combinations of processing parameters.
The samples consisted of single-walled block type support structures with delimited size of 20.0 mm in length, 20.0 mm in width and 17.5 mm in height—a size sufficiently representative when compared to the samples used in Lindecke [22] and Leary [23]. Figure 4 shows an image of the sample, as well as how the dimensions w and b p were taken. Regarding b p , four adjacent horizontal beam thickness perforations and all sides were measured, while for w, four grid elements were chosen for the measurements and just the upper side was used. The average of the measurements was calculated as the actual dimensions of the structure. The standard deviation was also calculated.
The masses m of the samples were measured using a precision balance (Marte Tecnologia, model AD3300, São Carlos, SP, Brazil), with a resolution of 0.01 g. The dimensions w and b p of the supports were measured using a stereoscope (Carl Zeiss AG, model Discovery.V8, Oberkochen, Germany).
The first criterion adopted for approving the parameter set to the next stage was a definition of a tolerance for b p ; if this requirement was not met, then the candidate would not proceed to the next stage. The relative dimensional deviation is expressed by the nominal size of the beam perforation [ b p ] n o m , which is 0.40 mm, and its real size [ b p ] r e a l , which was measured. In this work, the tolerance was arbitrated at ±10%. Thus, the allowable dimensions of b p ranged between 0.36 mm and 0.44 mm. The requirement to keep b p within a tolerance range is because both pre- and post-processing stages of manufacturing can be compromised if it is not met. For instance, if the actual size of the support structures cannot be predicted, numerical simulation models of the process may lose their accuracy. Another issue that may arise from the oversizing of the support structure dimensions is the difficulty of depowdering. The second criterion was the absence of macroscopic defects (e.g., poor consolidation) identified through visual inspection.
To better understand the impact of processing parameters in terms of P, v and E L on the dimensional results and stability of support structures, a power regression ( α ^ ) based on the theoretical development shown previously in Equation (3) was implemented, as expressed in Equation (4). In this formulation, a 0 and a 1 are the coefficients from this expression. The expression is written as
α ^ = a 0 + a 1 × E L = a 0 + a 1 × P v .

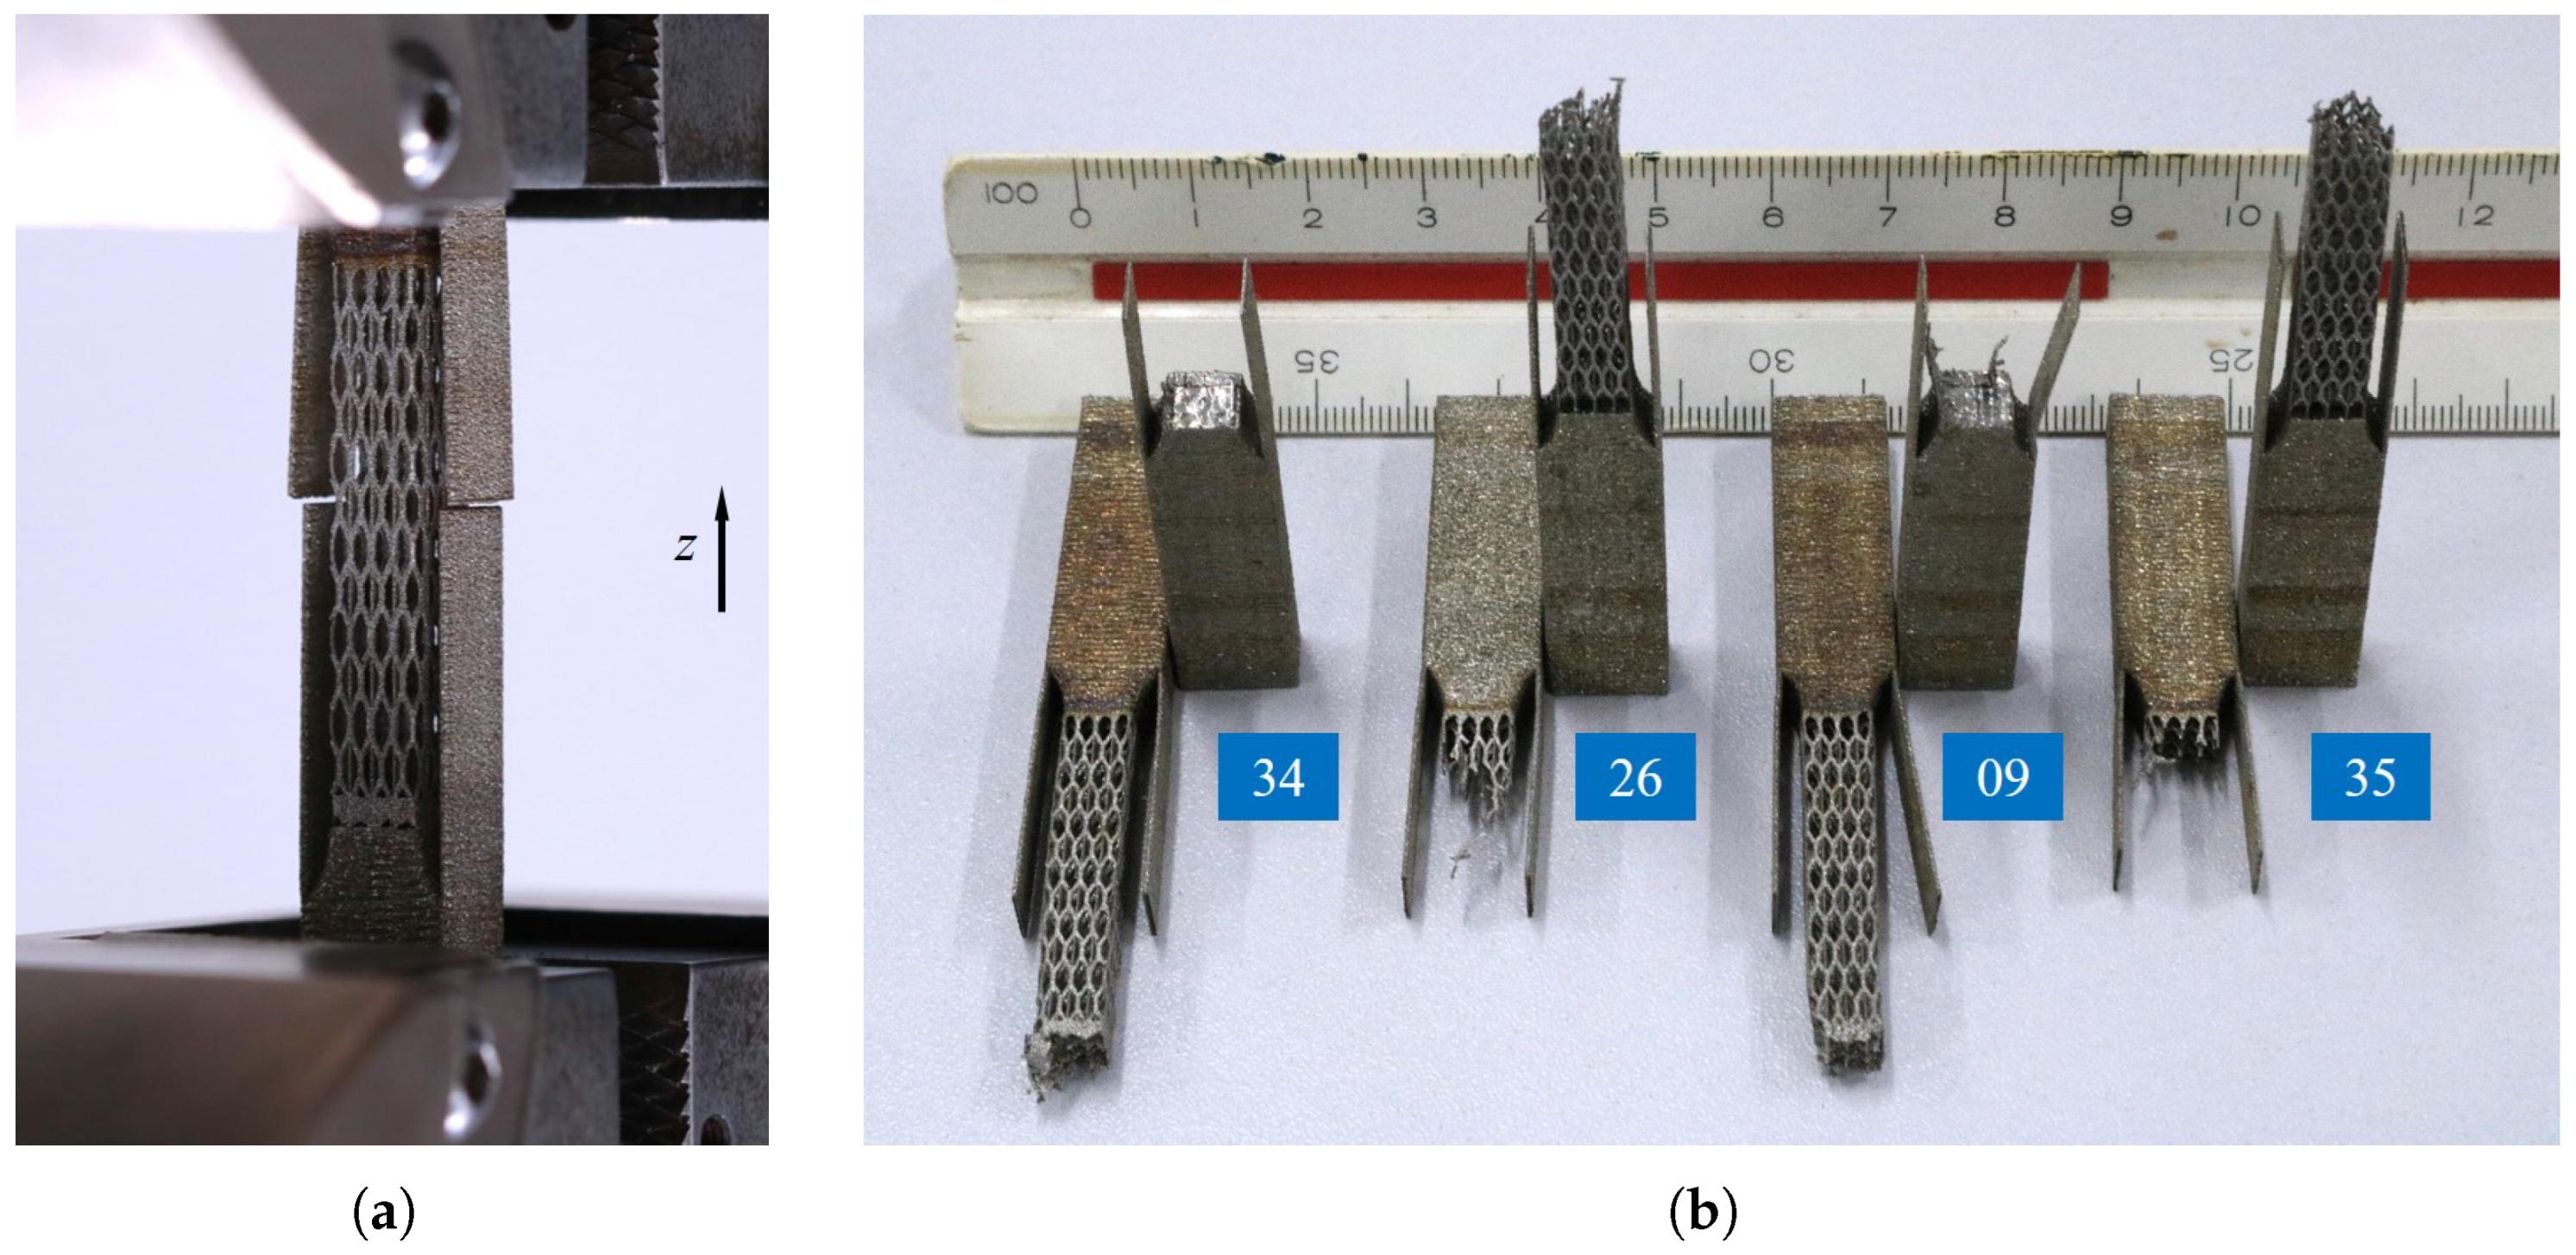
2.2. Mechanical Characterization

The objective of the second stage was to characterize the maximum load F m a x resisted by the support structures with the qualified combinations of P and v from the first stage. The strength specimens were designed and tested based on the standard ASTM-E8/E8M [31], as depicted in Figure 5. The specimen design was adapted with auxiliary struts with thickness T a u x aiming to protect the support structures from residual stresses and enhance heat dissipation during L-PBF processing, since it was the object of study [22,26,32]. After the fabrication was concluded, the struts were cut via WEDM. Besides the design description, a [ z ] o u of 0.12 mm, a [ z ] o l of 0.30 mm, a [ x y ] o of 0.20 mm and T a u x of 0.45 mm were implemented. The tensile strength tests were conducted using a universal testing machine from Instron, model 5988, with a cell load of 4 kN with a minimum resolution of 0.01 N. In addition, a preload of 50 N and a displacement rate of 0.025 mm/s was used.
Based on the F m a x results, a response surface method (RSM), defined as β ^ , was proposed to describe the behavior of the strength in relation to the parameters combination, according to Equation (5). In this context, b 0 , b 1 , b 2 , b 3 , b 4 and b 5 are coefficients from the quadratic regression. With the RSM result, it was possible to obtain an optimal candidate according to the dimensional constraints defined in the exploratory stage. The RSM and the optimization problem were solved using the MATLAB, version R2023a, algorithm developed for using quadratic regression and optimization with linear constraints. The polynomial expression is written as
β ^ = b 0 + b 1 × P + b 2 × v + b 3 × P × v + b 4 × P 2 + b 5 × v 2 .
With the results in hand, the analysis could be carried out by examining the results as a whole. First, the effective strength ( σ e f f ), and the tensile projected strength ( σ p r o j ) were calculated using Equation (6) and Equation (7), respectively, as described by Bobbio [21]. In this experiment, σ e f f was calculated by dividing F m a x , obtained in the mechanical characterization stage, and the effective section area ( A e f f ). The effective section area was calculated using the real scanning track width (w), determined during the processing parameter-exploration stage, and the laser scanning length (l) depending on the location of the fracture, which was obtained with assistance of Magics 26.06 software. In the other hand, σ p r o j was calculated by also dividing F m a x by the projected area ( A p r o j ), which is the multiplication of the length (L) and width (W) of the projection, as depicted in Figure 5. The tensile strengths are written as
σ e f f = F m a x A e f f = F m a x w × l ,
σ p r o j = F m a x A p r o j = F m a x W × L .
Bobbio [21] discussed in their work that σ p r o j represents the relative strength with respect to the support’s projected area, while σ e f f expresses the strength of the effectively connected material. In this work, while σ e f f reflects the strength of the effective processed material varying with the processing parameters combination, σ p r o j represents the tensile strength of the projected support structure area, which remains always the same, regardless of the used processing parameter set. When σ e f f is divided by the maximum tensile strength of the material ( σ u l t ), the result reveals the extent of defects and the stress concentrations present within the support. On the other hand, when σ p r o j is divided by σ u l t , the result normalizes the selected parameter set configuration of the support structure strength in relation to the maximum strength of the material.
Lastly, one additional proposition that can be made to select the best parameter set is calculating a structural efficiency ( I s u p p ), given by Equation (8). In this expression, m is measured in the processing parameter exploration stage, and V d e l is the delimited volume defined by the sample main dimensions, in this case 20.0 × 20.0 × 17.5 mm3, as exhibited in Figure 4. The structural efficiency is defined as
I s u p p = F m a x m / V d e l .

3. Results and Discussions

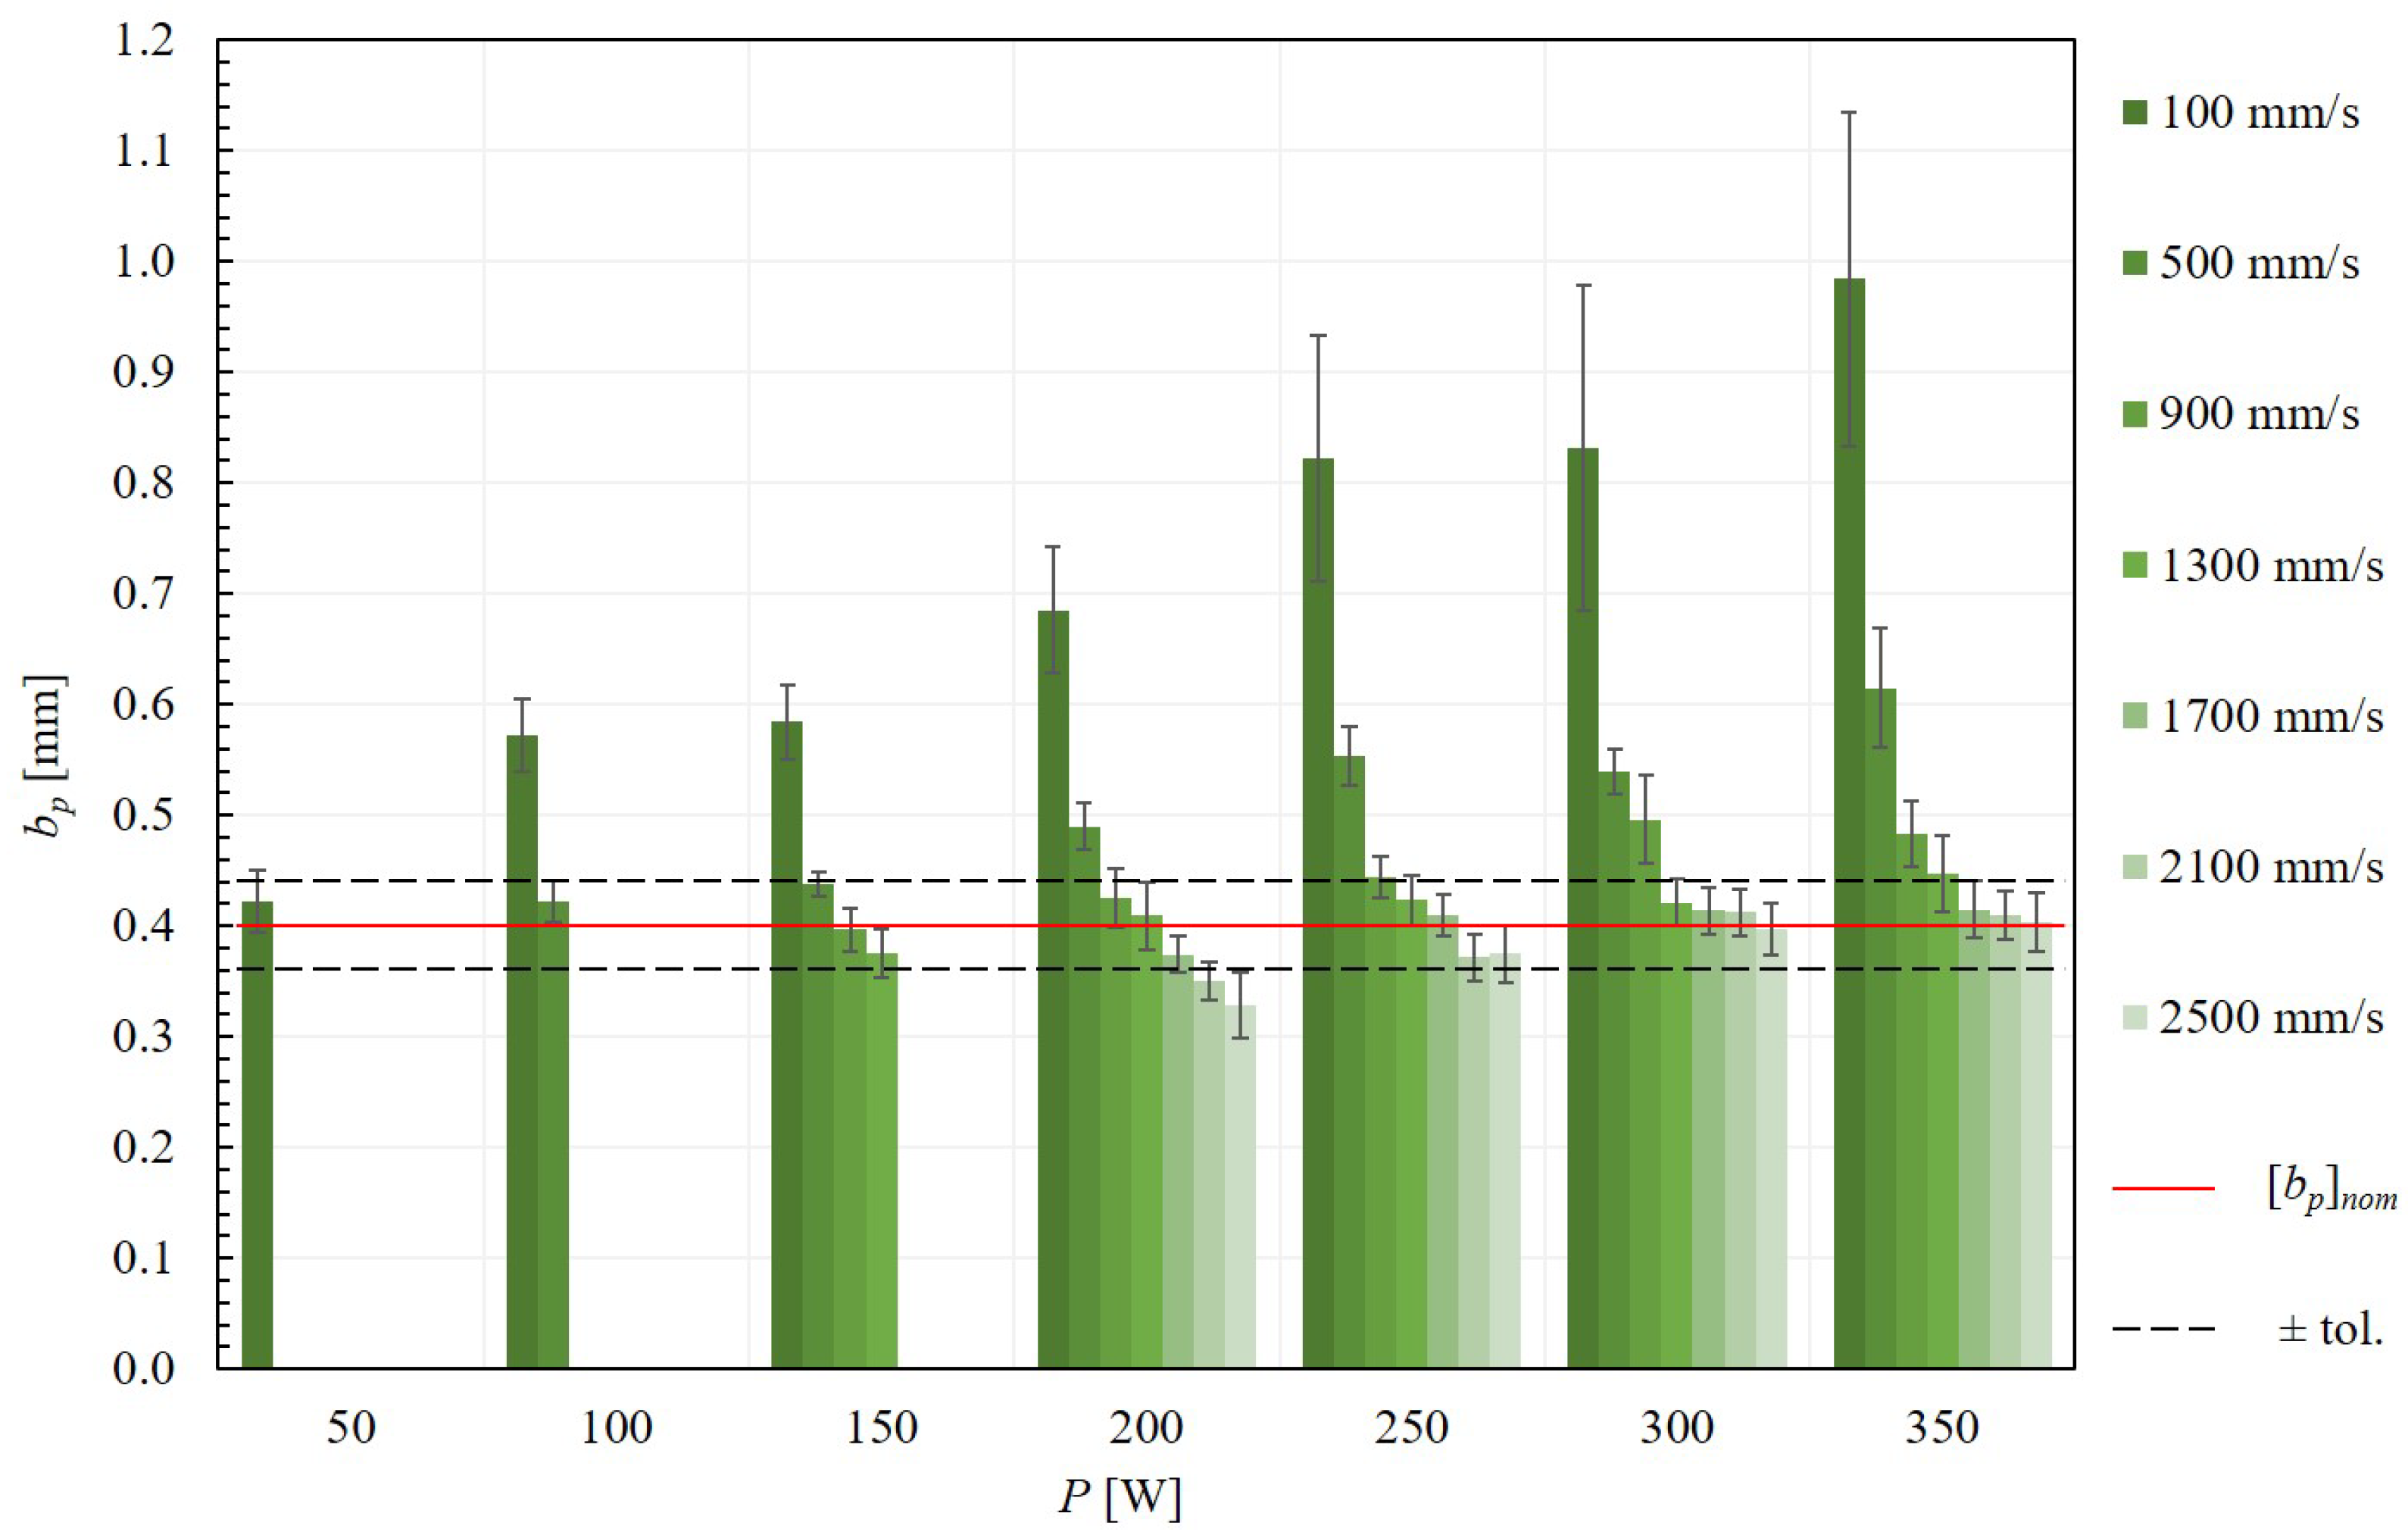
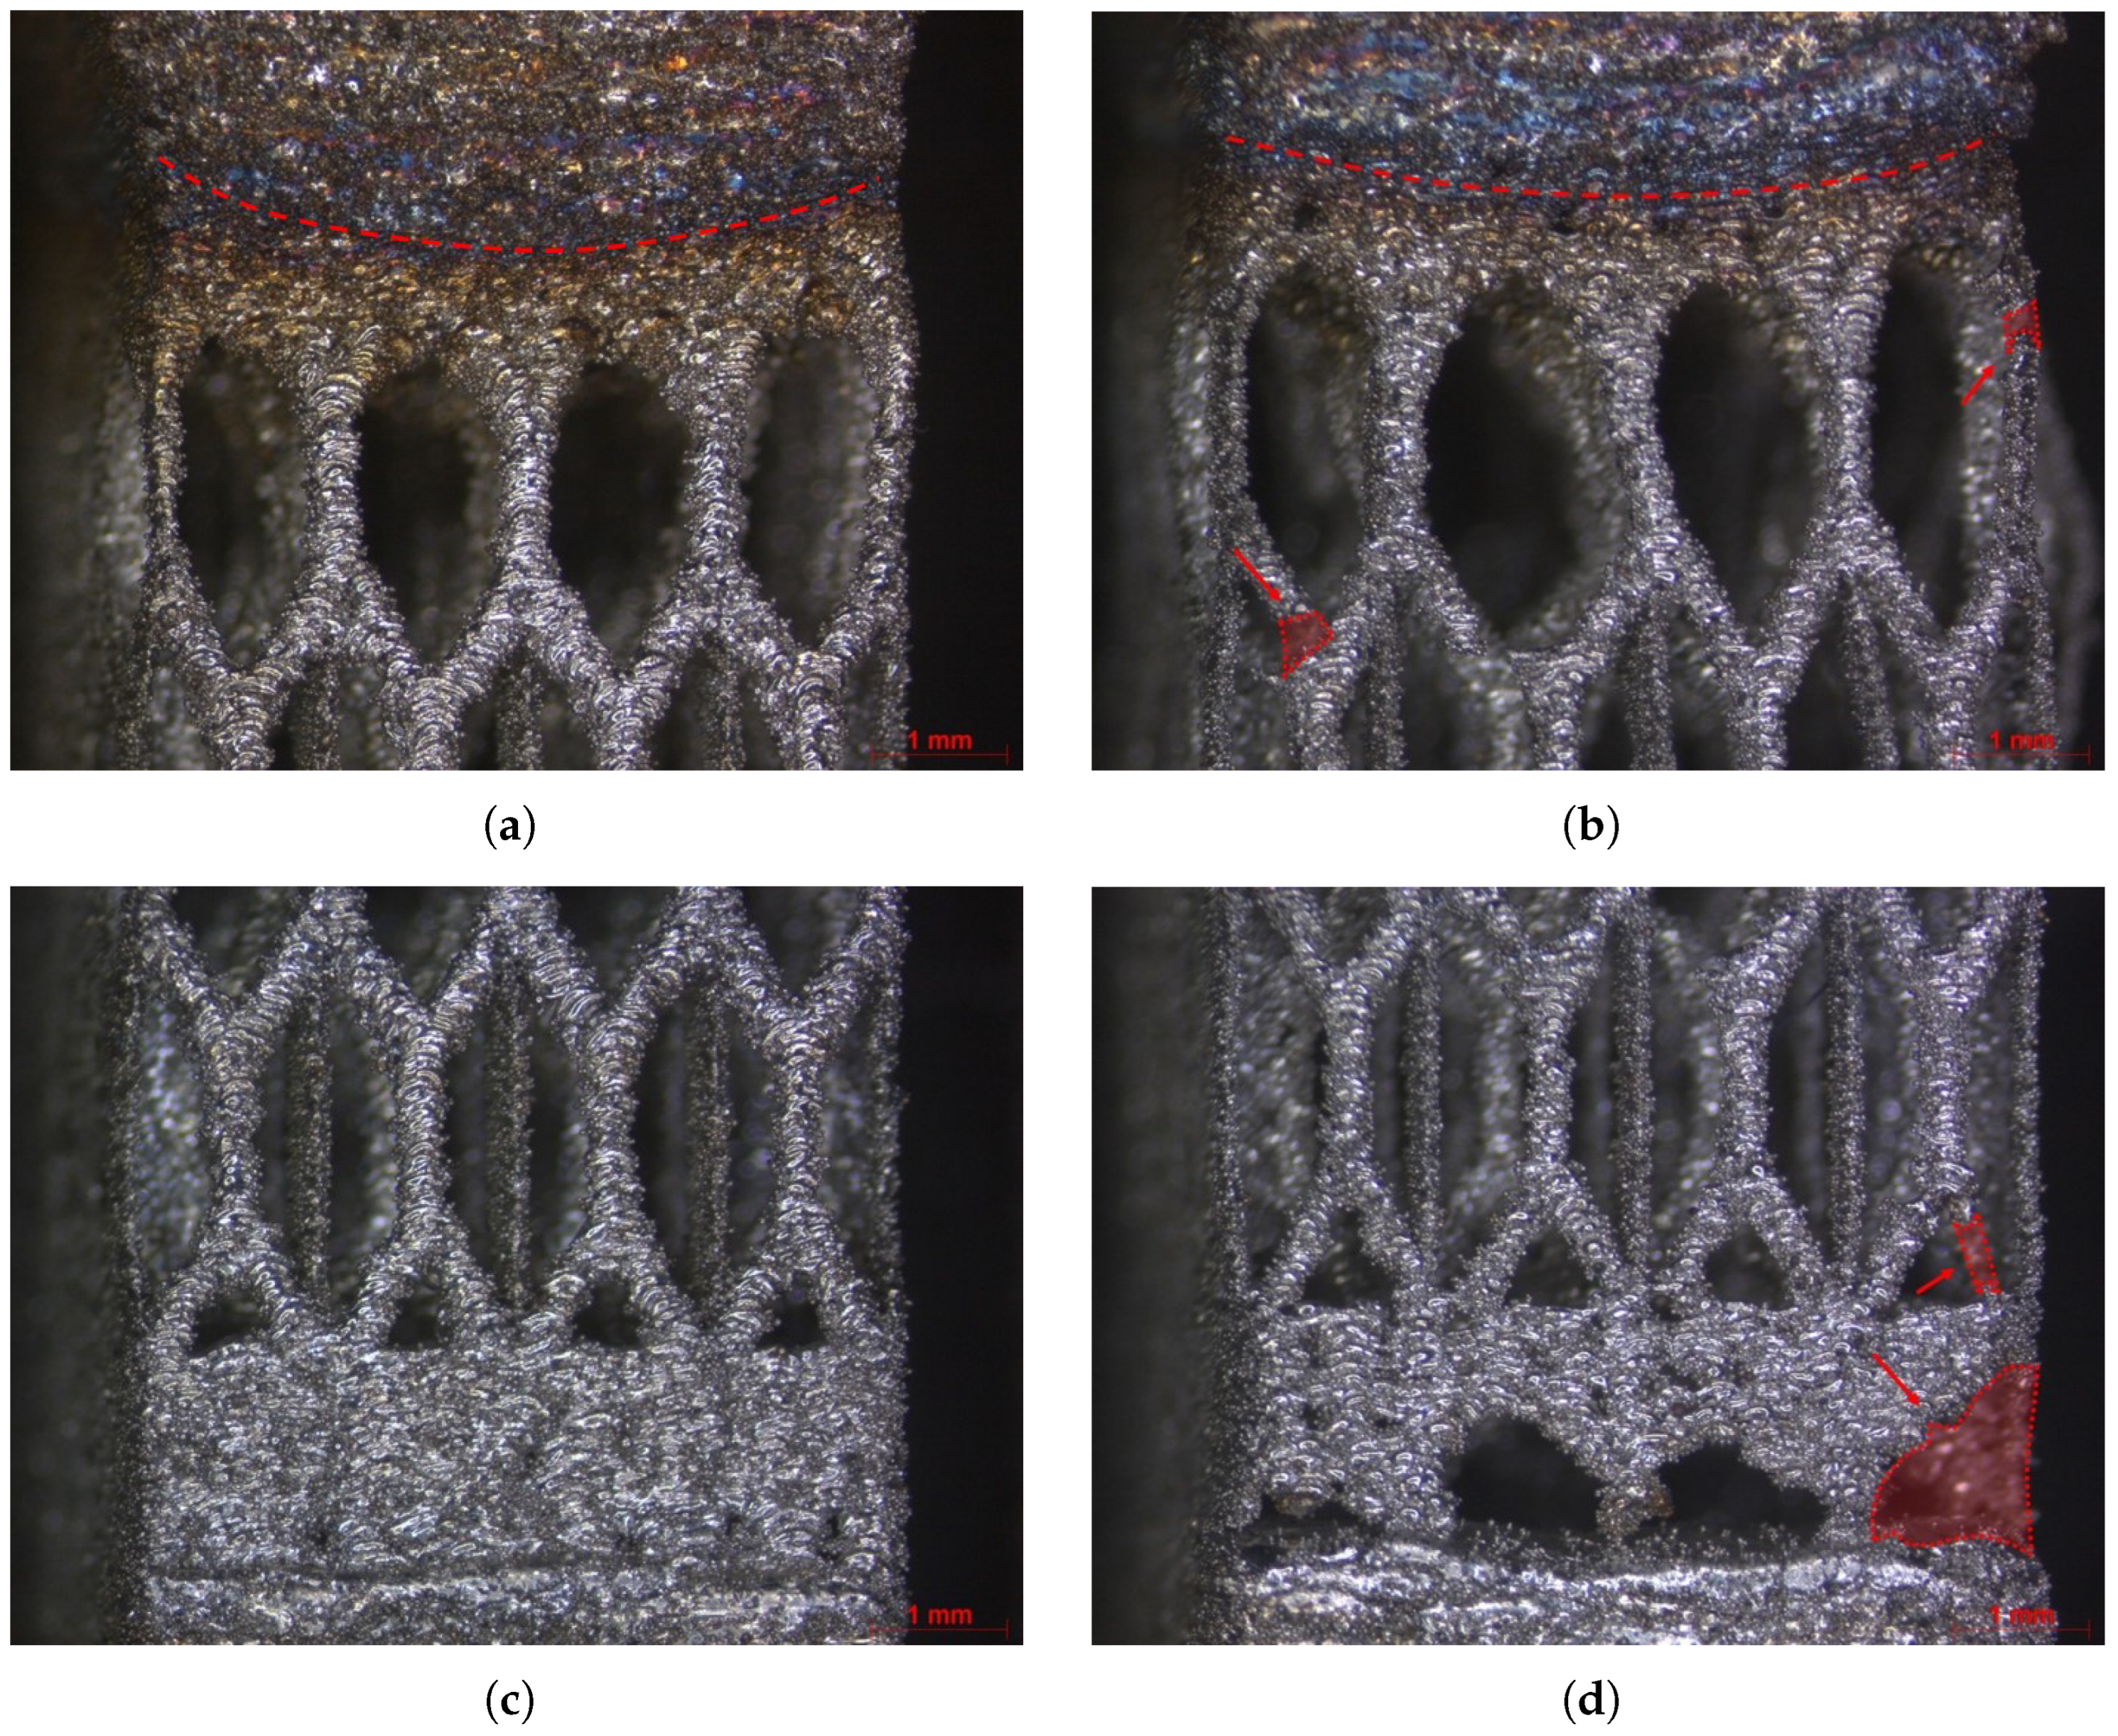
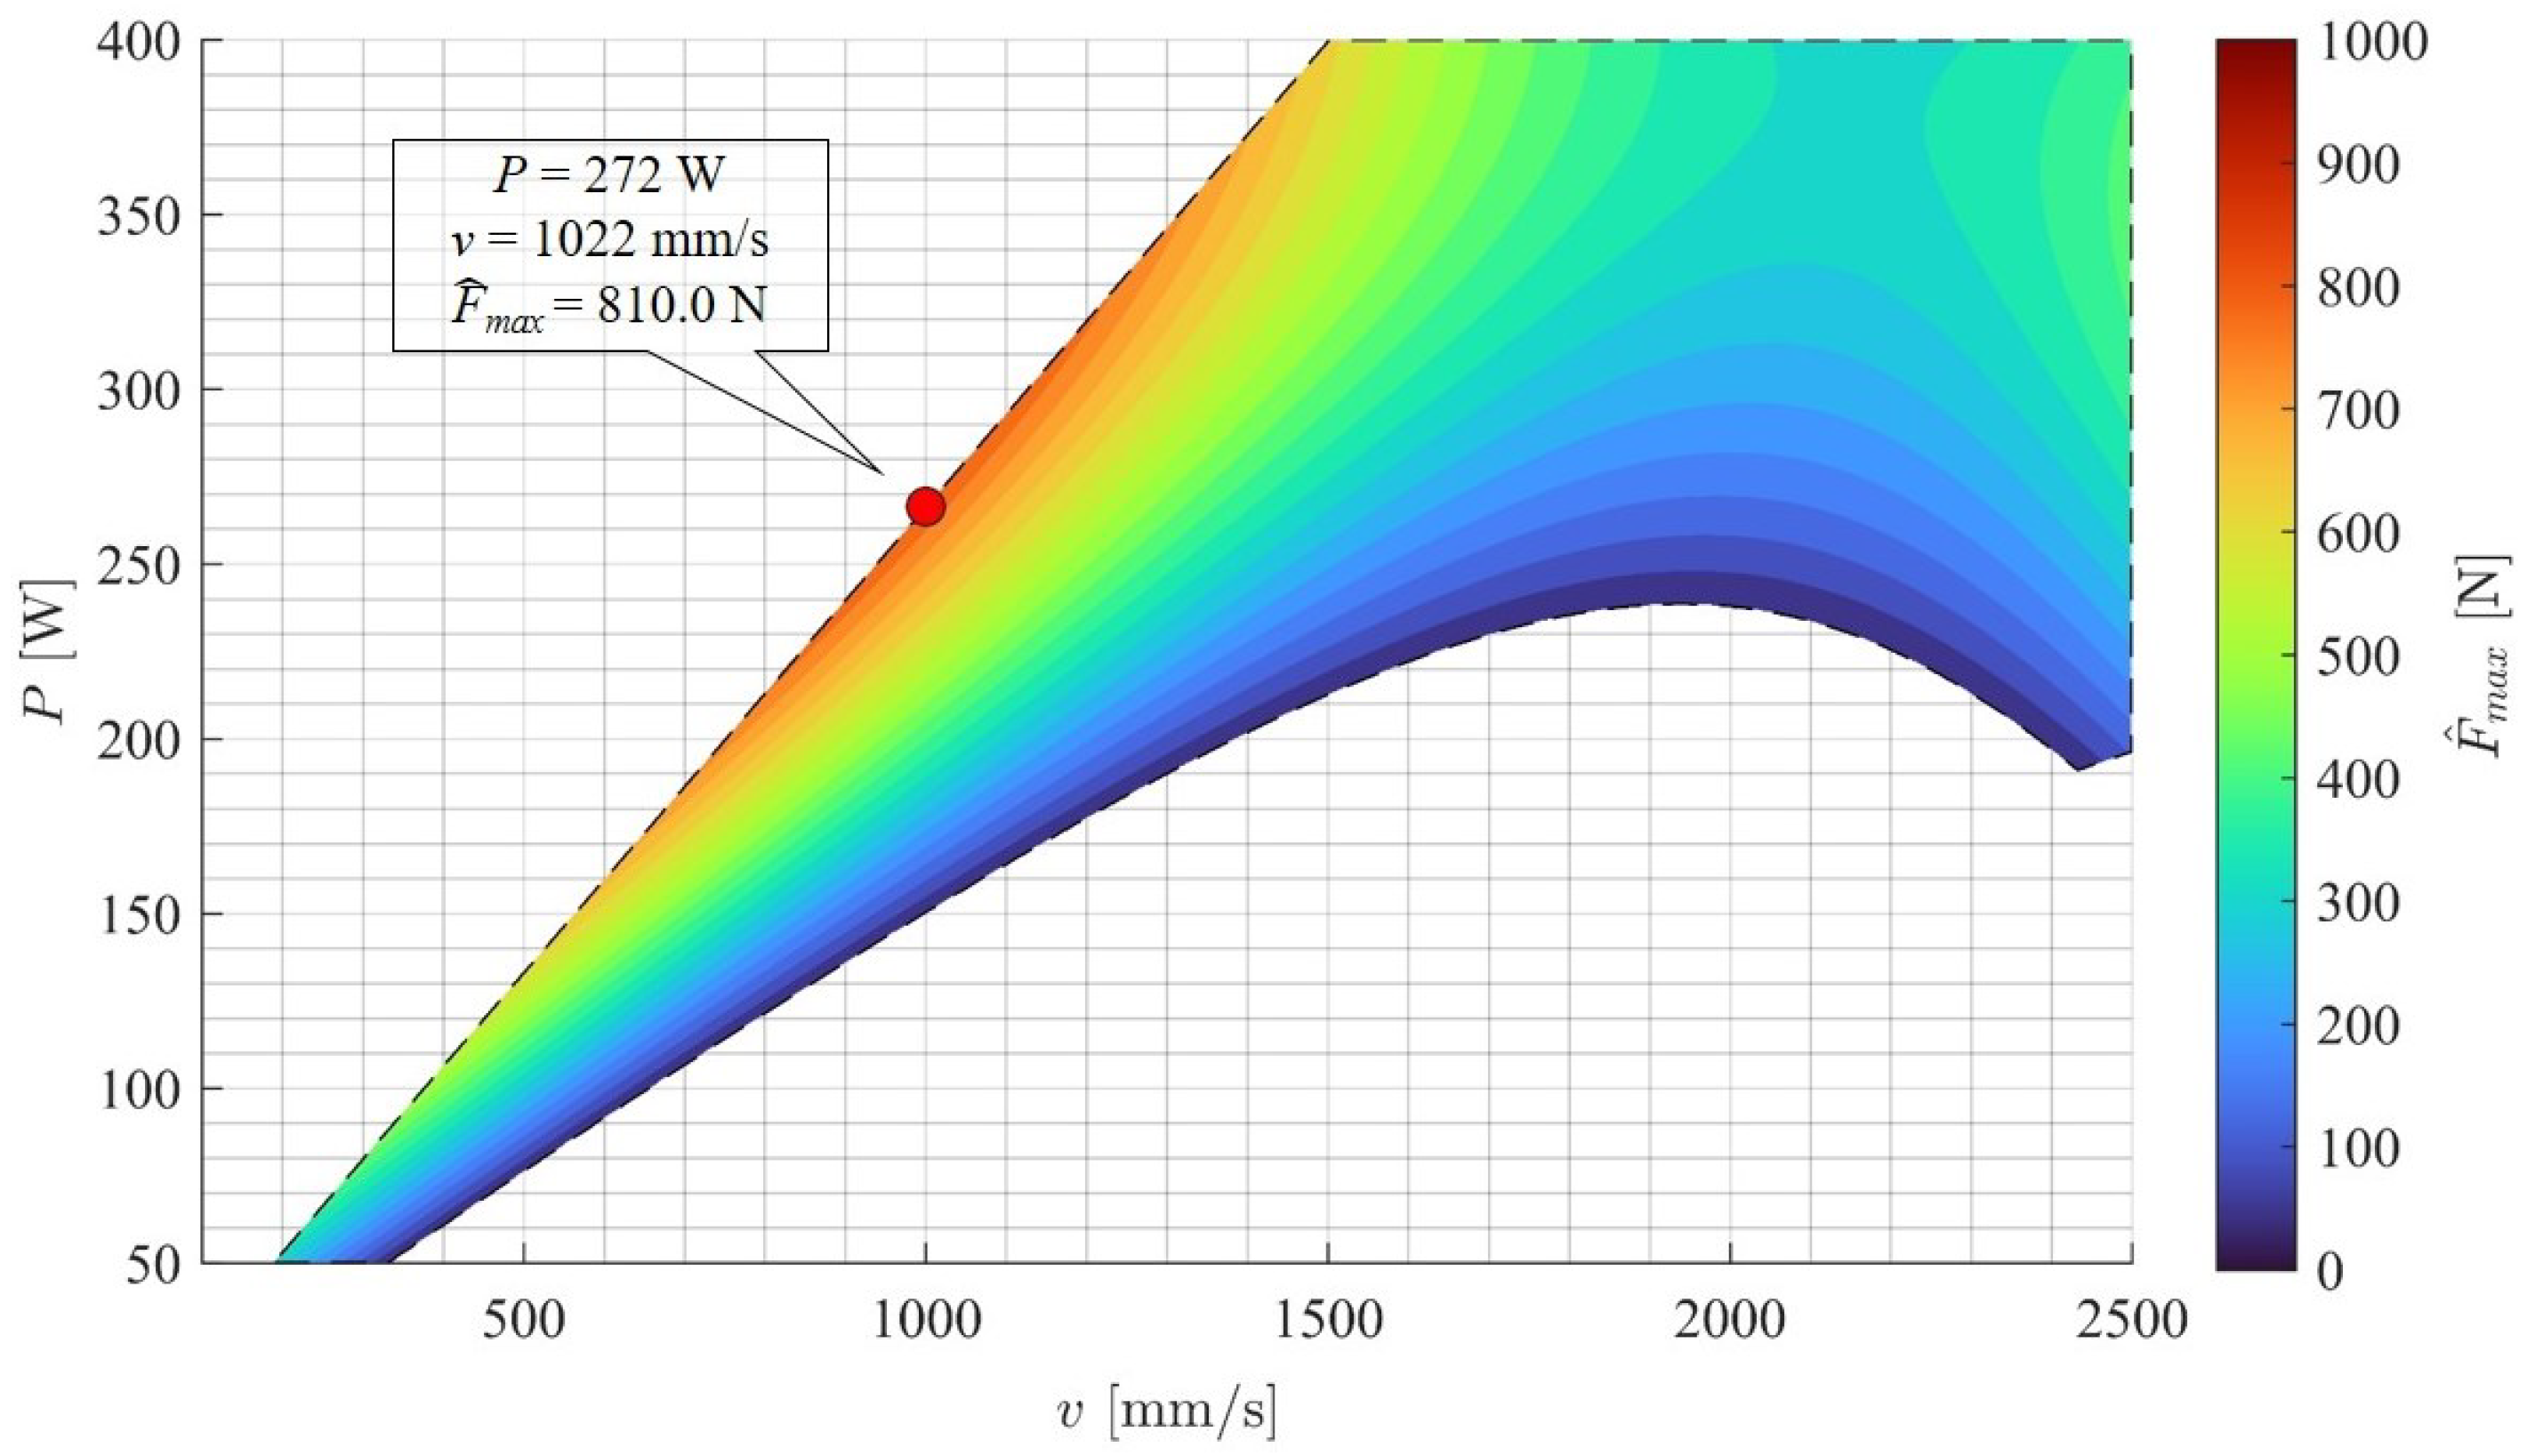
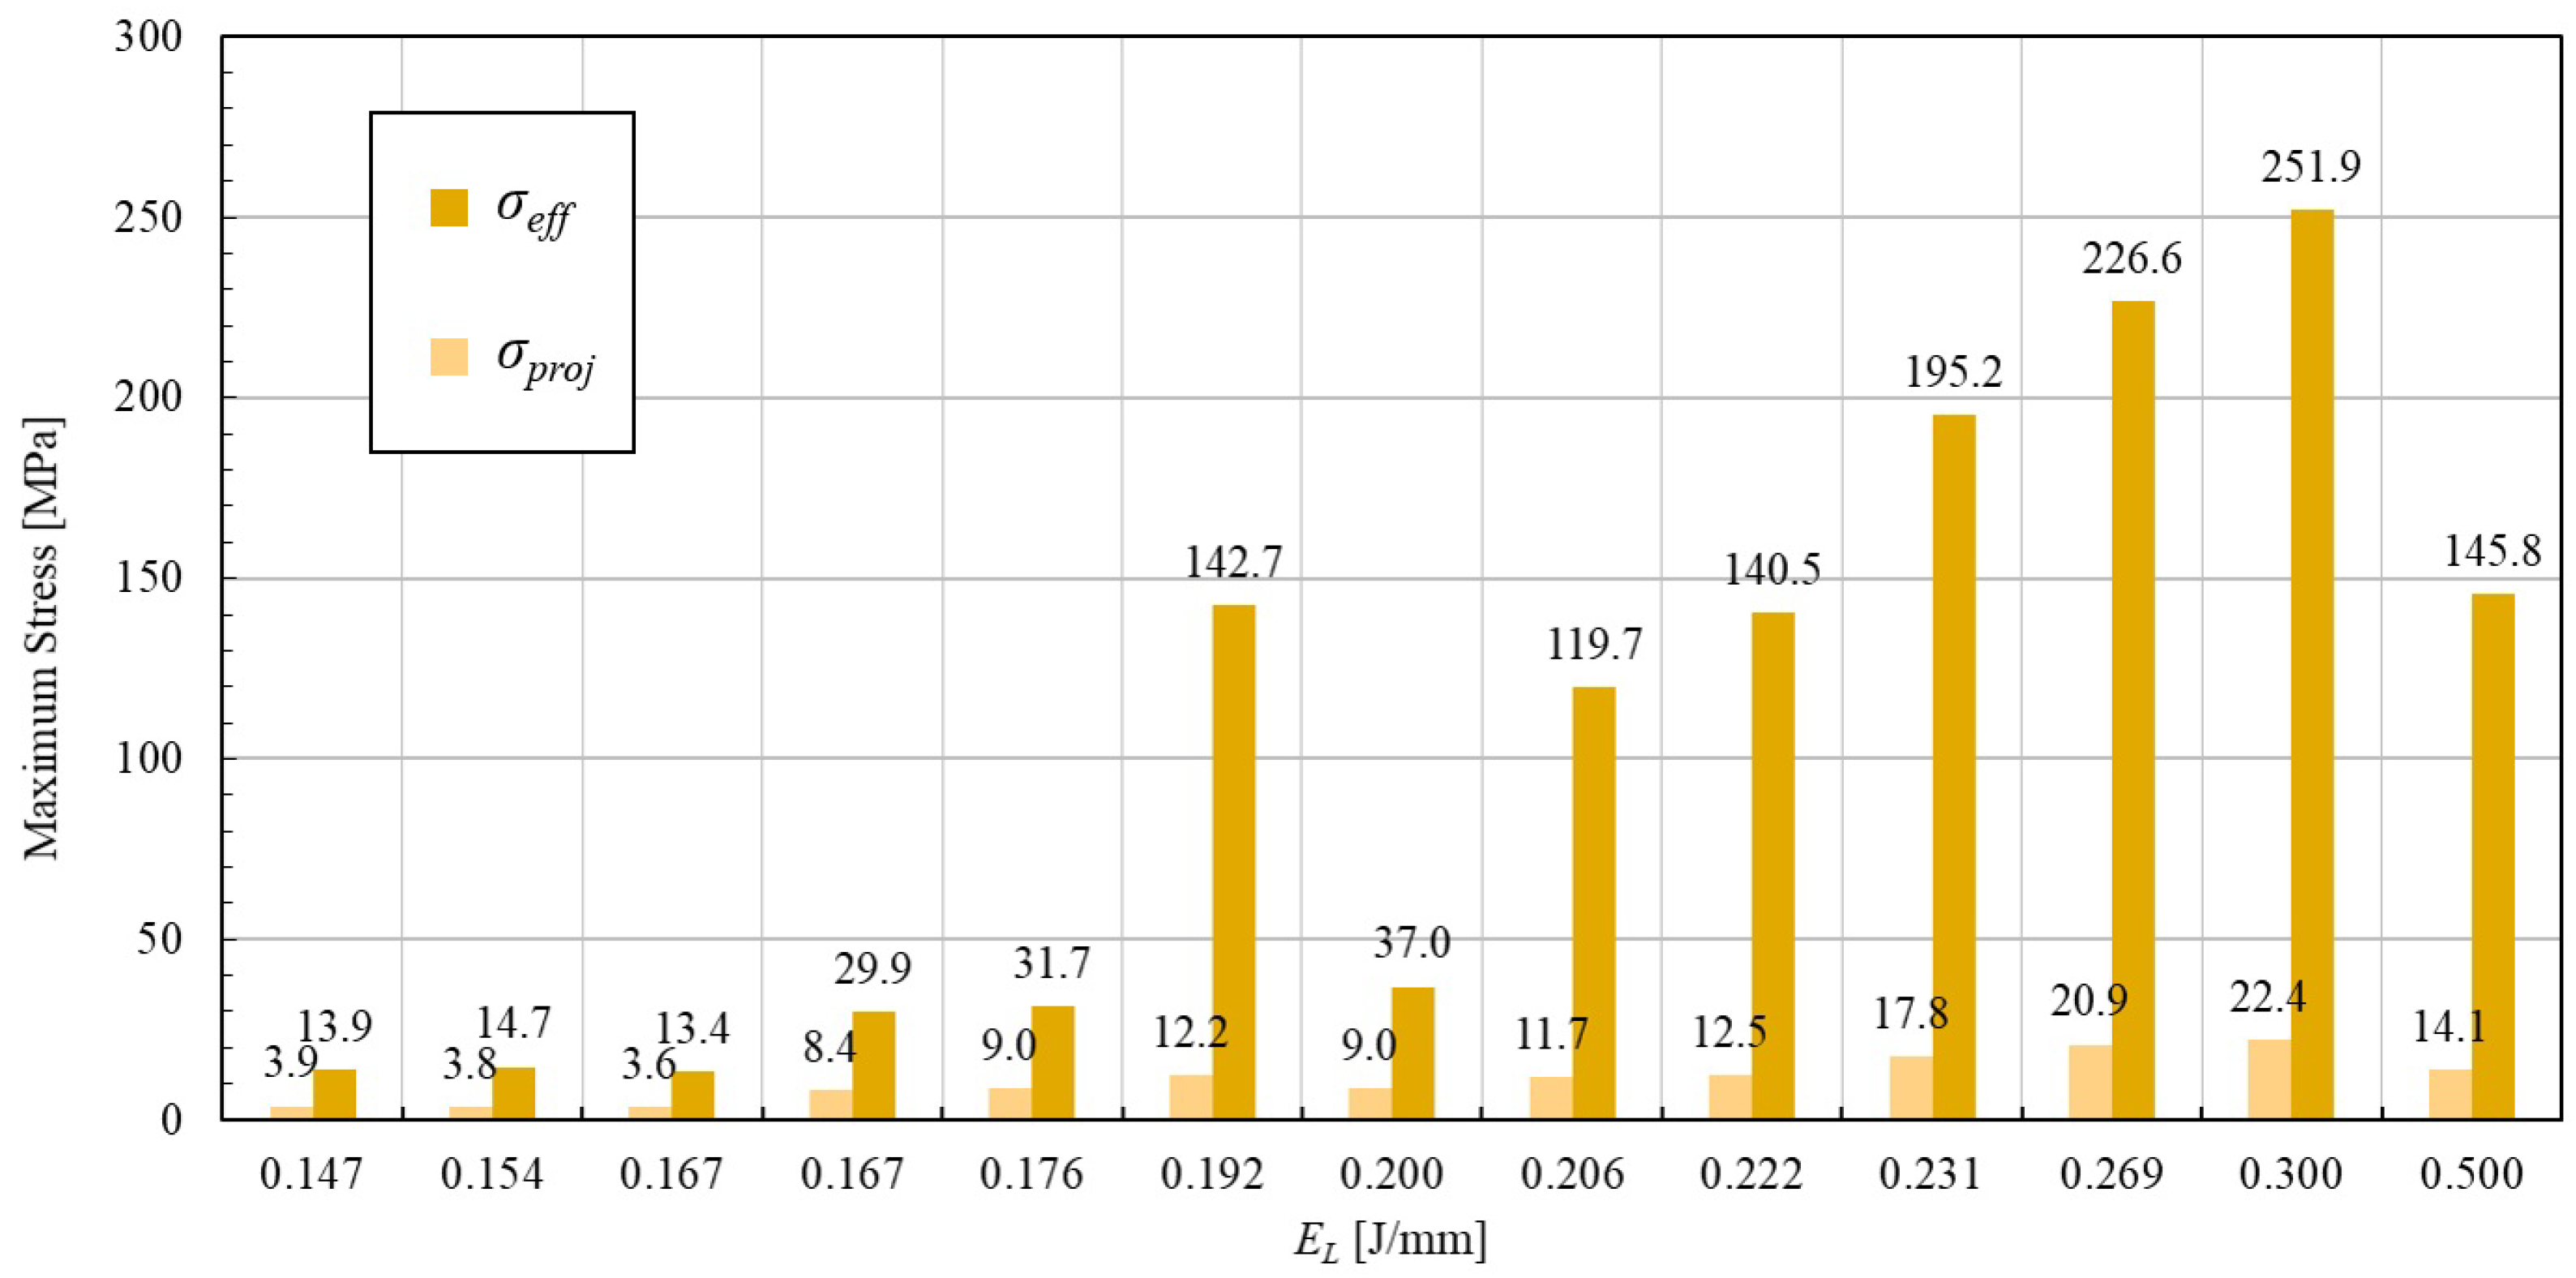
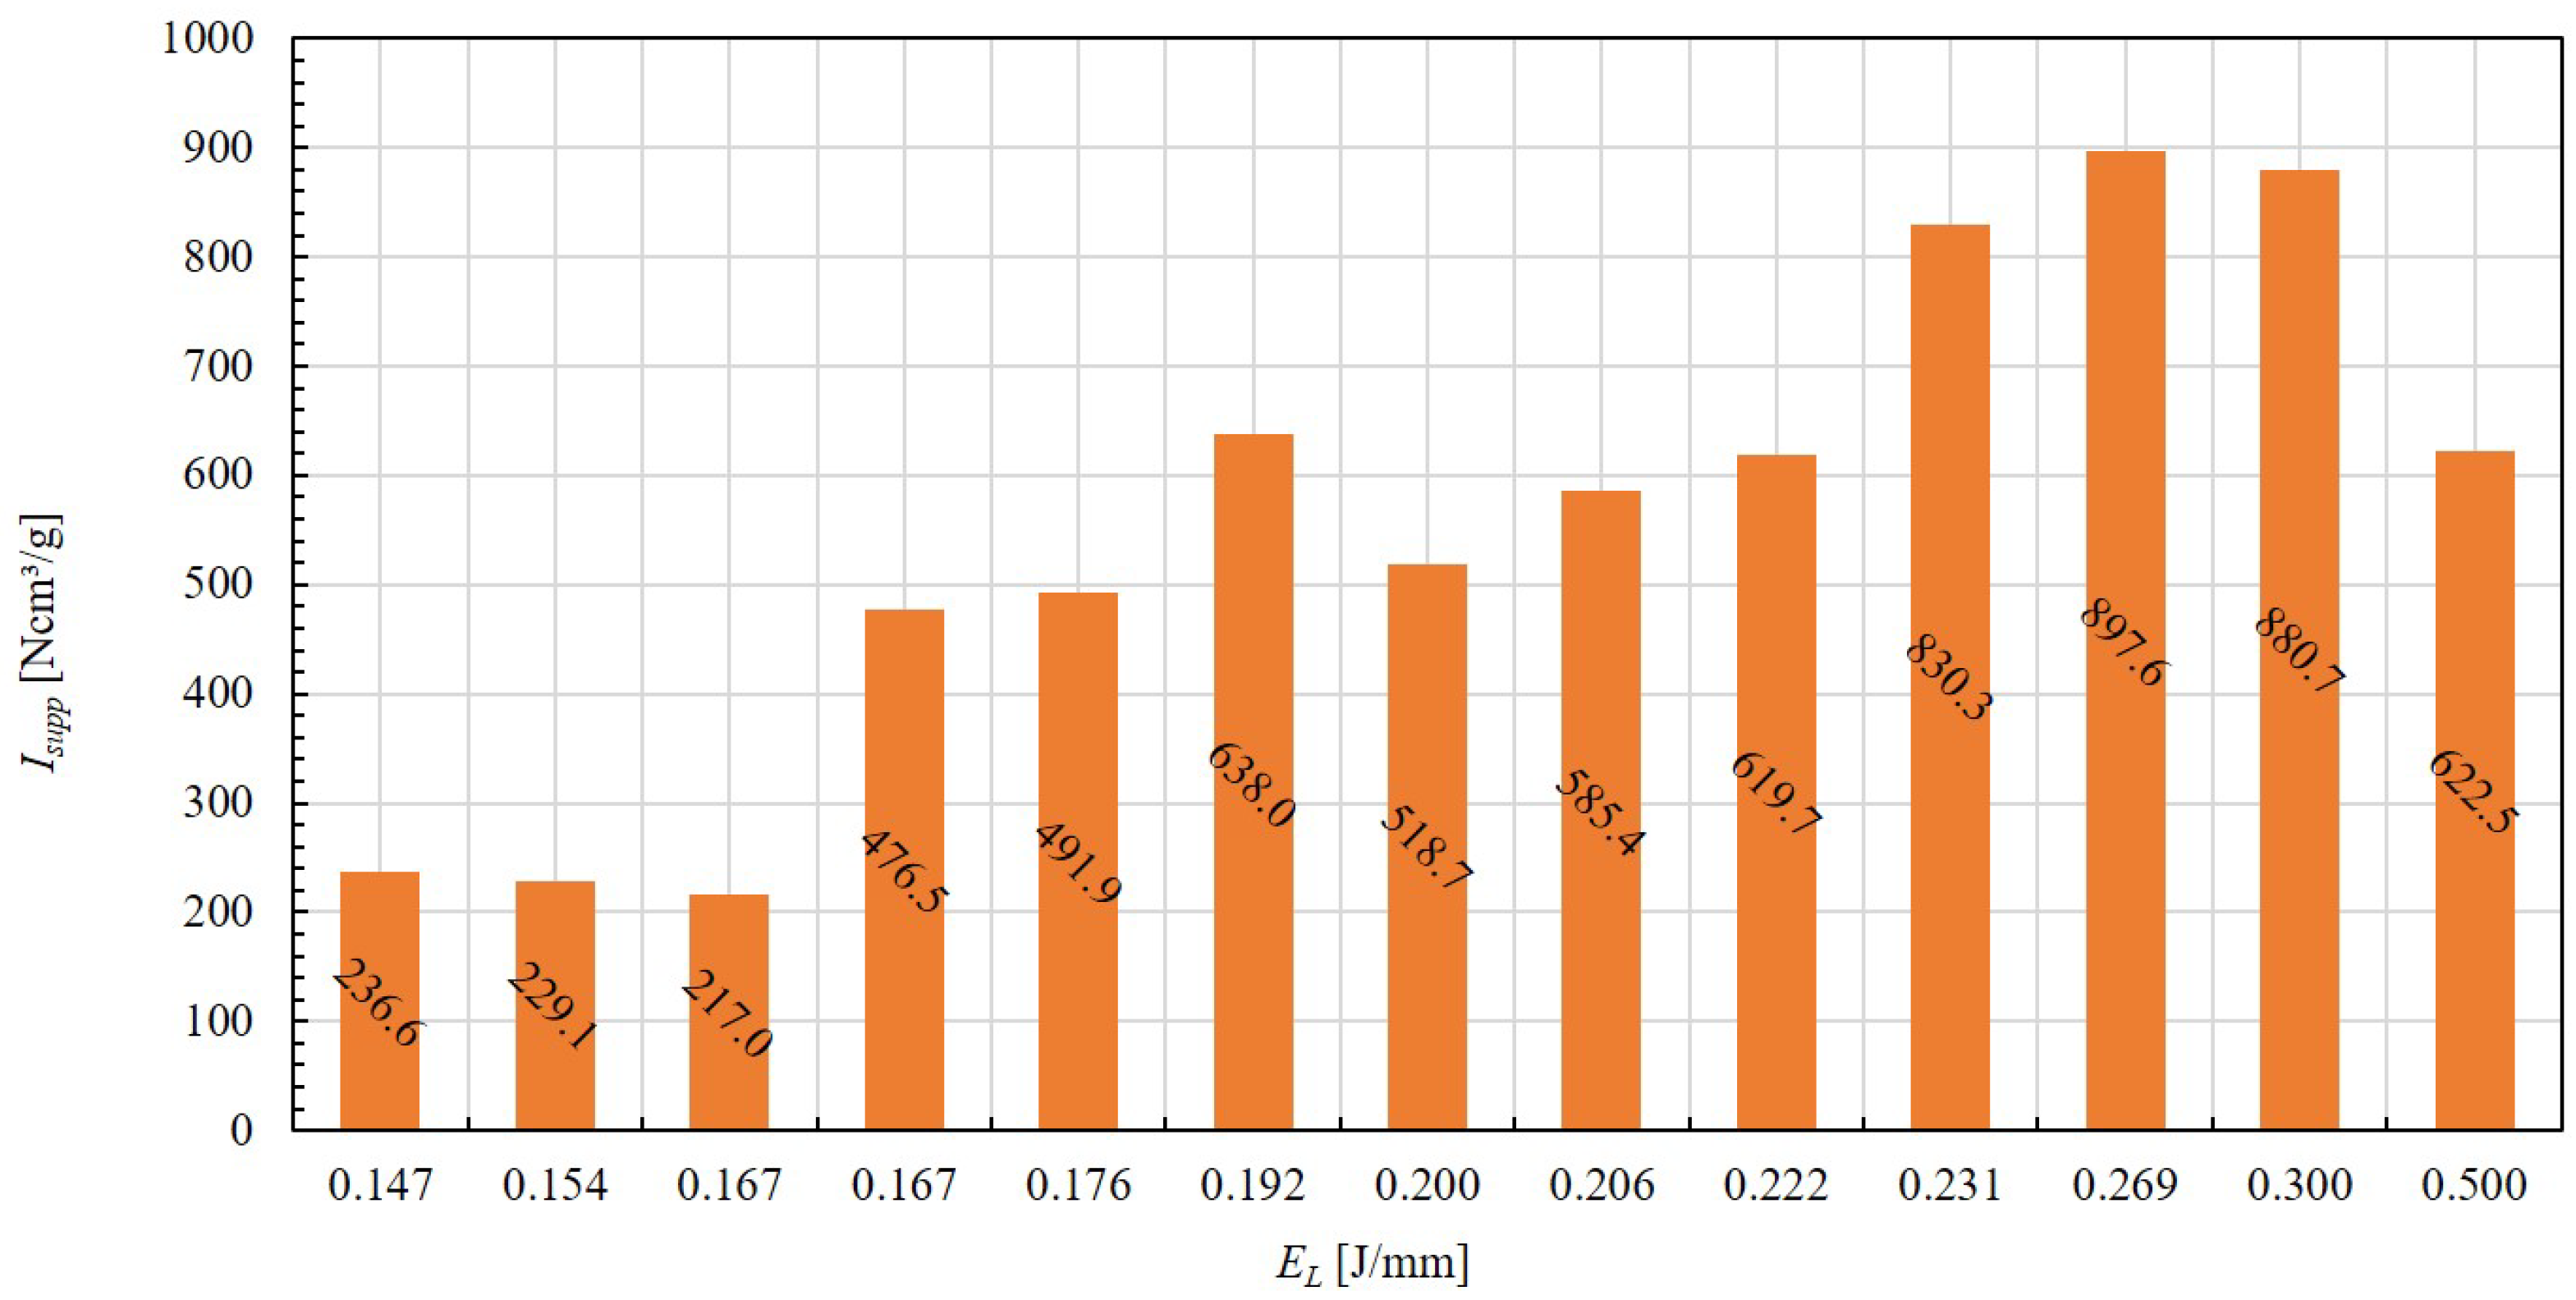
3.1. Processing Parameter Exploration

The processing parameter exploration build job consisted of a total of 292 layers and was completed in 4 h and 5 min. Figure 6 shows the build model planned and the manufactured samples in Figure 6a and Figure 6b, respectively. After the completion of the manufacturing process, the powder was removed, and the substrate was disassembled from the build platform. With the substrate out of the machine, it was already evident that some of the samples were not successfully processed. Out of the 49 samples, those with identification numbers 08, 15, 16, 22, 23, 29 to 31, 36 to 38, and 43 to 45 were not completed successfully.
Figure 7 and Figure 8 illustrate images taken from the top view and side view of the effect of different combinations of laser power (P) and scanning speed (v) on the line width (w) and the perforation thickness ( b p ), respectively. It is worth noting that both w and b p were measured with a 2× magnification. It is possible to observe that both processing parameters P and v influence w as described in the literature: as P increases for a fixed value of v, w results in thicker walls; when P remains constant and v increases, w results in thinner walls [24,27,28]. On the other hand, it is noticeable that the behavior of b p is analogous to that of w: more robust samples were identified on higher values of P when v was fixed, while the opposite happened on higher values of v when P was constant. This result highlights the importance of studying the impact of these processing parameters on single-walled block type support structures, as their influence extends beyond mechanical strength and can, for instance, compromise the depowdering step.
Regarding the sample’s integrity, Figure 9 shows, with a 1.6× magnification, the influence of the upper and lower boundaries of E L on the lateral sizing of the beam elements. Samples 07 and 46 exhibit the highest and lowest values of E L , respectively, and the contrast between the two samples is notorious. As can be seen in Figure 9a, sample 07 exhibits some excessively large elements and areas where material appears to have flowed, resembling the dross effect previously described by Calignano [20] and Lindecke [22]. On the other hand, Figure 9b shows sample 46, which displays a series of discontinuities within the structure. The dross effect was also identified in samples 04 to 07 and 14, which corresponded to the highest values of E L . Meanwhile, discontinuities were observed in samples 24, 32, 39 to 41, and within the range of 46 to 49, which corresponded to the lowest values of E L .
Figure 10 presents the mean and standard deviation of the measured b p values for all manufactured samples. The solid line indicates the nominal value (0.400 mm), while the dashed lines represent the maximum (0.440 mm) and minimum (0.360 mm) allowable values arbitrated in this study. Measured b p values ranged from 0.329 mm to 0.984 mm, and the behavior reaffirms the influence of the processing parameters on the geometric aspects of single-walled block type support structures. For a constant v, increasing P yields a near-linear response in b p ; conversely, for a constant P, increasing v reduces b p following a power-law trend. Another notable observation is the standard deviation, which increases as the measured b p increases as well and deviates from the nominal dimension. This may be related to measurement difficulties caused by the dross effect, as shown in Figure 9. In total, 19 different processing parameter combinations were according to the specified tolerance.
Adopting the hypotheses of Großmann [28] exposed by Equation (3) and using the proposed model from Equation (4), a power regression method based on E L , as shown in Figure 11, can be implemented regarding each one of the results, where w relates to Figure 11a, b p to Figure 11b and m to Figure 11c. All results are shown with a confidence interval of 95% in terms of E L , calculated by Equation (2). The black spots represent the measured results. Additionally, Equations (9)–(11) describe the power regression models w ^ , b ^ p and m ^ for each studied factor w, b p and m, necessarily in that order. If the relation w E L is true, then w E V is also true, since the diameter spot d s and the layer thickness t were fixed constant during the whole experiment, as Equation (1) suggests. The correlations are written as follows
w ^ = 106.6 + 142.2 × P / v ,
b ^ p = 265 + 339 × P / v ,
m ^ = 11.32 × P / v .
The similarities among the studied factors are notorious. The w ^ regression model shows R 2 of 95.1%. This result corroborates with previous experimental findings by Großmann [28] for other material alloys such as Ti6Al4V, AlSi10Mg and Maraging 300. This is a powerful formulation, since it can predict how thick a single-walled structure can achieve by a given set of P and v. For example, it can be used to calculate A e f f and estimate σ e f f , as formulated by Bobbio [21]. Regarding the b ^ p model, its R 2 resulted in 94.4%—the lowest of all regressions. Probably, this is related to the difficulties of measurements with the dross effect discussed previously. This relation can be used to explore different combinations of P and v while maintaining the perforation dimensions. The highest value of R 2 was measured in the m ^ regression, corresponding to 98.7%. If the density of the material is constant and independent of the processing parameters tested and V is the support structure volume, it implies that m V E L E V . This relation can be useful when estimating the processed material volume of single-walled structures in general.
Table 2 summarizes the classification of the results from the processing parameter-exploration stage in the function of the processing parameters tested and E L . It is important to note that some classifications overlapped regarding of energy-input distribution. In the table, red indicates the sample was not concluded ( E L ranging from 0.020 J/mm to 0.111 J/mm). Yellow indicates that the result was outside the tolerance (below the tolerance required, E L ranged from 0.080 J/mm to 0.100 J/mm; above, from 0.278 J/mm to 3.500 J/mm). Blue indicates that the sample was within the specified tolerance, but defects were identified (in this case, all of them associated with low energy input: E L varying from 0.115 J/mm to 0.143 J/mm). Finally, green indicates that no defects or dimensions outside the tolerance were identified ( E L varying from 0.147 J/mm to 0.500 J/mm). Although 19 parameter combinations were within the dimensional tolerance specified, only 13 parameter combinations were approved to the next stage of this study due to macroscopic defects.
According to the experiments conducted during the exploratory stage, the dimensional tolerance was always satisfied when E L ranged from 0.115 J/mm to 0.269 J/mm. In addition, for E L below 0.077 J/mm, the processed support consistently failed. Another key finding was that as v increases, the maximum acceptable E L threshold for dimensional tolerance decreases: for v = 100 mm/s, E L corresponded to 0.500 J/mm; for v = 500 mm/s, E L corresponded to 0.300 J/mm, and so on. This effect is attributed to the fact that slower scanning speeds tend to dissipate heat more efficiently. Consequently, it can be stated that lower v values require higher E L values to compensate for equivalent impact on b p .

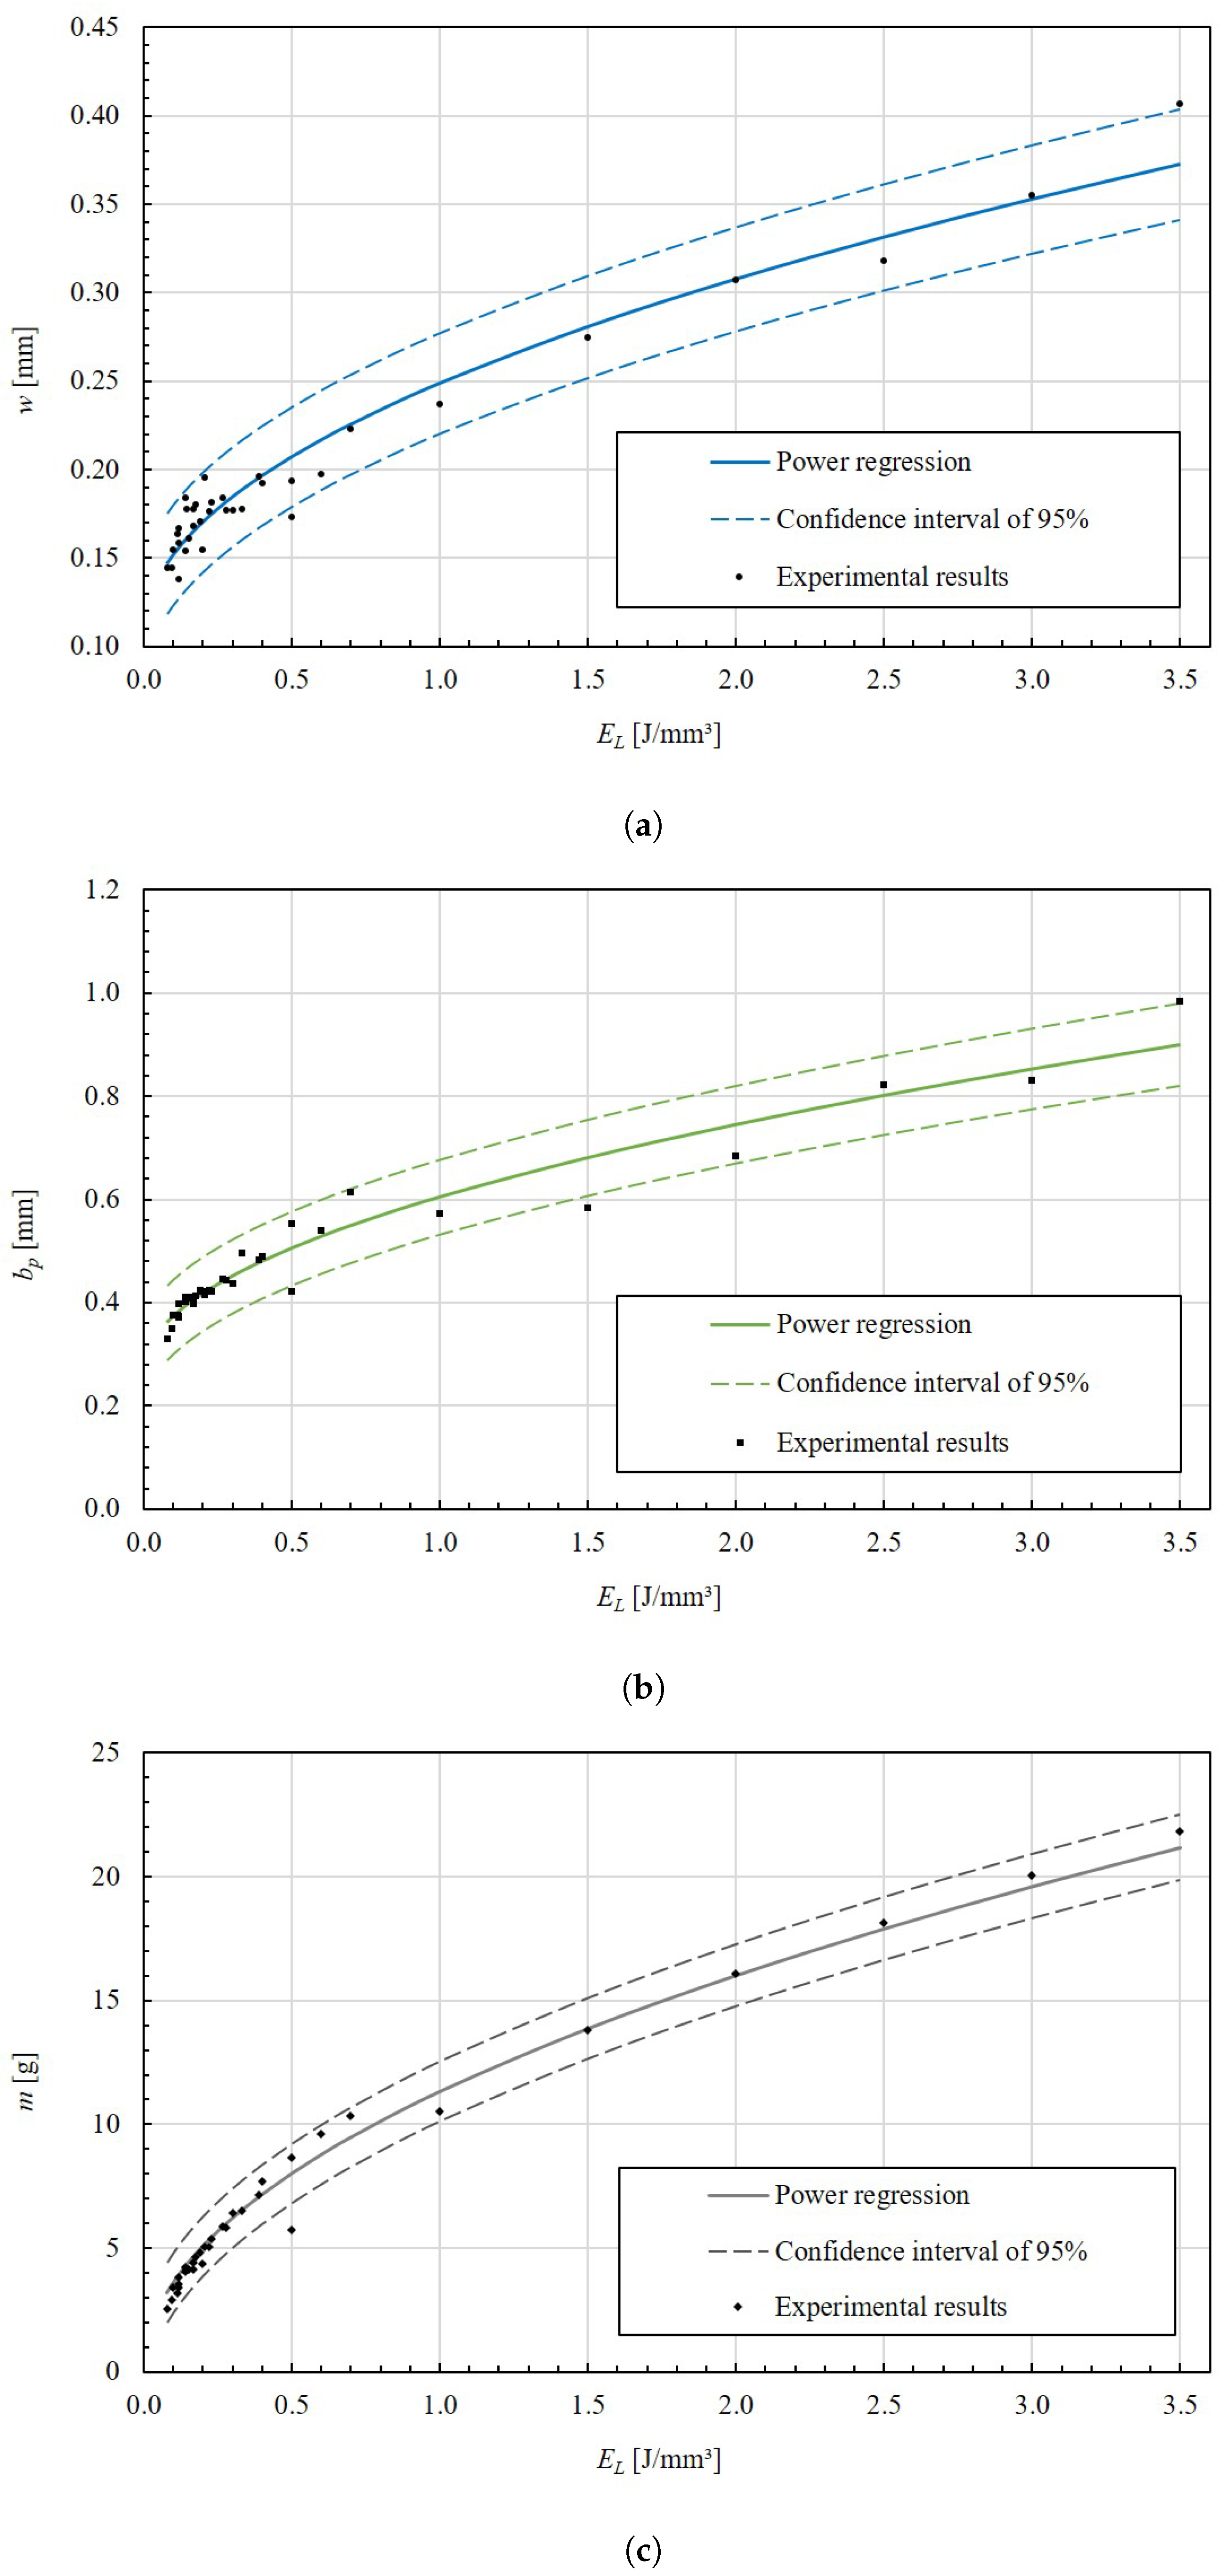
3.2. Mechanical Characterization

The fabrication of the mechanical characterization stage consisted of 1684 layers and lasted 18 h and 53 min. Figure 12 shows the build job model planned and the tensile specimens built, as depicted in Figure 12a and Figure 12b, respectively. According to the report issued by the machine’s monitoring system, O2 concentrations of up to 0.2% were recorded.
The specimens, shown in Figure 13, clearly reveal the differences between the upper and lower interfaces, corresponding to the highest (specimen 01, E L = 0.500 J/mm) and lowest (specimen 33, E L = 0.147 J/mm) energy values. Figure 13a,c display the upper and lower interfaces of specimen 01, while Figure 13b,d show the upper and lower interfaces of specimen 33, respectively.
Discontinuities in tensile specimen 33 are clearly visible on both interfaces, as well as warping on the upper interface of both specimens, evidenced by the red marks. It was observed that all specimens exhibited a different coloration near the upper interface region between the support structure and the solid part, which may indicate overheating. This might be related to a scenario involving an abrupt increase in temperature due to heat input and difficulty in heat dissipation. When the lower interface is being processed, the laser scan area—and consequently the heat generated—is significantly smaller compared to the upper interface. Additionally, at the lower interface, heat is dissipated by conduction much more easily than at the upper interface due to the different areas through which it flows [22].
The discontinuities identified at the lower interface of the specimens corresponding to lower E L values are attributed to a combination of residual stress and reduced thickening of w, which contributes to lower tensile strength. Some of the specimens—particularly those corresponding to the lowest E L values—showed discontinuities at the lower interface between the support and the bulk region. Notably, similar issues have been previously reported [21,32]. It is known that the lower the E L value, the shallower the melt pool penetration, which can also contribute to the bad consolidation between the support and bulk region of the lower interface [27]. In addition, for low values of E L , defects such as lack-of-fusion porosity may also appear [17,29]. Further analysis on the surfaces of the specimens is necessary to examine whether the discontinuities were caused by excessive residual stresses, poor fusing, lack of bonding, porosity or a combination of these factors.
Figure 14 depicts the specimen with its testing setup and some preliminary evaluation of the tensile testing result. Before testing, all auxiliary struts were cut via WEDM, as depicted in Figure 14a. On average, specimens with the lowest E L values fractured at the lower interface, whereas the others failed at the intermediate region, mostly close to the upper interface. The transition in the fracture location occurs between 0.176 J/mm and 0.206 J/mm, evidenced by samples 34, 26, 09, and 35, as shown in Figure 14b.
Figure 15 shows the average maximum and the standard deviation load resistance ( F m a x ) recorded by the load cell for the replicas corresponding to each specimen, organized in ascending order of E L . It also indicates the predominant fracture location for each specimen, where the abbreviation “int.” refers to failure at the intermediate region, and “low.” to failure at the lower interface region.
A clear correlation can be observed between F m a x and E L : as E L increases, a higher load is required to break the specimens. This was an expected outcome, since specimens with higher E L values exhibit better consistency and thicker w, which contribute to improved mechanical strength. The specimens that withstood the lowest tensile load were specimens 17 (P = 150 W, v = 900 mm/s, E L = 0.167 J/mm), 25 (P = 200 W, v = 1300 mm/s, E L = 0.154 J/mm) and 33 (P = 250 W, v = 1700 mm/s, E L = 0.147 J/mm), with an average result of 134.5 N, while the one that withstood the highest load was specimen 10 (P = 150 W, v = 500 mm/s, E L = 0.300 J/mm), resulting in 805.4 N. This reveals the importance of studying the influence of processing parameters on the resistance of single-walled support structures. Although the processing of different combinations of P and v resulted in geometrically feasible supports, their tensile resistances varied from 128.4 N to 805.4 N, which can be critical to the application.
It is worth highlighting some inconsistencies in relation to the expected trend. Notably, specimen 42 withstood twice the load of specimen 17, despite both corresponding to the same E L . The difference between the two lies in the combination of P and v: specimen 42 was processed with P = 350 W and v = 2100 mm/s, whereas specimen 17 was processed with P = 150 W and v = 900 mm/s. In addition to that, specimen 01 (P = 50 W, v = 100 mm/s, E L = 0.200 J/mm), which corresponded to the highest E L , did not necessarily match with the highest F m a x . This result not only reinforces the hypothesis that slower scanning speeds tend to enhance heat dissipation, but also may suggest that higher power levels for the same E L tend to promote better consolidation at the lower interface between the support and the solid part.
By evaluating the results of F m a x as a function of P and v, an RSM was implemented as per Equation (5), defined as F ^ m a x . The response surface F ^ m a x , described by Equation (12), resulted in an R 2 of 97.2%. The model is expressed by the following formulation
F ^ m a x = 83.26 + 13.6 × P 2.189 × v 20.07 E 3 × P × v 12.13 E 3 × P 2 + 6.878 E 3 × v 2 .
Once again setting the tolerance-deviation range as 0.360 mm < b p < 0.440 mm and using as reference Equation (10), it is possible to isolate the variable P as a function of v, thus obtaining Equation (13), as follows
0.0785 × v < P < 0.2665 × v .
Finally, an optimization method feasible with the model described by Equation (12) can be used, while respecting the constraints arbitrated by the dimensional deviation of b p , described in Equation (13). Figure 16 displays the solution envelope (region within the dashed lines) along with the RSM obtained during the mechanical characterization phase.
It should be noted that the minimum limit imposed by Equation (13) only constrains results at the upper boundary on the graph, and a small portion at the lower boundary. For this model, the optimal prediction was given by the parameter set P = 272 W and v = 1022 mm/s ( E L = 0.266 J/mm), yielding a value of F ^ m a x = 810.0 N. This result is slightly higher than that obtained in experiments for specimen 10, but still within the standard deviation range ( F m a x = 805.4 ± 37.9 N). The developed method for finding optimal P and v parameters for single-walled block type support structures has not been validated. However, this methodology enables establishing guidelines aligned with the designer’s objectives. For instance, a similar analysis could be employed when optimizing for either productivity maximization or material loss minimization. It should be emphasized that these results are strictly valid only for the studied layer thickness t = 0.060 mm, requiring recalibration for other layer thicknesses. For higher layer thicknesses, we expect less resolution, dimensional accuracy and tensile resistance, but more elongation and an increase in productivity [29].
The strength parameters σ e f f and σ p r o j were calculated as formulated in Equation (6) and Equation (7), respectively. In the formulation A e f f = l × w , the laser scanning length l from the single-walled block-support structure can be defined in terms of the job building height, while w can be defined according to the measured values from the set of parameters tested. As observed during mechanical characterization, fractures occurred predominantly at either the lower or the intermediate regions: lower region (l = 56.80 mm)—occurring on the division between solid and support structure; and intermediate region (l = 18.06 mm)—occurring always at the region of smallest cross-section. Figure 17 presents a diagram of σ e f f and σ p r o j values plotted against increasing values of E L .
Since A p r o j is a constant value, σ p r o j exhibits behavior analogous to the results of F m a x . The calculated σ e f f values reveal markedly different behavior compared to Figure 15. Notably, σ e f f yields lower values in specimens that failed at the lower interface versus those that failed at the intermediate regions. This can be explained by the differences between A e f f , as well as the detected discontinuities (as shown in Figure 13), which weaken the interface. Nevertheless, even throughout this different approach, specimen 10 remains the strongest, resulting in σ p r o j = 22.4 MPa and σ e f f = 251.9 MPa, while specimen 17 remains the weakest, exhibiting σ p r o j = 3.6 MPa and σ e f f = 13.4 MPa. When comparing these results with the maximum tensile strength ( σ u l t ) of AISI 316L stainless steel as per ASTM-SA240 [33] standard ( σ u l t = 485 MPa), the relative values comparing with σ u l t correspond to 0.8–4.6% for σ p r o j and 2.8–52.0% for σ e f f . This analysis reveals the significant impact of discontinuities due to inappropriate processing parameter combinations on the tensile strength of support structures. The obtained results for σ p r o j and σ e f f align with literature reports for other materials [21,22,23,26].
One practical application of the experimental results is their integration into finite element modeling (FEM) for failure prediction and mechanical behavior analysis of support structures. For instance, the value of σ p r o j may serve as an allowable stress limit when assessing whether the bonding between the bulk and support regions can withstand residual stresses during building or post-processing loads. Additionally, an equivalent stiffness may be derived from the measured displacements of the specimens and applied using a homogenization approach, enabling prediction of global part deformation. This simplification could reduce computational demand and facilitates more efficient design iterations. Moreover, incorporating σ e f f into FEM enables investigation of how changes in design or processing parameters influence failure mechanisms. Once the FEM model is validated, design parameters can be systematically adjusted to tailor mechanical responses and optimize support structure performance as wished.
Another way of assessing the quality of the support structure result is throughout the structural efficiency ( I s u p p ), expressed in Equation (8). It takes into consideration the F m a x divided by its apparent density, which is the support structure mass m obtained in the exploratory stage divided by its delimitation volume V d e l (constant for any processing parameter combination). Figure 18 shows the values of I s u p p plotted against E L for each specimen.
Contrary to previous findings, specimen 28 ( I s u p p = 897.6 Ncm3/g) exhibits the highest strength per unit of apparent density of the support structure when compared to specimen 10 ( I s u p p = 880.7 Ncm3/g). This means that if the mechanical resistance per material processed is more relevant than the mechanical resistance itself, then the processing parameter combination of specimen 28 would be a better choice rather than specimen 10.
This approach, when used complementary to the RSM, can be useful when choosing the processing parameter combinations where the amount of feedstock material should be minimized while keeping the support structure resistance. This metric also offers an alternative for optimizing processing conditions beyond the focus on strength alone. When combined with RSM, it enables a multi-objective decision-making approach, not only aiming for high mechanical integrity, but also considering material efficiency, cost reduction and environmental impact.

4. Conclusions

This study investigated multiple combinations of laser power (P) and scanning speed (v) to evaluate their impact on the dimensional deviation, structural integrity and mechanical resistance of single-walled block type support structures manufactured via Laser Powder Bed Fusion (L-PBF) using 316L stainless steel. The research methodology comprised two stages: processing parameter exploration, and mechanical characterization. This was done by fixing the support structure geometry and layer thickness of 0.060 mm.
We observed that the relationship between the laser scanning width (w), perforation thickness ( b p ) and sample mass (m) is non-linear and direct with respect to P, and inverse with respect to v. It was also observed that w, b p and m, when correlated in terms of E L , exhibit power-law behavior. The regressions yielded determination coefficients R 2 of 95.1% for w, 94.4% for b p and 98.7% for m. Support structures could be manufactured for E L values starting from 0.080 J/mm. It was observed that higher v produced lower feasible ranges of E L thresholds. Discontinuities were identified in samples when E L < 0.147 J/mm, while parameter combinations were meeting dimensional tolerance requirements and no evident defects matched with E L ranging from 0.147–0.269 J/mm, except for E L yielding 0.300 J/mm and 0.500 J/mm when v = 500 mm/s and v = 100 mm/s, respectively.
Overall, results demonstrated that mechanical performance of specimens improved with increasing E L . Fractures consistently occurred at the support-solid lower interface region or at the intermediate region. Weaker specimens failed at the lower interface, while stronger ones failed at the intermediate region. The transition of the fracture behavior happened when E L varied between 0.176 J/mm and 0.206 J/mm. The combination P = 150 W and v = 500 mm/s ( E L = 0.300 J/mm) yielded the highest mechanical performance, resulting in maximum tensile resistance ( F m a x ) of 805.4 N, maximum tensile projected strength ( σ p r o j ) of 22.4 MPa and maximum tensile effective strength ( σ e f f ) of 251.9 MPa. The comparison of these values with the ultimate tensile strength ( σ u l t ) of 316L corresponded to 4.6% in relation to σ p r o j and 52.0% in relation to σ e f f . The impact of the processing parameters P and v on F m a x was correlated through a response surface method (RSM), producing an R 2 value of 97.2%. The optimal solution using the RSM model resulted in P = 272 W and v = 1022 mm/s ( E L = 0.266 J/mm), estimating a maximum tensile resistance of 810.0 N.

Author Contributions

Conceptualization, D.A.G. and H.R.O.; Methodology, D.A.G., H.R.O. and N.V.; Validation, D.A.G.; Formal analysis, D.A.G.; Investigation, D.A.G., H.R.O. and N.V.; Resources, D.A.G. and H.R.O.; Data curation, D.A.G. and N.V.; Writing—original draft, D.A.G.; Writing—review & editing, D.A.G., H.R.O., T.C., J.T.P., O.K. and N.V.; Supervision, N.V.; Project administration, D.A.G. and H.R.O.; Funding acquisition, T.C. All authors have read and agreed to the published version of the manuscript.

Funding

This applied research project on digital additive manufacturing for the oil and gas industry was funded by the Brazilian National Agency for Oil, Natural Gas and Biofuels (ANP) and the Brazilian Company of Research and Industrial Innovation (EMBRAPII).

Data Availability Statement

The original contributions presented in this study are included in the article. Further inquiries can be directed to the corresponding author.

Acknowledgments

The authors thank Petróleo Brasileiro S.A. (PETROBRAS) and the SENAI Innovation Institute in Manufacturing Systems and Laser Processing for providing laboratory infrastructure, materials, and technical support throughout the development of this work. One of the authors (N.V.) acknowledges the National Council for Scientific and Technological Development (CNPq) for scholarship support.

Conflicts of Interest

The authors declare that they have no known competing financial interests or personal relationships that could have appeared to influence the work reported in this paper.

References

  1. ISO/ASTM 52900:2021; Additive Manufacturing–General Principles–Fundamentals and Vocabulary. International Organization for Standardization: Geneva, Switzerland, 2021.
  2. Wohlers Associates, Inc. Wohlers Report 2023: 3D Printing and Additive Manufacturing Global State of the Industry; Wohlers Associates: Fort Collins, CO, USA, 2023. [Google Scholar]
  3. McConnell, S.; Tanner, D.; Kourousis, K.I. Productivity improvement opportunities for metal powder bed fusion technologies: A systematic literature review. Rapid Prototyp. J. 2024, 30, 231–246. [Google Scholar] [CrossRef]
  4. DebRoy, T.; Wei, H.L.; Zuback, J.S.; Mukherjee, T.; Elmer, J.W.; Milewski, J.O.; Beese, A.M.; Wilson-Heid, A.; De, A.; Zhang, W. Additive manufacturing of metallic components—Process, structure and properties. Prog. Mater. Sci. 2018, 92, 112–224. [Google Scholar]
  5. Elsen, M. Complexity of Selective Laser Melting: A New Optimisation Approach. Ph.D Thesis, Katholieke Universiteit Leuven, Leuven, Belgium, 2007. [Google Scholar]
  6. Wang, D.; Yang, Y.; Yi, Z.; Su, X. Research on the fabricating quality optimization of the overhanging surface in SLM process. Int. J. Adv. Manuf. Technol. 2013, 65, 1471–1484. [Google Scholar] [CrossRef]
  7. Kruth, J.-P.; Deckers, J.; Yasa, E.; Wauthle, R. Assessing and comparing influencing factors of residual stresses in selective laser melting using a novel analysis method. Proc. Inst. Mech. Eng. Part B J. Eng. Manuf. 2012, 226, 980–991. [Google Scholar] [CrossRef]
  8. Charles, A.; Elkaseer, A.; Thijs, L.; Hagenmeyer, V.; Scholz, S. Effect of process parameters on the generated surface roughness of down-Facing surfaces in selective laser melting. Appl. Sci. 2019, 9, 1256. [Google Scholar] [CrossRef]
  9. Zhang, K.; Fu, G.; Zhang, P.; Ma, Z.; Mao, Z.; Zhang, D.Z. Study on the Geometric Design of Supports for Overhanging Structures Fabricated by Selective Laser Melting. Materials 2019, 12, 27. [Google Scholar] [CrossRef]
  10. Jiang, J.; Xu, X.; Stringer, J. Support Structures for Additive Manufacturing: A Review. J. Manuf. Mater. Process. 2018, 2, 64. [Google Scholar] [CrossRef]
  11. Cloots, M.; Zumofen, L.; Spierings, A.; Kirchheim, A.; Wegener, K. Approaches to minimize overhang angles of SLM parts. Rapid Prototyp. J. 2017, 23, 362–369. [Google Scholar] [CrossRef]
  12. Mercelis, P.; Kruth, J.-P. Residual stresses in selective laser sintering and selective laser melting. Rapid Prototyp. J. 2006, 12, 254–265. [Google Scholar] [CrossRef]
  13. Calignano, F.; Galati, M.; Iuliano, L. A Metal Powder Bed Fusion Process in Industry: Qualification Considerations. Machines 2019, 7, 72. [Google Scholar] [CrossRef]
  14. Mahmood, M.A.; Chioibasu, D.; Ur Rehman, A.; Mihai, S.; Popescu, A.C. Post-Processing Techniques to Enhance the Quality of Metallic Parts Produced by Additive Manufacturing. Metals 2022, 12, 77. [Google Scholar] [CrossRef]
  15. Autodesk. Netfabb Help: To Define a Part as a Support Structure. Available online: https://help.autodesk.com/view/NETF/2025/ENU/?guid=GUID-6DF4CD36-ED33-4A3F-B073-892DCA5AC864 (accessed on 7 June 2025).
  16. Materialise. Optimal Metal Supports for Additive Manufacturing. Available online: https://www.materialise.com/en/inspiration/articles/optimal-metal-supports (accessed on 7 June 2025).
  17. Oliveira, J.P.; LaLonde, A.D.; Ma, J. Processing parameters in laser powder bed fusion metal additive manufacturing. Mater. Des. 2020, 193, 108762. [Google Scholar] [CrossRef]
  18. Bassoli, E.; Sola, A.; Celesti, M.; Calcagnile, S.; Cavallini, C. Development of Laser-Based Powder Bed Fusion Process Parameters and Scanning Strategy for New Metal Alloy Grades: A Holistic Method Formulation. Materials 2018, 11, 2356. [Google Scholar] [CrossRef] [PubMed]
  19. Weber, S.; Montero, J.; Bleckmann, M.; Paetzold, K. Parameters on Support Structure Design for Metal Additive Manufacturing. In Proceedings of the Design Society: DESIGN Conference, Cavtat, Croatia, 26–29 October 2020; pp. 1145–1154. [Google Scholar] [CrossRef]
  20. Calignano, F. Design optimization of supports for overhanging structures in aluminum and titanium alloys by selective laser melting. Mater. Des. 2014, 64, 203–213. [Google Scholar] [CrossRef]
  21. Bobbio, L.D.; Qin, S.; Dunbar, A.; Michaleris, P.; Beese, A.M. Characterization of the strength of support structures used in powder bed fusion additive manufacturing of Ti-6Al-4V. Addit. Manuf. 2017, 14, 60–68. [Google Scholar] [CrossRef]
  22. Lindecke, P.; Blunk, H.; Wenzl, J.; Möller, M.; Emmelmann, C. Optimization of support structures for the laser additive manufacturing of TiAl6V4 parts. Procedia CIRP 2018, 74, 53–58. [Google Scholar] [CrossRef]
  23. Leary, M.; Maconachie, T.; Sarker, A.; Faruque, O.; Brandt, M. Mechanical and thermal characterisation of AlSi10Mg SLM block support structures. Mater. Des. 2019, 2019, 108138. [Google Scholar] [CrossRef]
  24. Gong, H.-J.; Teng, C.; Zeng, K.; Pal, D.; Stucker, B.E.; Dilip, J.J.S.; Beuth, J.L.; Lewandowski, J.J. Single Track of Selective Laser Melting Ti-6Al-4V Powder on Support Structure. In Proceedings of the 26th Annual International Solid Freeform Fabrication Symposium—An Additive Manufacturing Conference, Austin, TX, USA, 8–10 August 2016; Available online: https://api.semanticscholar.org/CorpusID:55217472 (accessed on 7 June 2025).
  25. Morgan, D.; Agba, E.; Hill, C. Support Structure Development and Initial Results for Metal Powder Bed Fusion Additive Manufacturing. Procedia Manuf. 2017, 10, 819–830. [Google Scholar] [CrossRef]
  26. Schmitt, M.; Kempter, B.; Schlick, G.; Reinhart, G. Parameter Identification Approach for Support Structures in Laser Powder Bed Fusion and Analysis of Influencing Factors. Procedia CIRP 2020, 94, 260–265. [Google Scholar] [CrossRef]
  27. Vaglio, E.; De Monte, T.; Lanzutti, A.; Totis, G.; Sortino, M.; Fedrizzi, L. Single Tracks Data Obtained by Selective Laser Melting of Ti6Al4V with a Small Laser Spot Diameter. Data Brief 2020, 33, 106443. [Google Scholar] [CrossRef]
  28. Großmann, A.; Felger, J.; Frölich, T.; Gosmann, J.; Mittelstedt, C. Melt Pool Controlled Laser Powder Bed Fusion for Customised Low-Density Lattice Structures. Mater. Des. 2019, 181, 108054. [Google Scholar] [CrossRef]
  29. Dabwan, A.; Anwar, S.; Al-Samhan, A.M.; AlFaify, A.; Nasr, M.M. Investigations on the Effect of Layers’ Thickness and Orientations in the Machining of Additively Manufactured Stainless Steel 316L. Materials 2021, 14, 1797. [Google Scholar] [CrossRef]
  30. Sefene, E.M. State-of-the-Art of Selective Laser Melting Process: A Comprehensive Review. J. Manuf. Syst. 2022, 63, 250–274. [Google Scholar] [CrossRef]
  31. ASTM E8/E8M:2016; Standard Test Methods for Tension Testing of Metallic Materials. American Society for Testing and Materials: West Conshohocken, PA, USA, 2016.
  32. Gallego, D.A.; Oliveira, H.R.; Volpato, N. Tensile Strength Specimens for Non-Solid Block Support Structures Manufactured by Laser Powder Bed Fusion: A Preliminary Study. In Proceedings of the 27th International Congress of Mechanical Engineering, Florianópolos, Brazil, 25–27 September 2023. [Google Scholar] [CrossRef]
  33. ASME SA-240/SA-240M:2007; Standard Specification for Chromium and Chromium-Nickel Stainless Steel Plate, Sheet, and Strip for Pressure Vessels and for General Applications. American Society of Mechanical Engineers: New York, NY, USA, 2007.
Figure 1. Representation of design parameters from single-walled block type support structures: (a) x y plane top view. (b) x / y z plane side view.
Jmmp 09 00254 g001
Figure 2. Representation of processing parameters from single-walled block type support structures.
Jmmp 09 00254 g002
Figure 3. Feedstock characteristics: (a) Particle size distribution of the powder sample based on the equivalent circular diameter (ECD), given in micrometers. The green bars represent the frequency distribution, while the black dashed line indicates the cumulative distribution, both given in percentage. (b) Scanning electron micrograph of stainless steel 316L powder.
Jmmp 09 00254 g003
Figure 4. Representation of the standard procedure adopted for measuring the scanning line width (w) and perforation beam thickness ( b p ), according to the view in x y and x / y z perspective. The indicators depicts the details of each view and the dimensions measured.
Jmmp 09 00254 g004
Figure 5. Representation of the geometric details of the support structure tensile strength specimen.
Jmmp 09 00254 g005
Figure 6. Processing parameter exploration build job: (a) Build model top view. (b) Build job concluded.
Jmmp 09 00254 g006
Figure 7. Top view from the single-walled block type support according to the laser power P and the scanning speed v.
Jmmp 09 00254 g007
Figure 8. Side view from the single-walled block type support according to the laser power P and the scanning speed v.
Jmmp 09 00254 g008
Figure 9. Defects identified on the single-walled block type support side view: (a) Sample 07 with visible dross. (b) Sample 46 with visible discontinuities.
Jmmp 09 00254 g009
Figure 10. Average and standard deviation measurements of the beam perforation thickness b p based on different combinations of laser power P and scanning speed v. The red line indicates the nominal beam perforation thickness [ b p ] n o m , while the dashed black lines indicate the tolerance range.
Jmmp 09 00254 g010
Figure 11. Power-law regressions in terms of the linear energy density E L : (a) Regression of scanning line width w. (b) Regression of beam perforation thickness b p . (c) Regression of sample mass m.
Jmmp 09 00254 g011
Figure 12. Mechanical characterization build job: (a) Build model top view. (b) Build concluded.
Jmmp 09 00254 g012
Figure 13. Contrast between the interface locations of the specimens from the mechanical characterization stages: (a) Top interface of specimen 01. (b) Top interface of specimen 33. (c) Bottom interface of specimen 01. (d) Bottom interface of specimen 33.
Jmmp 09 00254 g013
Figure 14. Preliminary evaluations of tensile characterization: (a) Testing setup. (b) Macroscopic characteristics of specimens 34, 36, 09 and 35 fractures.
Jmmp 09 00254 g014
Figure 15. Average and standard deviation of maximum load resistances F m a x of the specimens and their fraction location according to the linear energy density E L .
Jmmp 09 00254 g015
Figure 16. Surface response of the maximum load resistances F ^ m a x in terms of the laser power P and the scanning speed v. The envelope solution is constrained by the dashed black lines and the red spot represents the optimal solution proposed.
Jmmp 09 00254 g016
Figure 17. Maximum stress results based on projected tensile strength σ p r o j and maximum effective tensile strength σ e f f according to the linear energy density E L .
Jmmp 09 00254 g017
Figure 18. Structure efficiency I s u p p of the specimens according to the linear energy density E L .
Jmmp 09 00254 g018
Table 1. Description, nominal values and references of each design parameter fixed in this study.
Design ParameterDescriptionValueReference
θ p Perforation angle60.0 degMaterialise [16]
ϕ Rotation angle45.0 degMaterialise [16]
h s Scan line distance1.50 mmSchmitt [26]
s h Solid height1.50 mmSchmitt [26]
b p Perf. beam thickness0.40 mmLindecke [22]
s p Perforation height1.00 mmSchmitt [26]
Table 2. Results expressed in the linear scanning density E L according to the criteria adopted: red represents the samples that were not concluded; yellow the samples out of tolerance; blue the samples within the tolerance, but with evident defects; and green the samples that were feasible.
E L [J/mm] v [mm/s]
1005009001300170021002500
P [W]500.5000.1000.0560.0380.0290.0240.020
1001.0000.2000.1110.0770.0590.0480.040
1501.5000.3000.1670.1150.0880.0710.060
2002.0000.4000.2220.1540.1180.0950.080
2502.5000.5000.2780.1920.1470.1190.100
3003.0000.6000.3330.2310.1760.1430.120
3503.5000.7000.3890.2690.2060.1670.140
Disclaimer/Publisher’s Note: The statements, opinions and data contained in all publications are solely those of the individual author(s) and contributor(s) and not of MDPI and/or the editor(s). MDPI and/or the editor(s) disclaim responsibility for any injury to people or property resulting from any ideas, methods, instructions or products referred to in the content.

