Article

Measuring Transient Friction Coefficient Affected by Plastic Heat Generation Using a Warm Ring Compression Test with an In Situ Measurement System Measuring Ring Expansion Velocity

1
Department of Mechanical Engineering, Materials Science, and Ocean Engineering, Graduate School of Engineering Science, Yokohama National University, Yokohama 240-8501, Kanagawa, Japan
2
Division of Systems Research, Faculty of Engineering, Yokohama National University, Yokohama 240-8501, Kanagawa, Japan
3
Sanyo Works Co., Ltd., Yokohama 236-0034, Kanagawa, Japan
4
Kanagawa Institute of Industrial Science and Technology, Ebina 243-0435, Kanagawa, Japan
5
Yokohama TLO, Yokohama 240-8501, Kanagawa, Japan
6
Faculty of Engineering, Yokohama National University, Yokohama 240-8501, Kanagawa, Japan
*
Author to whom correspondence should be addressed.
J. Manuf. Mater. Process. 2025, 9(7), 241; https://doi.org/10.3390/jmmp9070241
Submission received: 16 June 2025 / Revised: 11 July 2025 / Accepted: 15 July 2025 / Published: 16 July 2025

Abstract

Frictional conditions at the workpiece–die interface are critical in metal forming, as significant plastic deformation generates heat that affects lubricant performance. Understanding lubricant behavior, especially its influence on friction under elevated temperatures, is essential for optimizing forming processes and meeting ecological demands. While the conventional ring compression test evaluates friction through inner diameter changes, it becomes unreliable when friction is transient. In this study, a warm ring compression test incorporating an in situ measurement system is proposed to evaluate the transient frictional behavior of lubricants under temperature rise due to plastic deformation. Results show that at T = 50 °C and 150 °C, the friction coefficient increases notably with the compression ratio, whereas at T = 100 °C, it remains relatively stable. This stability is likely due to the optimal performance of the chlorinated base lubricant at 100 °C, where boundary lubrication is most effective. At T = 50 °C, the additive activation is insufficient, and at T = 150 °C, thermal degradation may reduce its effectiveness. Finite element simulations using the transient friction coefficient reproduce the deformed ring cross-section with high accuracy, while those using constant friction values show less agreement.

1. Introduction

Metal forming is widely used in various industries to produce lightweight and cost-effective components with high productivity. Frictional conditions at the workpiece–die interface significantly influence forming outcomes, affecting applied loads, product microstructure, surface quality, and tool life [1]. During plastic deformation, a substantial portion of mechanical work is converted into heat, raising the workpiece temperature and influencing lubricant performance [2]. The effectiveness of lubrication is determined by tribological loads, which are characterized by parameters such as contact normal stress, surface enlargement, relative velocity, and initial temperature. These conditions can become severe, especially when forming high-strength or stainless steels, often leading to lubricant failure, pick-up, or galling at the interface [3].
In cold forging, plastic deformation and frictional work generate significant heat, resulting in a noticeable increase in workpiece temperature. Finite element simulations and experimental measurements have shown that during cold forging, workpiece temperatures can reach values as high as 270 °C depending on punch speed, deformation rate, and contact conditions. The conversion of mechanical energy into heat follows an approximately linear trend with respect to punch speed, and this temperature rise affects both forming loads and tool life [4]. Similarly, contact temperatures at the tool–workpiece interface have been reported to reach 200 °C on average, with localized spikes between 500 and 600 °C under high normal stresses and relative velocities [5]. To better understand these thermal effects, advanced measurement techniques, such as thermochromic indicator-based sensory lubricants, have been developed, enabling inline detection of temperatures in industrial processes. These methods confirmed peak temperatures exceeding 260 °C, consistent with FEM predictions [6]. Moreover, the influence of elevated temperature on lubricant performance has been systematically studied. Environmentally benign lubricants, including salt waxes and polymers, exhibited friction reductions of up to 50% at 200 °C, although degradation occurred above 150 °C in some cases [7].
To mitigate the challenges caused by high tribological loads and elevated temperatures, oils formulated with extreme pressure (EP) additives are employed. These additives react chemically with the metal surface under boundary lubrication conditions, forming protective layers that reduce friction and wear [8]. EP additives include chlorinated, sulfurized, and phosphorous-containing compounds. Among them, chlorinated paraffins are particularly effective under extreme conditions due to their high reactivity, forming metal–chlorinated films that prevent galling [2,8,9]. Sulfur-based and phosphorous-based additives, such as sulfurized hydrocarbons and zinc dialkyldithiophosphates (ZDDP), contribute similarly by creating sulfide and phosphate films that enhance load-carrying capacity [8].
However, increasing environmental concerns and the wide range of available lubricant formulations have made the selection and optimization of suitable lubricants more complex [10]. Therefore, understanding lubricant behavior, especially its influence on friction under elevated temperatures caused by plastic deformation, is essential for improving forming performance and meeting sustainability demands.
The process temperature, along with the heat generated by plastic deformation, is a key factor influencing tribological conditions. While numerous studies have examined the tribological behavior between the workpiece and the die under hot conditions, limited research has focused on the temperatures arising from plastic deformation in cold conditions. Waanders et al. [11] investigated temperature-dependent friction modeling and its impact on product quality in sheet metal stamping. Veldhuis et al. [12] studied the effects of process start-up, focusing on how temperature-induced friction increases affect forming stability. Li et al. [13] used ring compression tests to evaluate how friction changes with temperature and strain rate when using graphite-based lubricants. Hardell et al. [14] demonstrated that the increasing temperature reduced friction but increased wear in high-strength steels. Du et al. [15] evaluated the wear and frictional behavior of coated tools under different temperature conditions. Liu et al. [16] examined temperature effects in dry and lubricated conditions, showing a shift from abrasive to adhesive friction mechanisms. Yang et al. [17] studied the influence of temperature and lubricant amount on friction evolution. Noder et al. [18] investigated the temperature-dependent performance of lubricants and die coatings in warm forming of aluminum alloys.
In addition to temperature, other factors such as surface enlargement, roughness, and material transfer affect tribological behavior. Soleymanipoor and Maeno [19] studied friction changes caused by lubricant deterioration from surface enlargement. Surface roughness effects were analyzed under various lubrication and sliding conditions [20,21], while other researchers addressed surface coatings [22], lubricant thickness [23], and material adhesion [24]. These findings emphasize the time-dependent nature of friction in metal-forming processes [25].
To accurately assess friction, reliable testing methods are essential. The ring compression test, introduced by Kunogi [26] and further refined by Male [27], remains widely used in forging research [28,29]. In the ring compression test, the variation in inner diameter is highly sensitive to friction, with the relationship between inner diameter changes and height reduction under various friction conditions represented by specific calibration curves. The accuracy of the conventional ring compression test has been improved and discussed since its proposal by measuring the inner diameter, placing the ball bearing onto the specimen [30], developing a calibration curve under specific temperatures and strain rate ranges [31,32], and proposing a ring compression test with an outer [33] and an inner boss [34]. Moreover, advancements in finite element methods have enabled detailed numerical simulations investigating factors that affect calibration curves [35]. Nevertheless, the use of a calibration curve, which assumes constant friction behavior, should be avoided when friction is inconsistent as it can cause non-uniform changes in the inner diameter during the ring test, leading to an inaccurate evaluation of friction [29,36].
Using a constant friction value to represent transient tribological conditions can introduce inaccuracies in finite element analysis, especially when heat generated from plastic deformation alters lubricant properties. Since the friction coefficient varies with process conditions, assuming it remains constant is insufficient for accurate modeling [11]. Although the conventional ring compression test evaluates friction through inner diameter changes, it provides only discrete data points, requiring multiple interrupted tests at various compression levels to estimate the friction coefficient. This approach becomes unreliable when the friction coefficient changes dynamically. In contrast, the proposed in situ measurement system in this research offers several key innovations. It enables the continuous tracking of the ring’s outer diameter during compression, allowing the full deformation behavior to be captured in a single continuous test. This not only reduces the number of required experiments but also makes it easier to compare experimental data with FEM calibration curves and identify the exact point where deviations occur. Furthermore, the system generates a continuous expansion–time function, from which expansion velocity is derived via differentiation. This transition from displacement-based to velocity-based evaluation enhances sensitivity to subtle and transient changes in frictional behavior, enabling a more accurate and efficient estimation of the friction coefficient throughout the deformation process.
In this study, a warm ring compression test was conducted to replicate the temperature rise occurring during cold forging. An in situ measurement system was implemented to continuously track the ring’s outer diameter expansion, providing real-time data for evaluating frictional changes. This system enables the extraction of the expansion velocity, which enhances sensitivity to subtle variations in friction throughout the compression process. The coefficient of friction was evaluated by comparing the experimental results with the FEM-based calibration curves and by analyzing the expansion velocity of the ring during deformation.

2. Material and Methods

2.1. Overview of the Warm Ring Compression Test with an In Situ Measurement System

The conventional ring compression test, which measures inner diameter changes and height reduction, is limited to evaluating a constant friction coefficient. However, lubricant behavior is not uniform, especially when heat generated from plastic deformation alters its properties. Therefore, using the proposed in situ measurement system in the warm ring compression test allows for a more effective assessment of the lubricant’s transient behavior while accounting for the temperature variations from plastic deformation.
The designed experimental warm ring compression apparatus with an in situ measurement system is illustrated in Figure 1. It comprised an upper moving part attached to the press machine ram and a lower stationary part attached to the press machine bed bolster. Both the upper and lower parts mainly consist of compression cores and heaters. The compression cores are mounted in the holders, and cartridge heaters with 1600 W output are mounted in heater plates to heat the cores, while they are controlled by a K-type thermocouple attached to the surface of the holders.
The in situ measurement system consists of two edge laser sensors that continuously track the outer diameter expansion of the ring by sensing the outward movement of the push plates, which displace as the ring expands during compression. This setup enables the recording of the expansion as a function of compression time, providing the basis for extracting the expansion velocity, with enhanced sensitivity to frictional changes, and evaluating transient friction behavior. While the compression stroke was measured by the contact displacement sensor (GT2, Keyence Corporation, Osaka, Japan), the forming force was continuously measured by the press machine load cells.
The used core, with its 3D view surface topography and the dimensions of the ring used for the ring compression test, is illustrated in Figure 2. The core was made of the quenched and tempered SKD61 of hot work tool steel in JIS with a diameter of 50 mm and thickness of 20 mm. The core surface was prepared by grinding and post-polishing to average roughnesses of Ra 0.179 and 0.269 µm in parallel and perpendicular directions to the grind direction, respectively, and the upper and lower cores were placed in the same grind direction. The ring specimen was made of annealed SCM 425 (Cr-Mo) alloy steel according to the JIS standard, with the chemical composition being shown in Table 1. The ring specimen dimensions were as follows: outer diameter: 24 mm; inner diameter: 12 mm; and height: 8 mm, corresponding to a dimensional ratio of 6:3:2, and both surfaces were ground uniformly, while there was no effect of the grinding process in different directions, with an average roughness of Ra = 0.230 µm.
The sequence of the warm ring compression process, with an in situ measurement system, is illustrated in Figure 3. The rings were heated in an electric furnace on aluminum plates, with a thermocouple attached to monitor and control the temperature without considering the heating time, to temperatures T = 50, 100, and 150 °C. A total of 10 µL of a chlorine-based lubricant, X-4309 (Nihon Kohsakuyu Co., Ltd., Tokyo, Japan), was applied to both the upper and lower core surfaces using a micropipette immediately before each test. This lubricant is a medium-chain chlorinated paraffin (MCCP) with a kinematic viscosity of 127.9 mm2/s at 40 °C and a flash point of 162 °C. It is formulated to provide boundary lubrication through chemical reactions with metal surfaces. The chlorine content promotes the formation of a protective tribofilm under moderate heat and high pressure, thereby reducing wear and seizure during deformation. An additional 10 µL was applied to the opposing core to ensure uniform lubrication on both contact surfaces. The specimens and the cores were heated to the same temperature, and the heating temperature T was set to T = 50, 100, and 150 °C based on the temperature rise due to plastic heating determined by the cold forging simulation, as is discussed below. A servo press (SDE-8018, Amada, Japan) was used for the test, with press speeds of v = 1.2 mm/s and 7 mm/s, in constant velocity motion, and reduction in height of r = 50–55%. The process parameters in the warm ring compression test with an in situ measurement system are summarized in Table 2.

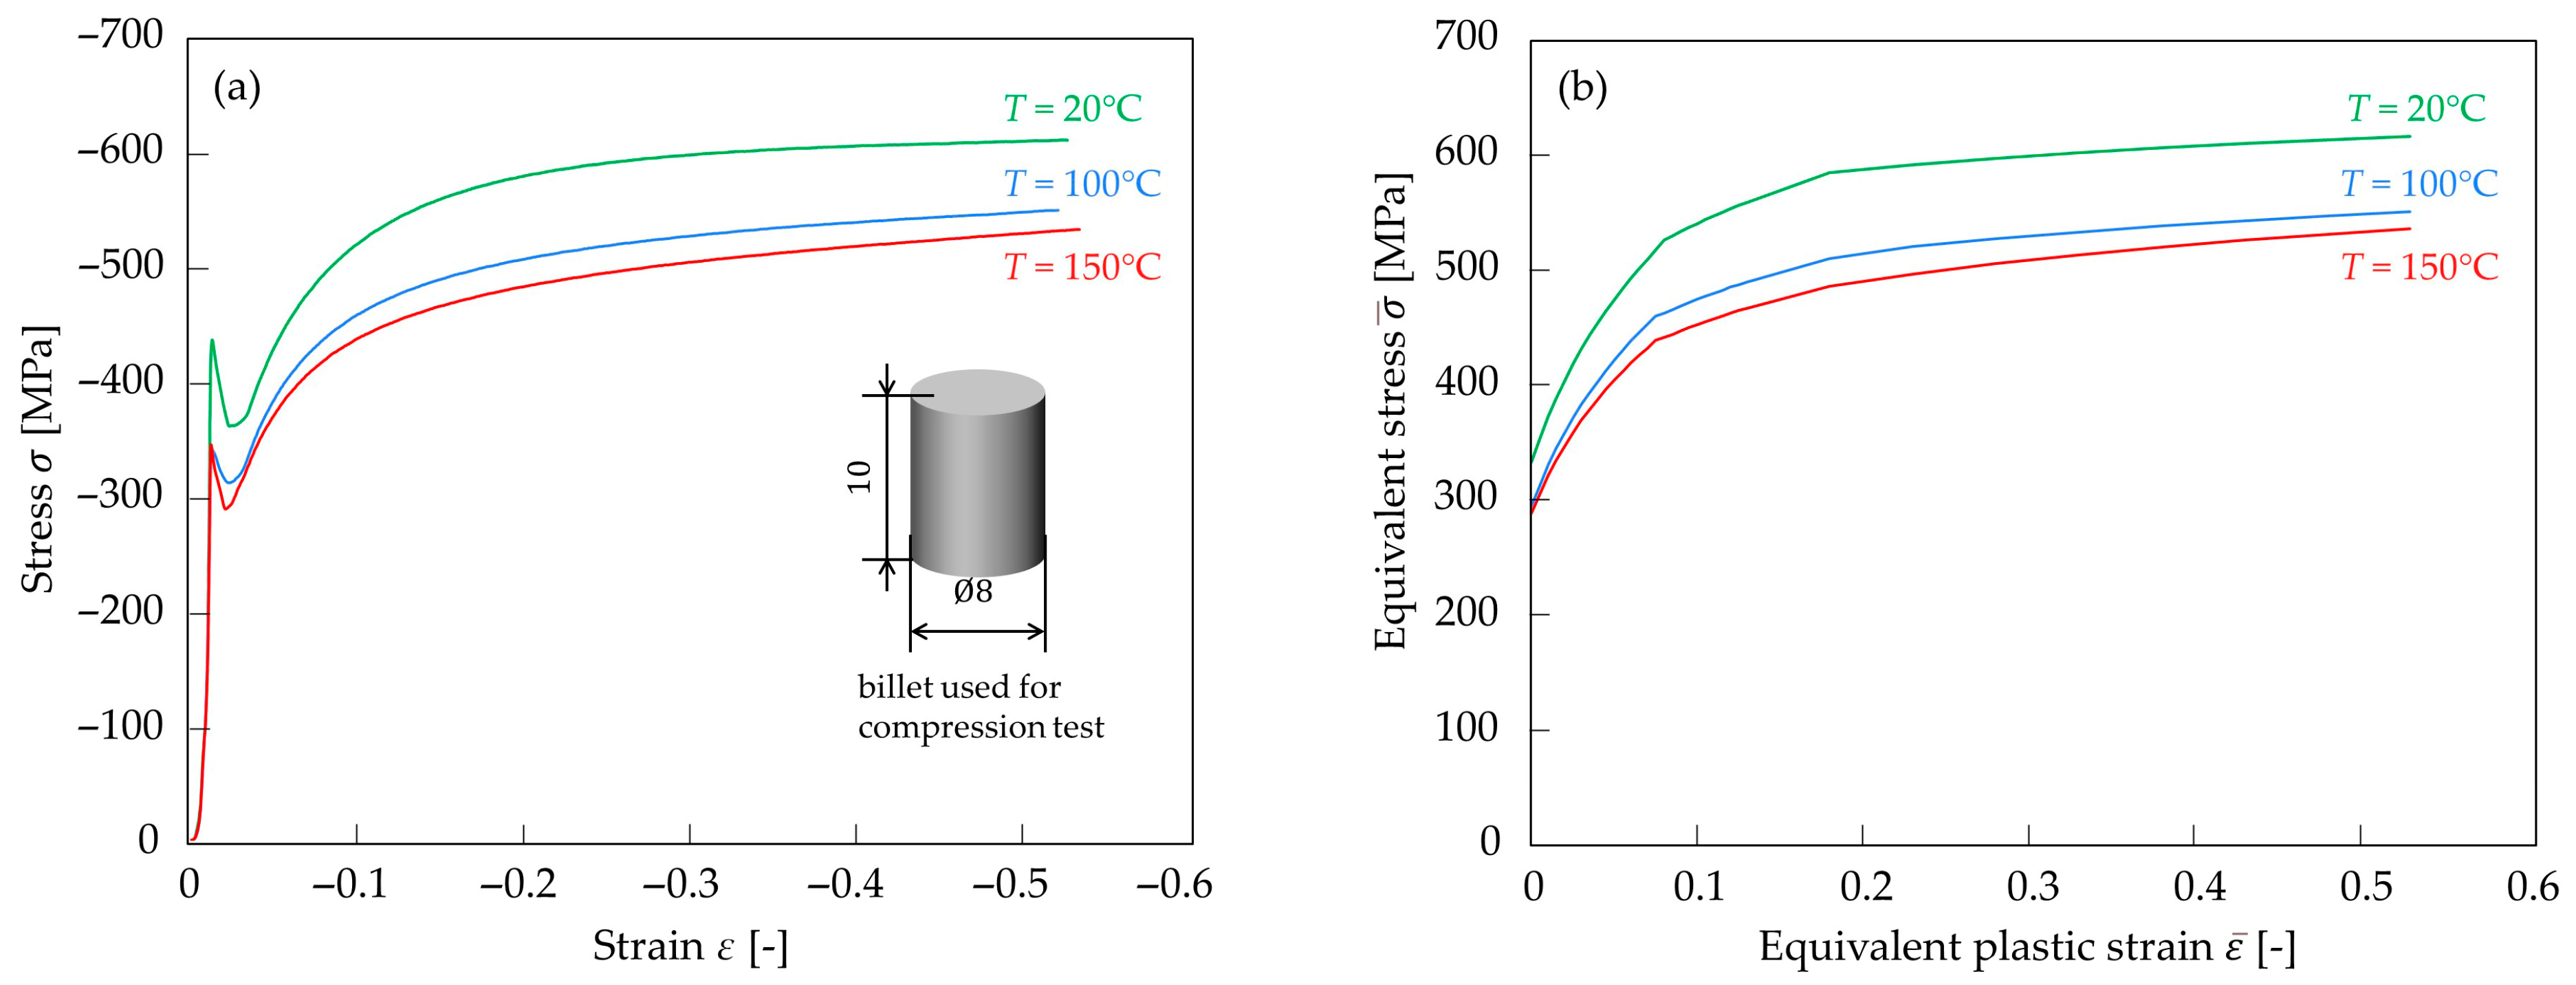
2.2. Methods for Determining Test Temperature and Flow Stress Measurement in Warm Conditions

The temperature range for the warm ring test was determined using a coupled heat-deformation FEM analysis of the cold-forged product. As an example of a high-precision cold-forged product, bevel gear forging was selected for investigation. The effect of increased temperature was analyzed using the commercial FEM software Simufact Forming 2024-2. The heating conversion ratio was set to 0.9, with the initial temperatures of both the rigid die and the deformable billet set at 20 °C. Material properties consistent with those used in the ring compression test (SCM 425 in JIS) were obtained through a compression test, and a constant press speed of 7 mm/s was applied during the simulations. Additionally, tests were conducted to assess the effect of different friction coefficients on the temperature increase, with two friction values of µ = 0.1 and 0.2. Figure 4 illustrates the temperature change at the tooth tips and grooves during the cold forging of the bevel gear from the start of the process to the bottom dead center stroke, along with the corresponding temperature distribution at the bottom dead center obtained via FEM analysis. In both friction coefficients, namely, µ = 0.1 and µ = 0.2, a significant increase in temperature from the initial temperature was observed in the tooth grooves due to intense deformation. However, as the process neared the bottom dead center, the temperatures at both the tooth tips and grooves equalized, reaching approximately 130 °C. Furthermore, the effects of different friction coefficients on temperature changes during bevel gear forging were negligible. Based on these findings, the test temperatures for the warm ring compression tests were set at T = 50, 100, and 150 °C. Due to the difficulty of maintaining a stable room temperature, 50 °C was used instead. The 150 °C condition represents the upper limit observed in cold forging, while the 100 °C condition serves as an intermediate point by which to examine temperature effects on deformation and interface behavior.
Since highly accurate material properties were essential for obtaining the calibration curves for warm ring compression simulations, additional compression tests were conducted. In addition to the compression test performed at T = 20 °C, which was used for the cold forging simulation of the bevel gear, warm compression tests were carried out after determining the increased temperature range from the bevel gear simulation. These tests were conducted at constant temperatures of T = 100 °C and T = 150 °C, with a compression speed of 7 mm/s, using a Thermecmastor-Z machine (Fuji Electric Industrial Co., Ltd., Tokyo, Japan). The billet size was 10 mm in height and 8 mm in diameter, and each test was repeated five times at each temperature. The results are shown in Figure 5, where the flow stress–strain curve is presented in Figure 5a, and the equivalent plastic stress–strain curve used in FEM analysis is shown in Figure 5b.

2.3. Modification of Ring Height Reduction Measured by Contact Displacement Sensor

The ring height reduction measurement process during the compression test is shown in Figure 6. The ring height reduction was estimated from the stroke of the upper die measured by the contact displacement sensor. However, this measurement is influenced by the elastic deformation of the press and tools, resulting in a recorded value higher than the actual reduction in height, which is determined based on the final height of the ring after compression. To solve this issue, the measured reduction in height was adjusted by incorporating the actual reduced height after ring compression. The modified reduction in height at each moment, hi, is determined by adjusting the measured reduction in height, hm, by the contact displacement sensor at the same moment to account for the deflection caused by the elastic deformation of the press machine and tools. This adjustment is made using a correction factor α:
h i = h m α F i
where Fi is the compression force at each moment.
The correction α as follows:
α = Δ s / F m a x
where Δs represents the difference between the estimated reduction in height by the displacement sensor Ss and the real reduction in height Sr:
Δ s = s s s r
Here, Fmax is the maximum force applied during this process.

2.4. Measurement of Outer Diameter Expansion of Ring During Compression and Extraction of Expansion Velocity

The method of measuring outer diameter expansion during the ring compression test is illustrated in Figure 7. The proposed setup consists of two push plates in contact with the ring and two edge laser sensors positioned to detect the outer edges of the push plates. As the compression test starts and the ring expands during compression, the push plates move outward accordingly. This movement is continuously captured by the edge laser sensors, enabling the real-time tracking of the ring’s outer diameter expansion.
In the next step, to extract the outer diameter expansion velocity of the ring during compression, the push plate movement equation over time is obtained by applying curve fitting to the movement–time data tracked by the edge laser sensors. By differentiating this equation, the expansion velocity is derived. Since the expansion velocity reflects the instantaneous deformation behavior, it is more sensitive to subtle or transient changes in interfacial friction conditions than the expansion ratio. This increased sensitivity allows for the more accurate evaluation of the frictional behavior during deformation. The process of applying the curve fitting method to obtain the expansion velocity of the compressed ring is illustrated in Figure 8.

3. Results and Discussion

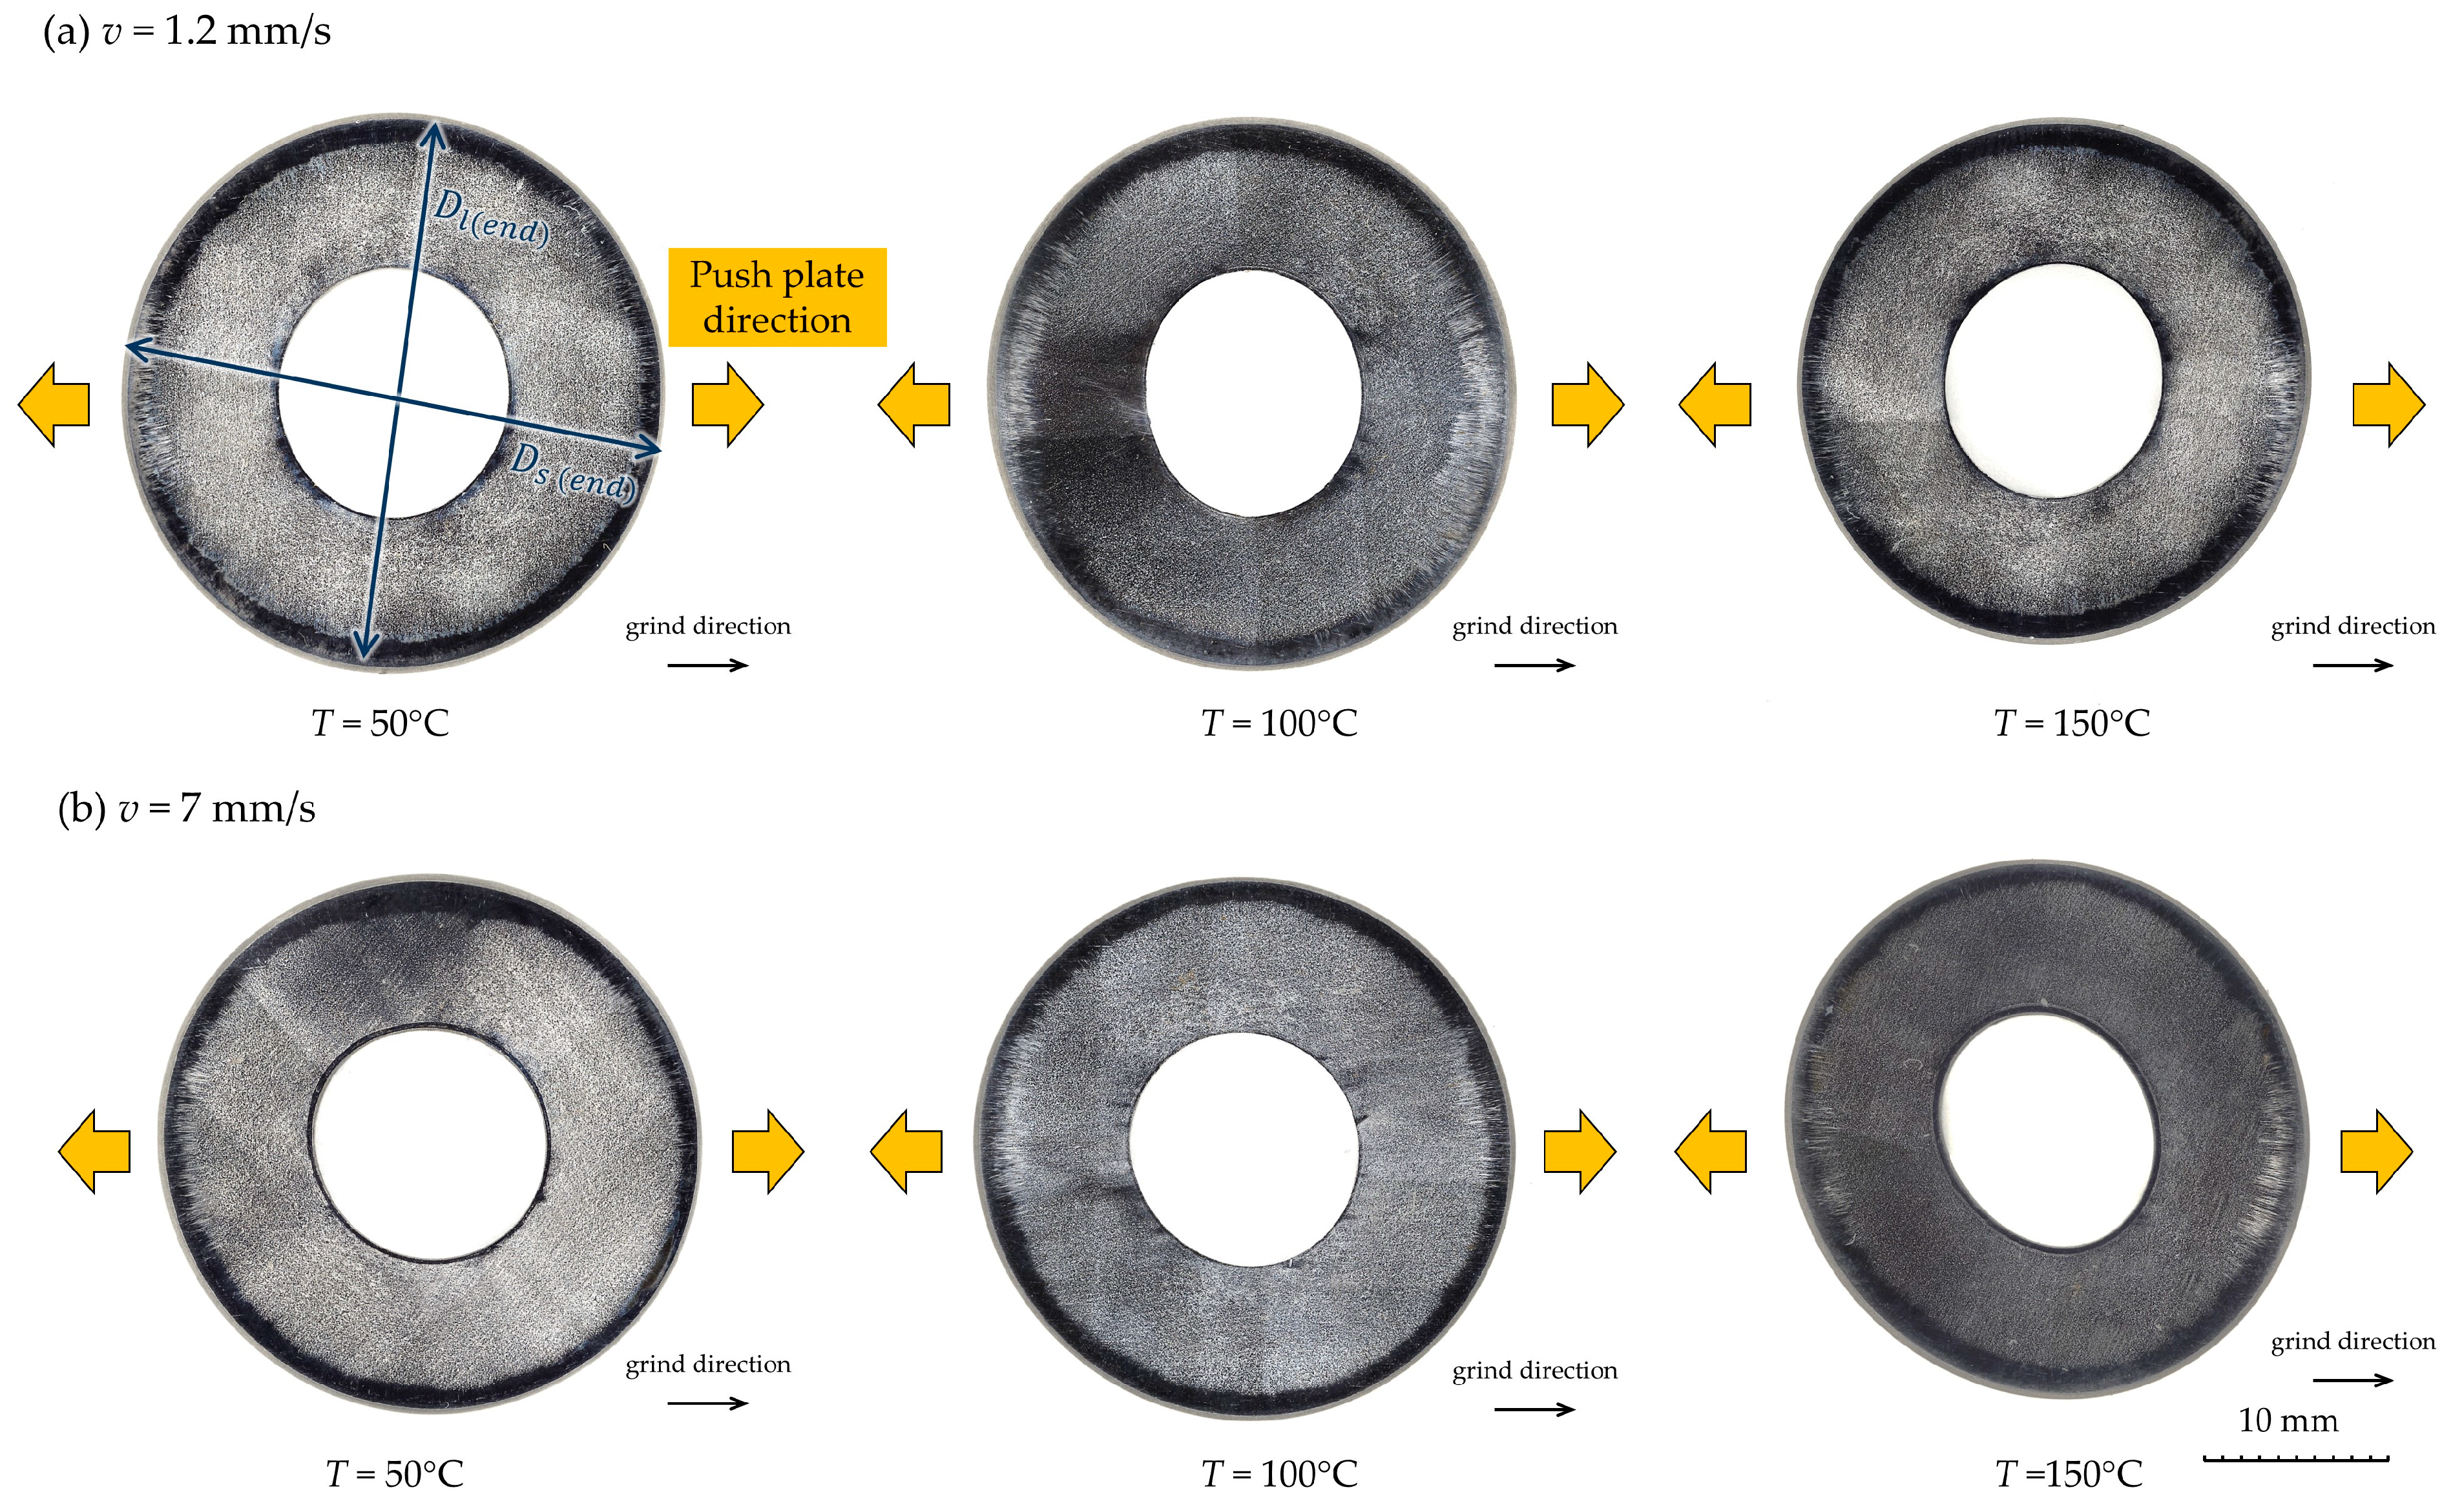
3.1. Shape of Compressed Ring and Modification of Non-Uniform Outer Diameter Expansion

The shapes of the compressed rings tested under warm conditions at T = 50, 100, and 150 °C, with compression speeds of v = 1.2 mm/s and 7 mm/s, are illustrated in Figure 9 as a representative result of each condition out of six repeated tests. The rings deformed into an oval shape under all conditions. This deformation is attributed primarily to tribological interactions between the ring and the core surface, particularly due to the directional roughness of the core, rather than to any inconsistency in the ring specimens themselves.
The ring was made of annealed SCM 425, and its surfaces were uniformly ground after machining, resulting in consistent surface conditions with an average roughness of Ra = 0.230 µm and no significant variation in the radial direction. Therefore, the influence of the ring’s outer surface on the observed ovality is considered negligible. In contrast, the core surface exhibited anisotropic roughness, with measured values of Ra = 0.179 µm parallel to, and Ra = 0.269 µm perpendicular to, the grinding direction. This difference affected local frictional resistance during compression and is likely responsible for the directionality of the oval deformation, where the larger diameter (Dl(end)) of the resulting oval ring tended to form almost perpendicular to the core grinding direction.
Due to this ovality and the non-uniform expansion along the direction of the push plates, the measured expansion varied in each test, which caused a discrepancy of approximately 3–8% between the actual average expansion ratio of the ring after compression and the value measured by the edge sensors. (In most cases, the values measured by the edge sensors were lower than the actual values.) To account for these variations, the expansion measured by the edge laser sensors was corrected using the final average outer diameter of the ring in each test, as described by Equation (4). The corrected outer diameter at each time step, Di, is calculated by applying a correction factor, β, to the measured outer diameter, De(i), by edge sensors at each time step:
D i = β D e ( i )
The correction factor β is defined as follows:
β = D a v e ( e n d ) D e ( e n d )
where De(end) is the evaluated outer diameter by edge laser sensors at the final time step, and Dave(end) is the average outer diameter at the final time step in the compressed ring, calculated as follows:
D a v e ( e n d ) = ( D l ( e n d ) + D s ( e n d ) ) / 2
Here, Dl(end) and Ds(end) represent the compressed ring’s larger and smaller outer diameters, respectively, at the final time step.

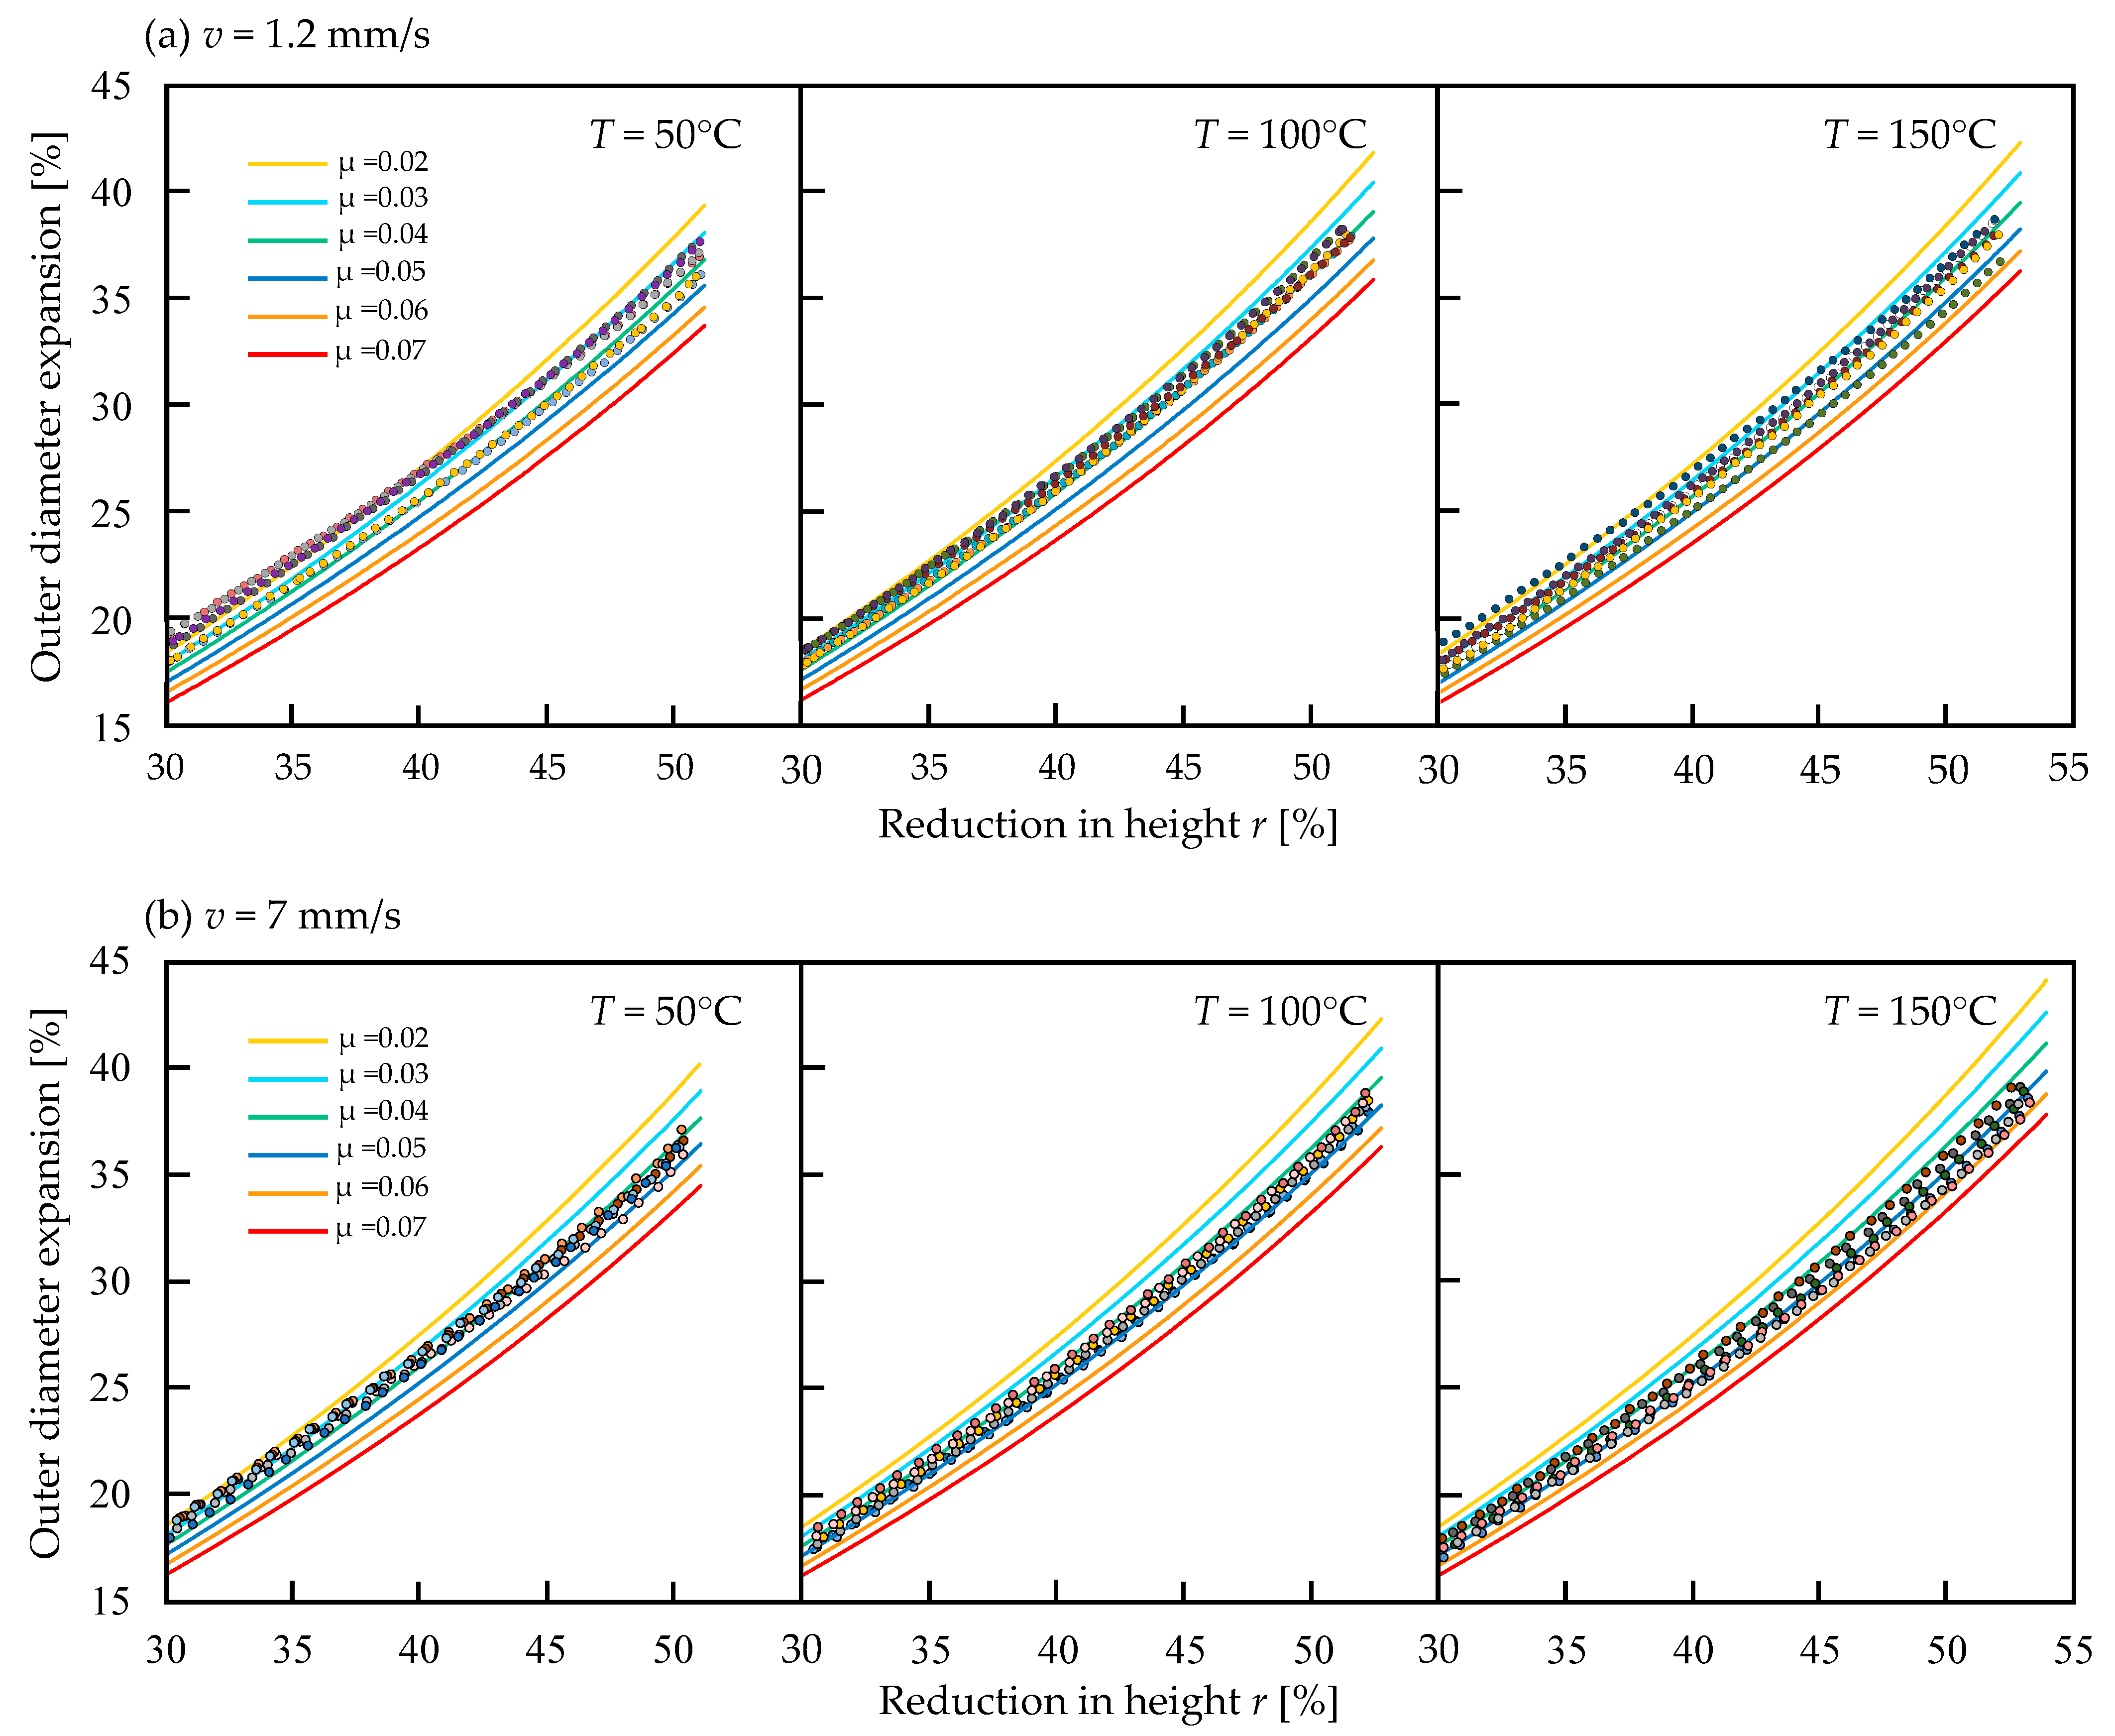
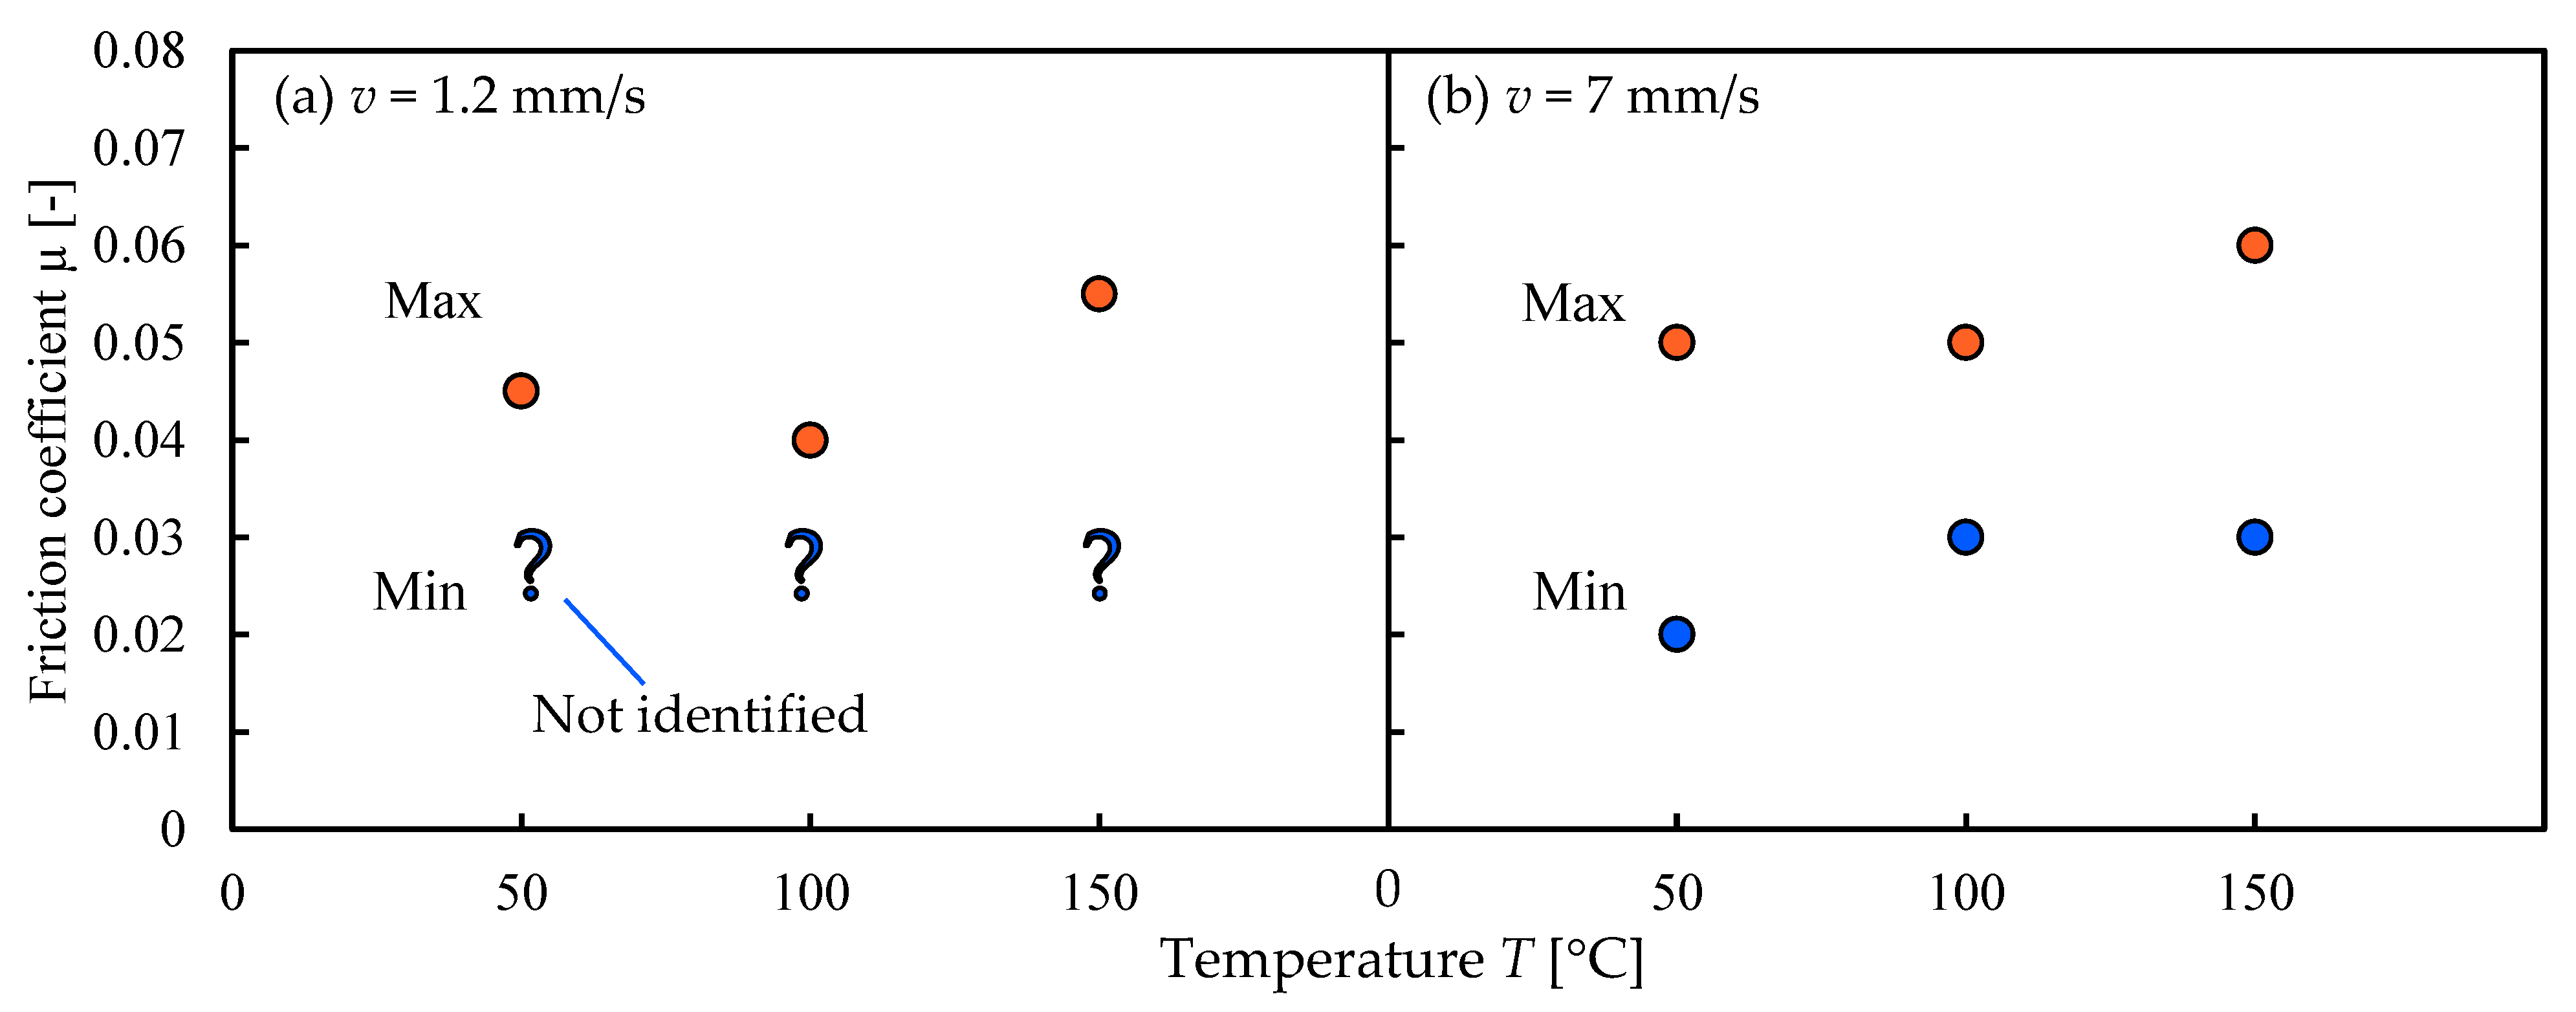
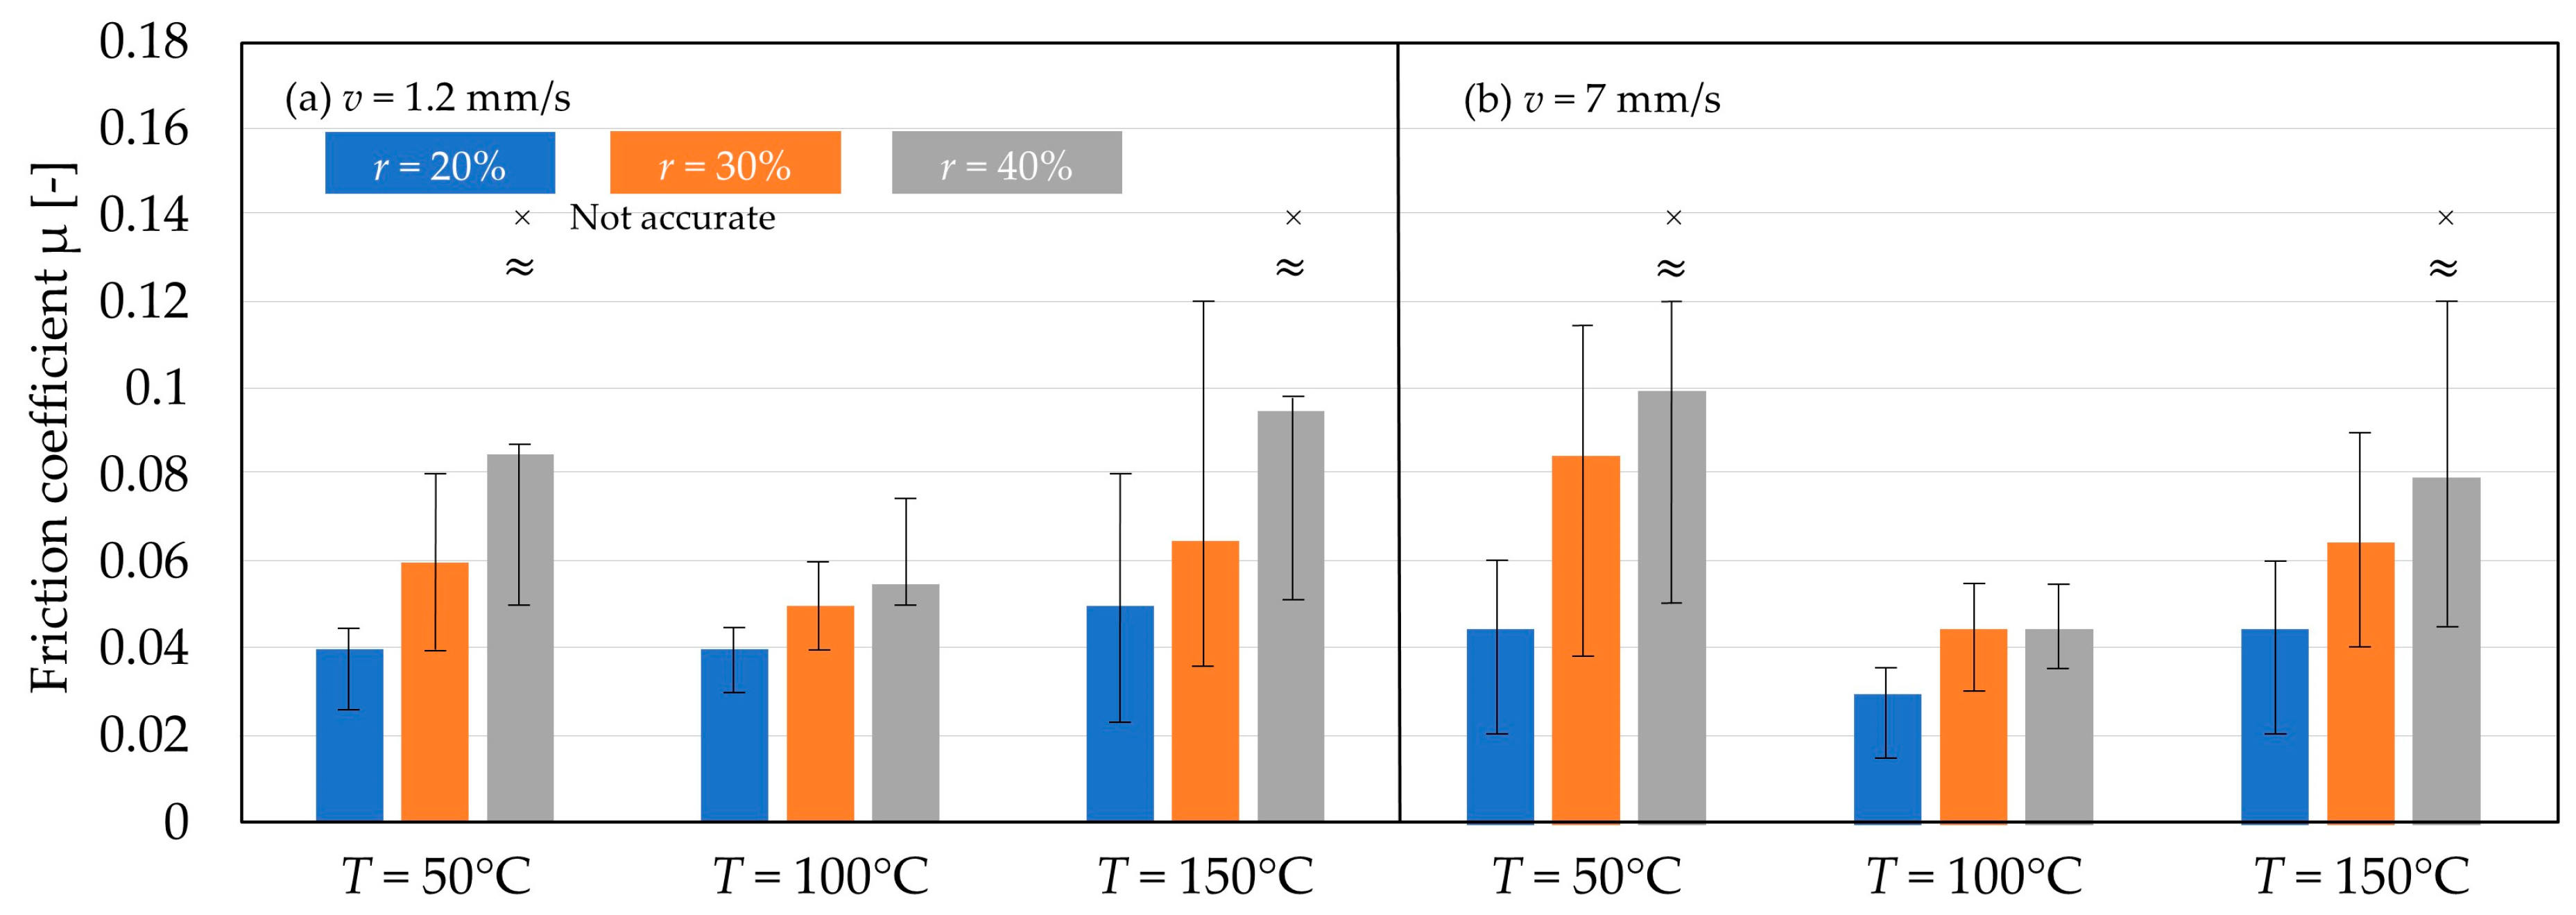
3.2. Effect of Temperature on Friction Coefficient Obtained from Outer Diameter Expansion Nomograph

The relationship between the outer diameter expansion and the reduction in height ratio, derived from the warm ring compression tests, along with the calibration curves obtained through FEM at compression speeds of v = 1.2 and 7 mm/s, is shown in Figure 10. Commercial FEM software Simufact Forming 2024-2 was used for FEM analysis. Both dies and specimens are analyzed as an axisymmetric model. The mechanical properties of the specimens are determined according to the flow stress curve shown in Figure 5b, and the die is assumed to be a rigid material. Since the mechanical property for each temperature is selected according to flow stress curves at the same temperature, plastic heat generation is omitted. Experimental results obtained from six runs under identical conditions generally indicate a low friction coefficient of less than 0.07. In both compression speeds, a slight increase in friction is observed as the reduction in height, r, increases, and the friction coefficient is not stable throughout the compression. The scatter of repeated tests under identical conditions is greater at T = 50 °C and 150 °C, indicating instability in frictional behavior. This instability not only increases scatter but also contributes to deviations from the FEM calibration curves due to the accumulated effect of transient friction throughout the compression process. At T = 50 °C, chlorinated extreme pressure additives are not sufficiently activated, while at T = 150 °C, thermal degradation begins, leading to unstable boundary lubrication. In contrast, at T = 100 °C, near the optimal activation temperature of the chlorinated additives, stable boundary films form, resulting in reduced scatter, despite some deviation from the FEM curves. The relationship between the friction coefficient and the temperature, which is obtained from Figure 10, is illustrated in Figure 11. The friction coefficient is identified by the degree of alignment with the experimental and FEM calibration curves at r = 30% to 50%, as it cannot be determined if the experimental curve deviates from the FEM curves. Meanwhile, due to the difficulty of obtaining an average value from agreement with the curves, maximum and minimum values for each temperature are plotted, and this indicates that temperature has a minimal effect on the coefficient of friction for the tribological interfaces and lubricant used in these experiments.
In the estimation of the friction coefficient via ring compression tests, with the results obtained from the expansion of the rings, friction is estimated by comparing the experimental data with the calibration curves derived from FEM analysis. However, this estimation relies heavily on the observer’s judgment, and this becomes difficult when the friction coefficient is not stable over the compression and when the experimental points deviate from the calibration curves (same as in Figure 10). Saiki et al. [37] focused on the expansion velocity of the ring, calculating the friction coefficient based on changes in the radial velocity at the ring’s outer diameter to overcome the misestimation associated with using the expansion ratio alone. Since expansion velocity reflects the instantaneous deformation behavior, it is more sensitive to transient variations in frictional conditions during compression. Therefore, to address this limitation, the method proposed by Saiki et al. is further developed in this research to enable the estimation of transient friction coefficients during the warm ring compression test.

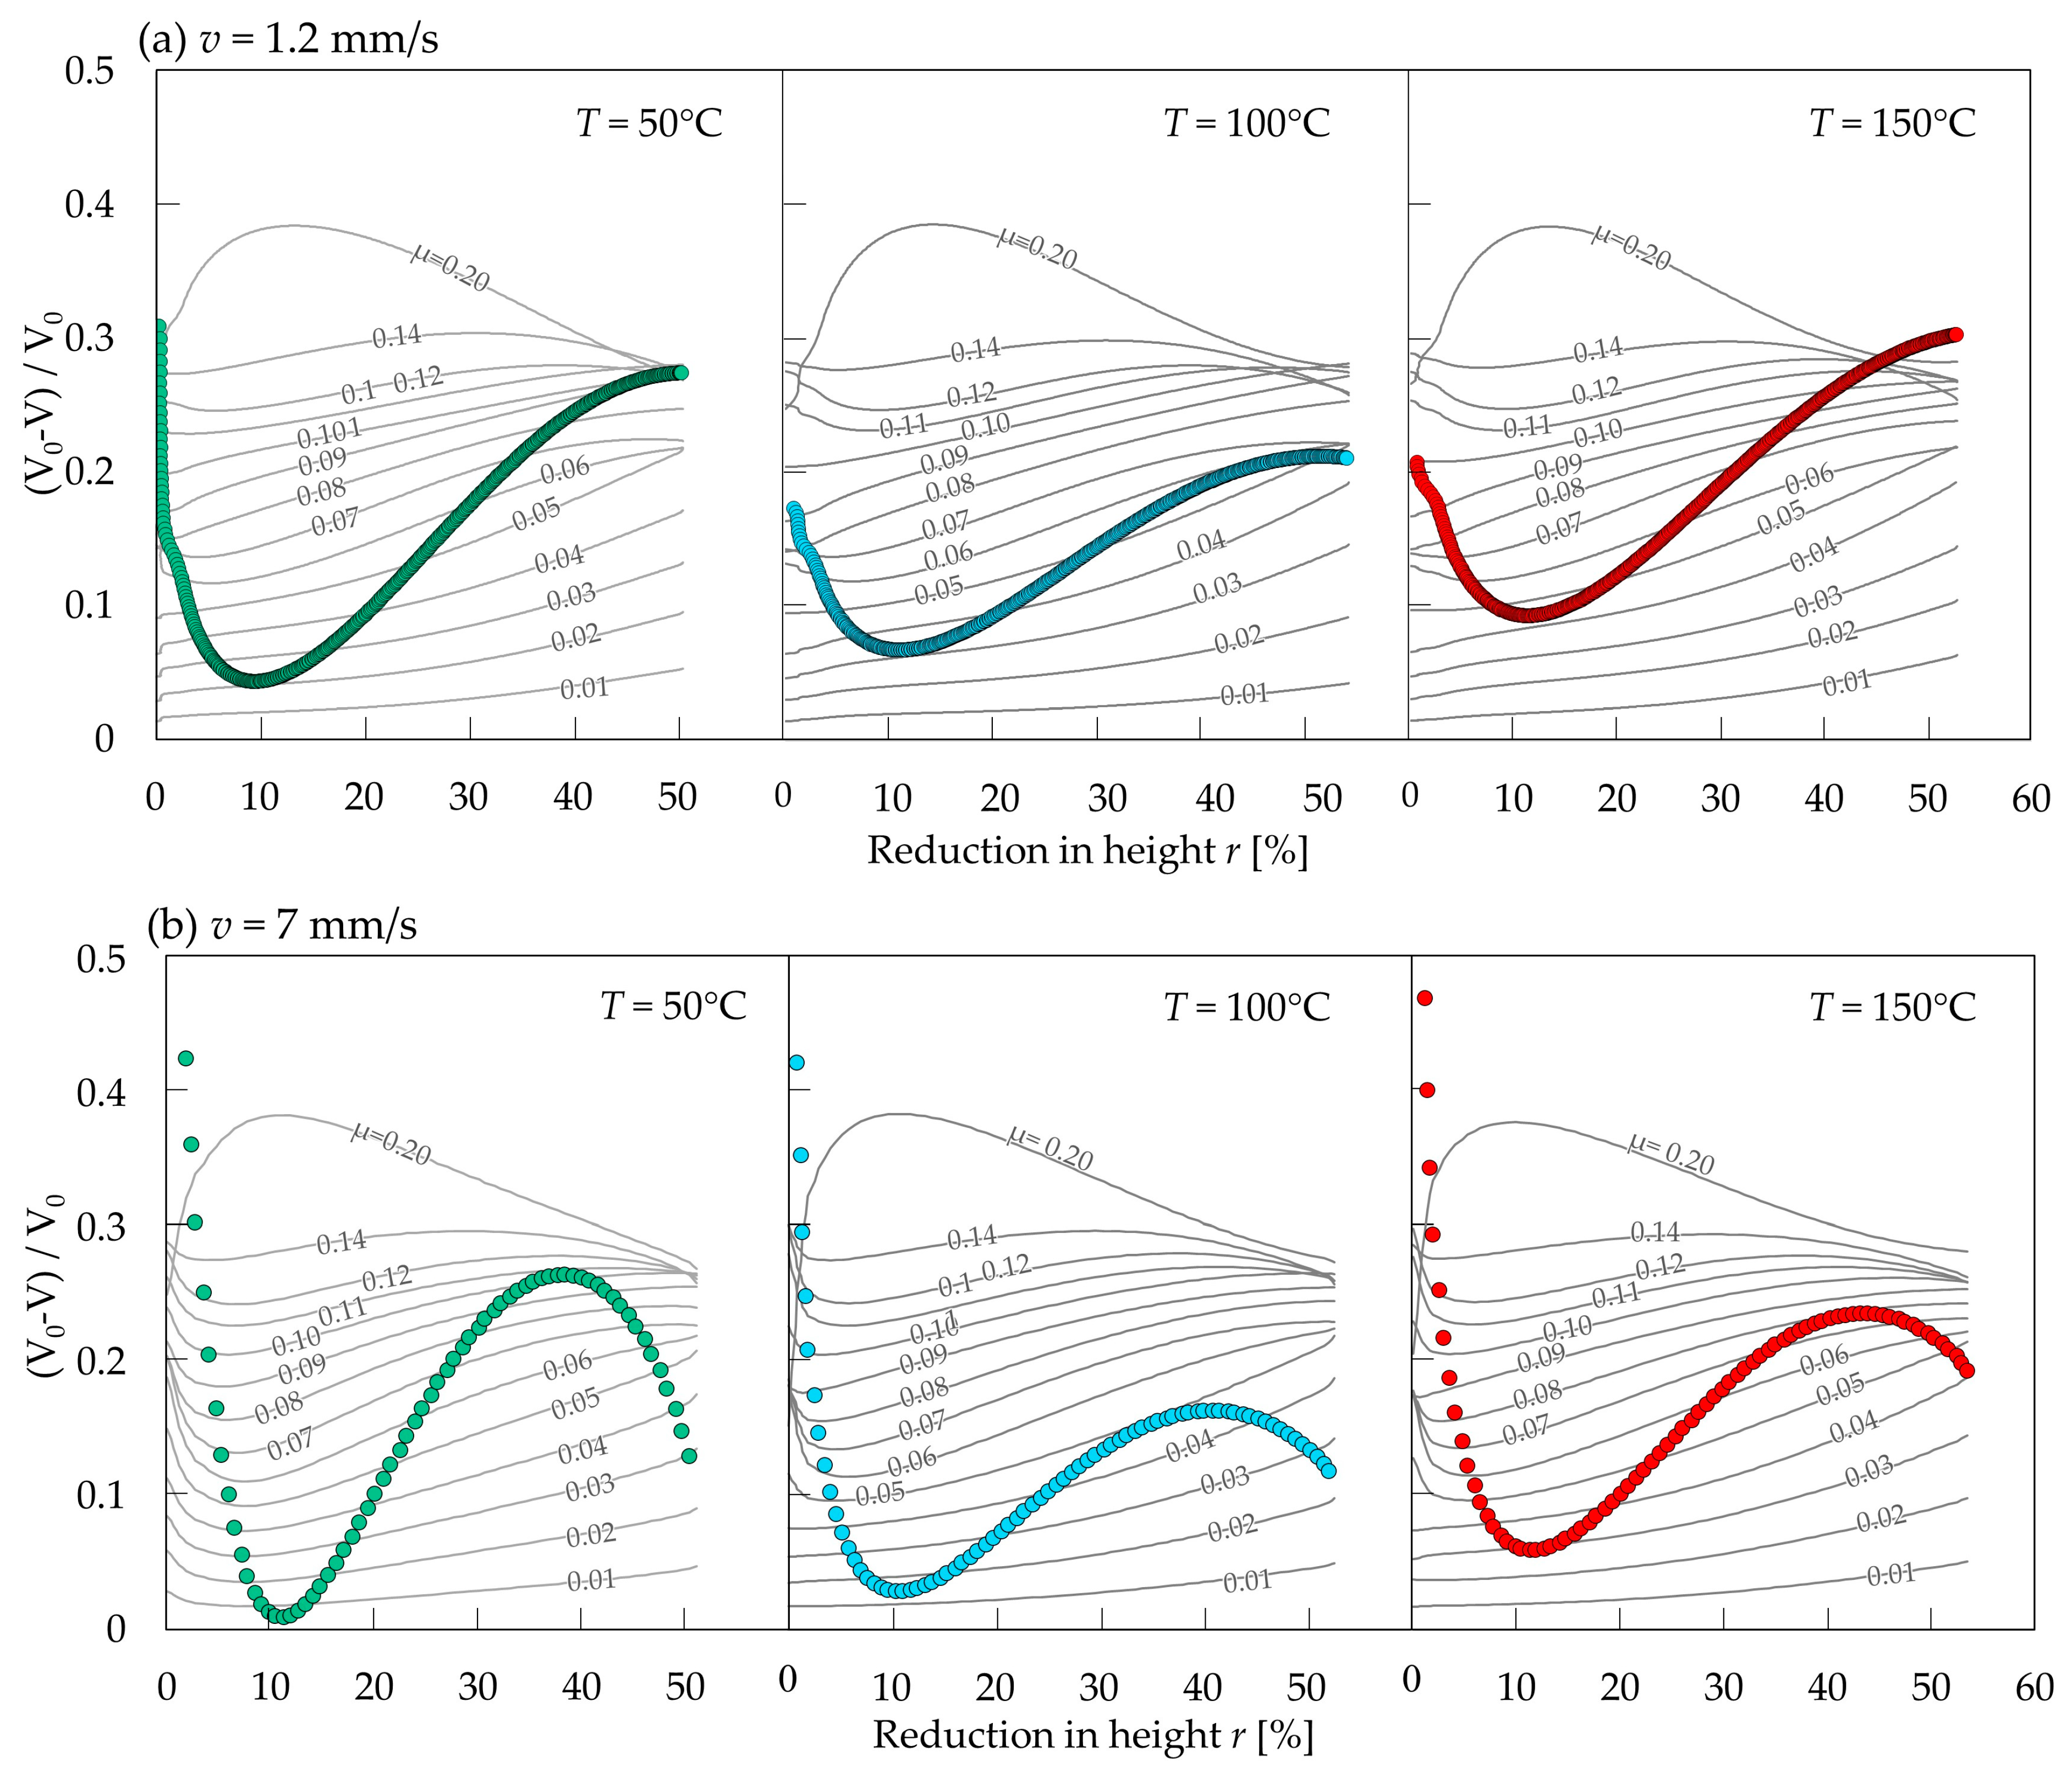
3.3. Using Expansion Velocity to Determine Transient Friction Coefficient

The nomographs illustrating the friction coefficient based on the expansion velocity of the outer diameter during the warm ring compression test, with compression speeds of v = 1.2 and 7 mm/s, are illustrated in Figure 12. Here, V0 is defined as the velocity of change in the ring outer diameter in the FEM simulation, with a friction coefficient of 0; while V represents the expansion velocity across various friction coefficients. The FEM calibration curves are indicated by solid grey lines, whereas the experimental tests at different temperatures are represented by dotted colored lines.
When the experimental curves follow a similar trend as the FEM calibration curves, variations in the friction coefficient become apparent. In tests conducted at T = 50 and 150 °C, the friction coefficient increases notably with a reduction in height, whereas this change is minimal at T = 100 °C. However, the experimental nomographs show a sharp change in the normalized expansion velocity, (V0 − V)/V0, in the early stage of compression. This occurs because the expansion velocity V increases rapidly at the early stage, causing the normalized value to drop sharply. This behavior is attributed to the mechanical response of the annealed SCM425 material, which exhibits a transition from the upper to the lower yield point, as shown in Figure 5. Additionally, the release of elastic deformation stored in the press machine dies at the early stage of compression during this transition may contribute to this sudden increase in expansion velocity.
In the final stage of compression, the FEM calibration curves converge when the friction coefficient exceeds 0.10 at high height reduction ratios across all temperatures. This indicates that the sensitivity of expansion decreases, making friction investigations less accurate. Additionally, the experimental outer expansion velocity is influenced by the accumulation of the transient friction coefficient throughout the process, affecting the shape and, consequently, the expansion velocity of the compressed ring.
The evaluated transient friction coefficient in the ring compression test is depicted in Figure 13, which is extracted from Figure 12. Friction coefficients were readily derived by comparing the experimental values with the FEM calibration curves. In tests conducted at both compression speeds at T = 50 °C and 150 °C, the friction coefficient increases notably as the compression ratio increases. In contrast, at T = 100 °C, the change is minimal, indicating stable friction. This stability at T = 100 °C may be attributed to the lubricant’s optimal operating temperature (chlorinated additive lubricant), where it maintains a consistent friction coefficient.

3.4. Comparison Between Experimentally Compressed Ring and Simulated Compressed Ring with Transient Friction Coefficient

The ring compression test was simulated in the FEM software Simufact Forming using both a transient friction coefficient evaluated from warm ring compression tests at T = 100 °C and 150 °C and a constant friction coefficient, as shown in Figure 14. The simulations and corresponding experimental tests were conducted under identical conditions, with a compression speed of v = 7 mm/s and a height reduction ratio of r = 40–43%. This reduced compression range was intentionally selected to avoid the reduced accuracy associated with larger height reductions (r > 45%), where calibration curves converge and friction estimation becomes unreliable.
The cross-sections of the compressed rings from both experimental tests and FEM simulations are compared in Figure 15. The shape of the ring cross-section, shown at the top of Figure 15, is representative of six repeated tests, and the displayed dimensions are the average values measured at corresponding positions in each test. At T = 100 °C, the FEM results under both transient and constant friction conditions show good agreement with the experimental profile, reflecting the minor variation in friction behavior and the small difference between the transient and constant friction values (µ = 0.04), as the amplitude of the transient friction is low. In contrast, at T = 150 °C, the FEM simulation using the transient friction coefficient shows closer agreement with the experimental cross-section, particularly in the shape and curvature of the inner diameter, than the simulation using a constant friction value of µ = 0.06.

4. Summary and Conclusions

In this study, a warm ring compression test incorporating an in situ measurement system was conducted to investigate the transient frictional behavior of lubricants under temperature increases caused by plastic deformation during cold forging. The developed system enabled the real-time measurement of the ring’s outer diameter expansion, allowing for continuous tracking of deformation and the estimation of the transient friction coefficients based on expansion velocity. Friction behavior was evaluated at three temperatures (50 °C, 100 °C, and 150 °C) and two compression speeds (1.2 mm/s and 7 mm/s), revealing notable variations in the friction coefficient with respect to temperature and compression ratio.
The results demonstrate that the temperature increase during plastic deformation has a significant effect on lubricant performance. At T = 100 °C, the friction coefficient remained relatively stable across the compression ratios, indicating that the chlorinated extreme pressure (EP) additives in the lubricant are optimally activated at this temperature, enabling effective boundary film formation. In contrast, at T = 50 °C, the additives are not sufficiently activated, resulting in unstable lubrication and a noticeable increase in friction as compression progresses. At 150 °C, thermal degradation of the additives likely occurred, weakening the boundary film and, again, causing elevated and less stable friction. Finite element simulations incorporating the experimentally obtained transient friction coefficients accurately reproduced the ring deformation. At 100 °C, both constant and transient friction models showed good agreement with the experimental results due to the relatively stable frictional behavior. However, at 150 °C, the simulation using the transient friction coefficient demonstrated better agreement, particularly in capturing the ring’s cross-sectional shape. These findings highlight the importance of including transient friction behavior in process modelling for more reliable simulation outcomes.

5. Outlook

In cold forging applications such as gear production from low-and high-alloy steels, where dimensional accuracy and surface integrity are critical, understanding the influence of temperature on frictional behavior is essential. The methods presented in this study, though simple, offer valuable insight for estimating the transient friction coefficient in practical conditions. The use of an in situ measurement system provides an efficient way to assess lubricant behavior during deformation. This research evaluates the transient behavior of the lubricant using a warm ring compression test with in situ measurement; however, the surface enlargement and contact pressure in this test are relatively small. Applying the obtained friction values to the FEM simulations of bulk metal-forming processes with larger surface enlargements or higher contact pressures, such as forward or backward extrusion, requires further consideration. For the more realistic estimation of frictional behavior, using a core with tribological properties similar to actual forging dies could be beneficial. Alternatively, dividing FEM simulations into early, middle, and final stages and applying stage-specific transient friction coefficients could enhance prediction accuracy. Although friction behavior in real industrial forging conditions is complex, integrating transient behavior into simulations will engender more accurate estimations before physical trials, reducing the need for extensive die design modifications and improving final product quality.

Author Contributions

Conceptualisation, A.S. and T.M.; methodology, A.S., T.M. and K.T. (Kosuke Tosaka); software, A.S. and K.T. (Kazuhito Takahashi); validation, A.S. and T.M.; formal analysis A.S., M.K. and M.Y. investigation, A.S., T.M., K.T. (Kosuke Tosaka), K.T. (Kazuhito Takahashi) and O.T.; resources, T.M.; data curation, A.S.; writing—original draft preparation, A.S.; writing—review and editing, A.S. and T.M.; visualization, A.S.; supervision, T.M. and O.T.; project administration, T.M.; funding acquisition, T.M. All authors have read and agreed to the published version of the manuscript.

Funding

This research was funded by the Go-Tech Foundation under the Ministry of Economy, Trade, and Industry of Japan.

Data Availability Statement

Data available on request due to restrictions related to the author’s ongoing research. The data are not publicly shared at this time, but may be provided upon reasonable request at the discretion of the corresponding author.

Acknowledgments

This research is part of the “Development of prototype-less cold forging products with DX to achieve high functionality, high precision, low cost, short lead time, and environmental considerations,” which was adopted in the FY2022 growth-type small and medium-sized enterprise research and development support project (Go-Tech project).

Conflicts of Interest

Author Masato Kakudo and Motoki Yanagisawa were employed by the company Sanyoseisakusho. Author Kazuhito Takahashi was employed by company Kanagawa Institute of Industrial Science and Technology. Author Osami Tsukamoto was employed by company Yokohama Technology Licensing Office (Yokohama TLO). The remaining authors declare that the re-search was conducted in the absence of any commercial or financial relationships that could be construed as a potential conflict of interest.

References

  1. Bhushan, B. Introduction to Tribology; John Wiley & Sons: Hoboken, NJ, USA, 2013. [Google Scholar]
  2. Farren, W.; Taylor, G. The heat developed during plastic extrusion of metals. Proc. R. Soc. Lond. 1925, 107, 422–451. [Google Scholar]
  3. Bay, N.; Azushima, A.; Groche, P.; Ishibashi, I.; Merklein, M.; Morishita, M.; Nakamura, T.; Schmid, S.; Yoshida, M. Environmentally benign tribo-systems for metal forming. CIRP Ann. 2010, 59, 760–780. [Google Scholar] [CrossRef]
  4. Kim, H.S.; Lee, S.M.; Kim, Y.H.; Kim, M.S.; Park, C.Y. Finite element analysis for temperature distributions in a cold forging. J. Mech. Sci. Technol. 2013, 27, 2979–2984. [Google Scholar] [CrossRef]
  5. Volke, P.; Groche, P. Interfacial heat transfer coefficients in cold forging of stainless steel. Int. J. Mater. Form. 2022, 15, 32. [Google Scholar] [CrossRef]
  6. Kuhn, C.; Volke, P.; Groche, P. Thermochromically Enhanced Lubricant System for Temperature Measurement in Cold Forming. Processes 2025, 13, 513. [Google Scholar] [CrossRef]
  7. Groche, P.; Zang, S.; Müller, C.; Bodenmüller, D. A study on the performance of environmentally benign lubricants at elevated temperatures in bulk metal forming. J. Manuf. Process. 2015, 20, 425–430. [Google Scholar] [CrossRef]
  8. Asadauskas, S.J.; Biresaw, G.; McClure, T.G. Effects of Chlorinated Paraffin and ZDDP Concentrations on Boundary Lubrication Properties of Mineral and Soybean Oils. Tribol. Lett. 2010, 37, 111–121. [Google Scholar] [CrossRef]
  9. Yan, L.; Yao, X.; Zhang, T.; Jiang, F.; Shui, Y.; Xie, H.; Xiang, Z.; Li, Y.; Lin, L. Passivation Effect of the Chlorinated Paraffin Added in the Cutting Fluid on the Surface Corrosion Resistance of the Stainless Steel. Molecules 2023, 28, 3648. [Google Scholar] [CrossRef] [PubMed]
  10. Groche, P.; Müller, C.; Stahlmann, J.; Zang, S. Mechanical conditions in bulk metal forming tribometers—Part one. Tribol. Int. 2013, 62, 223–231. [Google Scholar] [CrossRef]
  11. Waanders, D.; Hazrati Marangalou, J.; Kott, M.; Gastebois, S.; Hol, J. Temperature dependent friction modelling: The influence of temperature on product quality. Procedia Manuf. 2020, 47, 535–540. [Google Scholar] [CrossRef]
  12. Veldhuis, M.; Heingärtner, J.; Krairi, A.; Waanders, D.; Hazrati, J. An industrial-scale cold forming process highly sensitive to temperature-induced frictional start-up effects to validate a physical-based friction model. Procedia Manuf. 2020, 47, 578–585. [Google Scholar] [CrossRef]
  13. Li, L.X.; Peng, D.S.; Liu, J.A.; Liu, Z.Q. An experimental study of the lubrication behavior of graphite in hot compression tests of Ti–6Al–4V alloy. Tribol. Int. 2001, 112, 1–5. [Google Scholar] [CrossRef]
  14. Hardell, J.; Kassfeldt, E.; Prakash, B. Friction and wear behavior of high-strength boron steel at elevated temperatures of up to 800 °C. Wear 2008, 264, 788–799. [Google Scholar] [CrossRef]
  15. Du, S.; Li, Z.; He, Z.; Ding, H.; Wang, X.; Zhang, Y. Effect of temperature on the friction and wear behavior of electroless Ni–P–MoS2–CaF2 self-lubricating composite coatings. Tribol. Int. 2018, 128, 197–203. [Google Scholar] [CrossRef]
  16. Liu, Y.; Zhu, B.; Wang, K.; Li, S.; Zhang, Y. Friction behaviors of 6061 aluminum alloy sheets in hot stamping under dry and lubricated conditions based on hot strip drawing test. Tribol. Int. 2020, 151, 106504. [Google Scholar] [CrossRef]
  17. Yang, X.; Zhang, Q.; Zheng, Y.; Liu, X.; Politis, D.; El Fakir, O.; Wang, L. Investigation of the friction coefficient evolution and lubricant breakdown behavior of AA7075 aluminum alloy forming processes at elevated temperatures. Int. J. Extrem. Manuf. 2021, 3, 025002. [Google Scholar] [CrossRef]
  18. Noder, J.; George, R.; Butcher, C.; Worswick, M.J. Friction characterization and application to warm forming of a high-strength 7000-series aluminum sheet. J. Mater. Process. Technol. 2021, 293, 117066. [Google Scholar] [CrossRef]
  19. Soleymanipoor, A.; Maeno, T. Effect of Pulsating Motion Conditions on Relubrication Behavior and Dimensions of Laterally Extruded Internal Gears. J. Manuf. Mater. Process. 2025, 9, 190. [Google Scholar] [CrossRef]
  20. Wang, Z.; Dohda, K.; Haruyama, Y. Effects of entraining velocity of lubricant and sliding velocity on friction behavior in stainless steel sheet rolling. Wear 2005, 258, 203–211. [Google Scholar] [CrossRef]
  21. Trzepieciński, T.; Fejkiel, R. On the influence of deformation of deep drawing quality steel sheet on surface topography and friction. Tribol. Int. 2017, 115, 78–88. [Google Scholar] [CrossRef]
  22. Ma, G.; Wang, L.; Gao, H.; Zhang, J.; Reddyhoff, T. The friction coefficient evolution of a TiN coated contact during sliding wear. Appl. Surf. Sci. 2015, 345, 109–115. [Google Scholar] [CrossRef]
  23. Hu, Y.; Wang, L.; Politis, D.J.; Masen, M.A. Development of an interactive friction model for the prediction of lubricant breakdown behavior during sliding wear. Tribol. Int. 2017, 110, 370–377. [Google Scholar] [CrossRef]
  24. Hua, Y.; Zheng, Y.; Politis, D.J.; Masen, M.A.; Cui, J.; Wang, L. Development of an interactive friction model to predict aluminum transfer in a pin-on-disc sliding system. Tribol. Int. 2019, 130, 216–228. [Google Scholar] [CrossRef]
  25. Yang, X.; Liu, H.; Zhang, L.; Hu, Y.; Politis, D.J.; Gharbi, M.M.; Wang, L. Interactive mechanism and friction modeling of transient tribological phenomena in metal forming processes: A review. Friction 2024, 12, 375–395. [Google Scholar] [CrossRef]
  26. Kunogi, M. A new method of cold extrusion. J. Sci. Res. Inst. 1956, 50, 215–246. [Google Scholar] [CrossRef]
  27. Male, A.T.; Cockcroft, M.G. A method for the determination of the coefficient of friction of metals under conditions of bulk plastic deformation. J. Inst. Met. 1964, 93, 38–46. [Google Scholar] [CrossRef]
  28. Matsumoto, R.; Harada, S.; Utsunomiya, H. Influence of oxide scale formed on chrome steel surface in steam atmosphere on deformation behavior of chrome steel in hot ring compression. ISIJ Int. 2015, 55, 1711–1720. [Google Scholar] [CrossRef]
  29. Ohata, T.; Asai, K.; Kitamura, K.; Matsunaga, K. Ring compression test for high-strength steel at high reduction in height under dry condition. J. Mech. Eng. Sci. 2023, 10, 23–00057. [Google Scholar] [CrossRef]
  30. Hartley, R.S.; Cloete, T.J.; Nurick, G.N. An experimental assessment of friction effects in the split Hopkinson pressure bar using the ring compression test. Int. J. Impact Eng. 2007, 34, 1705–1728. [Google Scholar] [CrossRef]
  31. Shahriari, D.; Sadeghi, M.; Ebrahimi, G.; Kim, K. Effects of lubricant and temperature on friction coefficient during hot forging of Nimonic 115 superalloy. Kovove Mater. 2011, 49, 375–383. [Google Scholar] [CrossRef]
  32. Mirahmadi, S.J.; Hamedi, M.; Cheraghzadeh, M. Investigating friction factor in forging of Ti-6Al-4V through isothermal ring compression test. Tribol. Trans. 2015, 58, 778–785. [Google Scholar] [CrossRef]
  33. Hu, C.L.; Ou, H.; Zhao, Z. An alternative evaluation method for friction condition in cold forging by ring with boss compression test. J. Mater. Process. Technol. 2015, 224, 18–25. [Google Scholar] [CrossRef]
  34. Hu, C.; Yin, Q.; Zhao, Z.; Ou, H. A new measuring method for friction factor by using ring with inner boss compression test. Int. J. Mech. Eng. Mater. Sci. 2017, 123, 133–140. [Google Scholar] [CrossRef]
  35. Goetz, R.L.; Jain, V.K.; Morgan, J.T.; Wierschke, M.W. Effects of material and processing conditions upon ring calibration curves. Wear 1991, 143, 71–86. [Google Scholar] [CrossRef]
  36. Sofuoglu, H.; Rasty, J. On the measurement of friction coefficient utilizing the ring compression test. Tribol. Int. 1999, 32, 327–335. [Google Scholar] [CrossRef]
  37. Saiki, H.; Meng, Y.G.; Sakamoto, H. An experimental study of transient friction during forging processes. Trans. Jpn. Soc. Mech. Eng. 1989, 55, 2184–2191. [Google Scholar] [CrossRef]
Figure 1. Designed experimental warm ring compression apparatus with in situ measurement system: (a) overall view; (b) lower part.
Jmmp 09 00241 g001
Figure 2. (a) Compression core with its 3D view surface topography. (b) Dimensions of the ring used for the warm ring compression test.
Jmmp 09 00241 g002
Figure 3. Sequence of the warm ring compression test: (a) heating in furnace; (b) measuring 10 µL lubricant and rubbing it on the upper and lower cores; (c) performing the ring compression test.
Jmmp 09 00241 g003
Figure 4. (a) Temperature variation at the tooth tip and groove during cold forging of bevel gear, with friction coefficients of µ = 0.1 and 0.2, from the start of the process to the bottom dead center of the stroke. (b) Corresponding temperature distribution at the bottom dead center obtained via FEM analysis.
Jmmp 09 00241 g004
Figure 5. Flow stress–strain curve of annealed SCM425: (a) obtained from compression tests; (b) used in the FEM simulation of the warm ring compression test to obtain the calibration curves.
Jmmp 09 00241 g005
Figure 6. Measurement of ring height reduction with contact displacement sensor and adjustment for influence of elastic deformation on the estimated values.
Jmmp 09 00241 g006
Figure 7. Method of extracting the expansion stroke from the compressing ring using edge laser sensors to extract the ring’s outer diameter expansion.
Jmmp 09 00241 g007
Figure 8. Method to obtain the ring’s outer diameter expansion velocity via a fitted curve using push plate movement–time data tracked during the compression test.
Jmmp 09 00241 g008
Figure 9. Shapes of the compressed rings under warm conditions with a reduction in height of r = 50–55% with (a) compression speed of v = 1.2 mm/s and (b) compression speed of v = 7 mm/s.
Jmmp 09 00241 g009
Figure 10. Relationship between outer diameter expansion and reduction in height ratio for estimating the friction coefficient using an in situ measurement system: (a) compression speed of v = 1.2 mm/s; (b) compression speed of v = 7 mm/s, where the solid lines represent calibration curves with constant friction coefficients obtained via FEM simulation, and the dotted line represents experimental results.
Jmmp 09 00241 g010
Figure 11. Friction coefficient obtained from outer diameter expansion nomographs over a range of increased temperatures in cold forging: (a) compression speed of v = 1.2 mm/s; (b) compression speed of v = 7 mm/s.
Jmmp 09 00241 g011
Figure 12. Nomographs for evaluating the transient friction coefficient based on the expansion velocity of the outer diameter during the warm ring compression test: (a) compression speed of v = 1.2 mm/s; (b) compression speed of v = 7 mm/s.
Jmmp 09 00241 g012
Figure 13. Evaluated transient friction coefficient obtained by the expansion velocity of the compressed ring: (a) compression speed of v = 1.2 mm/s; (b) compression speed of v = 7 mm/s.
Jmmp 09 00241 g013
Figure 14. Transient friction coefficient and constant friction coefficient used for ring compression with a reduction in height of r = 40–43% and a compression speed of v = 7 mm/s: (a) compression temperature of T = 100 °C; (b) compression temperature of T = 150 °C.
Jmmp 09 00241 g014
Figure 15. Cross-section shape comparison of compressed ring between experiment and FEM, with a reduction in height of r = 40–43% and a compression speed of v = 7 mm/s: (a) T = 100 °C; (b) T = 150 °C.
Jmmp 09 00241 g015
Table 1. Chemical composition of quenchable steel tube (wt%).
CSiMnPSNiCrMo
0.23–0.280.15–0.350.60–0.900.030 or less0.030 or less 0.25 or less0.90–1.200.15–0.30
Table 2. Process parameters in the warm ring compression test with an in situ measurement system.
ParameterTemperature [°C]Compression Speed [mm/s]Ring Size [mm]Reduction in Height [%]Lubricant
Value50, 100, 1501.2, 7Outer diameter: Inner diameter: Height = 24:12:850–5510 µL
chlorine-based lubricant
Disclaimer/Publisher’s Note: The statements, opinions and data contained in all publications are solely those of the individual author(s) and contributor(s) and not of MDPI and/or the editor(s). MDPI and/or the editor(s) disclaim responsibility for any injury to people or property resulting from any ideas, methods, instructions or products referred to in the content.

