Article

Study of Corrosion Resistance of Hybrid Structure of DP980 Two-Phase Steel and Laser-Welded 6013-T4 Aluminum Alloy

by
Antonio Faria Neto
1,*,
Erica Ximenes Dias
1,
Francisco Henrique Cappi Freitas
2,
Cristina Sayuri Fukugauchi
3,
Erick Siqueira Guidi
1,
Marcelo Sampaio Martins
1,
Antonio Jorge Abdalla
2 and
Marcelo dos Santos Pereira
2
1
Department of Mechanical Engineering, School of Engineering and Sciences, São Paulo State University (UNESP), Guaratinguetá 12500-000, Brazil
2
Department of Materials and Technology, School of Engineering and Sciences, São Paulo State University (UNESP), Guaratinguetá 12500-000, Brazil
3
Federal Institute of São Paulo (IFSP), São José dos Campos 12200-000, Brazil
*
Author to whom correspondence should be addressed.
J. Manuf. Mater. Process. 2025, 9(7), 237; https://doi.org/10.3390/jmmp9070237
Submission received: 15 May 2025 / Revised: 4 July 2025 / Accepted: 5 July 2025 / Published: 9 July 2025

Abstract

The future of the automotive industry appears to hinge on the integration of dissimilar materials, such as aluminum alloys and carbon steel. However, this combination can lead to galvanic corrosion, compromising the structural integrity. In this study, laser-welded joints of 6013-T4 aluminum alloy and DP980 steel were evaluated for their morphology, microhardness, and corrosion resistance. Corrosion resistance was assessed using the electrochemical noise technique over time in 0.1 M Na2SO4 and 3.5% NaCl solutions. The wavelet function was applied to remove the DC trend, and energy diagrams were generated to identify the type of corrosive process occurring on the electrodes. Corrosion on the electrodes was also monitored using photomicrographic images. Analysis revealed an aluminum–steel mixture in the melting zone, along with the presence of AlFe, AlFe3, and AlI3Fe4 intermetallic compounds. The highest Vickers microhardness was observed in the heat-affected zone, adjacent to the melt zone, where a martensitic microstructure was identified. The 6013-T4 aluminum alloy demonstrated the highest corrosion resistance in both media. Conversely, the electrochemical noise resistance was similar for the DP980 steel and the weld bead, indicating that the laser welding process does not significantly impact this property. The energy diagrams showed that localized pitting corrosion was the predominant form of corrosion. However, generalized and mixed corrosion were also observed, which corroborated the macroscopic analysis of the electrodes.

1. Introduction

The constant technological development in vehicle manufacturing, particularly in the evolution of materials, reached a milestone in the 1970s. This period, influenced by the oil crisis and economic globalization, pressured steelmakers to innovate, as noted by [1,2,3]. Consequently, the automotive industry adopted strategies like reducing vehicle size, replacing traditional materials with aluminum and plastic, and substituting common carbon steels with higher-strength steels. These changes aimed to enhance structural integrity and shock resistance while lowering the final product cost [3,4,5,6].
In response to these challenges, Advanced High-Strength Steels (AHSS) emerged from the 1990s onward. These are categorized into 1st, 2nd, and 3rd generations based on their mechanical properties [7,8,9,10,11]. Third-generation advanced steels bridge the gap between their first and second generation counterparts. The necessity for these new materials arose because, despite their excellent properties, 2nd generation steels were expensive and difficult to mass-produce, making them impractical for automotive production. Among the AHSS, dual-phase (DP) steel, proposed in the late 1970s, features a microstructure of a ferritic matrix with dispersed martensitic phases, resembling islands. DP steel offers strengths ranging from 500 to 1200 MPa. Its ferritic matrix provides ductility, combining high strength with good deformation capacity, making it ideal for components requiring stamping [3,12,13,14,15,16,17,18]. Simultaneously, the demand for aluminum automotive sheets is set to grow unprecedentedly in the development of strong and lightweight bodies. Generally, aluminum and other lightweight materials will likely dominate heavy vehicles like pick-ups and SUVs, mainly the 6xxx series alloys, which are already used as structural materials in vehicles due to their mechanical properties, while AHSS will probably maintain its strong position in light and small vehicles [19,20].
Contemporary studies aim to unite advanced steels and aluminum alloys to leverage the best properties of each material in designing safe, strong, and lightweight automobile bodies. One joining method is Tailor Welded Blanks, which involves joining sheets of different thicknesses [21]. This process offers several advantages, including weight reduction, fewer parts, simplified assembly, and significant cost savings [22]. Although numerous studies focus on applying various welding technologies to join these alloys, the challenge of strength loss in weld areas, due to the formation of brittle intermetallic compounds, remains largely unresolved. Given these challenges facing the automotive industry, the immense potential of aluminum alloys and advanced 3rd generation high-strength steels like DP steel, combined with a new design concept where components are produced by joining dissimilar materials, makes hybrid aluminum/steel structures a promising path. This approach can achieve weight reduction and reduce pollutant emissions by combining the most advanced materials the automotive industry has to offer.
Welding dissimilar alloys, such as DP steel and Aluminum 6013, creates a complex corrosion system. Firstly, welding introduces microstructural heterogeneities [23]. Secondly, the distinct microstructures of aluminum and steel, both separately and in contact, as illustrated in Figure 1, form a complex galvanic system. This can accelerate the corrosion process and requires more in-depth study to advance manufacturing processes and designs aimed at reducing automobile weight in the modern automotive industry. In this context, this work aims to laser weld a DP980 steel sheet to a 6013-T4 aluminum sheet to evaluate their morphology, microhardness, and corrosion resistance, in addition to identifying intermetallics in the joint.

2. Materials and Methods

2.1. Material

This study utilized two alloys: dual-phase steel 980 (DP980) and a 6013-T4 aluminum alloy, both with a thickness of 1.2 mm. The DP980 steel was supplied in the form of cold-rolled sheets. These materials were selected for their advantageous properties and technological applications, particularly within the automotive and aeronautical/aerospace industries. Their nominal chemical composition is presented in Table 1 and the values were obtained through X-ray fluorescence spectroscopy (XRF) analysis, alongside the standard values. It can be observed that the measured values align well with the standardized values. Notably, the DP980 steel used in this study does not feature a zinc layer, which is commonly applied to rolled products for corrosion protection, and their mechanical properties are detailed in Table 2.

2.2. Methodology

2.2.1. X-Ray Fluorescence Spectroscopy—FRX

The chemical composition of the materials—DP980 steel and an AA6013-T4 aluminum alloy—was determined using X-ray fluorescence spectroscopy (XRF). An Axios MAX (PANanalytical) tool was employed for semi-quantitative measurements without standards, allowing for the identification of chemical elements from fluorine to uranium. Samples were prepared by embedding them in boric acid.

2.2.2. Choosing Welding Parameters

Figure 2 presents a flowchart outlining the experimental steps. As shown, the welding parameters were established through macroscopic and microhardness analyses. The specific parameters tested are detailed in Table 3.
Sample welding was conducted at the Multiuser Laboratory for Development and Applications of Lasers and Optics (DedALO), situated at the Institute of Advanced Studies (IEAv–DCTA). The steel plates were joined to the aluminum plates in an overlapping configuration, as depicted in Figure 3a. The welding direction was established parallel to the rolling direction of both the steel and aluminum plates. Given aluminum’s reflective characteristics, the welding process was executed with the steel plate positioned above the aluminum plate, ensuring direct reception of the laser beam. Figure 3b presents a detailed view of the laser’s focal point. The equipment employed was an IPG-YLR-2000 laser, which operates at a wavelength of 1070 nm and a maximum power of 2000 W. Furthermore, argon gas was applied to safeguard the weld pool, at a flow rate of 10 L/min.
The monitoring setup used suction cups on both sides to pull and fit the two plates together, side-by-side, preparing them for the welding process. After this, the plates passed through two rollers that flattened them, ensuring perfect alignment, even when using plates of different thicknesses. Two cameras, one positioned above and one below, synchronously monitored the plates’ movement to prevent any positioning issues during welding. Finally, the joined plates were laser-welded with the entire monitoring system in place.
For this exploratory study, five welding conditions were tested. These conditions were chosen based on the equipment operator’s experience and the results of previous work involving aluminum alloys and materials similar to DP980 steel [26]. Before welding, the steel plates were sanded with 220-mesh sandpaper, then washed with detergent, and finally cleaned with acetone to remove any grease. The tested conditions are detailed in Table 3.
After the welding process, samples were extracted from the welded plates for subsequent analysis. This was performed using a wire EDM (Electrical Discharge Machining) process with an Agie Charmilles FW 2U tool, located in the Machining Study Laboratory of FEG-UNESP. Samples were extracted in the transverse, superficial, and longitudinal directions relative to the weld bead. The wire EDM process is crucial for preparing metallographic or mechanical samples because it prevents vibrations during sectioning. Such vibrations, common in conventional cutting methods, could lead to sample fracture due to potential embrittlement of the weld by the formation of FeXAlY intermetallics.
Following sectioning, the samples underwent standardized metallographic preparation procedures, adhering to ASTM E 3-11 (2017) [27]. The samples were hot-embedded in phenolic resin (Bakelite). Afterward, they were wet-sanded using a STRUERS manual sander for metallography, located at DMT/FEG/UNESP, with sandpaper in the following grit sequence: #220, 320, 400, 600, 1000, 1200, 1500, and 2000 mesh. Polishing was performed manually using the POLITRIZ AP10 PANAMBRA tool, an OP-NAP polishing cloth from STRUERS, and a non-crystallizing colloidal silica suspension (0.05 μm) for ferrous materials, manufactured by ALLIED. After sanding and polishing, the samples were subjected to an ultrasonic bath in alcohol for 10 min and then etched with a 2% Nital reagent.
Upon completion of preparation, images of the weld’s cross-section were captured at the Microscopy Laboratory of DMT/FEG/UNESP to check for defects and weld penetration. Images were obtained using an Epiphot 200 optical microscope (Nikon, Tokyo, Japan) and a Stemi 2000 binocular stereoscope (Carl Zeiss–Zeiss, São Paulo, Brazil). Both setups utilized SKT-ML500C-135A (Industrial Digital Camera) cameras with 5 MP resolution. The software used for image capture was ImageJ (1.53v.).

2.2.3. Vickers Hardness by Microindentation

For microhardness analysis, samples were tested following the ASTM E384-2017 Standard [22]. A WOLPERT Microhardness Tester equipped with a Vickers diamond indenter (a square-based pyramid with a 136° angle between planes) was used. This equipment is located at the DMT/FEG/UNESP Machining Studies Laboratory. A load of 1.96 N (200 g) was applied for an indentation time of 15 s [28].
A straight-line scan was performed across three distinct regions of the welded sample, all in the upper steel section: one near the surface, one in the center, and another close to the steel/aluminum interface. The center of the weld was defined as point 0, with 20 measurements taken to the right and 20 to the left, resulting in 41 points per line (−20 to +20). In total, 123 points were evaluated for each sample.

2.2.4. Corrosion Measurements

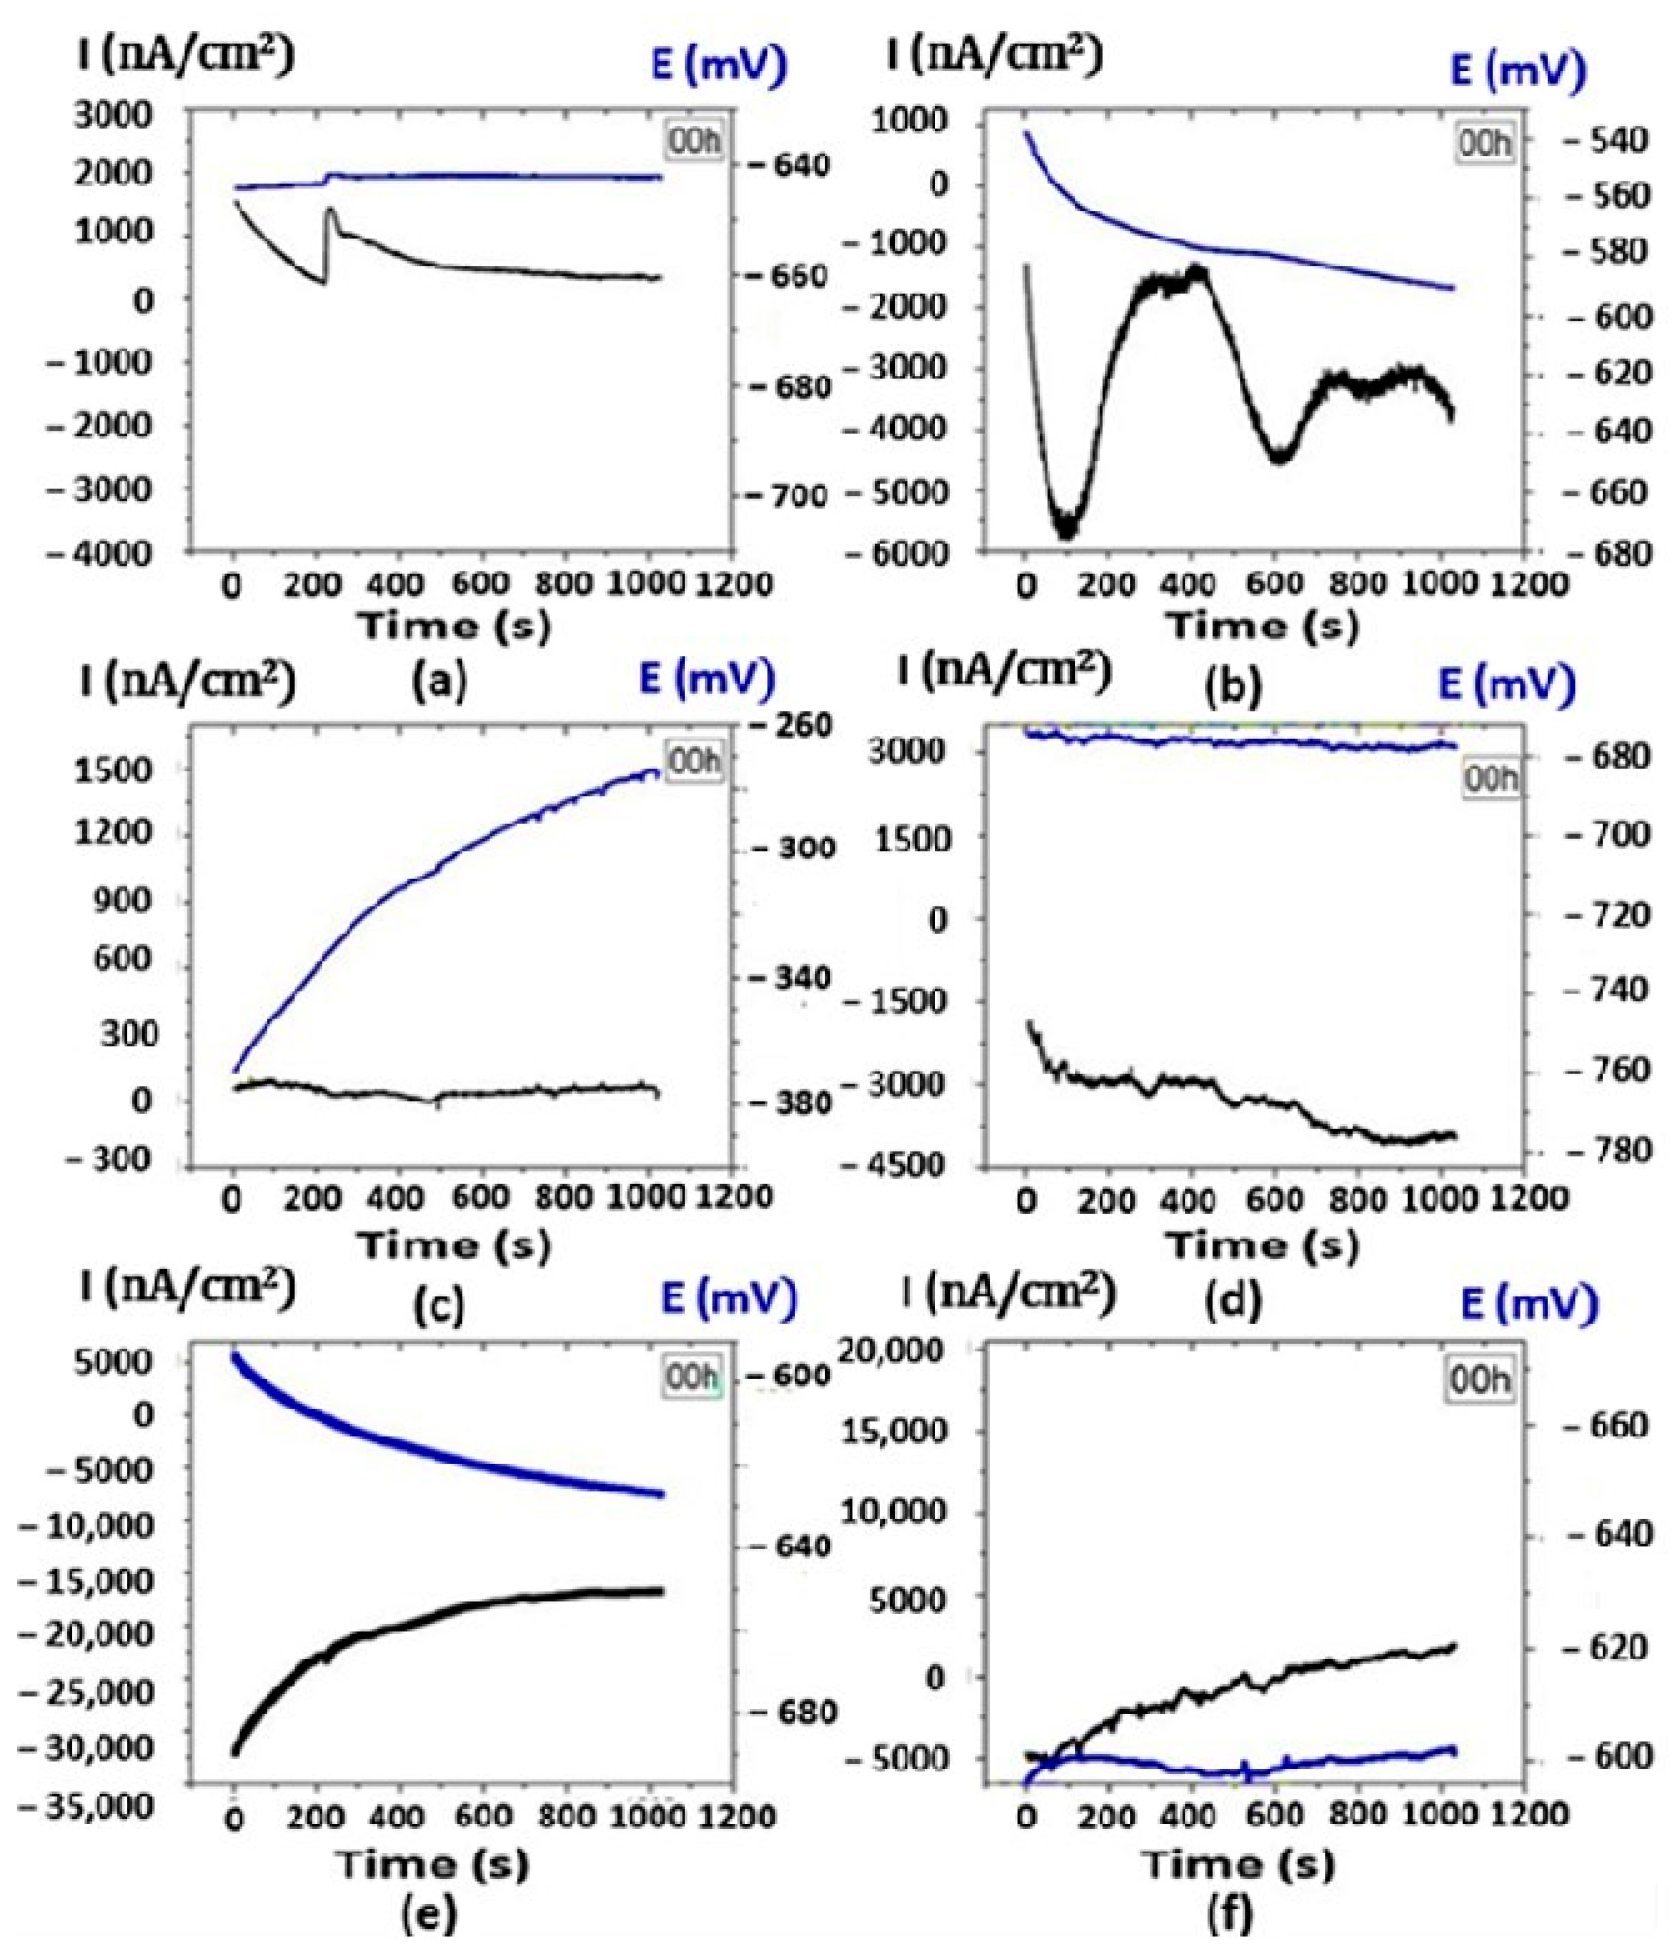
Electrochemical Noise Measurements and Analysis
Electrochemical noise measurements were conducted using a unique electrochemical cell configuration that included two working electrodes and one reference electrode (Ag|AgCl, KCl (sat)), as schematically represented in Figure 4. All measurements were performed at room temperature in the Chemistry Laboratory DFQ/FEG/UNESP, using a 250 mL solution volume for each experiment.
Six experiments were performed using different electrode types: DP980 steel electrodes (each with an area of 1.0 cm2), 6013-T4 aluminum alloy electrodes (each with an area of 1.0 cm2), and weld bead electrodes (each with an approximate area of 1.6 cm2). These experiments were conducted first in a 0.1 M Na2SO4 solution, followed by a 3.5% NaCl (0.6 M) solution. Figure 4b illustrates the electrodes used in this study. For all electrodes, a brass wire, approximately 2.0 mm in diameter, was welded on to serve as the electrical contact for electrochemical measurements. This wire was secured to the electrodes using mechanical anchoring and tin solder to ensure proper contact. To isolate the brass wire contact and expose only the surface to the electrolyte, the electrodes were embedded in polymeric resin. For electrodes containing the welding bead, silicone glue was used to isolate the analysis surface. Table 4 lists the parameters used for the electrochemical noise test.
The simultaneous acquisition of current and potential noise data was performed using an Autolab PGSTAT302N potentiostat via Nova (1.8 v.) software, with measurements taken every 0.5 s. The electrode surfaces were also analyzed after each electrochemical noise measurement using an optical microscope (Stemi 2000 binocular stereo microscope (Carl Zeiss) with an SKT-ML500C-135A Industrial Digital Camera, 5MP). For each recording, a rate of two points per second was used, totaling 2048 points over an interval of 1024 s. Measurements for each set of samples (two steel, aluminum, or welding electrodes) were performed at varying immersion times, as detailed in Table 4.
Analysis of Electrochemical Noise Results
Analysis of electrochemical noise results in the time domain provides a statistical interpretation of the noise by evaluating current and potential fluctuations. From these fluctuations, noise resistance (Rn) is calculated to assess corrosion in different media and on different materials. However, before interpretation, it is essential to remove the DC trend from each experimental record. For this purpose, the wavelet function was chosen, specifically the Dabechies–db4 orthogonal function, applied in eight levels of decomposition using MATLAB software.
The electrochemical noise technique also allows for the evaluation of responses in the frequency domain. By analyzing the energy spectrum of the signals, again with the aid of the Dabechies–db4 wavelet function, the corrosion process can be characterized.
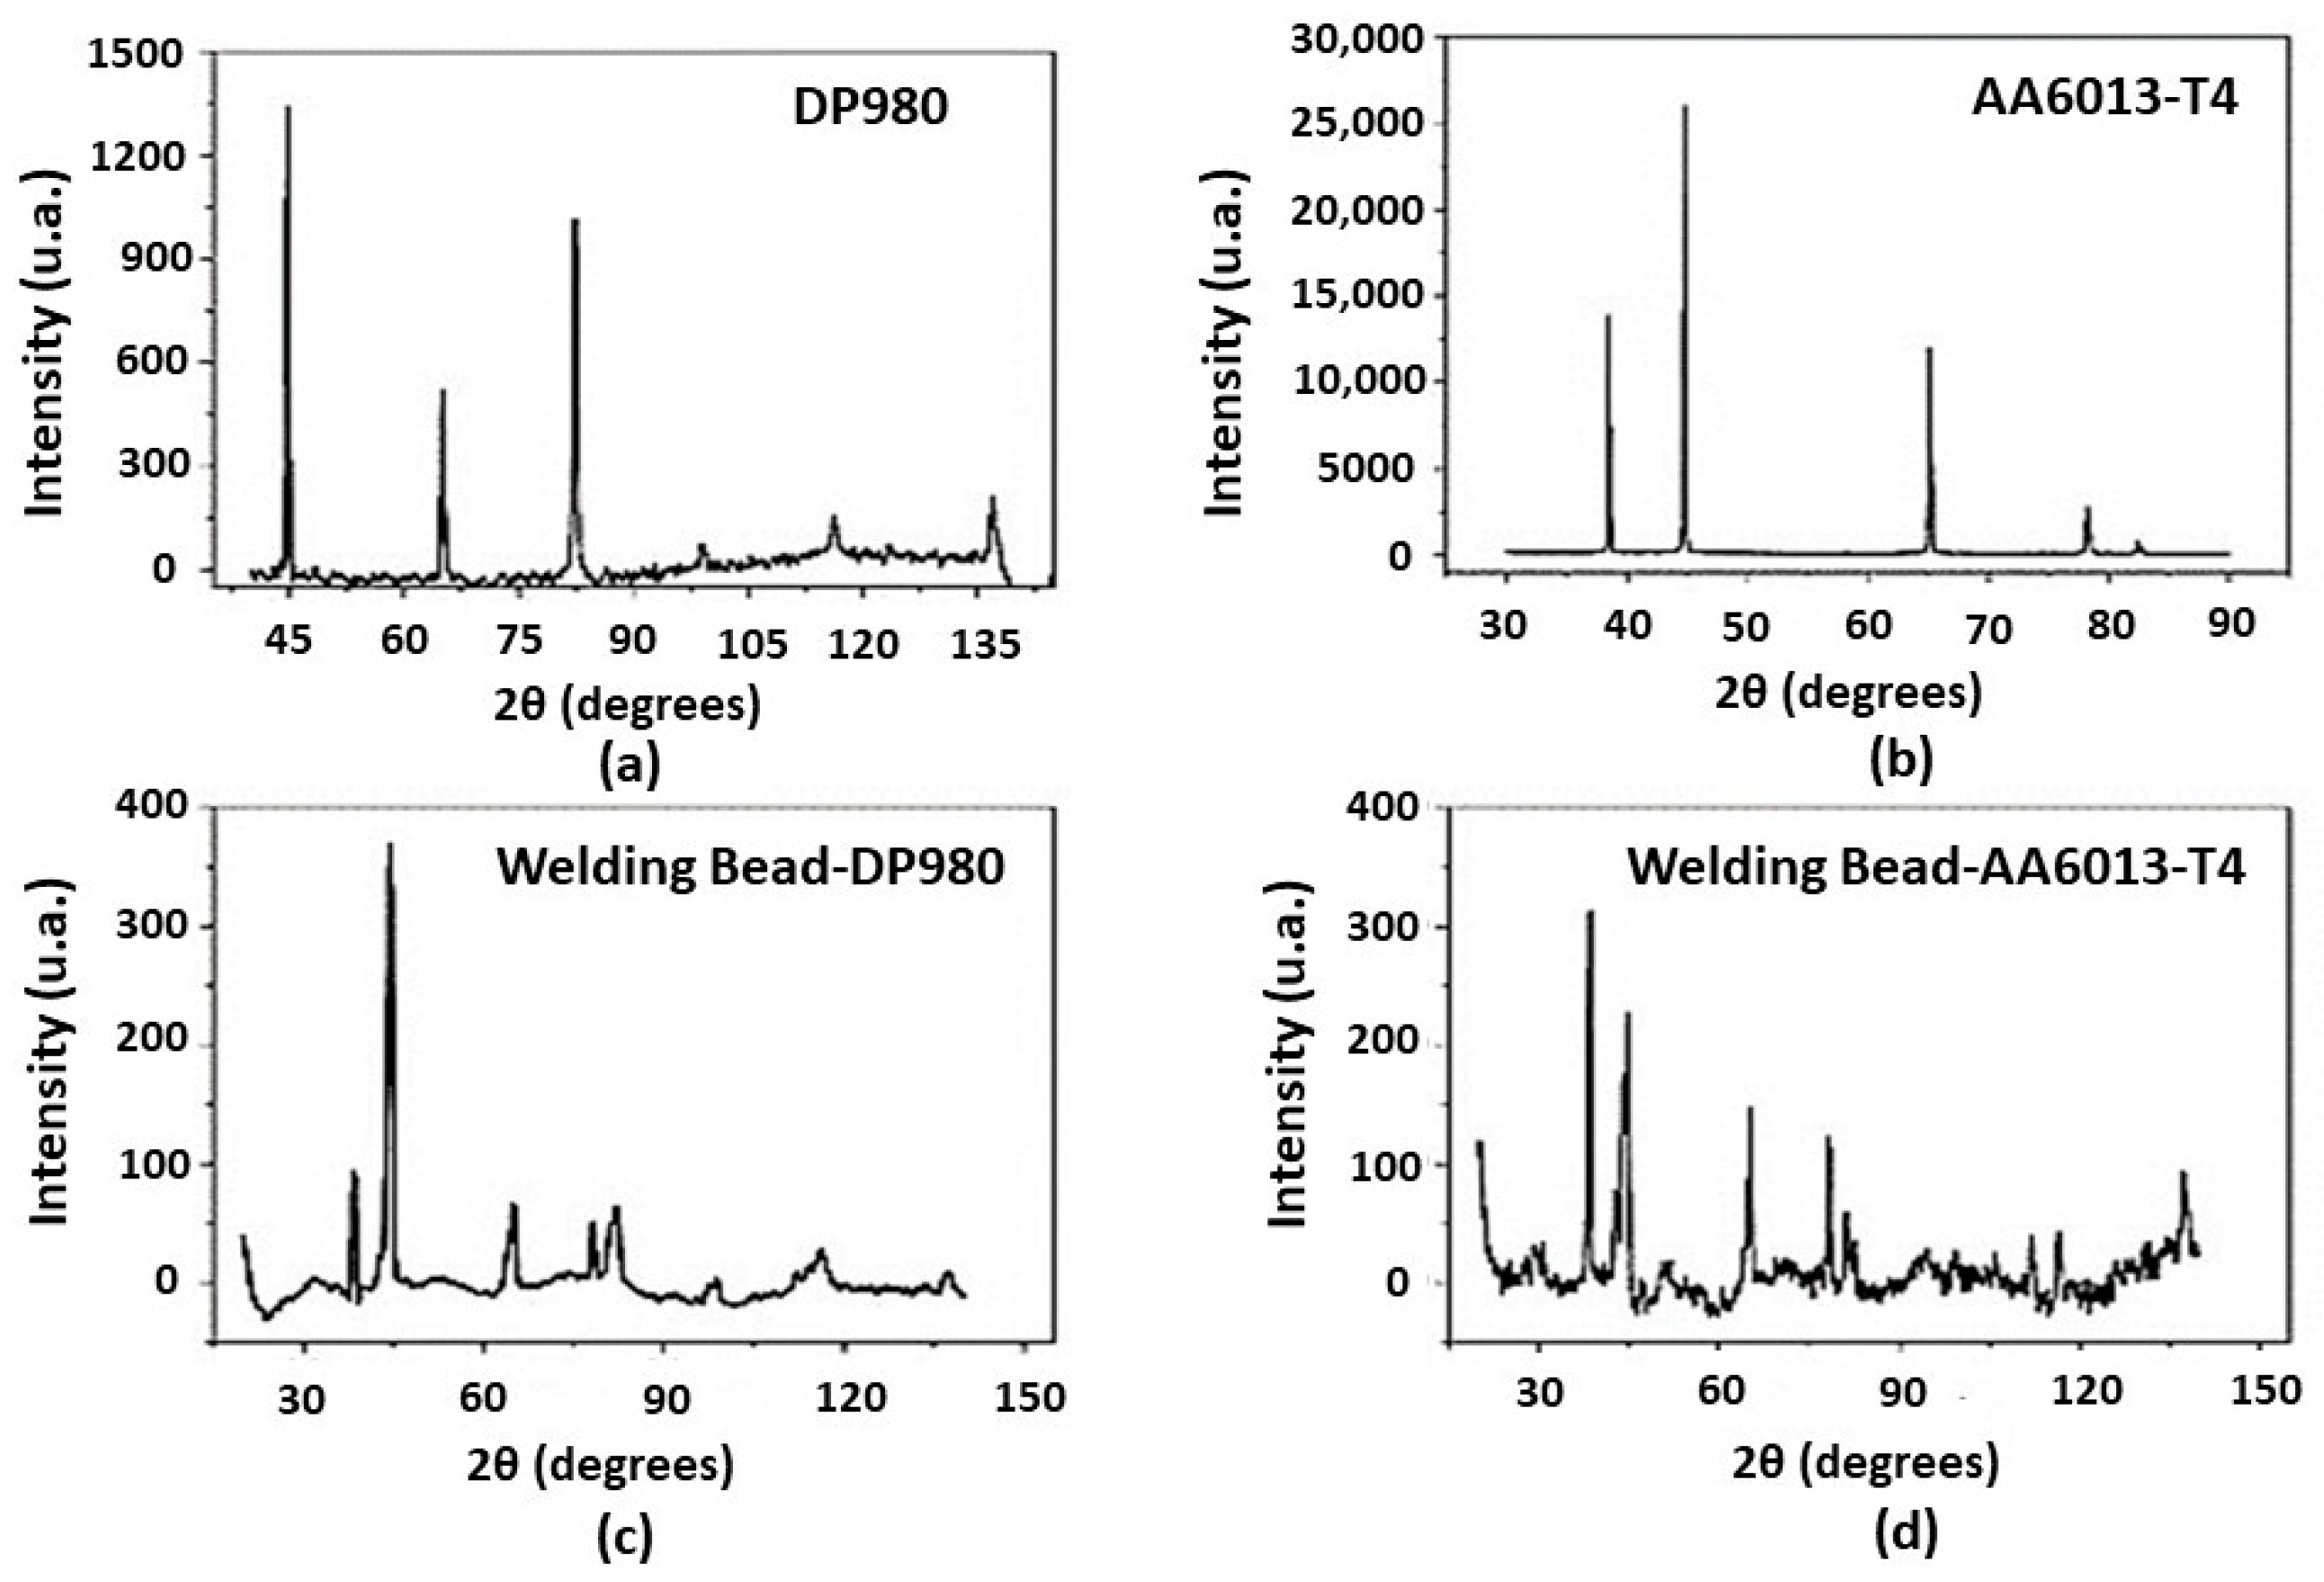
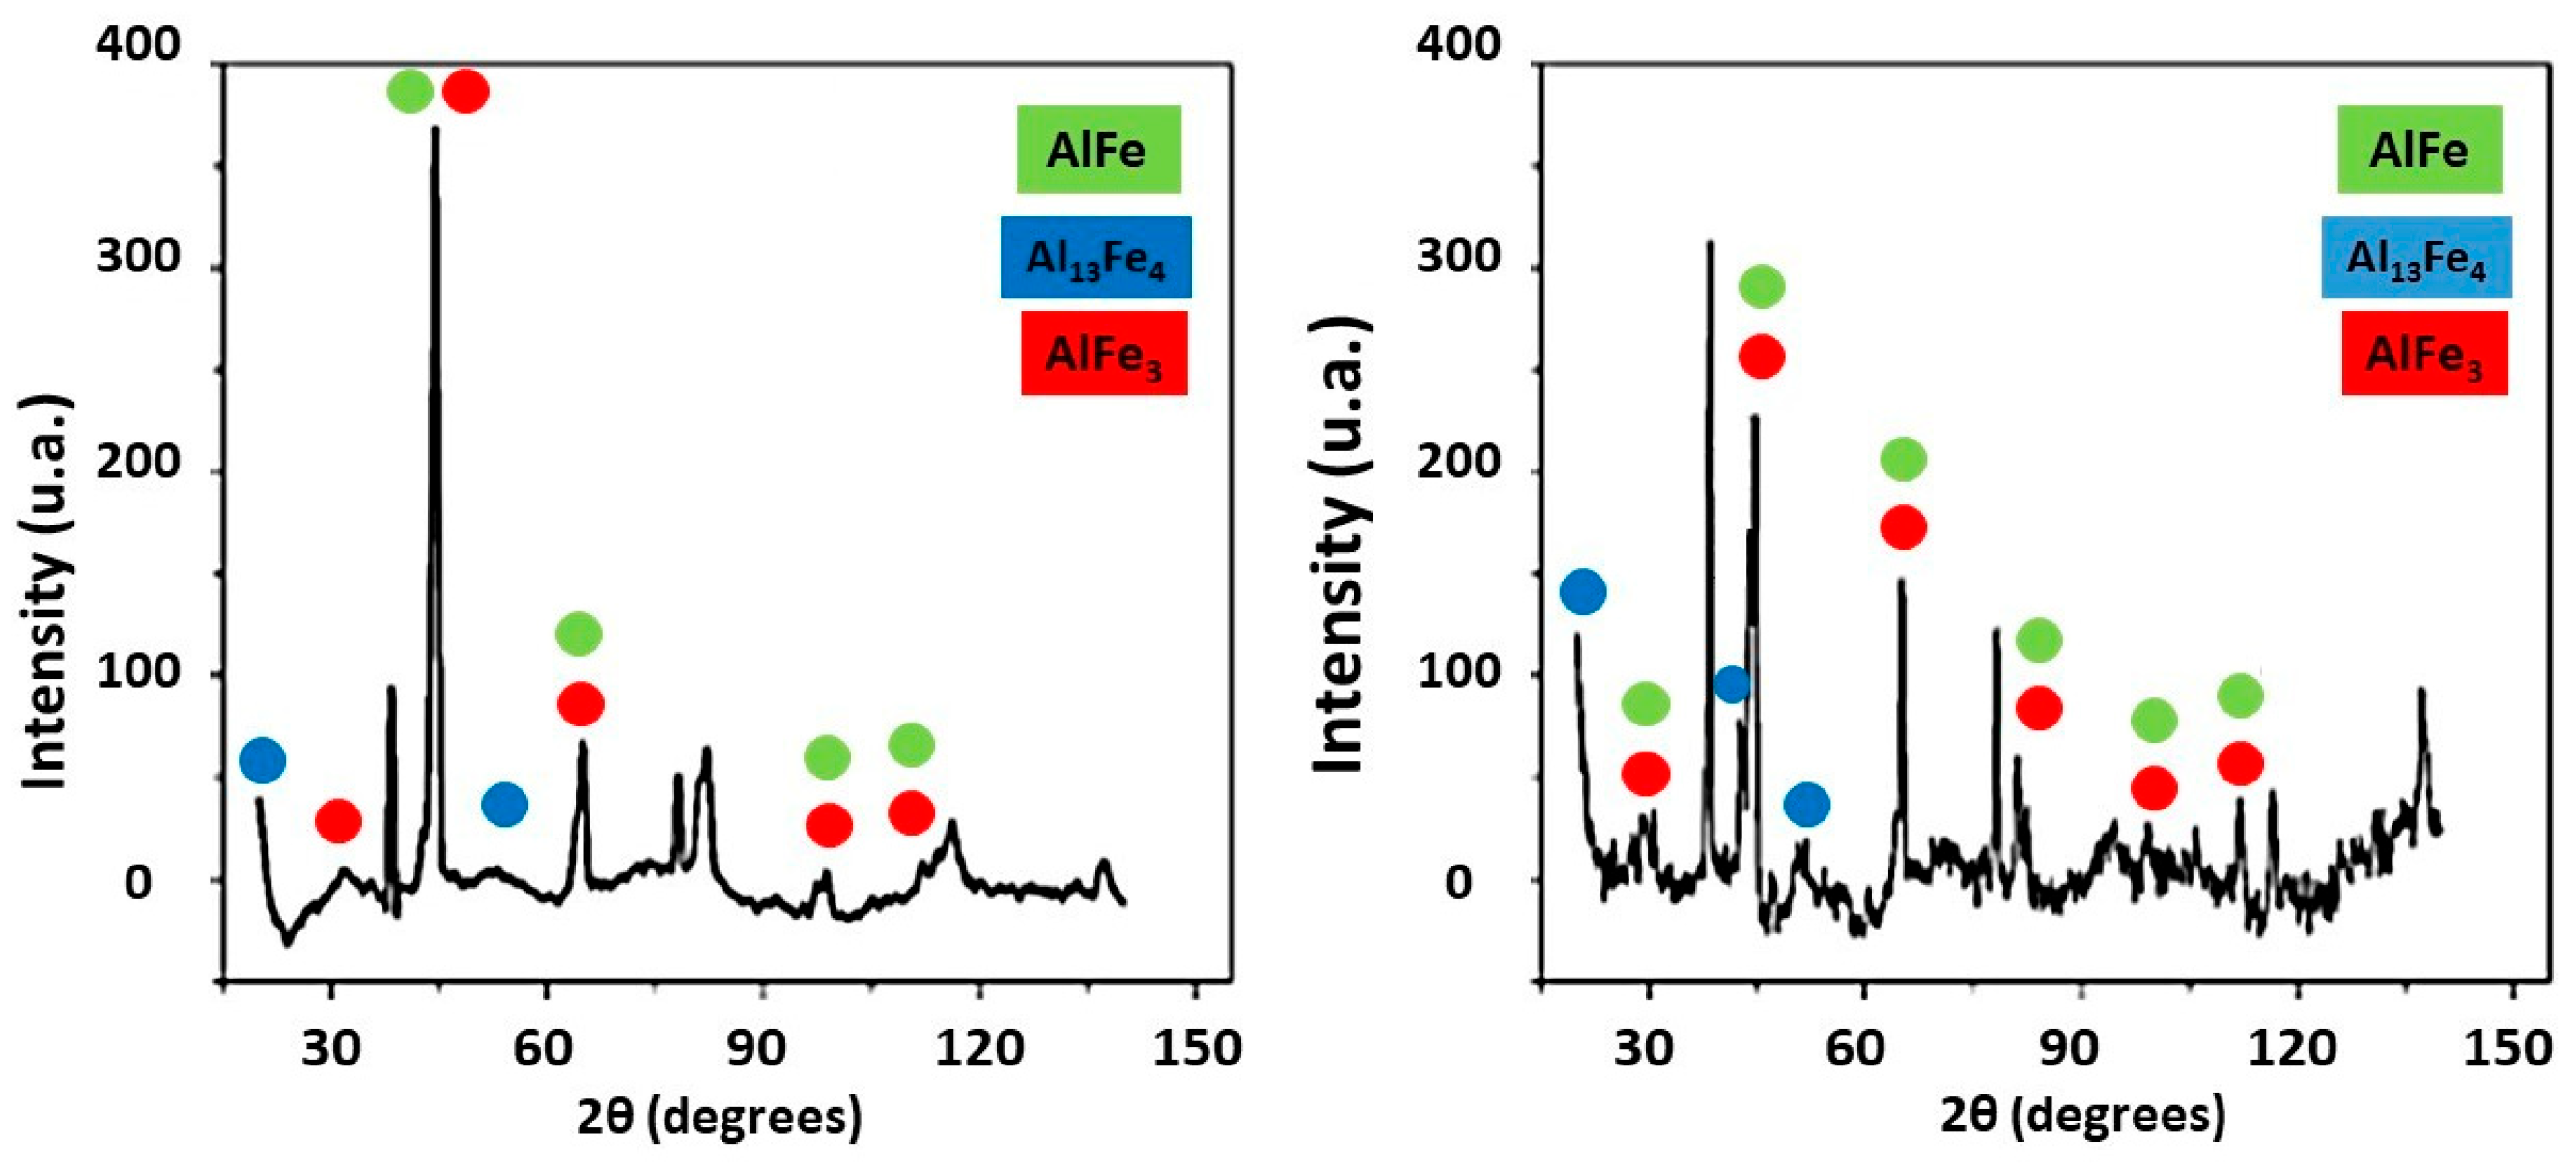
Characterization by Ray Diffraction X–DRX
The X-ray diffractometry (XRD) technique was used to observe the formation of intermetallics in the weld bead. Measurements were performed on four samples: DP980 steel, 6013-T4 aluminum, the weld bead located on the DP980 steel sheet, and the weld bead located on the 6013-T4 aluminum sheet. The steel and aluminum joints were separated to access a larger area of the weld. A Bruker X-ray diffractometer, model D8 Advance, was used, employing CuK$\alpha$ radiation with a current of 25 mA and voltage of 40 kV. The 2θ measurement range was from 20° to 140°, with a step of 0.02°, a counting time of 0.35 s for each 2θ, and a slit width of 0.6 mm.
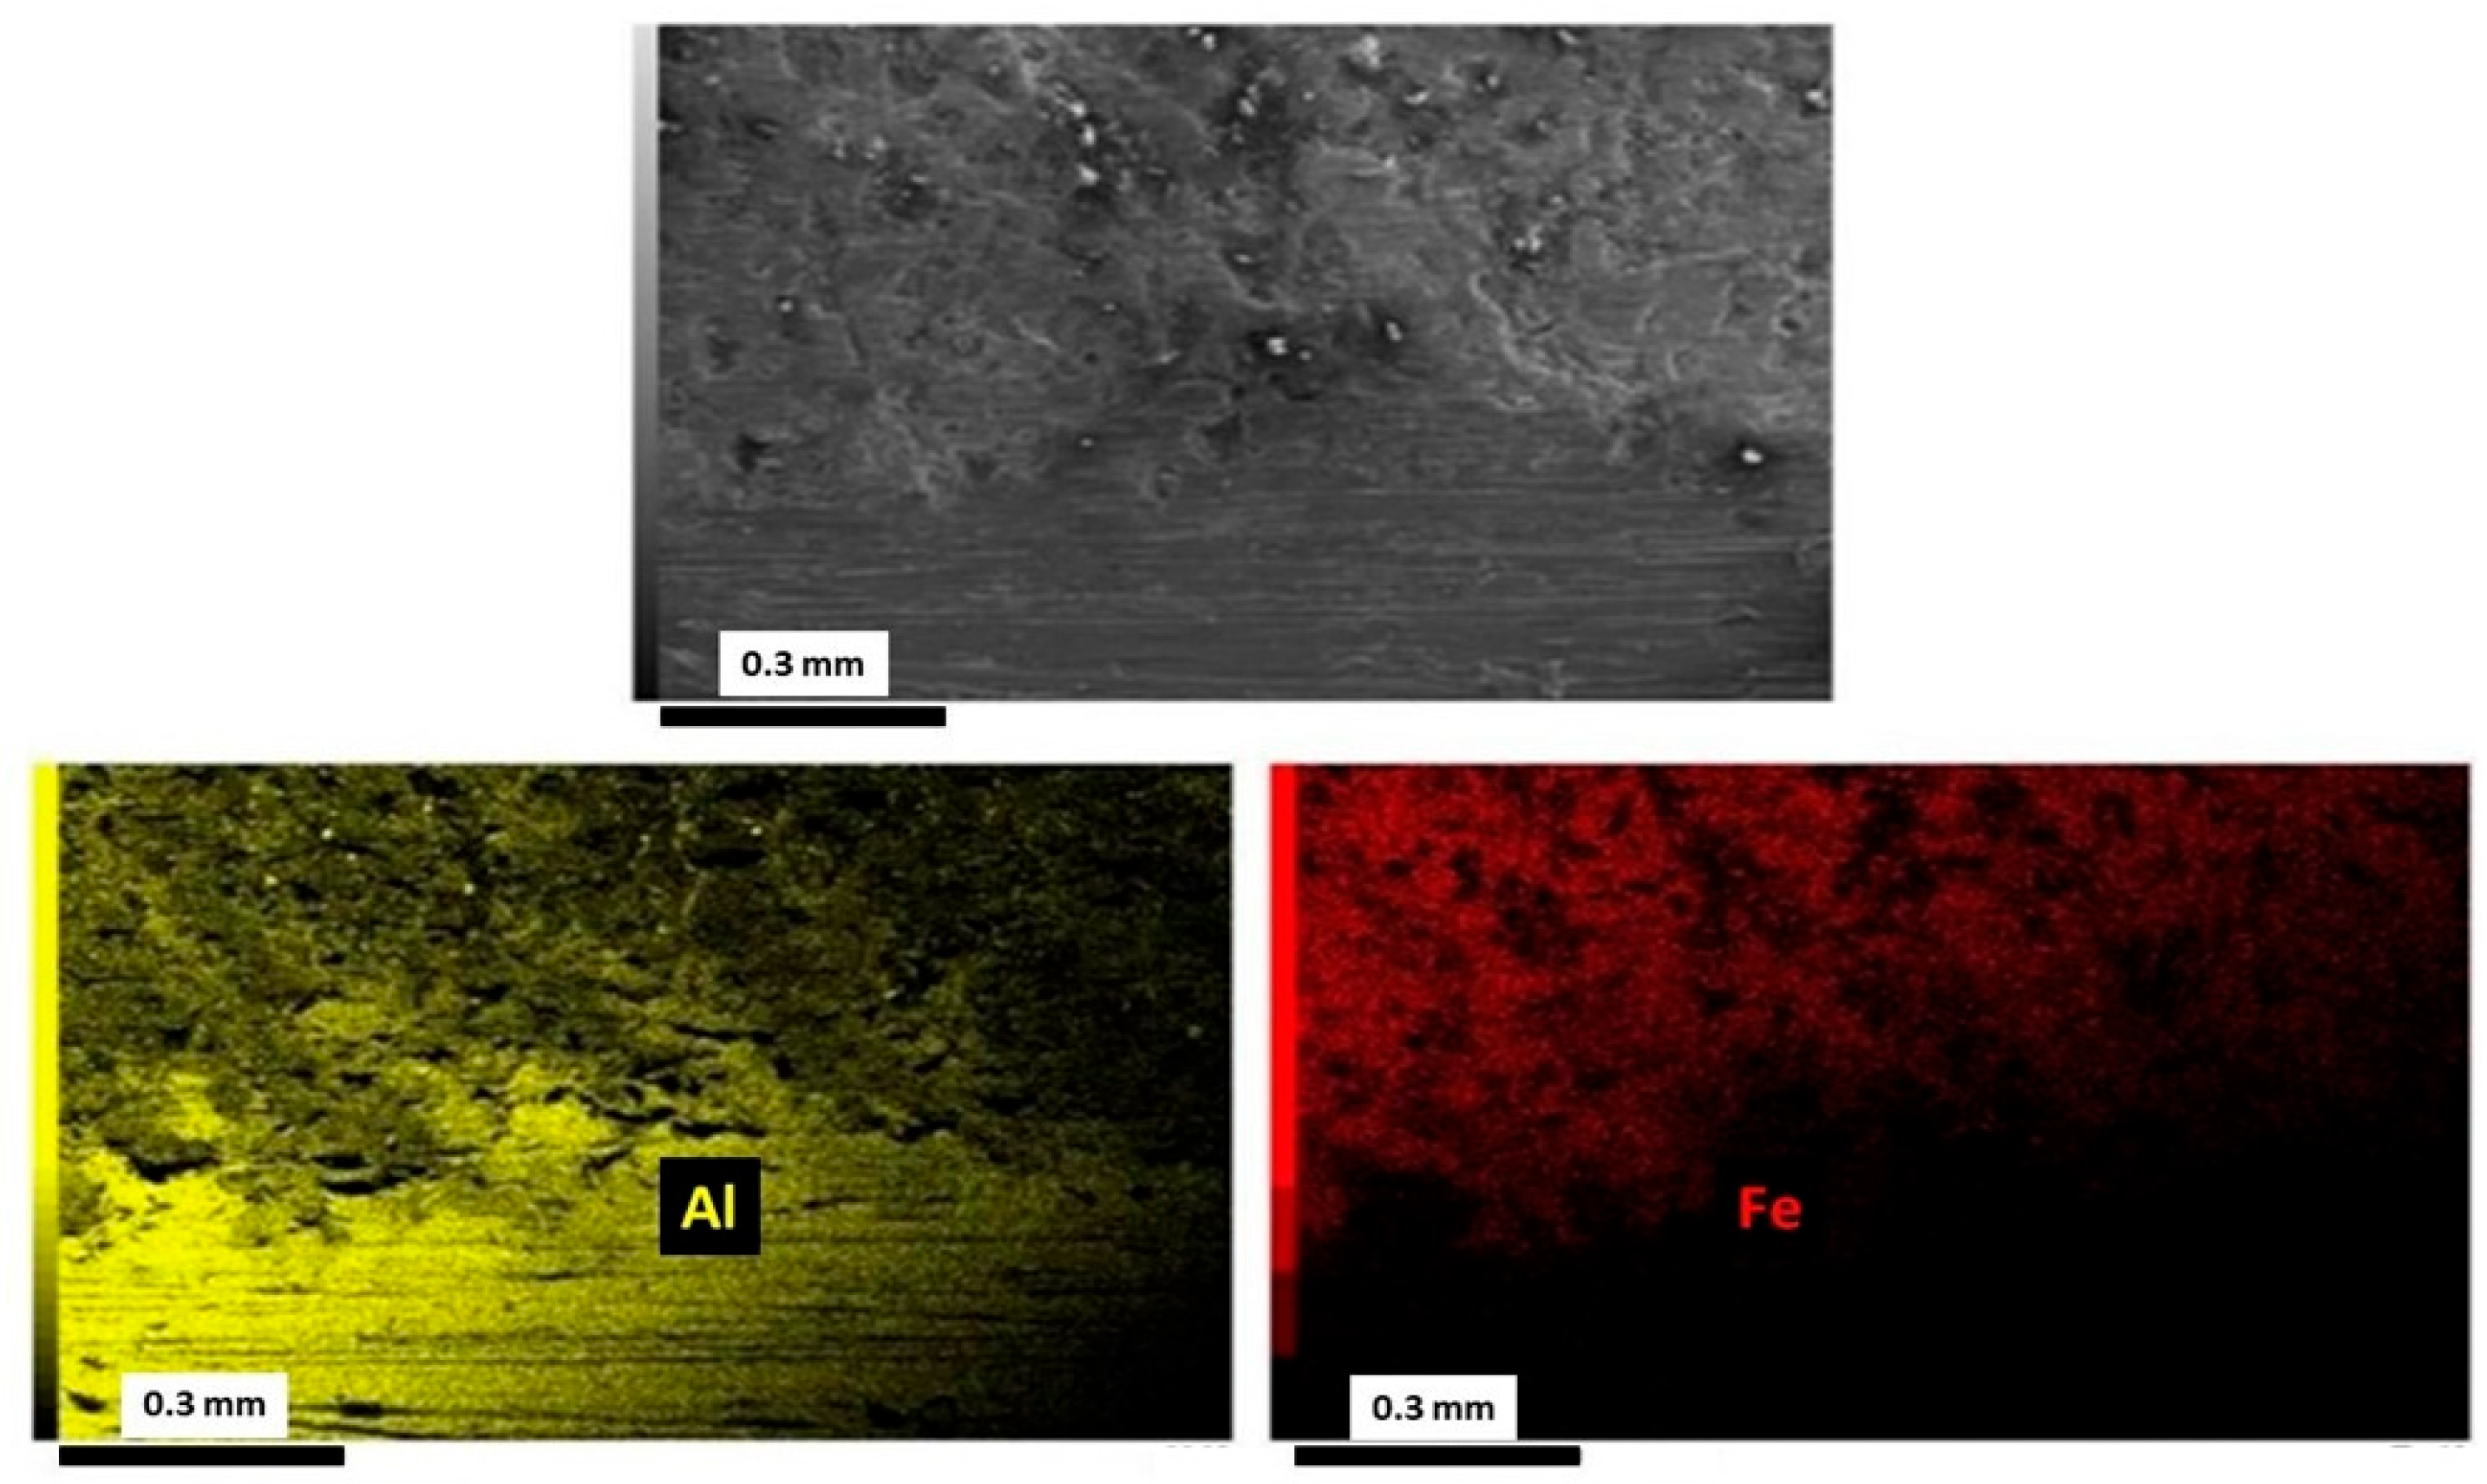
Characterization by Energy Dispersive Spectroscopy
To analyze the elements in the weld bead region, the Energy Dispersive Spectroscopy (EDS) technique was utilized with the aid of a JEOL JSM-6010 scanning electron microscope. This analysis was conducted at the Multiuser Materials Characterization Laboratory (LMCMat) at UNESP–Sorocaba.
Conductivity and pH Analysis for Corrosion Measurements
To monitor the conductivity and pH values of the solutions used in the corrosion measurements, a Satra PHS-3E benchtop pH meter with automatic calibration was employed. Measurements were also taken with a MERCK pH indicator strip for comparison with the digital readings. For conductivity measurements, a Mettler Toledo FiveEasy Plus portable conductivity meter was used. These measurements were performed at the Chemistry Laboratory of the Federal Institute of São Paulo–São José dos Campos Campus.

3. Results and Discussion

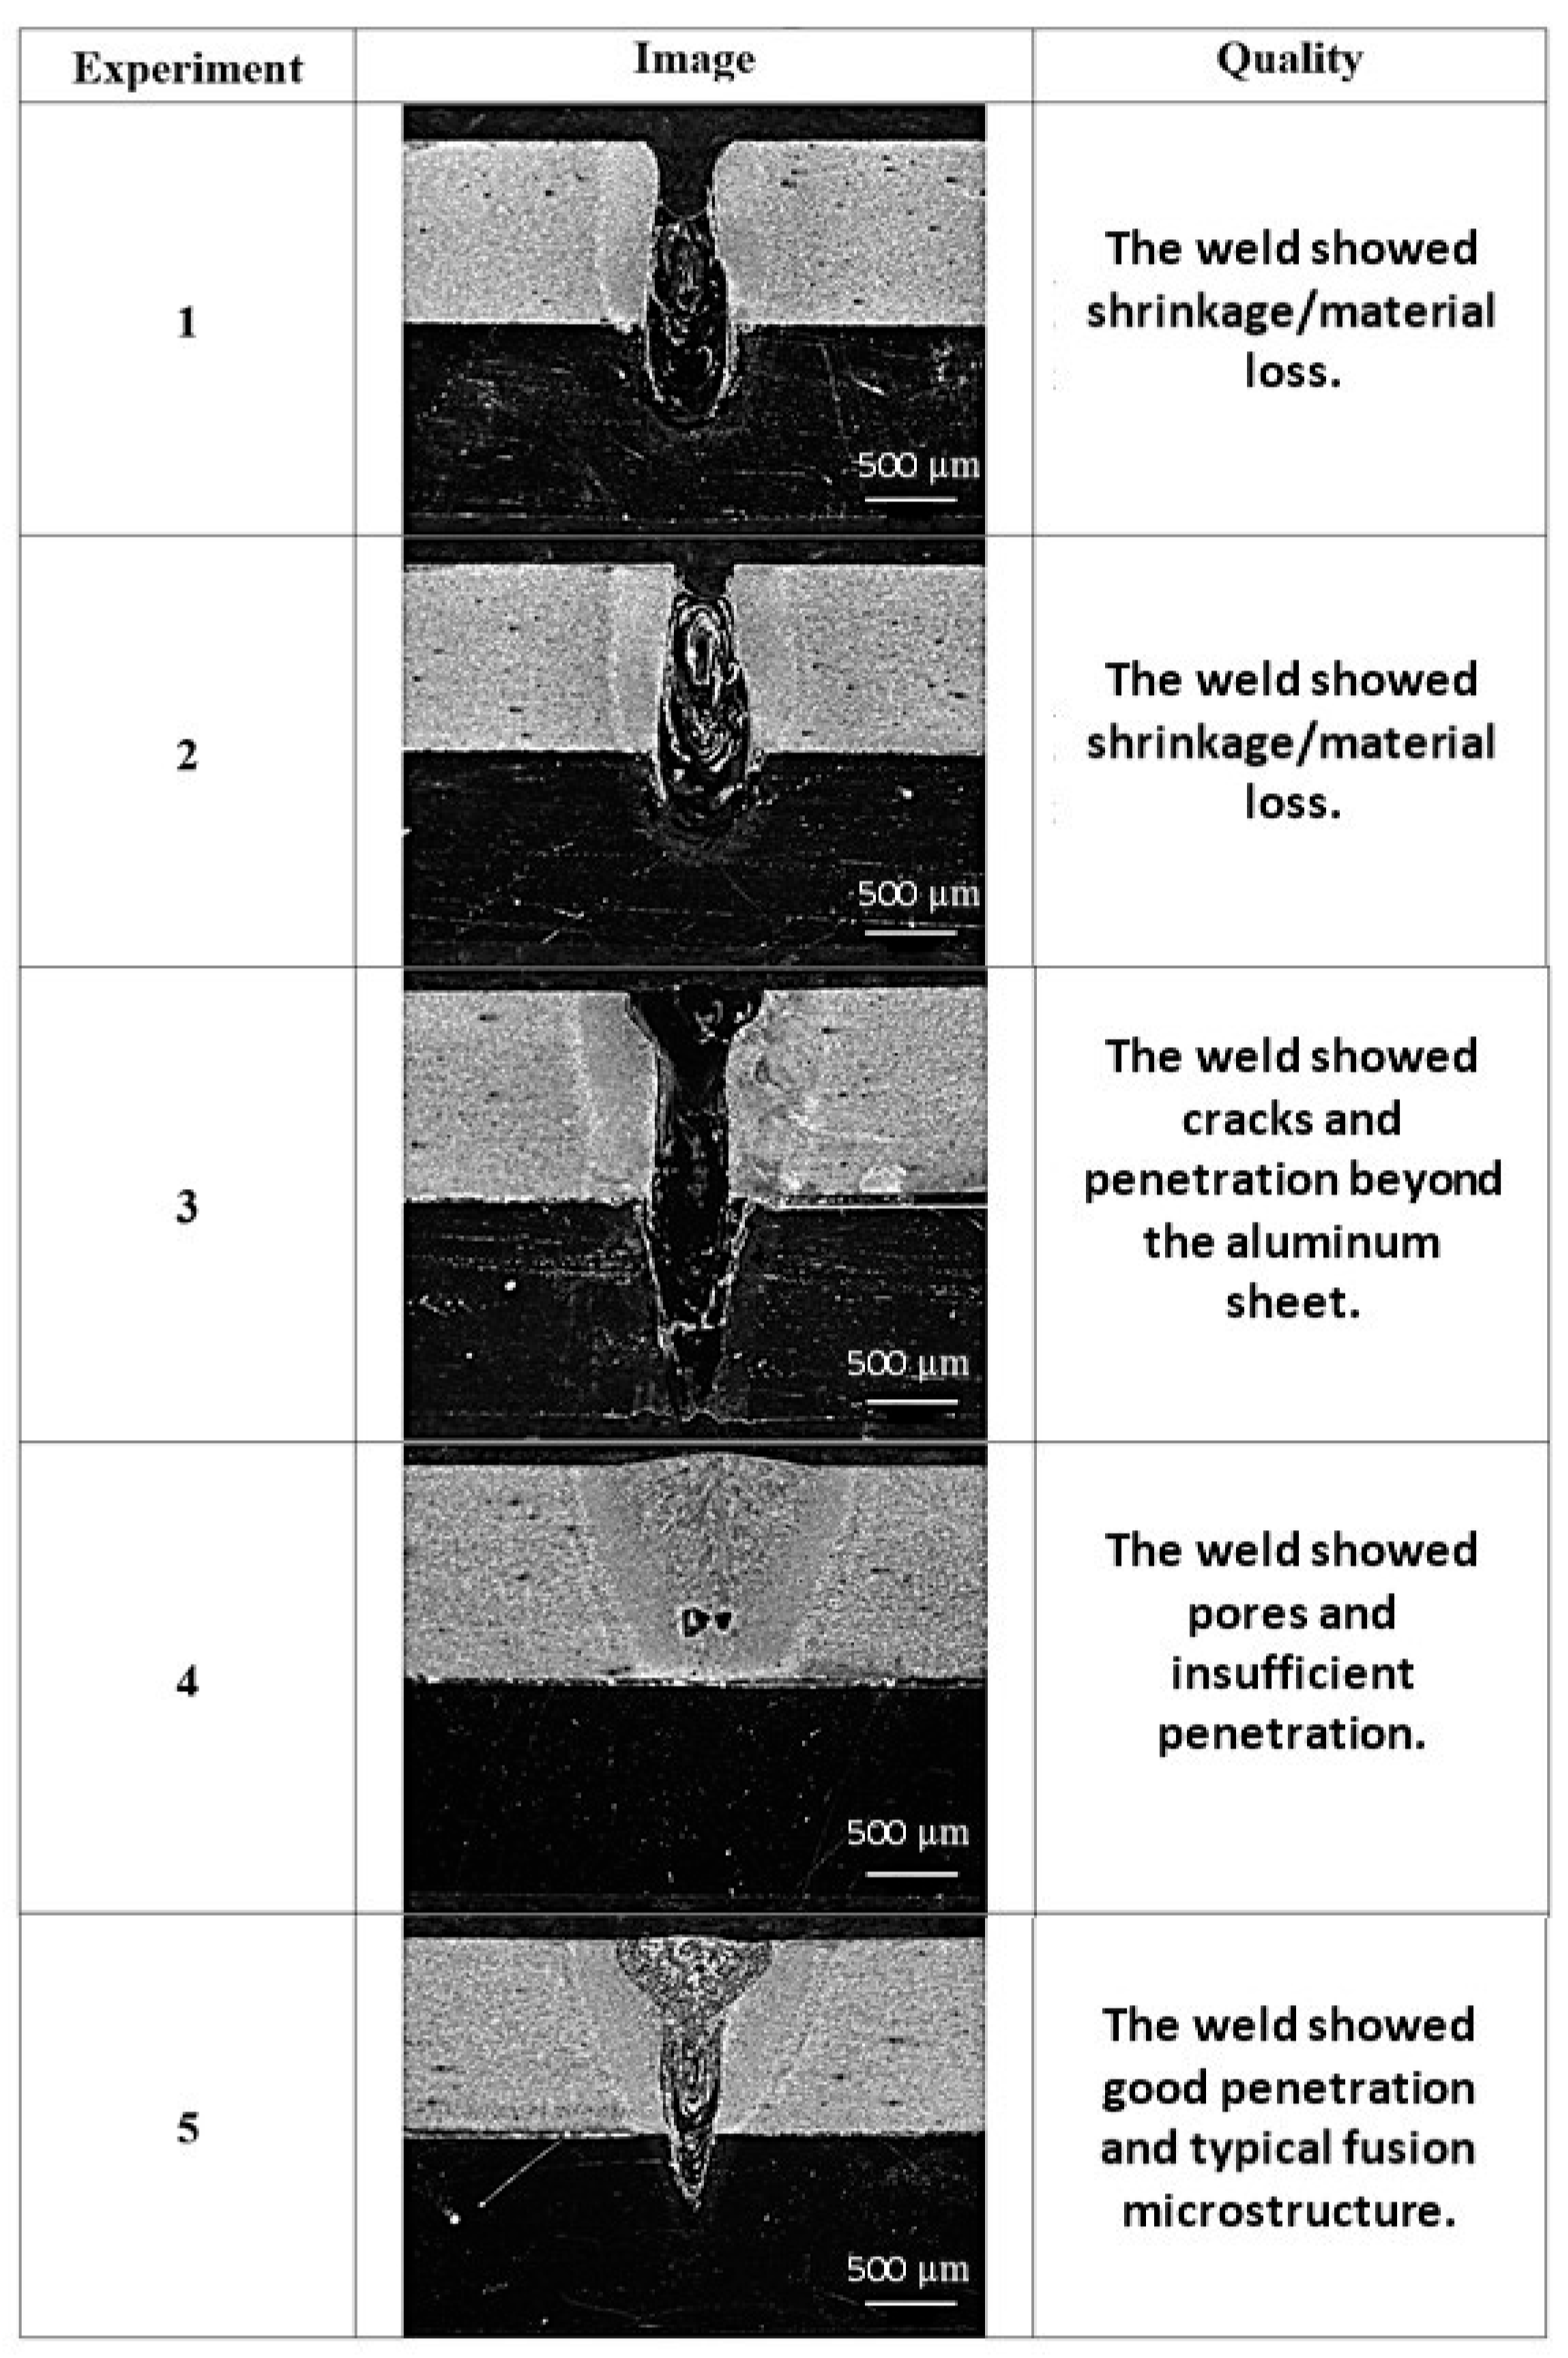
3.1. Parameter Selection

After welding the DP980 steel and 6013-T4 aluminum sheets, as detailed in Table 3, analyses were initiated to identify the optimal welding condition based on weld quality. Samples were etched with a 2% Nital reagent to enhance contrast between the steel and aluminum sheets. Figure 5 shows the results from the exploratory study to define the best welding parameters. It was observed that experiments 1 and 2 exhibited a contraction in the upper part of the fusion zone. This phenomenon can be attributed to the high power of the laser beam, which causes the evaporation of aluminum due to its lower melting point compared to steel.
Experiment 3 presented a crack, likely resulting from the embrittlement of the weld bead, possibly caused by excessive intermetallic formation. In this experiment, excessive penetration was also observed, likely due to the high laser power combined with the chosen speed. Experiment 4 did not achieve sufficient penetration to join the sheets. In contrast, experiment 5 demonstrated good quality concerning the parameters mentioned above.
Therefore, the parameters selected for subsequent analyses were a power of 900 W, a welding speed of 25 mm/s, and a focus of 2.4 mm. Experiment 5 was the only one that did not exhibit shrinkage/material loss (observed in experiments 1 and 2), cracks or excessive penetration (experiment 3), or pores or lack of penetration (experiment 4). Consequently, the parameters from experiment 5 were adopted for welding the samples analyzed in this article.

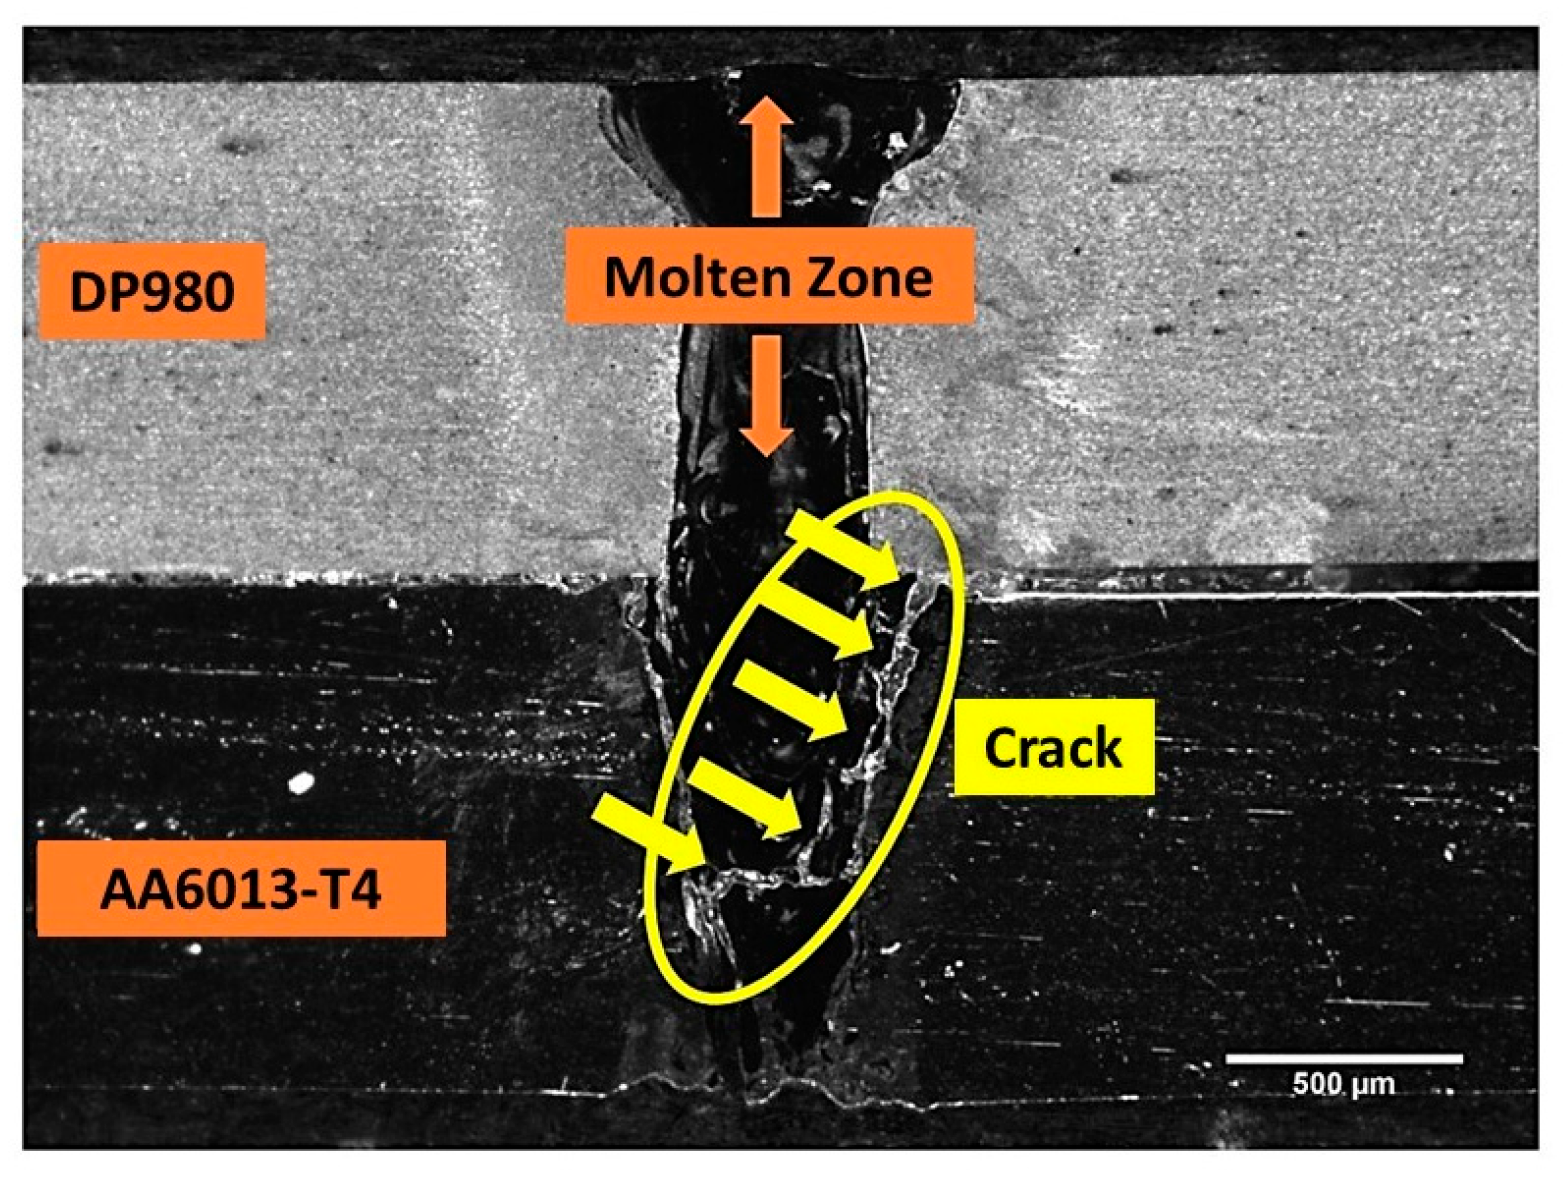
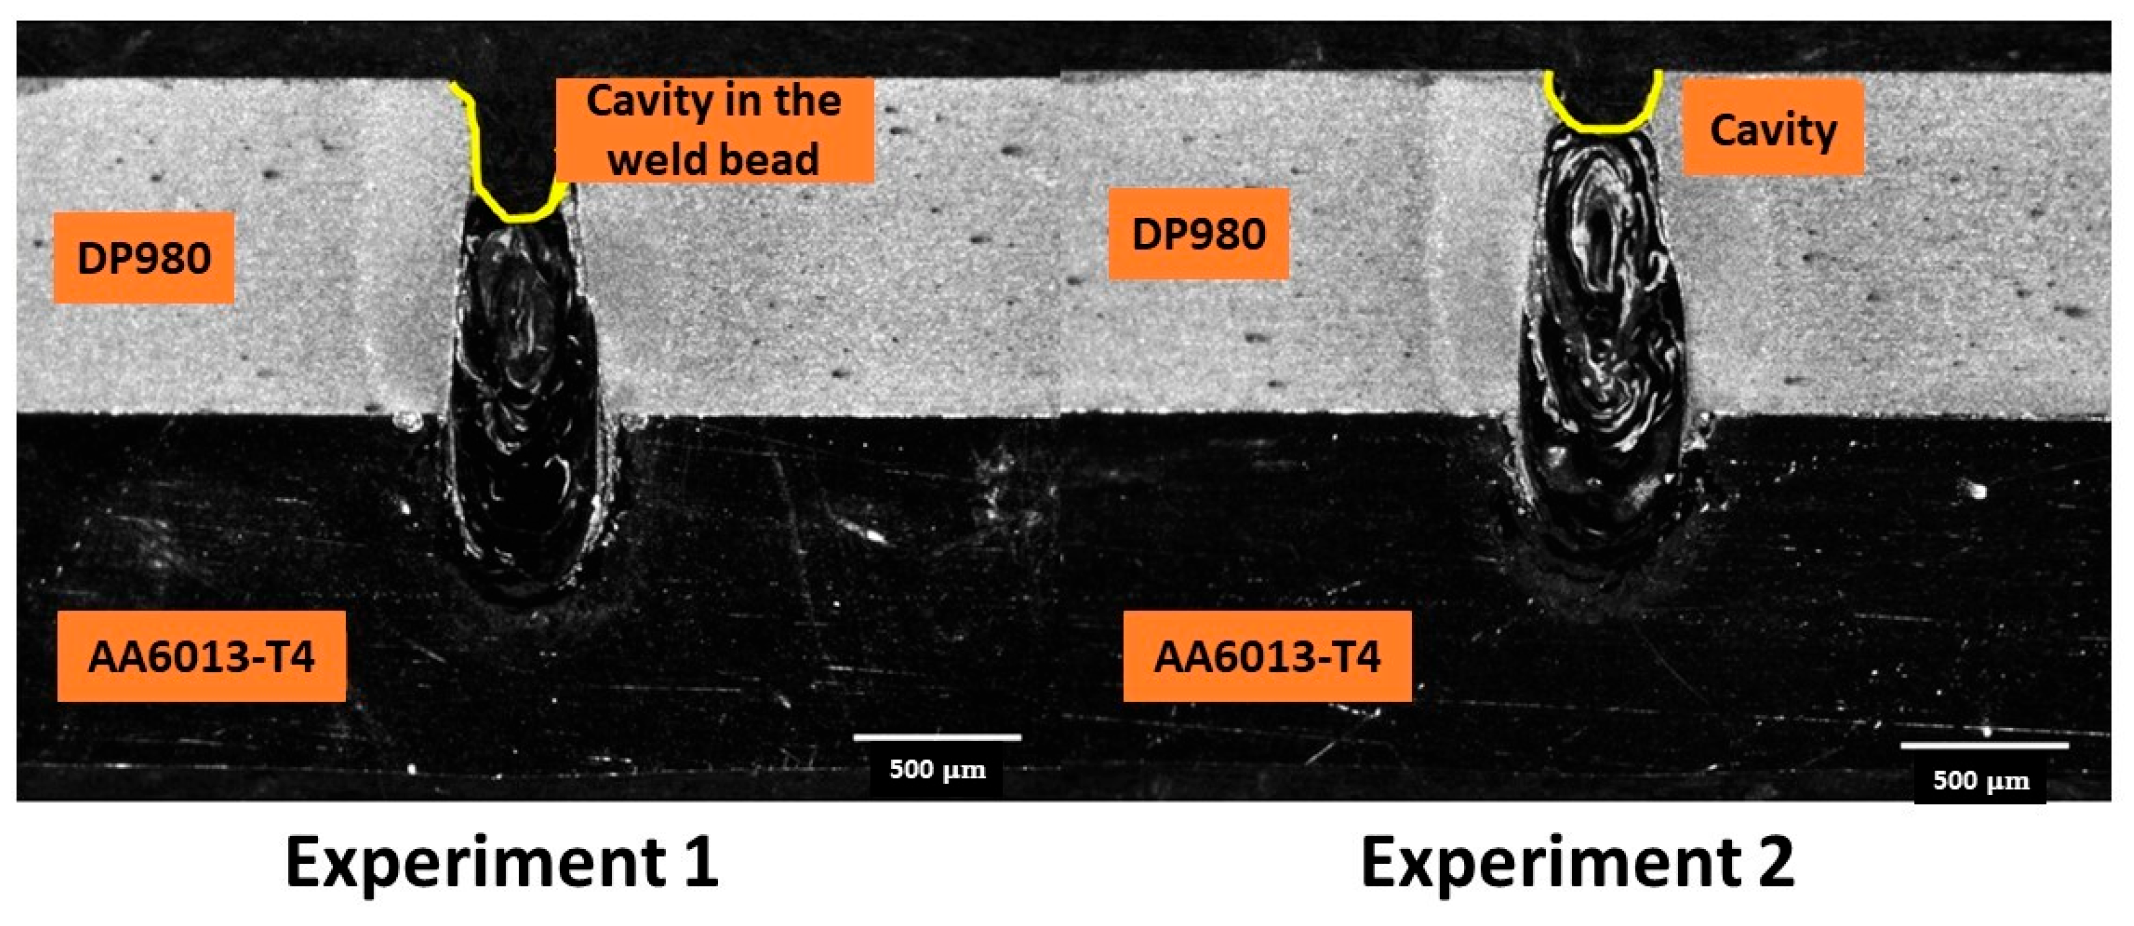
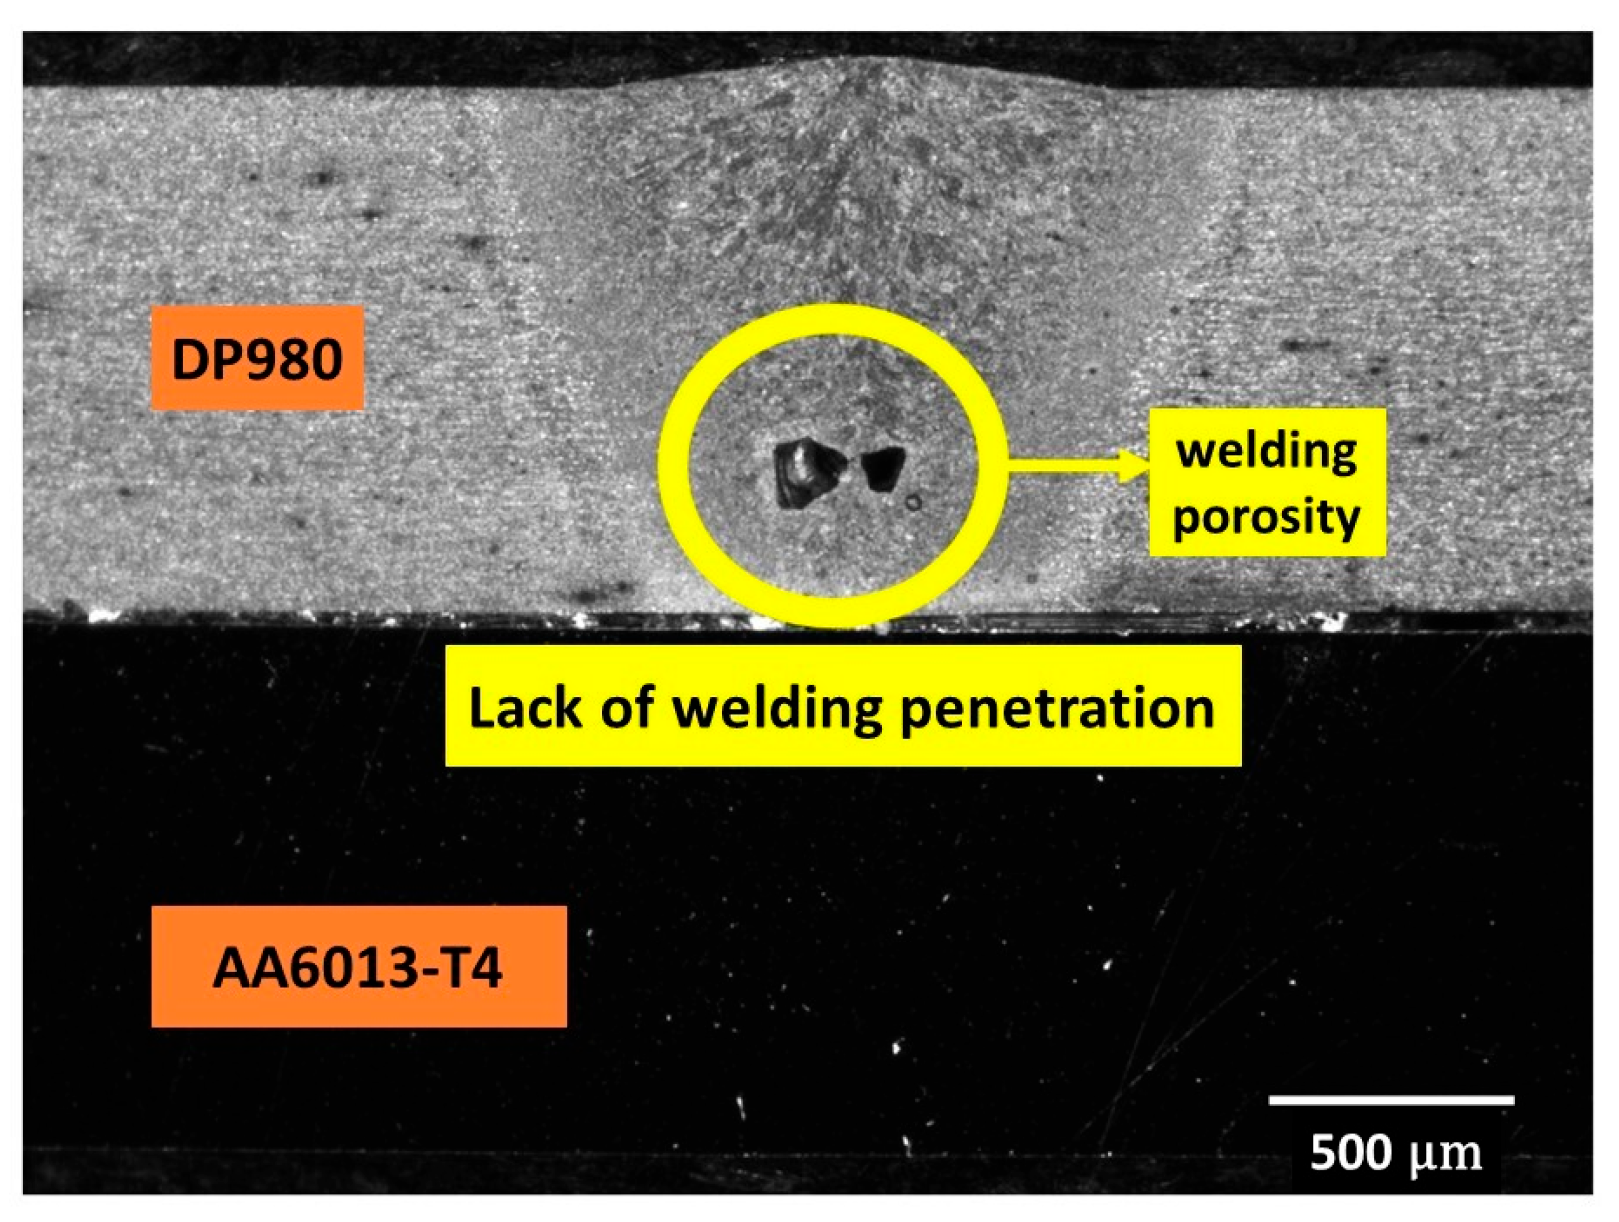
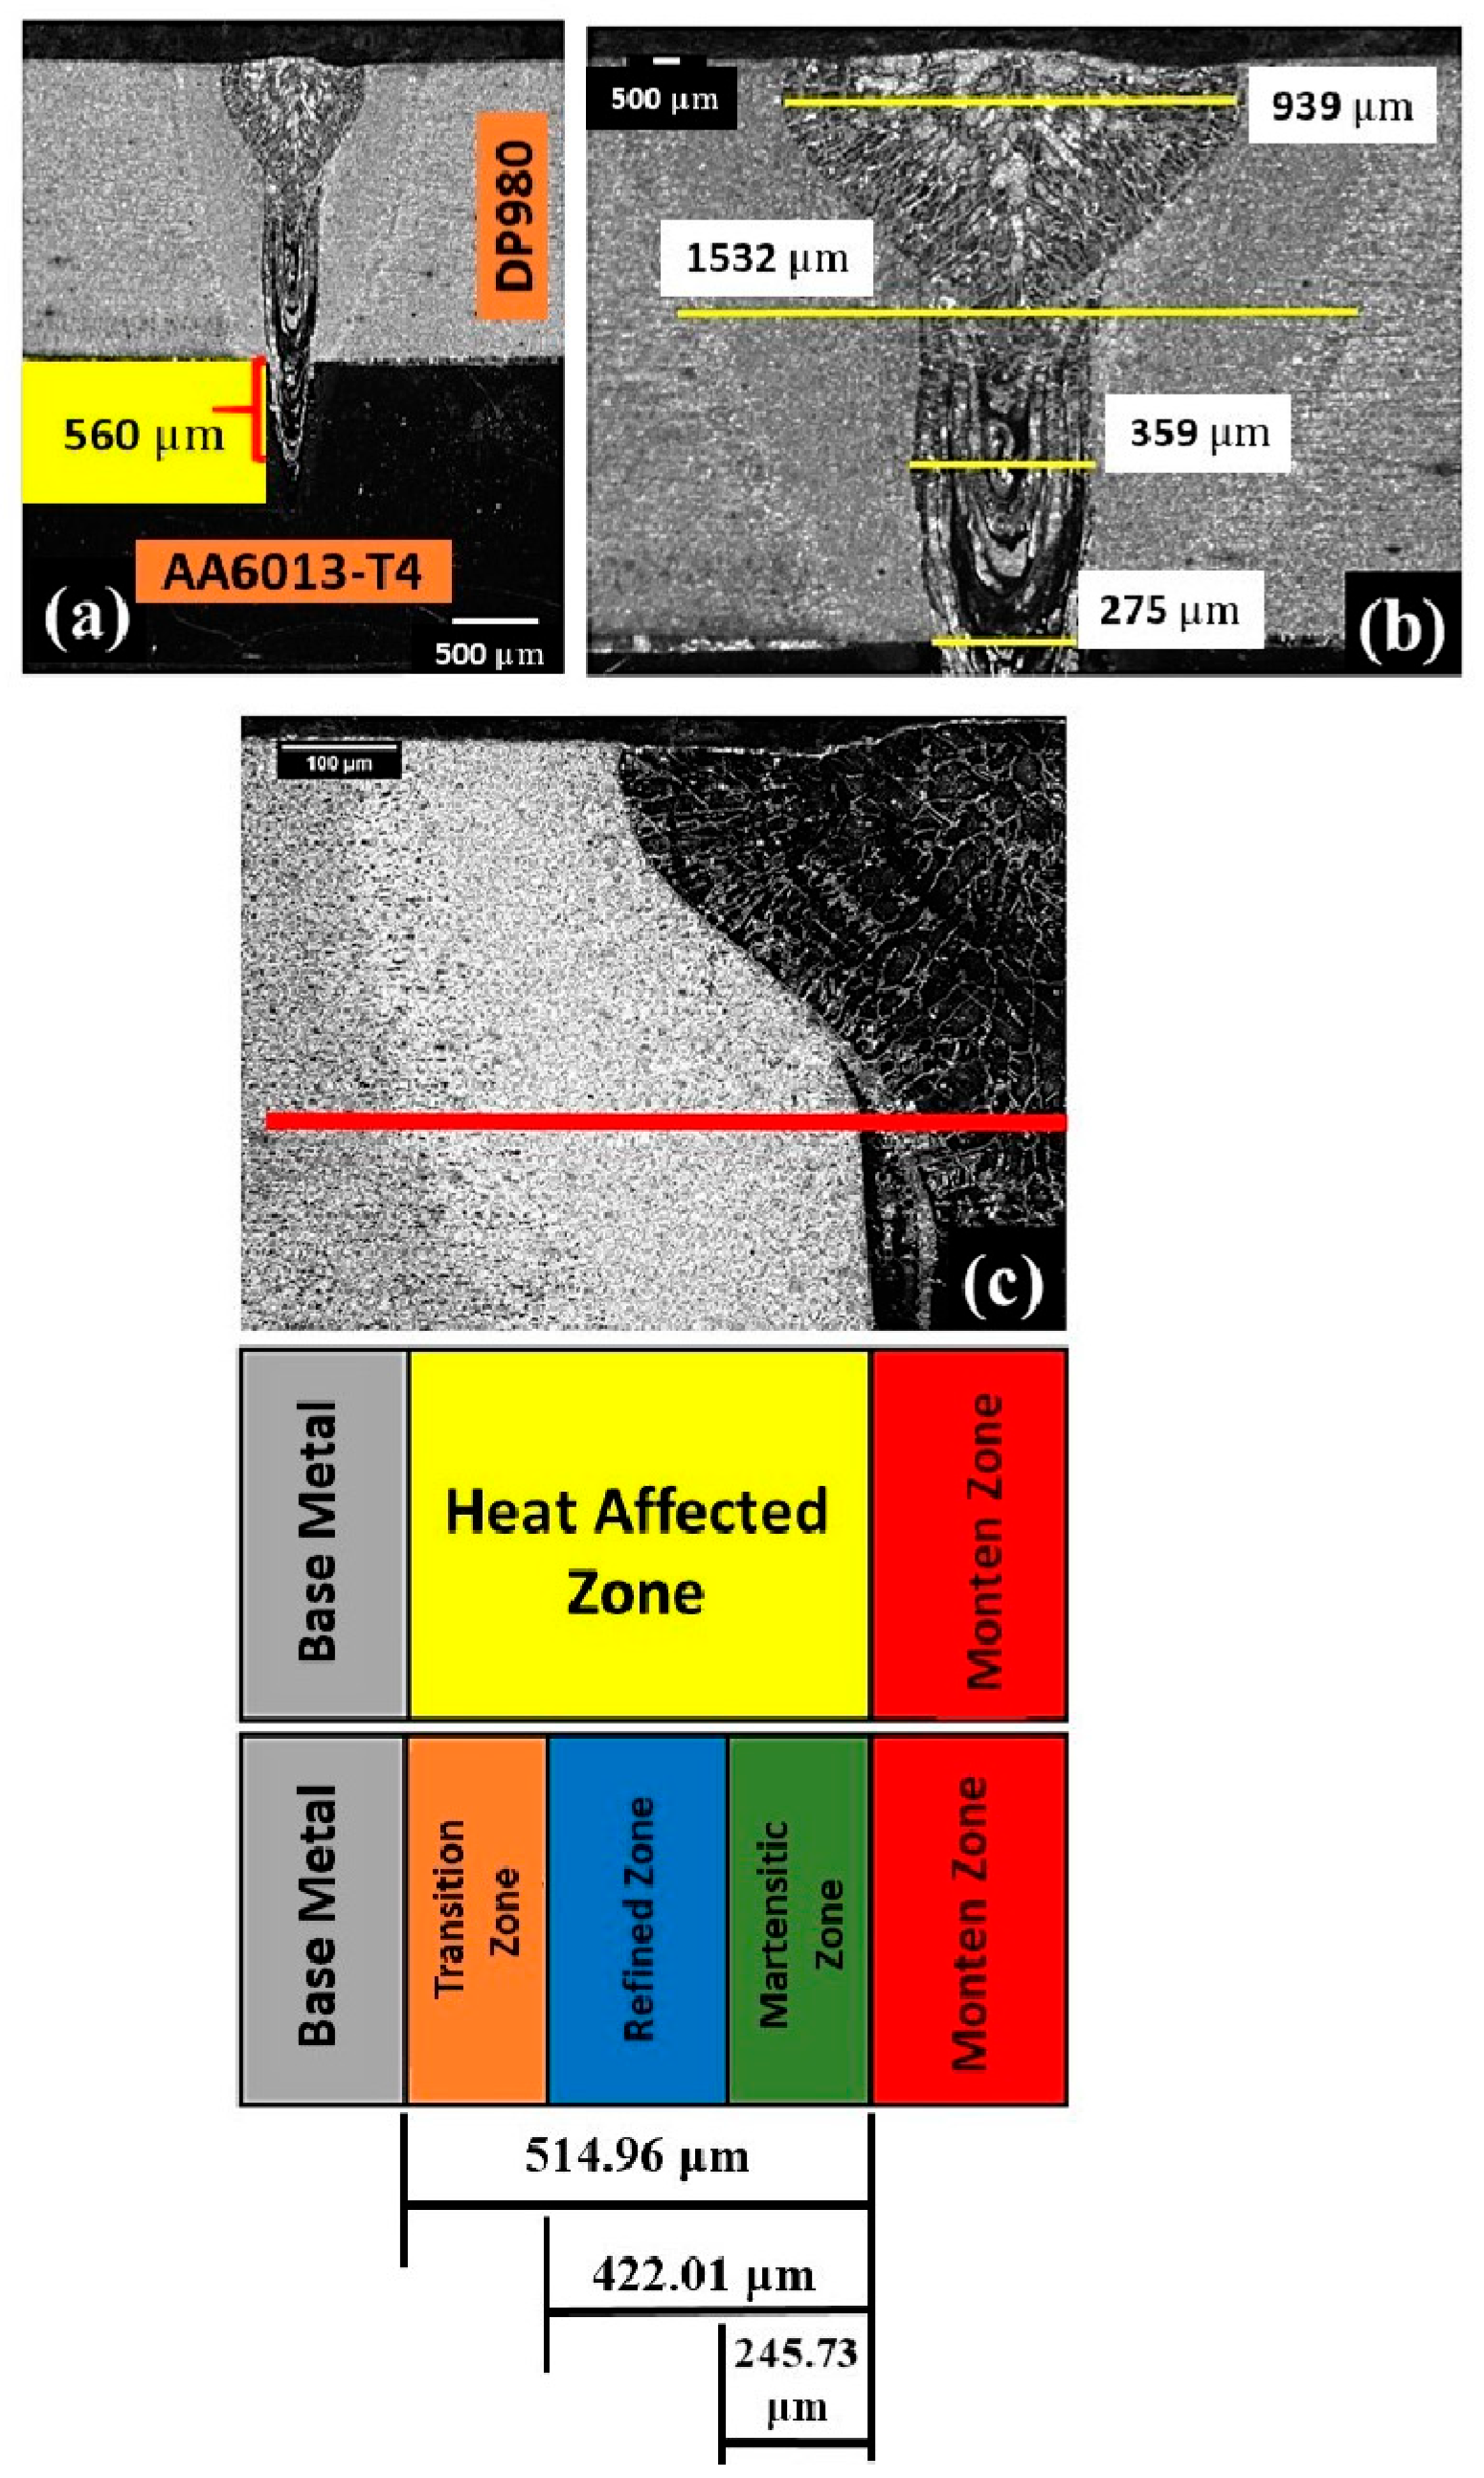
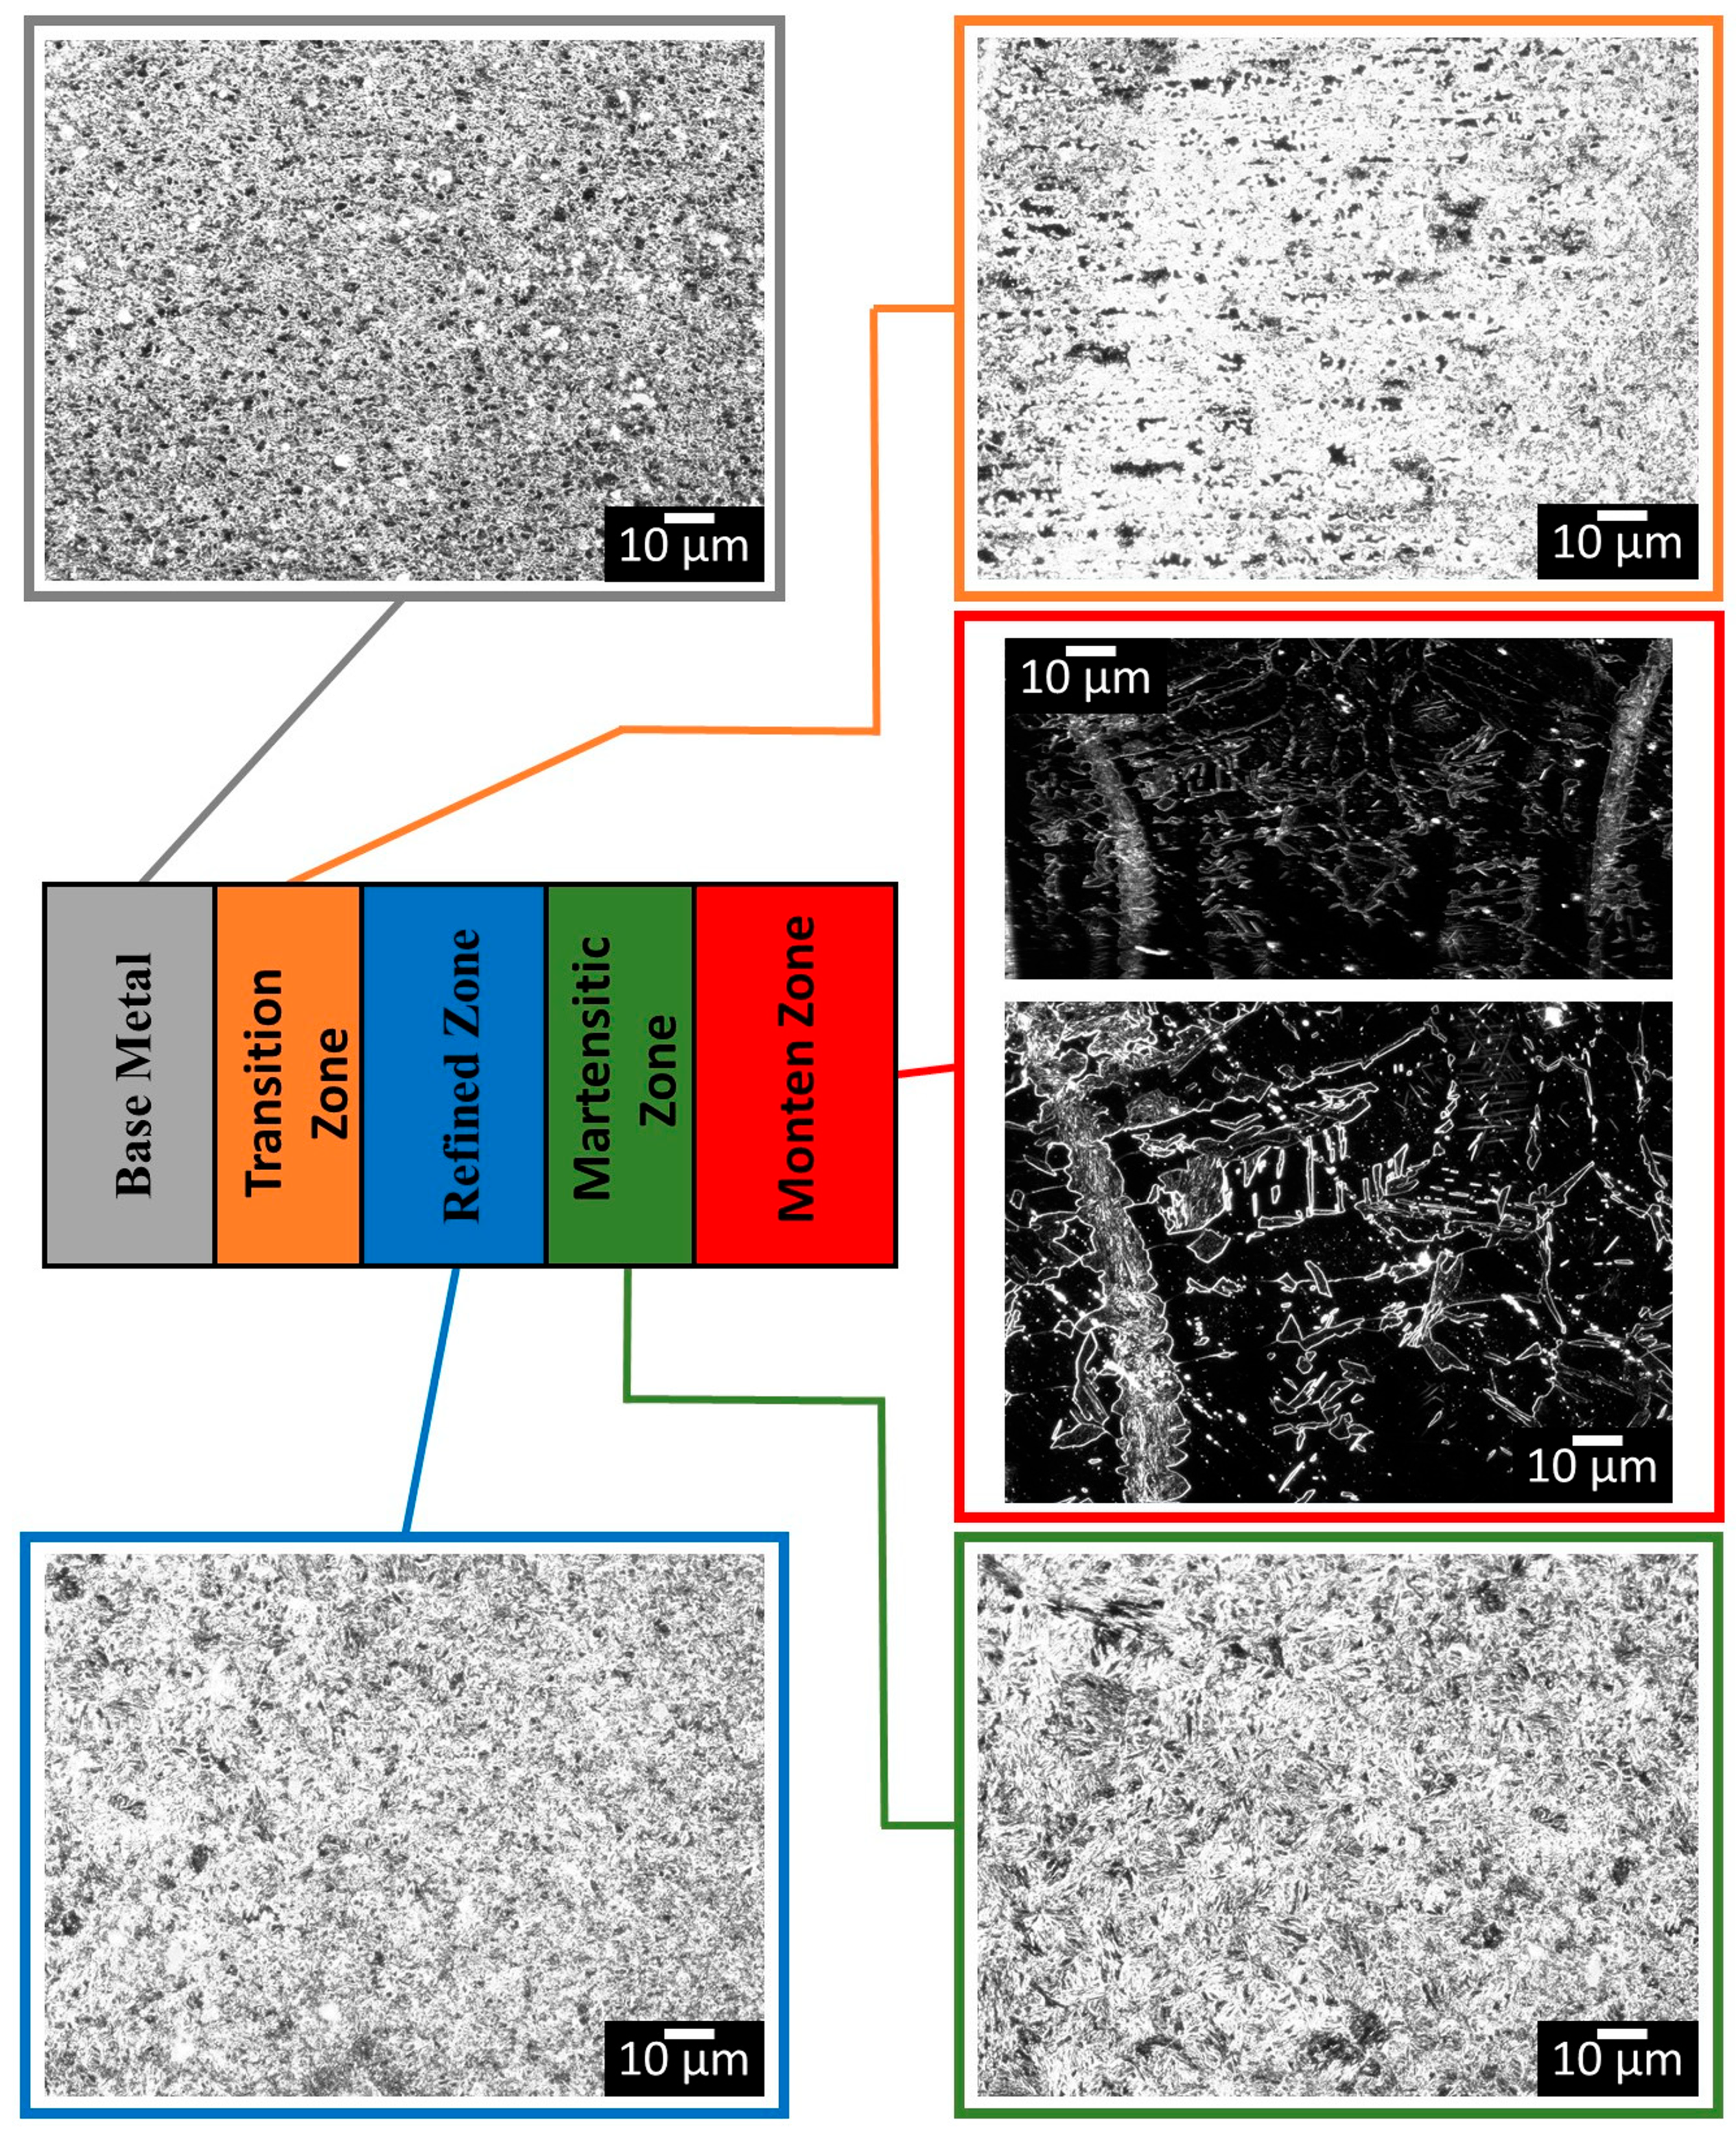
3.2. Microstructural Analysis of Welded Joints

The successful outcome of a weld is significantly contingent upon the properties of the joined metals, which exhibit considerable differences between steel and aluminum. Consequently, certain welding defects—such as lack of penetration, porosity, cracks, contraction, and loss of strength—can be attributed to these disparities in properties. These issues are also linked to the specific characteristics inherent to aluminum alloys, including their low absorptivity, comparatively low solidification and boiling points (relative to iron), high thermal conductivity, elevated coefficient of thermal expansion, substantial solidification contraction, propensity to form low-melting-point components, and high hydrogen solubility during and after solidification [29,30].
Aluminum alloys are notably susceptible to cracking post-welding, a phenomenon that can manifest through two principal mechanisms: solidification cracking and liquefaction cracking. Liquefaction cracking primarily affects alloys with a high content of alloying elements, as these elements tend to form eutectic constituents possessing a low melting point. During the welding process, these constituents melt, and when accompanied by sufficient stress, cracks can propagate during cooling. This particular type of cracking occurs within the heat-affected zone (HAZ) and around grain boundaries. It is less prevalent in laser welding due to the concentrated beam, which minimizes both the Molten Zone and the HAZ.
The more commonly observed mechanism is solidification cracking, also known as hot cracking, which originates within the Molten Zone. This occurs when the liquid metal is incapable of withstanding the stress imposed by solidification contraction and thermal stresses. The manifestation of these cracks is dependent upon both the alloy composition and the prevailing welding conditions [29,31]. Figure 6 provides an enlarged view of experiment 3, specifically illustrating the presence of cracks observed after welding. The crack shown in Figure 6 is a typical welding defect. In this case, according to [32,33], there is an incompatibility of the thermal expansion coefficients between the brittle intermetallics and the aluminum during cooling. This causes the emergence and propagation of cracks in the weld region close to the aluminum alloy. This phenomenon is more present in welds with depths greater than 700 μm, as the weld region becomes more fragile due to the formation of intermetallics. As shown in Figure 6, the crack occurred in the weld region, close to the aluminum, and, as will be shown, there is the formation of brittle intermetallics that can cause the formation and propagation of cracks [32,33].
Figure 7 elucidates the material contraction and loss that transpired in experiments 1 and 2. Volume contraction in metals is a well-documented phenomenon in both fusion welding and casting, with the liquid-to-solid contraction typically approximating 6%. This contraction adversely affects weld quality by inducing internal stresses and represents a primary cause of mechanical deformation [34,35].
Volume contraction proceeds through three distinct stages, such as liquid contraction—a reduction in volume as the liquid cools until its solidification temperature is attained; solidification contraction—the volumetric change occurring during the phase transition from the liquid to the solid state; and solid contraction—the volumetric change that takes place in the solid state as the material cools from its solidification temperature to ambient temperature [36].
Furthermore, laser beam power constitutes a critical factor in laser welding. The power delivered to the workpiece is indispensable for achieving keyhole welding and for controlling weld formation. Insufficient power can lead to inadequate penetration, whereas excessively high power can induce spatter, undercuts, and insufficient filling [30]. Additionally, high power levels may also result in excessive vaporization and material ejection [37].
Upon analyzing Figure 7, it is pertinent to note that experiments 1 and 2 were conducted with identical laser power (1300 W) but employed distinct laser focus settings. In experiment 1, the focus was positioned at the steel surface (0 mm). Conversely, in experiment 2, the focus was situated 2.4 mm from the steel surface (accounting for the 1.2 mm steel thickness plus the 1.2 mm aluminum thickness), thereby placing it at the surface most distant from the aluminum. This distance is crucial as it ensures the concentration of the laser’s power within a specific area.
Focal length is directly correlated with the spot size [28,37]. Moreover, [38] observed that the efficiency of energy transfer increases with a decrease in spot size and an increase in focal distance. This phenomenon is attributed to a reduction in beam divergence, which subsequently leads to greater absorption through constructive interference within a thin liquid metallic film on the keyhole walls. Consequently, the reduced cavity observed in experiment 2 can be ascribed to a more efficient utilization of energy resulting from the modification of the focal length. Nevertheless, despite this improvement, material loss persisted due to the high laser power (1300 W).
Figure 8 delineates the porosity observed within the weld bead subsequent to machining, which resulted from the application of parameters from experiment 4. In aluminum alloys, porosity is typically characterized by the entrapment of hydrogen within the structure during solidification. However, according to [39], in the context of laser welding, porosity is not primarily hydrogen-induced. Instead, it occurs due to the entrapment of both shielding gas and metal vapor in the lower portion of the keyhole, precipitated by the sudden collapse of its upper section. Additionally, it is evident that the weld in experiment 4 did not achieve sufficient penetration to reach the 6013-T4 aluminum alloy. This issue is plausibly attributable to experiment 4 employing the lowest laser power (800 W).
Based on the experiments and the selected optimal parameters, the characteristics of the weld cross-section were observed. These observations focused on the weld bead length, the dimensions of the fusion zone (FZ) and heat-affected zone (HAZ), and the penetration depth. Characterizing these parameters is crucial for understanding a key advantage of laser welding: its ability to affect smaller material dimensions. This localized impact minimizes changes to the material’s microstructure, thereby reducing the probability of defects compared to other welding processes that influence larger areas.
Measurements were performed on the weld bead obtained from experiment 5, which utilized the following parameters: 900 W power, 25 mm/s speed, and a 2.4 mm focal distance. These measurements are presented in Figure 9a,b. Figure 9c provides a diagram illustrating the distinct sectors within the heat-affected zone (HAZ): the Transition Zone (TZ), Refined Zone (RZ), and Martensitic Zone (MZ), in addition to the Base Metal (BM) and the Molten Zone (MZ). Figure 10 shows the microstructure of the zones named above. These zones can be observed through the microstructure and microhardness and were based on references presented in the discussion of this article.

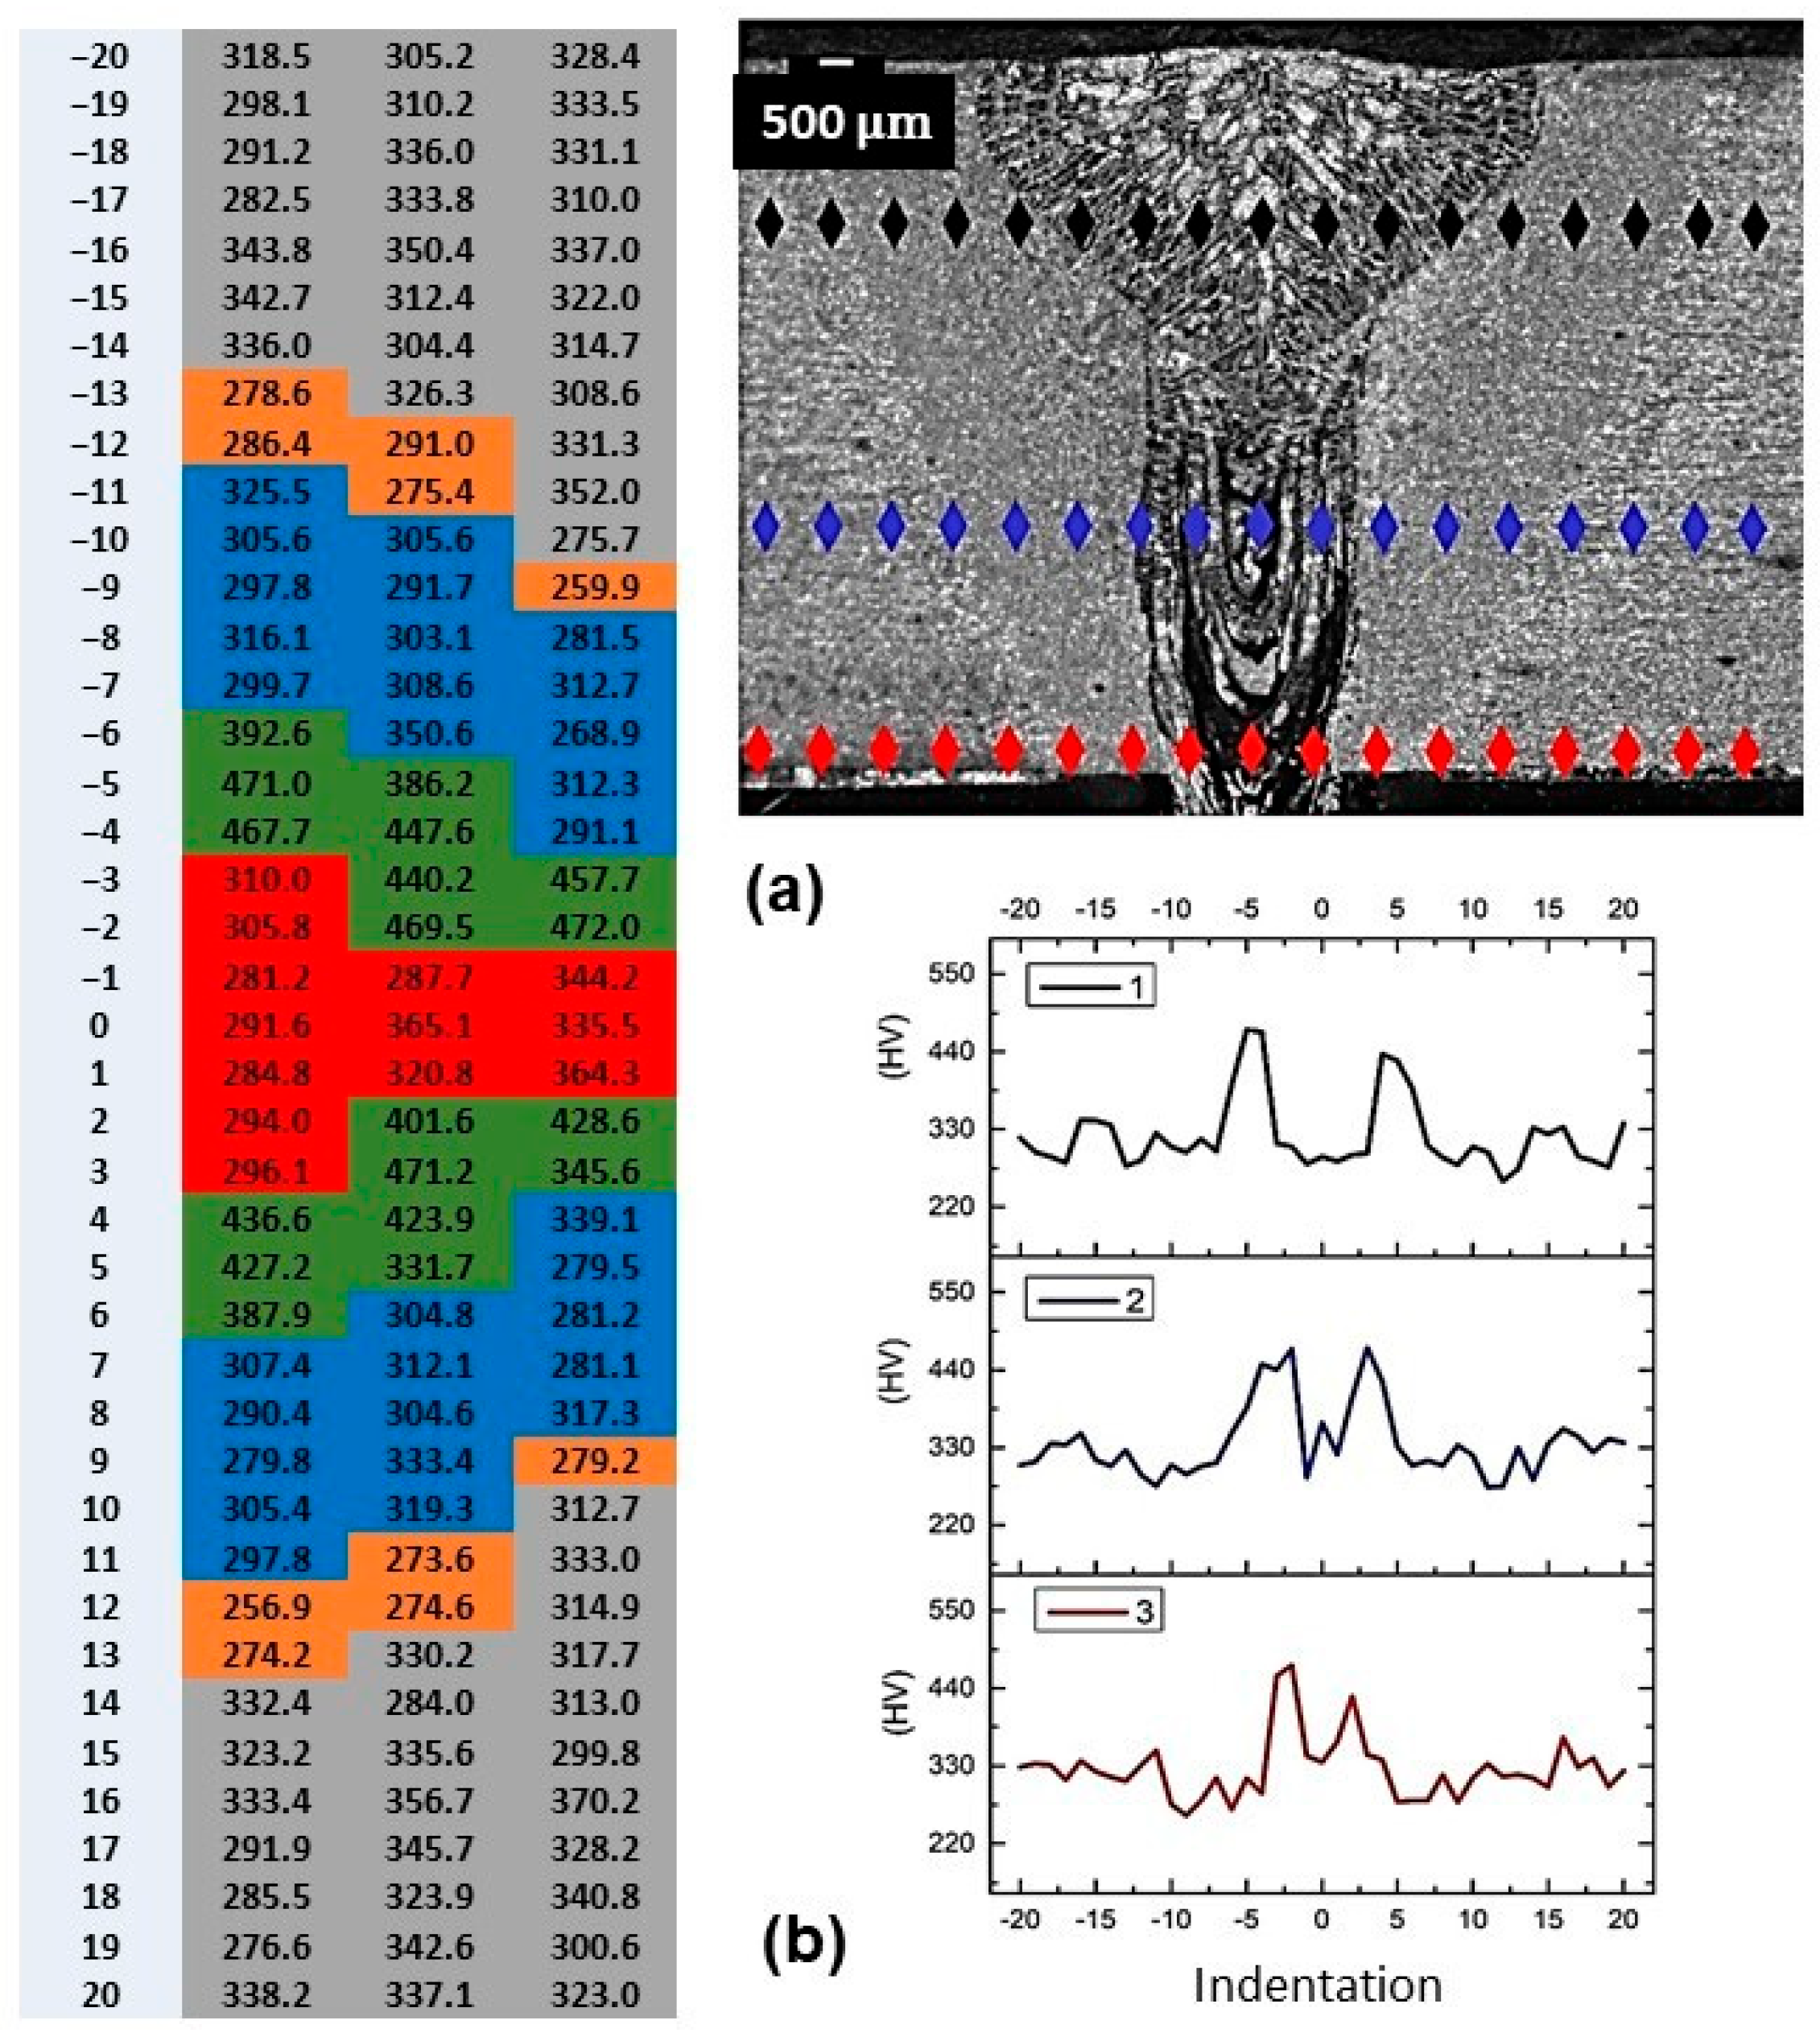
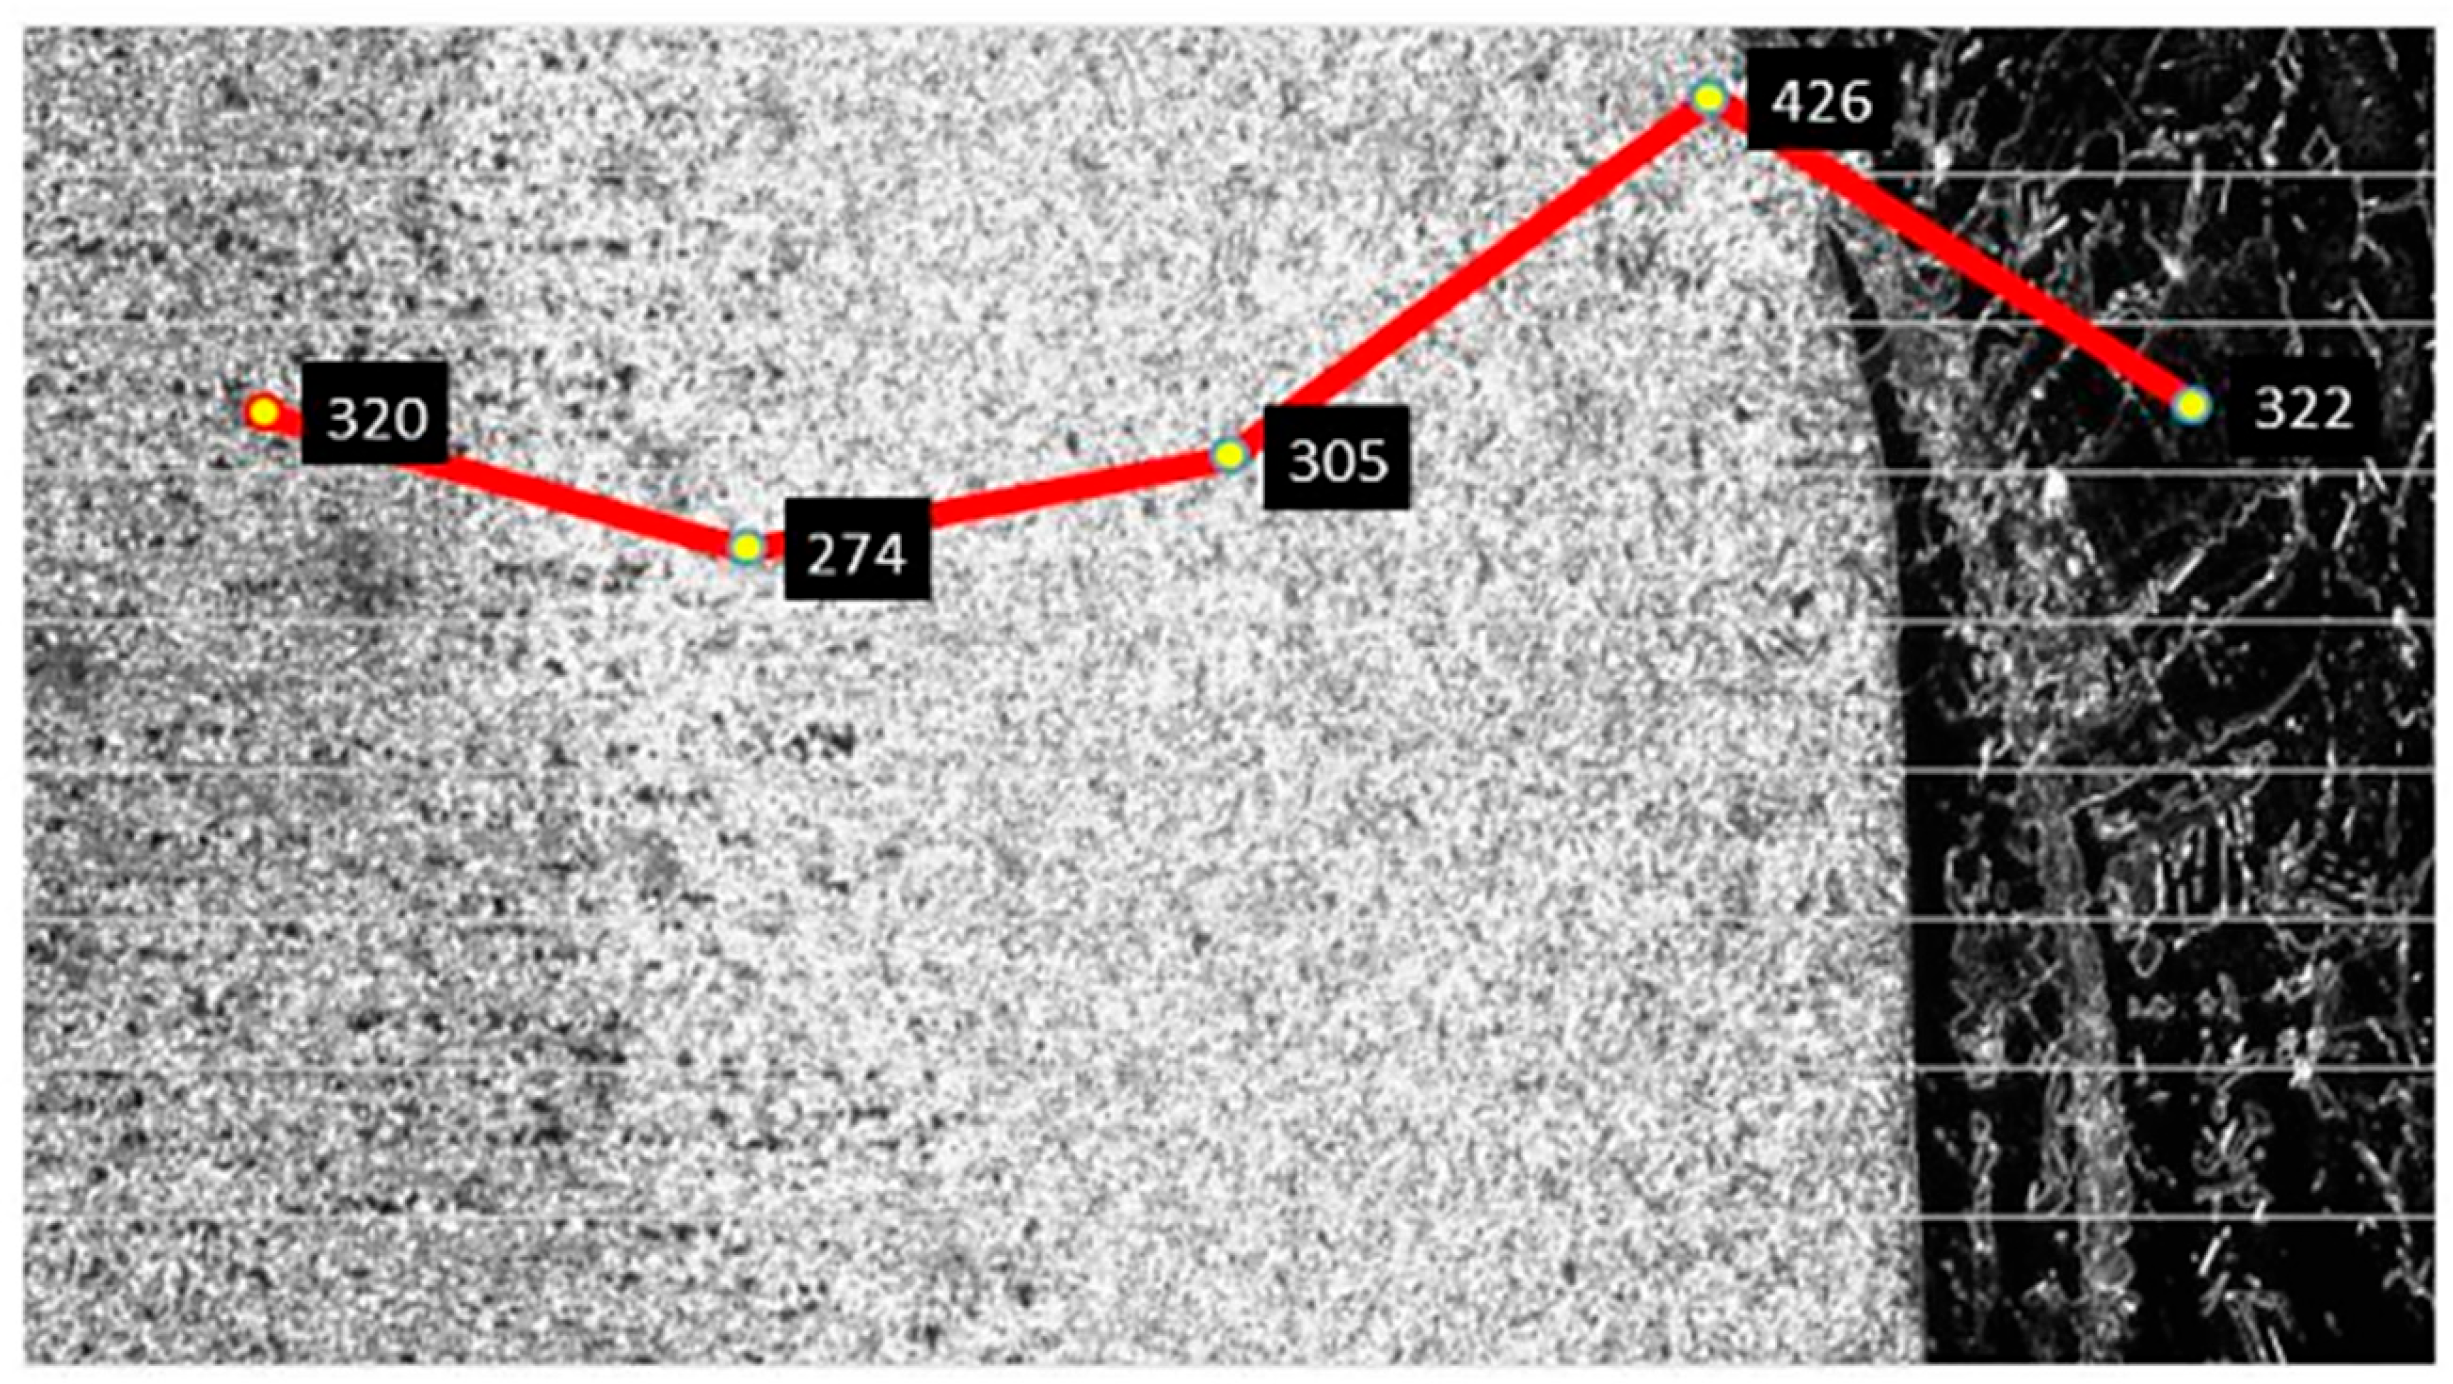
3.3. Vickers Hardness Characterization by Microindentation of Welded Joint

To further characterize the weld bead’s cross-section, microhardness measurements were performed in each previously mentioned region. As detailed in the methodology, three microhardness profiles were taken across three distinct regions of the weld bead located on the DP980 steel plate: the upper, central, and lower regions.
Figure 11 presents the Vickers hardness values obtained from these microindentation profiles, with a table with the values of each point that represent an indentation shown in Figure 11a and the graphs of the three directions shown in Figure 11b. The different subzones are color-coded for clarity: the Fusion Zone (FZ) in red, Martensitic Zone (MZ) in green, Refined Zone (RZ) in blue, Transition Zone (TZ) in “pumpkin” (orange), and Base Metal (BM) in gray. Figure 11 also includes the Vickers hardness profile alongside an approximate schematic representation of the line simulating the hardness profile.
The initial data presented in Figure 11 allow for a clear visualization of Vickers hardness values, separated by color according to their respective subzones. This approach simplifies the interpretation of individual microindentation points and their corresponding values. It is evident that microindentations were made, with one central point in the middle of the Fusion Zone (FZ) and twenty points each to the right and left. The tabulated image accompanying the microhardness profiles and data indicates that the FZ exhibits relatively low hardness. This lower hardness can be attributed to the aluminum present in the as-cast structure. The exact values for these points are highlighted in red.
It can be observed that as the analysis progresses from the FZ towards the aluminum sheet, the hardness tends to increase. This trend can be explained by the increased formation of intermetallics closer to the aluminum sheet. The Martensitic Zone (MZ), situated adjacent to the FZ, consistently shows the highest hardness, as depicted in the graphical profiles alongside the table of values. This region, represented in green, has an average hardness of 426 HV0.2, significantly higher than the FZ’s average of 322 HV0.2. This high hardness value is explained by the martensitic microstructure and aligns with the findings of [40], who, after laser welding DP980 steel, observed an increase in martensite volume fraction within the HAZ. This increase, resulting from heat input and rapid cooling, led to Vickers hardness values ranging from 400 to 460 HV0.2.
Following this region, in the Refined Zone (RZ), the hardness value decreases again to approximately 305 HV0.2. This value, even lower than that found in the FZ, might be due to the presence of a complex microstructure. This microstructure could include not only harder and more resistant phases but also softer and relatively ductile phases, such as acicular ferrite, retained austenite, upper bainite, and pearlite. Furthermore, it is still possible that some indentations within the FZ were made on, or partially on, intermetallics, which could have increased the measured hardness.
The subsequent zone, the Transition Zone (TZ), exhibits the lowest hardness level, averaging 274 HV0.2. This level can be explained by the microstructure itself, which, as previously discussed, is characterized by larger grains, thereby reducing the hardness of the initial DP980 steel structure.
Regarding the hardness of the Base Metal (BM), an average of 320 HV0.2 was found, which is consistent with the findings of several authors like [40,41,42]. Ref. [43] obtained similar results when resistance welding DP980 steel. According to this author, the martensitic region, forming immediately after the fusion zone, arises from the high cooling rate, which is, in turn, a consequence of the peak temperature reached in the FZ. In relation to the TZ observed in this work, the same author attributes its lower hardness to the weld’s thermal cycle, which tends to induce a decrease in hardness due to the tempering of martensite. This implies that the peak temperature in the TZ is not sufficiently high to re-austenitize the region and subsequently transform it back into martensite upon rapid cooling; instead, the temperature promotes the softening of the material. Ref. [44] also observed a drop in material hardness at the end of the HAZ, near the BM, a region referred to as the TZ in this study. They assert that this reduction in hardness is primarily due to the tempering of martensite. Figure 12 illustrates a graph presenting the average Vickers hardness values positioned within their respective weld bead regions. Regarding the 6013-T4 aluminum alloy, [45] demonstrated in his study the behavior of microhardness when welded with steel.

3.4. XRD and EDS Analysis

When laser welding DP980 steel with an AA6013-T4 alloy, the materials intermix in the molten pool. Due to physicochemical differences during solidification, aluminum trapped within the steel structure can form Fe-Al alloys, intermetallic phases, or solidify as pure aluminum. In fact, the latter is a hypothesis for the lower hardness observed in the Fusion Zone (FZ) and for the FZ’s microstructure as seen via optical microscopy. However, using only a chemical etch with Nital reagent does not allow for clear observation of the phases present in the FZ due to the aluminum, much less the identification of intermetallic formation. Therefore, the EDS technique was employed to verify aluminum’s presence in the weld bead, and the XRD technique was used to attempt to identify intermetallic formation.
Figure 13 displays images of a region of the weld bead in the longitudinal direction. It clearly shows the presence of aluminum both at the base, where the AA6013-T4 alloy is located, and within the weld bead itself. This indicates that the aluminum melted and mixed with the iron from the DP980 steel during solidification. Consequently, the hypothesis that the presence of aluminum in the weld bead may have caused a decrease in the region’s hardness is plausible, given its confirmed presence in the FZ. In this image, the yellow tones indicate the presence of the element aluminum and the red tones the presence of the element iron. Highlighted is an electron microscopy image of the evaluated region.
An XRD analysis was conducted, and four sets of results were compared. These analyses were performed on DP980 steel, AA6013-T4 alloy, and two distinct regions of the weld bead, as detailed in the methodology. Figure 14 presents these results.
The initial observation from the diffractograms is the significant difference between the welded regions and the base materials (DP980 steel and AA6013-T4 alloy). This difference clearly indicates that structural modifications occurred in the welded zone. The study, conducted to identify the presence of intermetallics revealed that the welded regions may contain at least three distinct intermetallics: AlFe3, AlFe, and Al13Fe4.
These analyses were performed using Crystallographica Search-Match software, which compares the obtained diffractograms with a library of known elements or compounds. The software also allows for the inclusion of external diffractograms for peak comparison.
Figure 15 displays an image of the weld diffractogram analysis alongside that of the AA6013-T4 alloy, showing the equivalences for AlFe3, AlFe, and Al13Fe4. This finding is consistent with the existing literature, which frequently reports the formation of intermetallics when steel and aluminum are welded. For instance, [45] compared laser and spot welds, finding AlFe3 in both. Ref. [46] analyzed a welded joint of DP steel with aluminum and identified not only AlFe3 but also Fe2Al5. Similarly, [47] found AlFe3, Fe2Al5, and AlFe when analyzing laser-welded steel and aluminum joints. Furthermore, [48] studied electron beam-welded DP steel and AA5754 aluminum alloy joints and reported the presence of AlFe3, FeAl, FeAl6, FeAl2, and Fe4Al13.
Therefore, the formation of intermetallics in the laser-welded joint, given the parameters and materials used, was clearly observed. The presence of these elements can induce brittleness in the material, potentially leading to failure under stresses that would otherwise be below the material’s yield and resistance limits.

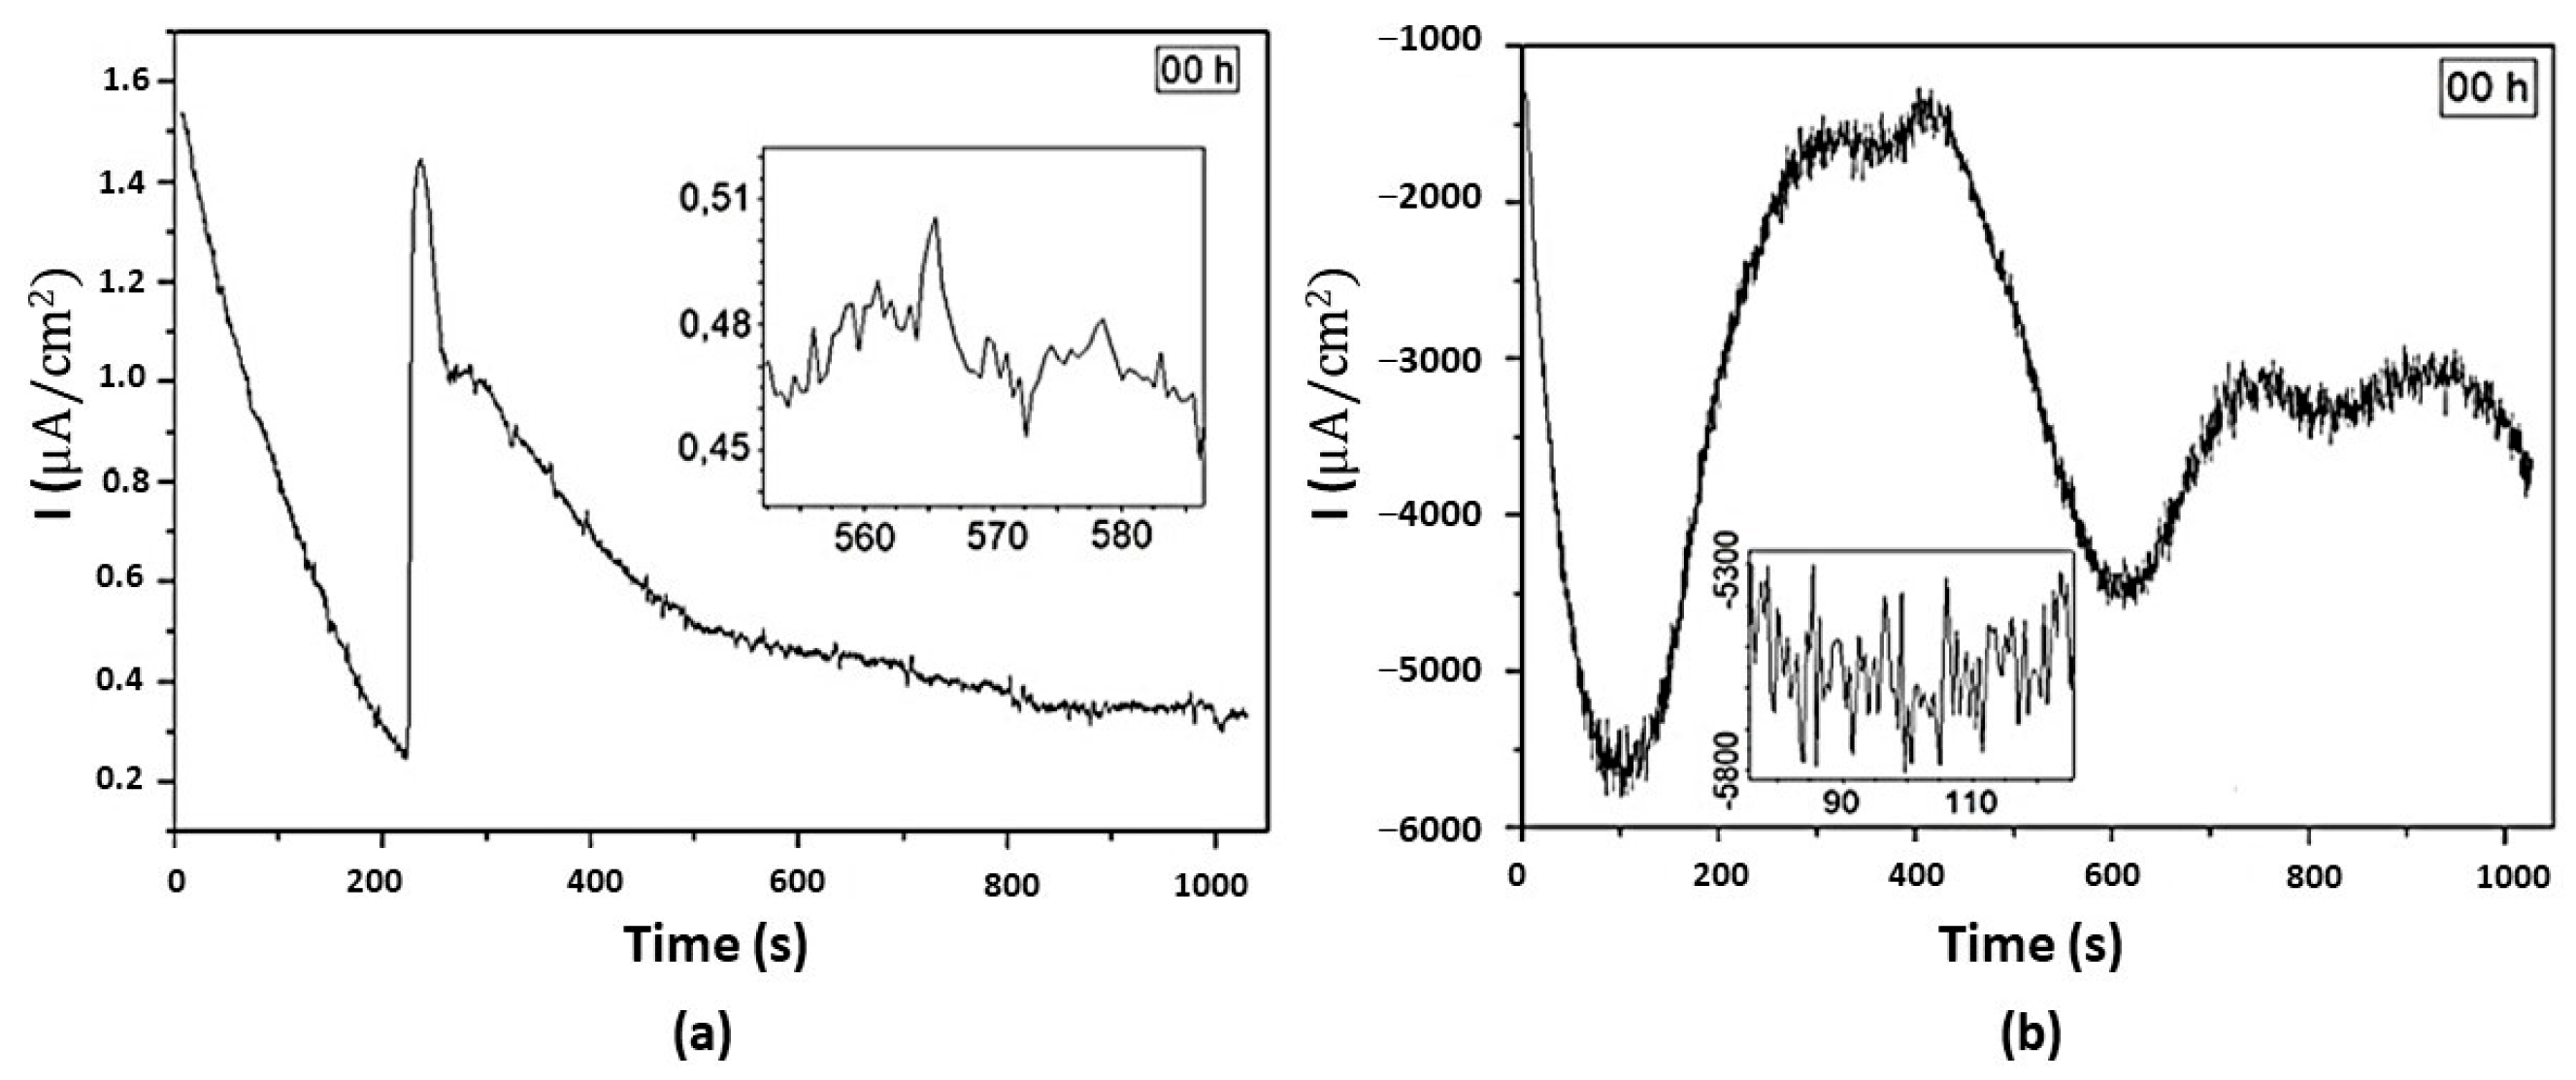
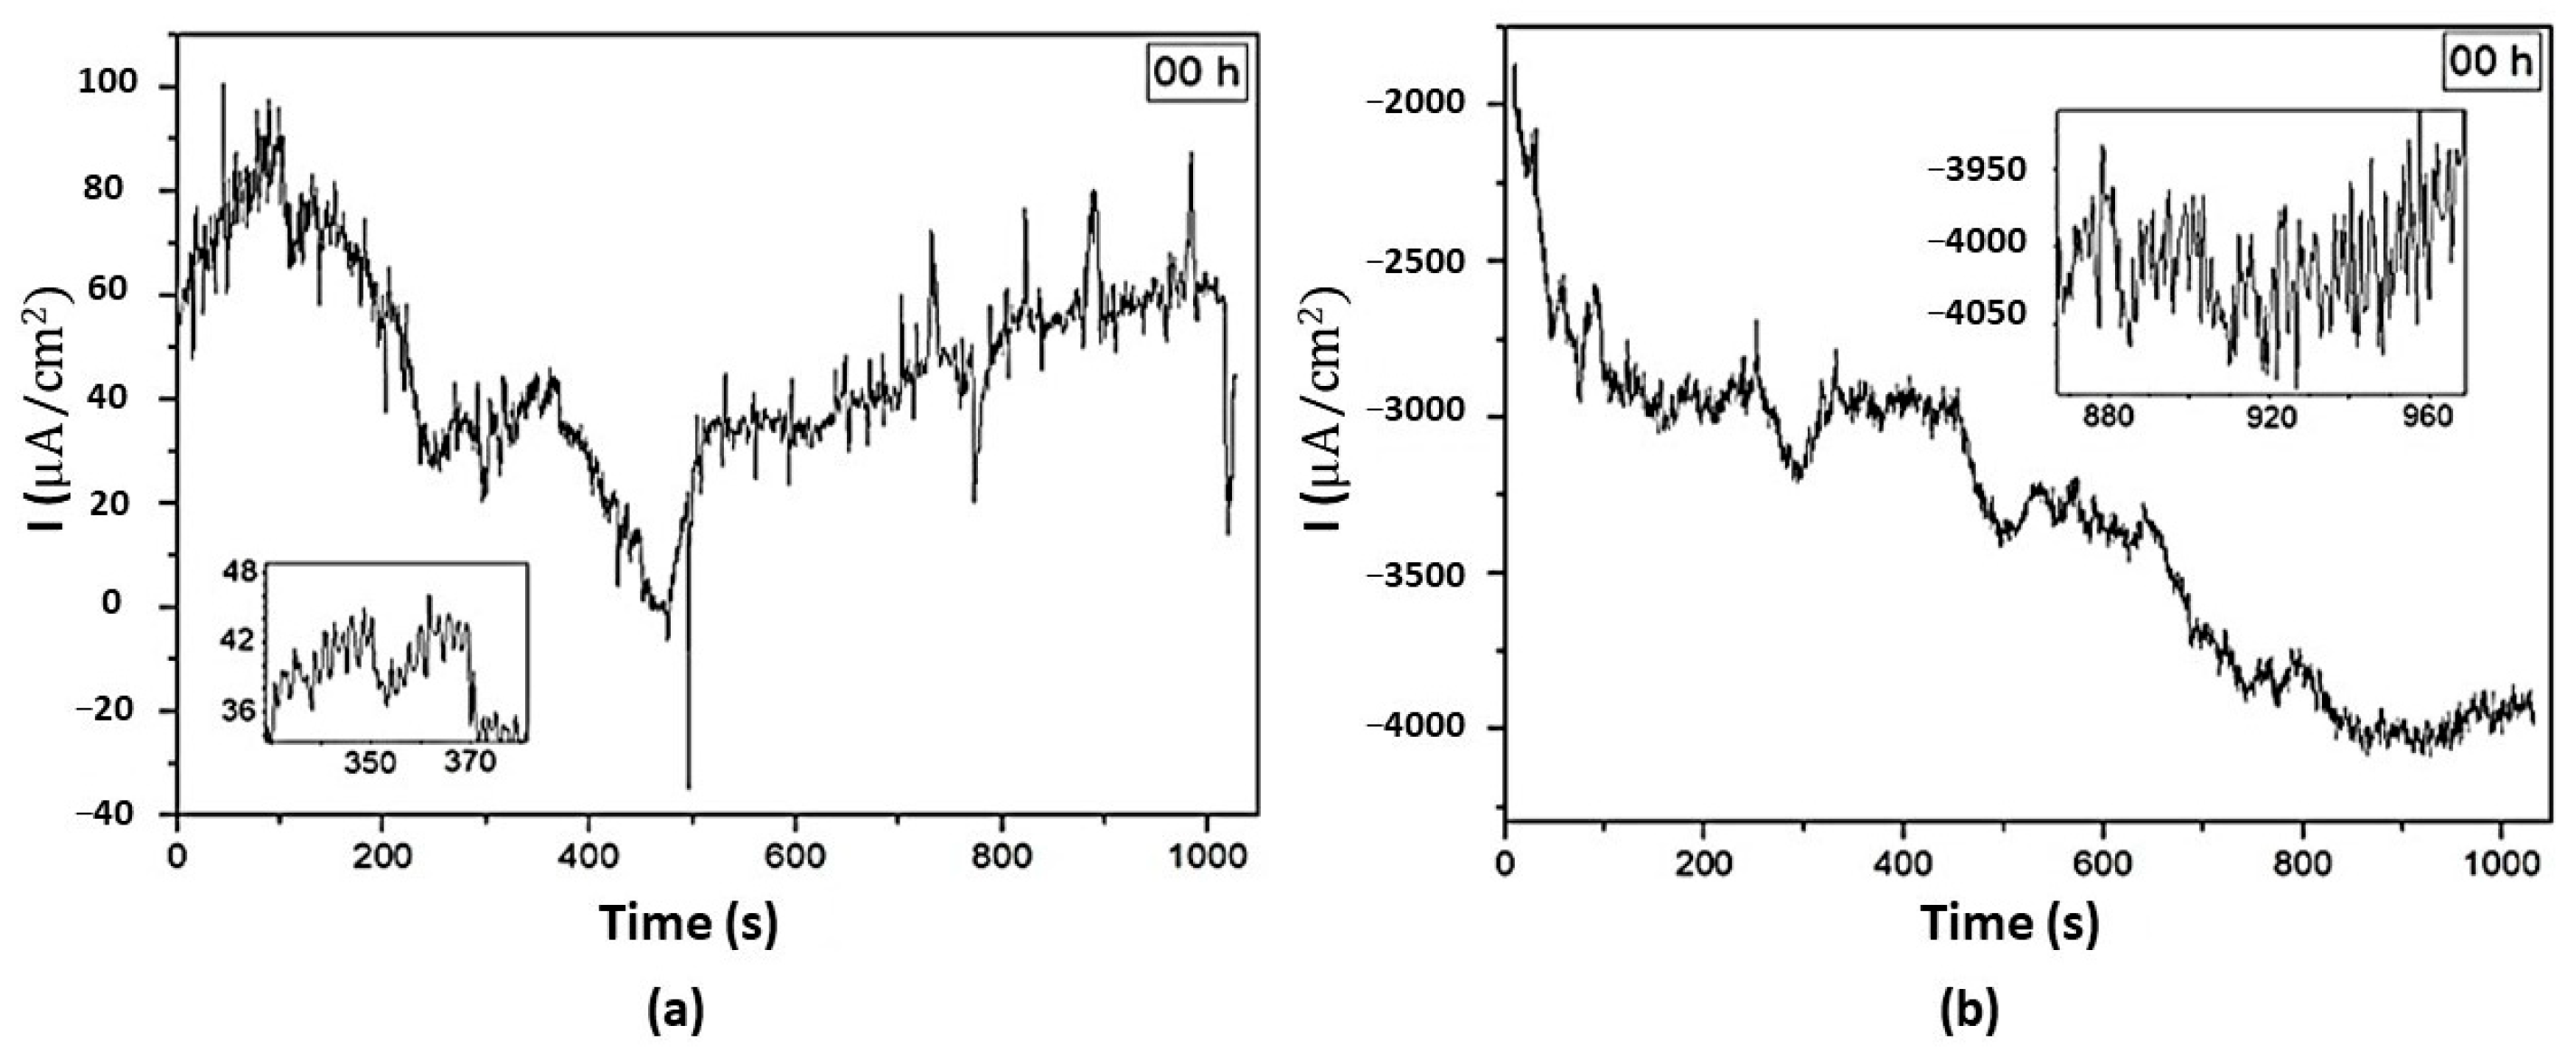
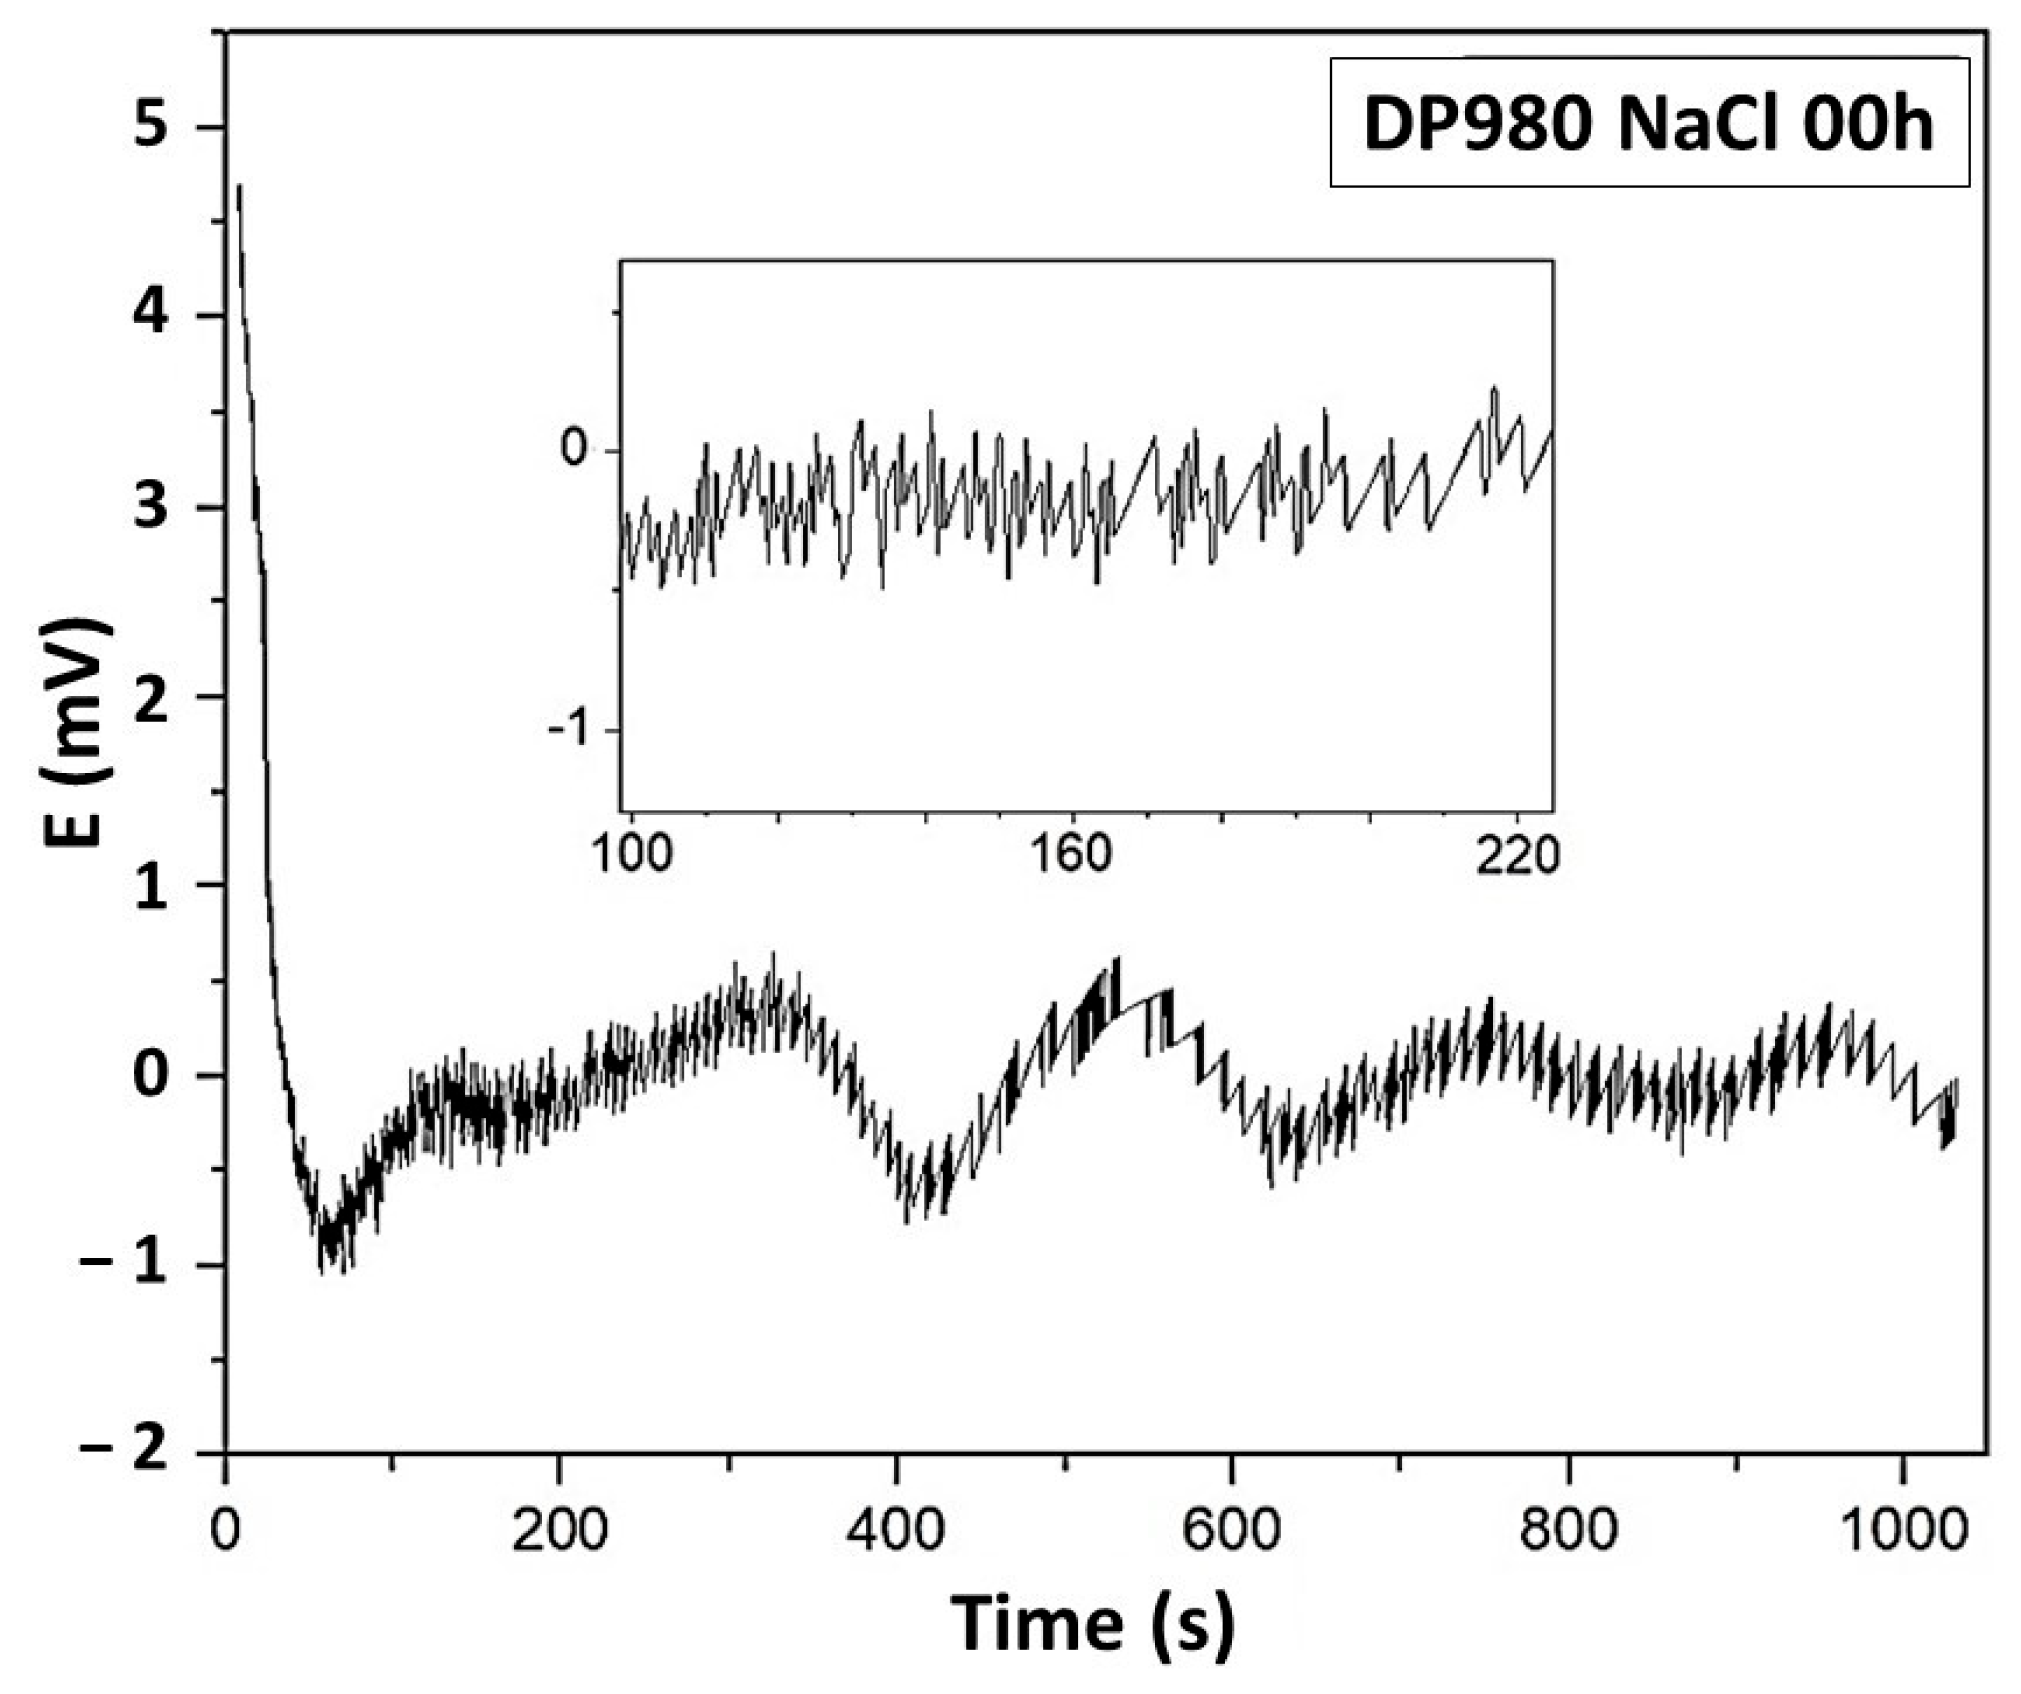
3.5. Electrochemical Noise Analysis

Figure 16 presents the electrochemical noise data obtained immediately after immersion (“00 h”) for various materials and solutions, specifically: (a) DP980 steel in 0.1 M Na2SO4 solution; (b) DP980 steel in 0.6M NaCl solution; (c) 6013-T4 aluminum alloy in 0.1 M Na2SO4 solution; (d) 6013-T4 aluminum alloy in 0.6M NaCl solution; (e) weld in 0.1 M Na2SO4 solution; and (f) weld in 0.6M NaCl solution.
The current noise curves (I) demonstrate distinct behaviors, evident both when changing the medium (from Na2SO4 to NaCl) for the same material and when transitioning between materials (DP steel, aluminum alloy, and weld). Regarding the change in medium for a given material, the NaCl solution consistently yields current profiles with higher amplitudes compared to tests conducted in the Na2SO4 medium. Figure 16 provides a detailed view of the current signal transients for the electrochemical noise (EN) test utilizing DP980 steel working electrodes.
Figure 17, exemplified at 00 h, reveals that transients in the NaCl medium exhibit significantly greater amplitude and higher frequency (more signals per unit time) compared to those in the Na2SO4 medium. Specifically, the NaCl medium’s signal amplitude exceeds that of the Na2SO4 medium by over 16 times. This transient arises from an intense charge transfer between the material and the electrolyte. The transient’s morphology is material-dependent, and its time-dependent characteristics correlate with the corrosion rate. Transients convey kinetic information about the system’s oxidation-reduction reactions, and energy distribution analysis offers mechanistic insights into the underlying physical processes, indicating the dominant corrosion mechanism and/or its evolution. Moreover, signal and transient comparisons between materials are indicative of corrosion intensity [49,50,51].
Detailed analysis of the transient in Figure 17a shows an abrupt decrease in instantaneous values followed by an exponential recovery, forming a distinct peak. This characteristic signal for carbon steel was previously documented by [49]. This phenomenon is termed metastable corrosion, which fundamentally underpins stable pit initiation and subsequent metallic surface degradation. Stable pit formation is often preceded by numerous metastable pits, with only a small fraction evolving into actual corrosion. The probability of stable pit formation is directly proportional to the intensity of the metastable pit, specifically the intensity of the transient current noise signal [49].
Mirroring the behavior observed in steel, the aluminum alloy also displays higher signal amplitudes in the NaCl medium, as depicted in Figure 18. While exhibiting a similar media-dependent trend to DP steel, the aluminum alloy possesses unique characteristics, including a more chaotic signal, as highlighted in Figure 18b. For aluminum, the current signal represents the differential between local electrode currents, which are influenced by anodic film passivation of the electrode surface, metal dissolution (pitting), and oxygen reduction [52].

3.5.1. DC Trend Removal

The removal of the DC trend was performed using MATLAB software and the Daubechies wavelet function with eight decompositions, as described in the methodology section of this work and by [53].
Figure 19 presents the graphs for the initial condition (00 h) with the DC trend removed from the current density measurements.
For both steel and aluminum alloy, the NaCl medium appears to be more corrosive. This is inferred from the higher frequency of signals and the greater amplitude of fluctuations observed in the detailed graphs in Figure 19, particularly when compared to the materials in the Na2SO4 medium. This correlation is due to the direct link between fluctuation intensity and corrosion rate. Visually, the signals from measurements involving the weld bead electrode seem less intense than those from the other materials. However, upon analyzing the fluctuation intensity, a significant difference is noted, especially for the NaCl medium, where transients with an intensity of 700 nA/cm2 are observed. This heightened intensity may be attributed to the synergism caused by the mixture of materials (iron + aluminum + intermetallics) and the microstructural differences resulting from laser welding.
Regarding potential noise, it typically fluctuates around the material’s corrosion potential. Table 5 displays the average corrosion potential obtained from measurements spanning 00 h to 72 h.
The potential curves also underwent the DC trend removal process. Following this process, both the current and potential noise signals fluctuate around a zero value. Figure 20 displays the potential noise graph for DP980 steel in NaCl medium at 00 h, after DC trend removal. Although other conditions also underwent the same trend removal process and exhibited a similar pattern of fluctuating around zero, they will not be presented.
Furthermore, while potential noise values are crucial for calculating noise resistance, they do not inherently convey physical information about corrosion in the same manner as current noise signals. In the latter, the intensity of the signals can be directly correlated with corrosion intensity, and the signal energy can be associated with the predominant type of corrosion.
Table 6 presents the electrochemical noise resistance of the materials in both Na2SO4 and NaCl media. It is evident that aluminum exhibits the highest corrosion resistance among the three materials tested. The weld bead, in terms of corrosion resistance as measured by the electrochemical noise technique, demonstrates a behavior similar to DP980 steel; however, in the NaCl medium, its resistance is marginally lower.
Another critical point for discussion pertains to the role of the chloride ion (Cl) in the corrosion of both steel and aluminum. Regarding steel, upon contact with an electrolyte, its surface also forms an oxide layer; however, this layer is not as stable as that formed on aluminum. Therefore, given a sufficient concentration of Cl to disrupt this oxide layer and adequate oxygen to sustain the oxidation-reduction reaction, a conducive environment for corrosion is established. Such conditions are met by the sufficient concentration of Cl provided by the NaCl solution and the oxygen supplied by the aqueous solution and ambient air, as the experimental cell is not hermetically sealed [54].
For the AA6013-T4 aluminum alloy, contact with an electrolyte typically leads to the formation of a protective oxide layer on its surface. This layer acts as a barrier, inhibiting further metal oxidation. However, in environments containing aggressive anions, such as chloride species (Cl), the passive film becomes unstable and degrades locally, initiating localized corrosion. This type of corrosion proceeds through two distinct stages: initiation and propagation [55].
One common form of localized corrosion is pitting corrosion. This process begins via mechanisms such as the penetration of Cl ions, which surround the electrolyte/metal interface, into the oxide layer, followed by adsorption and displacement of these ions, leading to local rupture of the passive layer. This interaction between the oxide layer and Cl ions is due to the inherent nature of the elements; specifically, for the AA6013-T4 aluminum alloy, the surface will exhibit a net positive charge, attracting anions in aqueous solutions with a pH below 9.5. This attractive force facilitates the facile movement of Cl to the oxide/solution interface, thereby providing ample opportunity for interaction with the passive film’s surface [55]. By concentrating at the interface, Cl ions cause a localized decrease in pH, promoting local corrosion. Consequently, the significant decrease in the noise resistance (RN) of aluminum in the NaCl medium can be attributed to the very nature of the material’s interaction with the specific medium to which it was exposed.
The pH and conductivity of the solution are important for comprehending the corrosion phenomena occurring within the medium. Therefore, the variation in these two measurements was monitored for experiments in both media. Table 7 presents the average values obtained, indicating that no significant changes occurred for either measurement. These measurements are crucial as they reflect the non-interference of these two parameters in the overall corrosion process. Throughout the entire measurement period, the solution’s conductivity remained virtually constant, meaning that the transport of species did not experience a specific gain or loss in ease of conduction. The pH, conversely, remained close to neutrality for both media. In summary, the nature of the local phenomena caused by chloride ions—as described above—provides the most compelling explanation for the observed corrosion phenomenon, particularly for the NaCl medium.

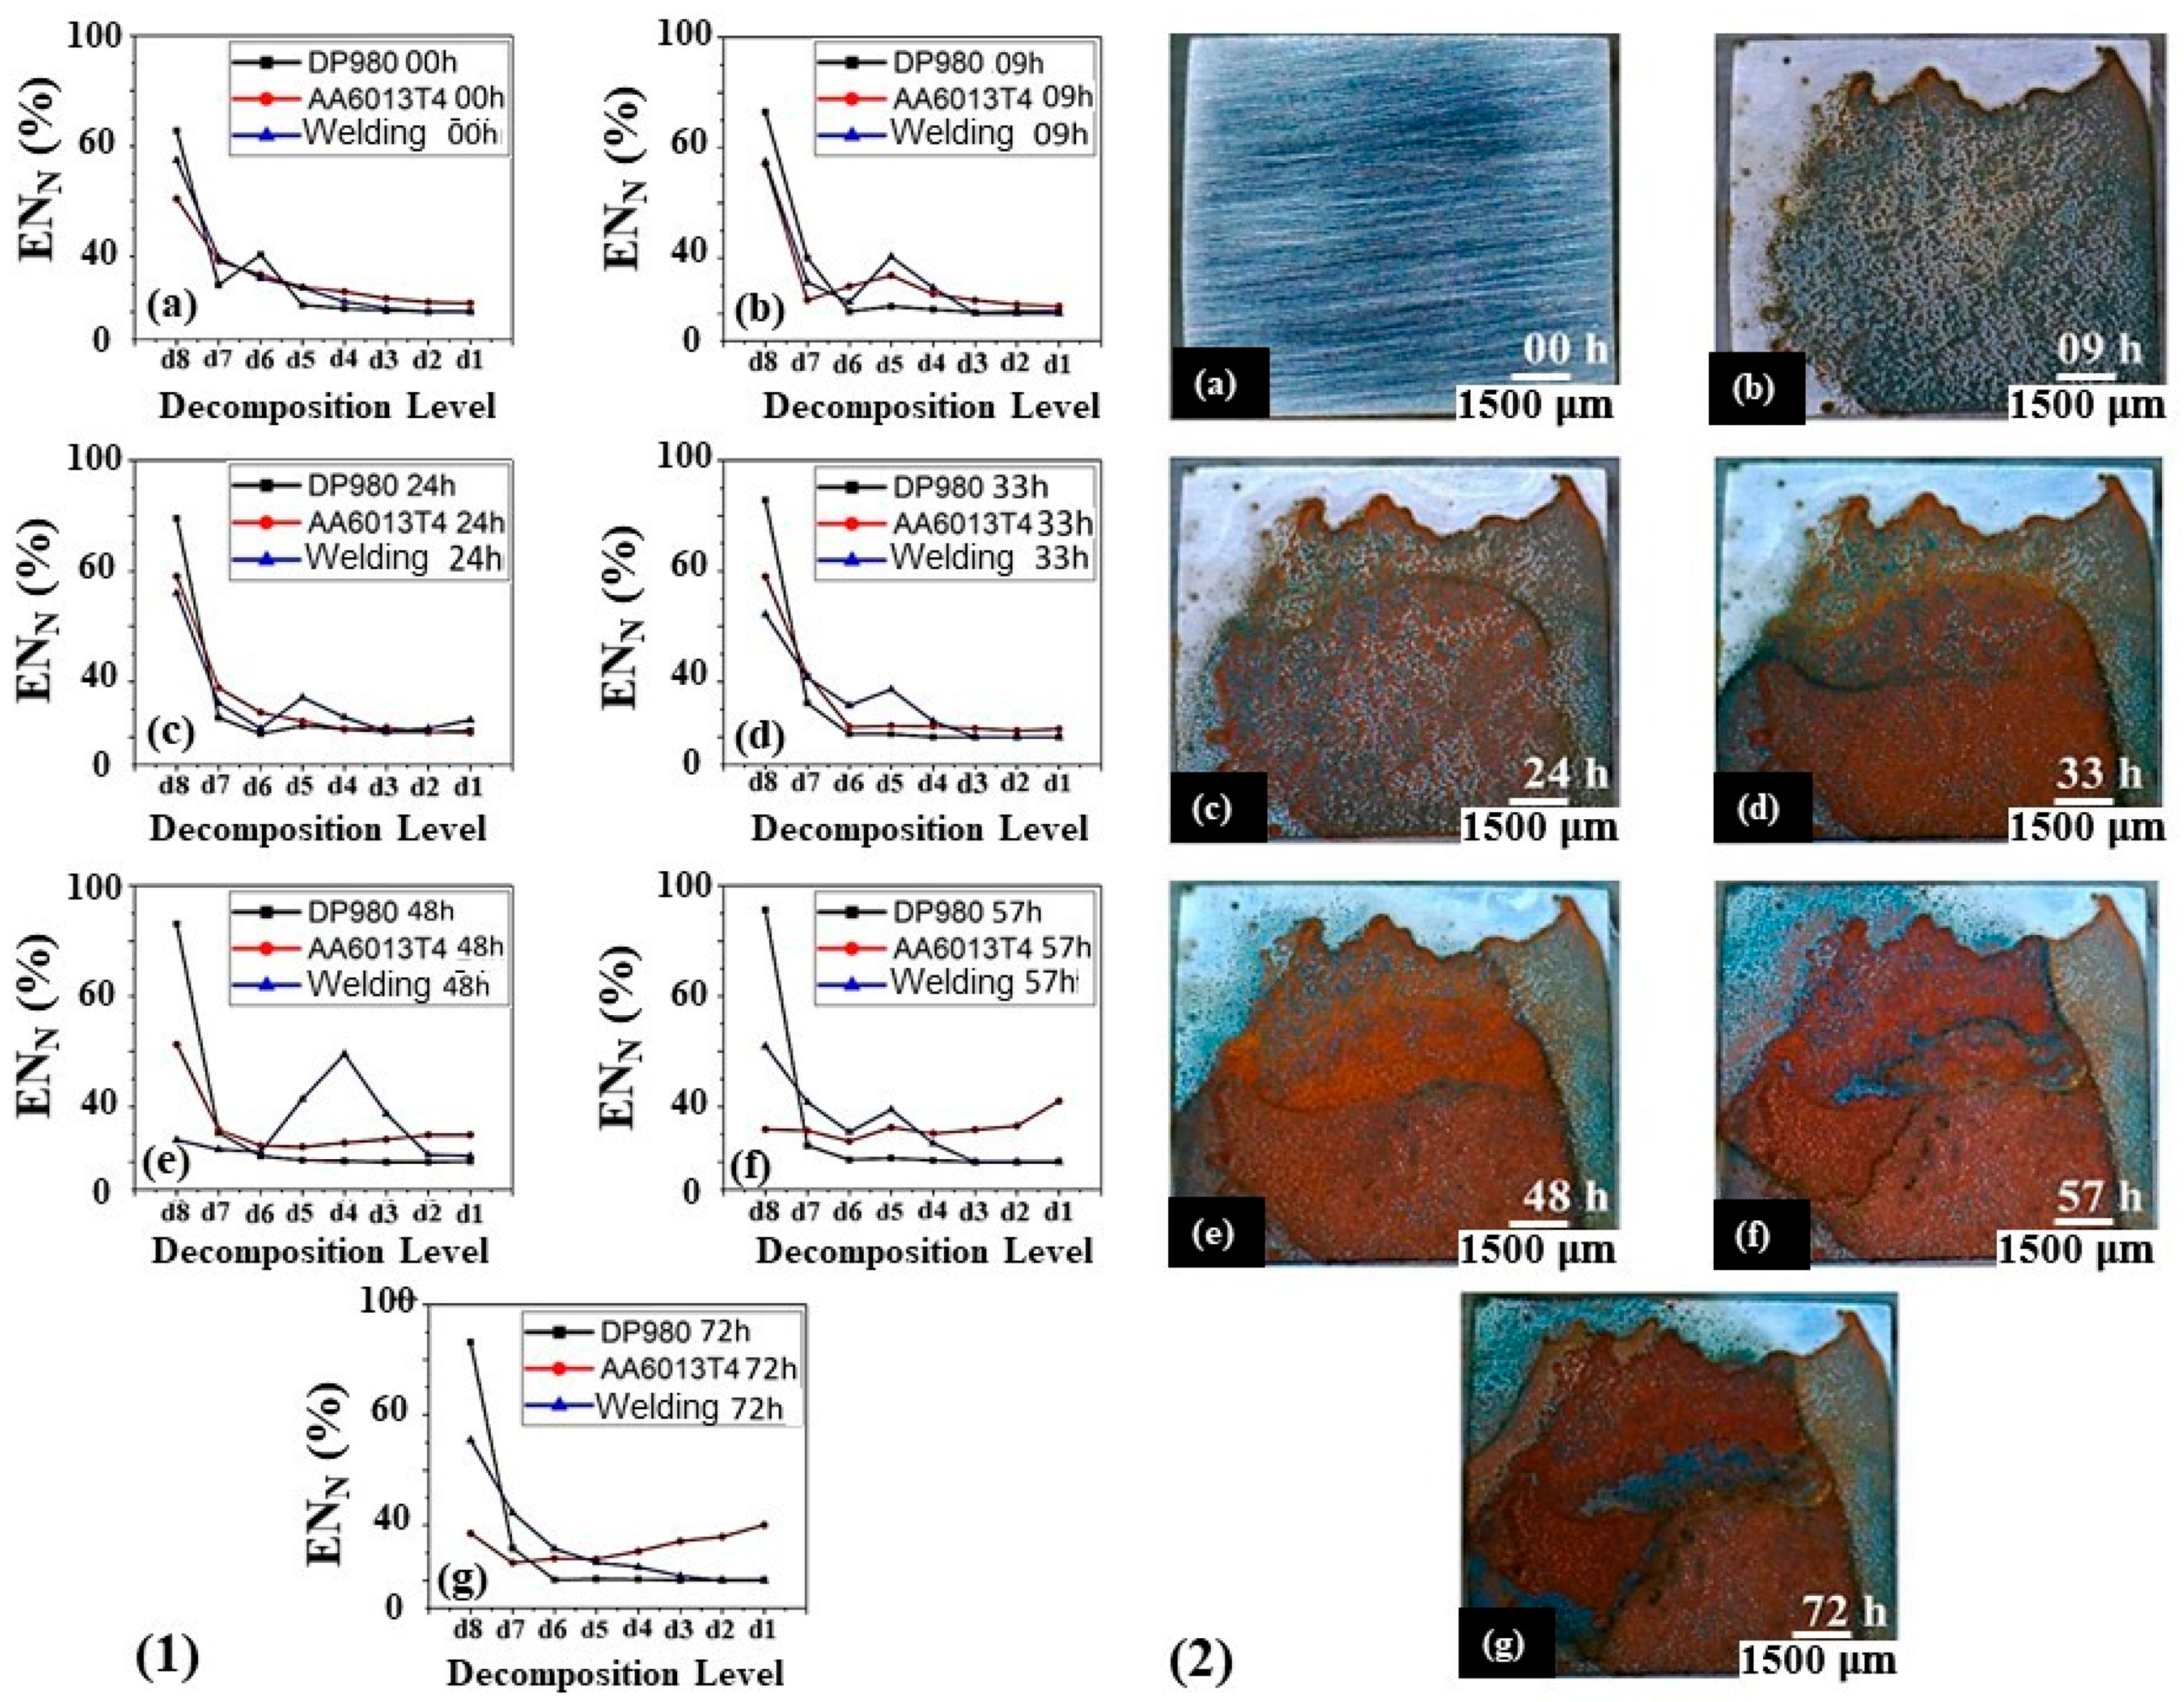
3.5.2. Power Diagrams

Figure 21(1) presents a comparison of the energy distribution diagrams obtained from wavelet analyses of the current noise for DP980 steel, AA6013-T4 alloy, and the weld, all in the Na2SO4 medium.
Regarding DP980 steel, the energy at 00 h reflects its corrosion behavior immediately upon contact with the electrolyte. In this initial measurement, nearly one hundred percent of the energy is concentrated in the d8, d6, and d7 crystals. Based on the literature and experimental observations, it can be stated that the corrosion process begins as soon as contact with the electrolyte is established, given the significant energy concentration in the d8 crystal. This likely indicates the occurrence of diffusion processes, specifically the diffusion of oxygen, which, as previously noted, is essential for the continuity of the corrosion process. Furthermore, this crystal may also signify localized corrosion, which is a natural occurrence early in the process, as micro-galvanic cells form immediately upon contact with the corrosive medium, leading to simultaneous corrosion in multiple locations. For subsequent time points, the DP980 steel maintains a pattern of higher energy located in the d8 crystal, followed by the d7 crystal, consistently indicating localized corrosion and the presence of an oxygen diffusion process. At 09, 24, and 57 h, a discrete accumulation of energy is observed in the d5 crystal, suggesting the possibility of mixed corrosion and pitting.
Figure 21(2) illustrates the DP980 steel electrode as the corrosion process evolves over time. The image at 00 h shows the electrode without any visible signs of corrosion, although, as indicated by the energy graphs, the corrosion process had already commenced. By the end of 72 h, the electrode is almost entirely corroded, yet the energy diagrams predominantly indicate localized corrosion (d8 crystal). The combined analysis of image 114 (presumably referencing a visual inspection, though the image itself is not provided in the text) and the energy diagrams demonstrate that corrosion initiates in a localized manner and subsequently spreads across nearly the entire metal surface. The discrete accumulation of energy in the d5 crystal, indicative of mixed corrosion, is also consistent with the visual analysis of the images. The hypothesis of localized corrosion is further supported by the observed corrosion points, primarily in the left region of the electrode; corrosion begins locally at these points and expands to cover the electrode’s entire length.
Figure 22(1) illustrates the evolution of corrosion over time for AA6013-T4 alloy electrodes in the Na2SO4 medium. As depicted, the alloy’s surface does not visibly corrode, similar to DP980 steel. This observation aligns with the corrosion resistance calculated using electrochemical noise. The alloy demonstrates high resistance and, as observed, appears to have undergone passivation, given the absence of visible corroded regions. Therefore, the consistent interpretation of the diagrams, in conjunction with the visual inspection of the images, supports the conclusion that the AA6013-T4 alloy has passivated.
For the electrode containing the weld bead, the d8 crystal generally exhibits the highest amount of accumulated energy. However, throughout the experiment, energy also accumulates in the d5 and d4 crystals, particularly at 48 h. Consequently, the energy diagrams indicate the presence of mixed corrosion and pitting in addition to localized corrosion. This becomes evident when observing the images of the electrode containing the weld bead over the test duration, as shown in Figure 22(2). The formation of more degraded regions is discernible, and as time progresses, the surface adopts a corroded appearance across its entirety. The increased energy distribution in levels d5 and d4 is particularly characterized at 09, 24, 33, 48, and 57 h, with the images revealing darker points and a surface increasingly covered by corrosion products, thus supporting the hypothesis of pitting and mixed corrosion.
Figure 23(1) presents a comparison of the energy distribution diagrams derived from wavelet analyses of the current noise for the DP980 steel, AA6013-T4 alloy, and weld in the NaCl medium. The corrosion behavior in this medium differs from that observed in the Na2SO4 medium. At 00 h, the highest accumulated energy is still in the d8 crystal. However, even at the outset, the d5 and d1 crystals draw attention by accumulating a significant, visibly discernible, level of energy. As previously established, the d8 crystal relates to localized corrosion and oxygen diffusion. In contrast, the d5 and d1 crystals may indicate, upon initial contact between the electrolyte and the metal surface, the formation of metastable and “stable” pits, their propagation, and mixed corrosion. At 09 and 33 h, significant energy remains concentrated in d8 and in d1 to d3, predominantly in d1. From 48 h onward, practically all energy accumulates in d8.
Figure 23(2) presents images depicting the corrosion of the DP980 steel electrode over time. It can be observed that at 9 and 24 h, localized corrosion is evident. Subsequently, after 48 h, the electrode begins to corrode in widespread areas until it is almost entirely covered at 72 h. The phenomenon observed at 9 and 24 h, consistent in both the energy diagrams and the images, underscores the sensitivity of the technique. When analyzing the entire dataset, it becomes plausible to hypothesize that, in a NaCl environment, the steel initially undergoes localized corrosion in the form of pits. Over time, these pits propagate, and localized corrosion extends across sectors until the surface is completely covered.
Figure 24(1) displays macrographs of the electrode fabricated from the AA6013-T4 alloy across the seven electrochemical noise measurements. Analysis of these images reveals the appearance of corrosion spots, a phenomenon not observed in the Na2SO4 medium. This finding aligns with the lower electrochemical noise resistance recorded for this alloy in the NaCl medium compared to the Na2SO4 medium, indicating a greater propensity for corrosion. At the conclusion of the process, localized corrosion is observed on the electrode’s periphery and in some central spots. This suggests that the most coherent interpretation of the energy diagrams points towards localized corrosion and pitting formation.
Figure 24(2) illustrates the behavior of the most energetic crystals during the evolution of corrosion on the surface of the electrode containing the weld bead. Initially, there is a tendency for localized corrosion to form, indicated by two degraded circular areas in the upper left corner. Over time, the entire surface of the electrode in the image becomes covered by corrosion products, suggesting generalized or mixed corrosion. This is supported by the increasing degradation in the circular areas and, notably, in the lower region of the electrode, the appearance of small brown spots over time. These spots may represent pitting, which justifies the high energy observed in d8 and the signal’s tendency to indicate localized and mixed corrosion, in addition to the presence and growth of pits.
A notable observation arising from the experimental results pertains to the weld bead region. As previously discussed in the metallography and hardness section, the Fusion Zone (FZ) contains a mixture of steel and aluminum, leading to the formation of Fe-Al alloys, intermetallics (identified via XRD), and pure aluminum. The latter has been indicated as responsible for the decrease in the material’s hardness within the weld. It was also observed that welding generates a multiphase microstructure within the heat-affected zone (HAZ), comprising at least three distinct regions between the beam-affected FZ and the Base Metal. During the corrosion monitoring of the electrodes, the weld bead region, depicted in Figure 25, presented a noteworthy observation.
Figure 25 illustrates that despite the entire region exhibiting corrosion products, the weld bead itself remains distinctly delineated and appears to possess a less deteriorated surface when compared to the adjacent lateral regions. Thus, based on the microstructural and corrosion analyses, it can be inferred that aluminum not only contributes to the reduction in FZ hardness through its mixture with steel to form a type of new alloy, but also imparts a degree of corrosion resistance to the molten region. The potential galvanic couple responsible for electrode corrosion appears to be established not between the constituent materials within the FZ, but rather between the FZ itself and the HAZ. As indicated by the image, the HAZ ultimately experiences more significant corrosion, suggesting that the FZ primarily functions as a cathode while the HAZ acts as an anode for the majority of the time.

4. Conclusions

Based on the obtained results, it is concluded that the dissimilar laser-welded joint, composed of 6013-T4 aluminum alloy and DP980 steel, was comprehensively evaluated concerning its morphology, Vickers hardness, corrosion resistance, and corrosion mode.
Utilizing specific parameters of 900 W power, 25 mm/s welding speed, and a focal distance of 2.4 mm below the incidence surface for overlapped sheets with 1.2 mm thickness achieved optimal penetration. Specifically, the laser beam successfully traversed the DP steel sheet and penetrated 560 µm into the aluminum sheet without exhibiting defects such as cracks, fusion zone shrinkage, or pores.
Microstructural analysis revealed the presence of five distinct regions with differing structures after welding. These include the Base Metal (DP980 steel), a Transition Zone (TZ) characterized by observed grain growth and a lower measured Vickers hardness of 274 HV0.2, and a Refined Zone (RZ) which may present a multiphase constitution. Additionally, a Martensitic Zone (MZ) exhibited the highest hardness (426 HV0.2) due to martensitic formation, and a Fusion Zone (FZ) was identified where the steel and aluminum alloy were mixed. The mixing in the FZ was confirmed by energy-dispersive spectroscopy, and the presence of intermetallic compounds such as AlFe, AlFe3, and Al13Fe4 was identified through the refinement of diffraction patterns obtained from X-ray diffraction analysis.
In the evaluation of corrosion resistance, the application of the wavelet function proved to be a powerful tool for both signal detrending and the subsequent energy analysis.
The 6013-T4 aluminum alloy consistently demonstrated the highest corrosion resistance in both analyzed environments (0.1 M Na2SO4 and 3.5% NaCl). Notably, the corrosion resistance of the welded region showed no statistically significant differences when compared to DP980 steel, indicating that the laser welding process has minimal impact on this particular property.
Finally, the energy diagrams, in conjunction with the microscopic analysis, revealed the passivation of the aluminum alloy and the presence of both localized and generalized corrosion across all materials in both environments. Microscopic analysis further indicated a propensity for corrosion to occur preferentially around the weld bead, a phenomenon likely attributable to the influence of aluminum present within the fusion zone, which may have ennobled that specific region.

Author Contributions

Conceptualization, A.F.N., E.X.D., F.H.C.F., C.S.F., A.J.A. and M.d.S.P.; Methodology, A.F.N., E.X.D., F.H.C.F., C.S.F., M.S.M., A.J.A. and M.d.S.P.; Software, A.F.N. and M.S.M.; Validation, A.F.N., F.H.C.F., E.S.G., M.S.M., A.J.A. and M.d.S.P.; Formal analysis, A.F.N., E.X.D., F.H.C.F., C.S.F., E.S.G., M.S.M., A.J.A. and M.d.S.P., Investigation, A.F.N., F.H.C.F. and C.S.F.; Resources, A.F.N.; Data curation, A.F.N.; Writing—original draft, A.F.N., E.X.D. and E.S.G.; Writing—review & editing, A.F.N. and E.X.D.; Visualization, A.J.A. and M.d.S.P.; Supervision, A.J.A. and M.d.S.P.; Project administration, A.J.A. and M.d.S.P.; Funding acquisition, A.J.A. and M.d.S.P. All authors have read and agreed to the published version of the manuscript.

Funding

This study was financed in part by the Coordenação de Aperfeiçoamento de Pessoal de Nível Superior-Brasil (CAPES)-Finance Code 001. The APC was funded by UNESP.

Data Availability Statement

The original contributions presented in the study are included in the article; further inquiries can be directed to the corresponding author.

Acknowledgments

The authors would like to thank UNESP and CAPES for the financial support.

Conflicts of Interest

The authors declare no conflicts of interest.

References

  1. Marra, K.M. Aços Dual Phase da Usiminas: Características e Potencial de Aplicação em Veículos Automotores. In Proceedings of the Congresso Anual da ABM, São Paulo, Brazil, 31 July–3 August 2008; Volume 63, p. 2. [Google Scholar]
  2. Faria Neto, A.R.; Dias, E.X.; Fukugauchi, C.S.; Martins, M.S.; Pereira, M.S. Mechanical and microstructural characterization of class 800 complex phase steel before and after the laser welding process. J. Manuf. Mater. Process. 2024, 8, 232. [Google Scholar]
  3. Faria Neto, A.R.; Fukugauchi, C.S.; Pereira, M.S. Using design of experiments in the evaluation of the microstructural characterization parameters with the LePera reagent in a multiphase steel. Mater. Res. Express 2019, 8, 15. [Google Scholar]
  4. Kishida, K. High Strength Steel Sheets for Light Weight Vehicle; Nippon Steel technical Report; Nippon Steel Corporation: Tokyo, Japan, 2000; Volume 81, pp. 12–16. [Google Scholar]
  5. DIAS, E.X.; Faria Neto, A.R.; Castro, T.S.; Martins, M.S.; Pereira, M.S. Laser Welding Applied to Complex Phase Steel; SAE Technical Paper; SAE: Warrendale, PA, USA, 2024. [Google Scholar]
  6. Sebastiany, Y.; Faria, A.R.; Martins, M.S.; Barkey, M. Isothermal Fatigue Characterization of P91 Steel Under Load Control. Mater. Res. 2025, 28, e20250129. [Google Scholar]
  7. Cao, W.; Shi, J.; Wang, C.; Wang, C.; Xu, L.; Wang, M.; Weng, Y.; Dong, H. The 3rd generation automobile sheet steels presenting with ultrahigh strength and high ductility. In Advanced Steel—The Recent Scenario in Steel Science and Technology, 1st ed.; Weng, Y., Dong, H., Gan, Y., Eds.; Springer: Beijing, China, 2011; Volume 22, pp. 209–227. [Google Scholar]
  8. Dong, H.; Sun, X.; Cao, W.; Liu, Z.; Wang, M.; Weng, Y. On the performance improvement of steels through M3 structure control. In Advanced Steel: The Recent Scenario in Steel Science and Technology, 1st ed.; Weng, Y., Dong, H., Gan, Y., Eds.; Springer: Beijing, China, 2011; Volume 6, pp. 35–57. [Google Scholar]
  9. Han, H.N.; Oh, C.S.; Kim, G.; Kwon, O. Design method for TRIP-aided steel based on a microstructure-based modelling for transformation-induced plasticity and mechanically induced martensitic transformation. Mater. Sci. Eng. A 2009, 499, 462–468. [Google Scholar]
  10. Matlock, D.K.; Speer, J.G.; De Moor, E.; Gibbs, P.J. Recent developments in advanced high strength sheet steels for automotive applications: An overview. Jestech 2012, 15, 1–12. [Google Scholar]
  11. Radwański, K.; Wrożyna, A.; Kuziak, R. Role of the advanced microstructures characterization in modeling of mechanical properties of AHSS steels. Mater. Sci. Eng. A 2015, 639, 567–574. [Google Scholar]
  12. Sun, S.; Pugh, M. Properties of thermomechanically processed dual-phase steels containing fibrous martensite. Mater. Sci. Eng. A 2002, 335, 298–308. [Google Scholar]
  13. Silva, E.A. Study of the Correlation Between Work Hardening Models and Crystallographic Characteristics in Advanced High-Strength Steels Subjected to the Springback Effect. Ph.D. Thesis, Paulista State University, Guaratinguetá, Brazil, 2016. [Google Scholar]
  14. Fukugauchi, C.S.; Faria Neto, A.R.; Ribeiro, R.B.; Pereira, M.S. Microstructural characterization of dual and multiphase steels applied to automotive industry. Mater. Sci. Forum 2014, 775–776, 146–150. [Google Scholar]
  15. Cheng, N.; Yang, S.; Li, Y.; Zhao, X.; Bi, J.; Tian, J. Analysis of fatigue fracture mechanism of laser spiral welding of dissimilar metals of 6082 high strength aluminum alloy and DP980 high strength dual phase steel. Mater. Today Commun. 2024, 41, 110665. [Google Scholar]
  16. Dong, W.; Zhang, Y.; Bao, L.; Shin, K. Effects of laser scanning strategy on bending behavior and microstructure of DP980 steel. Materials 2024, 17, 2415. [Google Scholar] [PubMed]
  17. Liu, H.; Wang, Y.; Zhang, J.; Zhu, Z.; Yang, S. Effect of laser spot offset on microstructure and properties of laser welded joint of medium Mn/DP980 dissimilar steel. Mater. Lett. 2024, 363, 136331. [Google Scholar]
  18. Pan, H.; Ya, X.; Yu, W.; Tao, W.; Zhang, S.; Zhou, W. The Effect of Laser Power on Microstructure and Mechanical Properties between Medium Mn Steel and DP980 Joint by Laser Welding. J. Mater. Eng. Perform. 2024, 34, 10568–10576. [Google Scholar]
  19. Djukanovic, G. European aluminium recycling industry improves. Alum. Int. Today 2016, 28, 28. [Google Scholar]
  20. Derbiszewski, B.; Obraniak, A.; Rylski, A.; Siczek, K.; Wozniak, M. Studies on the quality of joints and phenomena therein for welded automotive components made of aluminum alloy—A review. Coatings 2024, 14, 601. [Google Scholar] [CrossRef]
  21. Zadpoor, A.A.; Sinke, J.; Benedictus, R. Mechanics of tailor welded blanks: An overview. Key Eng. Mater. 2007, 344, 373–382. [Google Scholar]
  22. Shakeri, H.R.; Buste, A.; Worswick, M.J.; Clarke, J.A. Study of damage initiation and fracture in aluminum tailor welded blanks made via different welding techniques. J. Light Met. 2002, 2, 95–110. [Google Scholar]
  23. Rahman, A.B.M.M.; Kumar, S.; Gerson, A.R. Galvanic corrosion of laser weldments of AA6061 aluminium alloy. Corros. Sci. 2007, 49, 4339–4351. [Google Scholar]
  24. Usiminas. Cold Rolled. Available online: https://www.usiminas.com/en/pages/markets-and-products/cold-rolled/ (accessed on 23 March 2025).
  25. The Aluminum Association. International Alloy Designations and Chemical Composition Limits for Wrought Aluminum and Wrought Aluminum Alloys, 2nd ed.; The Aluminum Association: Arlington, TX, USA, 2015. [Google Scholar]
  26. Siqueira, R.H.M. Mechanical and Microstructural Characterization of Laser Welded 6013 T4 Aluminum Joints. Master’s Thesis, Paulista State University, Guaratinguetá, Brazil, 2012. [Google Scholar]
  27. ASTM E 3-11; Standard Guide for Preparation of Metallographic Specimens. American Society for Testing and Materials: Conshohocken, PA, USA, 2017.
  28. ASTM E 384; Standard Test Method for Microindentation Hardness of Materials. American Society for Testing and Materials: Conshohocken, PA, USA, 2017.
  29. Çam, G.; Koçak, M. Progress in joining of advanced materials. Int. Mater. Rev. 1998, 43, 1–44. [Google Scholar]
  30. Cao, X.; Wallace, W.; Poon, C.; Immarigeon, J.P. Research and progress in laser welding of wrought aluminum alloys. I. Laser welding processes. Mater. Manuf. Process. 2003, 18, 23–49. [Google Scholar]
  31. Kou, S. Solidification and liquation cracking issues in welding. JOM 2003, 55, 37–42. [Google Scholar]
  32. Cui, X.; Chen, B.; Chen, B.; He, D. Dual beam laser keyhole welding of steel/aluminum lapped joints. J. Mater. Process. Technol. 2018, 256, 87–97. [Google Scholar]
  33. Qi, Y.; Song, G. Interfacial structure of the joints between magnesium alloy and mild steel with nickel as interlayer by hybrid laser-TIG welding. Mater. Des. 2010, 31, 605–609. [Google Scholar]
  34. Wei, Y.H.; Dong, Z.B.; Liu, R.P.; Dong, Z.J. Three-dimensional numerical simulation of weld solidification cracking. Model. Simul. Mater. Sci. Eng. 2005, 13, 437. [Google Scholar]
  35. Wang, X.; Lu, F.; Wang, H.P.; Cui, H.; Tang, X.; Wu, Y. Mechanical constraint intensity effects on solidification cracking during laser welding of aluminum alloys. J. Mater. Process. Technol. 2015, 218, 62–70. [Google Scholar]
  36. Calliste, W.D., Jr.; Rethwisch, D.G. Materials Science and Engineering an Introduction, 6th ed.; John Wiley & Sons: New York, NY, USA, 2003. [Google Scholar]
  37. Dawes, C.T. Laser Welding: A Practical Guide; Woodhead Publishing: Cambridge, UK, 1992. [Google Scholar]
  38. Walsh, C.A. Laser Welding–Literature Review. Available online: https://www.phase-trans.msm.cam.ac.uk/ (accessed on 7 July 2025).
  39. Matsunawa, A. Defects formation mechanisms in laser welding and their suppression methods. In Proceedings of the International Congress on Applications of Lasers & Electro-Optics, Orlando, FL, USA, 17–20 October 1994; Laser Institute of America: Orlando, FL, USA, 1994; pp. 203–209. [Google Scholar]
  40. Freitas, F.H.C. Study of the Influence of Laser Welding Parameters on Overlapping Joints of DP980 and TRIP780 Steels Using Statistical Tools. Ph.D. Thesis, Paulista State University, Guaratinguetá, Brazil, 2022. [Google Scholar]
  41. Taylor, M.D.; Choi, K.S.; Sun, X.; Matlock, D.K.; Packard, C.E.; Xu, L.; Barlat, F. Correlations between nanoindentation hardness and macroscopic mechanical properties in DP980 steels. Mater. Sci. Eng. A 2014, 597, 431–439. [Google Scholar]
  42. He, H.; Forouzan, F.; Volpp, L.; Robertson, S.M.; Vuorinen, E. Microstructure and mechanical properties of laser-welded DP steels used in the automotive industry. Materials 2021, 14, 456. [Google Scholar]
  43. Ordoñez, J.H.; Ambriz, R.R.; García, C.; Plascencia, G.; Jaramillo, D. Overloading effect on the fatigue strength in resistance spot welding joints of a DP980 steel. Int. J. Fatigue 2019, 121, 163–171. [Google Scholar]
  44. Xia, M.; Sreenivasan, N.; Lawson, S.; Zhou, Y.; Tian, Z. A comparative study of formability of diode laser welds in DP980 and HSLA steels. J. Eng. Mater. Technol. 2007, 129, 446–452. [Google Scholar]
  45. Atílio, I.; Braga, V.; de Siqueira, R.H.M.; de Carvalho, S.M.; de Lima, M.S.F. Comparing the weldability of AA6013-T4 aluminium alloy on DP600 dual-phase steel with laser welding and resistance spot welding. J. Braz. Soc. Mech. Sci. 2020, 42, 71. [Google Scholar]
  46. Indhu, R.; Divya, S.; Tak, M.; Soundarapandian, S. Microstructure development in pulsed laser welding of dual phase steel to aluminium alloy. Procedia Manuf. 2018, 26, 495–502. [Google Scholar]
  47. Tian, L.I.; Yan, Y.; Ping, P.; Liu, J. First-principles and experimental investigations on ductility/brittleness of intermetallic compounds and joint properties in steel/aluminum laser welding. Trans. Nonferrous Met. Soc. China 2021, 31, 2962–2977. [Google Scholar]
  48. Dinda, S.K.; Jana, S.; Roy, G.G.; Srirangam, P. Effect of beam oscillation on porosity and intermetallics of electron beam welded DP600-steel to Al 5754-alloy. J. Mater. Process. Technol. 2019, 265, 191–200. [Google Scholar]
  49. Smulko, J. Methods of electrochemical noise analysis for investigation of corrosion processes. FNL 2006, 6, R1–R9. [Google Scholar]
  50. Rios, E.C.; Zimer, A.M.; Pereira, E.C.; Mascaro, L.H. Analysis of AISI 1020 steel corrosion in seawater by coupling electrochemical noise and optical microscopy. Electrochim. Acta 2014, 124, 211–217. [Google Scholar]
  51. Xia, D.H.; Song, S.Z.; Behnamian, Y. Detection of corrosion degradation using electrochemical noise (EN): Review of signal processing methods for identifying corrosion forms. Corros. Eng. Sci. Technol. 2016, 51, 527–544. [Google Scholar]
  52. Sasaki, K.; Isaacs, H.S. Origins of electrochemical noise during pitting corrosion of aluminum. J. Electrochem. Soc. 2004, 151, B124. [Google Scholar]
  53. De Faria Neto, A.R.; Souza, A.N.; Passos, R.R.; Pereira, M.S.; Pocrifka, L.A.; Brambilla de Souza, R.F.; Rios, E.C. Evaluation of Paullinia Cupana as a green corrosion inhibitor for carbon steel utilizing gravimetric and electrochemical noise techniques. Mater. Res. Express 2019, 6, 076522. [Google Scholar]
  54. Elfergani, H.; Abdalla, A. Effect of Chloride Concentration on the Corrosion Rate in Carbon Steel. In Proceedings of the 2nd Libyan Conference on Chemistry and its Applications, Benghazi, Libya, 9–11 May 2017. [Google Scholar]
  55. Natishan, P.M.; O’grady, W.E. Chloride ion interactions with oxide-covered aluminum leading to pitting corrosion: A review. J. Electrochem. Soc. 2014, 161, C421. [Google Scholar]
Figure 1. Diagram demonstrating the complexity of dissimilar welded joints with respect to the corrosion mechanism.
Jmmp 09 00237 g001
Figure 2. Flowchart showing the steps performed.
Jmmp 09 00237 g002
Figure 3. (a) Representative drawing of the welding method between DP980 steel and 6013-T4 aluminum; (b) focus used in the welding process.
Jmmp 09 00237 g003
Figure 4. (a) Illustration of the electrochemical cell used in electrochemical noise tests with two working electrodes and one reference electrode. (b) Samples used in noise measurements.
Jmmp 09 00237 g004
Figure 5. Laser welding results analyzed from the cross-section of the welded sheets.
Jmmp 09 00237 g005
Figure 6. Detail of the transverse region of the weld bead showing a solidification crack in the fusion zone of the 6013 T4 aluminum. Magnification 20×.
Jmmp 09 00237 g006
Figure 7. Detail of the transverse region of the weld bead showing the cavities formed in experiments 1 and 2 after welding. 20× magnification.
Jmmp 09 00237 g007
Figure 8. Detail of the cross-sectional region of the weld bead showing the pores formed after welding in experiment 4 and also the lack of weld penetration in the 6013 T4 aluminum alloy. 20× magnification.
Jmmp 09 00237 g008
Figure 9. (a) Cross-section of the sample from experiment 5: DP980 steel laser-welded with AA6013-T4 alloy; power of 900 W, speed of 25 mm/s and focal length of 2.4 mm. Magnification of 6.5×. (b) Characterization of the dimensions of the laser weld bead. Magnification of 32×. (c) Division of the laser weld bead cross-section into five sectors: the Transition Zone (TZ); Refined Zone (RZ) and Martensitic Zone (MZ), in addition to the Base Metal (MB) and Molten Zone (FZ). Magnification of 100×.
Jmmp 09 00237 g009
Figure 10. Diagram showing the microstructures subdivided into sectors: Base Metal at 500× magnification; Transition Zone at 500× magnification; Refined Zone at 500× magnification; Martensitic Zone at 500× magnification; and Molten Zone at 200 and 500× magnifications.
Jmmp 09 00237 g010
Figure 11. The Figure shows the data on the Vickers microhardness profile performed on the cross section of the weld bead using microindentation. In image (a) a cross section can be seen showing the weld microstructure and the lines where the microhardness test was performed. In image (b) the graphs show the variation of the microhardness in each line in the cross section of the welded region.
Jmmp 09 00237 g011
Figure 12. Average HV0.2 measurements positioned in the regions of the heat-affected zone where they were analyzed.
Jmmp 09 00237 g012
Figure 13. Maps for the iron (Fe in red color) and aluminum (Al in yellow color) elements present in the region comprising the weld bead and the AA6013-T4 alloy, after longitudinal cutting of the laser weld bead of the DP980 steel and AA6013-T4 alloy joint.
Jmmp 09 00237 g013
Figure 14. Diffractograms of the analyses performed for (a) DP980 steel; (b) AA6013-T4 alloy; (c) weld bead in the steel region; and (d) weld bead in the AA6013-T4 alloy region.
Jmmp 09 00237 g014
Figure 15. The corresponding intermetallics on the peaks of the diffractograms of the weld bead of the steel and aluminum parts, respectively.
Jmmp 09 00237 g015
Figure 16. EN curves of current density (black color nA/cm2) and potential (blue color mV vs. Ag|AgCl, KCl (sat)), for the first measurement (time of 00 h) for each evaluated condition: (a) DP980 steel in Na2SO4 solution (0.1 M); (b) DP steel in NaCl solution (0.6 M); (c) aluminum alloy 6013-T4 in Na2SO4 solution (0.1 M); (d) aluminum alloy 6013-T4 in NaCl solution (0.6 M); (e) weld in Na2SO4 solution (0.1 M); and (f) weld in NaCl solution (0.6 M).
Jmmp 09 00237 g016
Figure 17. Current noise curves for DP980 steel in (a) Na2SO4 (0.1 M) and (b) NaCl (0.6 M) media for time 00 h showing the details of the transients of the curves.
Jmmp 09 00237 g017
Figure 18. Current noise curves for aluminum alloy 6013 T4 in (a) Na2SO4 (0.1 M) and (b) NaCl (0.6 M) media for time 00 h showing the details of the transients of the curves.
Jmmp 09 00237 g018
Figure 19. Current density EN curves (nab/cm2), for the first measurement (time of 00 h) for each condition evaluated without the DC trend after removing the DC trend using the wavelet function. (a) DP980 steel in Na2SO4 solution (0.1 M); (b) steel in NaCl solution (0.6 M); (c) aluminum alloy 6013-T4 in Na2SO4 solution (0.1 M); (d) aluminum alloy 6013-T4 in NaCl solution (0.6 M); (e) weld in Na2SO4 solution (0.1 M); and (f) weld in NaCl solution (0.6 M).
Jmmp 09 00237 g019
Figure 20. Current density EN curves (nA/cm2), for the first measurement (time of 00 h) for each condition evaluated without DC bias after removing the DC trend using the wavelet function.
Jmmp 09 00237 g020
Figure 21. (1). Energy distribution diagrams: comparison between DP980 steel, AA6013-T4 alloy and welding for Na2SO4 medium. (a) 00 h; (b) 09 h; (c) 24 h; (d) 33 h; (e) 48 h; (f) 57 h; and (g) 72 h. (2). Monitoring of corrosion on electrodes in Na2SO4 medium for DP980 steel. (a) 00 h; (b) 09 h; (c) 24 h; (d) 33 h; (e) 48 h; (f) 57 h; and (g) 72 h.
Jmmp 09 00237 g021
Figure 22. (1) Monitoring of corrosion on electrodes in Na2SO4 medium for AA 6013-T4 alloy. (a) 00 h; (b) 09 h; (c) 24 h; (d) 33 h; (e) 48 h; (f) 57 h; and (g) 72 h. (2) Monitoring of corrosion on electrodes in Na2SO4 medium for welding. (a) 00 h; (b) 09 h; (c) 24 h; (d) 33 h; (e) 48 h; (f) 57 h; and (g) 72 h.
Jmmp 09 00237 g022
Figure 23. (1) Energy distribution diagrams: comparison between DP980 steel, AA6013-T4 alloy and welding for NaCl medium. (a) 00 h; (b) 09 h; (c) 24 h; (d) 33 h; (e) 48 h; (f) 57 h; and (g) 72 h. (2) Monitoring of corrosion on electrodes in NaCl medium for DP980 steel. (a) 00 h; (b) 09 h; (c) 24 h; (d) 33 h; (e) 48 h; (f) 57 h; and (g) 72 h.
Jmmp 09 00237 g023
Figure 24. (1) Monitoring of corrosion on electrodes in NaCl medium for AA013-T4 alloy. (a) 00 h; (b) 09 h; (c) 24 h; (d) 33 h; (e) 48 h; (f) 57 h; and (g) 72 h. (2) Monitoring of corrosion on electrodes in NaCl medium for welding. (a) 00 h; (b) 09 h; (c) 24 h; (d) 33 h; (e) 48 h; (f) 57 h; and (g) 72 h.
Jmmp 09 00237 g024
Figure 25. Corrosion on the weld bead during corrosion monitoring for the NaCl medium (a) 33 h 25× magnification; (b) 72 h 25× magnification.
Jmmp 09 00237 g025
Table 1. Chemical composition of materials used (% by weight).
Alloy ElementDP980
Standard
DP980
Measured
A6013-T4
Standard
A6013-T4
Measured
Carbon (C)0.23 máx0.23-0.8
Silicon (Si)2.00 máx0.420.60–1.000.37
Manganese (Mn)3.30 máx2.190.10–0.600.04
Phosphorus (P)0.09 máx0.01-0.92
Sulfur (S)0.04 máx0.01-0.88
Chromium (Cr)--0.10.01
Magnesium (Mg)--0.80–1.200.03
Copper (Cu)-0.030.60–1.100.26
Titanium (Ti)-0.030.196.66
Zinc (Zn)--0.25–0.300.01
Iron (Fe)Balance97.02Balance0.01
Aluminum (Al)-0.05--
Nickel (Ni)-0.04--
Vanadium (V)----
Refs. [24,25].
Table 2. Mechanical properties of the materials used.
MaterialResistance Limit
(MPa)
Yield Limit
(MPa)
Stretching
(%)
DP980 (T)980 mín550–7308 mín (L0 = 80 mm)
6013–T432518524
Refs. [24,25].
Table 3. Parameters tested in the exploratory study to define the best welding condition.
ExperimentPower
(W)
Welding v.
(mm/s)
Laser Focus
Sample 1130050Steel Surface (0 mm)
Sample 21300502.4 mm (alloy surface Al)
Sample 31000252.4 mm (alloy surface Al)
Sample 4800252.4 mm (alloy surface Al)
Sample 5900252.4 mm (alloy surface Al)
Table 4. Summary of parameters adopted in electrochemical noise experiments.
ExperimentWorking ElectrodeSolutionTimeMeasurements
1Steel DP980Na2SO4 0.1 M1024 s00, 09, 24, 33, 48, 57 e 72 h
2Steel DP980NaCl 3.5% (0.6 M)1024 s00, 09, 24, 33, 48, 57 e 72 h
3Aluminum 6013-T4Na2SO4 0.1 M1024 s00, 09, 24, 33, 48, 57 e 72 h
4Aluminum 6013-T4NaCl 3.5% (0.6 M)1024 s00, 09, 24, 33, 48, 57 e 72 h
5Weld BeadNa2SO4 0.1 M1024 s00, 09, 24, 33, 48, 57 e 72 h
6Weld BeadNaCl 3.5% (0.6 M)1024 s00, 09, 24, 33, 48, 57 e 72 h
Table 5. Average potential noise values for each test condition.
ExperimentPotential Noise (V)
1-(DP980–Na2SO4 0.1 M)−0.68512
2-(DP980–NaCl 3.5% 0.6 M)−0.65421
3-(6013-T4–Na2SO4 0,1 M)−0.34485
4-(6013-T4–NaCl 3.5% 0.6 M)−0.71404
5-(Welding bead–Na2SO4 0.1 M)−0.67363
6-(Welding bead–NaCl 3.5% 0.6 M)−0.65175
Table 6. Values of resistance to electrochemical noise for the materials DP980 steel, AA6013-T4 aluminum alloy and welding in Na2SO4 and NaCl media.
RN [kΩ·cm2]
Na2SO4 NaCl
DP980 SteelMean3.232.75
Median3.312.16
AA6013-T4Mean38.059.35
Median33.049.33
Welding beadMean3.311.88
Median2.591.20
Table 7. Results of conductivity and pH measurements for Na2SO4 and NaCl media over time.
Exp.Na2SO4 NaCl
Conductivity
(mS/cm)
pH Conductivity
(μS/cm)
pH
00 h10.06 ± 0.016.72 ± 0.0653.19 ± 0.196.85 ± 0.10
09 h10.03 ± 0.026.36 ± 0.0453.26 ± 0.116.72 ± 0.07
24 h10.05 ± 0.026.58 ± 0.0952.31 ± 0.396.64 ± 0.09
33 h10.03 ± 0.016.76 ± 0.0853.27 ± 0.146.58 ± 0.08
48 h10.05 ± 0.016.32 ± 0.0552.97 ± 0.236.66 ± 0.07
57 h10.07 ± 0.016.53 ± 0.0753.38 ± 0.286.76 ± 0.12
72 h10.02 ± 0.026.29 ± 0.0552.84 ± 0.317.08 ± 0.18
Disclaimer/Publisher’s Note: The statements, opinions and data contained in all publications are solely those of the individual author(s) and contributor(s) and not of MDPI and/or the editor(s). MDPI and/or the editor(s) disclaim responsibility for any injury to people or property resulting from any ideas, methods, instructions or products referred to in the content.

