1. Introduction
Injection molding of thermoplastics is crucial in transforming plastic materials. One of the most studied phenomena in injection molding is the volumetric contraction of plastic parts. This phenomenon occurs when the plastic part shrinks to a smaller volume than the cavity it occupies due to changes in temperature and pressure during the molding process [
1,
2]. Although injection molding is the most widely used process, other advanced techniques are also employed for the transformation of polymer-based materials for different industrial sectors, depending on the necessities of the obtained product [
3,
4,
5,
6].
As observed by Kastelic et al. [
7], this contraction does not occur uniformly throughout the part, resulting in part warpage. Mourya et al. [
8] provided a comprehensive analysis of injection defects, highlighting the occurrence of warpage. The volumetric contraction can be divided into two phases: the first phase occurs within the mold, where the material transitions from high temperature and pressure (e.g., 200 °C) to approximately 70 °C and atmospheric pressure. The second phase, which falls outside the scope of this study, occurs after the part is ejected from the mold and left to cool at an ambient temperature (e.g., 20 °C) [
9].
The injection molding process has recently gained significant attention, particularly in parameter optimization, to achieve consistently high-quality parts and maintain process stability over time. Numerous algorithms have been employed for parameter optimization [
9]. The backpropagation neural network (BPNN) has emerged as one of the most extensively utilized methods [
7,
10]. Its effectiveness is evident in the many research articles published since 2014, which focus on this modeling methodology and optimizing machine parameters [
11]. Obtaining a better part quality implies less polymer waste, which is an interesting solution for the environment, as the invalid parts must be recovered with a recycling process [
8].
Reducing volumetric contraction and warpage has been one of the objectives of optimizing injection process parameters, such as the temperature of the molten mass, packing pressures, packing time, injection speed, and injection machine parameters [
8,
12,
13]. The warpage phenomenon continues to be one of the main areas of study during the injection process. Yannik Lockner et al. [
14] examined the efficiency of using neural networks to optimize injection parameters. The employment of neural networks and deep-learning techniques has also been employed in many fields for the optimization of the process [
15,
16].
Other economic aspects, such as reducing operating times, have also been targeted for parameter optimization [
17], as well as the comparison of different modeling methods, as demonstrated by Ozcelik et al. [
13], who compare the results between modeling with a neural network and a genetic algorithm. Sedighi et al. [
18] proposed optimizing the material entry point location using a neural network, and Park et al. [
19] suggested employing AI that directly adjusts machine parameters in response to values obtained from temperature and pressure sensors placed in the mold.
From a part geometry perspective, the analysis of the warpage phenomenon of rectangular parts produced with polypropylene is conducted. Part geometry plays a critical role in the quality of injected products, as reported by Popa et al. [
20]. They explored the correlation between geometric dimensions and process quality and the design of cooling circuits based on part geometry, as investigated by Hopmann et al. [
21]. It is important to highlight that the study of materials like polypropylene is of great interest as it is employed in many manufacturing techniques such as injection molding or the thermoforming of sheets [
22,
23].
Many studies in plastic injection utilize support software for injection simulations to obtain data that serve as inputs for various optimization methods. Yang K. et al. [
24] optimized the parameters for injecting a part for an automobile, relying on data obtained with Moldflow [
14]. G. Dongre Ganesh et al. [
25] validated the results of cycle reduction obtained with MoldFlow against actual results. Another example of data validation provided by MoldFlow Insight is found in the studies of Marhöfer et al. [
26]. Simulations can be employed in many fields; they are also widely employed in mechanical behaviour prediction [
27]. They demonstrated no exact correlation between the data provided by this software and real data due to the viscosity differences between different plastic supply formats (powder vs. granules). In a similar software validation, Brincat et al. [
28] concluded that Moldflow can accurately predict the thermal behavior of the injection mold.
A study focusing on warpage in rectangular parts with semicrystalline materials was conducted by Sun et al. [
29], who compared the warpage values obtained with Moldex3D to the warpage values acquired through part injection.
In our case, the data obtained from the MoldFlow Insight software are utilized in the training phase of the BPNN. These simulation data were validated by comparing them with real warpage measurements.
An attempt is made to replace the data provided by simulation software with data obtained through modeling via deep learning. For instance, Uglov et al. [
30] employed Moldflow data as training data for ANN to predict filling time and part deflection. They modeled the mechanical characteristics of an injected product using a BPNN and determined the optimal combination of process parameters to maximize Von Mises stress. In our case, we also developed an alternative method to obtain warpage values without relying on injection simulation software, except for the modeling phase of the BPNN.
During the first contraction phase, several factors directly influence the final contraction of the part, such as part geometry, injection parameters, material employed, and the mold geometry [
9]. Unlike other studies that have examined the dependence of warpage in injected parts on machine parameters (Rodrigues et al. [
17]), we investigate the relationship between the warpage of injected parts and their final dimensions, establishing a correlation between inputs and outputs. In this work, the main objective is to determine how part warpages are influenced by modifying the independent variables of the area and part thickness. In addition, it will analyse the effectiveness of predictive methods, such as artificial neural networks, in predicting warpage.
2. Materials and Methods
2.1. Input Variables
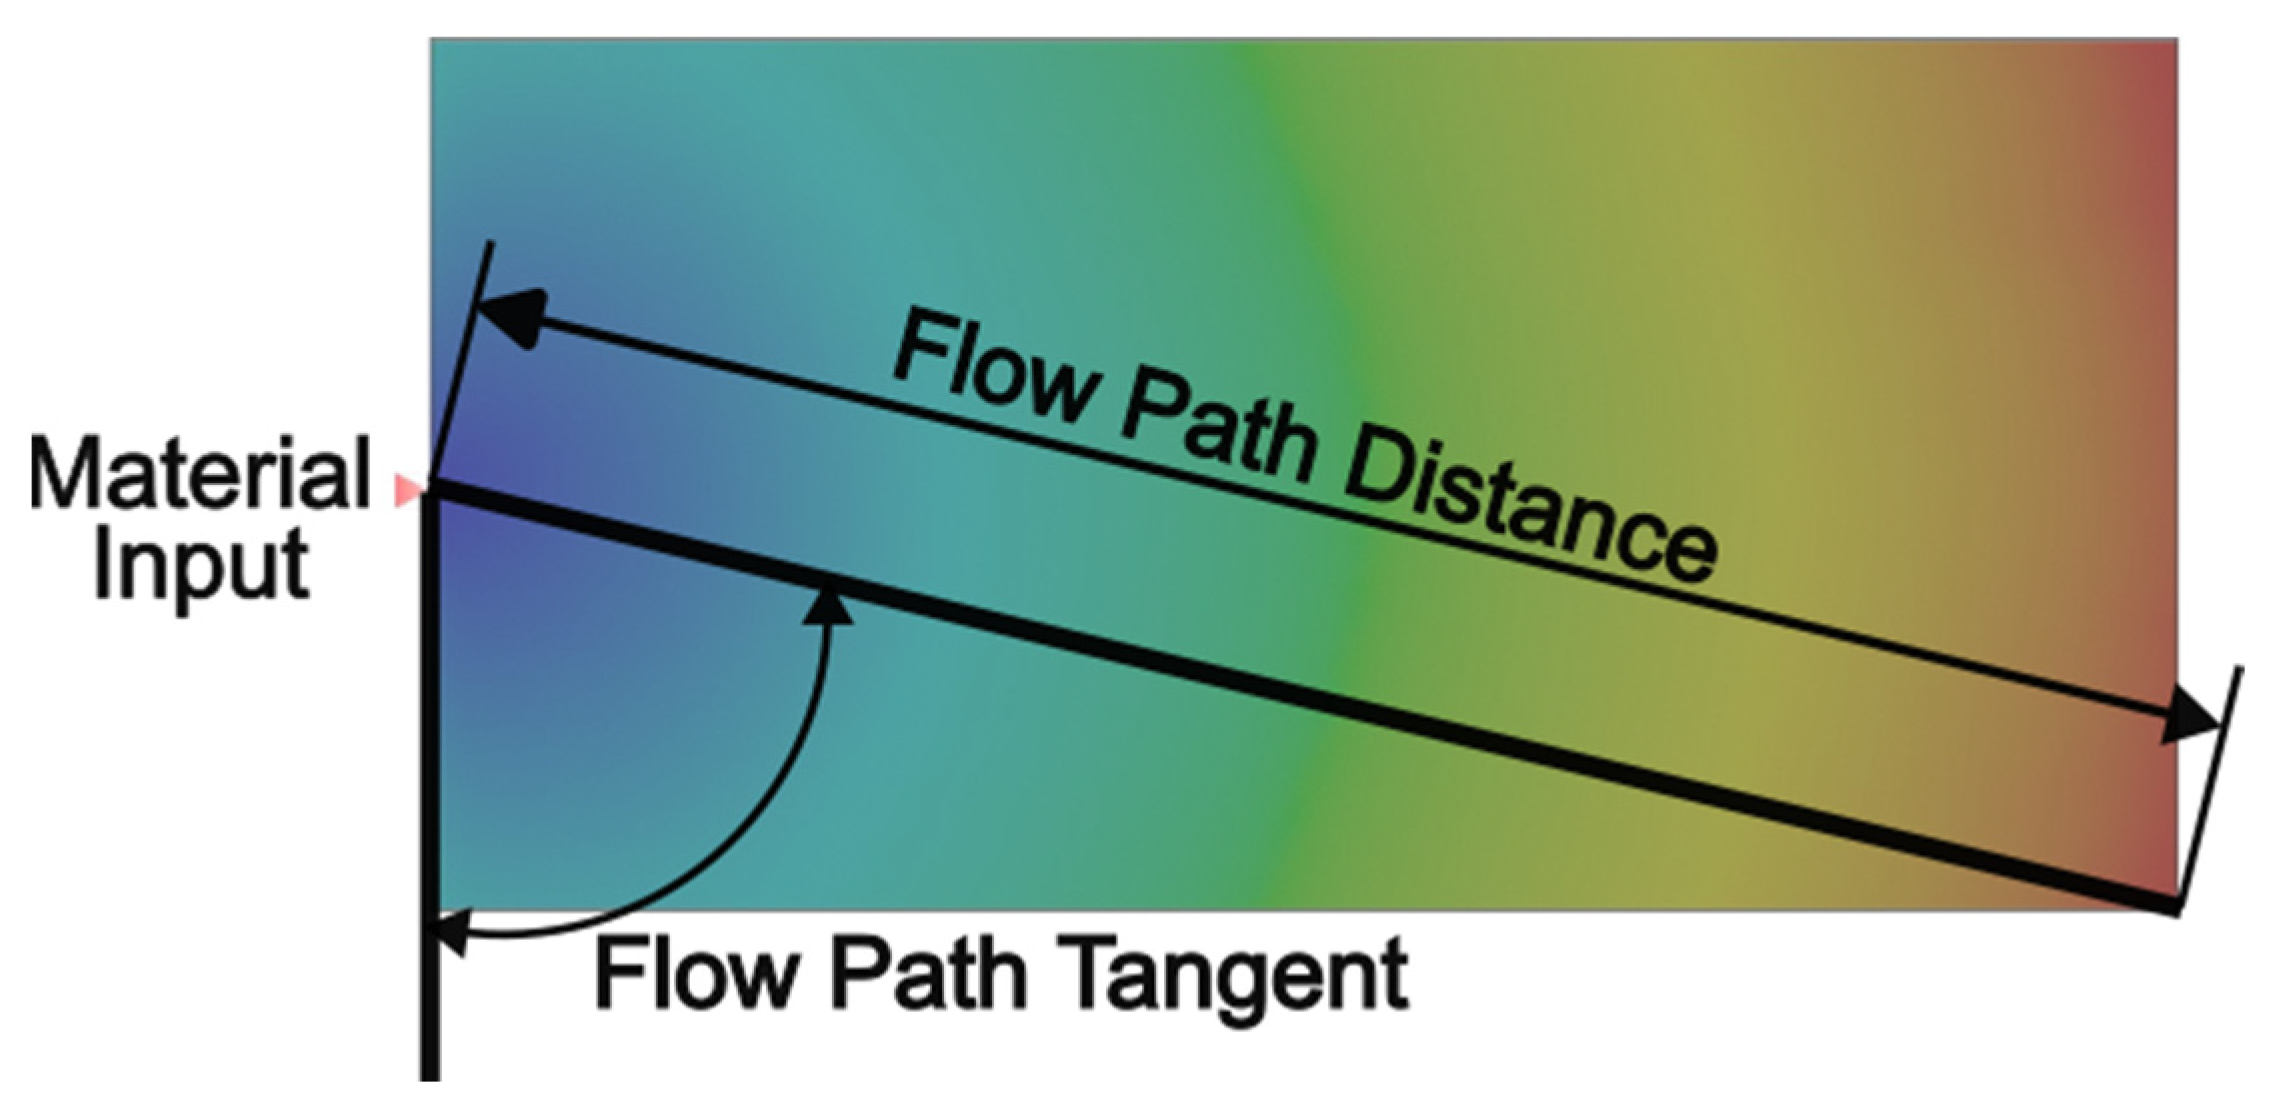
The input variables for the process initially correspond to dimensional variables: width, length, and thickness. However, an additional variable to consider is the location of the material inlet. This determines the positioning of the part’s length and width, significantly impacting the warpage data. Different warpage values are obtained for the same part depending on whether the material inlet is on the width or length side.
In this study, two variables are defined for the analysis. The first variable represents the distance from the material inlet to the farthest point of the part, referred to as the flow path. The second variable is the tangent value of the flow path intersecting with the wall in contact with the material inlet. These variables are illustrated in
Figure 1. Both variables are related to the part’s length and width. According to the Pythagorean theorem, it is known that:
where “a” represents the part width, and “b” represents the part length. Additionally, using trigonometric relations:
By considering both Equations (1) and (2), one can better understand the relationship between the flow path distance and the tangent and their dependence on the part’s dimensions. These variables play a crucial role in the warpage behavior of the injected part.
Figure 1.
Graphical representation of the input variables: flow path distance and tangent.
Figure 1.
Graphical representation of the input variables: flow path distance and tangent.
Therefore, the input variables of the process are present in
Table 1.
2.2. Output Variables
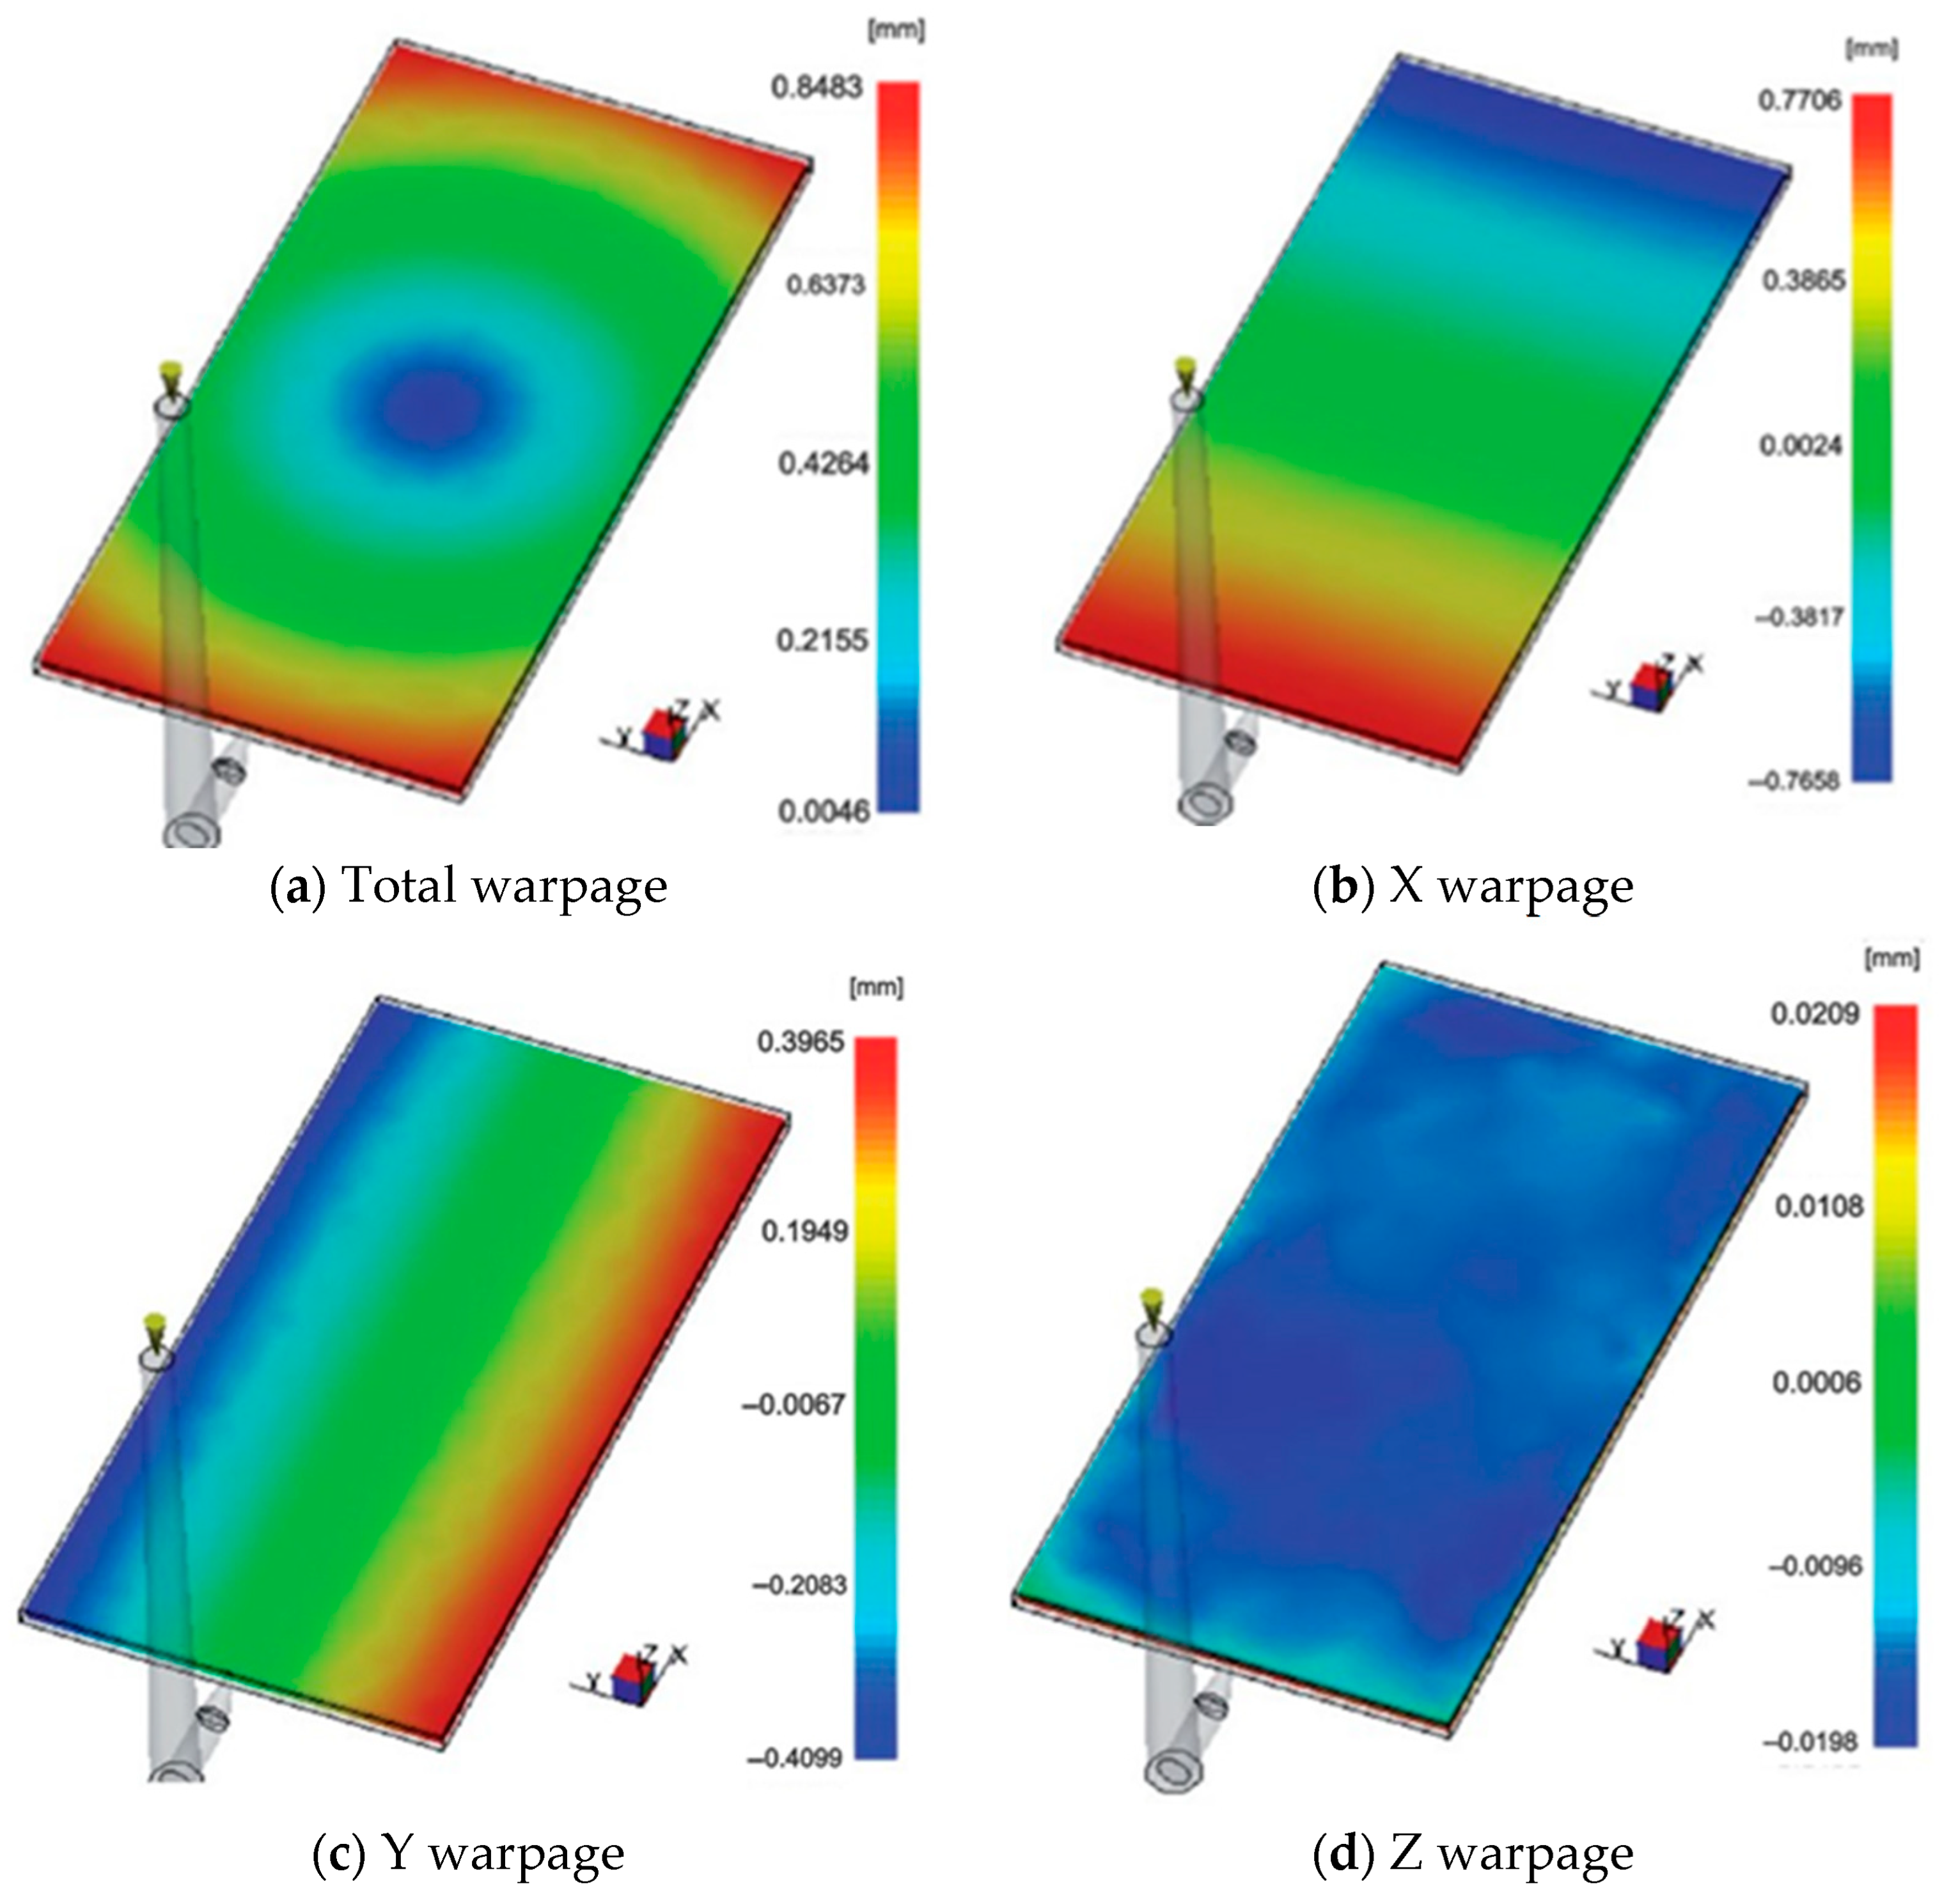
Part warpage after the injection process is a key focus of this study. This warpage occurs due to the part’s contraction, which occurs with varying intensities depending on the direction of contraction in relation to the part axes. This unequal contraction leads to warpage. In the Moldflow simulations, the material used is the PP–ISPLEN PB 180A4M from Repsol (Madrid, Spain), which is the same as that used in the real injection process. MoldFlow can simulate this warpage and decompose warpage into the different axial directions, X, Y, Z, and the warpage that results from the three axial warpages. This total warpage is obtained as the vector sum of the warpage vectors along each axis, with the maximum values recorded at specific nodes.
If we consider that there is almost no warpage on the Z axis (
Figure 2d), the study focuses on analysing the warpage based on three parameters:
Total warpage: This parameter refers to the change in position of a point on the finished part after it has been injected into the same point within the mold cavity. It represents the sum of warpages along each axis for that specific point. Only the maximum warpages and corresponding locations are considered (
Figure 2a). By considering the total warpage and its distribution across the part, it can gain valuable insights into the warpage behavior, and it can further optimize the injection process to minimize warpage and improve part quality.
Figure 2.
Graphical representation of the variables for warpage.
Figure 2.
Graphical representation of the variables for warpage.
Warpage in the X-axis direction: This parameter refers to the change in position along the X-axis of a point on the part, compared to its position within the mold cavity. The simulation program provides two sets of data, one positive and the other negative, representing warpages in opposite directions. The absolute values of both sets are summed to obtain the total warpage in the X-axis direction (
Figure 2b).
Warpage in the Y-axis direction: This parameter captures the change in position along the Y-axis of a point on the part relative to its position within the mold cavity. Like the X-axis warpage, the simulation program presents two datasets, positive and negative, representing warpages in opposite directions. The absolute values of both sets are summarized to calculate the total warpage in the Y-axis direction (
Figure 2c).
Regarding the Z-axis warpage, which corresponds to the displacement of a point on the part along the Z-axis from its position within the mold cavity, it is not considered significant in this study due to its relatively shallow magnitude. This is visually illustrated in
Figure 2d.
By analyzing
Figure 2, it is possible to identify the red areas representing the maximum warpage on the positive axis side. At the same time, the blue regions correspond to the maximum warpages in the negative direction along the studied axes. The intermediate shades between these colors indicate lower warpage values than the extremes mentioned above, with green representing null or minimal warpage.
2.3. Process Conditions
According to several studies, such as those conducted by Mourya et al. [
8] and Park [
19], the key variables in the injection process include packing pressure and time, injection time, cooling time, mold temperature, and melt temperature.
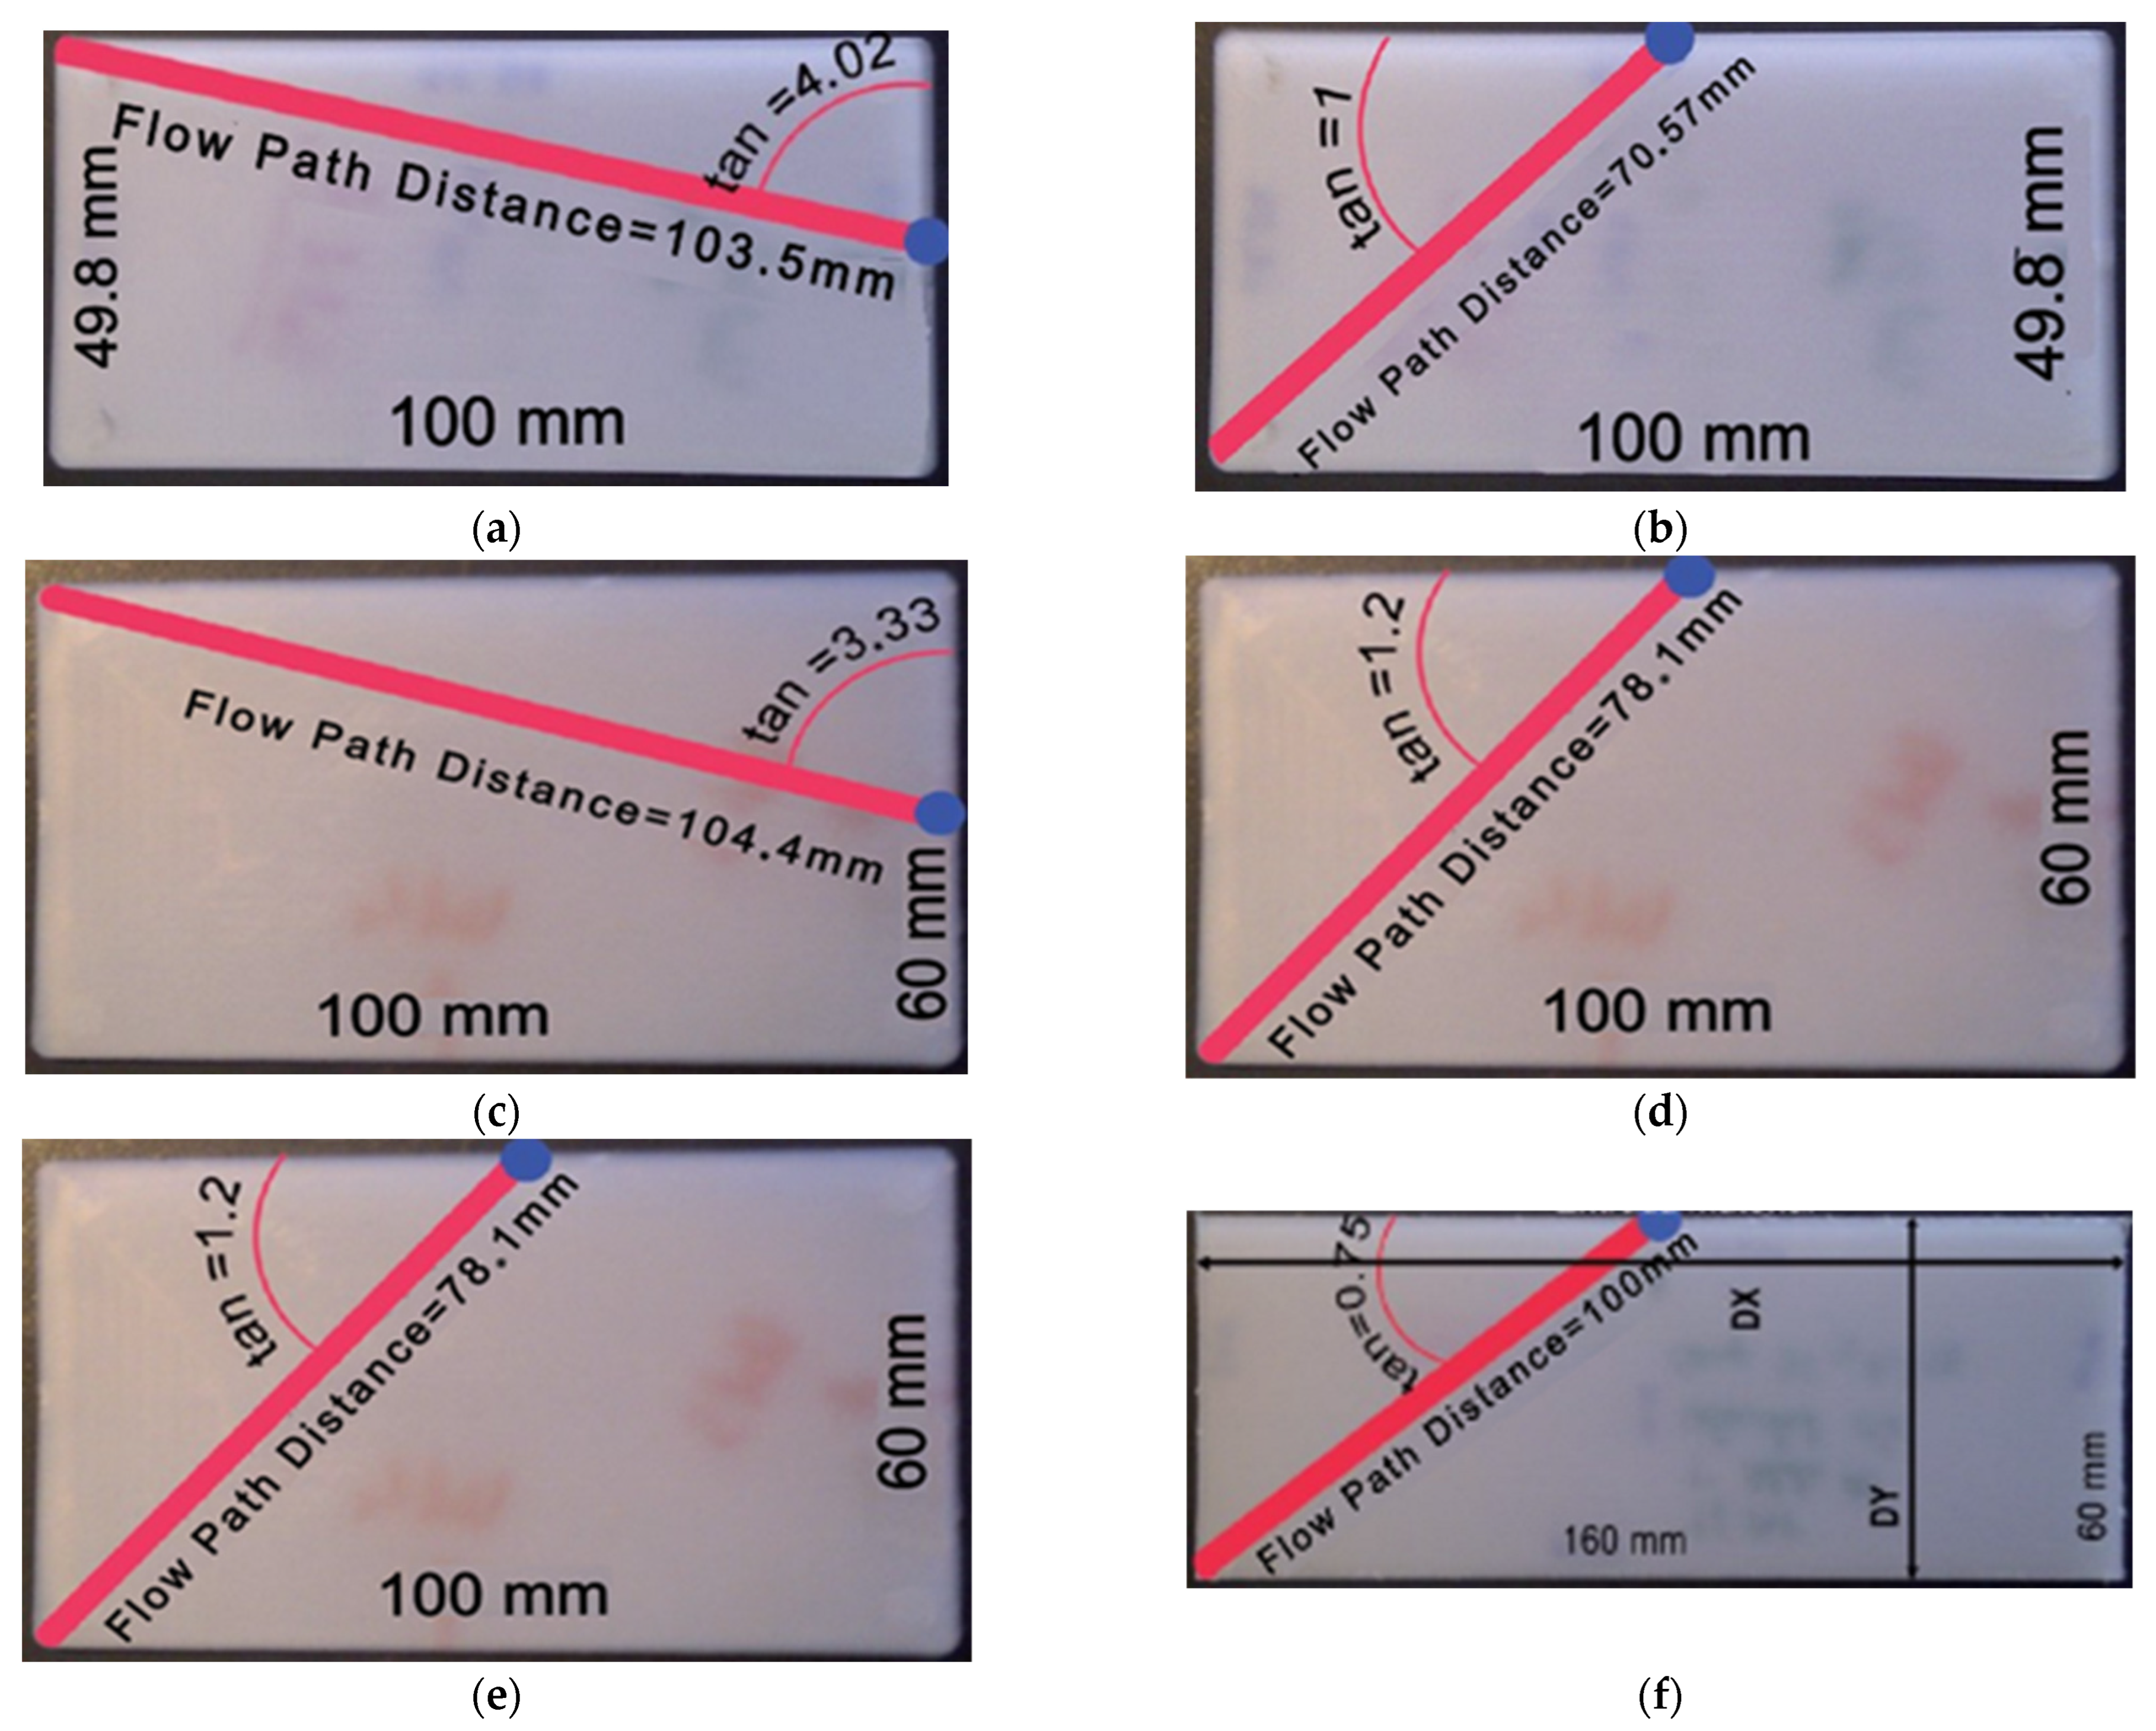
Various parts (depicted in
Figure 3) were initially injected to determine the optimal process conditions, and different parameter values were tested until a part of suitable quality was obtained. The desired quality criteria include the absence of sink marks or flash and adequate part compactness.
The procedure for determining the optimal process conditions was as follows:
Injection of each validation part: Each part was injected with different parameter values to assess their impact on warpage and other quality criteria. For real injections, we use a cycle time of 25 s.
Extraction of the optimal parameters per part: The parameter values that result in the least warpage and meet the desired quality criteria were identified for each part.
Extraction of the average optimal parameter values for all the parts: The average optimal parameter values were calculated based on the results obtained from each part.
Final injection into all the parts under the conditions of the average values: All the parts were injected using the average optimal parameter values determined in the previous phase. This step aims to verify if the parts were correctly produced with the average values.
After injecting the parts (Injection machine properties and other data can be found in the
Supplementary Materials File), the actual warpage of the injected parts was measured using a micrometer 24 h post-ejection to account for delayed crystallization, and these measurements were compared to the warpage results provided by MoldFlow. The working conditions that will be used in the simulation of all parts and the injection of the real parts are listed. They are shown in
Table 2.
The injection molding process sequences simulated in this case include filling, packing, cooling, and ejection.
2.4. Materials
When selecting the material for the study, a material that exhibits complex contraction behavior similar to semicrystalline materials was chosen while also being suitable for general use. The material chosen for this study was Polypropylene ISPLEN PB 180 A4M. It has a fluidity index value of 20 g/10 min, which is considered appropriate when taking an average value. This material offers excellent workability and processability, and the main features can be seen in the following
Table 3.
The dimensional ranges of the different simulated parts can be seen in the following
Table 4 (gate dimensions were standardized at 3 mm diameter):
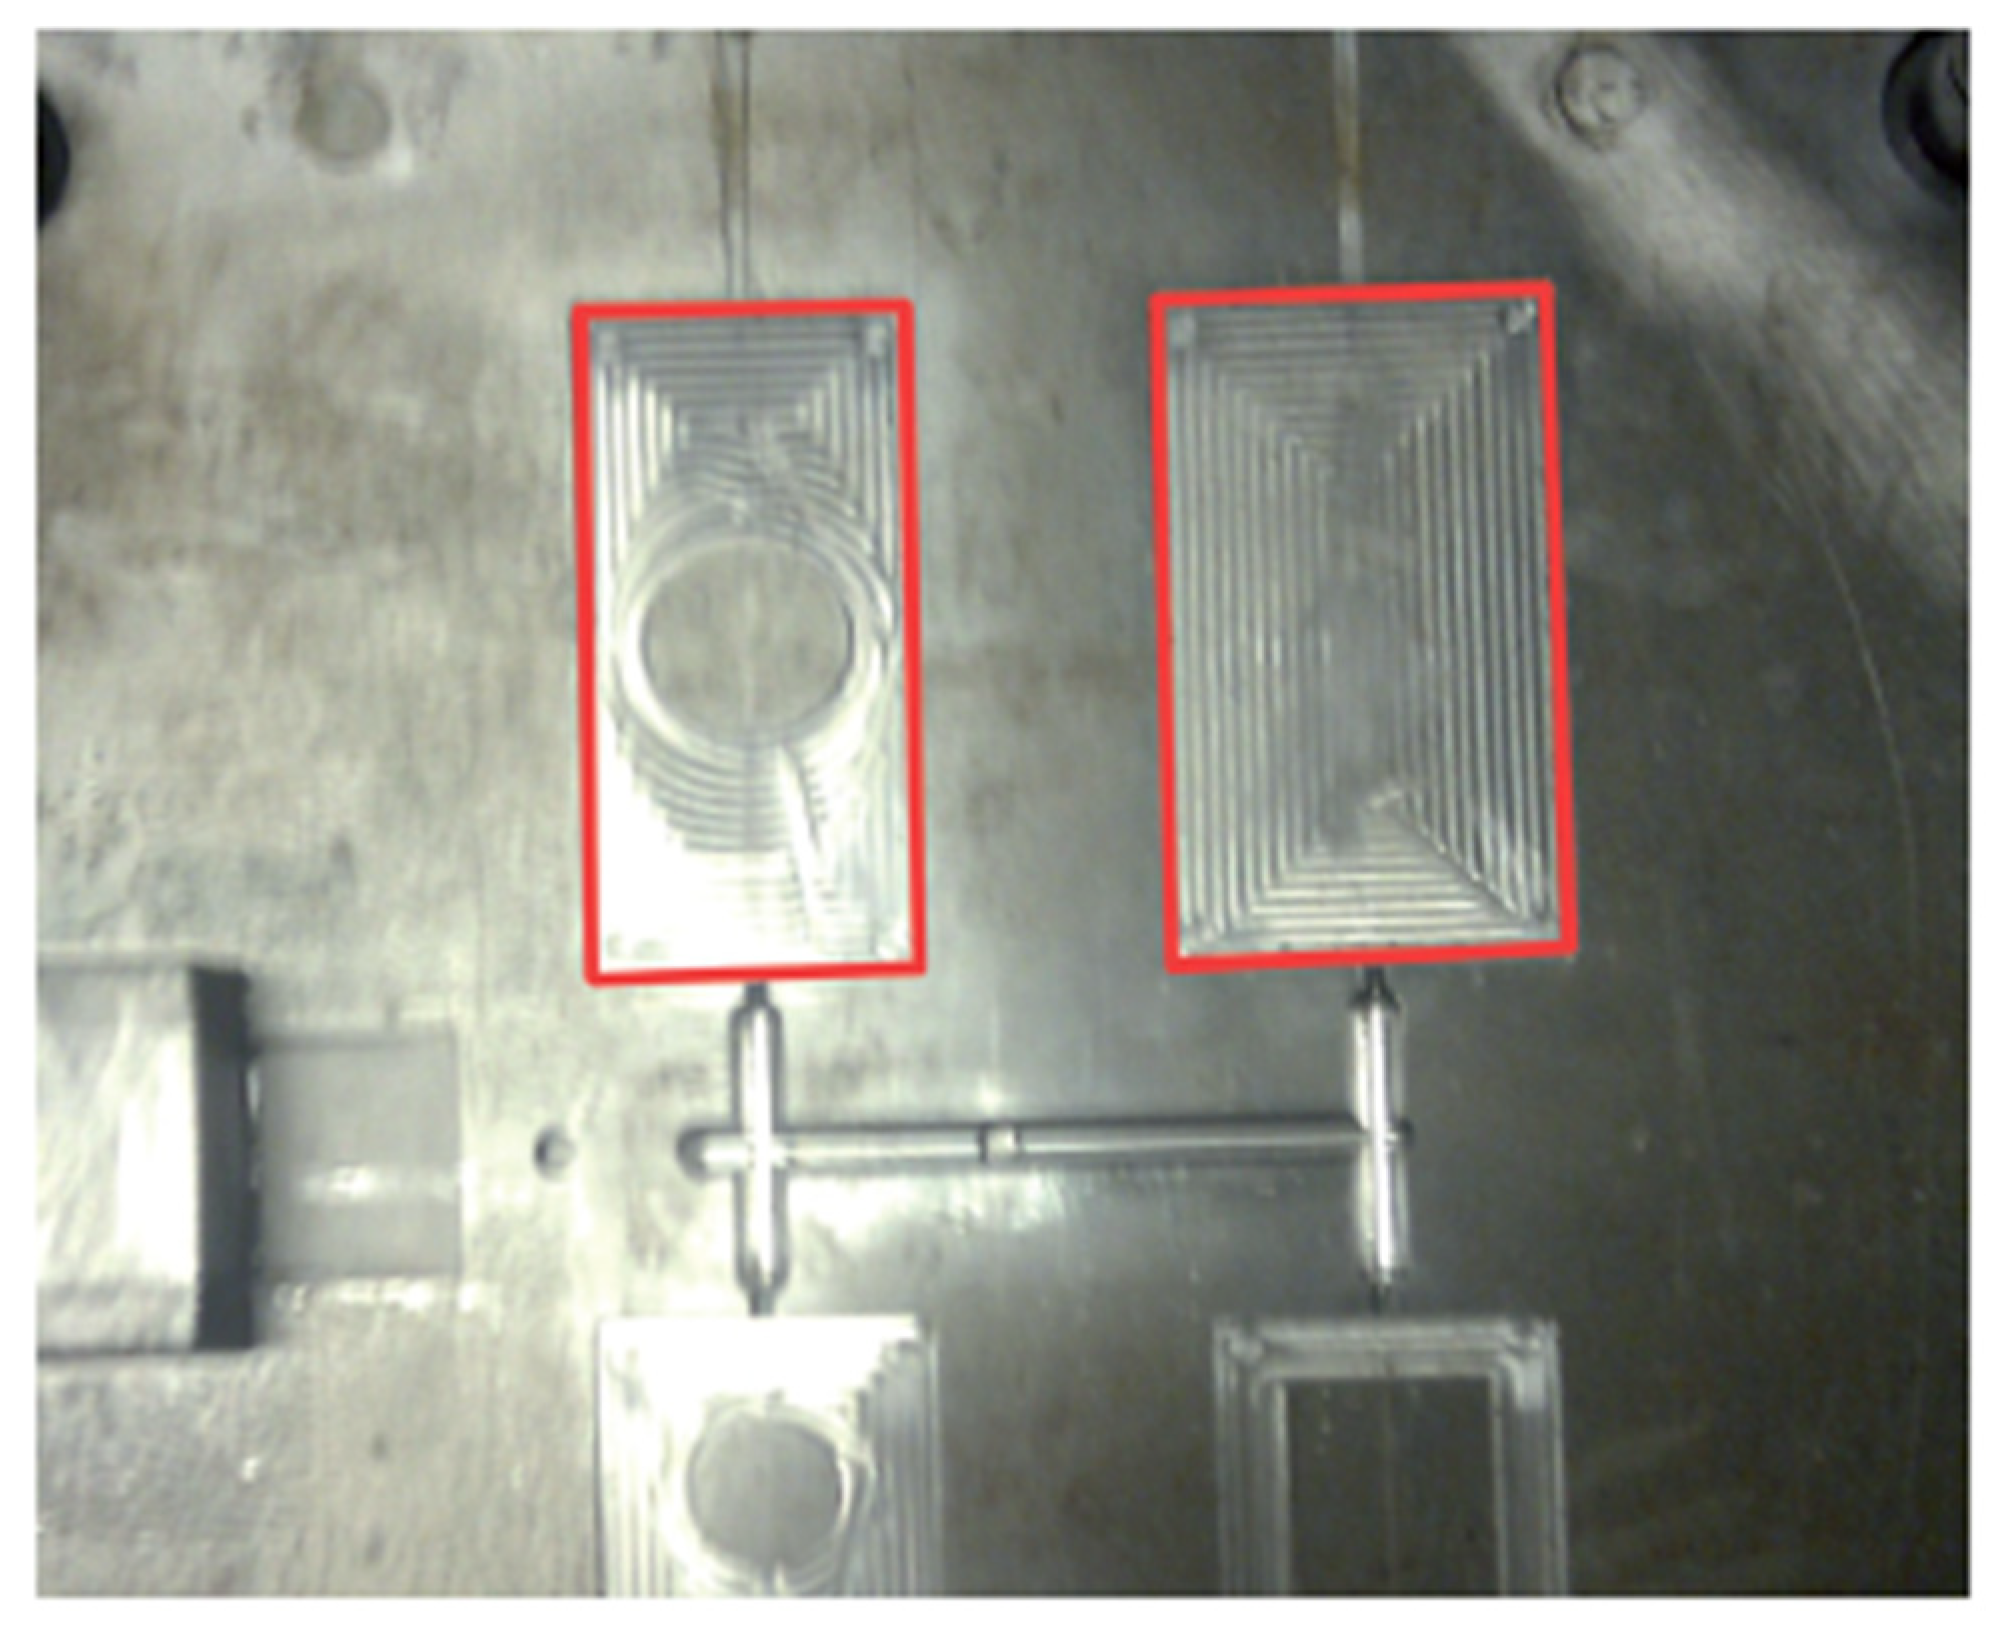
The molds shown in
Figure 4 and
Figure 5 were used to inject the physical parts. With these two molds and the correct placement of the material inlets, the six physically injected parts are obtained. The materials for these molds are P20 (DIN 1.2311) for core and cavity, and for the other plates, the material is C45 (DIN 1.1730).
The warpages in the real pieces were measured using the external micrometer. The procedure involved externally measuring the pieces at specific points and analyzing these points with respect to flat surfaces. The pieces were measured 24 h after injection.
Regarding the injection machine used in this study, a Meteror 250/75, it is located in EPSA’s own process laboratory. It is a 75-ton clamping force machine from Mateu & Solé. You can see the specific data of the machine in the additional information section.
Software used in this study: MoldFlow Insight 2010 and EasyNN Plus v7.
2.5. Neural Network Configuration
Optimizing the Artificial Neural Network (ANN) involves determining the optimal number of hidden layers and the number of neurons within these layers to achieve the best generalization error. This process is largely empirical and entails conducting tests until the best combination that minimizes the generalization error is identified. The key parameters of the ANN include the number of hidden layers, the number of neurons in each hidden layer, the acceptable error range, the learning rate, and the activation function. This study used a BPNN with supervised learning, which has three layers. The hidden layer with eight neurons was configured. The input layer included the following factors: part thickness, flow path distance, and flow path tangent.
The output layer responds to total warpage, warpage in the X-axis direction, and warpage in the Y-axis direction (
Figure 6). Once optimized, the values defining the BPNN were as follows:
Number of Hidden Layers: one layer
Number of Hidden Layer Neurons: eight neurons
Red Error Range: 4.5%
Learning Rate: 0.7
Module: 0.8
The activation function used in the hidden layer was the standard ReLu, defined as f(x) = max(0,x), with no additional parameters. This choice was based on its computational simplicity, and the activation function used in the hidden layer was the standard logistic sigmoid.
Figure 6.
BPNN structure representation.
Figure 6.
BPNN structure representation.
2.6. Training and Validation
To train an ANN model, it is necessary to have a diverse set of samples and examples. Since obtaining real data for all possible rectangular parts is impractical, Moldflow simulation software was used. To this effect, 200 rectangular parts correspond to a different dataset during the training phase. These datasets were created by combining 10 different flow path distance values, five flow path tangent values, and four thickness values to determine the dimensions of each rectangle. Additionally, an extra set of 20 randomly selected rectangular parts within the specified dimension ranges was introduced to enhance the accuracy of the BPNN model further. These additional examples followed no specific rule but remained within the established minimum and maximum ranges outlined in
Table 1. Finally, 20 more rectangles with randomly chosen dimensions within the specified ranges (
Table 1) were designed as validation samples. In summary, 240 rectangles were analyzed to optimize the BPNN model. Of these, 220 rectangles were used for training, while the remaining 20 were reserved for BPNN validation. Due to practical limitations, physically injecting 240 different rectangles was not feasible, as it would require many molds. Therefore, the parts were created using CAD software, specifically SolidWorks 2017, where all 200 rectangular parts were designed according to the appropriate dimensions. Subsequently, injection simulations were performed on each part using Moldflow software to obtain the corresponding warpage values for every simulated sample.
Before entering the data obtained from the MoldFlow simulations for RNA training, the warpage data of the six real injected parts were compared with the MoldFlow simulation software’s warpage data.
4. Conclusions
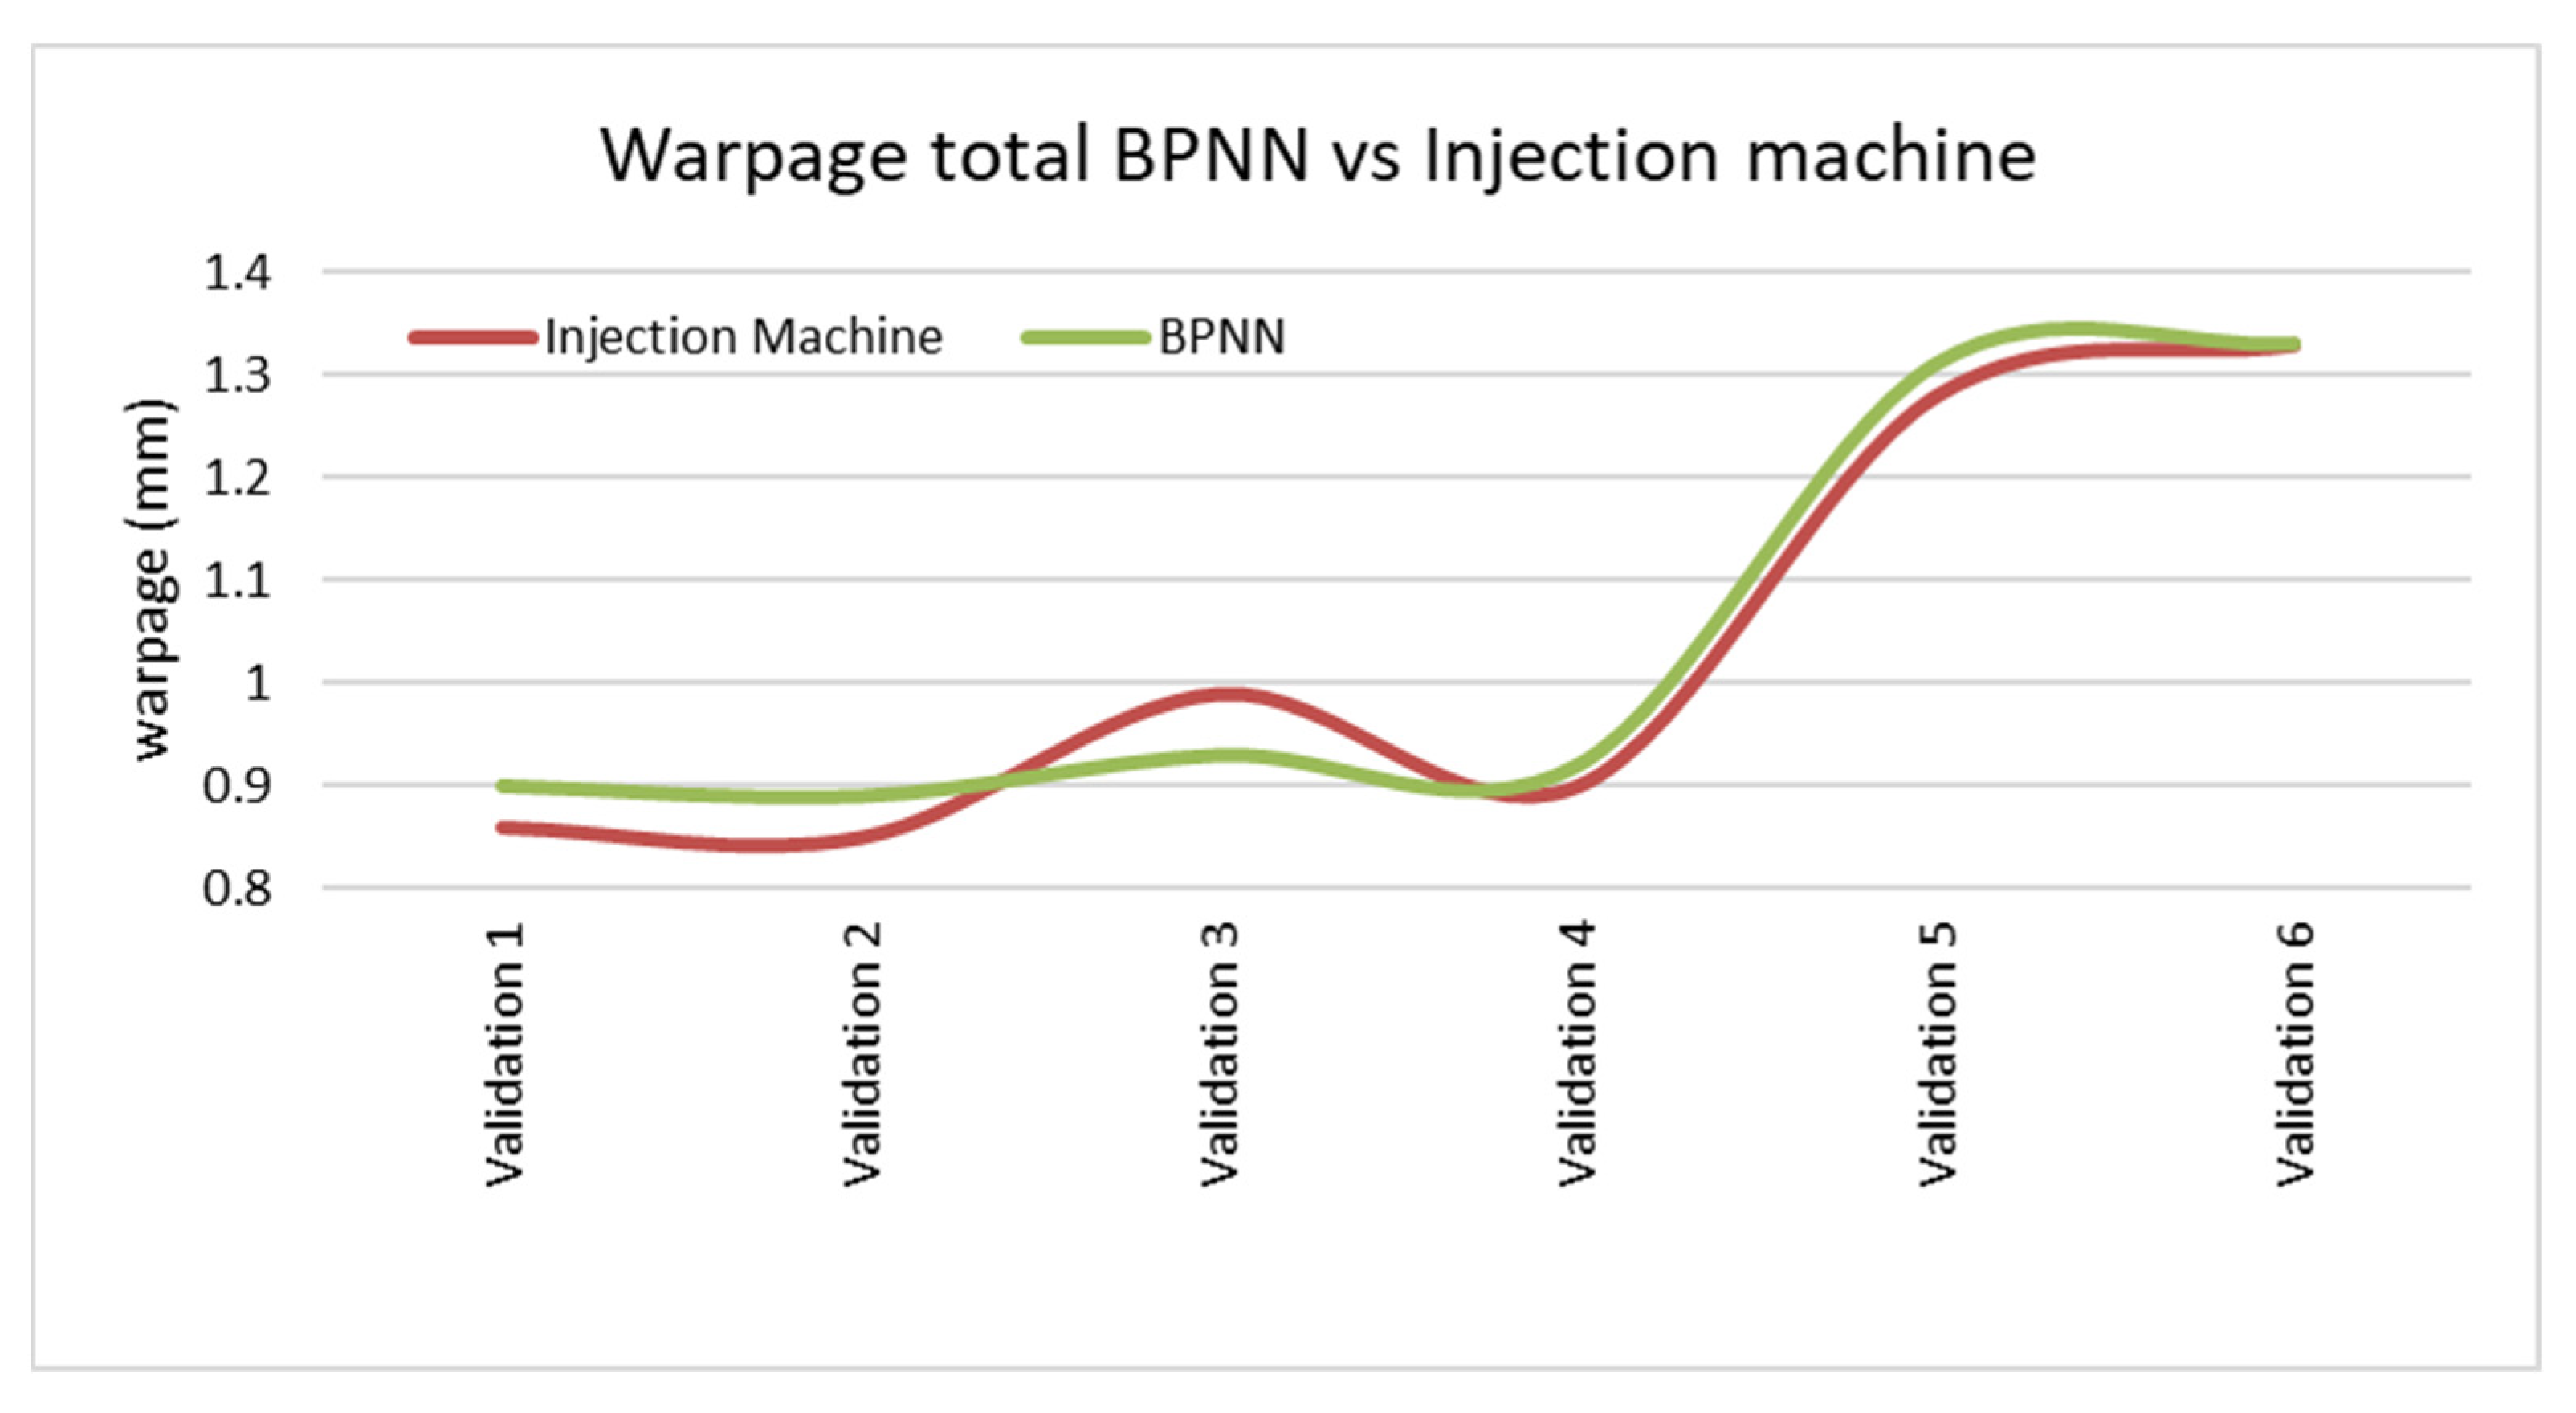
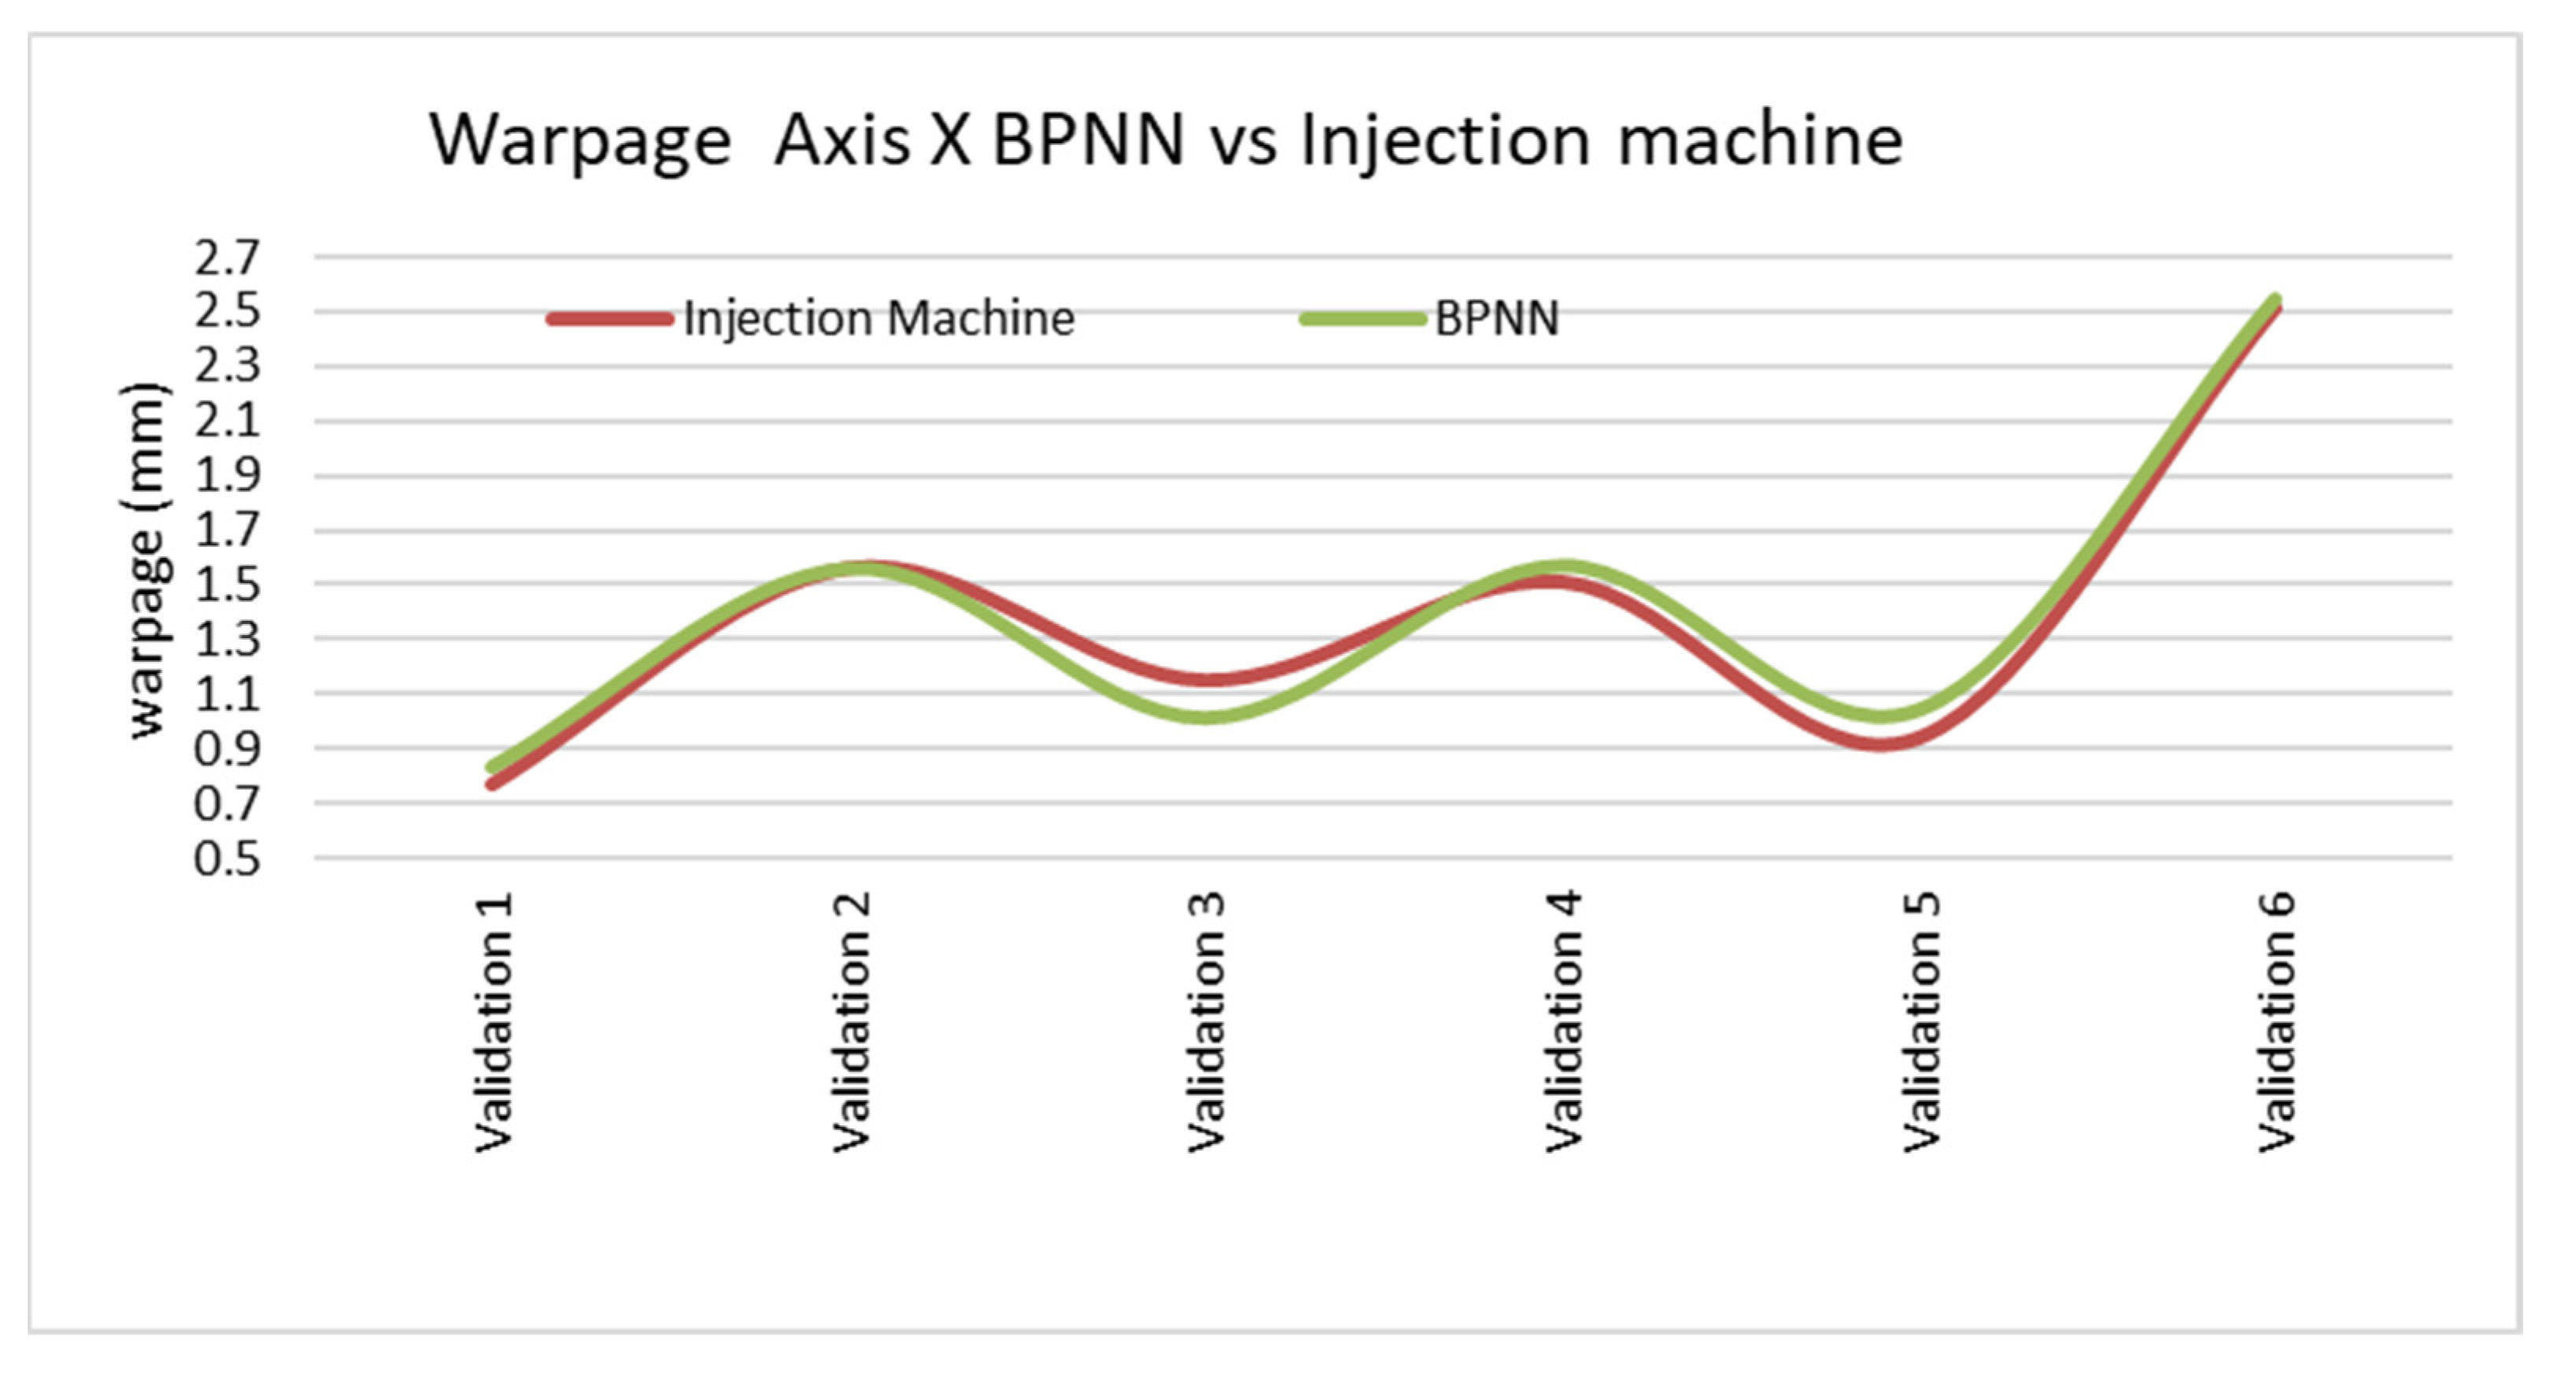
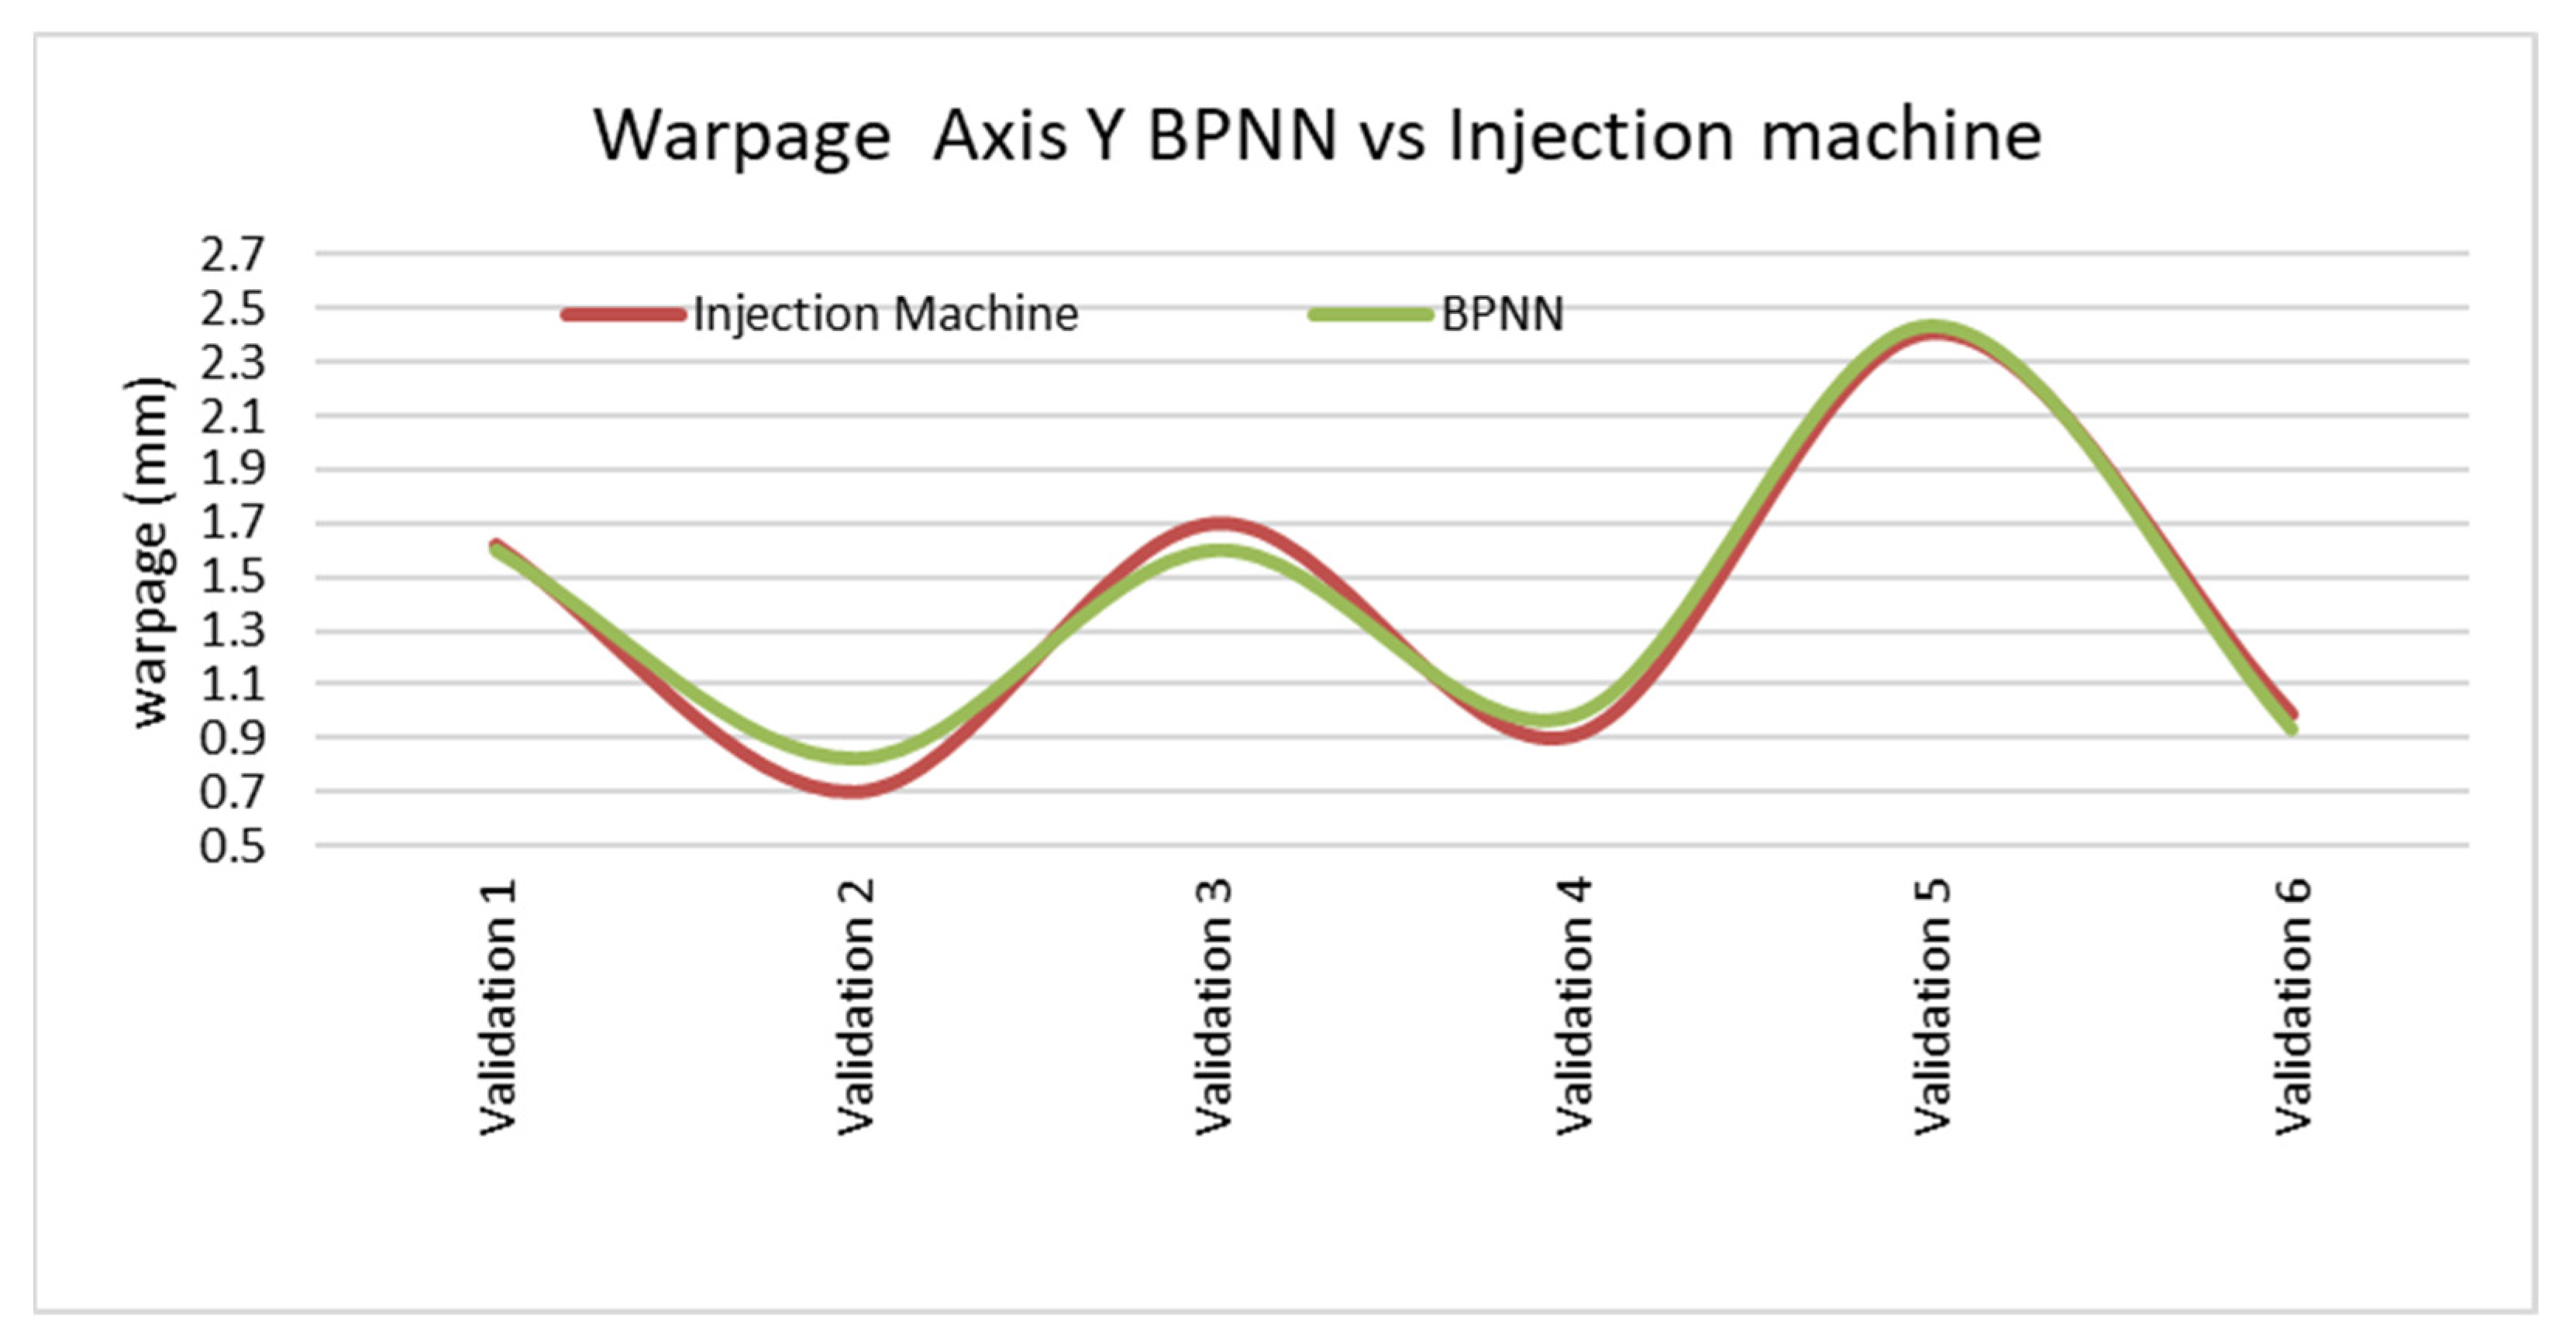
The findings of this study demonstrate a close agreement between the warpage data obtained from the MoldFlow simulation software and the actual warpage values observed in parts produced on the machine using the same processing parameters. However, slight inaccuracies may arise due to oil loss, mechanical misalignment, spindle wear, and nozzle loss during manufacturing. Despite these minor discrepancies, both the simulated and real warpages exhibit a minimal margin of error, supporting the overall effectiveness of the approach.
The warpage data obtained from the BPNN model deviate slightly from those of machine-injected parts. This disparity is expected as the BPNN model is built based on simulation data (MoldFlow), which moderately aligns with the machine data. Despite this small difference, the BPNN data remain consistent and provide a reliable approximation of the real warpages.
It is worth noting that while the actual industrial part being injected deviates from the strictly rectangular shapes studied in the previous section, the warpage data obtained with the BPNN for this similar rectangular-like part closely approach the real warpages. The data shown in
Figure 7,
Figure 8 and
Figure 9 are acceptable for acquiring a preliminary understanding of the warpage behavior in a rectangular part made of polypropylene (PP).
Although the errors obtained with the neural network (BPNN)—with E max 14.65% and E average 5.2%—are slightly higher than those from the MoldFlow simulation software (E max 6.91% and E average 3.52%), the design and calculation process using the BPNN model is significantly faster. In the future, it might be possible to reduce reliance on the tedious computer-aided engineering (CAE) process used to study warpage. This could make the BPNN-based approach a practical and time-efficient alternative. However, at present, this method is not applicable to parts beyond those analyzed in the current study. The key aspect of this study is the ability to obtain an approximate prediction of the warpage of a rectangular part made of PP by simply inputting the part dimensions into the BPNN model. This encourages further exploration of different shapes and materials beyond those examined in this study.
In conclusion, integrating MoldFlow simulation and BPNN modeling offers a promising methodology for predicting and optimizing warpage behavior during injection molding. The BPNN model is not a replacement for CAE but a complementary tool for rapid prototyping of simple geometries. The close agreement between simulation and machine data validates the reliability of the approach, while the efficiency of the BPNN model paves the way for practical applications in industrial settings. Future research endeavors may extend this methodology to encompass a broader range of part geometries and materials, further enhancing the overall efficiency and accuracy of the injection molding process. By continually refining these techniques, advancements in the plastic part production industry can be achieved, promoting sustainable and high-quality manufacturing practices.


 ,
, 


