Article

Dynamic Properties and Vibration Control of Additively Manufactured Carbon and Glass Fiber Reinforced Polymer Composites Using MFC: A Numerical Study with Experimental Validation

1
Faculty of Mechanical Engineering and Design, Kaunas University of Technology, Studentų Str. 56, LT-51424 Kaunas, Lithuania
2
Institute of Fluid Flow Machinery, Polish Academy of Sciences, Fiszera 14 Str., 80-231 Gdansk, Poland
3
Institute of Mechatronics, Kaunas University of Technology, Studentų Str. 56, LT-51424 Kaunas, Lithuania
4
Department of Laser Technologies, Center for Physical Sciences and Technology, Savanoriu Ave. 231, LT-02300 Vilnius, Lithuania
5
Faculty of Materials Science and Technology, VSB—Technical University of Ostrava, 17. Listopadu 2172/15, 708 00 Ostrava, Czech Republic
*
Authors to whom correspondence should be addressed.
J. Manuf. Mater. Process. 2025, 9(7), 235; https://doi.org/10.3390/jmmp9070235
Submission received: 5 June 2025 / Revised: 28 June 2025 / Accepted: 6 July 2025 / Published: 8 July 2025

Abstract

With the growing need for lightweight, durable, and high-performance structures, additively manufactured (AM) polymer composite structures have captured significant attention in the engineering community. These structures offer considerable advantages in various dynamic engineering sectors including automotive, aviation, and military. Thus, this investigation emphasizes the numerical analysis of the dynamic properties and vibration control of AM polylactic acid (PLA) composite structures reinforced with continuous glass fibers (CGFR-PLA) and carbon fibers (CCFR-PLA), with 0°–0° and 0°–90° layer orientations. The findings of this numerical study are compared and validated against earlier published experimental results. Initially, the numerical models were created using the Abaqus CAE 2024, replicating the actual experimental models. The numerical bending modal frequency of each numerical model is determined, and the 0°–0° oriented models exhibited considerably higher values compared to the corresponding 0°–90° models. Significant differences were noted between the numerical and experimental values in the higher modes, mainly due to existence of voids and misalignment in the actual models that were not considered in numerical models. Following this, a numerical amplitude frequency response (AFR) analysis was conducted to observe vibration amplitude variations as a function of frequency. The AFR numerical results demonstrated consistent trends with the experimental results despite differences between the absolute values of both scenarios. Afterwards, vibration amplitude control analysis was performed under the influence of a macro fiber composite (MFC) actuator. The findings from both numerical and experimental cases revealed that vibration control was noticeably higher in 0°–0° oriented structures compared to 0°–90° structures. Experimental models demonstrated higher vibration control effectiveness than the corresponding numerical models. Although significant differences between the numerical and experimental vibration response values were observed in each composite structure, the numerical results exhibited consistent trends with the experiments. This discrepancy is attributed to the challenge of capturing all boundary conditions of the experimental scenario and incorporating them into the numerical simulation.

1. Introduction

Recently, the need for lightweight, high-performance, and high-resistant materials with the capability to withstand significant forces especially under dynamic loads and vibrations [1,2,3]. This demand is particularly evident in industries such as automotive, aviation and military, where low mass, longevity, strength, and resistance are crucial. Metals and traditional materials such as plastics are increasingly falling to meet the rising standard requirements of these rapidly developing industries [4]. This is one of the reasons engineers and scientists increasingly prefer composites, where the combination of two or more different materials can produce a material with desired characteristics. In the market, a wide variety of composites are available, which can be divided according to reinforcement or matrix material, the orientation of the reinforcement and manufacturing methodology. The three main groups of composite structures categorized by matrix material are metallic, polymeric, and ceramic composites [5]. According to Dinița et al., polymeric matrix composites with fiber reinforcement (FRPC) are one of the most popular advanced material groups, characterized by high stiffness to weight and strength to weigh ratios [6]. The appropriate selection of matrix and reinforcement materials, along with fiber volume fraction and orientation, enables the creation and development of composite structures with desired properties and performance for targeted applications [7]. Zhang et al. presented an extensive study on recyclable thermosets and their composites composed of dynamic covalent networks. These materials can be recycled and reprocessed like thermo-plastic, while maintaining the high strength and thermal stability comparable to traditional thermosets. These recycled thermosets and their composites have numerous applications such as in wearable technology, 3D printing, and biomedical materials [8]. Among the wide range of available polymer matrices, thermoplastic materials are considered among the most promising. The thermoplastics enables additive manufacturing and offers easier recycling and reusability than thermosets. Additive manufacturing is one of the fastest growing technologies and is reshaping our understanding of manufacturing processes, leading the Industry 4.0 revolution [9]. This approach has offered almost unlimited design and geometric freedom, elimination of tooling, accelerated product development, improved cost efficiency, and reduced material waste [10].
Due to its ability to use a wide range of materials such as thermoplastic composites, additive manufacturing has become one of the most researched and promising methodologies for manufacturing and developing high performance structures with complex geometries and advanced functionalities. Among additive manufacturing technologies, fused deposition modeling (FDM) is one of the most widely used methods to manufacture continuous fiber reinforced thermoplastic composites [11]. FDM offers several advantages, such as relative simplicity, high customizability, an adaptable printing process, affordability and material versatility. The FDM process consists of layer-by-layer extrusion of thermoplastic through a nozzle onto the printing bed [12]. One of the most frequent polymers utilized in FDM process is polylactic acid (PLA). PLA is commonly known for its excellent printability and environmental friendliness. PLA is derived from renewable resources including corn starch and sugarcane [13]. However, pure PLA often lacks the strength, rigidity, and stiffness required for demanding and dynamic loading applications. The customizable feature of FDM process provides the opportunity to reinforce PLA with continuous fibers, including Kevlar, carbon or glass. This drastically enhances its mechanical properties and expands its application potential [14].
The static mechanical properties, numerical simulation approaches, and printing methodologies to reinforce PLA with continuous fiber have been extensively studied; however, investigations into their dynamic features and vibration control are becoming one of the most important research topics [15]. To fully examine the properties of composite structures, it is also necessary to investigate their dynamic behavior, particularly when these structures are designed for applications involving dynamic loads, such as in the automotive and aviation industries. Vibrations in composite structure can cause damage, significantly reduce their lifespan and generate unwanted noise [16]. To minimize the influence of vibrations and dynamic loads on structural integrity and reduce the risk of structure failure, a thorough investigation of dynamic characteristics such as damping ratios, mode shapes and natural frequencies is crucial [17]. Accurate prediction of dynamic characteristics and material behavior requires a combined approach, including both experimental and numerical simulation.
Finite element analysis (FEA) is one of the most used approaches for simulating and predicting the dynamic behavior of intricate composite structures [18]. FEA allows engineers to predict the overall dynamic and mechanical characteristics of structures. This capability enables them to optimize the geometry, materials, fiber orientation, and content in the structure prior to the manufacturing phase. However, to ensure accurate and reliable predictions of the composite structures, numerical results must be validated experimentally. Experimental modal analysis (EMA) performs a crucial role as the link between numerical simulation and real-world behavior [19].
Different approaches are employed for vibration control in engineering applications, such as passive, active, and semi-active methods. The passive control approach usually involves integrating damping materials or devices (typically tuned mass dampers), enabling the system to attenuate vibrations without requiring external power [20]. The active control scheme acts as an emerging technological approach, typically incorporating piezoelectric actuators and sensors to actively suppress the vibrations of the system. Moreover, it enables real time tracking of system’s vibration status. Although this method is more expensive and complicated, it offers greater flexibility and adaptability compared to passive approach. The semi-active method combines both passive and active techniques, providing a balance between complexity and performance in controlling system vibrations. The choice of the control approach depends on the specific application, damping requirements, cost and system complexity [21,22].
Nowadays, researchers are employing advanced piezoelectric composites known as macro fiber composites (MFCs,) manufactured by Smart Materials Corp [23], in active vibration control applications as actuator and sensors rather than using conventional piezoelectric (typically PZT-lead zirconate titanate). These MFCs provide greater flexibility, enhanced conformability, and generate higher actuation force strain than conventional piezoelectric material [24,25].
Raza et al. carried out FEA of PLA and PLA composite structures, including those reinforced with short carbon fiber (SCFR-PLA) and continuous carbon fiber (CCFR-PLA), using ANSYS R19.1 software. The simulations were executed to assess their natural frequencies of various modes, and to evaluate vibration reduction by employing an effective methodology involving an MFC actuator. The findings demonstrate that the CCFR-PLA structure has the highest natural frequencies, followed by SCFR-PLA, with pure PLA having the lowest. Moreover, the MFC actuator most efficiently suppresses vibration in the structure with the highest [26].
Lyu et al. proposed an innovative methodology to control vibrations in flexible beam structure by incorporating the MFC actuators along with a rotary motor. The results demonstrate that, through the combined effect of MFCs and the rotary motor, the novel scheme significantly suppresses the vibrations in the beam structure [27]. Zhang et al. suggested a numerical simulation and experimental adaptive vibration control methods for CCFR structures by incorporating MFC as an active control element. The CCFR structures face vibration under external disturbance, and it is imperative to suppress these vibrations to enhance performance and structural durability. Both numerical and experimental findings indicate that the suggested adaptive technique proved effective in suppressing the vibrations in the CCFR structure [22].
In addition, other numerical simulation and experimental studies have addressed the dynamic properties and vibration control of additively manufactured (AM) PLA, SCFR-PLA, and CCFR-PLA structures with 0°–0° layer configurations. The dynamic analysis findings demonstrate that CCFR-PLA structures indicate the highest natural bending mode frequencies, followed by SCFR-PLA and PLA the lowest. An effective vibration control was developed utilizing the MFC actuators, resulting in the most substantial reduction recorded in CCFR-PLA, followed by SCFR-PLA and the least in PLA [1,28]. Zhang et al. conducted a novel theoretical investigation on actively suppressing non-linear vibrations in functionally graded plate structure made of carbon nanotube reinforced composite under mechanical loadings. The proposed active feedback control approach involved incorporating MFCs with plate structure as actuators and sensors. The findings reveal that the proposed active control approach has proven promising in controlling the non-linear vibration effect in the plate structure [29].
This numerical simulation provides new insights into evaluating the dynamic properties and vibration mitigation analysis of AM CGFR-PLA and CCFR-PLA composite structures with 0°–0° and 0°–90° layer orientations, incorporating MFC actuators (Model: M8507/P2). The findings of this numerical study are thoroughly compared and validated against prior published experimental data [30]. The experimental work was conducted prior to numerical simulation to incorporate accurate physical characteristics into the numerical model. Moreover, if the numerical simulation had been performed first, a significant portion of the data such as material properties and exact number of printed lines in one layer. This would have been taken from literature, where these parameters might differ from those of the actual model used, making it difficult to compare and validate results.
Firstly, the finite element models of AM composite structures and MFC patch were created using the Abaqus CAE 2024 platform. The MFC was integrated with numerical models at an appropriate position replicating the experimental setup. Modal frequencies and associated mode shapes were assessed using the Lanczos approach. The deviations between numerical and experimental modal frequencies were analyzed by examining microscope images of the actual AM structures captured with a portable smart microscope and by considering the limitations in replicating the experimental boundary conditions within Abaqus platform. Following that, amplitude frequency response (AFR) analyses were performed to observe vibration amplitude as a function of frequency. Numerical and experimental results were compared, and discrepancies arising from differences in applied boundary conditions were discussed. Finally, vibration mitigation analysis considering the impact of integrated MFC patch was carried out in the numerical models and compared with the experimental scenario.
The numerical study focuses on assessing trends in dynamic properties (modal analysis and AFR) and vibration response of each composite structure, consistent with experiments, rather than providing fully predictive absolute values. Additionally, it presents a detailed investigation of discrepancies between numerical and experimental results and demonstrates the influence of fiber type and orientations on dynamic properties and vibration suppression.

2. Materials and Methods

In this study, AM CGFR-PLA and CCFR-PLA structures incorporated with MFC, are employed to investigate their numerical dynamic properties and vibration mitigation performance. The numerical results were compared and validated against prior experimental data [30]. The experimental process flow diagram based on previous published article is depicted in Figure 1. The flowchart of numerical simulation and experimental validation is illustrated in Figure 2.
In the pre-processing stage, the geometry of model is created, material properties are assigned, interaction between sections is specified, appropriate element categories are assigned to sections, the model is properly meshed, boundary conditions are applied, and necessary analysis steps are defined to investigate the numerical model.
During the solution stage, a job is created and executed for each defined analysis step. The convergence of the results is observed and if the desired results are not attained, then modifications are made to the model in the pre-processing stage, and the analysis step is re-executed.
In the post-processing stage, the results are visualized, necessary data are retrieved and properly plotted for interpretation.

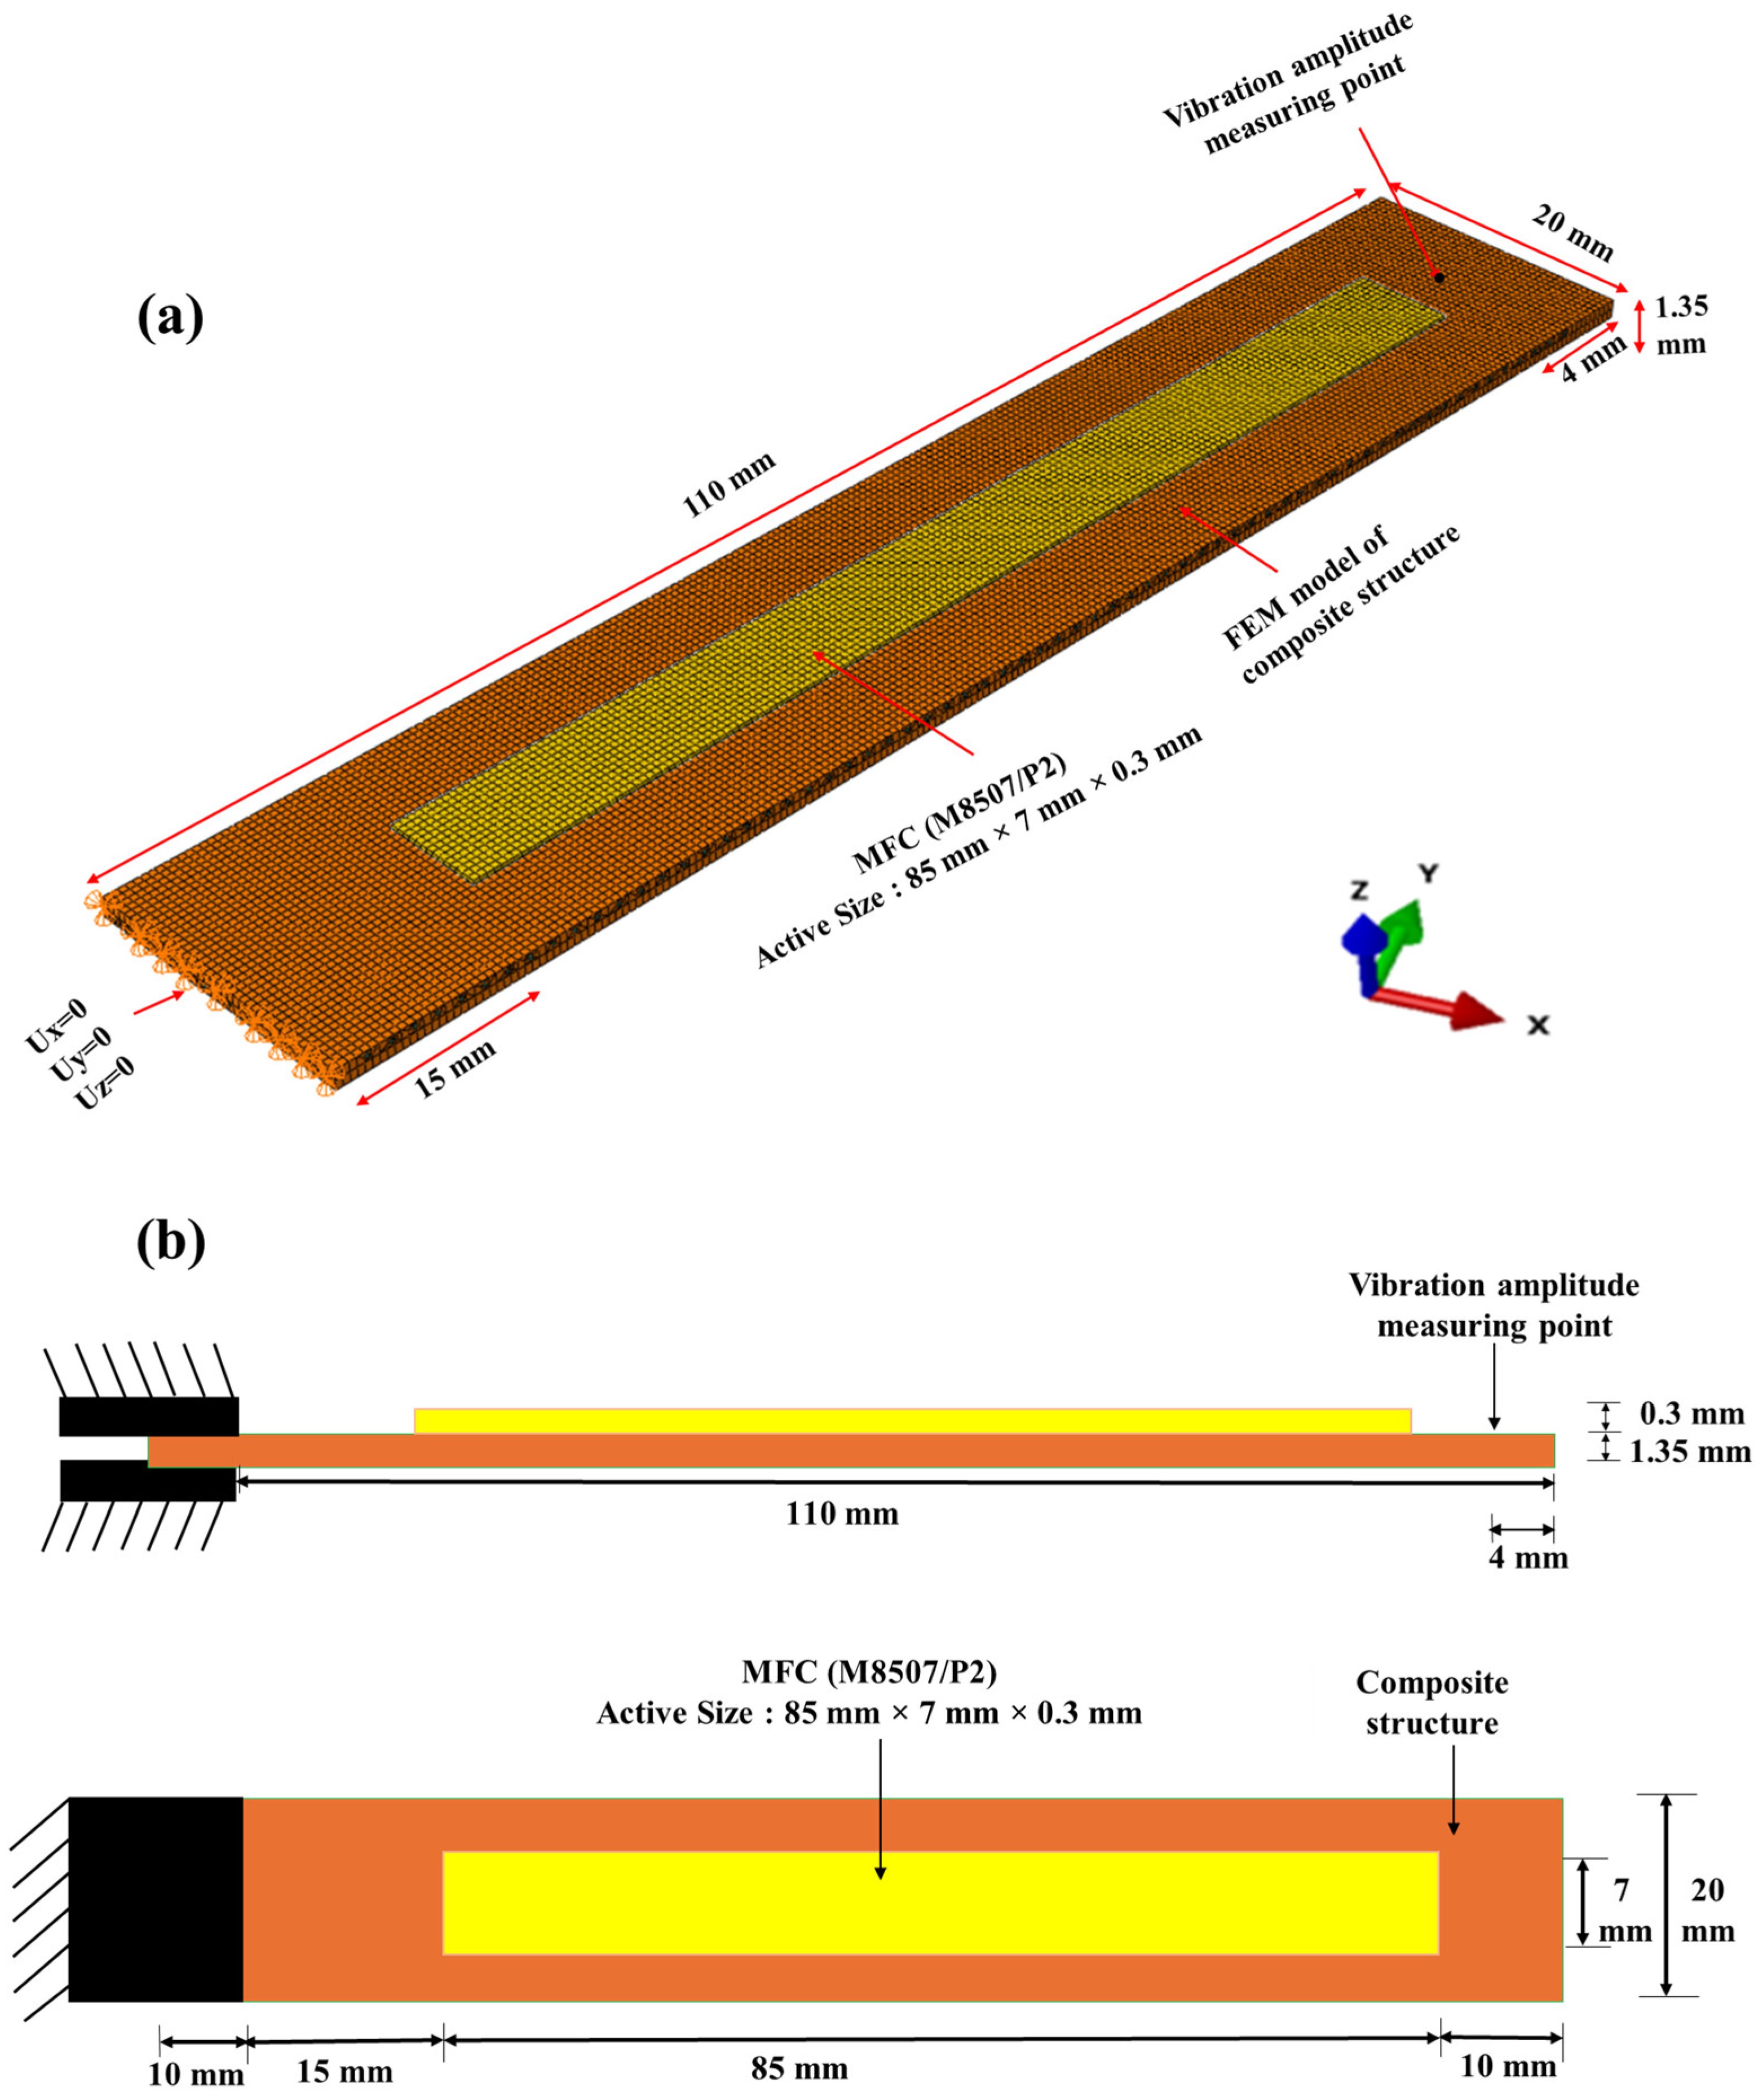
2.1. Finite Element Modeling (FEM) of Composite Structures

The CGFR-PLA and CCFR-PLA composite structures with 0°–0° and 0°–90° were numerically modeled (measurements: 110 mm × 20 mm × 1.35 mm) using the Abaqus, representing each layer as continuum solid shells (CSS8). The volume fractions of fibers in the 0° and 90° oriented layers were comparable to those in the actual AM structures, ~18% and ~17%, respectively. The modeling scheme of the composite structures is depicted in Figure 3. Following that, modeling of the active portion (measurements: 85 mm × 7 mm × 0.3 mm) of MFC (M8507/P2) was performed considering it as homogeneous piezoelectric solid (C3D20RE) elements [1]. Afterwards, a mesh convergence test was carried out using the 0°–0° CCFR-PLA structure with hexahedral elements. To assess the mesh convergence, the first natural frequency was evaluated across three mesh refinement levels as depicted in Figure 4. These three mesh refinement levels were chosen based on the need to appropriately capture the reinforced fibers in the PLA matrix. For this numerical study, the 2nd refinement level, with a mesh size of 0.02 mm, was selected for meshing, as it provided the suitable results within an acceptable range. Further refinement to 0.01 mm significantly increased the computational time required for dynamic behavior and vibration control analysis. Thus, a hexahedral mesh with a size of 0.02 mm was applied separately to each composite structure and the MFC. The material specifications used for modeling are detailed in Table 1 and Table 2. The numerically modeled MFC was coupled with composite structure models replicating the experiment setup, positioned 15 mm from the fixed side. To provide a firm surface interaction between the MFC and composite structure, a tie constraint was implemented. Moreover, one side of each composite model was fixed, restricting movement in the X, Y, and Z directions. The boundary conditions applied to FEM model and actual model are illustrated in Figure 5. The upper surface of the MFC model was defined as a higher potential (U), while the bottom surface was held at 0 V.

2.2. Extraction of Modal Frequencies and Mode Shapes

The Lanczos approach has been implemented to assess the modal frequencies and relevant mode shapes in the absence of an applied force. It entirely depends on the defined material characteristics, geometry, and boundary conditions of model. The Abaqus software applies the following fundamental free vibration equations, as available in Abaqus documentation 2024 [34]. It represents the vibrating harmonic motion of the system in the absence of an external force.
y ¨ ( t ) + K y ( t ) = 0 .
In Equation (1) M illustrates mass matrix, y ¨ t is the acceleration vector, y ( t ) is the displacement vector, and K indicates the stiffness matrix.
Considering the harmonic vibrating motion of the system under analysis:
y t = ø n sin ( w n t ) .
Incorporating Equation (2) into Equation (1) and simplifying:
( K w n 2 M ) ø n = 0 .
In Equation (3), w n 2 describes the eigen values and ø n is the eigen vectors. This is a general representation of equation to determine the modal frequencies and generate mode shapes, respectively.

2.3. Amplitude Frequency Response (AFR)

The amplitude frequency response (AFR) was performed to examine the vibration amplitude as a function of frequency of each model in dynamic loading scenarios. One end of each structure was fixed, and the dynamic force was applied to the free end, as exhibited in Figure 5. The AFR depends on previously performed modal analysis as thoroughly discussed in Abaqus documentation 2024 [34] and finds out the amplitude response as function of frequency.
The overall displacement spectrum z ( t ) resulting from the implemented dynamic load can be represented as cumulative sum of each modal mode [34].
z ( t ) = n = 1 α n ø n ,
where α n is the nth modal amplitude; ø n is the nth mode shape. Equation (5) represents α n :
α n = ø n T F 0 /   w n 2 w 2 + 2 i   ʆ n w n w ,
where F 0 is applied load; w is excitation frequency; ʆ n damping ratio.
The damping ratio values for the numerical models were calculated from the actual composite models following the methodology demonstrated in the referenced article [35]. The damping ratio values were determined as 0.0340, 0.0064, 0.0100, and 0.0060 for the 0°–0° CCFR-PLA, 0°–90° CCFR-PLA, 0°–0° CGFR-PLA, and 0°–90° CGFR-PLA composites, respectively.

2.4. Vibration Control Analysis

To investigate the vibration suppression in each structure integrated with an MFC actuator, the governing equation of the system can be described as:
M z ¨ t + C z ˙ t + K z t = F e F a ,
where C is the damping matrix, z ˙ ( t ) is the velocity vector, F e is the applied external force for producing kinematic excitation in composite structure, and F a illustrates the counter force generated by MFC to suppress vibrations.
The counter force ( F a ) produce by MFC applied to structure to suppress the vibration amplitude. While C is inherent characteristics of the described system such as internal friction and other damping effects that facilitate vibration suppression.

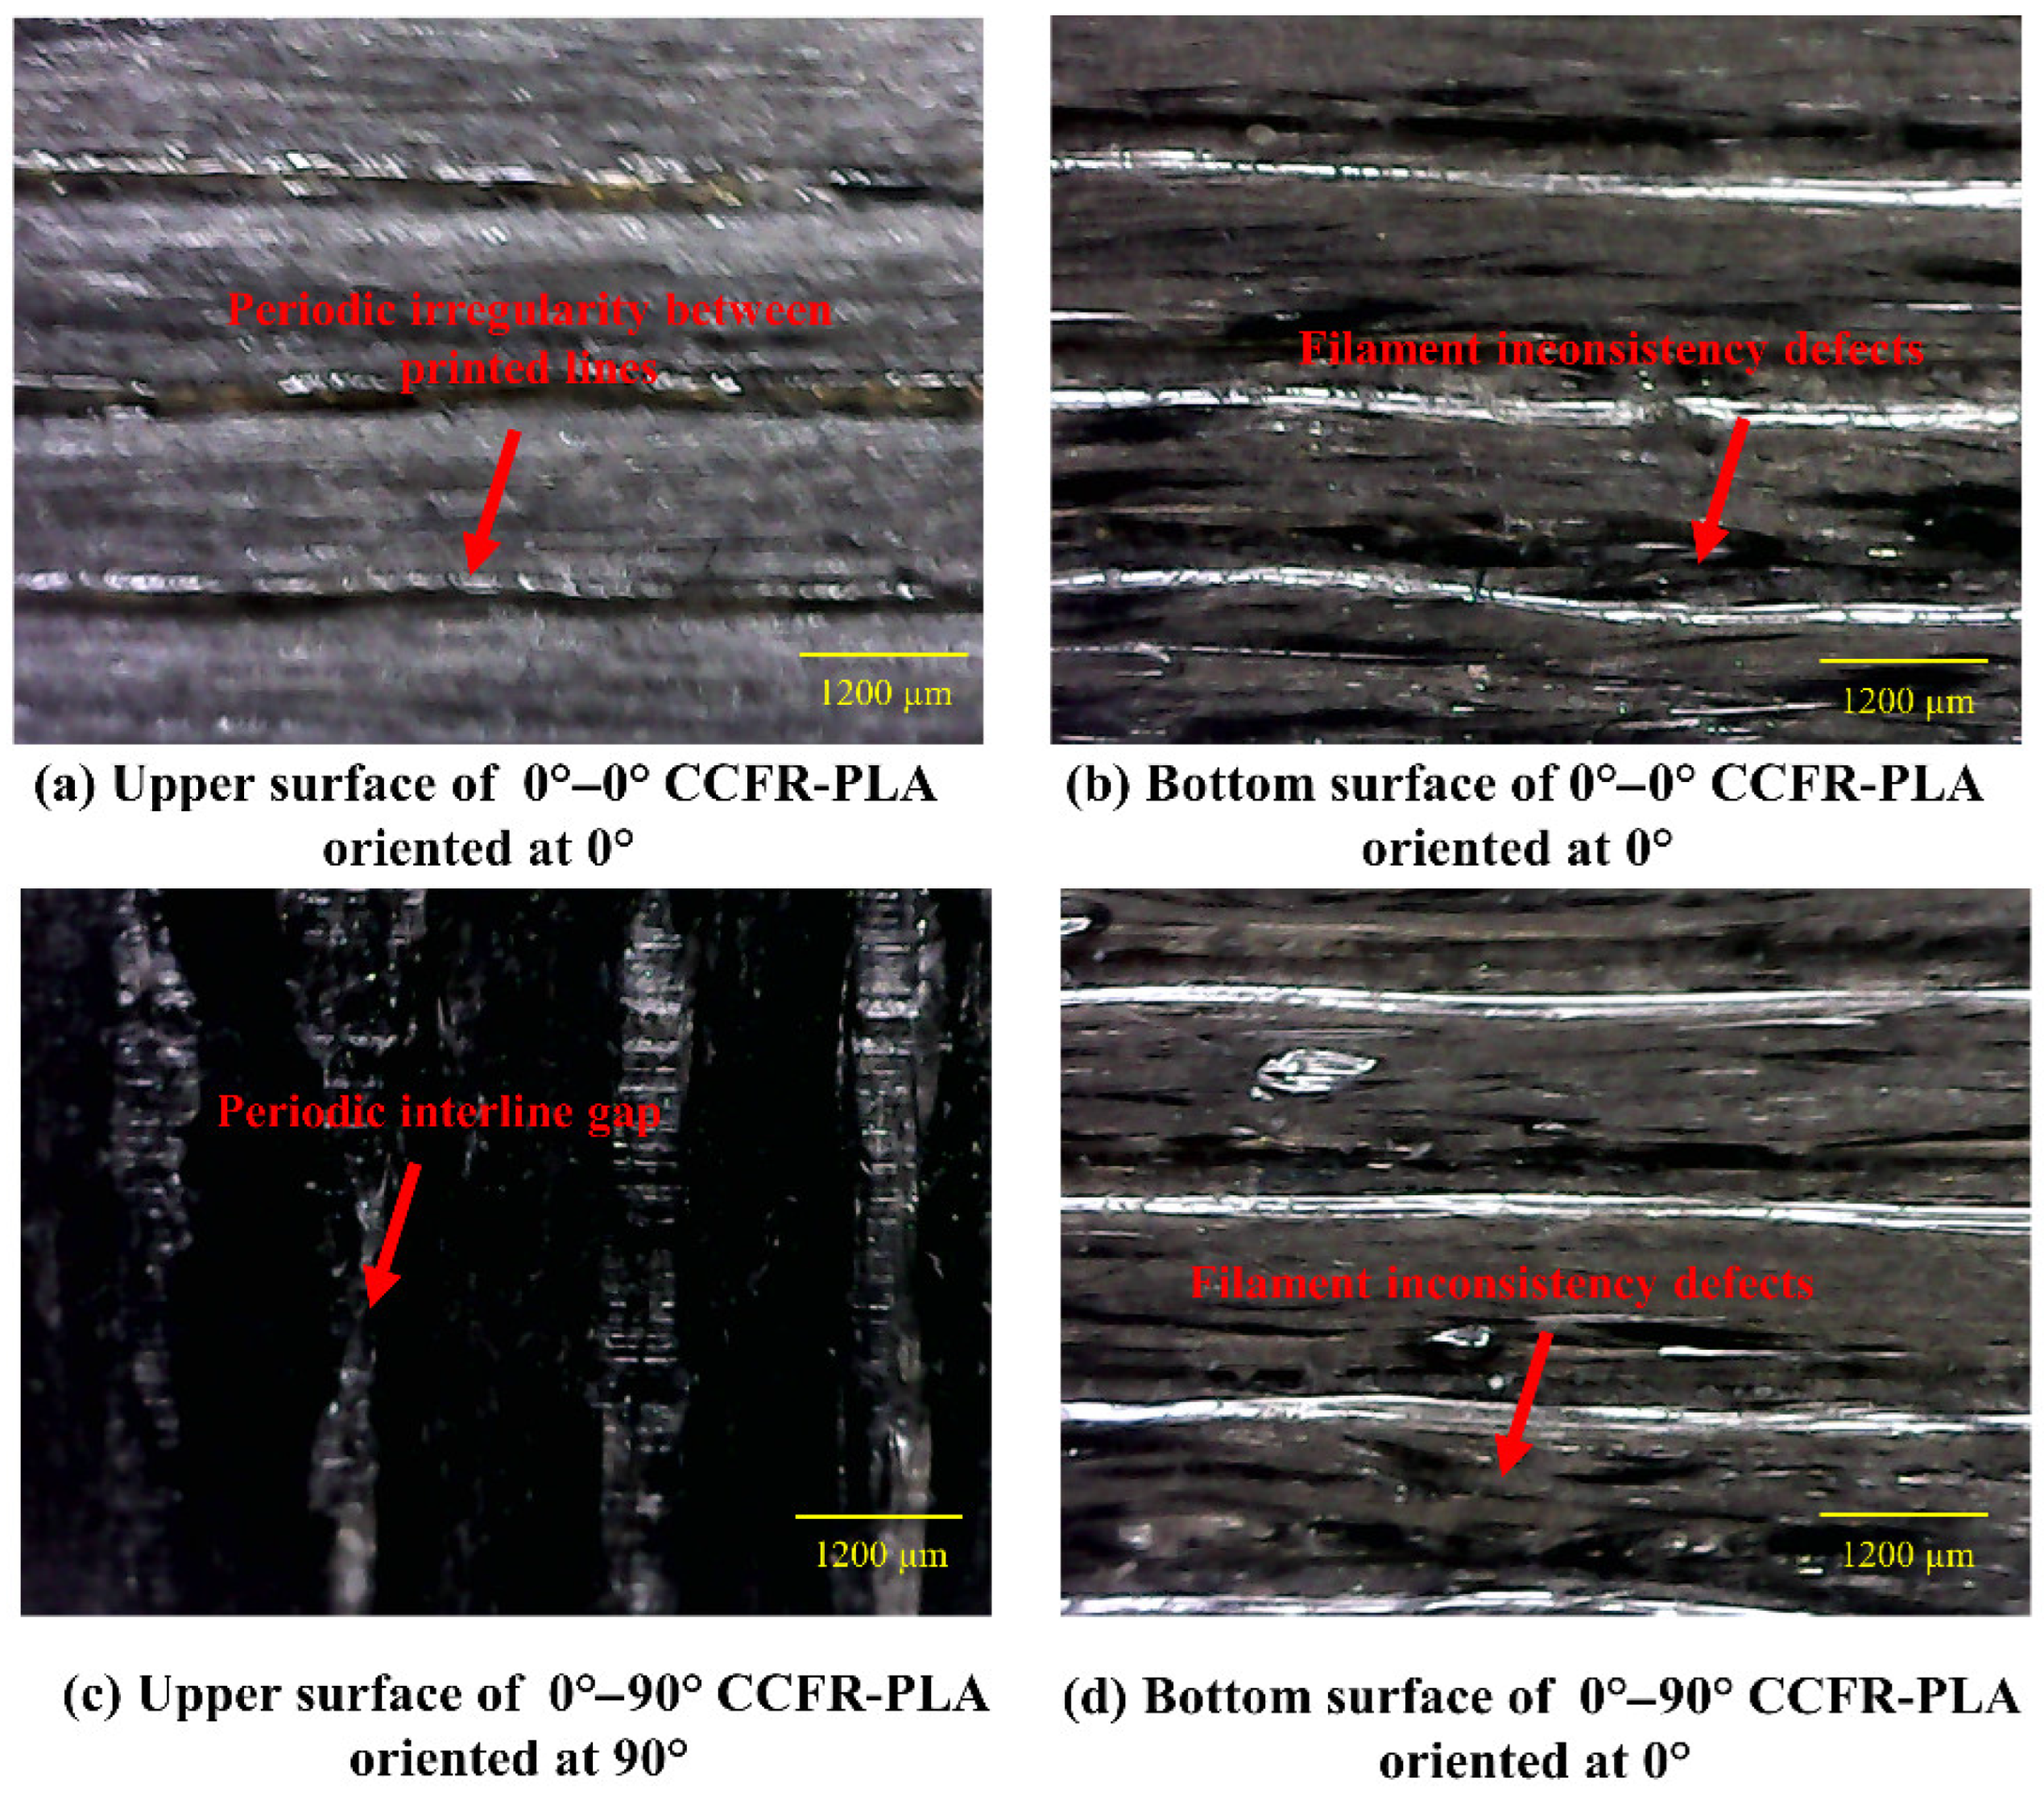
2.5. Microstructural Imaging of Composite Structures

The microstructural imaging of the top and bottom surfaces of each actual AM composite structure was performed using the portable smart microscope (G600, China). This digital microscope has a magnification range of 1–600×. The top and bottom surfaces of each composite structure were analyzed, with magnification adjusted between 1× and 600× until voids and fiber misalignments in AM composites were clearly visible. The upper and bottom surfaces of the CCFR-PLA and CGFR-PLA composite structures with 0°–0° and 0°–90° orientations, highlighting voids and misalignments on the surfaces, are illustrated in Figure 6 and Figure 7, respectively.

3. Results and Discussions

The investigation of dynamic properties and vibration amplitude suppression in CCFR-PLA and CGFR-PLA composite structures with 0°–0° and 0°–90° orientations was conducted using the Abaqus platform. Additionally, the obtained findings were compared with the previously published experimental results for validation.

3.1. Assessment of Modal Frequencies and Mode Shapes

In this section, the numerical modal frequencies and associated mode shapes of the first four bending modes of each composite structure integrated with MFC (M8507/P2) patch were determined. The modal frequencies of CCFR-PLA and CGFR-PLA composite structures both with 0°–0° and 0°–90° orientations, are reported in Table 3, while their associated numerical mode shapes are depicted in Figure 8 and Figure 9, respectively. Each numerical model requires about 30 min to compute modal frequency and associated mode shapes.
As observed in Table 3, the numerical frequencies of the 1st bending modes closely match the experimental frequencies, with differences of 0.83%, 5.60%, 4.85%, and 4.55%, respectively, for 0°–0° CCFR-PLA, 0°–0° CGFR-PLA, 0°–90° CCFR-PLA, and 0°–90° CGFR-PLA. In the 2nd bending modes, the differences are 4.18% and 3.31% for CCFR-PLA and CGFR-PLA with both 0°–0° orientations, respectively, while in the 0°–90° case, comparatively higher errors are observed: 13.48% and 16.28%. In the 3rd bending modes, the differences are 2.95% and 1.59% for CCFR-PLA and CGFR-PLA with both the 0°–0° orientations, respectively, and 10.84% and 14.66% for the 0°–90° orientation, respectively. In the 4th bending modes, the differences are 0.10% and 0.81% for CCFR-PLA and CGFR-PLA with both 0°–0° orientations, and 10.68% and 11.32% for the 0°–90° case, respectively. The percentage error in experimental and numerical bending mode frequencies are illustrated in Figure 10. Several factors are attributed to the discrepancy between the numerical and experimental higher modes frequencies, especially in the 0°–90° orientation scenarios. This is attributed to misalignment, voids (see Figure 6 and Figure 7) in the actual AM composite structures, as well as complex inherent properties that were not incorporated into numerical models. Secondly, the incomplete incorporation of boundary conditions in the numerical scenario contributes to the deviations from the experimental results. Specifically, in the numerical scenario, the composite structures were firmly fixed from one side, whereas in the experimental scenario, they were fixed within a fixture. There is also the possibility of slippage of the actual structure within the fixture during vibration, causing significant variations in the modal frequencies.

3.2. Assessment of Amplitude Frequency Response (AFR)

Figure 11 illustrates the AFR of CCFR-PLA and CCFR-PLA models with 0°–0° and 0°–90° orientations. The AFR exhibits the absolute magnitude of vibration amplitude ∣Y(ω)∣ in meter (m) as function of frequency (f) in Hertz (Hz). The measurements are demonstrated in the logarithmic scale rather than linear one to enhance the visualization of the vibration amplitude response across the entire frequency range.
Figure 11a presents the experimental frequency responses, obtained using a 3D laser vibrometer (PSV-W-500, Polytech GmbH, Germany) [30], while Figure 11b exhibits the numerical simulation responses obtained using Abaqus. To evaluate the numerical dynamic response of each composite structure one side was fixed and other free end was subjected to sinusoidal excitation force of ±1 × 10⁻⁸ N.
The experimental and numerical AFR results highlight the bending vibration responses of each model, indicating distinct peaks as depicted in Figure 11.
The experimental AFR in Figure 11a exhibits significant variability and noise in high bending mode peaks, which is typically expected during real-world measurements. The 3D laser vibrometer offers high precision measurement; however, the factors such as low surface reflectivity of specimens and ambient vibrations can still introduce such variations. Additionally, imperfections in actual AM models such as misalignments, voids (see Figure 6 and Figure 7) and inconsistencies in the boundary conditions further contribute to these variations in AFR.
In contrast, the numerical AFR in Figure 11b shows comparatively smoother and more prominent distinct bending mode peaks. This is due to the idealized modeling of numerical models and consistency in boundary conditions.
Both experimental and numerical results show different absolute values of vibration amplitude as function of frequency. However, a clear consistency in trends is observed, such as the first bending modes showing the highest vibration amplitude and the fourth bending mode the lowest.
For the 0°–0° oriented composite structures, the numerical results indicate that the vibration amplitudes at the first natural frequency were observed to be the highest as follows: 1.89 µm at 60.5 Hz for CCFR-PLA and 3.17 µm at 45.03 Hz for CGFR-PLA. The corresponding experimental vibration amplitudes at the first natural frequency were determined: 4.14 µm at 60.0 Hz for CCFR-PLA and 4.40 µm at 47.7 Hz for CGFR-PLA.
In the 0°–90° oriented composite structures scenario, the numerical results reveal that the highest vibration amplitudes at the first natural frequency were observed as follows: 8.03 µm at 27.89 Hz for CCFR-PLA and 12.22 µm at 22.27 Hz for CGFR-PLA. The corresponding experimental vibration amplitudes at the first natural frequency were determined: 10.11 µm at 26.6 Hz for PLAP-CCF and 9.26 µm at 21.3 Hz for CGFR-PLA.

3.3. Vibration Amplitude Control Analysis

This section provides a comprehensive analysis of vibration control of numerical models, focusing on identifying the trends in vibration control responses rather than assessing the fully predictive absolute values. Additionally, these numerical results are compared and validated with experimental data to ensure consistency [30].
The numerical models CCFR-PLA composite structure with 0°–0° and the 0°–90° orientations were externally excited at their corresponding first resonant frequencies of 60.5 Hz and 27.89 Hz, respectively. The numerical uncontrolled vibration amplitude responses were noted about ±222 µm for 0°–0° CCFR-PLA, as presented in Figure 12a, and +555 µm to −540 µm for 0°–90° CCFR-PLA, as presented in Figure 13a. The experimental uncontrolled responses were observed as ±210 µm for 0°–0° CCFR-PLA (Figure 12a), and +514 µm to −2545 µm for 0°–90° CCFR-PLA (Figure 13a). The 0°–0° oriented models exhibit significantly lower peak-to-peak vibration amplitude as compared to corresponding models with 0°–90° orientation. In the 0°–0° orientation, the reinforced fiber layers within the matrix are aligned along the same longitudinal axis (bending axis). Thus, this configuration provides maximum stiffness in that direction due to strong bonding between the layers, resulting in lower vibration amplitude (i.e., less deformation) under external excitation. Whereas, in the 0°–90° orientation, the fiber layers are oriented perpendicular to each other. This configuration reduces stiffness due to weak bonding between fiber layers, resulting in higher vibration amplitude under external excitation [35].
After introducing the counteracting force through MFC (M8507/P2), the numerical controlled vibration amplitude was about ±13 µm for 0°–0° CCFR-PLA, as depicted in Figure 12b, and about ±22.5 µm for 0°–90° CCFR-PLA as presented in Figure 13b. The corresponding experimental responses were ±1.7 µm (Figure 12b) and +6.15 µm to −6.4 µm (Figure 13b). Moreover, numerical control responses of CCFR-PLA structures were smoother than the corresponding experiment results. This difference is caused by the ambient environment factors, including noise influencing the experimental control responses which were not incorporated in the numerical simulation.
In numerical models of CGFR-PLA, the uncontrolled vibration responses were noted to be about ±252 µm for 0°–0° CGFR-PLA, as illustrated in Figure 14a and about ±818 µm for 0°–90° CGFR-PLA as illustrated in Figure 15a. The corresponding experimental responses were about ±241 µm (Figure 14a) and +785 µm to −810 µm (Figure 15a), respectively.
The numerical controlled amplitude was about ±14.3 µm for 0°–0° CCFR-PLA, as illustrated in Figure 14b, and about ±25 µm for 0°–90° CCFR-PLA as presented in Figure 15b. The corresponding experimental responses were +2.9 µm to −2.4 µm (Figure 14b) and +8.5 µm to −12.2 µm (Figure 15b).
The numerically control responses of CGFR-PLA structures were observed to be more uniform than the corresponding experimental results. However, in the experiment scenario, particularly for the 0°–90° CGFR-PLA structure exhibited in Figure 15b, the response was significantly affected by the ambient environment. This is mainly due to the high flexibility of the glass fiber, which has significantly lower Young’s modulus compared to carbon fiber (reported in Table 2). Moreover, the printed fiber layers are configured perpendicular to each other, leading to enhanced flexibility. This flexible nature makes the 0°–90° CGFR-PLA more susceptible to ambient environment, resulting in fluctuations in the controlled amplitude.
The numerical models exhibited vibration suppression of approximately 94%, while the experimental models demonstrated a higher suppression of approximately 99%. The overall discrepancy between the numerical and experimental results arises from the modeling simplifications inherent in the numerical approach. The MFC actuator has been numerically modeled by considering homogenous material rather than a non-uniform one, as referred to in the literature [1]. Moreover, the voids and misalignments (refer to Figure 6 and Figure 7) in the actual AM models have not been introduced in the numerical models. The environmental factors (i.e., noise) and fixture damping characteristics of experimental scenario have not been incorporated in the numerical simulation. These factors have a significant influence on the vibration amplitude suppression. However, the trend of results in both scenarios reveal that models with 0°–0° orientation demonstrated significantly higher vibration amplitude suppression compared to 0°–90° oriented structures. Moreover, the CCFR-PLA structure with 0°–0° and 0°–90° orientation, demonstrated higher vibration suppression compared to corresponding CCFR-PLA structures.

4. Conclusions

This study evaluated the dynamic properties and vibration control of numerical models of AM composites including CCFR-PLA and CGFR-PLA with 0°–0° and 0°–90° layer orientations. Additionally, the achieved results have been compared and validated with the experimental results to confirm the reliability of the numerical approach.
The following key insights are presented below:
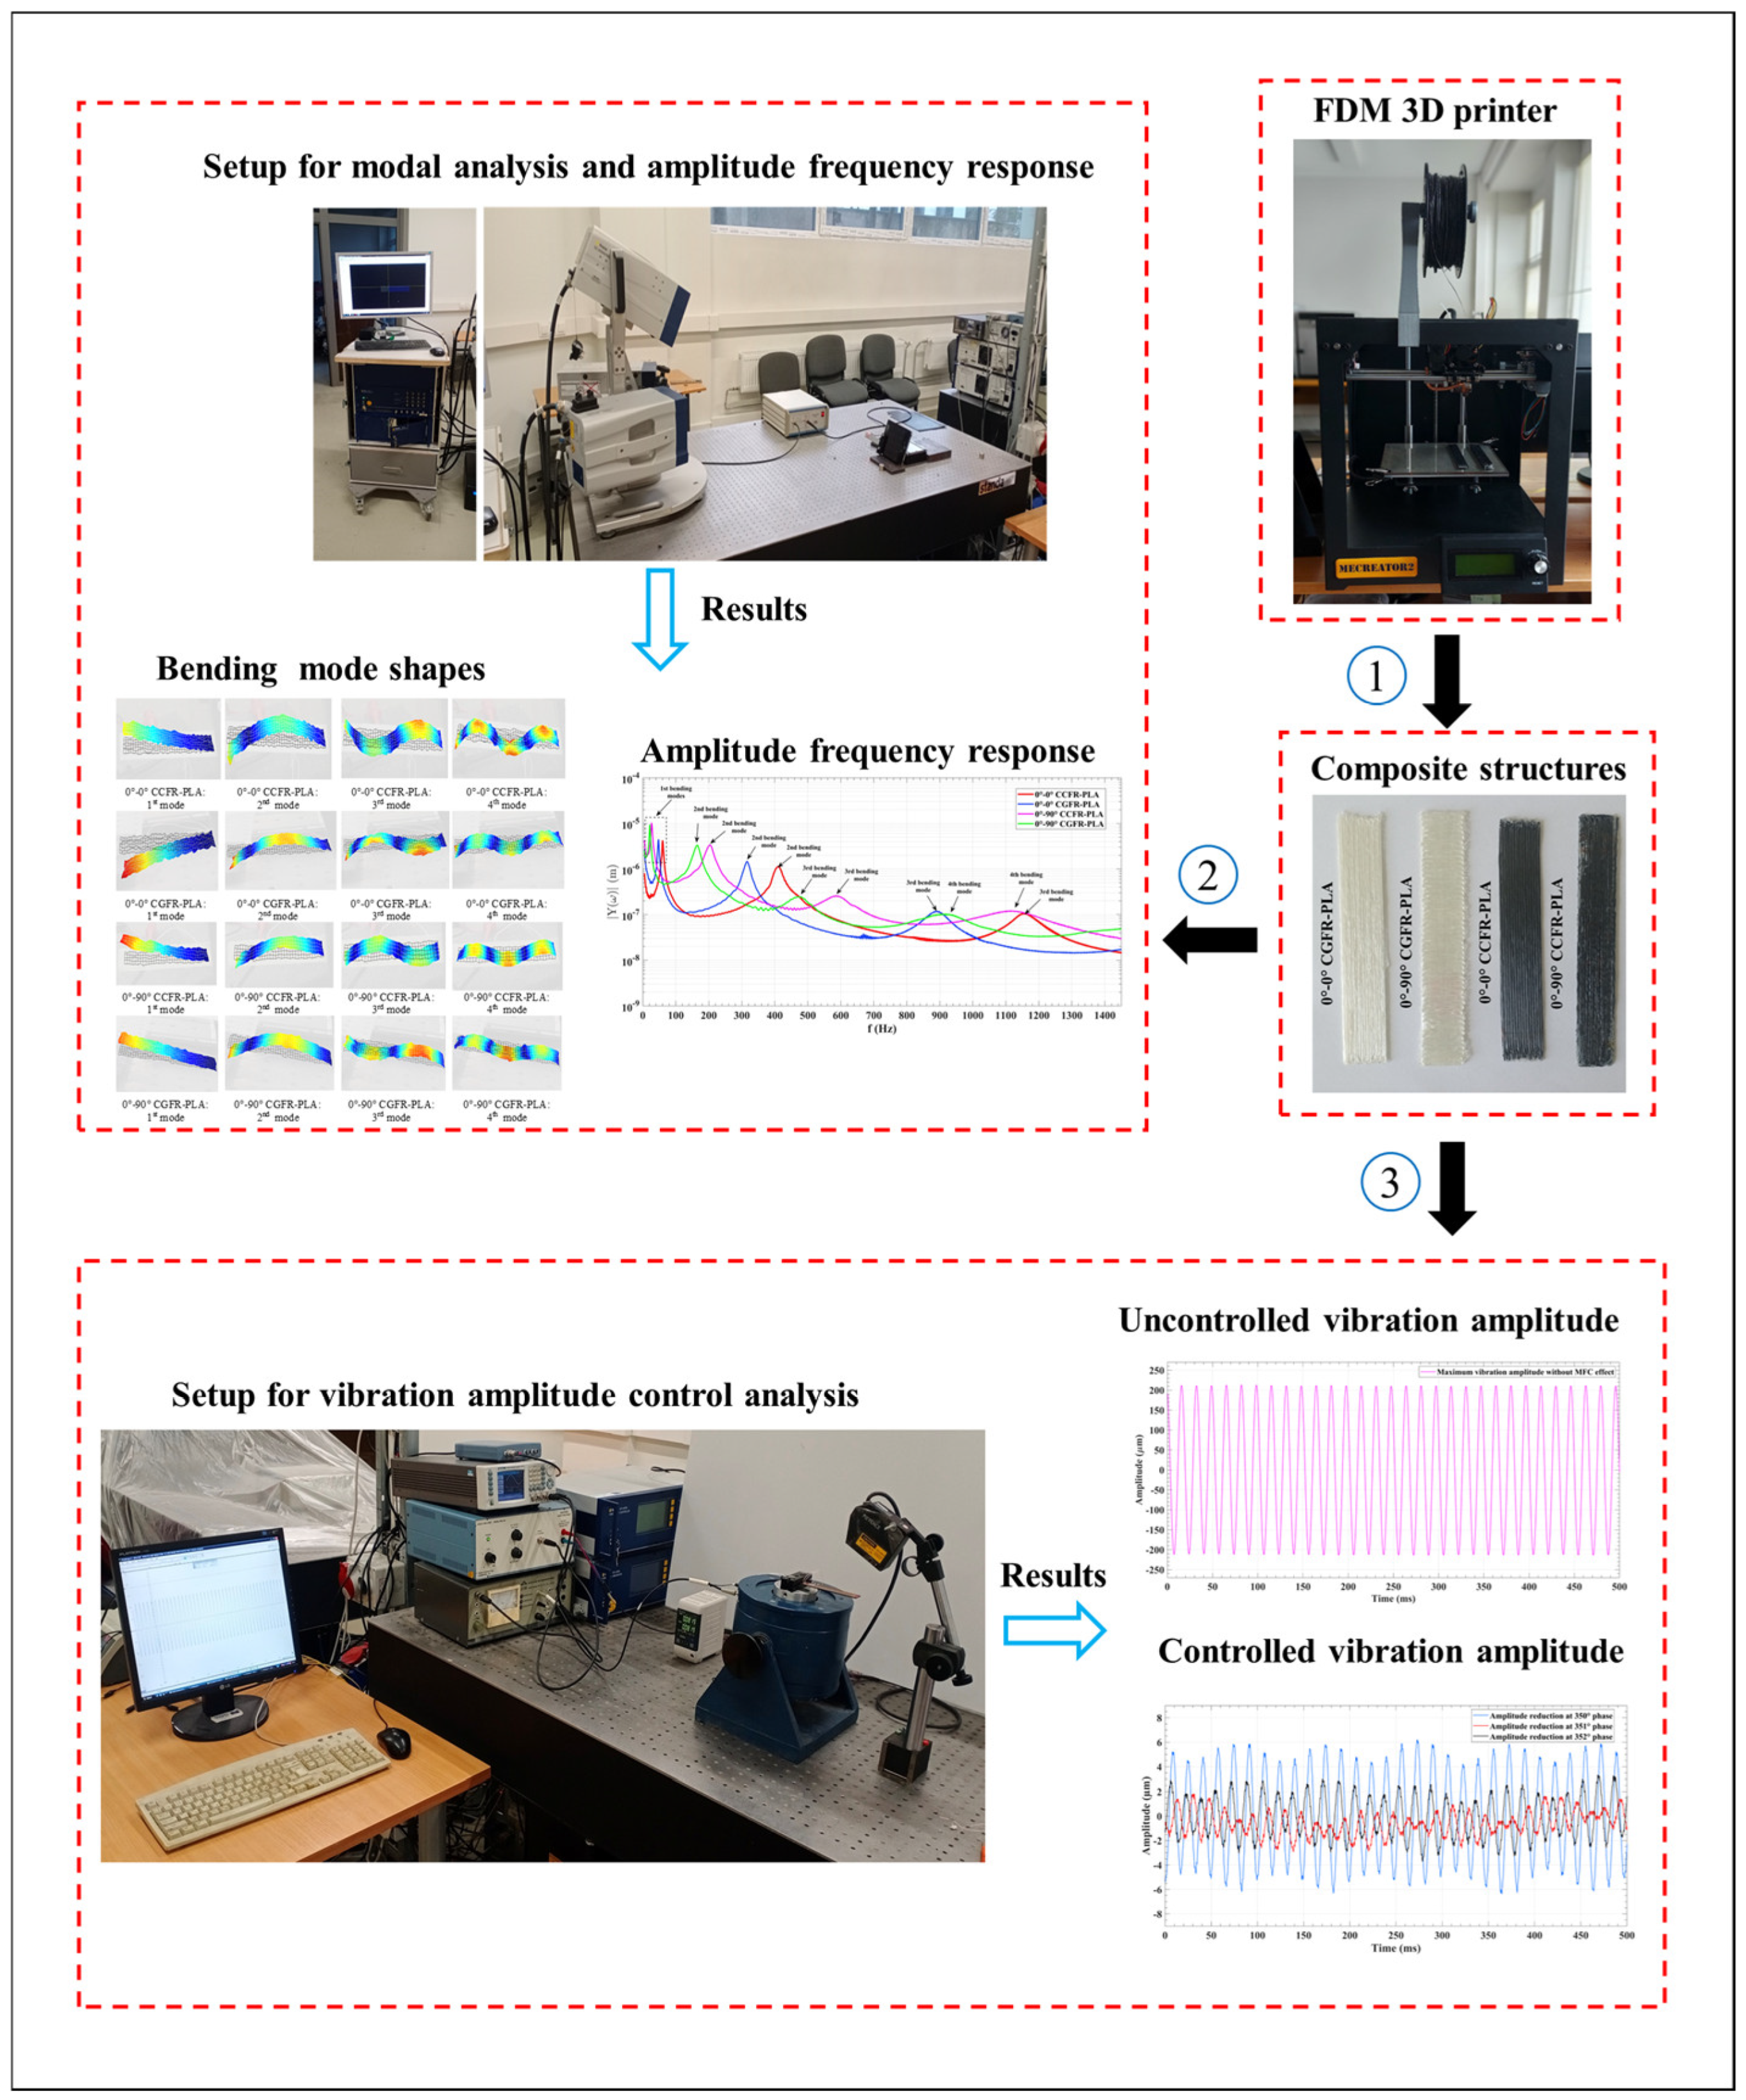
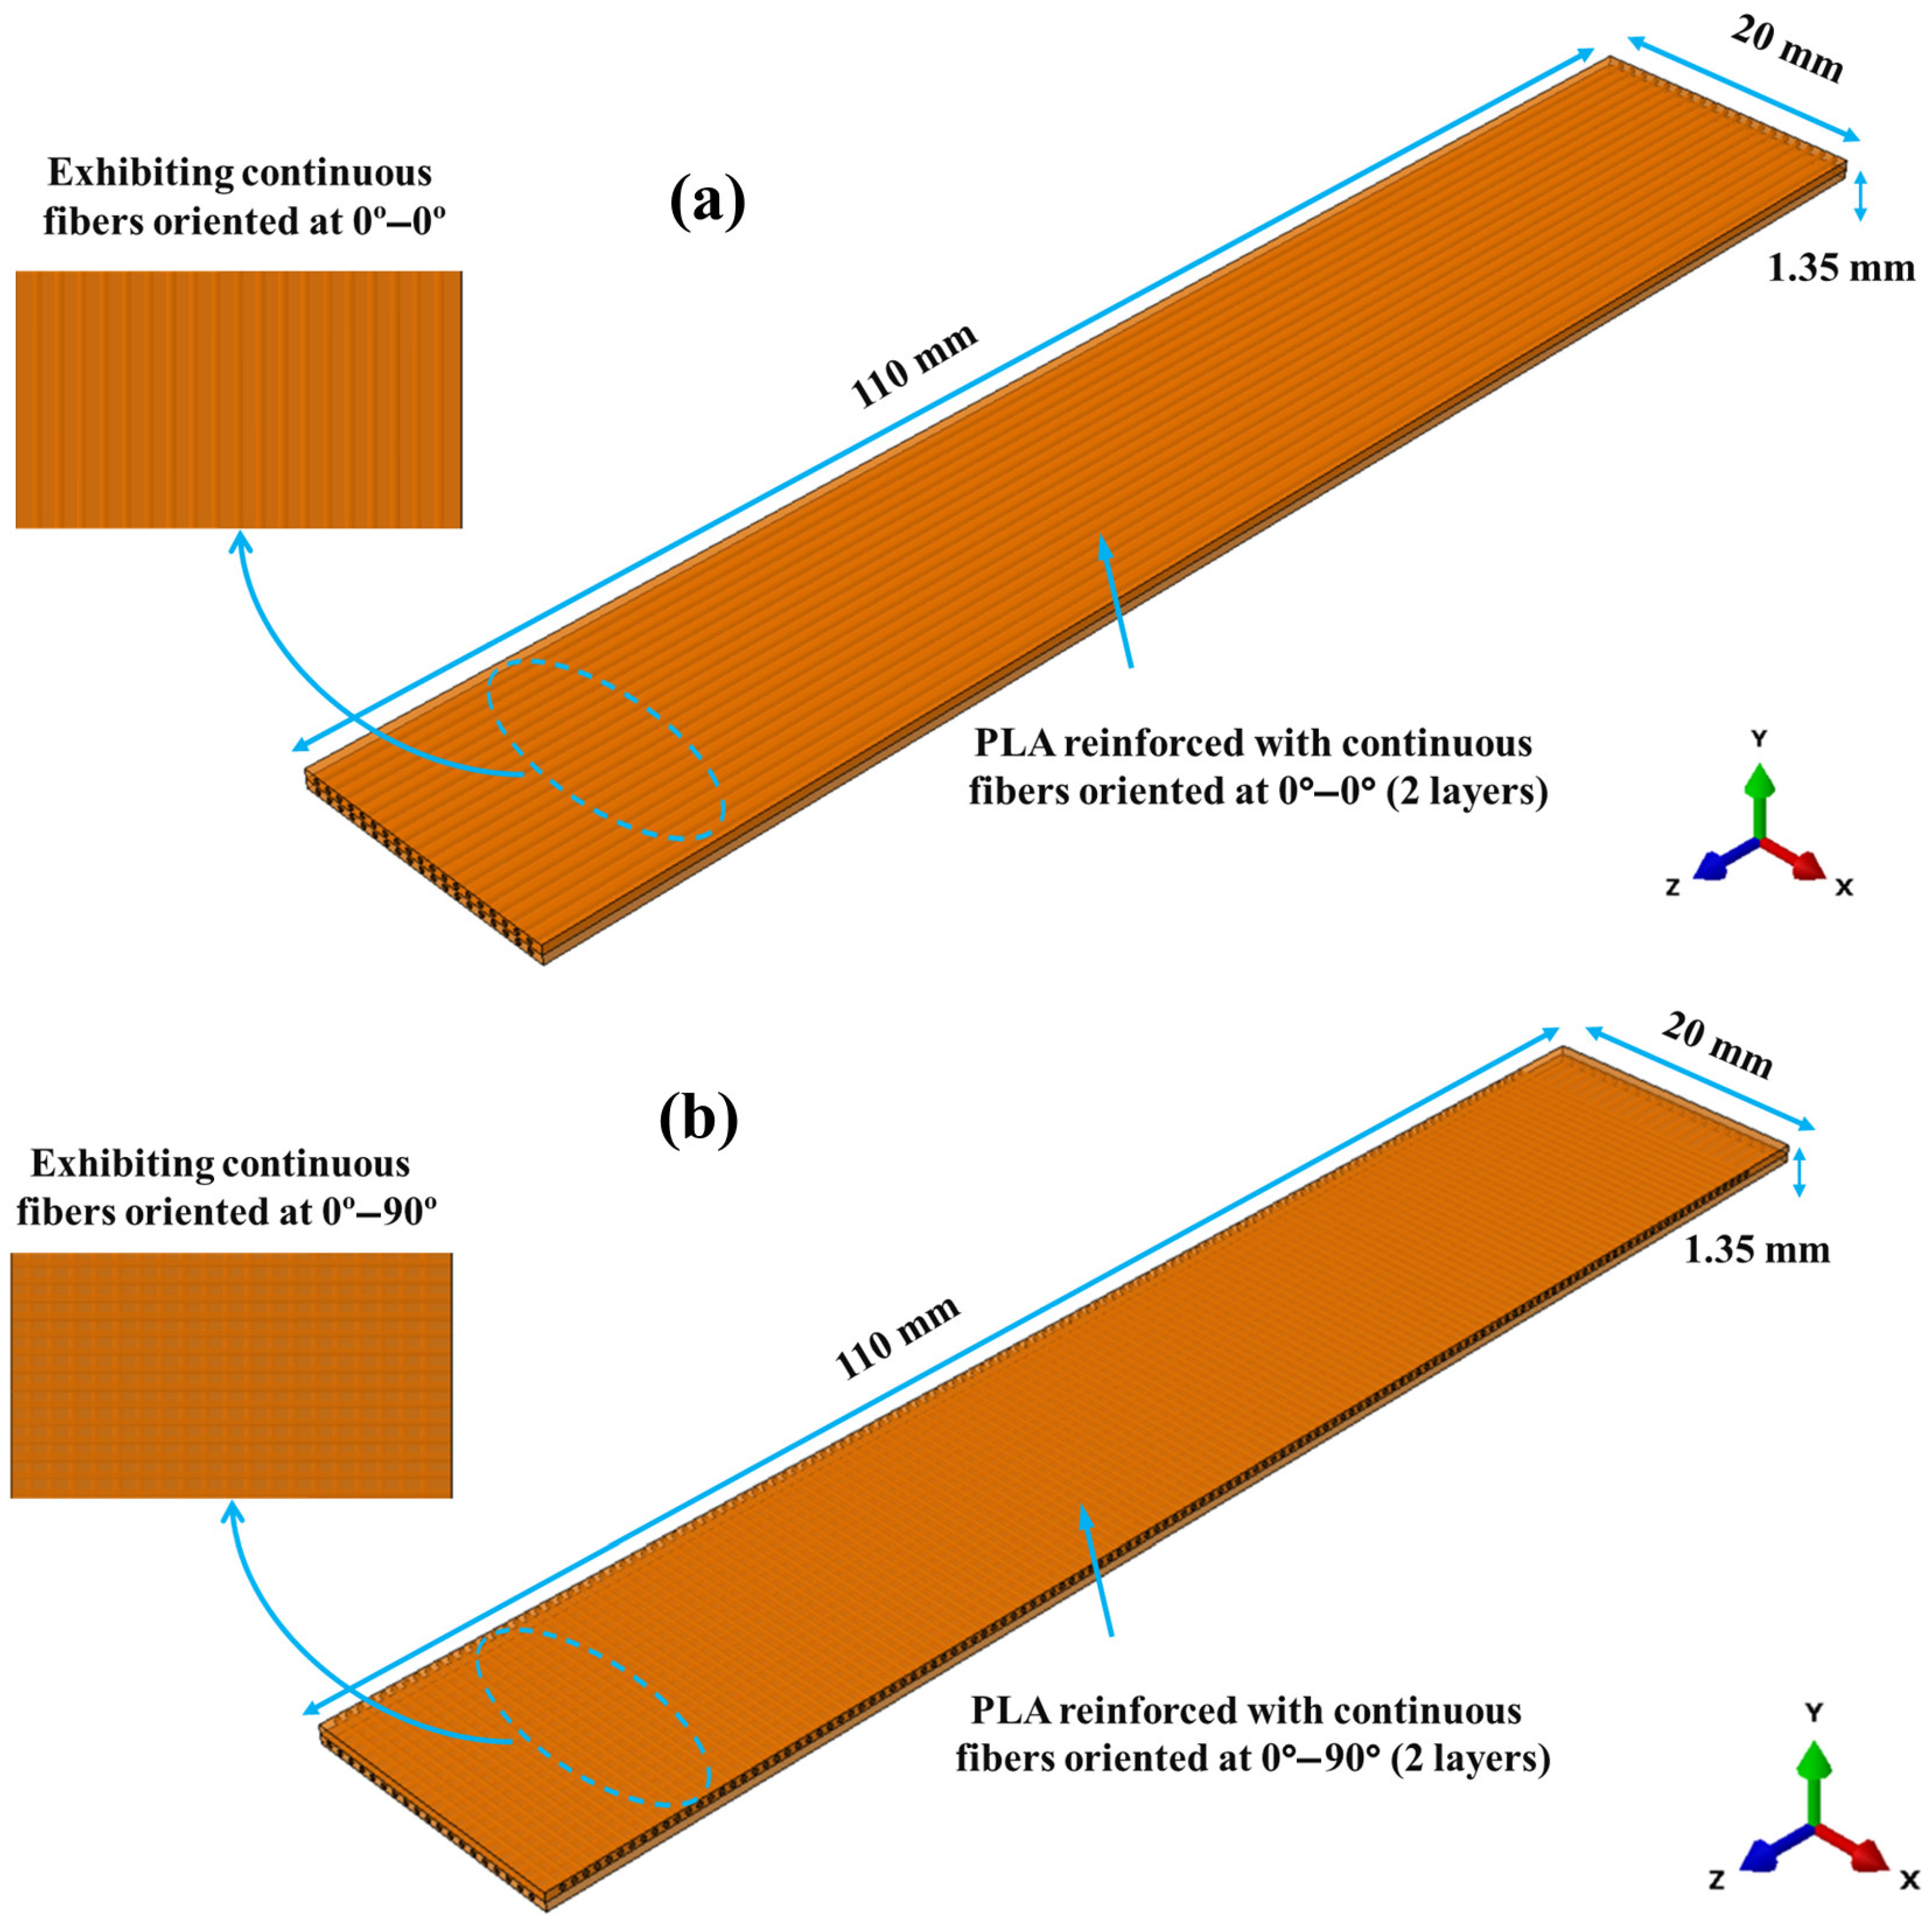
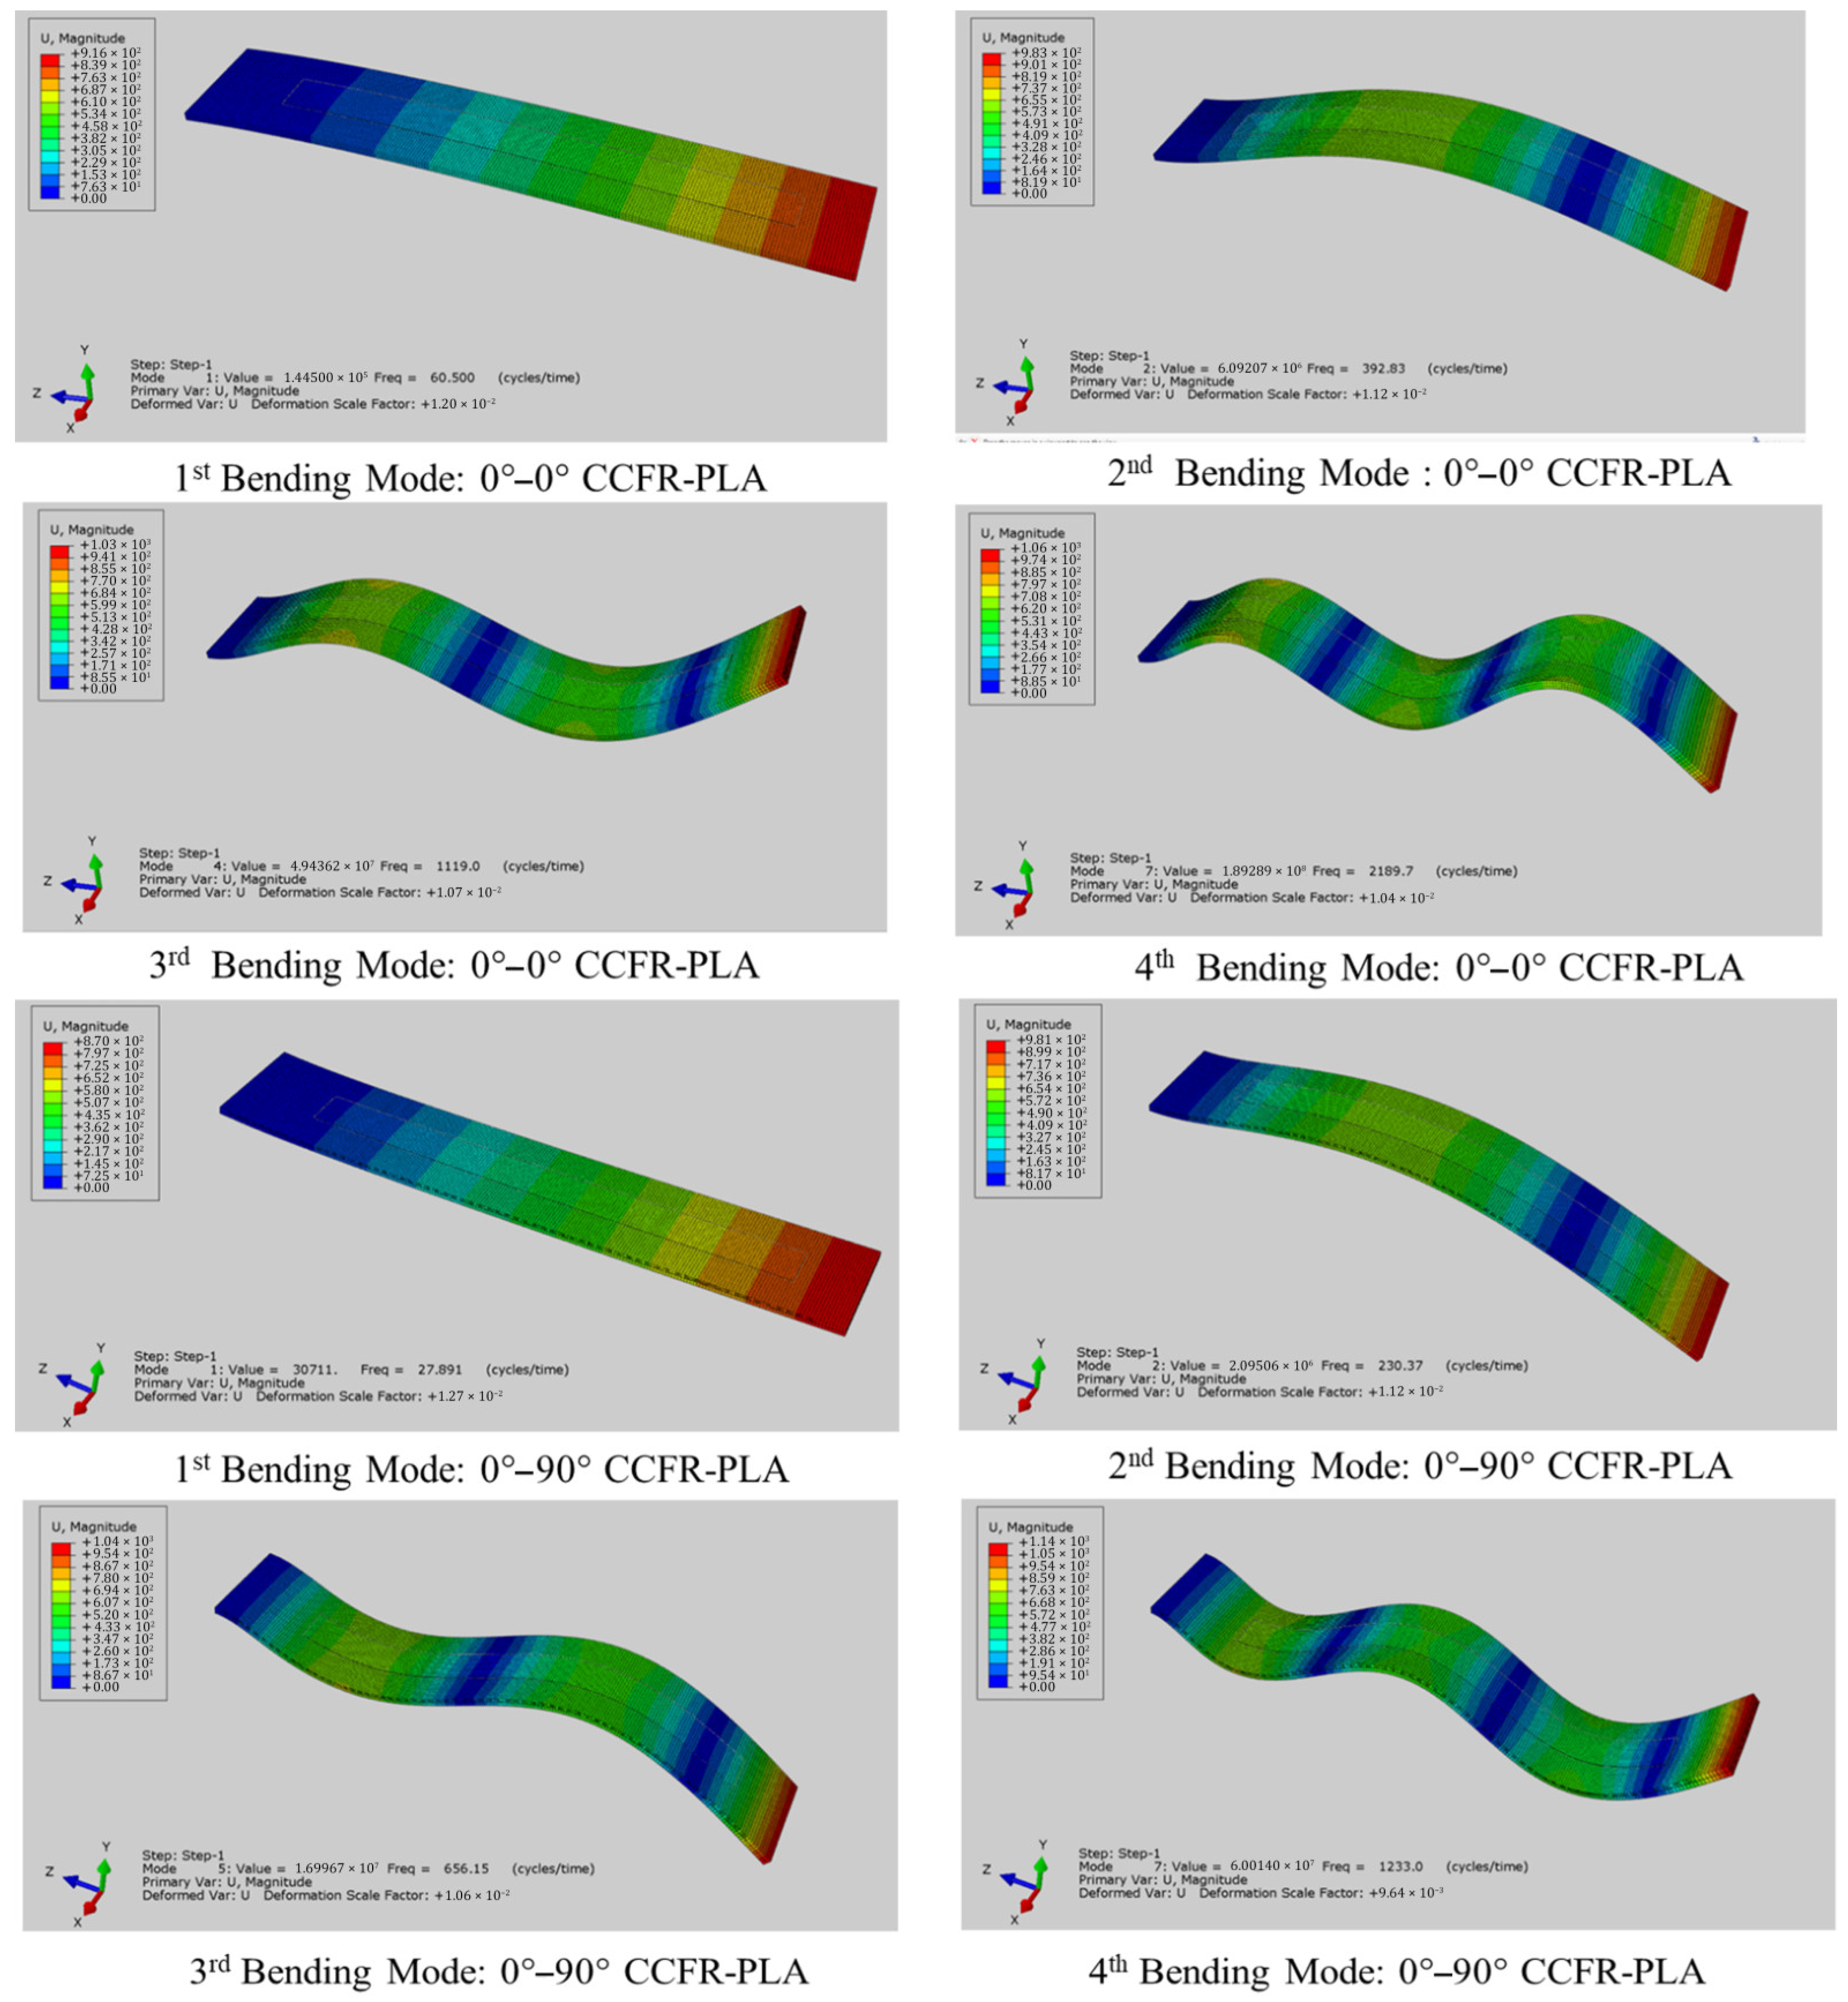
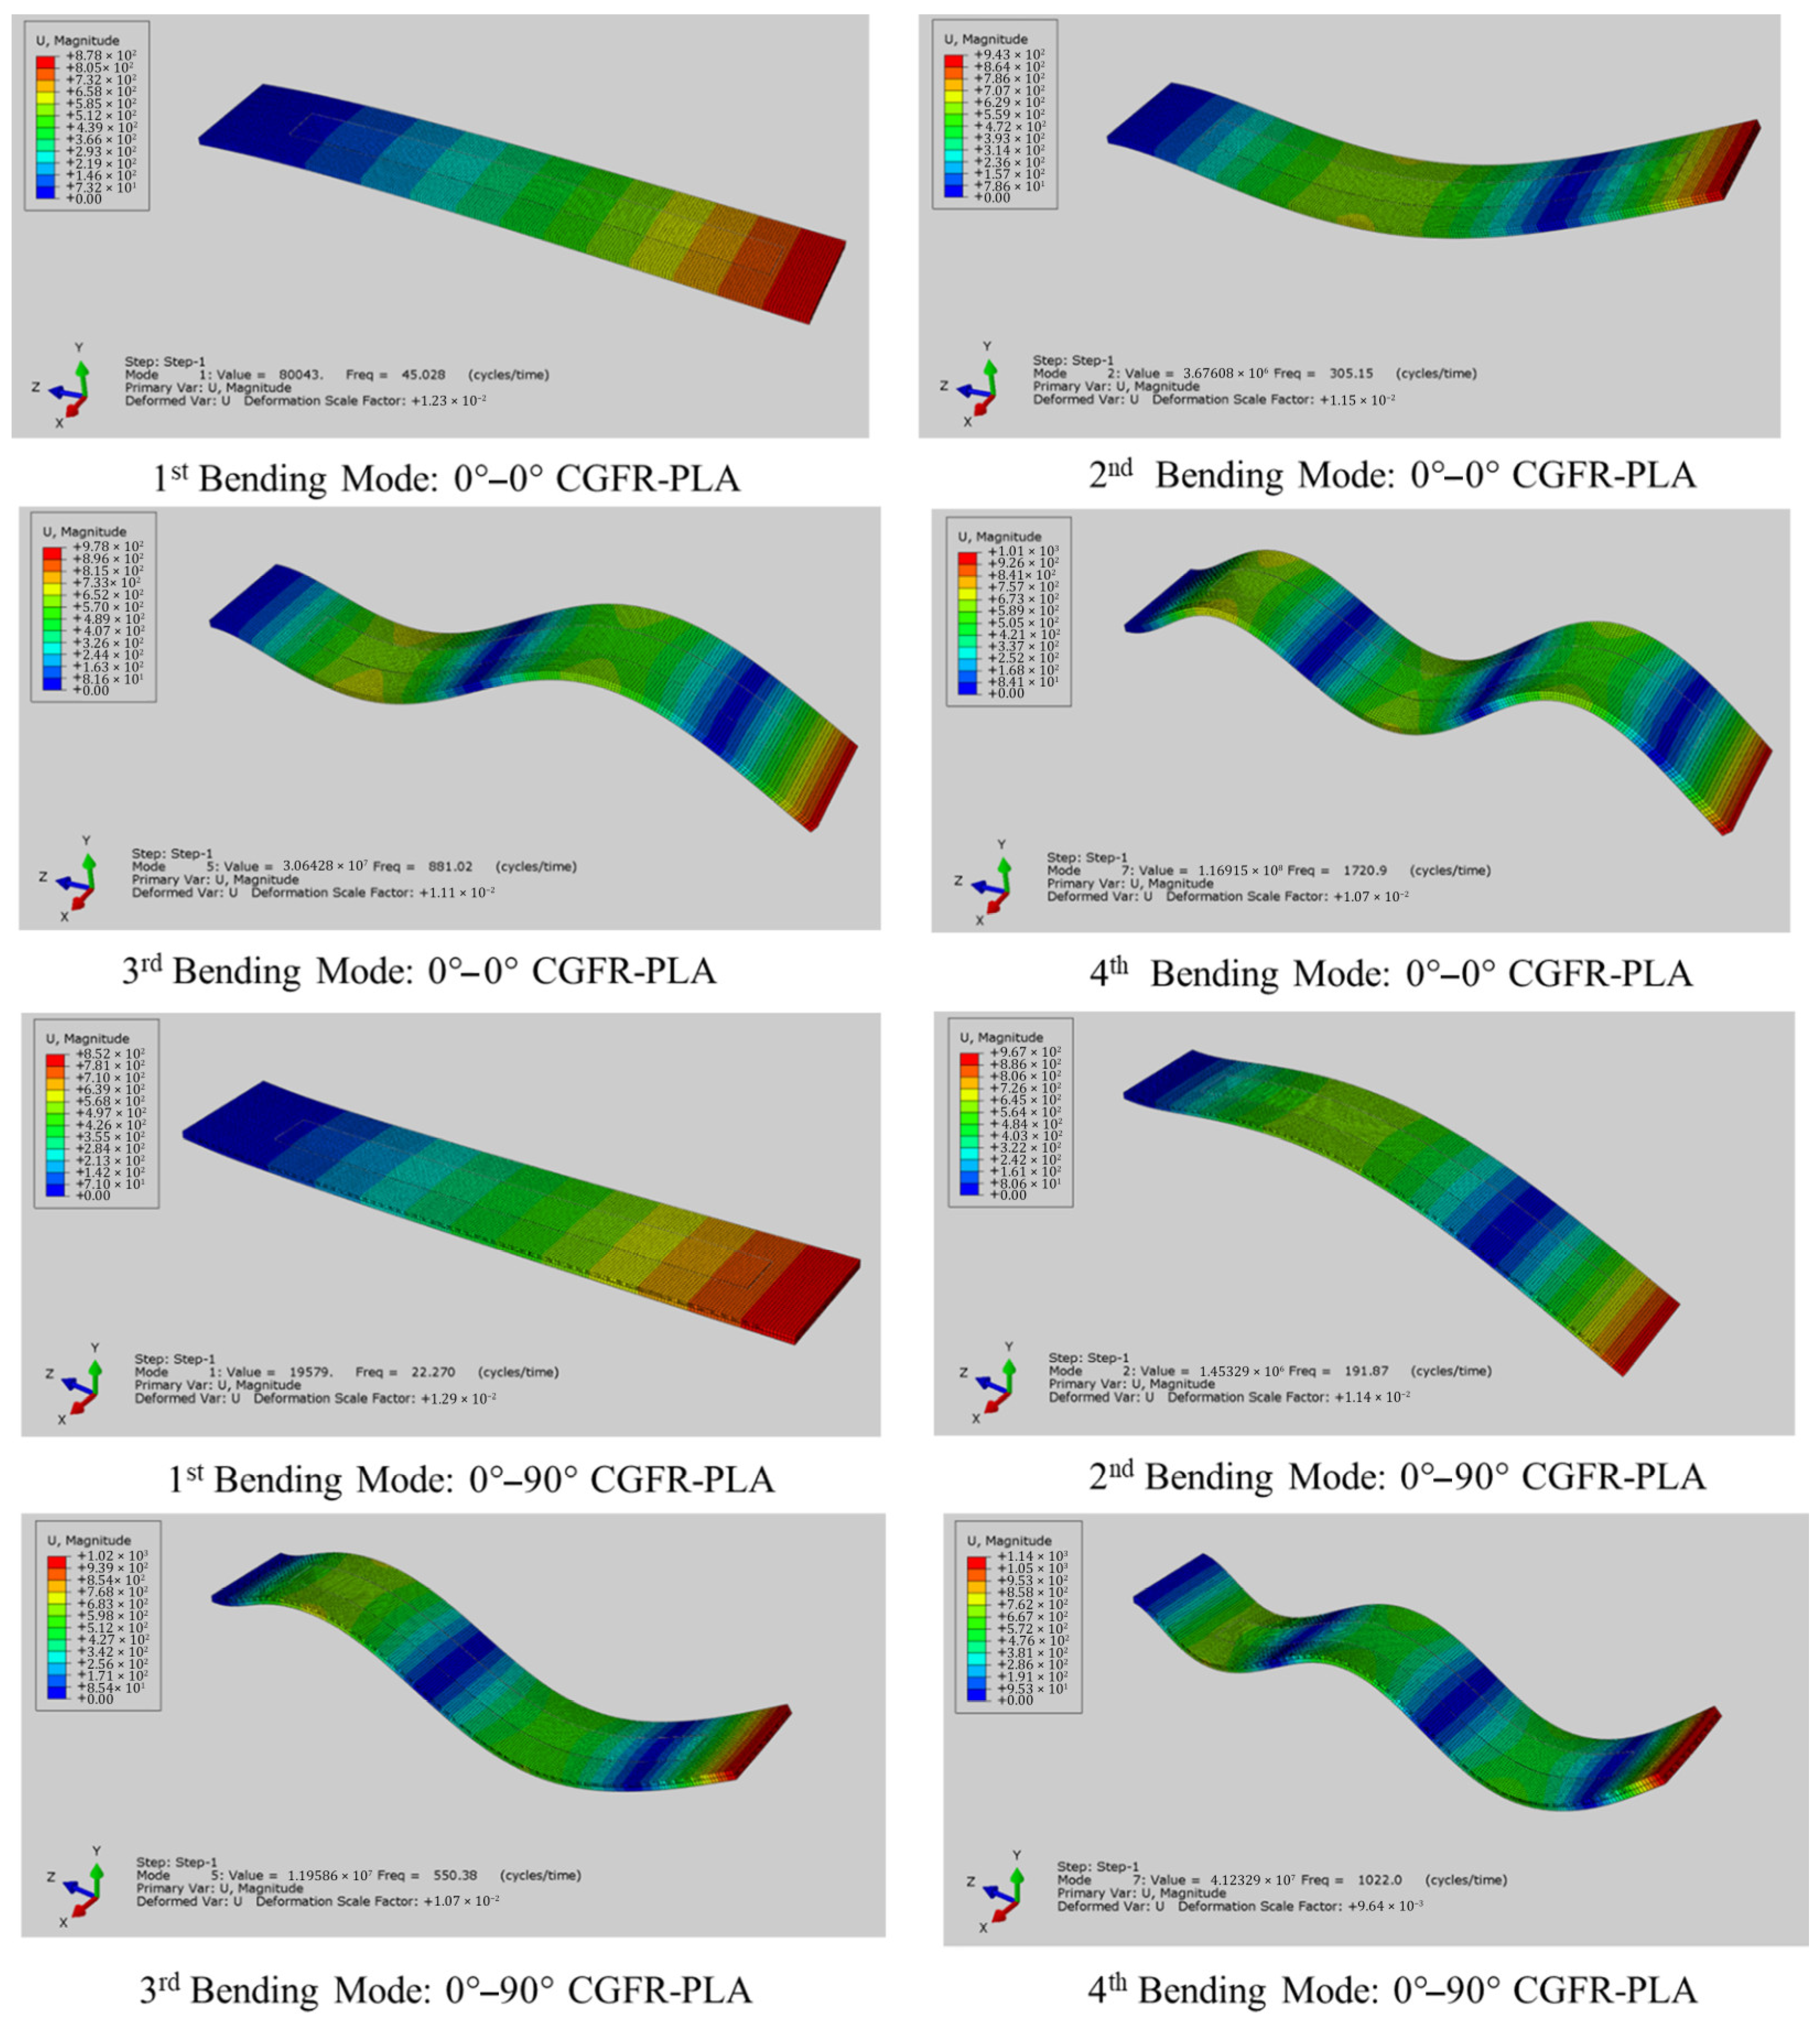
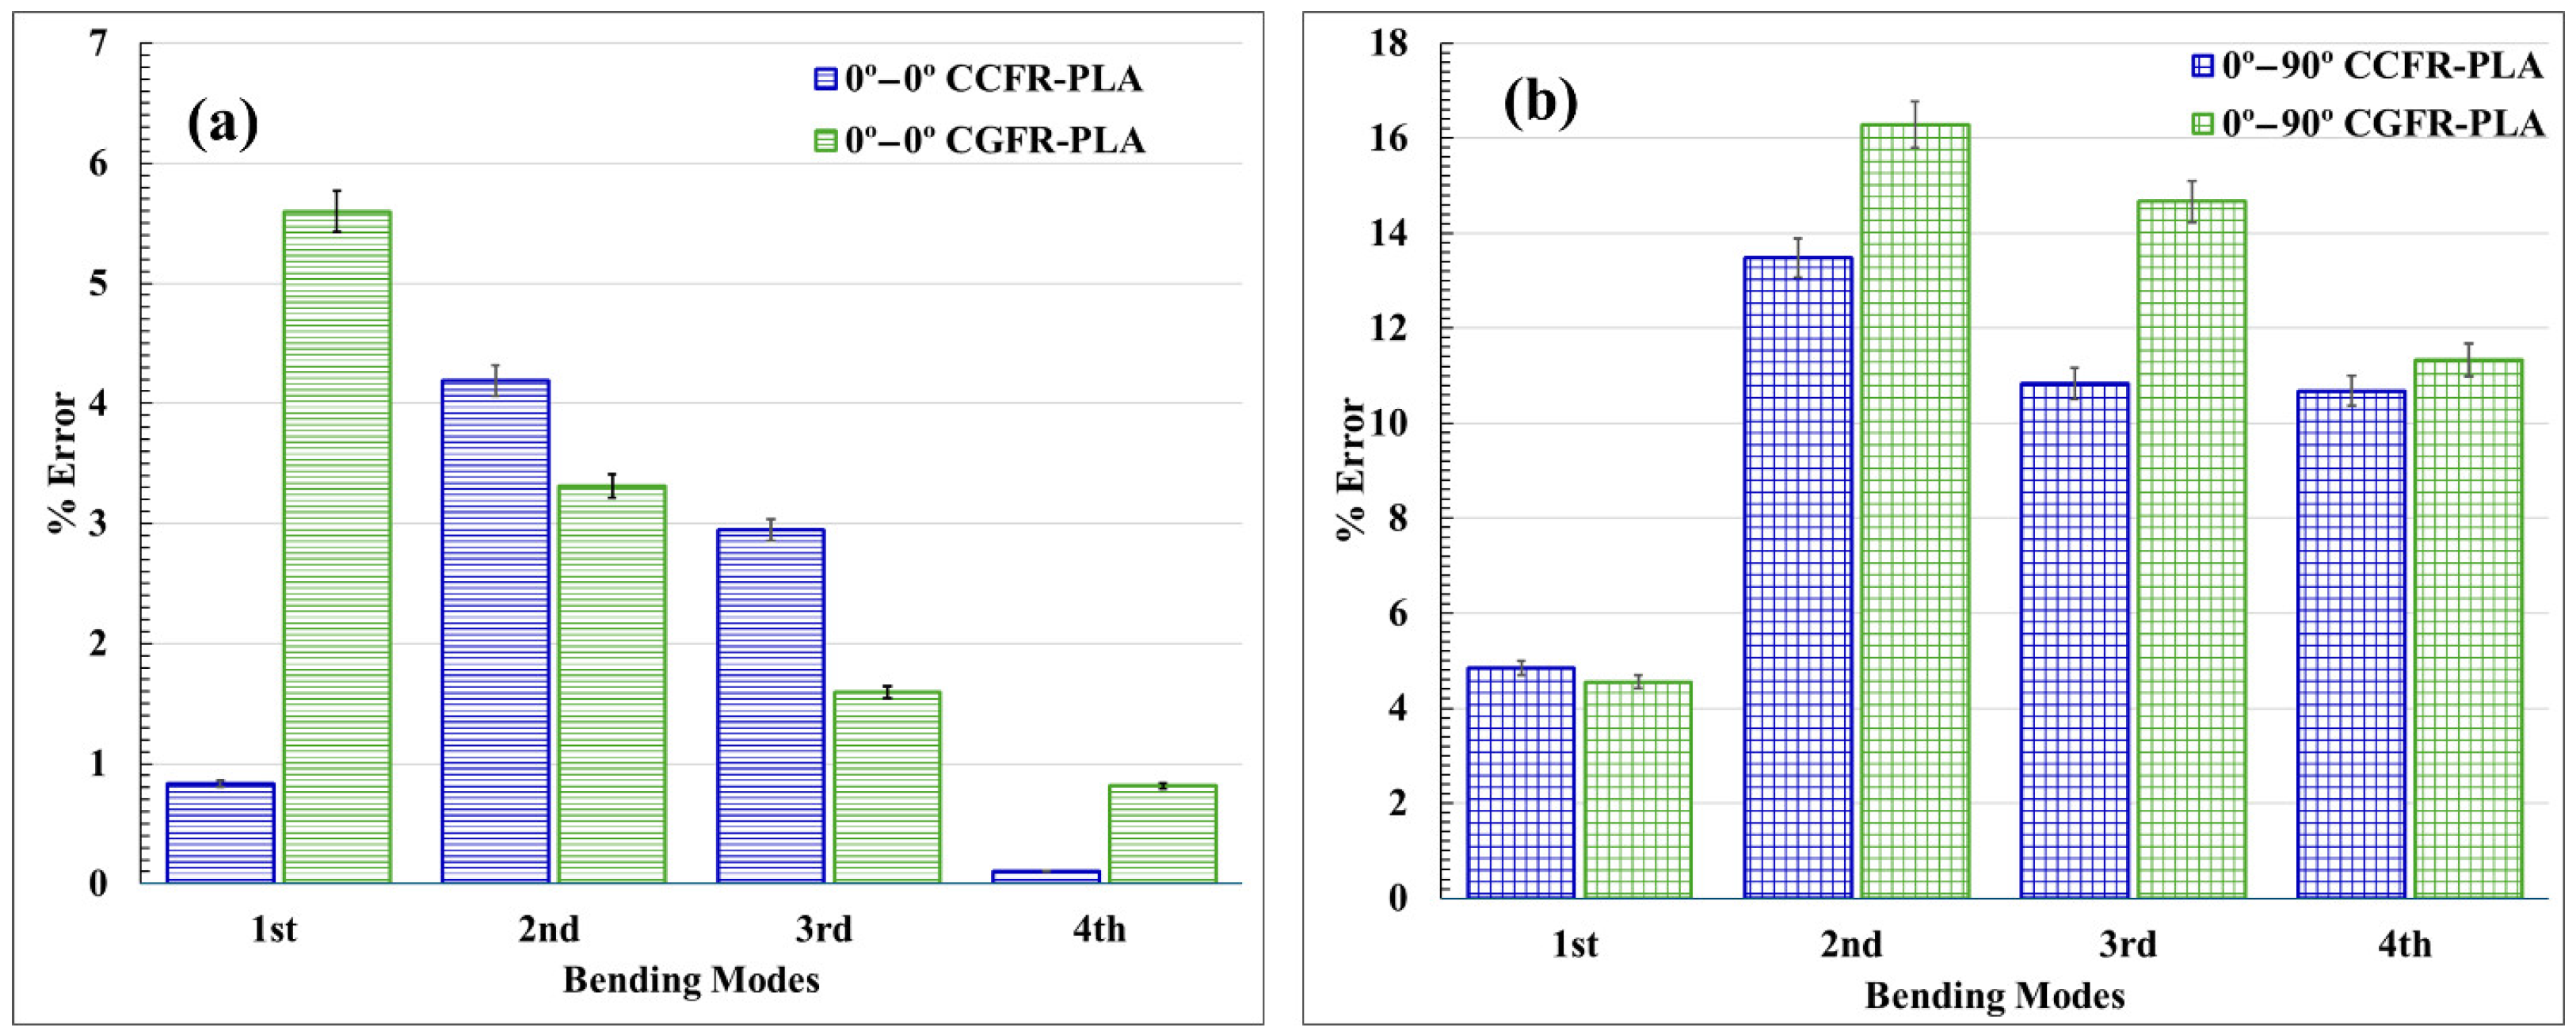
  • The numerical bending mode frequencies of 0°–0° models were higher than corresponding 0°–90° oriented models. This is because the 0°–0° models demonstrate higher stiffness due to fibers being aligned in the same direction, while in the 0°–90° the fibers are perpendicular. The first bending modes frequencies were determined to be 60.5 Hz for 0°–0° CCFR-PLA, 27.89 Hz for 0°–90° CCFR-PLA, 45.03 Hz for 0°–0° CGFR-PLA, and 22.27 Hz for 0°–90° CGFR-PLA. The corresponding experimental values were 60 Hz, 26.60 Hz, 47.70 Hz, and 21.30 Hz, respectively. In the 0°–0° numerical models, the first and higher bending mode (2nd, 3rd, and 4th) frequencies deviated by a maximum of about 6% from experimental values. For 0°–90° numerical models, the first mode frequencies deviated by a maximum of about 5%, and the higher modes by a maximum of about 16%.
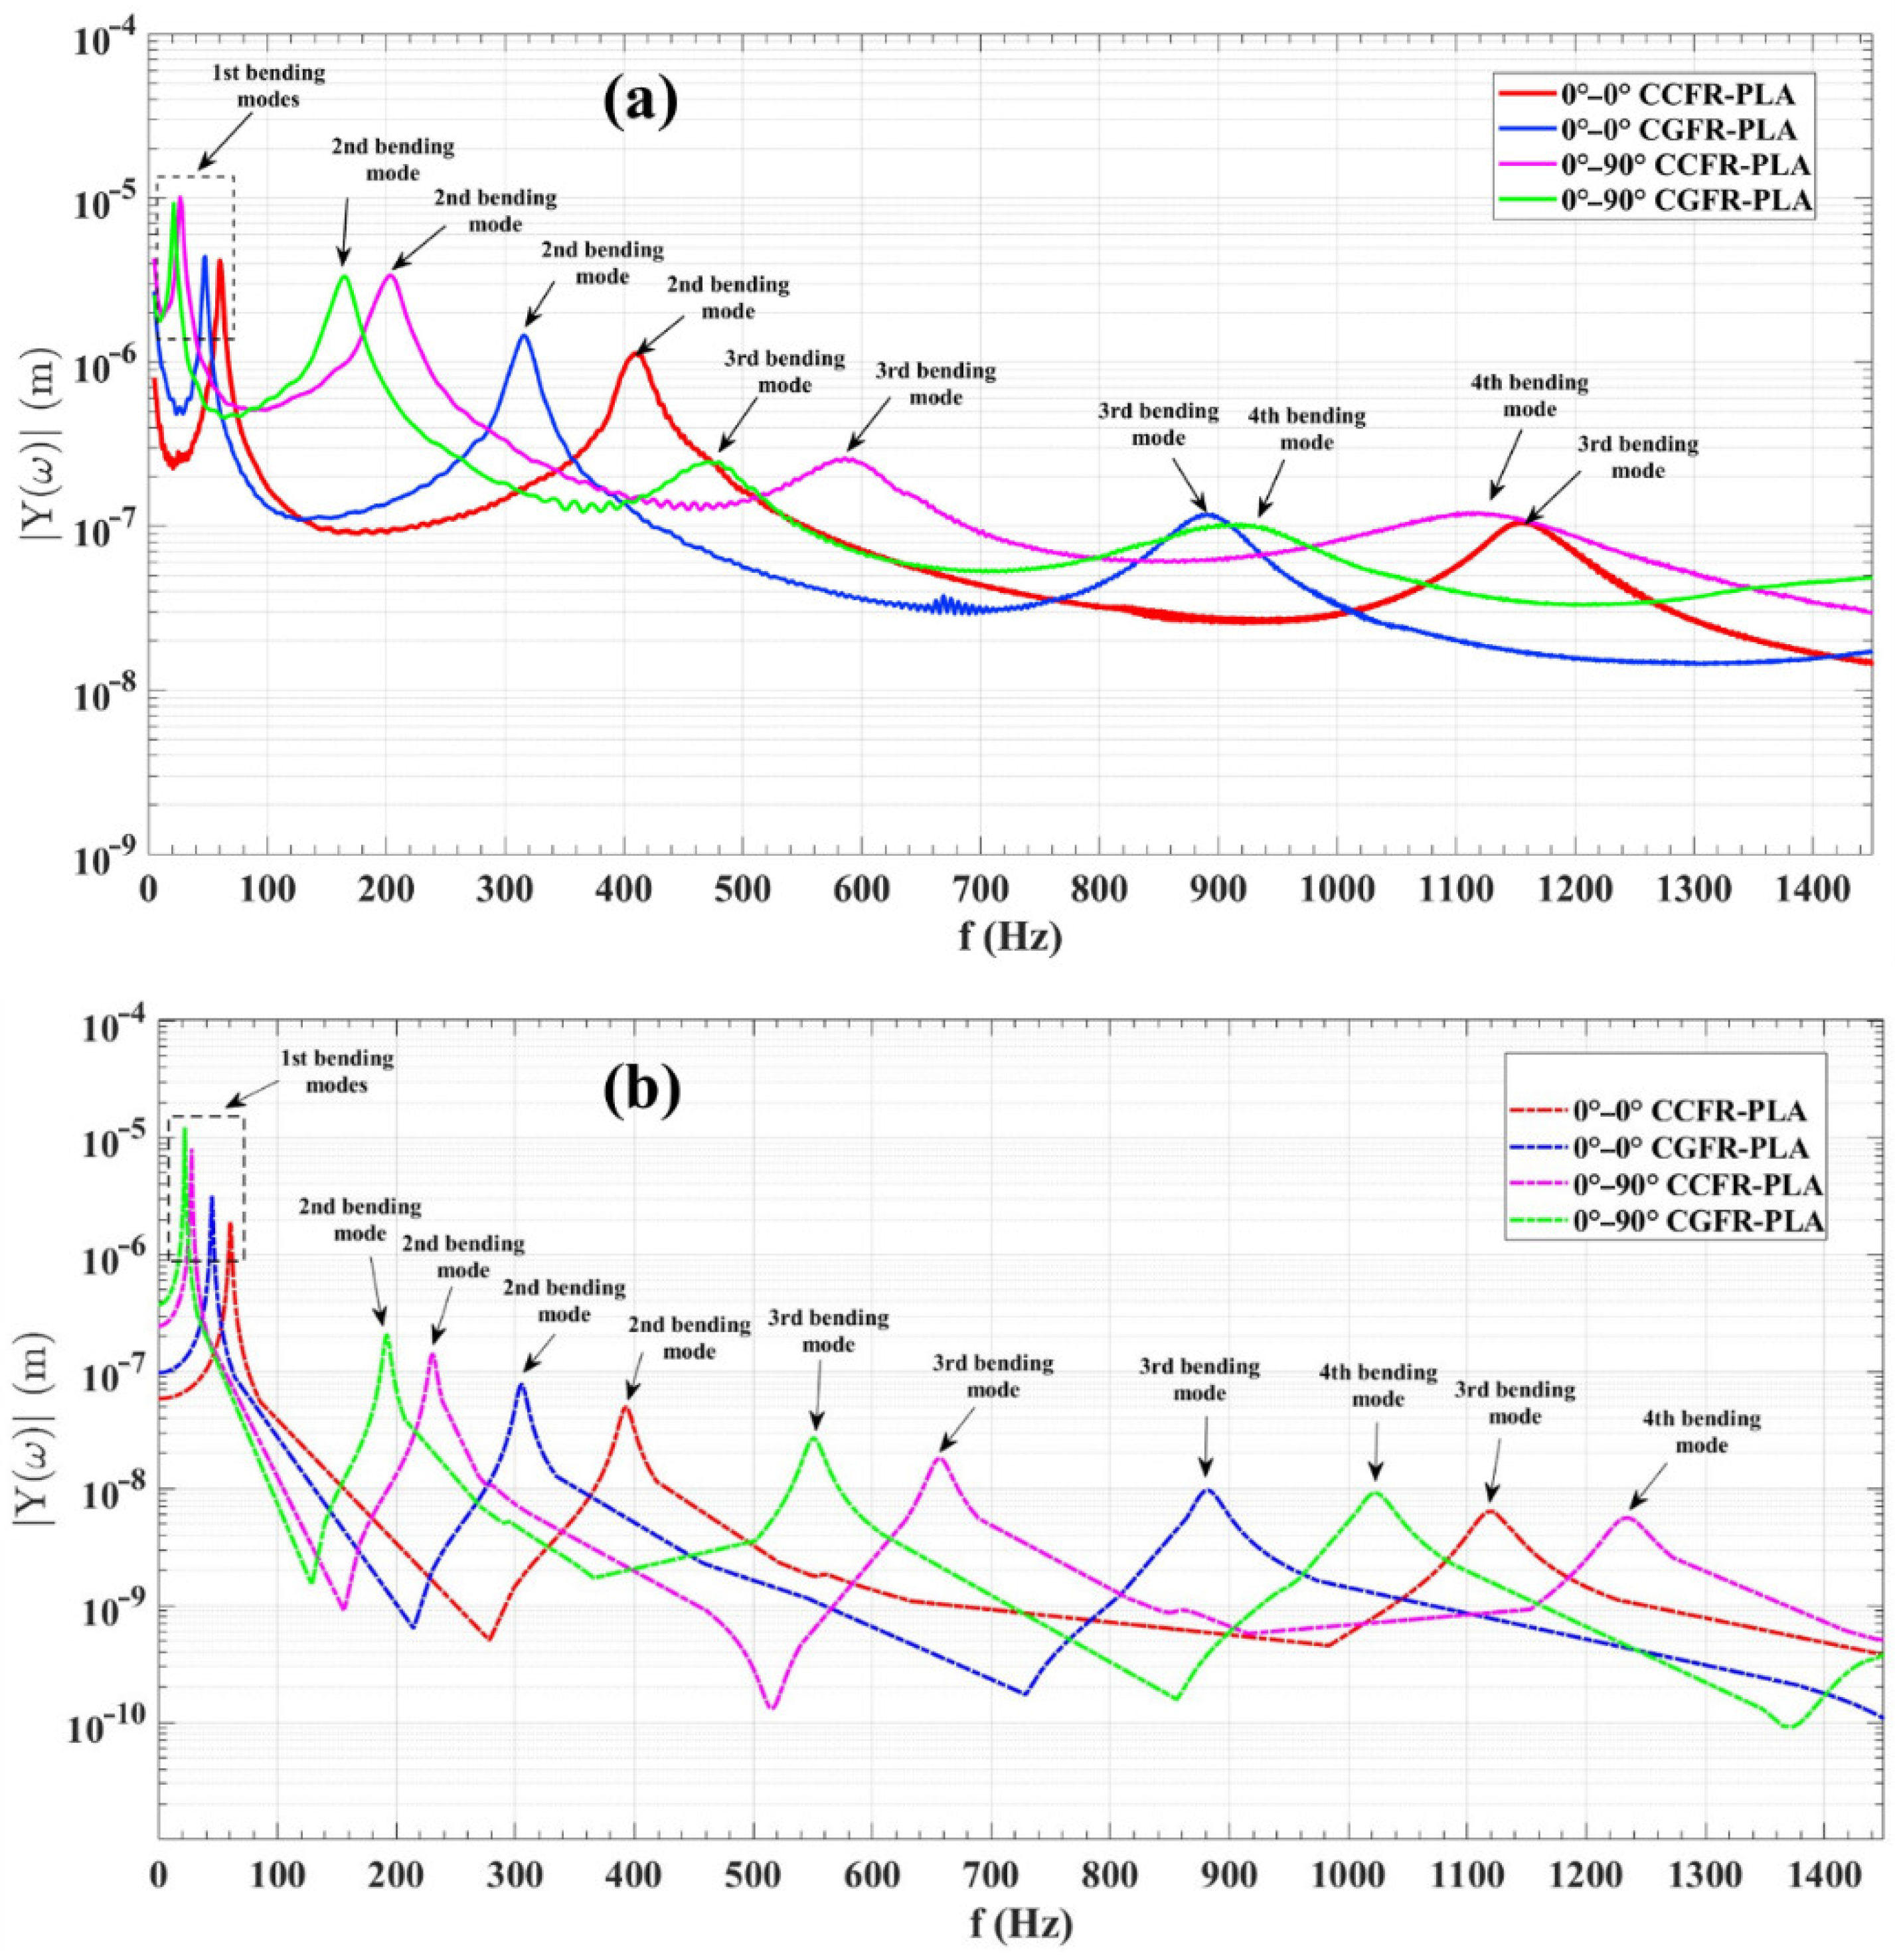
  • The AFR indicates that both experimental and numerical results exhibit variation in the absolute values of vibration amplitude as a function of frequency. However, the responses demonstrate a uniform consistency; the first bending mode presents the highest vibration amplitude, while the fourth bending mode the lowest.
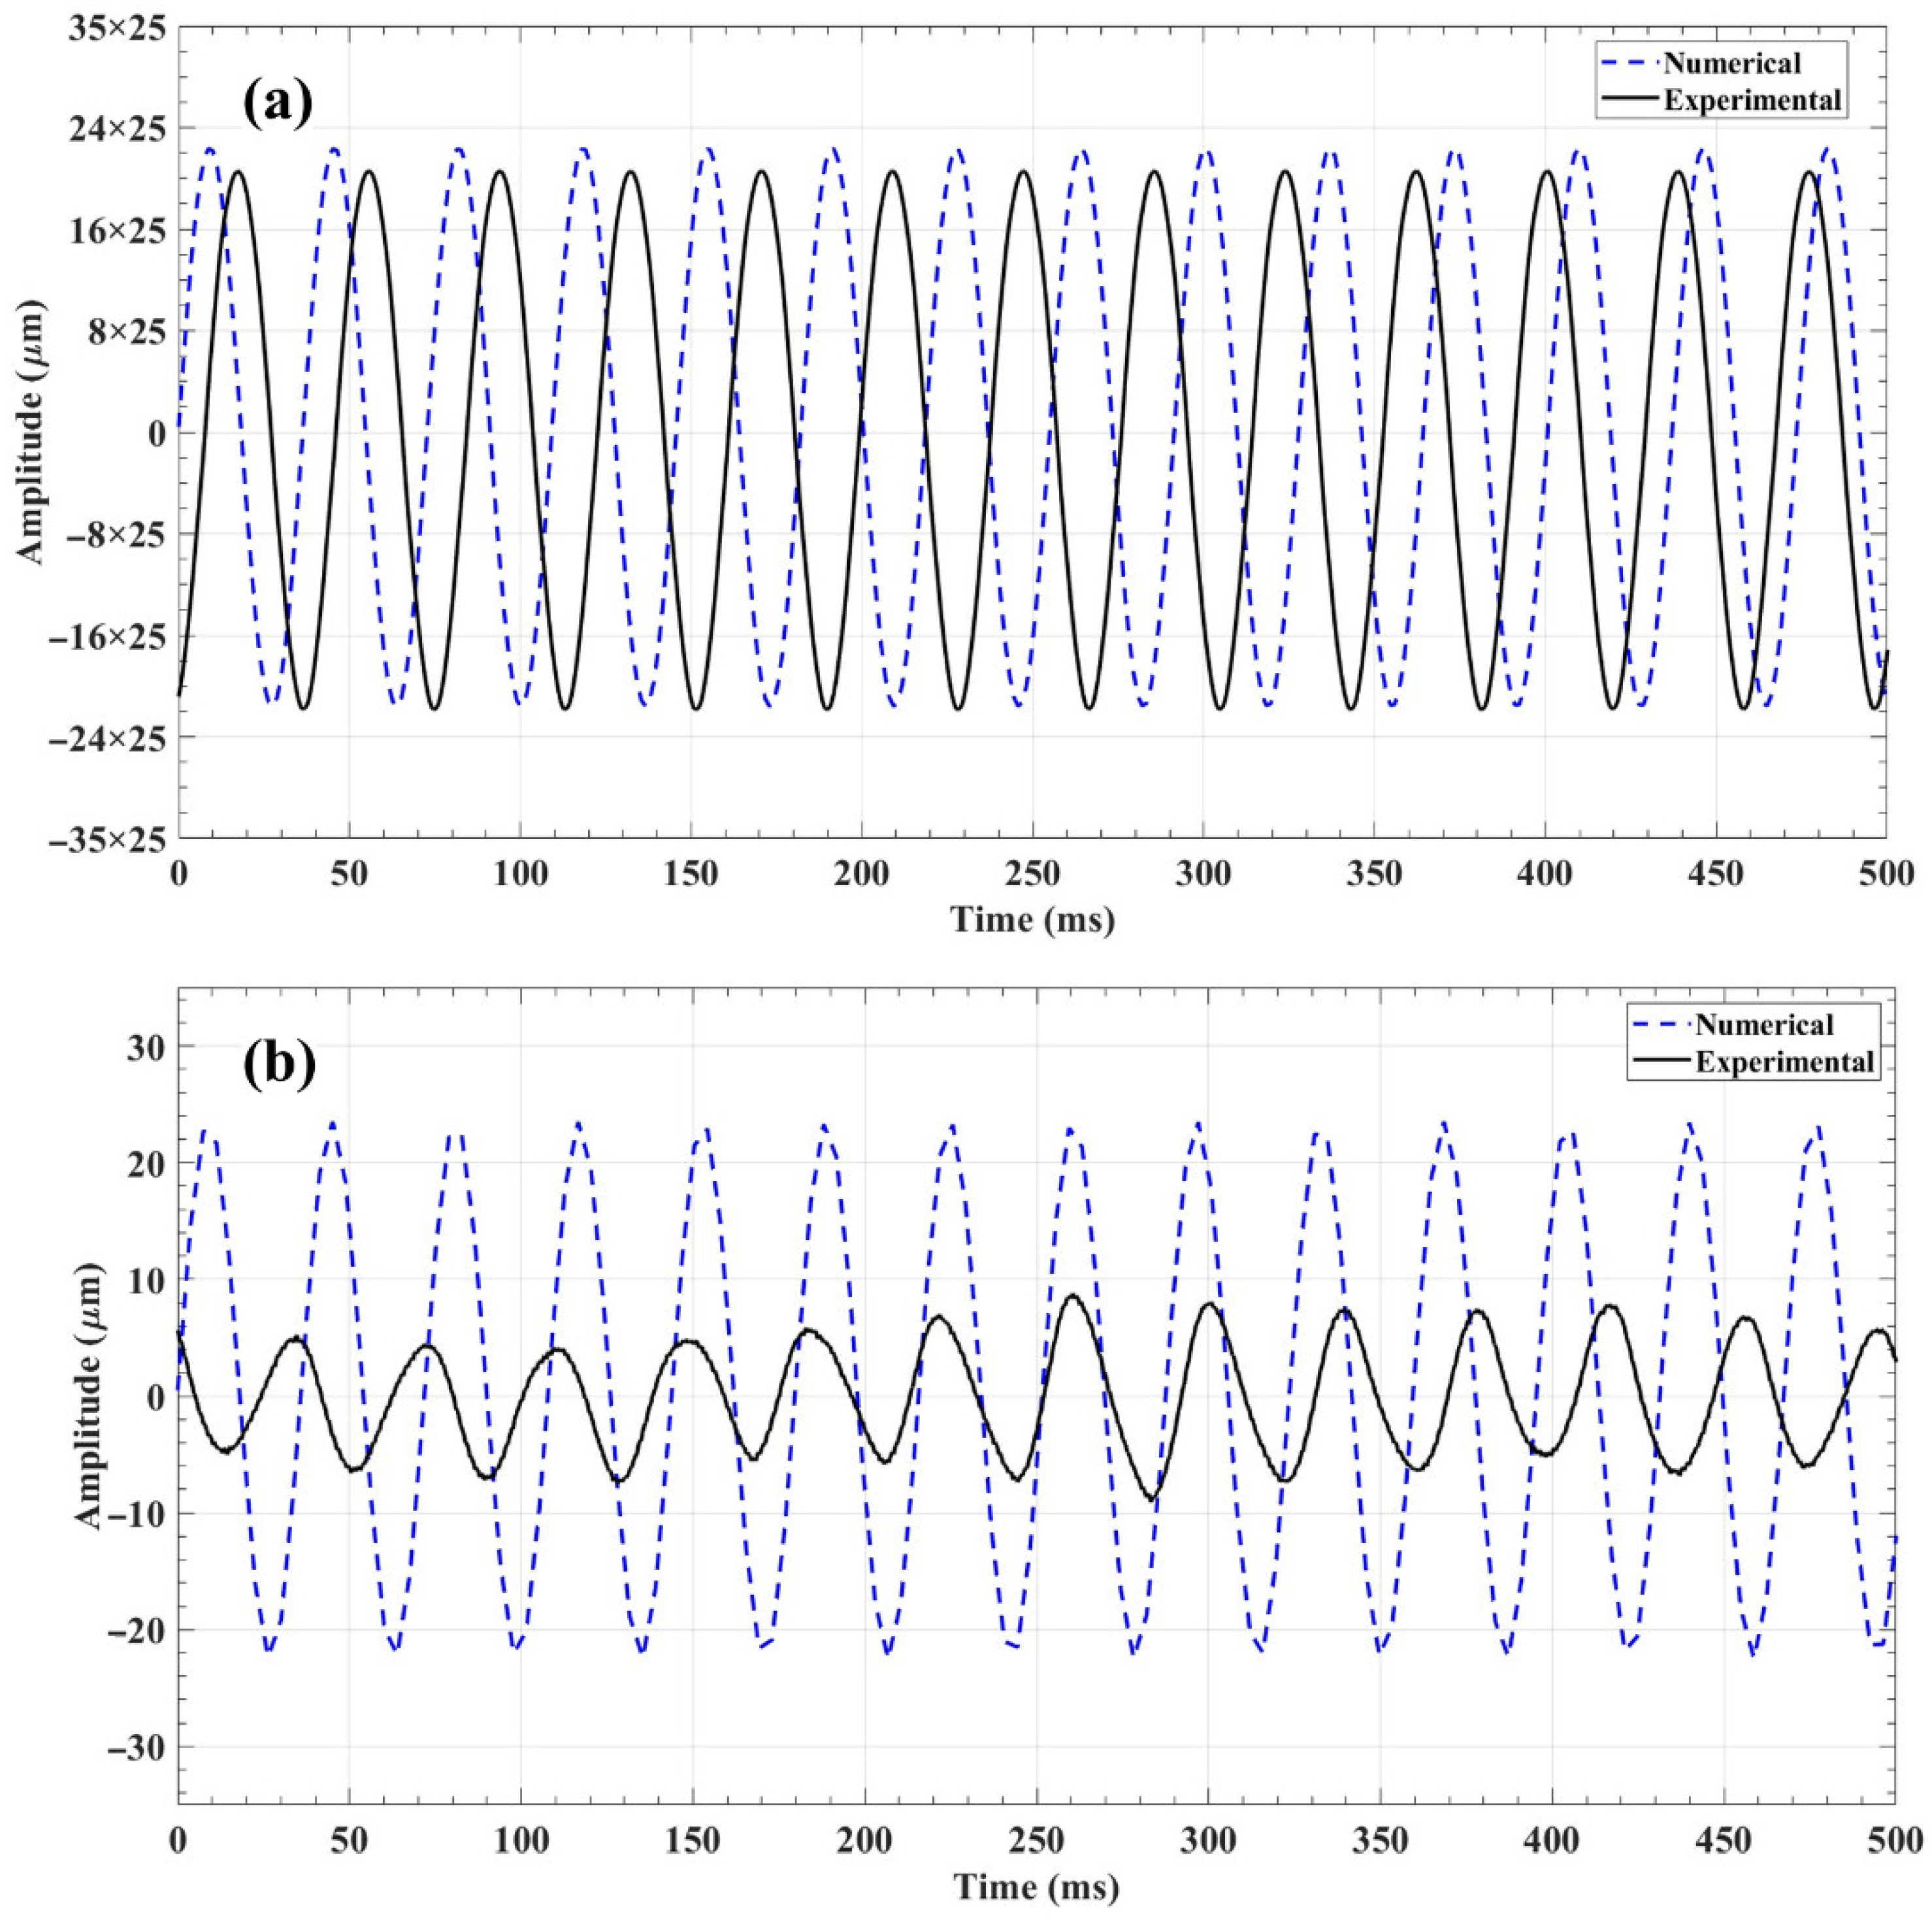
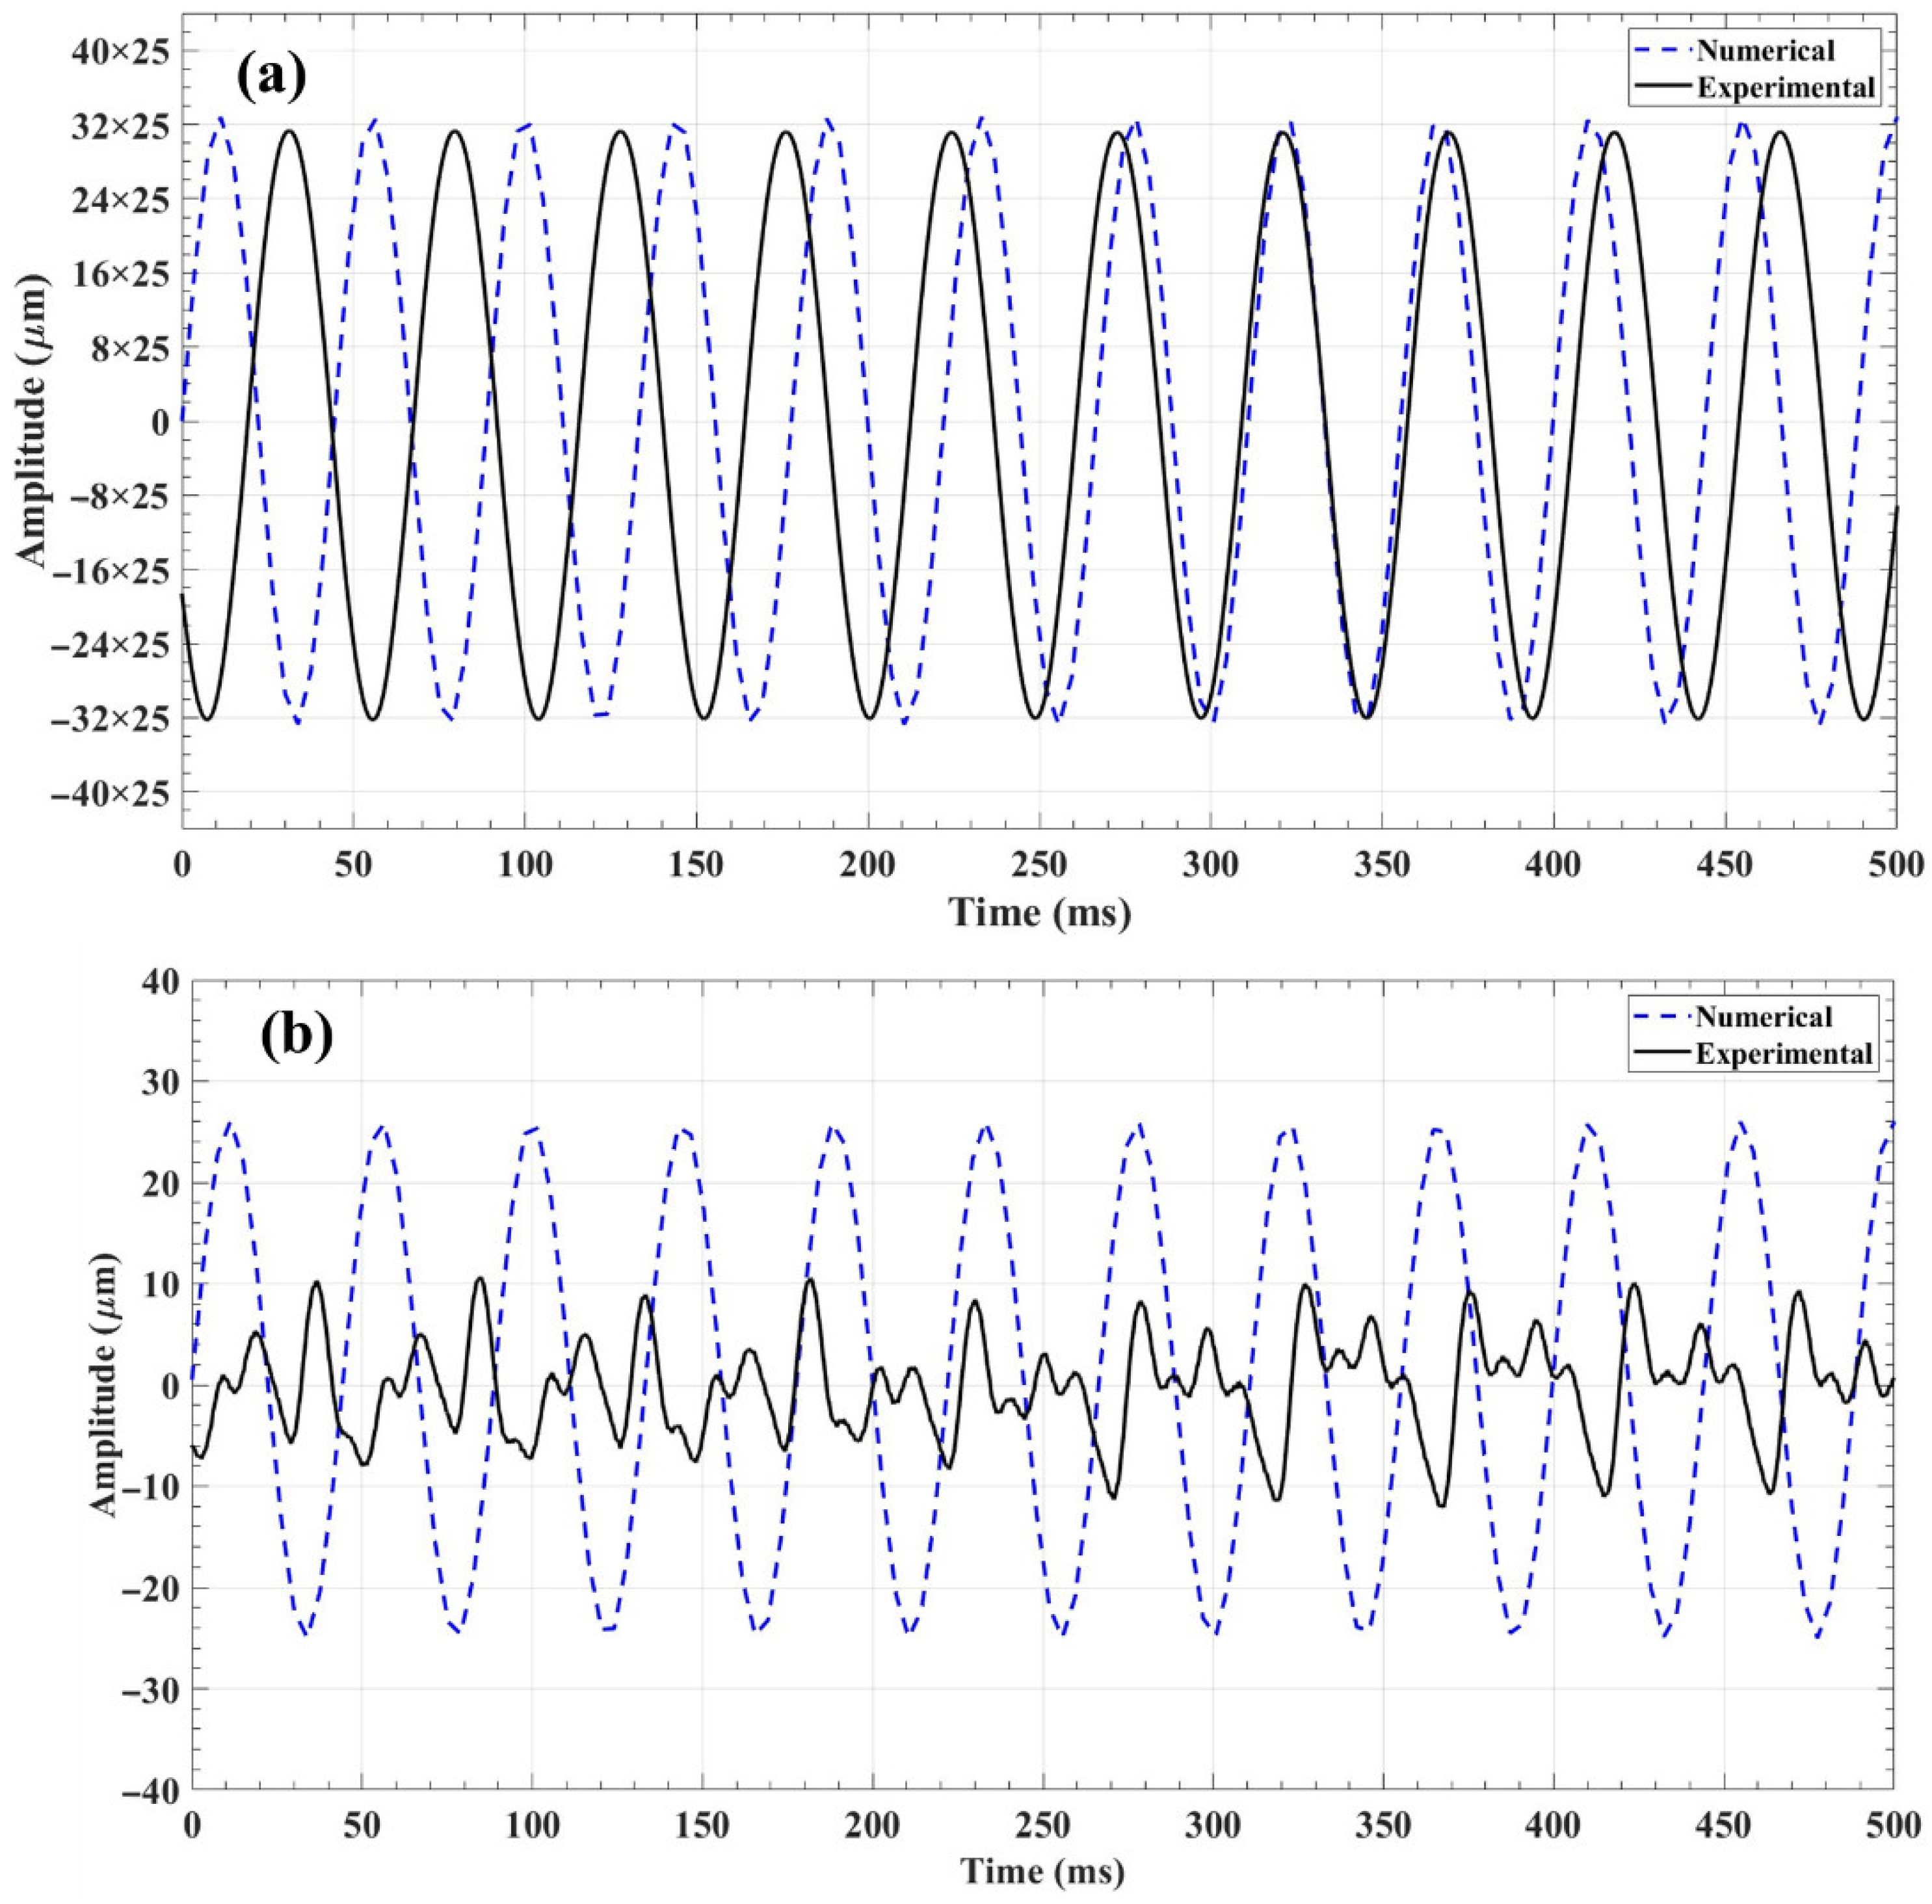
  • The uncontrolled peak-to-peak vibration amplitude responses indicate that 0°–0° oriented models exhibit lower amplitudes than 0°–90° models under external forces at the relevant first resonant frequency. This demonstrates the comparatively higher stiffness and resistance to deformation of the 0°–0° models. In the numerical models, uncontrolled peak-to-peak amplitudes were about ±222 µm for 0°–0° CCFR-PLA, ±252 µm for 0°–0° CGFR-PLA, +555 µm to −540 µm for 0°–90° CCFR-PLA, and ±818 µm for 0°–90° CGFR-PLA. The corresponding experimental values were about ±210 µm, ±241 µm, +514 µm to −545 µm, and +785 µm to −810 µm, respectively.
  • The peak-to peak numerically controlled vibration amplitude were achieved: about ±13 µm for 0°–0° CCFR-PLA, ±14.3 µm for 0°–0° CGFR-PLA, ±22.5 µm for 0°–90° CCFR-PLA, and ±25 µm for 0°–90° CGFR-PLA. The corresponding experimental value were about ±1.7 µm, +2.9 µm to −2.4 µm, +6.15 µm to −6.4 µm, and +8.5 µm to −12.2 µm, respectively. Although the vibration amplitude differences were significant, the observed percentage vibration reduction trends were consistent and meaningful, demonstrating a reduction of about 94% for all numerical models and about 99% experimental models.
  • In the future, numerical study may include the improved modeling of MFC actuator heterogeneity to obtain the vibration control response closer to experiments. However, the suggested approaches in this study for examining dynamic properties and vibration control responses can be applied to different composite structures made of natural or synthetic fibers individually reinforced in diverse compatible matrix materials with distinct fiber orientations. This approach will help in the determination of an effective combination of fiber type, fiber orientation, and matrix material for dynamic and vibration-related applications.

Author Contributions

Conceptualization, A.R., M.M. and R.R.; methodology, A.R.; software, A.R. and M.M.; validation, A.R.; formal analysis, A.R., V.J., N.M., M.R. and T.K.; investigation, A.R., M.M., R.R. and V.J.; resources, M.M. and R.R.; data curation, A.R., N.M. and M.R.; writing—original draft, A.R. and T.K.; writing—review and editing, A.R., M.M. and R.R.; visualization, A.R., M.M., R.R. and V.J.; supervision, M.M. and R.R. All authors have read and agreed to the published version of the manuscript.

Funding

This research received no external funding.

Data Availability Statement

The original contributions presented in the study are included in the article, further inquiries can be directed to the corresponding authors.

Acknowledgments

The numerical simulations were carried out using the computers of the Centre of Informatics, Tricity Academic Supercomputer & Network.

Conflicts of Interest

The authors declare no conflicts of interest.

References

  1. Raza, A.; Mieloszyk, M.; Rimašauskienė, R.; Jūrėnas, V. Dynamic Analysis and Vibration Control of Additively Manufactured Thin-Walled Polylactic Acid Polymer (PLAP) and PLAP Composite Beam Structures: Numerical Investigation and Experimental Validation. Materials 2024, 17, 5478. [Google Scholar] [CrossRef] [PubMed]
  2. Hong, S.W.; Ahn, S.S.; Li, H.; Kim, J.K.; Ko, S.J.; Koo, J.M.; Seok, C.S. Charpy Impact Fracture Characteristics of CFRP Composite Materials According to Variations of Fiber Array Direction and Temperature. Int. J. Precis. Eng. Manuf. 2013, 14, 253–258. [Google Scholar] [CrossRef]
  3. He, D.; Liu, X.; Jiao, F. Investigation on Flame-Retardant, Thermal and Mechanical Properties of Glass Fiber Reinforced Polyimide Composites. Polym. Compos. 2024, 45, 350–359. [Google Scholar] [CrossRef]
  4. Sultan, M.T.H.; Rajesh, M.; Jayakrishna, K. Failure of Fibre-Reinforced Polymer Composites; CRC Press: Boca Raton, FL, USA, 2021. [Google Scholar]
  5. Jawaid, M.; Thariq Hameed Sultan, M.; Saba, N. Modelling of Damage Processes in Biocomposites, Fibre-Reinforced Composites and Hybrid Composites, 1st ed.; Elsevier: Amsterdam, The Netherlands, 2018; ISBN 9780081022894. [Google Scholar]
  6. Diniță, A.; Ripeanu, R.G.; Ilincă, C.N.; Cursaru, D.; Matei, D.; Naim, R.I.; Tănase, M.; Portoacă, A.I. Advancements in Fiber-Reinforced Polymer Composites: A Comprehensive Analysis. Polymers 2023, 16, 2. [Google Scholar] [CrossRef] [PubMed]
  7. Chung, D.D.L. Processing-Structure-Property Relationships of Continuous Carbon Fiber Polymer-Matrix Composites. Mater. Sci. Eng. R Rep. 2017, 113, 1–29. [Google Scholar] [CrossRef]
  8. Zhang, Y.; Zhang, L.; Yang, G.; Yao, Y.; Wei, X.; Pan, T.; Wu, J.; Tian, M.; Yin, P. Recent Advances in Recyclable Thermosets and Thermoset Composites Based on Covalent Adaptable Networks. J. Mater. Sci. Technol. 2021, 92, 75–87. [Google Scholar] [CrossRef]
  9. Prashar, G.; Vasudev, H.; Bhuddhi, D. Additive Manufacturing: Expanding 3D Printing Horizon in Industry 4.0. Int. J. Interact. Des. Manuf. 2023, 17, 2221–2235. [Google Scholar] [CrossRef]
  10. Ozyilmaz, E.D.; Turan, A.; Comoglu, T. An Overview on the Advantages and Limitations of 3D Printing of Microneedles. Pharm. Dev. Technol. 2021, 26, 923–933. [Google Scholar] [CrossRef]
  11. Cano-Vicent, A.; Tambuwala, M.M.; Hassan, S.S.; Barh, D.; Aljabali, A.A.A.; Birkett, M.; Arjunan, A.; Serrano-Aroca, Á. Fused Deposition Modelling: Current Status, Methodology, Applications and Future Prospects. Addit. Manuf. 2021, 47, 102378. [Google Scholar] [CrossRef]
  12. Lalegani Dezaki, M.; Mohd Ariffin, M.K.A.; Hatami, S. An Overview of Fused Deposition Modelling (FDM): Research, Development and Process Optimisation. Rapid Prototyp. J. 2021, 27, 562–582. [Google Scholar] [CrossRef]
  13. Taib, N.A.A.B.; Rahman, M.R.; Huda, D.; Kuok, K.K.; Hamdan, S.; Bakri, M.K.B.; Julaihi, M.R.M.B.; Khan, A. A Review on Poly Lactic Acid (PLA) as a Biodegradable Polymer. Polym. Bull. 2023, 80, 1179–1213. [Google Scholar] [CrossRef]
  14. Karimi, A.; Rahmatabadi, D.; Baghani, M. Various FDM Mechanisms Used in the Fabrication of Continuous-Fiber Reinforced Composites: A Review. Polymers 2024, 16, 831. [Google Scholar] [CrossRef]
  15. Doddamani, M. Dynamic Mechanical Analysis of 3D Printed Eco-Friendly Lightweight Composite. Compos. Commun. 2020, 19, 177–181. [Google Scholar] [CrossRef]
  16. Chaupal, P.; Rajendran, P. A Review on Recent Developments in Vibration-Based Damage Identification Methods for Laminated Composite Structures: 2010–2022. Compos. Struct. 2023, 311, 116809. [Google Scholar] [CrossRef]
  17. Treviso, A.; Van Genechten, B.; Mundo, D.; Tournour, M. Damping in Composite Materials: Properties and Models. Compos. B Eng. 2015, 78, 144–152. [Google Scholar] [CrossRef]
  18. Nurhaniza, M.; Ariffin, M.K.A.; Ali, A.; Mustapha, F.; Noraini, A.W. Finite Element Analysis of Composites Materials for Aerospace Applications. IOP Conf. Ser. Mater. Sci. Eng. 2010, 11, 012010. [Google Scholar] [CrossRef]
  19. Fan, W.; Dong, J.; Wei, B.; Zhi, C.; Yu, L.; Xue, L.; Dang, W.; Li, L. Fast and Accurate Bending Modulus Prediction of 3D Woven Composites via Experimental Modal Analysis. Polym. Test 2019, 78, 105938. [Google Scholar] [CrossRef]
  20. Balaji, P.S.; Karthik SelvaKumar, K. Applications of Nonlinearity in Passive Vibration Control: A Review. J. Vib. Eng. Technol. 2020, 9, 183–213. [Google Scholar] [CrossRef]
  21. Ma, R.; Bi, K.; Hao, H. Inerter-Based Structural Vibration Control: A State-of-the-Art Review. Eng. Struct. 2021, 243, 112655. [Google Scholar] [CrossRef]
  22. Zhang, Y.; Sun, W.; Zhang, H.; Ma, H.; Du, D.; Xu, K. Design and Implementation of the Adaptive Vibration Control for Bolted Composite Plates under Variable Loads. Mech. Syst. Signal Process. 2025, 229, 112496. [Google Scholar] [CrossRef]
  23. Smart Material Manufactures and Develops High-Performance Piezo Composites. Available online: https://www.smart-material.com/ (accessed on 6 March 2022).
  24. Pandey, A.; Arockiarajan, A. Actuation Performance of Macro-Fiber Composite (MFC): Modeling and Experimental Studies. Sens. Actuators A Phys. 2016, 248, 114–129. [Google Scholar] [CrossRef]
  25. Zhang, S.Q.; Li, Y.X.; Schmidt, R. Modeling and Simulation of Macro-Fiber Composite Layered Smart Structures. Compos. Struct. 2015, 126, 89–100. [Google Scholar] [CrossRef]
  26. Raza, A.; MAHATO, S.; Rimašauskienė, R. Actuation Performance of Macro Fibre Composite (MFC) as Actuator in Vibration Reduction of Cantilever Beams. Mechanics 2023, 29, 42–50. [Google Scholar] [CrossRef]
  27. Lyu, Z.; Li, C.; Jia, T. Combined Vibration Control of Flexible Cantilever Beam Driven by MFC Actuators and Rotary Motor. Acta Mech. 2024, 236, 305–320. [Google Scholar] [CrossRef]
  28. Raza, A.; Rimašauskienė, R.; Jūrėnas, V.; Mahato, S. Experimental Investigation of Vibration Amplitude Control in Additive Manufactured PLA and PLA Composite Structures with MFC Actuator. Eng. Struct. 2023, 294, 116802. [Google Scholar] [CrossRef]
  29. Zhang, P.; Wang, J. Macro Fiber Composite-Based Active Control of Nonlinear Forced Vibration of Functionally Graded Plate. Appl. Math. Mech. 2025, 46, 869–884. [Google Scholar] [CrossRef]
  30. Raza, A.; Rimašauskienė, R.; Jūrėnas, V.; Kuncius, T. Enhancing Vibration Control in Kinematically Excited Additively Manufactured Continuous Fiber Composite Structures with Distinct Orientations. Eng. Struct. 2024, 321, 118933. [Google Scholar] [CrossRef]
  31. Polymaker PolyLiteTM PLA Technical Data Sheet. Available online: https://ec3d.co.za/wp-content/uploads/2022/08/PolyLite%E2%84%A2-PLA_TDS_V3.pdf?srsltid=AfmBOopruFk5-qatnuWiZR6Q2I8dFuh4pnvGAUf08AiIStX_vD0KKD5a (accessed on 9 March 2023).
  32. Toray Composite Materials America T300 Standard Modulus Carbon Fiber Technical Data Sheet. Available online: https://www.rockwestcomposites.com/media/wysiwyg/T300DataSheet_1.pdf (accessed on 9 March 2023).
  33. E & S Fiberglass Composite Materials|JPS Composite. Available online: https://jpscm.com/products/e-glass-s-glass/ (accessed on 5 February 2025).
  34. Abaqus CAE. Available online: https://docs.software.vt.edu/abaqusv2024/English/ (accessed on 23 June 2024).
  35. Raza, A.; Rimašauskienė, R.; Jūrėnas, V.; Rimašauskas, M. An Experimental Study on the Dynamic Properties of 3D-Printed Structures with Different Layer Orientations. J. Vib. Eng. Technol. 2024, 12, 321–334. [Google Scholar] [CrossRef]
Figure 1. Experimental workflow overview [30].
Jmmp 09 00235 g001
Figure 2. Flowchart of numerical simulation and experimental validation.
Jmmp 09 00235 g002
Figure 3. Modeling of AM CCFR-PLA and CGFR-PLA structures: (a) 0°–0° orientation, (b) 0°–90° orientation.
Jmmp 09 00235 g003
Figure 4. Mesh convergence analysis demonstrating three mesh refinement levels.
Jmmp 09 00235 g004
Figure 5. Composite structure integrated with MFC demonstrating applied boundary conditions: (a) FEM model, (b) schematic diagram of actual model.
Jmmp 09 00235 g005
Figure 6. Microscopic images of upper and bottom surfaces of CCFR-PLA composite structures with 0°–0° and 0°–90° orientations.
Jmmp 09 00235 g006
Figure 7. Microscopic images of upper and bottom surfaces of CGFR-PLA composite structures with 0°–0° and 0°–90° orientations.
Jmmp 09 00235 g007
Figure 8. Bending modes of numerical CCFR-PLA composite structures with 0°−0° and 0°−90° orientations.
Jmmp 09 00235 g008
Figure 9. Bending modes of numerical CGFR-PLA composite structures with 0°−0° and 0°−90° orientations.
Jmmp 09 00235 g009
Figure 10. Percentage error in experimental and numerical bending mode frequencies for composite structures: (a) 0°–0° orientation, (b) 0°–90° orientation.
Jmmp 09 00235 g010
Figure 11. Amplitude frequency responses (AFR) of CCFR-PLA and CGFR-PLA composite structures with 0°–0° and 0°–90° orientation: (a) numerical response, (b) experimental response.
Jmmp 09 00235 g011
Figure 12. Vibration amplitude responses of 0°–0° CCFR-PLA: (a) without control, (b) with control.
Jmmp 09 00235 g012
Figure 13. Vibration amplitude responses of 0°–90° CCFR-PLA: (a) without control, (b) with control.
Jmmp 09 00235 g013
Figure 14. Vibration amplitude responses of 0°–0° CGFR-PLA: (a) without control, (b) with control.
Jmmp 09 00235 g014
Figure 15. Vibration amplitude responses of 0°–90° CGFR-PLA: (a) without control, (b) with control.
Jmmp 09 00235 g015
Table 1. Material specifications of PLA, CGF, and CCF [26,31,32,33].
SpecificationsPLACGFCCF
Young’s Modulus (Y), GPa2.636 ± 0.33089230
Poisson’s Ratio (v)0.360.220.20
Tensile Strength (σt), MPa46.6 ± 0.946003530
Density (ρ), g/cm31.17–1.242.531.76
Table 2. Material specifications of MFC (M8507/P2) [23,24,25,26].
SpecificationsMFC (M8507/P2)
Young’s Modulus (Y), GPaY1 = 30.336, Y2 = Y3 = 15.857
Shear Modulus (S), GPaS12 = S13 = S23 = 5.515
Poisson’s Ratio (v)v12 = v13 = 0.31, v23 = 0.438
Density (ρ), g/cm35.44
Piezoelectric Coefficient (d), pm/Vd31 = −170, d32 = −100
Table 3. Modal frequencies of composite structures: experiments and numerical simulation results.
Bending
Modes
0°–0° CCFR-PLA0°–90° CCFR-PLA0°–0° CGFR-PLA0°–90° CGFR-PLA
ExperimentNumericalExperimentNumericalExperimentNumericalExperimentNumerical
Hz
1st60.0060.526.6027.8947.7045.0321.3022.27
2nd410.00392.83203.00230.37315.60305.15165.00191.87
3rd1153.001119.00592.00656.15895.30881.02480.00550.38
4th2192.002189.701114.001233.001707.001720.90918.001022.00
Disclaimer/Publisher’s Note: The statements, opinions and data contained in all publications are solely those of the individual author(s) and contributor(s) and not of MDPI and/or the editor(s). MDPI and/or the editor(s) disclaim responsibility for any injury to people or property resulting from any ideas, methods, instructions or products referred to in the content.

