1. Introduction
In recent decades, the automotive industry has faced challenges, such as improving energy efficiency, reducing pollutant emissions, increasing occupant safety, and reducing production costs. At first, these seem like conflicting expectations, but such is the challenge of searching for more efficient materials that combine these characteristics. To solve these challenges, it is necessary to reduce the weight of vehicle bodies without compromising the safety of the occupants.
To combine vehicle weight reduction with improved performance against deformations in cases of impact, a new family of advanced high-strength steels is introduced, AHSS (Advanced High-Strength Steels). However, this family of steel has lower formability and greater springback compared to conventional steels. The mechanical properties of AHSS undergo some changes, such as an increase in mechanical resistance and, consequently, a reduction in total elongation, which is why they have a lower stampability compared to carbon steels. However, the use of suitable microstructures makes it possible to minimize the loss of ductility under higher levels of mechanical resistance. Dual-phase (DP) steels are characterized by optimally combining high mechanical resistance, good formability, and a high initial hardening rate. This ductility comes from its microstructure, which combines extremely hard phases (martensite or bainite islands) arranged in a pure ferritic matrix.
The manufacturing process of formed parts, particularly in the automotive sector, crucially depends on stamping tools, or dies, to guarantee product quality. Researchers have focused on improving these tools, seeking solutions that result in high-quality products and reduced tryout time. These investigations involve the detailed analysis of process variables, such as stamping speed, applied force, temperature, and lubrication, factors that, when optimized, increase the efficiency and precision of the process, resulting in components with a better finish and shorter production times.
The Forming Limit Curve (FLC), initially developed by Keeler [
1], Goodwin [
2], and Woodthorpe et al. [
3], continues to be an essential tool for predicting the formability limits of metal sheets, allowing for defects, such as fissures and cracks, to be identified before process failures occur. The method, developed by Nakazima, is widely used to obtain a material’s FLC, based on standard ISO 12004-2 [
4]. The test evaluates the material’s behavior under different deformation states using specimens with different widths, printed with circular grids to monitor deformations. Several studies, such as those developed by Hino et al. [
5], Pan et al. [
6], Schwindt et al. [
7], Cardoso et al. [
8], Paul [
9], Frohn-Sörensen et al. [
10], Oliveira et al. [
11], Sanrutsadakorn et al. [
12], and Rezazadeh et al. [
13], confirm the relevance of FLC in the evaluation and development of new materials and forming processes, showing that the Nakazima test is a reliable reference to characterize the formability limits of steels.
The development of AHSS has revolutionized manufacturing processes, especially in the automotive industry. The introduction of these new alloys has brought significant changes in forming parameters, requiring in-depth investigations into deformation mechanisms and the influence of stamping tools on material formability. Many researchers have explored the use of new materials, such as dual-phase steels, as well as alternative processes to improve efficiency and manufacturing cost reduction. These advances are highlighted in the studies of Abeyrathna et al. [
14], Ke et al. [
15], Schmid et al. [
16], Barlo et al. [
17], and Sarand and Misirlioglu [
18], which highlight the potential of these innovations to optimize production and achieve the growing demands of the automotive sector. Welding is another manufacturing process widely used in the automotive industry which directly affects crystal structure. The studies from Khan et al. [
19], Rajak et al. [
20], Cheng et al. [
21], Mansur et al. [
22], and Park et al. [
23] investigated the hardness in the heat-affected zone (HAZ) of biphasic steels subjected to laser welding. The results demonstrate that the process preserves material strength without compromising its structural integrity. These characteristics highlight the potential of laser welding in automotive applications that demand high mechanical strength and good formability, making it a viable and efficient option for structural components. The methodology adopted covers the analysis of different grades of DP steels, focusing on the behavior of their martensitic and ferritic phases, in addition to the influence of parameters such as heat input, chemical composition, and thermal cycles.
A relevant topic in research on mechanical forming is the analysis of the variables associated with stamping tools and their impact on the formability of materials. Parameters such as blank holder force, stamping speed, and lubrication conditions have been widely investigated to optimize the process, as demonstrated in the studies by Meng et al. [
24], Folle and Schaeffer [
25], Schmid et al. [
16], Paul et al. [
9], Oliveira et al. [
11], and Votava et al. [
26].
In a stamping tool, there are several variables involved on the sheet formability limit. The study by Chemin Filho et al. [
27] showed a significant increase for DP600 steel formability due to a more assertive choice of blank holder force (BHF). The research by Shinmiya et al. [
28] presented how a rise in BHF promoted an increase in the maximum stress of the tested materials. Affronti and Merklein [
29] and Sari Sarraf et al. [
30] emphasize the effect of tool variables on AHSS stampability. Likewise, to BHF, the drawbead (DB) is also relevant in determining the sheet metal’s formability limit, as it acts directly in sheet metal flow during the stamping, influencing, and deformation mode suffered by the material, as proposed by Leocata et al. [
31]. Therefore, it is possible to conclude that tooling characteristics have a strong effect on the stamping process, promoting a microstructural transformation, which will directly impact the sheet formability degree, as with the Bauschinger effect studied by Weinmann et al. [
32]. Proper optimization of these variables not only increases process efficiency, but also ensures that the components meet the quality and performance requirements of the industry, especially in applications that demand high precision, such as the automotive and aerospace industries.
Microscopy plays a key role in the detailed analysis of the microstructures of AHSS, such as DP 600, DP780, and TRIP, allowing for an in-depth understanding of the behavior of these materials in industrial processes. Advanced techniques, such as Scanning Electron Microscopy (SEM) and Electron Backscatter Diffraction (EBSD), are widely used to investigate phases distribution like martensite, bainite, and ferrite. These tools are crucial for optimizing heat treatments and evaluating mechanical properties. Recent studies, such as those by Zhang et al. [
33], Schwindt et al. [
7], Ma et al. [
34], and Sarand and Misirlioglu [
18], highlight the importance of these techniques for modeling and understanding the deformation suffered by steel alloys, especially those applied in the automotive industry. These works analyze the impact of heat treatments on the material’s microstructure, revealing how differences between phases, such as ferrite and martensite, influence the non-uniform distribution of deformations, providing subsidies for the performance of these materials in industrial environments.
Furthermore, Webber and Knezevic [
35] investigated the strength of the ferrite and martensite phases in dual-phase and martensitic steels, respectively, with tensile strengths ranging from 590 to 1180 MPa. The authors correlated the local hardness of each phase with the global strength of the material, offering valuable insights for the development and application of AHSS alloys in industrial conditions. Katiyar [
36] used the shot peening process on the surface of biphasic steels, with the aim of increasing wear resistance. The technique promoted stress-induced martensitic transformation and grain refinement, proving to be effective in improving both the mechanical and tribological properties of the material, contributing to applications that demand greater durability and strength.
The mechanical forming process significantly changes the mechanical properties of the material during stamping. Among these properties, hardness stands out as one of the most impacted. During the process, the metal sheet is subjected to compression, promoting the hardening of the grains in its microstructure, which results in an increase in the material’s hardness.
As described by Oliver and Pharr [
37], the hardness (H) and the elastic modulus (E) are the two mechanical properties that are most evaluated using indentation techniques, where data is obtained from one complete cycle of loading and unloading. The unloading data are analyzed according to a model that correlates elastic deformation, the indenter contact area at peak load, and the elastic modulus. The indenter contact area function is used to provide measurements of H and E.
According to Lepienski et al. [
38], the nanoindentation technique is a powerful tool to determine a material’s mechanical properties at micro- and sub-micrometer scales, and it is very useful in characterizing thin film’s properties. In addition to hardness and the elastic modulus, other properties that can be estimated or measured, could be work hardening rate, yield strength, and strain rate sensitivity, as proposed by Dao et al. [
39] and Casals et al. [
40]. The first attempt to evaluate hardness using nanoindentation methods was performed by Tsui et al. [
41] using a high-strength aluminum alloy with a Berkovich indenter.
Nanoindentation techniques were used by Liu et al. [
42] to study the creep behavior of nickel-based superalloys used to repair components through laser metal deposition. A recent study from Gallardo-Basile et al. [
43] shows a method to determine the parameters of a crystal plasticity law of a body-centered-cubic (BCC) single-phase material, where nanoindentation experiments were used in comparison with computational simulations.
Electron Backscatter Diffraction (EBSD), also known as Backscatter Kikuchi Diffraction (BKD), is a commonly SEM-based backscatter or transmission electron diffraction technique for the fetching phase information and crystallographic orientation of materials, with resolutions ranging from a few microns to a few nanometers when using field-emission guns. According to Raabe [
44], the technique is based on obtaining maps of electron backscatter patterns from different crystalline regions. These patterns lie in symmetrically arranged bands, also referred to as Kikuchi bands. They contrast with the diffraction of the backscattered by the crystal. The electrons generated using an electron beam in the SEM spread beneath the specimen surface in all directions, producing a divergent source of electrons which diffract with the crystal planes according to the Bragg condition. These electrons move from the source in all directions; for each set of planes for which the Bragg condition is appeased, the diffracted beams remain on the surface of a cone whose axis is normal to the diffracted plane. These cones collide with a screen placed in front of the specimen, and propagate to the patterns. With advances in instruments, the technique is becoming more common, and relevant studies in this area are as follows: Zaefferer et al. [
45], Haertel et al. [
46], Li et al. [
47], Carneiro and Simões [
48], Atreya et al. [
49], and Ma et al. [
34]. The technique was employed to quantitatively evaluate the deformation level, induced by hardening, using different DB geometries.
The development of new steel alloys and the optimization of forming parameters, combined with the use of advanced microscopy and simulation techniques, are essential to meet the demands of the automotive industry for lighter, safer, and more efficient vehicles, while ensuring quality and efficiency in the manufacturing processes.
2. Materials and Methods
The material used in this study was Dual-Phase 600 (DP600) steel, with a thickness of 1.0 mm, supplied by Siderurgica Usiminas S/A. This material is increasingly replacing traditional HSLA steels in the structural components of automotive bodies, justifying the feasibility of a more sophisticated analysis of its behavior during stamping.
From the sheet metal, a small sample was taken for material chemical characterization. The optical emission spectrometry technique was used, in accordance with the reference standard ASTM E415-2021 [
50] (Standard Test Method for Analysis of Carbon and Low-Alloy Steel by Spark Atomic Emission Spectrometry). The sample surface was mechanically grinded using SiC-abrasive papers with different particle sizes and granulometry ranging from 120 to 1200, followed by polishing with alumina paste.
The mechanical properties and stampability parameters were determined using tensile tests. The EMIC DL 3000 equipment was used, and the specimens were obtained at the Machining Laboratory from Federal University of Paraná, in accordance with the ASTM E8/E8M-2016 standard [
51]. The fundamental mechanical properties of the DP600 steel were obtained through the tensile tests: ultimate tensile strength (UTS), yield strength (YS) and total elongation (El). The formability parameters of the steel were also determined: the anisotropy factor (r), proposed by Lankford and the work hardening exponent (n), following Hollomon’s equation. These properties and formability parameters are essential in the characterization of the material prior to the stamping tests to verify the classification of the material according to its manufacturing standard and to determine the steel power law, which can be used as input in numerical simulation models.
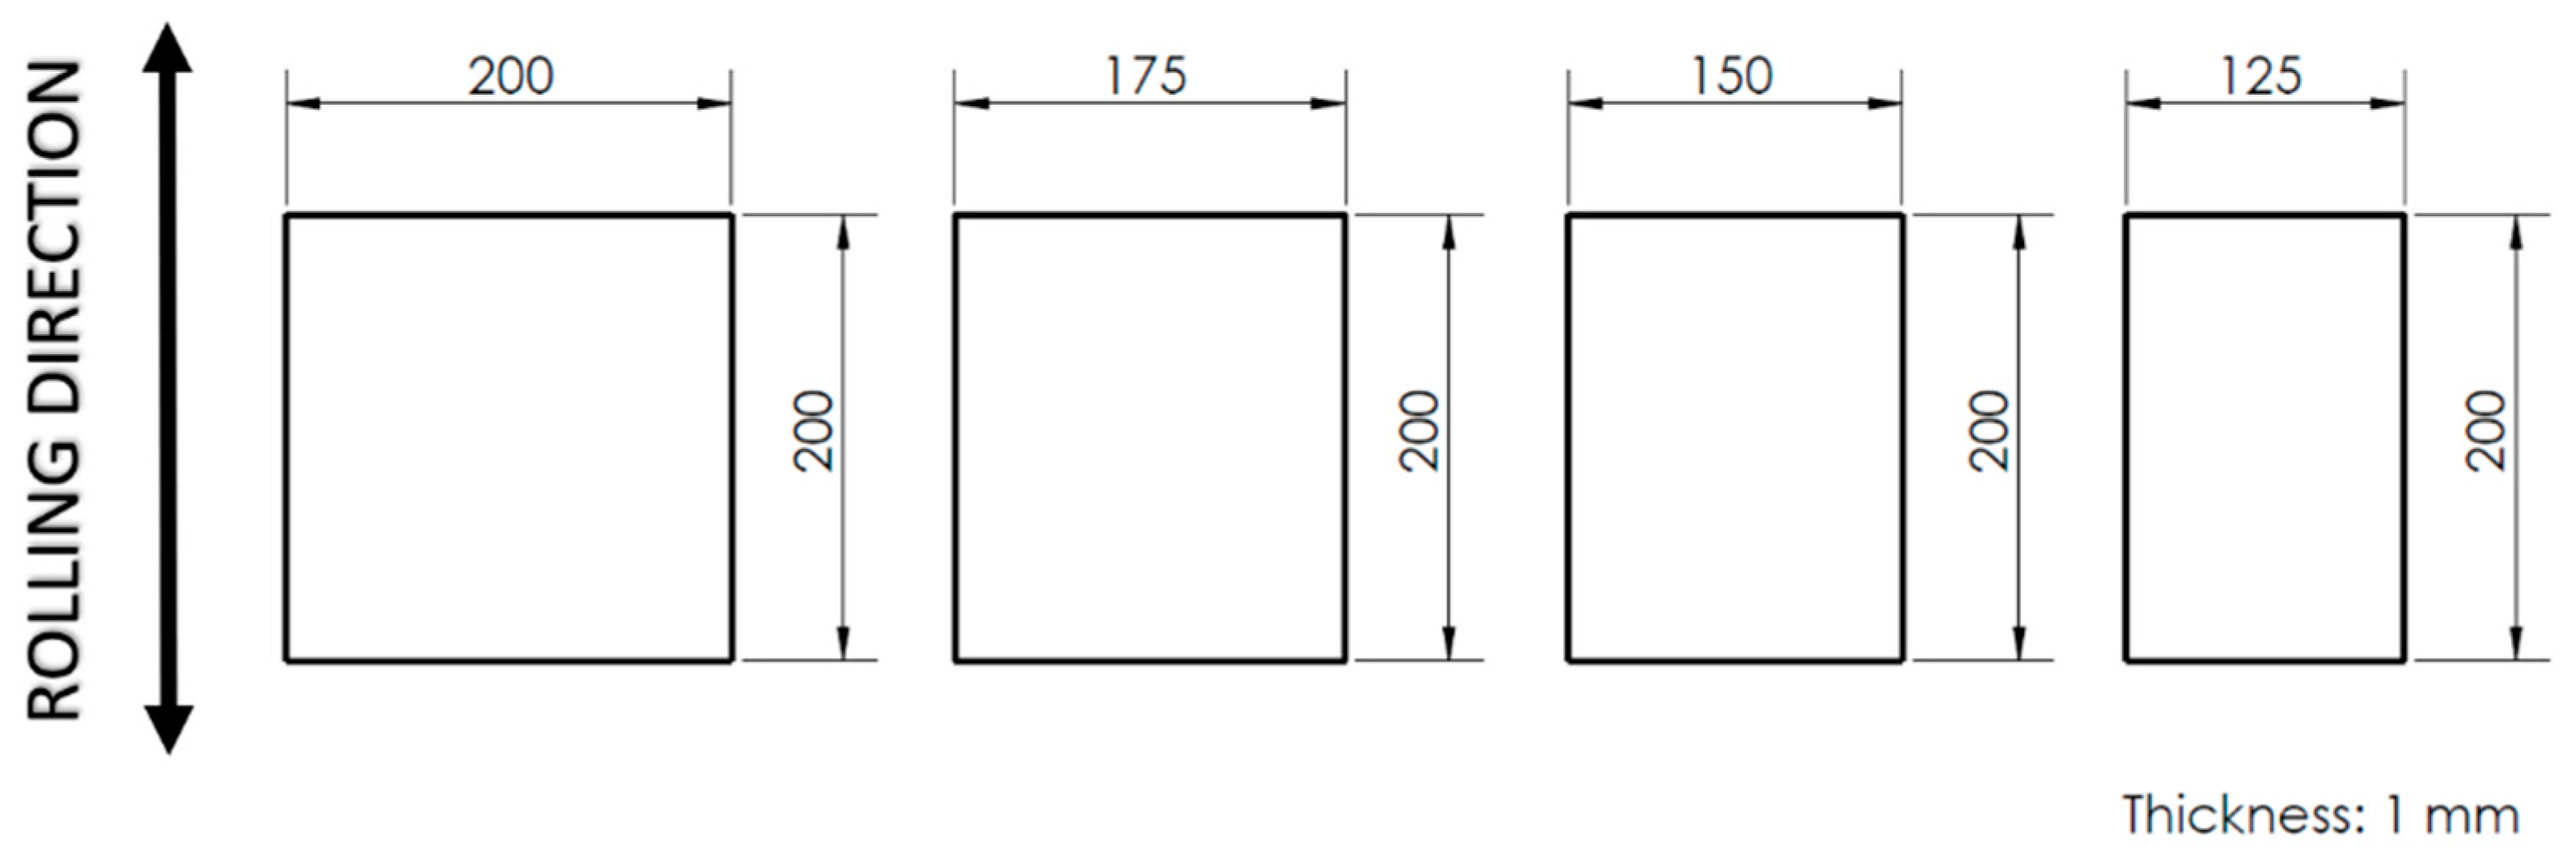
In this study, the main variable was DB geometry, as the blank holder force was fixed in 1157 kN. Test specimens obtained from the sheet metal were limited to only four sample dimensions, all 200 mm in length and with widths of 125, 150, 175 and 200 mm, as shown in
Figure 1. Only these geometries were used, since these are the specimens that produce stretching deformations in the sheet metal, a condition in which the effect of blank holder force and DB are predominant around the punch. The narrower specimens, whose sides do not have direct contact with the blank press and, therefore, produce deformations by drawing, were disregarded, since they do not allow for a more precise evaluation of the effect of the force of the blank press and the DB geometry. It should be noted that, in practical operations, the DB acts fully on the entire contour of the part.
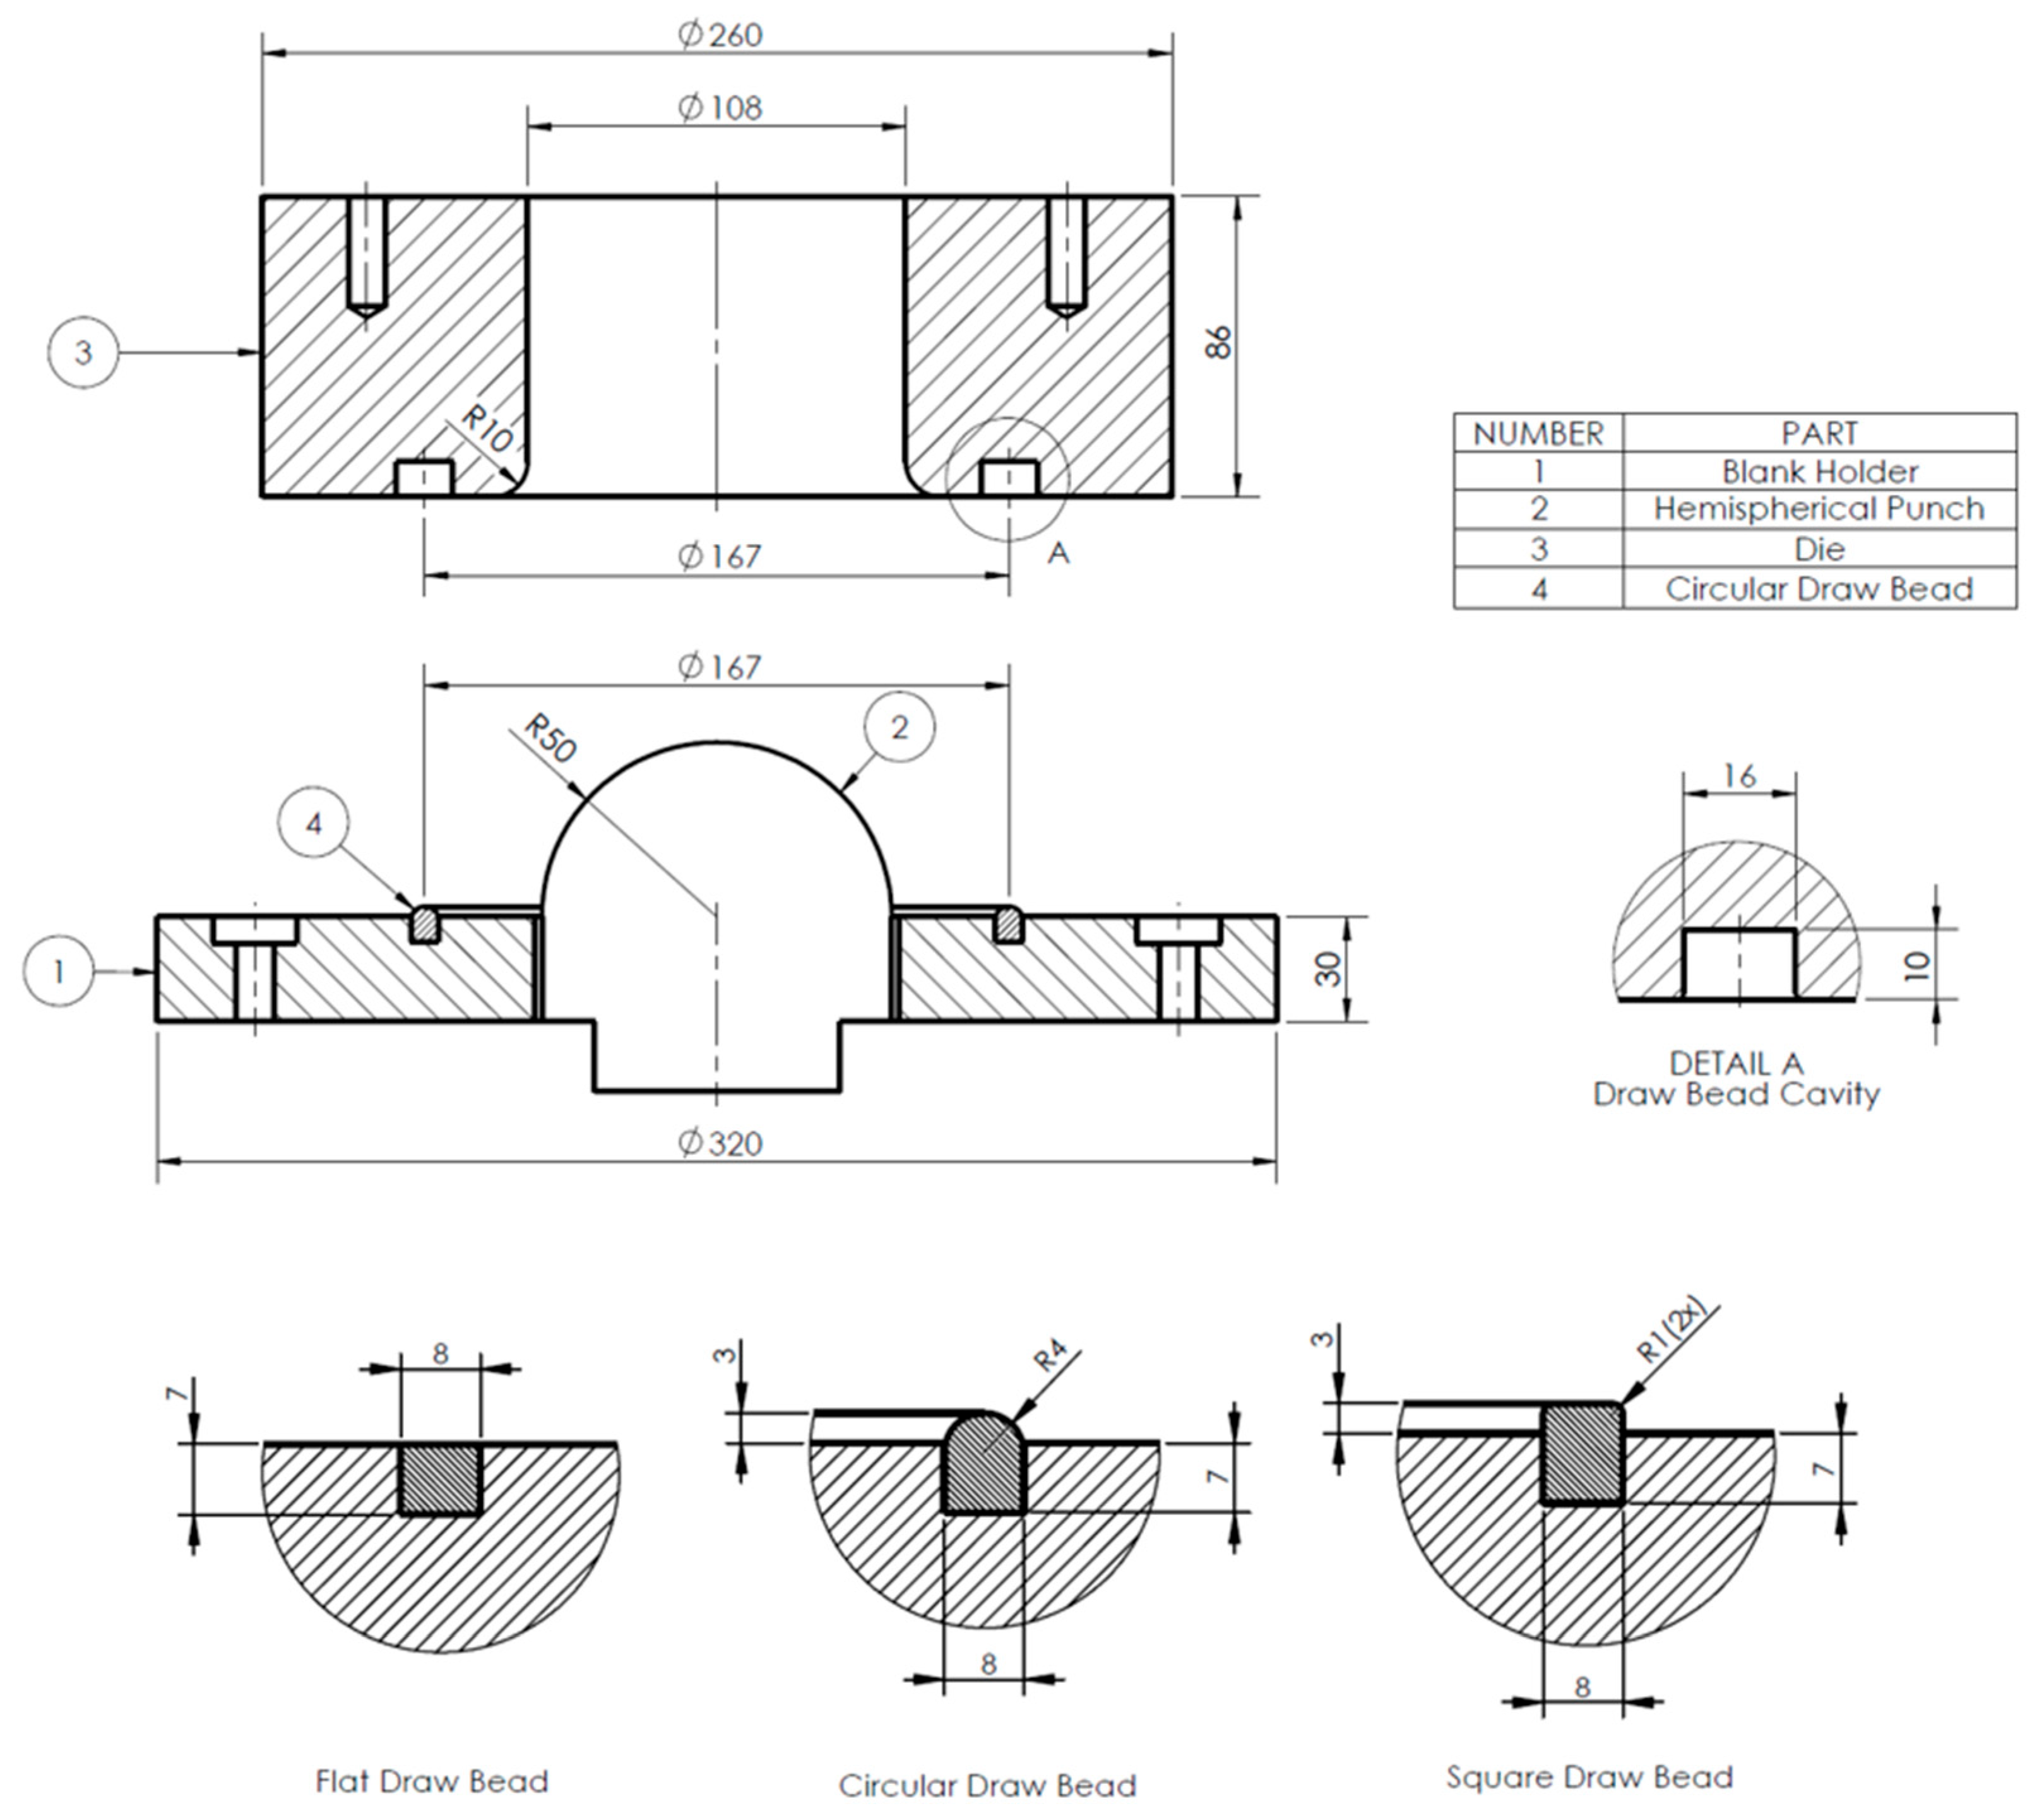
After the material was cut, test specimens were cleaned and printed with a 5 mm diameter circle mesh using the silkscreen method. At this stage, the paint was prepared using a mixture of 90% epoxy paint and 10% nitric acid. This preparation ensured a good finish and the good adhesion of the paint to the specimen’s surface. Tests were performed three times for each condition. The profile and dimension of three DB geometries P (plane or flat), C (circular), and Q (square). The Nakazima test tool proposed by Oliveira et al. [
11] is presented in
Figure 2 and was composed of die, punch, blank holder, and an interchangeable DB ring. The tool was installed in a hydraulic press, controlled using software, setting the BHF in 1157 kN and using 90 mm/min as punch speed.
Except for DB geometries, which were a variable in the proposed tests, the blank holder force of 1157 kN and the other parameters followed the ISO 12004-2 (2008) [
4] standard.
All blanks were stamped without lubrification using the modified Nakazima test. No lubrication was studied, as this provided the worst scenario for forming [
52]. After stamping, the formed blanks were sectioned in the center to remove samples for metallographic preparation, as shown in
Figure 3. The regions selected for analysis are represented in
Table 1, where R represents the die radius and C represents the crack region. Both can be used as reference points for the other regions analyzed. The samples were removed using a cutting disk from the sheet’s cross section, following the rolling direction. In the crack region, samples were taken on the side opposite its formation. The samples were taken only from the 200 × 200 mm blank for the three DB geometries, resulting in six pieces. The pieces were embedded in conductive resin, used for electrolytic polishing and for observation using scanning electron microscopy, associated with the EBSD technique. From each stamped blank, two pieces were removed. They were grouped in pairs depending on the three DB geometries, resulting in three inlays: an inlay for flat, an inlay for circular, and an inlay for square pieces. The two pieces of each stamped blank were separated by nuts during embedding to ensure that the surface with the regions of interest was facing upwards. In
Figure 4, a sample embedded in resin is represented, where (A) is the piece with points R − 5, R − 2.5, R + 2.5, and R + 5, and (B) is the piece with points C − 2.5 and C. A fourth sample was also prepared, which refers to the as received state, being the sheet as received, for comparison basis. The metallographic preparation of the samples for microscopy and nanoindentation analyses involved mechanical grinding using SiC-abrasive papers with different particle sizes and granulometry ranging from 120 to 1200, followed by electrolytic polishing using an electrolyte composed of 800 mL of ethanol, 140 mL of distilled water, and 60 mL of 60% perchloric acid, using 35 V for 15 s.
The scans using the EBSD technique were carried out in specific regions of the samples, according to
Table 1. The analysis took place using the FEI
TM Quanta FEG 450 high-resolution microscope (FELMI-ZFE, Graz, Austria), using a 70° incidence angle of the electron beam with 20 kV acceleration voltage, 0.2 µm step during the scan, and 2.500 times magnification in the previously mentioned regions of interest. The collected data was analyzed using the software TSL OIM Analysis version 8. The tools used to analyze the EBSD maps were Inverse Pole Figure (IPF) and Kernel Average Misorientation (KAM).
All experiments were performed using a nanoindenter Zwick-Roel at Nanomechanical Properties Laboratory from UFPR, using the software Inspector X (version 4.7.8) for data acquisition and analysis. As described by Oliver and Pharr [
37], a Berkovich indenter was used. It consists of a three-sided pyramid with an area-to-depth function which is the same as a Vickers indenter; all experiments were conducted in load-controlled conditions, with a maximum force of 50 mN (5 g) and a load-holding–unloading time of 10 s-5 s-10 s with a room temperature of 22 °C and 61% of air humidity. The indentations were arranged in a regular grid with a spacing of 20 µm, as presented in
Figure 4b. A total of 252 indentations were distributed on a single specimen of DP600, divided in seven points, as shown on
Table 2. Every sample point was measured in three different thickness dimensions from the top edge of the sheet: (a) 0.1 mm, (b) 0.5 mm, and (c) 0.9 mm. Three specimens were evaluated, according to DB geometry, for their rolling directions.
3. Results and Discussion
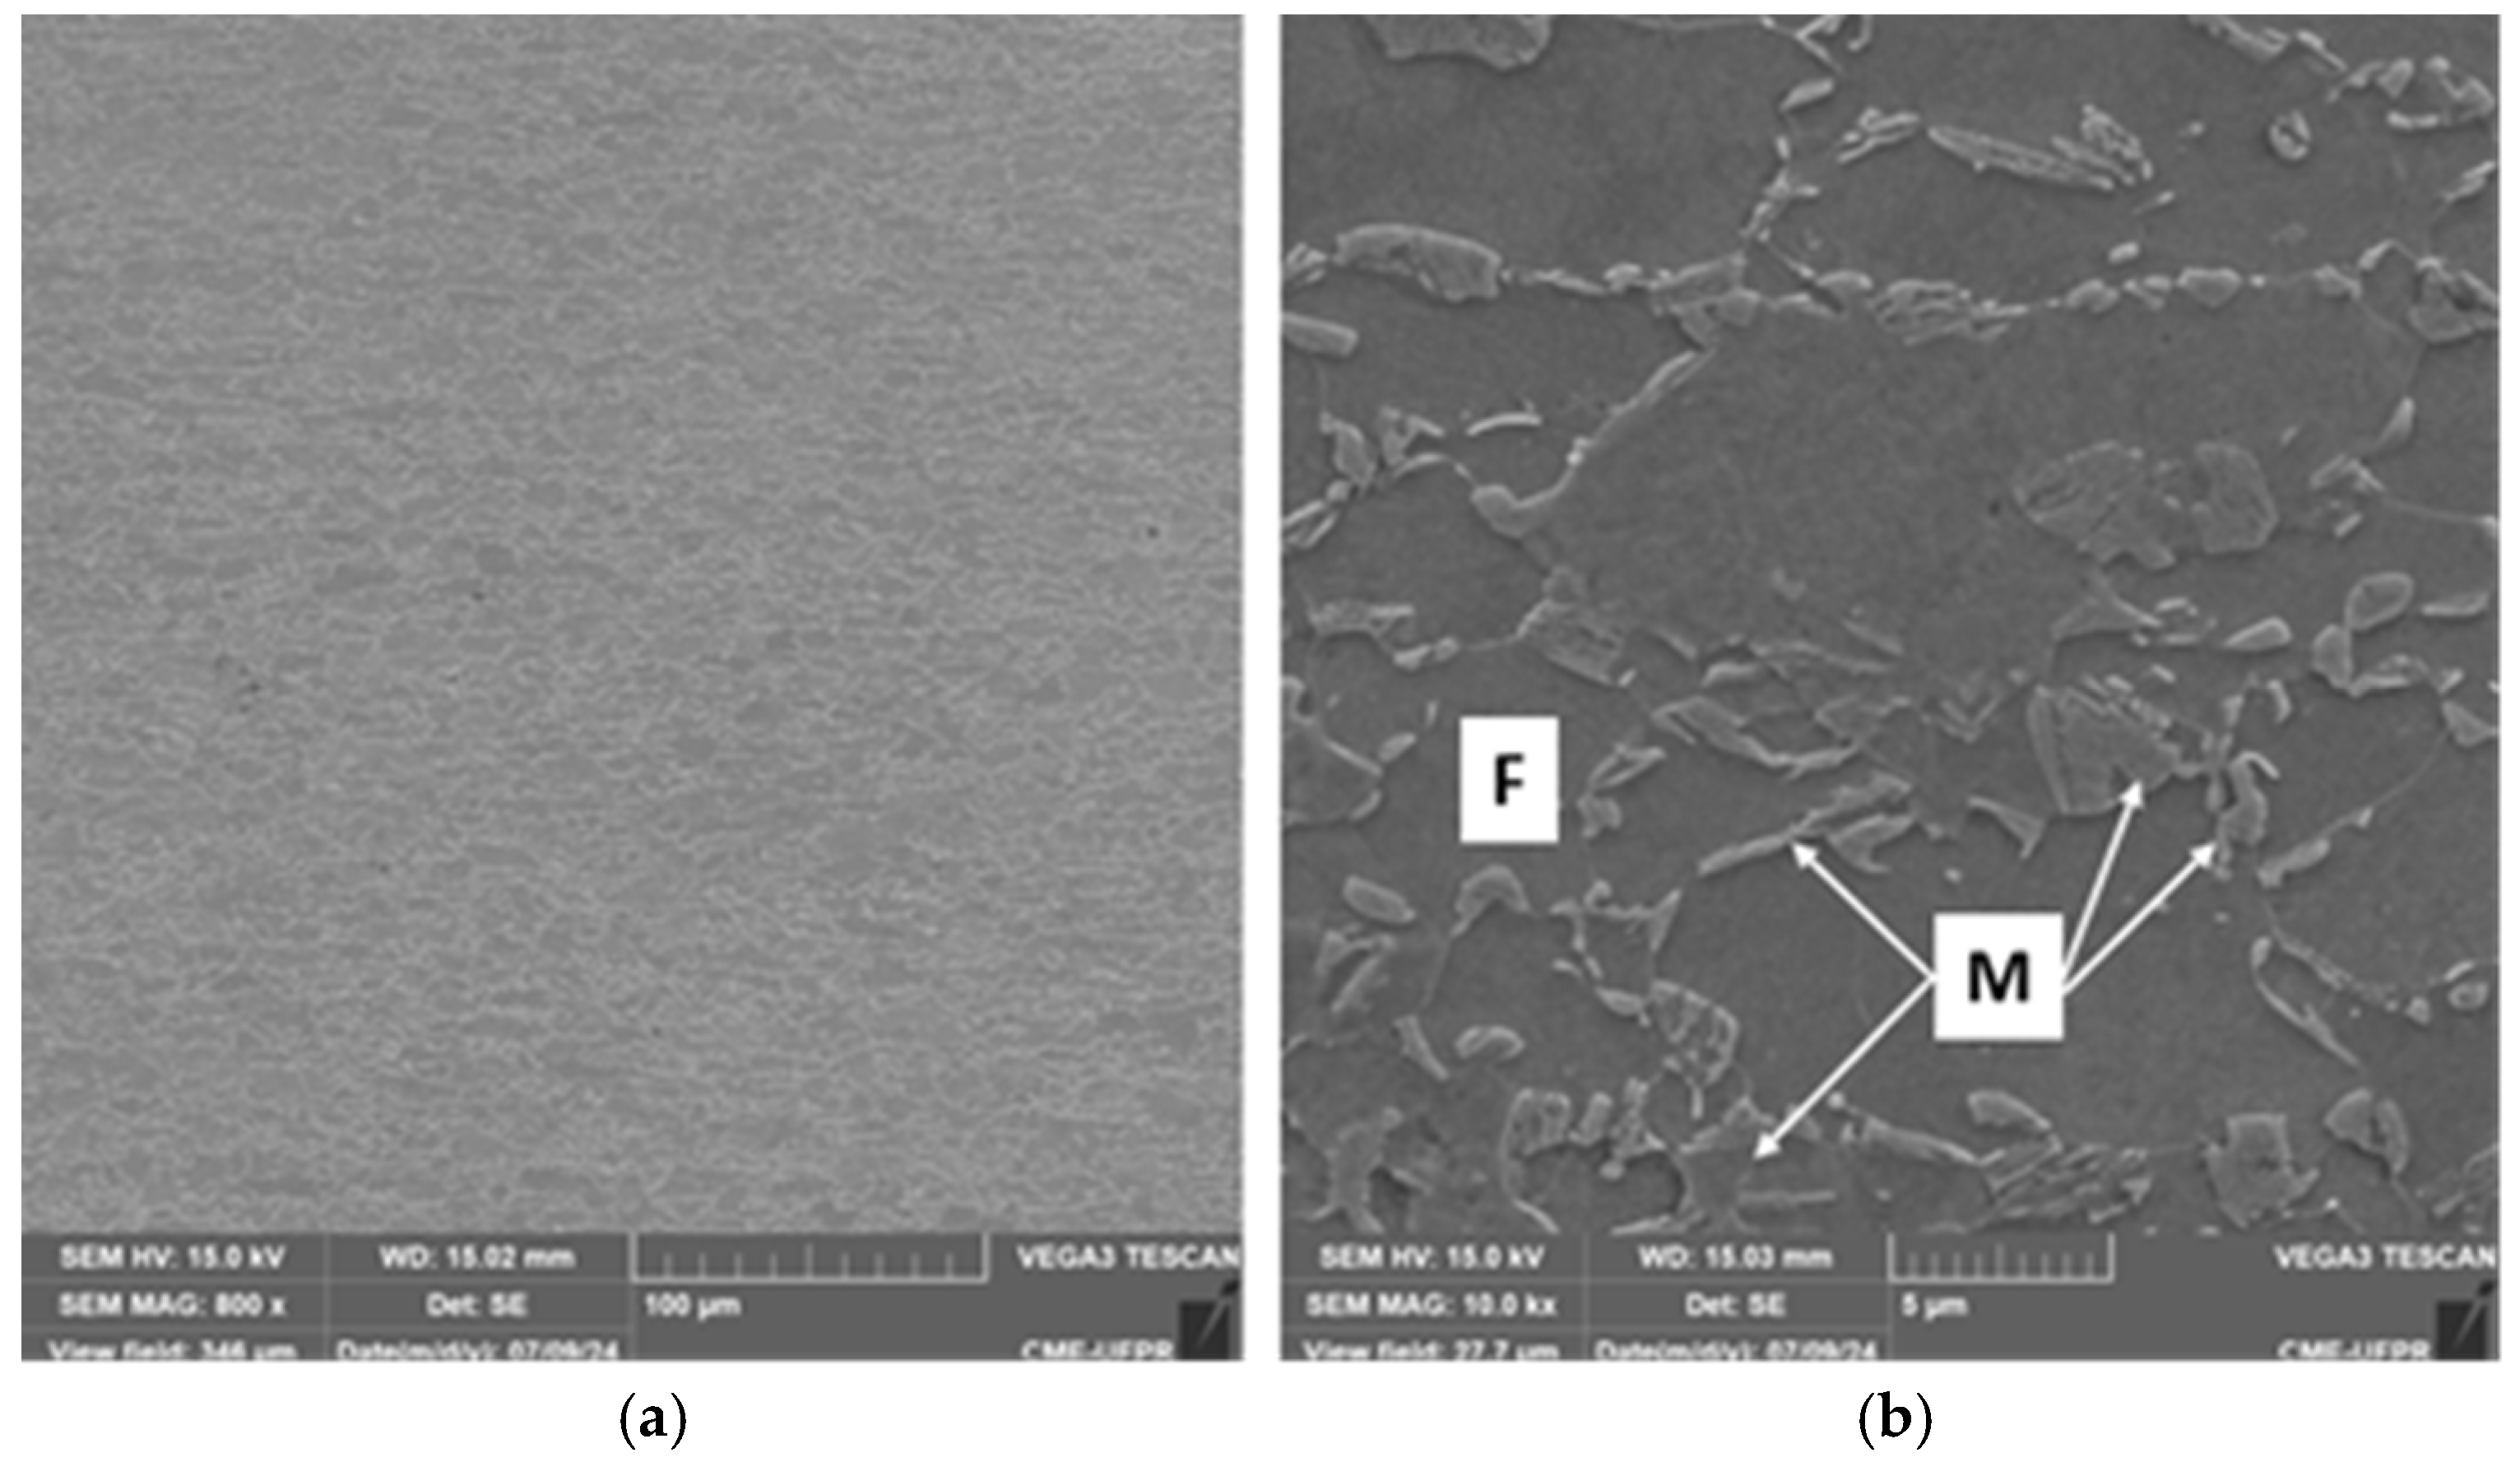
The microstructure of DP600 steel as received, captured using scanning electron microscopy, is shown in
Figure 5, with magnifications of 800 and 10,000 times. The figure indicates that the microstructure consists of ferrite (dark gray) and martensite (light gray), as referenced by Raabe [
44], Wang and Wei [
53], and Saai et al. [
54]. Martensite is distributed mainly along the ferrite grain boundaries and several small islands of martensite dispersed in the matrix.
The mechanical properties and formability parameters of DP600 steel are presented in
Table 3, as well as results obtained from uniaxial tensile tests in different positions in relation to the sheet rolling direction (0°, 45°, and 90°).
According to results, the material used in this study demonstrated mechanical properties and stamping parameters consistent with expectations for DP600 steel, according to data reported by Barlo et al. [
17], Khan et al. [
19], Mansur et al. [
22], Park et al. [
23], and Chemin Filho et al. [
27]. The agreement across multiple studies reinforces the reliability of the material’s characteristics and its performance under stamping conditions, validating its suitability for industrial applications.
Small variations in results between different batches of sheets supplied often indicate significant variations in the stamping tests due to the great sensitivity of this manufacturing process to variations in sheet metal properties, hence the need to perform preliminary tests to characterize the materials received.
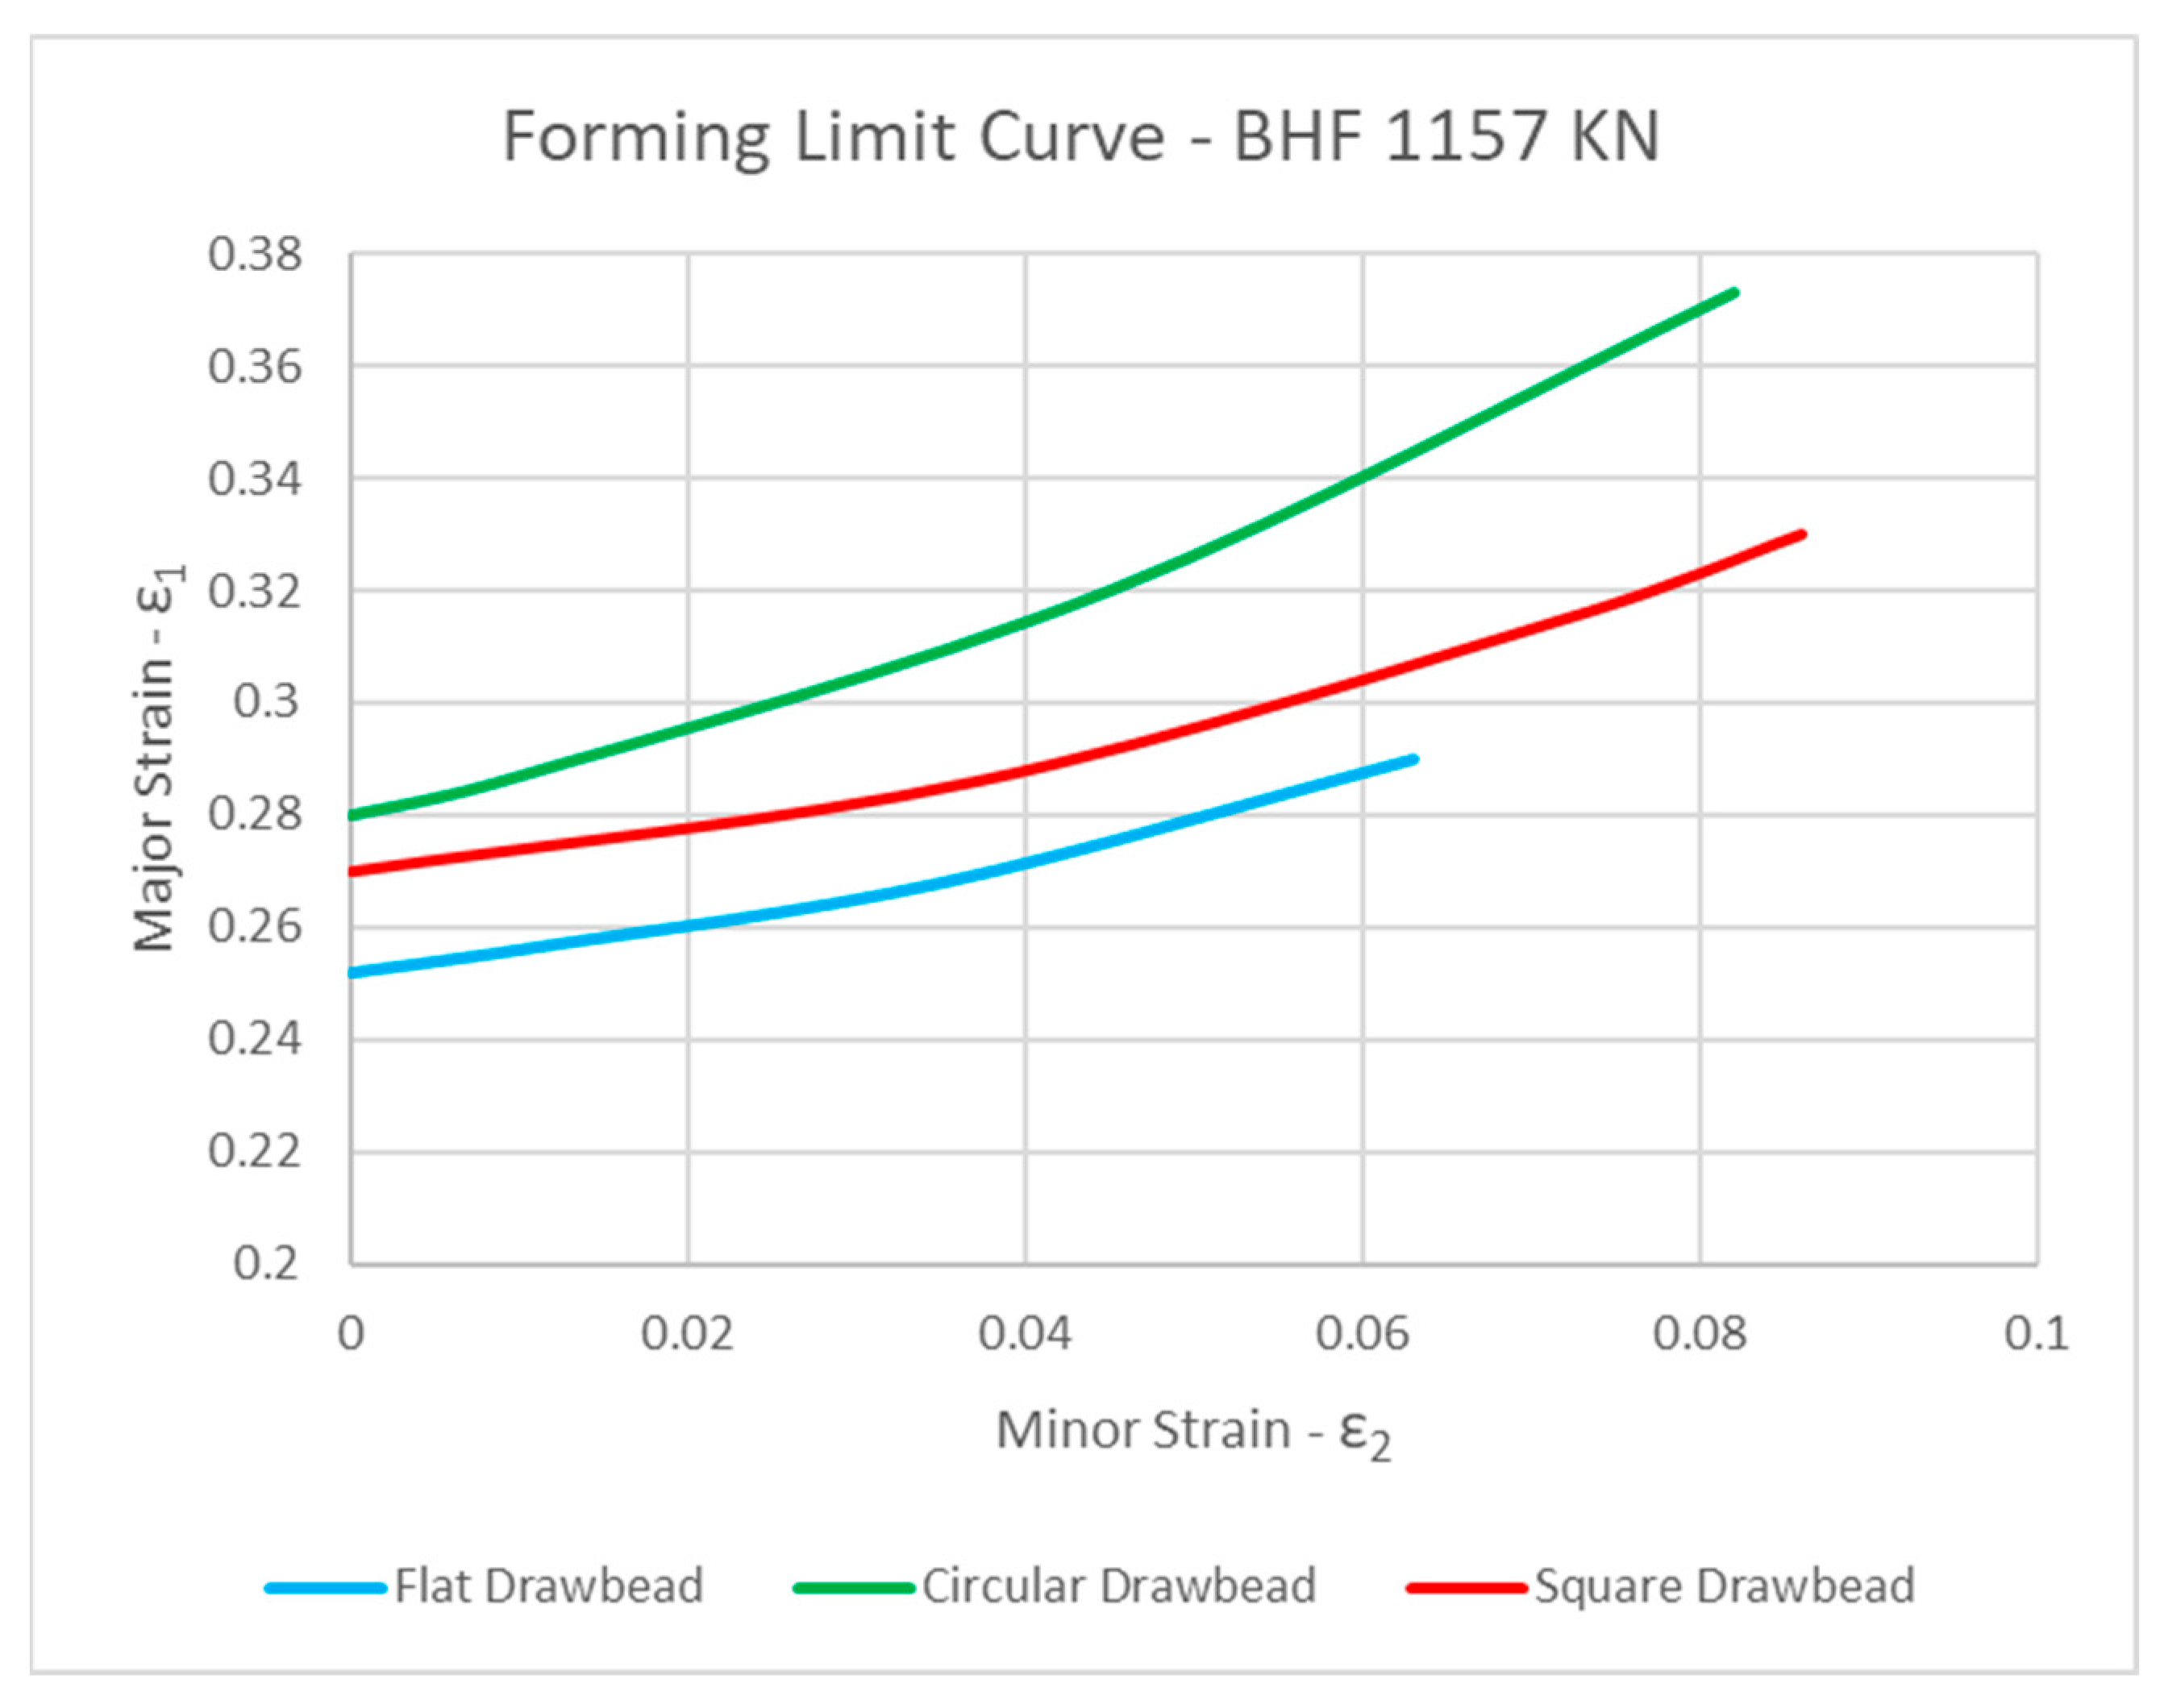
From the stamping tests conducted until material rupture, a total of three forming limit curves were obtained, one for each DB geometry. Thus, the curves were grouped in the same graph for comparative analysis regarding the stampability of the sheet in each test condition, as shown in
Figure 6. It should be noted that the result of the limit curves of forming is the basis for identifying, according to the characteristics of the deformation and hardness profiles, the causes that led to a better or worse performance of the material in each test configuration.
According to the limit forming curves presented, the best performance with the circular DB and the worst performance with the flat one are evident for both sheet press forces used. This result is very close to the results presented by Oliveira et al. [
11], who performed similar tests for DP780 steel.
In this way, the FLC clearly shows the real gains in sheet metal stampability with the use of DB, in addition to how the use of a more appropriate tooth geometry increases material formability. The detrimental effect of the low restriction on the flow of the material in the flange region on its formability is evident, since the flat geometry, which restricts the sheet flow during stamping to a lesser extent, produces lower FLC. Thus, the restrictive function of sheet flow, resulting from the use of the DB and BHF, substantially improves the formability limit of the material under study.
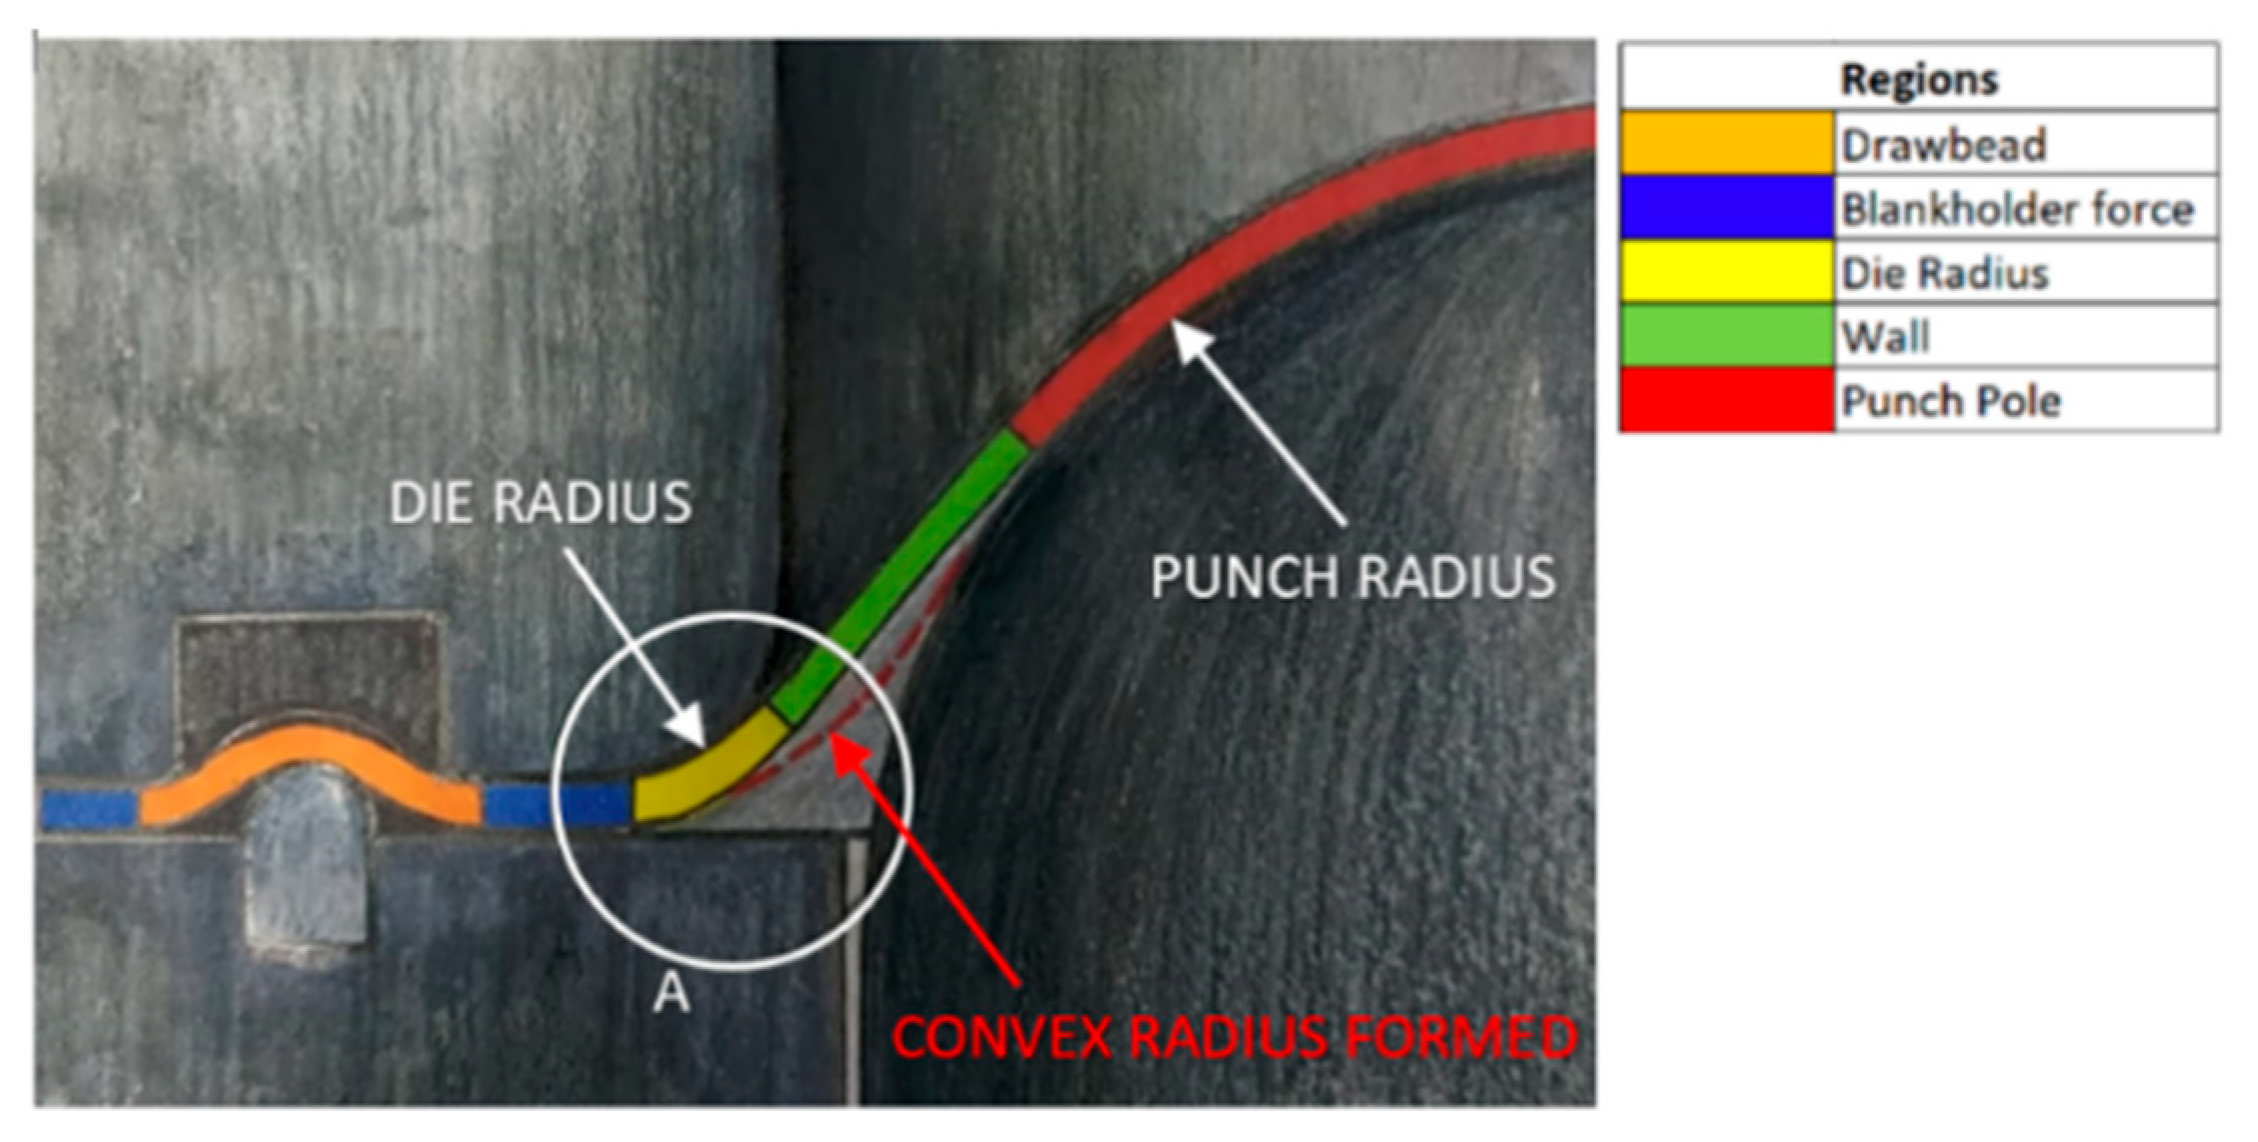
For a more detailed analysis and a better understanding of the material’s behavior during stamping, a study of the sheet mechanics during the forming process was carried out to identify the way in which the metal sheet deforms in certain regions from the test specimen, as presented in
Figure 7.
The blue regions represent the points where the blank holder acts directly on the material blank. The orange region represents the DB acting area, deforming a metal blank, still on the flange. The yellow region at the end of the flange represents the folded area of the sheet on die radius, where the sheet metal is flowing into the tool. At this moment, the material is subjected to the Bauschinger effect, also, and the sheet metal is counterclockwise bent (indicated by
Figure 8). This condition was denominated, similar to “convex forming” of the blank. Studies from Gui et al. [
55], Kim and Park [
56], and David et al. [
57] provide insights about this behavior, highlighting its importance to the material’s performance when submitted to cyclic loads.
The green region corresponds to the “wall” of the cup, and the red region corresponds to punch pole. In the red area, the punch acts directly against the sheet metal, forming a pressure zone between the tool and the material, under intense friction, from which the sheet metal flows towards the wall region of the sample, that is, in the opposite direction to the flow of the sheet metal in the flange region, where it is pulled into the die. At the punch pole, the sheet metal is also curved in the opposite direction to the curvature over the die radius, forming a “concave” profile over the material.
Based on these characteristics, it can be said that the wall region, in an intermediate position between the die radius and the punch pole, is a friction-free zone, which represents an important transition in the flow direction and sheet curvature during stamping. The mechanical behavior of the sheet in the wall region is directly affected by the restrictive force on the sheet in the flange (defined by the BHF and DB geometry), which affects the flow of the material and, consequently, the degree of work hardening resulting from the bending of the sheet over the die radius.
The impact of the punch pole region on the wall region, which affects the flow of the material in this direction, depends only on the friction condition between the punch and the sheet, which, in laboratory tests, is constant. In practical terms, other variables must be considered, in addition to the lubrication condition, which affects the coefficient of friction, such as the geometry of the tooling (punch and die shape factors).
Based on Oliver–Pharr [
37] method, nanoindentation measurements were performed in different blank regions, as previously presented in
Table 2. The deformations caused in each of them are directly related to the hardening of the material during stamping. Nanoindentation results are expressed in [HV], and can be summarized in
Figure 9, for different DB geometries.
In the crack region (point C of the samples), the hardness is very similar when comparing flat and circular geometries, being around 302 HV. The value registered for the square was 320.6 HV, an increase of approximately 5%.
For the flat DB, the hardness variation between points R + 5 and C − 2.5 was 224.7 HV and 291.7 HV, respectively, until failure was reached. For circular geometry, the hardness variation between the same points of the sample was 243.6 HV and 298.5 HV, respectively, reaching up to 302.8 HV until rupture. For the square profile, the hardness variation between the points was 255 HV and 311.9 HV, respectively, reaching 320.6 HV at the crack point. The hardness variation between the three geometries at these points was, respectively, (a) 67 HV for the flat, (b) 54.9 HV for the circular, and (c) 56.9 HV for the square. The greater variation for flat geometry points to heterogeneous deformation, compared to other geometries, compromising the formability of the material. The smaller variation in hardness presented by the circular and square types of points to a soft strain distribution, which was better for stamping. For flat geometry, the hardness is stable between the points R + 2.5 and R + 5 of the sample, characterized as a “dead zone”. During the deformation of the sheet, under the action of the punch in the stamping region, a flow of the sheet occurs simultaneously from the flange region to the die radius (R). Due to the lower restrictive force imposed on the sheet by the flat DB, it flows with greater speed over the matrix, accentuating the effect of hardening on the radius (a greater increase in hardness at this point). In addition to causing a difference in speed between the different regions of the sheet, the speed at the exit radius is greater than at the beginning of the stamped region, causing a compression effort at the point of discontinuity (without friction) between the die radius and the punch pole. By varying the geometry of the DB to circular and square shapes, there is a greater balance in the material flow during stamping, represented by a smaller variation in the sheet speed in different regions. This is a possible cause for the formation of the “dead zone” found for the flat type.
The R − 5 point of the samples is closest to DB, which influences the hardness profile results along the stamped blank. The hardness profile for the flat is the lowest, as the DB does not cause any deformation in the sheet. The greater hardness attributed to the square profile is due to the greater deformation caused by it when it acts on the sheet before the punch begins to deform the sheet. The circular type also deforms the blank, but the increase in hardness is smaller compared to the square type, being closer to the values achieved by the flat type. This greater deformation caused by the square type, when the blank press acts before the start of the punch action, is what explains the higher hardness level for the square at all points of the sample from R − 5 to R + 5. The circular geometry is the one that presented a more uniform hardness variation across the entire profile of the stamped blank (points R − 5 to R + 5) and presented a lower level of hardness in relation to the square geometry, presenting the best performance in stamping, evidenced by the FLC. The square type presented lower hardness variation than the flat type and greater variation compared to the circular one. Furthermore, the square presented the highest level of hardness throughout the stamped blank, which resulted in better performance compared to the flat one, but was lower compared to the circular geometry, also evidenced by the FLC. The hardness variation between the R − 5 and R + 5 points of the samples showed very similar results between the circular and square geometries (2.4 HV and 3.5 HV, respectively), showing that the DB mitigates this variation, which is positive for the better formability of the sheet, corroborating the FLC results. However, for the square type, the hardness levels were higher than for the circular type, explaining the lower performance using FLC. These types of DB impose greater restrictions on the sheet flow, placing more tension in the region of the stamped cup wall, producing positive deformations throughout the profile. The one with flat geometry showed a hardness variation of 13.4 HV in this same region, showing that it does not impose restrictions on the sheet flow, providing a more accentuated curvature in the region of the wall of the stamped cup, close to the punch radius, generating a compression effort at this point, which explains the lower hardness at the R + 5 point of the sample and, consequently, the greater hardness variation in the stamping area.
At point R − 2.5 for each sample, the hardness variation was (a) 17.8 HV for flat, (b) 6.7 HV for circular, and (c) 5.4 HV for square geometries. This variation refers to the difference in thickness measurements of 0.1 mm, 0.5 mm, and 0.9 mm from the upper surface of the sheet. The greatest variation was registered for flat geometry. For the circular and square geometries, the variation was closer to each other, being smaller in the square; however, the average hardness at this point was higher, compared to the circular one. At point R from each sample, the hardness variation was (a) 29.7 HV for flat, (b) 22.5 HV for circular, and (c) 20.6 HV for square geometries. Such hardness variation is consistent with FLC and directly impacts material hardening. The variation in hardness between points R − 2.5 and R of each sample, considering the 0.9 mm elevation from the upper surface of the sheet, showed an increase in hardness of 25.4 HV for the flat profile, an increase of 10 HV for the circular one, and an increase of 9.3 HV for the square geometry.
The average error of nanoindentation, presented in
Figure 8, is due to a nanoscale of measurement carried out on a dual-phase steel that contains ferritic and martensitic phases in its microstructure. So, it was used the average values of nanoindentation seen in
Figure 8, which corroborate to the microhardness results obtained in the same regions of measurement.
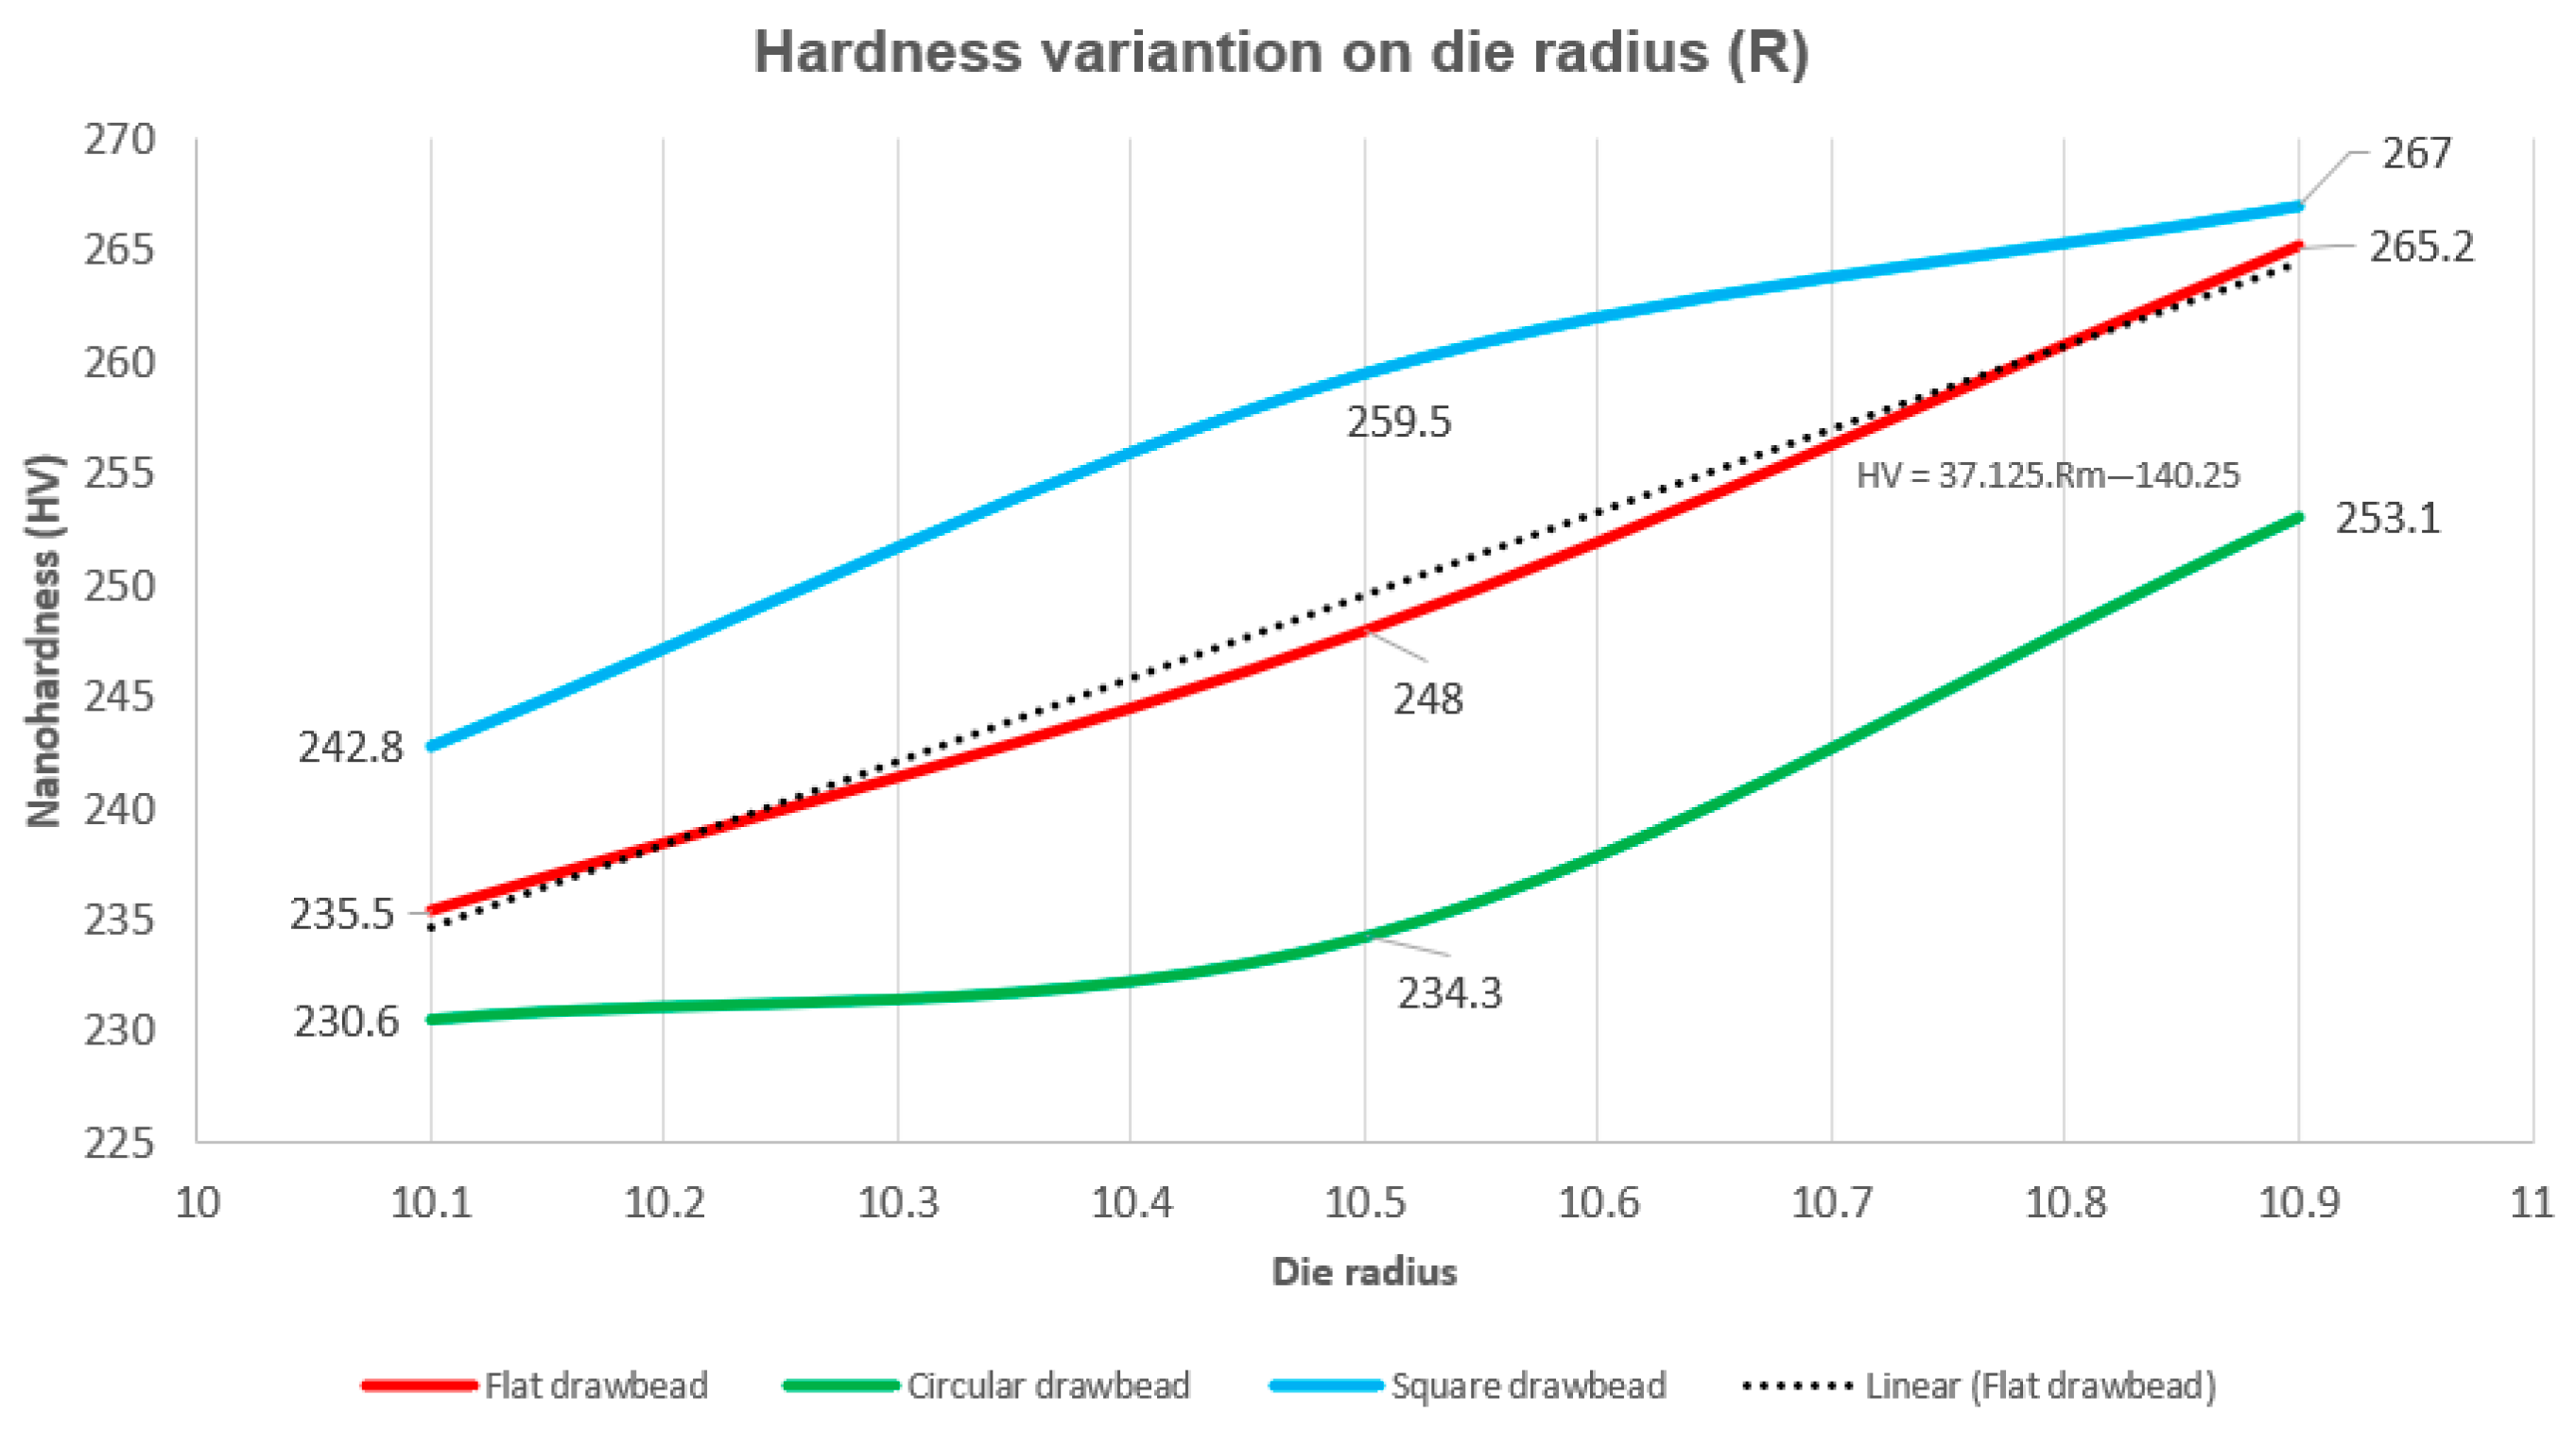
This point is subjected to successive load reversals, which can be associated with the Bauschinger effect because of the influence of hardening. In this way, this point was evaluated at three different dimensions of the sheet’s thickness depending on each DB geometry. As previously presented, the die radius has a dimension of 10 mm, and, for this specific point, nanohardness measurements occurred at three different dimensions of the sheet’s thickness (10.1 mm, 10.5 mm, and 10.9 mm) for the three DB geometries. These results are presented in
Figure 9.
It is possible to show that, regardless the DB geometry, the nanohardness values increased due to the increase in the dimension that represents the distance in relation to the neutral axis of the sheet, where the point 10.1 mm is closer to (R), subjected to compression efforts, while the point 10.9 mm is closer to the punch pole, being subjected to tensile efforts.
It is possible to verify that the flat DB presented a greater variation in hardness (29.7 HV); however, the curve has a profile very close to linear. The hardness variation between the circular and square geometries was very close, with values of 22.5 HV and 24.2 HV, respectively; however, the curves had different profiles and hardness levels.
The lowest level of hardness occurred for circular geometry. It is the DB that generates less damage to the sheet because of being more influenced by the Bauschinger effect, relieving flow stress and reducing hardness through hardening. The square profile was the one that presented the highest level of hardening over the die radius, which is more influenced by hardening, as it restricts the slipping of the sheet due to its geometry. The flat profile, despite being at a lower level of hardening due to hardening over the die radius, in relation to the square, presented worse performance in the FLC due to the formation of the “dead zone” at the beginning of the wall region of the stamped specimen. As the circular DB has less influence from hardening, it is precisely this geometry that presented a better stamping performance, as evidenced by the FLC.
The formation of the “dead zone” in the flat DB is due to a transition from a convex to a concave deformation in the region of the wall of the printed cup. This DB does not have teeth or protrusions, so there is no increase in its restrictive force and, consequently, the sheet slides more during stamping. This produces less stretching of the sheet in this transition region between the convex and concave deformation, causing a “dead zone” which produces a greater variation in hardness in the region from the wall to the crack, compromising the sheet’s formability.
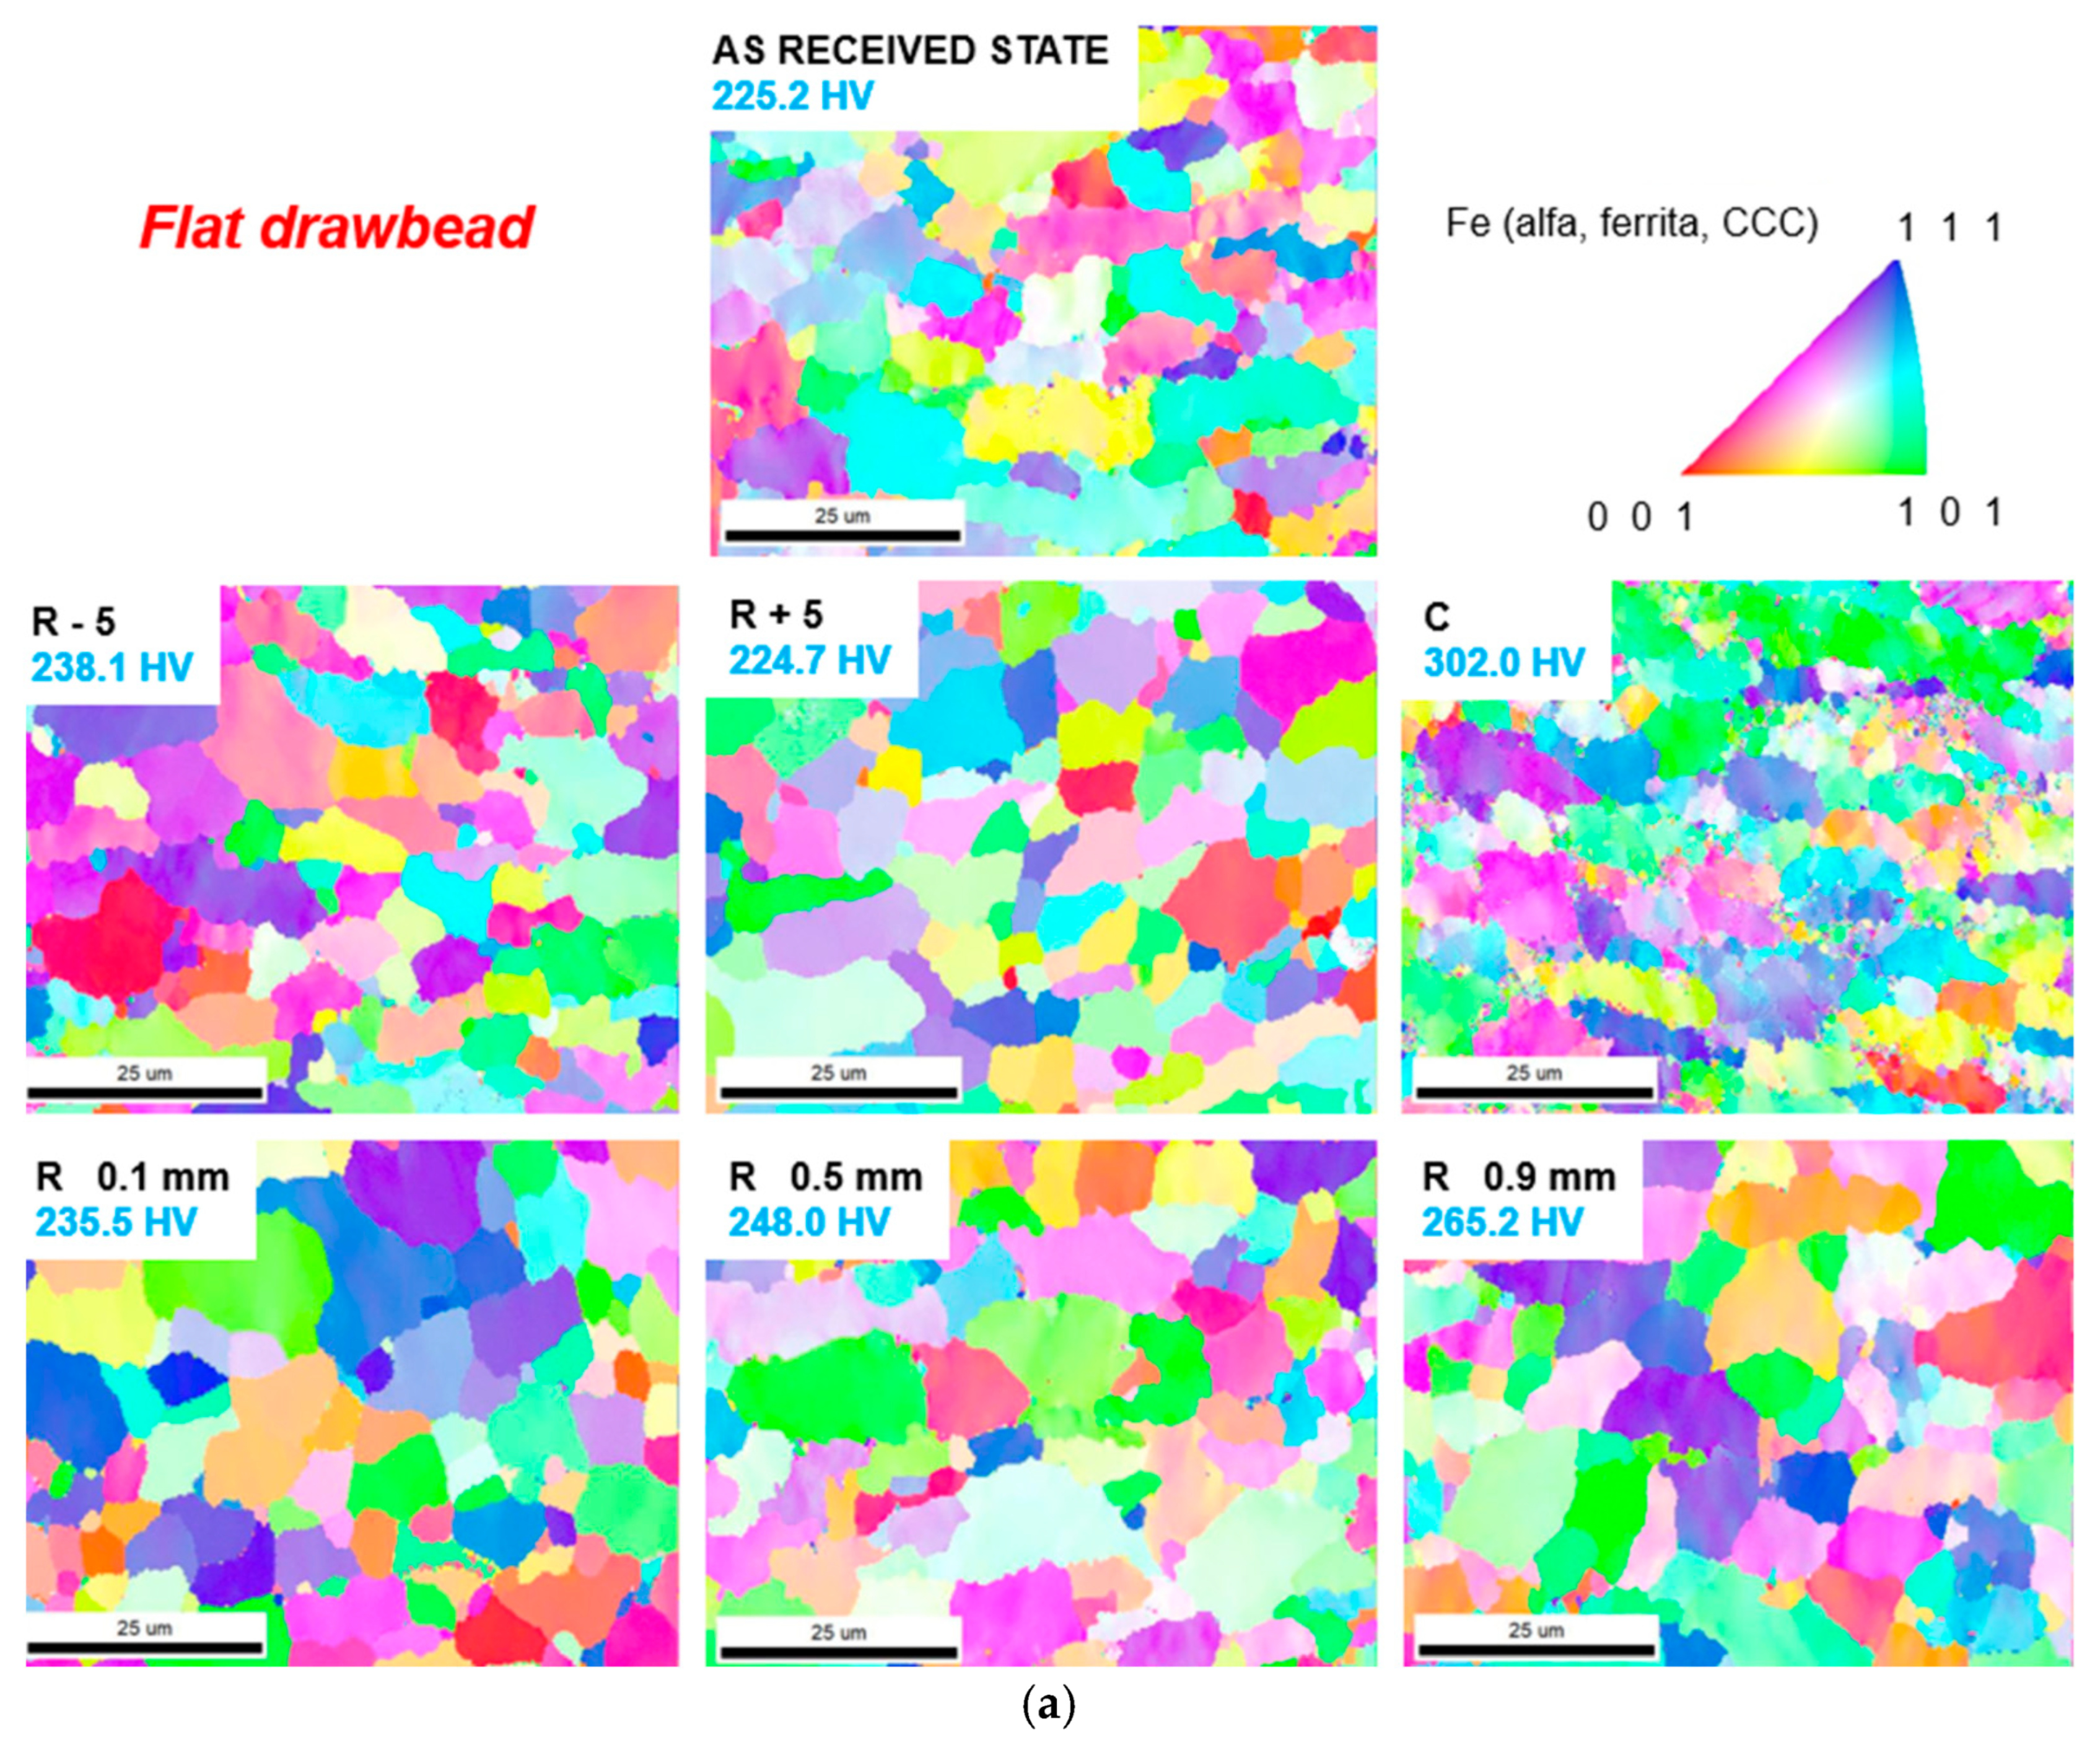
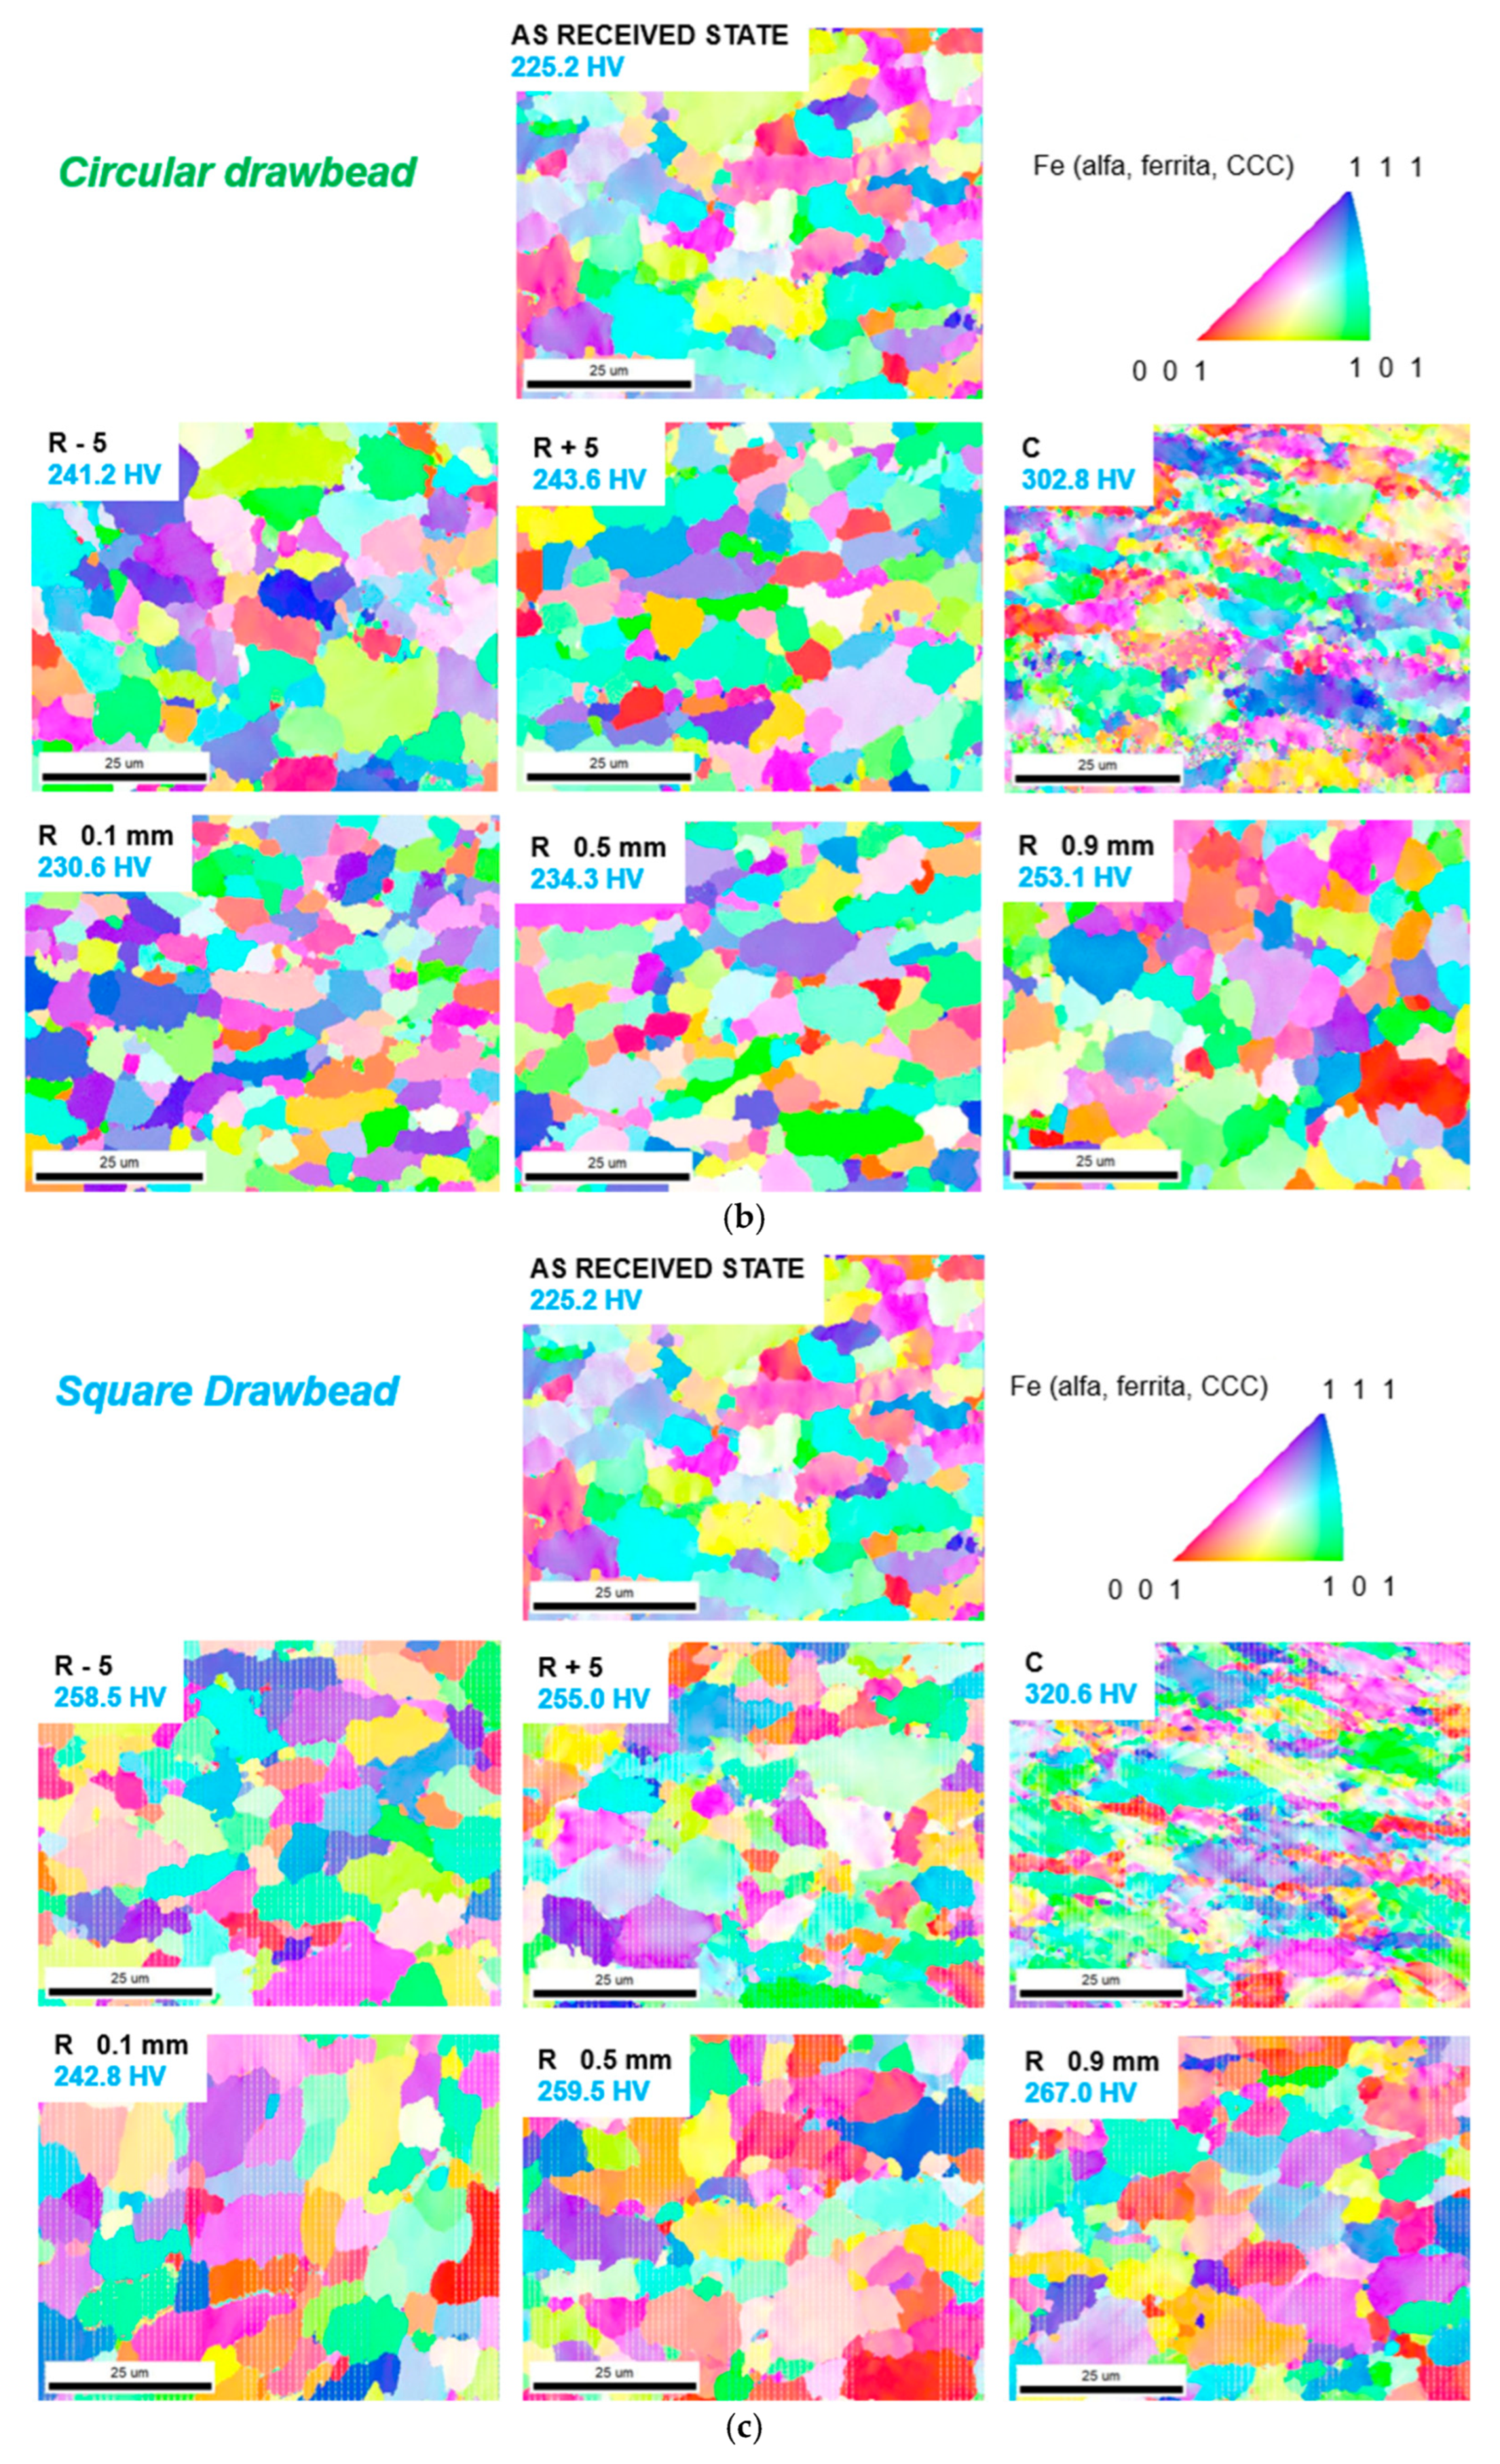
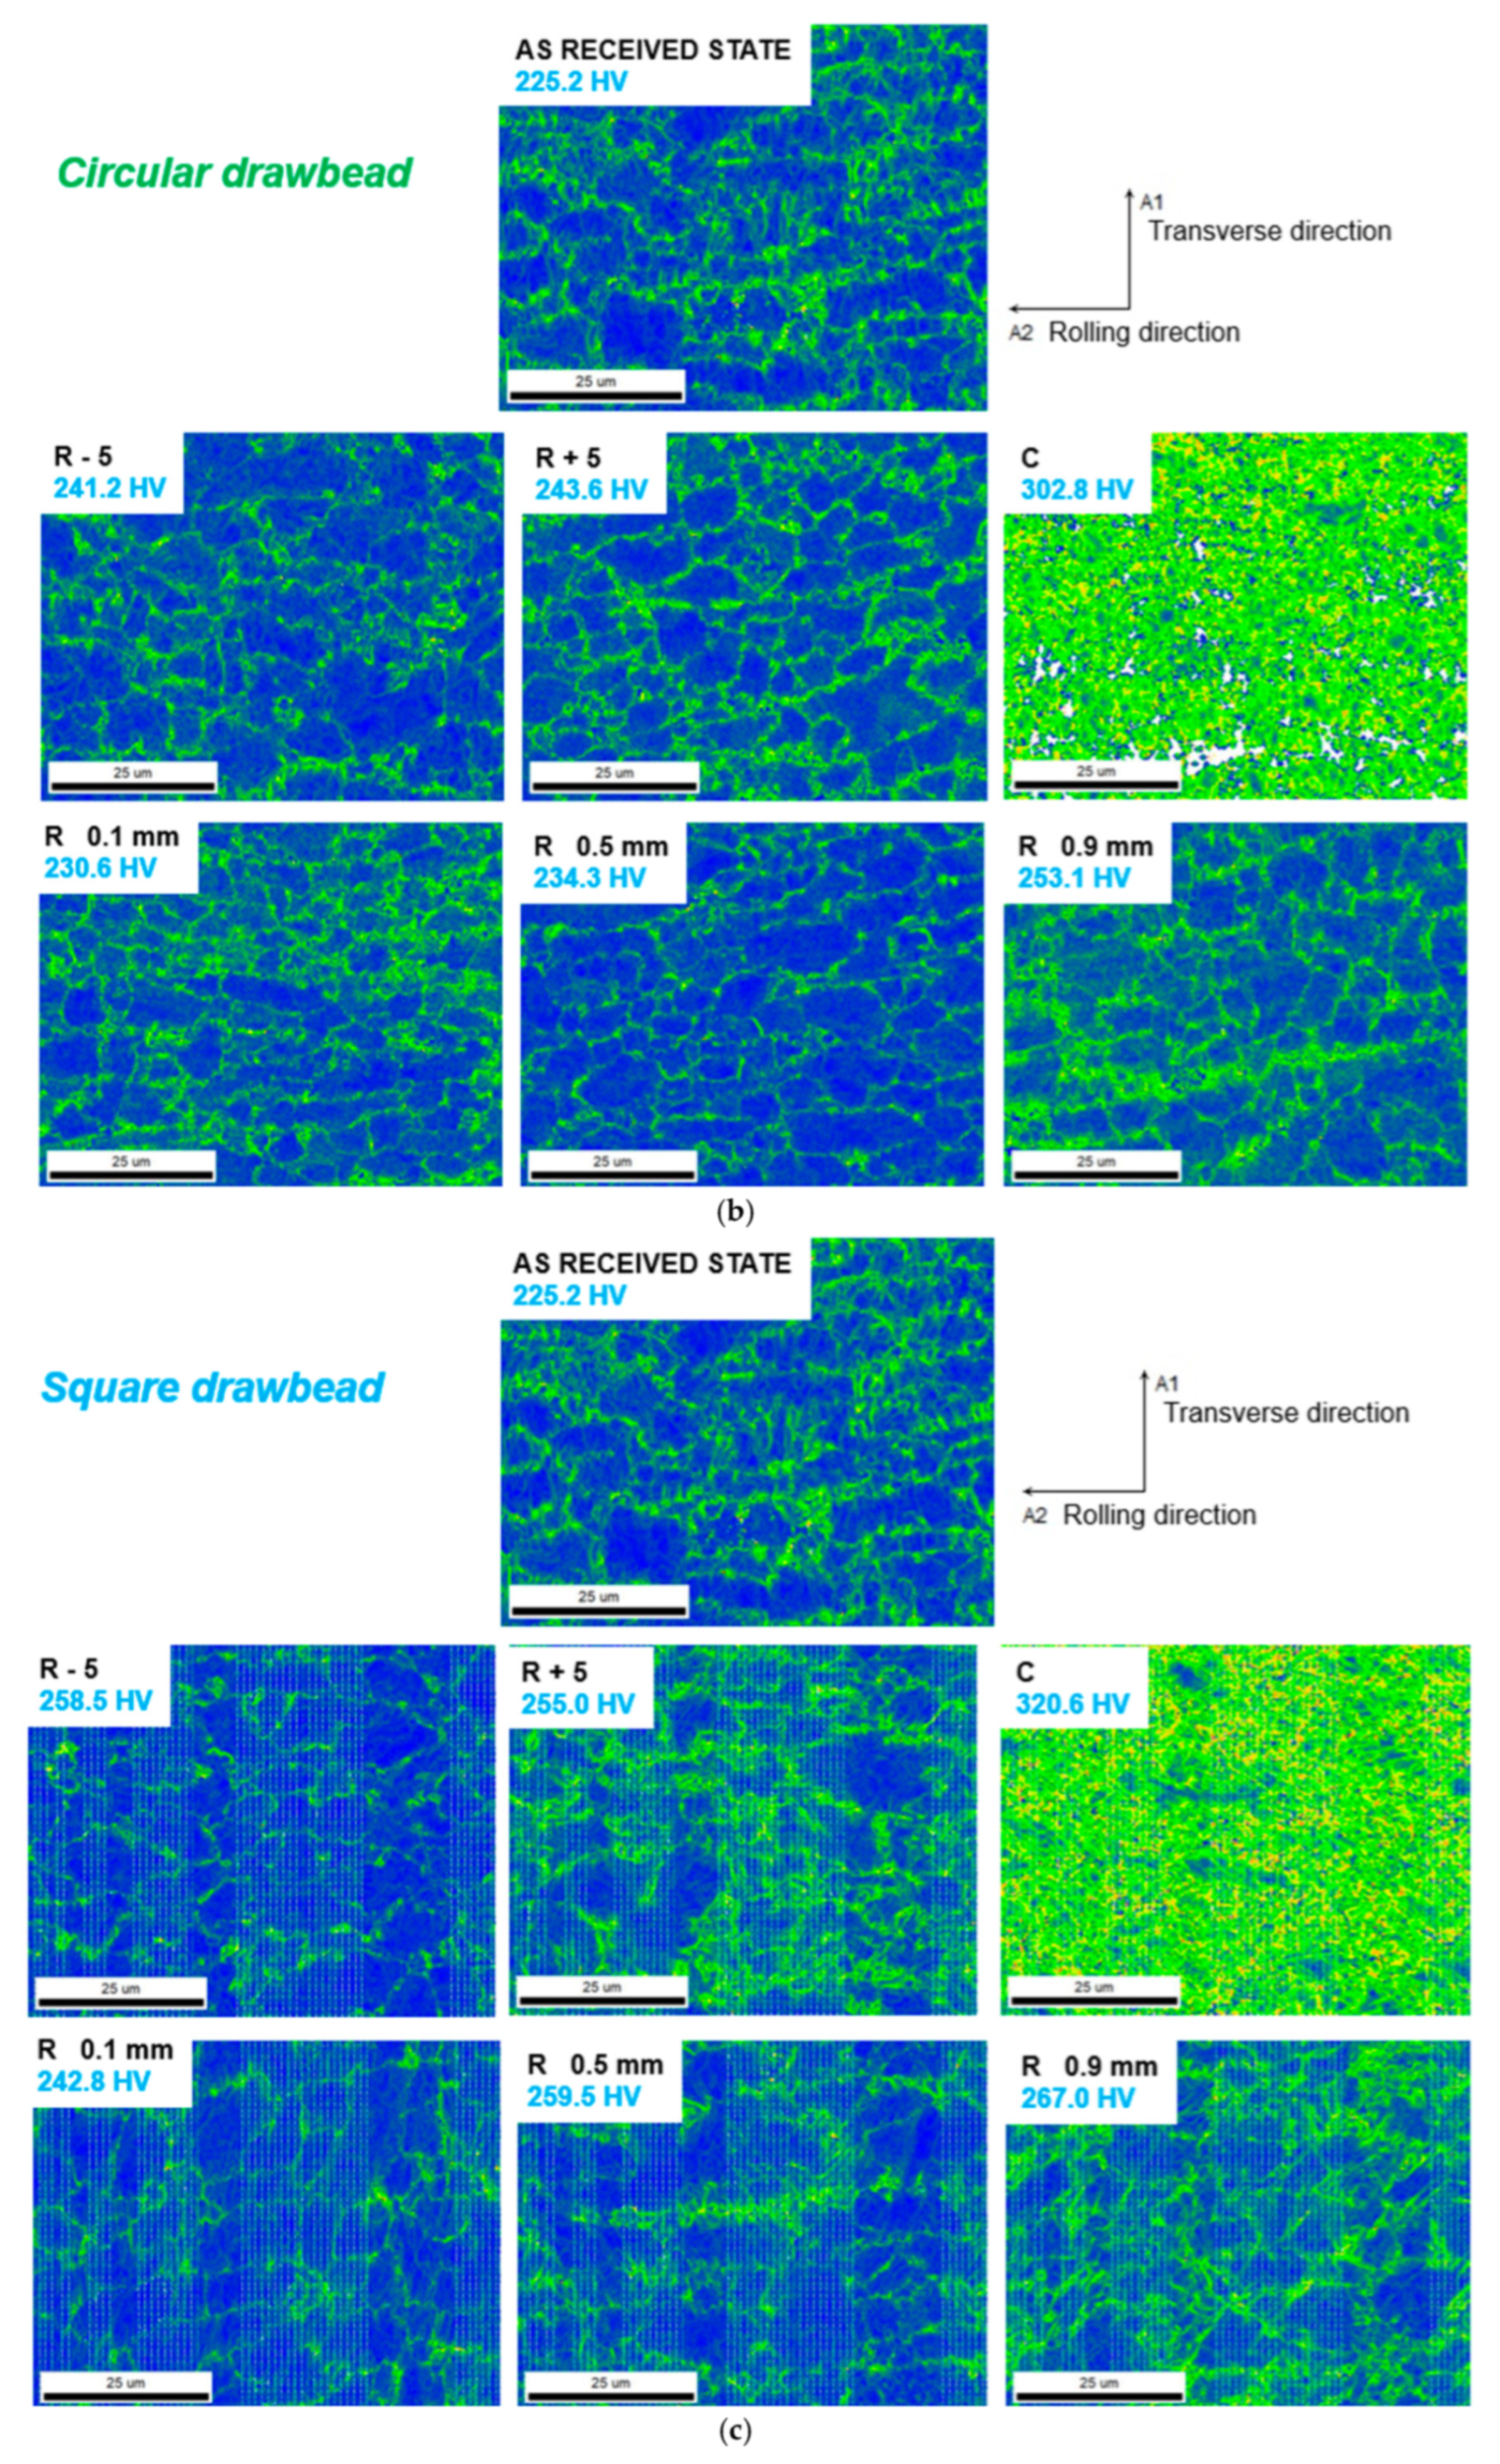
The maps and images obtained using EBSD carried out on each sample are presented, depending on the DB type, as presented in
Table 1. The figures are presented in “blocks”, which contain seven images each. One image refers to the as-received state for a comparative basis. The other six images refer to each of the points analyzed. Above each image, there is a table that describes the analyzed point and the average hardness value found. In
Figure 10 is presented the inverse pole figures for each of the three DB types: (a) flat, (b) circular, and (c) square.
In relation to the as-received state, there were no significant changes in the pattern presented for each point evaluated in the samples. For the three DB geometries, point C (crack region), in relation to the other points, had a greater deformation of the grains. The hardness values at this point were the highest in relation to the other points, corroborating with the images presented.
The deformation maps or KAM are shown in
Figure 11 (a) for the flat, (b) circular, and (c) square geometries. It is possible to notice a change in the microstructure where the quality worsens with the increase in deformation, which is expected due to the increase in disorientation due to the intense movement of the dislocations. It is possible to observe that, at point R (die radius), the deformation levels increased due to the increase in the dimension that represents the distance in relation to the neutral axis of the sheet, considering that the point with 10.1 mm is closer to R and the point with 10.9 mm is closer to the punch pole, subject to tensile efforts.
4. Conclusions
By surveying the material FLC depending on DB geometry variation, the better performance of the circular type in relation to the others became evident. It was also observed that the worst performance occurred for the flat type, reinforcing the need to use DB for better steel formability.
The circular DB presented the most uniform hardness variation along the profile of the stamped blank, which includes the flange region, the die radius, and the stamping region. It also presented lower hardness values compared to the square geometry, as evidenced by the FLC. Considering these two geometries, it should be noted that the hardness variation along the stamped blank profile presented very similar results (delta of 1.1 HV), concluding that the DB attenuates such a variation, contributing to better metal sheet formability, which corroborates with FLC results. Comparing the three geometries, taking the die radius (R) as a reference, the hardness variation was consistent, according to FLC, directly evidencing the effect of work hardening on the sheet.
As previously mentioned, the point of greatest incidence of such a phenomenon occurs at the die radius, where the highest hardness value was found with square DB (256.4 HV) and the lowest hardness value with the circular one (239.3 HV). The flat DB presented the lowest hardness in the flange region because it does not have the “tooth” that causes the initial deformation, but it had a considerable increase in hardness along the die radius (249.6 HV), with the subsequent formation of a “dead zone” at the beginning of the stamped region, as it allows for a more accentuated sheet flow. The increase in hardness at the die radius, followed by the formation of a “dead zone”, caused a greater variation in hardness, precisely at the entrance of the stamped region, negatively affecting the sheet stampability, which was evidenced once again by the FLC.
The lowest level of hardness occurred for circular geometry, i.e., it is the DB that generated the least damage to the sheet due to being more influenced by the Bauschinger effect, relieving the flow stress and reducing the hardness through work hardening. The square profile, on the other hand, was the one that presented the highest level of hardening over the die radius, i.e., it is more influenced by work hardening, as it restricts sheet’s sliding due to its geometry. The formation of the “dead zone” in the flat DB is due to a transition from a convex to a concave deformation in the region of the wall of the stamped cup. This geometry does not impose a barrier to the sheet flow, producing less stretching of the sheet in this transition region between convex and concave deformation, forming the “dead zone”, which produces a greater variation in hardness in the region from the wall to the crack, compromising the formability of the sheet.
Among the DB geometries analyzed, the circular geometry presented the most uniform hardness variation along the profile of the stamped blank and presented lower hardness values in relation to the other geometries, concluding that the DB attenuates this variation, contributing to the better formability of the sheet, which corroborates the FLC results. Considered to be the most critical region of the sample according to the tests, in the die radius, circular geometry presented a lower level of hardness in relation to the others, which characterizes less influence from hardening and, consequently, a lesser effect from this variation on steel stampability.
Through the qualitative analysis of the deformation maps, it was possible to show that, in the die radius, the deformation levels increased as a function of the increase in the distance in relation to neutral axis of the sheet to the external surface of the curvature, whose predominant effort is traction. Mostly, there is a subtle difference in the deformation maps when comparing the flat DB with the two other geometries, which showed significant similarity in relation to deformations, especially in the die radius.
The parameters used in EBSD were satisfactory in terms of generating images to reveal the material grains’ morphology. However, such images did not clearly demonstrate the levels of hardening resulting from the plastic deformation suffered by the sheet after the stamping tests.
