1. Introduction
Machining procedures hold significant value in contemporary manufacturing due to their versatility, precision, and ability to produce complex geometries with high dimensional accuracy [
1]. As a core subtractive process, milling is widely utilized across industries ranging from aerospace and automotive to biomedical and electronics, where the demand for high-quality components continues to rise. In the context of modern manufacturing applications, the efficiency of milling operations must be evaluated not only in terms of productivity and material removal rates but also through critical performance indicators such as the surface finish quality of the fabricated products [
2]. Surface roughness constitutes a critical factor in evaluating process effectiveness, as it is inherently connected to the functional performance, durability, and assembly compatibility of machined components [
3]. Therefore, monitoring and optimizing the machining process in order to achieve superior surface finish is essential for ensuring both the technical reliability and economic competitiveness of leading manufacturing companies [
4]. This necessitates a systematic approach to process evaluation and control, especially as industries increasingly adopt intelligent manufacturing systems and data-driven optimization strategies.
In general, surface finish quality comprises a fundamental determinant of both the functional and esthetic performance of a product, particularly within the domains of precision engineering and advanced manufacturing. Notably, a high-quality surface finish contributes significantly to the enhancement of mechanical properties such as fatigue strength, wear resistance, and corrosion resistance, primarily by reducing surface irregularities that often serve as initiation sites for mechanical failure [
5]. Furthermore, the surface condition critically affects the fit and tribological behavior of interfacing components, thereby ensuring accurate assembly, dimensional stability, and consistent operational performance [
6]. In applications where visual and tactile attributes are pivotal, such as in consumer electronics or biomedical devices, the surface finish also plays a key role in shaping user perception and product acceptance. It is worth mentioning that surface finish quality should not be regarded as a superficial attribute but rather as an intrinsic factor that governs the functional integrity and the overall lifecycle performance of machined components. Specifically, it represents a crucial interface between material characteristics and system-level outcomes, impacting interactions at both micro and macro scales. As such, the ability to monitor and control surface finish in real time establishes a vital capability in the context of smart manufacturing systems, where precision, adaptability and predictive quality assurance are paramount [
7].
Hereupon, real-time evaluation of surface finish quality has become critically important in the modern manufacturing industry, particularly within the context of smart manufacturing and Industry 4.0. This importance stems from the increasing demand for higher productivity, tighter tolerances, zero-defect manufacturing, and adaptive process control [
8]. In traditional manufacturing environments, surface quality control is predominantly performed offline using tactile or optical profilometers. While these post-process techniques provide high accuracy, they inherently delay the detection of surface anomalies until after the component has been fully machined. Such delays not only result in material waste but also increase the likelihood of propagating defects through downstream operations [
9]. Therefore, real-time surface finish evaluation circumvents these limitations by providing instantaneous feedback on surface quality during the machining process itself. This approach could enable timely corrective actions such as tool path modification, feed rate adjustments, or spindle speed regulation.
In addition, the real-time evaluation of surface quality is crucial for advancing modern manufacturing systems toward greater efficiency, consistency, and autonomy, enabling a proactive conceptual framework for quality control [
10]. By monitoring signals from several sensors during machining and predicting the surface outcome on the fly, manufacturers can immediately detect deviations from optimal cutting conditions. This capability supports early intervention to adjust process parameters before defects occur [
11]. Moreover, it allows for dynamic process optimization, where the system continuously adapts in response to material variability, tool degradation, or thermal effects. From a broader perspective, in situ surface finish prediction aligns with the principles of intelligent manufacturing, where digital integration, data-driven decision-making, and cyber–physical systems play central roles. Through the integration of real-time analytics into the milling workflow, manufacturers could gain enhanced process visibility, reduced inspection time, and the ability to implement predictive maintenance strategies. This not only improves product quality and consistency but also reduces costs associated with rework, scrap, and machine downtime. Hence, ensuring optimal surface finish is essential for both product performance and compliance with applicable industry standards.
The prediction of surface finish in machining operations has garnered significant attention in precision manufacturing, driven by demands for zero-defect production and Industry 4.0 adoption. Traditional methods relying on post-process metrology are limited by their offline nature, prompting research into in-process monitoring techniques and quality prediction based on certain manufacturing parameters. Among these, AI techniques, such as machine learning (ML) and deep learning (DL), are employed alongside mathematical modeling and statistical analysis, including regression methods and analysis of variance (ANOVA), in order to accurately capture the complex, nonlinear relationships between cutting parameters and surface roughness [
12]. These approaches are supported by systematically designed experiments that generate high-quality data for model training and optimization.
In particular, study [
13] aimed to develop a mathematical model for predicting surface roughness in face milling operations, based on the geometric characteristics of the cutting tool’s surface profile. Unlike previous approaches, which often relied on the simplifying assumption of a perfectly circular tool nose or employed purely statistical analyses derived from extensive experimental datasets, this research introduced a geometry-based modeling framework. Additionally, the research presented in [
14] employed both Artificial Neural Networks (ANN) and Response Surface Methodology (RSM) to develop accurate surface roughness prediction models. Network construction involved evaluating five learning algorithms: conjugate gradient backpropagation, Levenberg–Marquardt, scaled conjugate gradient, quasi-Newton backpropagation, and resilient backpropagation. In parallel, a second-order polynomial model was developed using RSM, and statistical analysis through ANOVA was conducted to evaluate the influence of machining parameters. The predictions from both models closely matched the experimental results; however, the RSM model exhibited a higher R
2 value, indicating superior stability and robustness compared to the ANN approach. An interesting approach was suggested in [
15], where random forest (RF), decision tree, and support vector machine (SVM) models were trained using a central composite design framework to incorporate both controllable process parameters and noise variables. The models’ performance in predicting surface roughness was assessed through validation experiments taking into account Root Mean Square Error (RMSE), with the RF demonstrating the highest prediction accuracy.
The authors in [
16] explored the application of ML techniques for predicting surface roughness in milling operations, utilizing sensor-acquired data as the principal input source. The proposed sensor suite, comprising current transformers, a microphone, and displacement sensors, highlighted the effectiveness of integrating data-driven methodologies with advanced predictive modeling to improve both the quality and precision of machined surfaces. It must be noted that conventional ML-based approaches could face limitations related to convergence to local minima, potentially resulting in suboptimal generalization and predictions that may conflict with established physical principles. To address these issues, a study [
17] introduced a physics-informed DL framework for surface roughness prediction in milling processes, integrating domain-specific physical knowledge into both the input and training phases of the learning model. Another work that utilized a learning-based optimization approach was suggested in [
18] to predict the surface finish quality based on cutting parameters, vibrations, and sound characteristics in face milling. The developed system obviates the necessity for manual, physical measurement of surface roughness by enabling automated real-time data acquisition.
Findings that could offer valuable insights regarding the turning process in optimizing process parameters in order to achieve superior surface integrity were proposed in [
19,
20]. Specifically, ML models including SVM, Gaussian process regression (GPR), adaptive neuro-fuzzy inference systems (ANFIS), and ANN were utilized to predict surface roughness with high accuracy. The RSM analysis revealed, among others, that the feed rate was the most influential parameter affecting surface roughness. Another ML approach was introduced in [
21], where the AI models were able to leverage data from cutting forces, temperatures, and vibrations by applying robust sensors to predict the workpiece surface roughness in cylindrical turning operations. The work presented in [
22] formulated a dual-method approach to surface roughness prediction in CNC milling operations. Initially, a Design of Experiments (DOE) methodology was employed to identify the most influential process parameters. Subsequently, a fuzzy logic-based predictive model was developed using experimental data obtained from CNC milling tests. Then, the significant parameters identified through DOE were used as inputs to the fuzzy logic system estimating the surface roughness via an empirically derived model.
In order to improve data utilization while minimizing computational overhead, a novel dual-task monitoring approach for simultaneous prediction of surface roughness and tool wear was proposed in [
23]. This method modifies the enhancement layer of each sub-task in the traditional broad learning system by incorporating a reservoir with echo state network characteristics. By enabling information sharing and capturing dynamic features unique to each task, a broad echo state dual-task learning system with incremental learning capabilities was established, outperforming existing dual-task learning approaches in terms of overall monitoring accuracy and computational efficiency. Furthermore, an interesting methodology [
24] employing long short-term memory (LSTM) networks demonstrated its effectiveness in handling time-series data of varying lengths and capturing long-range dependencies. In this context, the LSTM approach was applied to predict surface roughness during milling, where the results highlighted the potential of LSTM models in data-driven smart manufacturing environments, particularly for surface roughness prediction and real-time decision-making in machining processes.
This study presents a comprehensive methodology for predicting surface roughness in milling operations by classifying data signals using multiple AI-based algorithms. It should be noted that each audio signal is associated with a corresponding surface roughness value, enabling supervised learning that way. The proposed pipeline includes audio preprocessing, feature extraction via Mel-Frequency Cepstral Coefficients (MFCCs) and classification using ML-based models tailored for time–frequency representations. Essential preprocessing steps, including channel normalization, resampling, and image-like representation methods, were employed to ensure data consistency and enhance model efficiency. Finally, the experimental results demonstrated robust classification accuracy and strong resilience to noise, establishing the proposed framework as an effective, lightweight solution for real-time and non-contact surface roughness estimation in intelligent manufacturing systems.
2. Materials and Methods
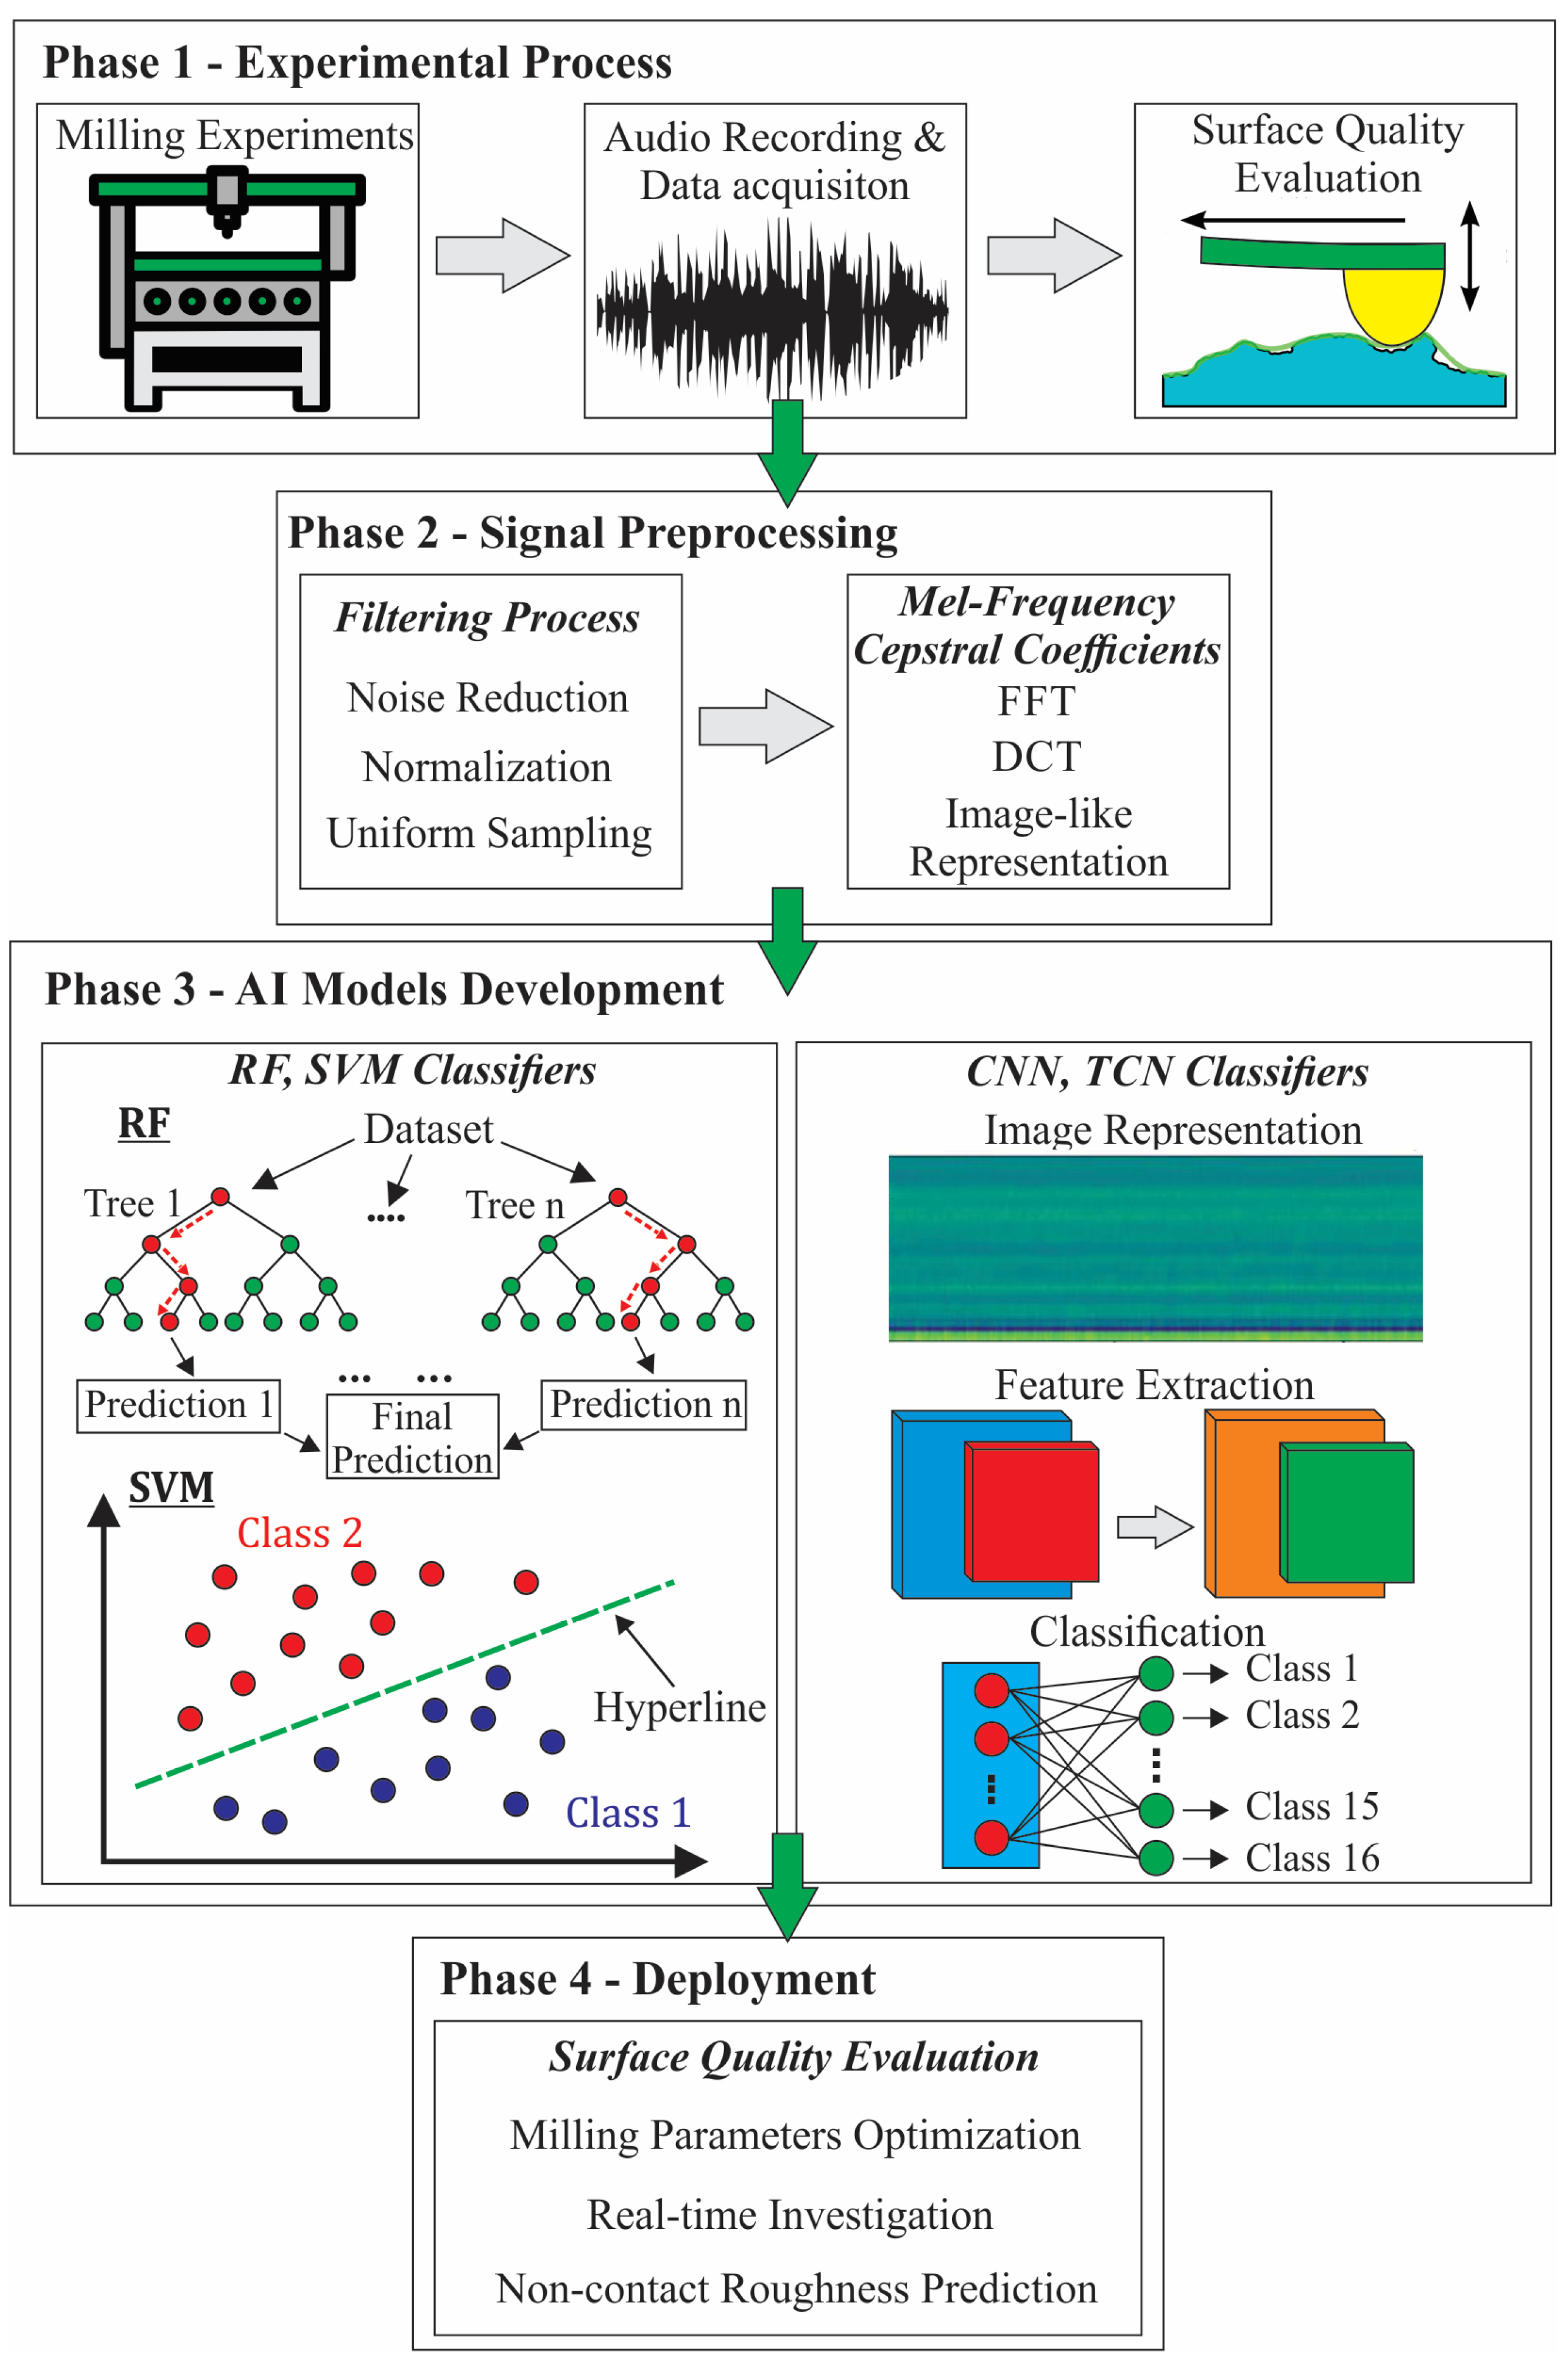
The introduced methodology follows a structured pipeline designed to evaluate and classify surface roughness based on sound data captured during milling operations, as exhibited in
Figure 1. An open experimental dataset was considered containing a series of controlled milling experiments that were conducted under predefined machining conditions, as it is analytically described in [
25,
26]. Specifically, a BFW YF1 vertical milling machine was employed using tungsten carbide tools, where the workpiece material consisted of a mild steel with dimensions of 8 × 20 × 8 [mm]. During these experiments, sound signals were collected using the appropriate sensors and the surface roughness of the machined components was measured post-process using standardized evaluation techniques to establish a corresponding label for each recorded signal, thereby constructing a labeled dataset. The proposed workflow demands that each audio signal undergoes a preprocessing phase aimed at standardizing and enhancing the quality of the input. Hereupon, certain actions were conducted like noise reduction in order to remove ambient or irrelevant signal components, channel normalization to convert stereo recordings into mono by averaging and finally resampling all audio waveforms to a uniform sampling rate. These preprocessing steps ensure consistency across the dataset, as well as eliminate potential variability imported by differences in recording conditions.
Once preprocessed, the audio waveforms were transformed into two-dimensional (2D) time–frequency representations using MFCCs. This transformation emulates the human auditory system’s perceptual scale; providing a compact, image-like representation of the audio data that captures relevant spectral features. The resulting MFCC matrices serve as the input to the applied ML models designed for classification. In order to explore the effectiveness of different learning paradigms, a convolutional neural network (CNN), a temporal convolutional network (TCN), an RF classifier and an SVM classifier were trained to classify the MFCC representations according to the defined surface roughness categories. CNN/TCN consider the full MFCC time series, like an image or a 2D matrix, so they can model temporal and frequency patterns directly; whereas RF and SVM rely on their aggregated values like the mean and standard deviation.
To further investigate the temporal efficiency and real-time applicability of the trained models, the original audio signals were segmented into fixed-duration clips of five seconds. These cropped sample audio files are then processed through the developed pipeline employing the trained ML models in order to assess whether the models can maintain accurate classification performance with limited temporal information. This step serves to evaluate the feasibility of implementing the proposed system in practical, real-time industrial scenarios, where rapid surface condition assessment is essential. Overall, the proposed pipeline integrates experimental machining, signal processing, and ML approaches into a unified framework to enable automated and data-driven prediction of surface finish quality, supporting advancements in intelligent manufacturing systems aligned with Industry 4.0 objectives.
2.1. Data Acquisition Process and Experimental Evaluation
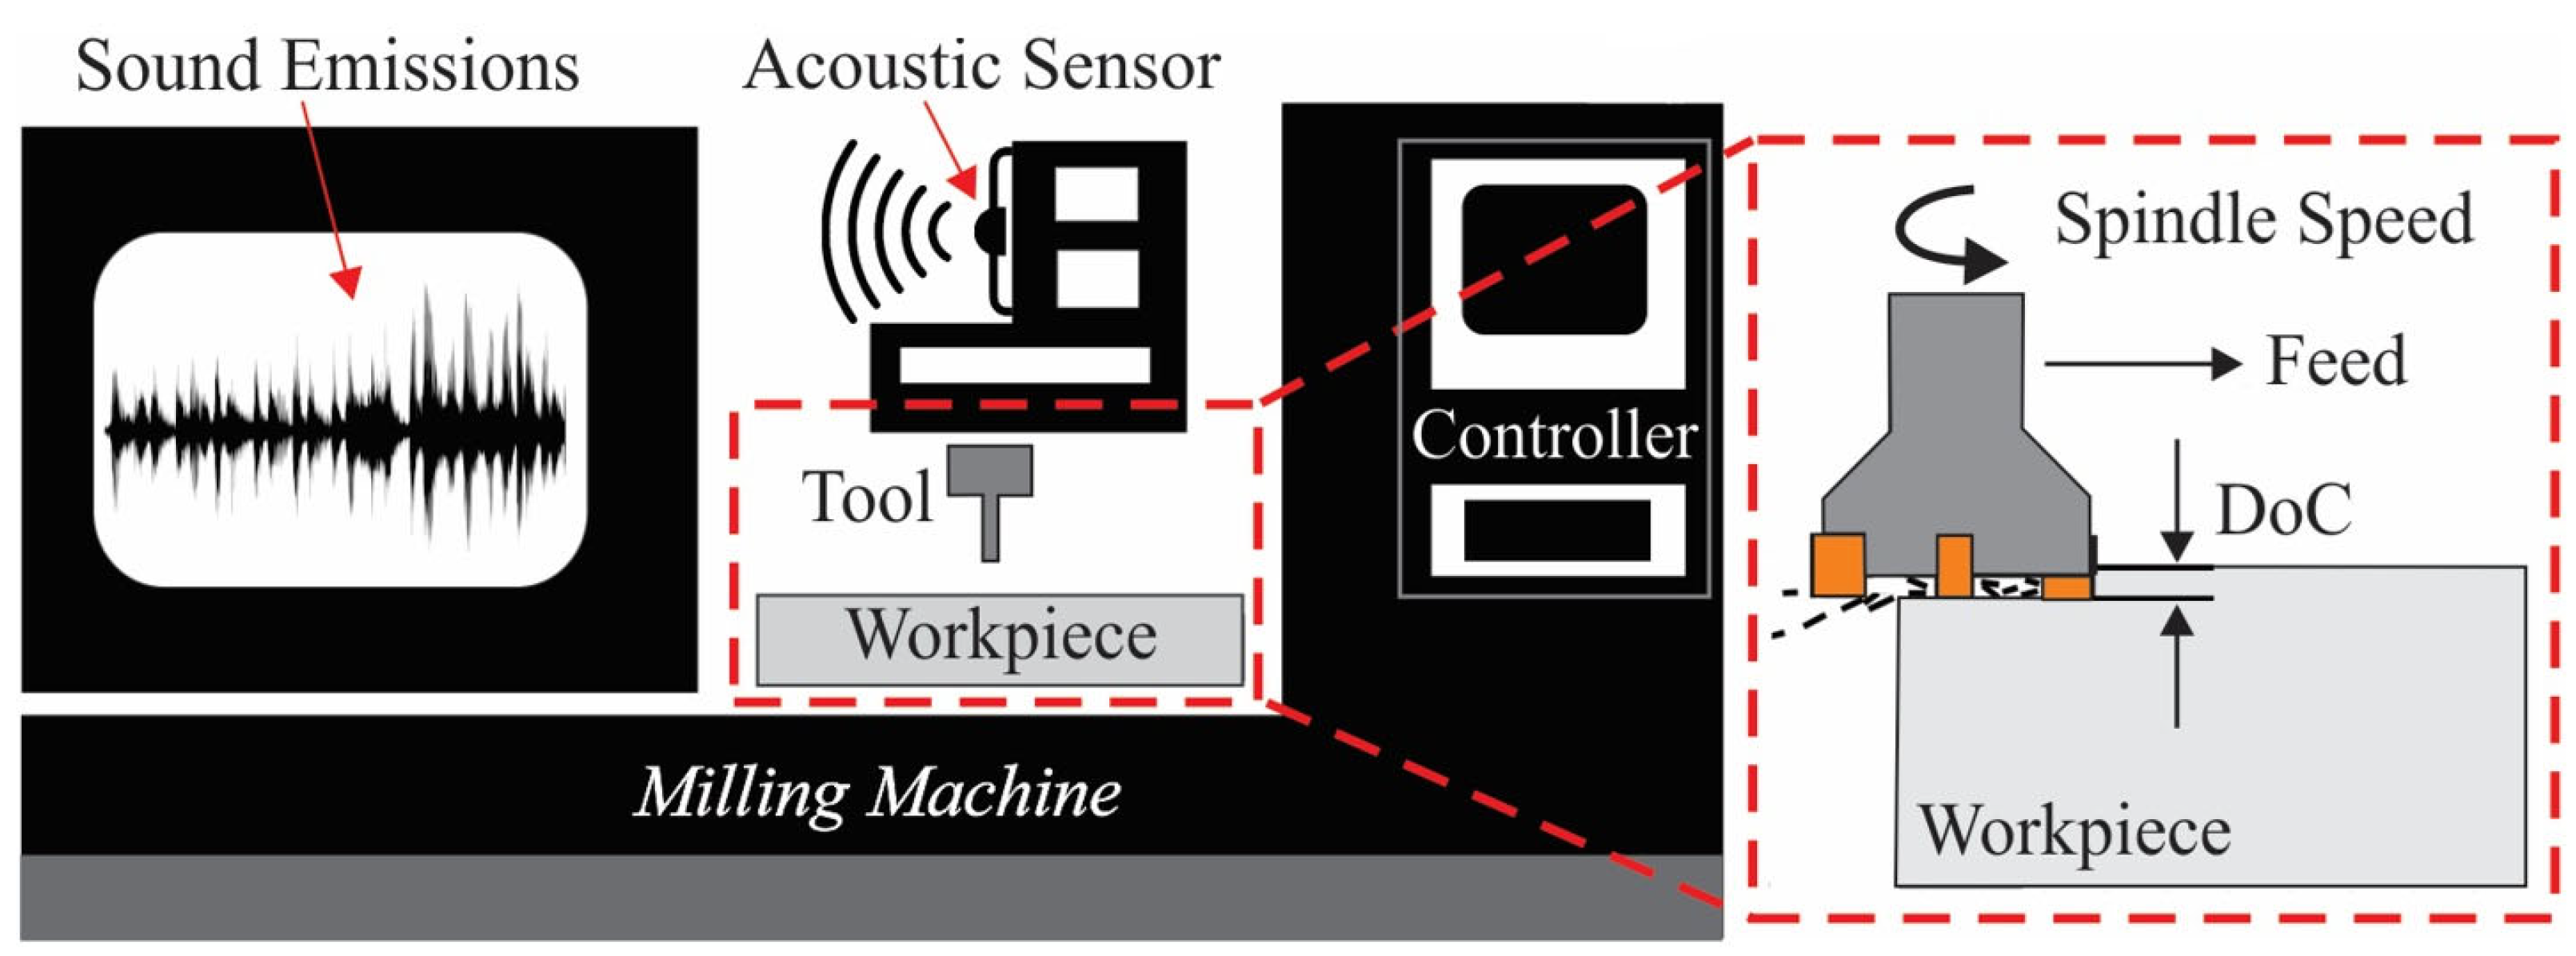
Regarding the data acquisition procedure and the evaluation of the surface quality, an experimental dataset was utilized that consists of 7.444 audio recordings of sound signals during the milling procedure [
25,
26], as schematically illustrated in
Figure 2. The purpose of this dataset was to explore how variations in the values of certain milling conditions affect the surface roughness, ultimately determining the quality of the machined products. These audio data were collected for different combinations of spindle speed, feed rate, and depth of cut. Moreover, the experiments were carried out in a controlled environment to minimize external noise that could compromise the accuracy of the recorded audio data. It is noteworthy that mechanical vibrations and equipment interference can significantly impact the quality and interpretation of sound emission signals during milling operations [
27]. Structural vibrations from the spindle, guideways, or drive systems may introduce low-frequency noise that modulates the high-frequency sound emissions generated by tool-workpiece interactions. Additionally, electromagnetic interference from motors and controllers may introduce broadband electrical noise that contaminates the raw audio signal [
28]. These interference effects can lead to misinterpretation of signal features, particularly when using time–frequency analysis methods where overlapping spectral components may obscure the characteristic signatures of surface formation mechanisms. Hereupon, the employed controlled setup was essential to ensure the integrity of the experimental data, enabling a more reliable analysis and interpretation of the sound characteristics associated with milling operations.
The experiments were conducted in various combinations of feed rate (5 and 10 mm), depth of cut (0.25, 0.50, 0.75, and 1 mm), and spindle speed (500 and 1000 rpm), creating 16 different classes. Hereupon, the 7.444 audio recordings were divided and merged into a single file in each of the 20 sets per class, resulting in a total number of 320 (20 × 16) sets of data. In addition, roughness was measured for each combination using a Carl Zeiss E-35B profilometer after the termination of each test. The evaluation of these measurements was also included in the dataset, providing key insights regarding the correlation between the surface quality of the machine part and the corresponding audio files. The results of the surface finish quality investigations in each class are documented in
Table 1. It is noteworthy that while measurement uncertainty may affect tabulated roughness values, the developed model’s input features (audio waveforms) remain invariant to such post hoc uncertainties, as they directly reflect the physical process dynamics of the milling process.
2.2. Transformation of Audio Data into Image-like Representations
In order to enable the application of sophisticated networks and image-based DL architectures for classification tasks, the sound signals were transformed into 2D image-like representations using MFCC [
29]. Although the MFCC representation can be visualized as an image, owing to its 2D structure, it fundamentally constitutes a multivariate time series, where each MFCC corresponds to a frequency-related feature that evolves over time. This process leverages the time–frequency characteristics of audio signals, encoding relevant temporal and spectral information into a compact, structured format suitable for image-based analysis. Specifically, this audio-to-image conversion bridges the gap between signal processing and DL, leveraging the superior pattern recognition capabilities of DL originally developed for computer vision tasks. It should be noted that spectral representations highlight transient frequency content and energy distribution over time, offering that way a compressed yet information-rich depiction of the audio environment during milling. In this form, sound signatures corresponding to different surface finish qualities manifest as distinct visual textures or patterns, which can be learned and discriminated by a suitably trained ML model. Moreover, it is worth mentioning that the proposed approach is particularly advantageous for real-time monitoring applications. Once trained, the models could classify incoming sound signals with minimal latency, providing immediate estimations of surface quality without interrupting the machining process. As such, the use of audio image-like representations constitutes a powerful, non-invasive, and scalable methodology for in-process surface finish evaluation.
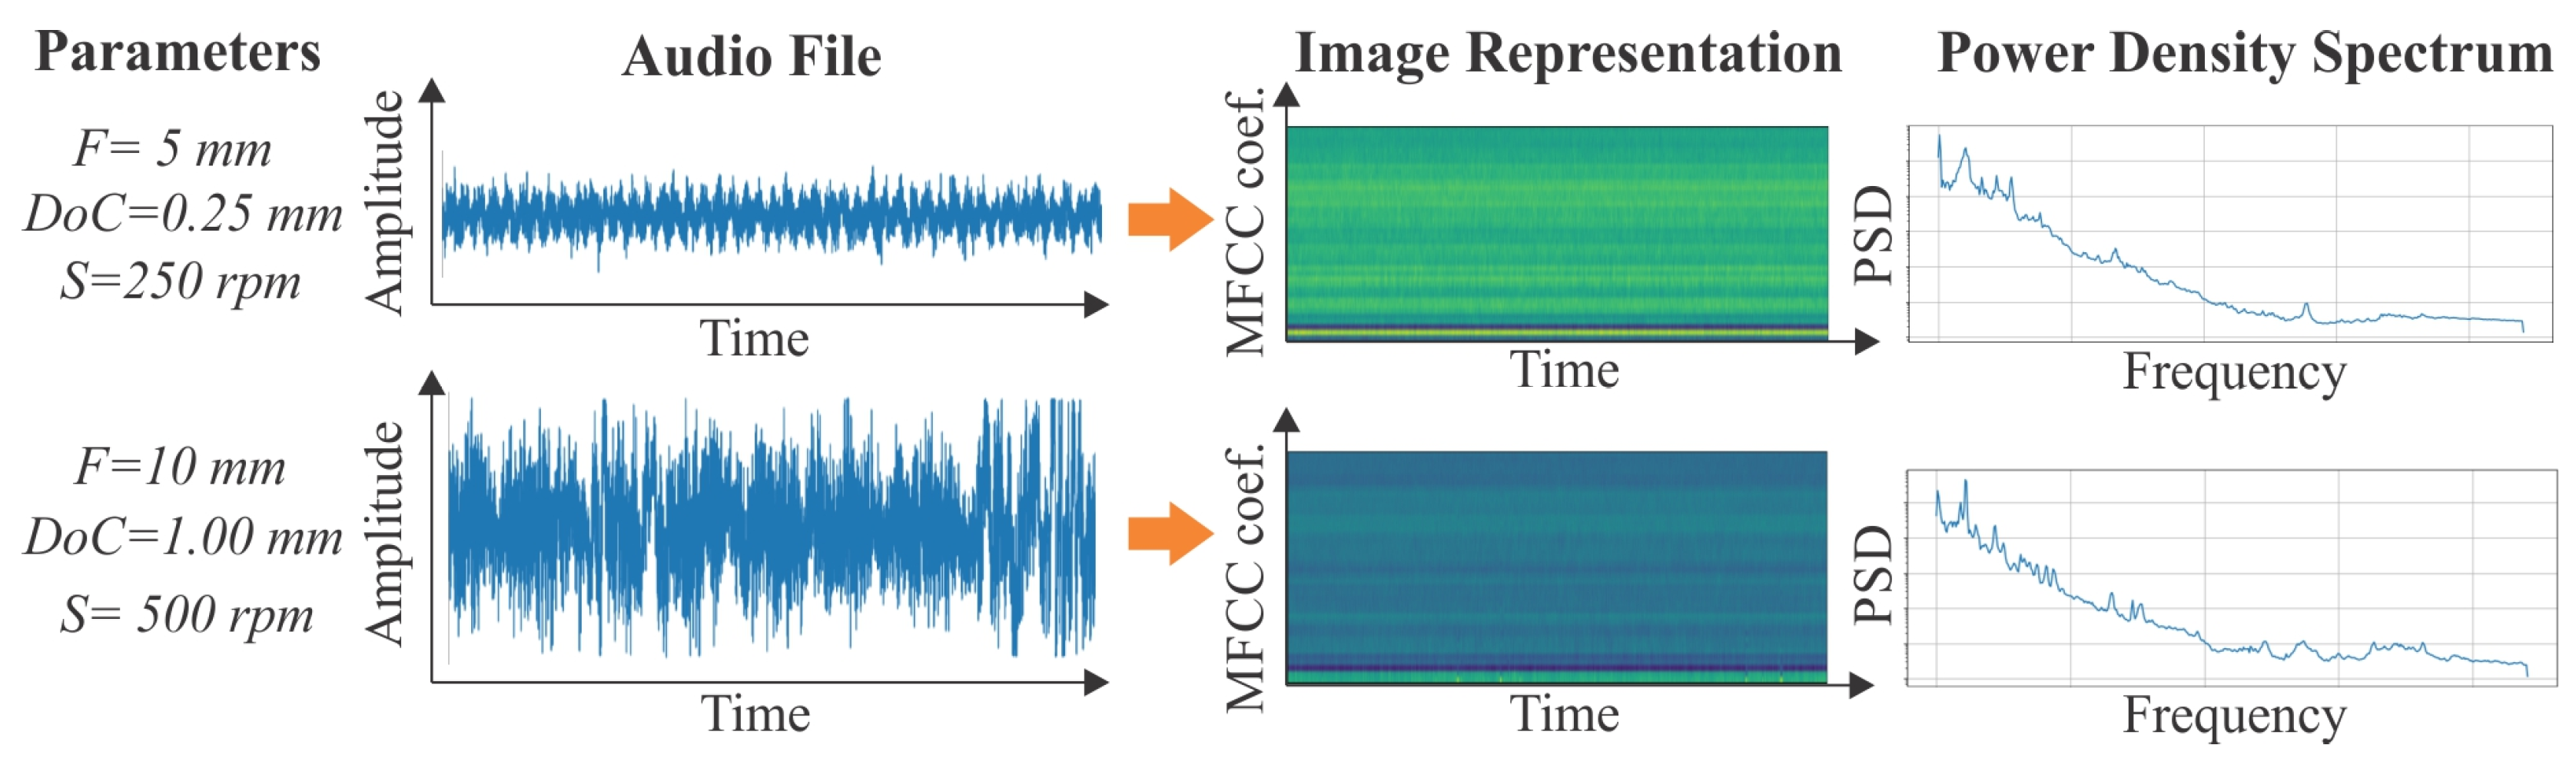
The transformation of raw sound signals begins with segmenting the continuous waveform into short, overlapping frames using a sliding window with predefined frame length and hop size. For each frame, the power spectrum is calculated via the Fast Fourier Transform (FFT), providing a spectral representation of the signal. This spectrum is subsequently processed through a bank of triangular filters distributed according to the Mel scale, which models the nonlinear frequency sensitivity of human auditory perception. This filtering emphasizes perceptually significant frequency components while attenuating less informative regions. Following this, the Discrete Cosine Transform (DCT) is applied to decorrelate the resulting features and reduce dimensionality, resulting in a fixed number of MFCCs per frame. The temporal sequence of these MFCC vectors forms a two-dimensional representation, with rows corresponding to individual cepstral coefficients and columns representing time frames. These MFCC-based spectrograms are then standardized and optionally resized to conform with the input dimensions of AI models, thus enabling efficient learning of discriminative patterns from audio data in a visual domain. Characteristic results of the applied transformation method are displayed in
Figure 3. Finally, it is worth noting that even though the Mel scale is conventionally employed in audio feature extraction in several studies, its direct mapping from human auditory perception could potentially not be fully aligned with machine-generated sound data. An alternative approach for analyzing such data, particularly with emphasis on spectral characteristics, involves the examination of the Power Spectral Density (PSD) of the signals. This can be effectively visualized through characteristic diagrams depicting the PSD as a function of frequency, as shown on the right of
Figure 3. However, in the present work, the MFCC approach demonstrated robust efficacy in assessing surface quality characteristics of the machined products, proving particularly effective at capturing subtle texture variations and finish irregularities.
2.3. Artificial Intelligence Algorithms for Real-Time Evaluation of the Milling Procedure
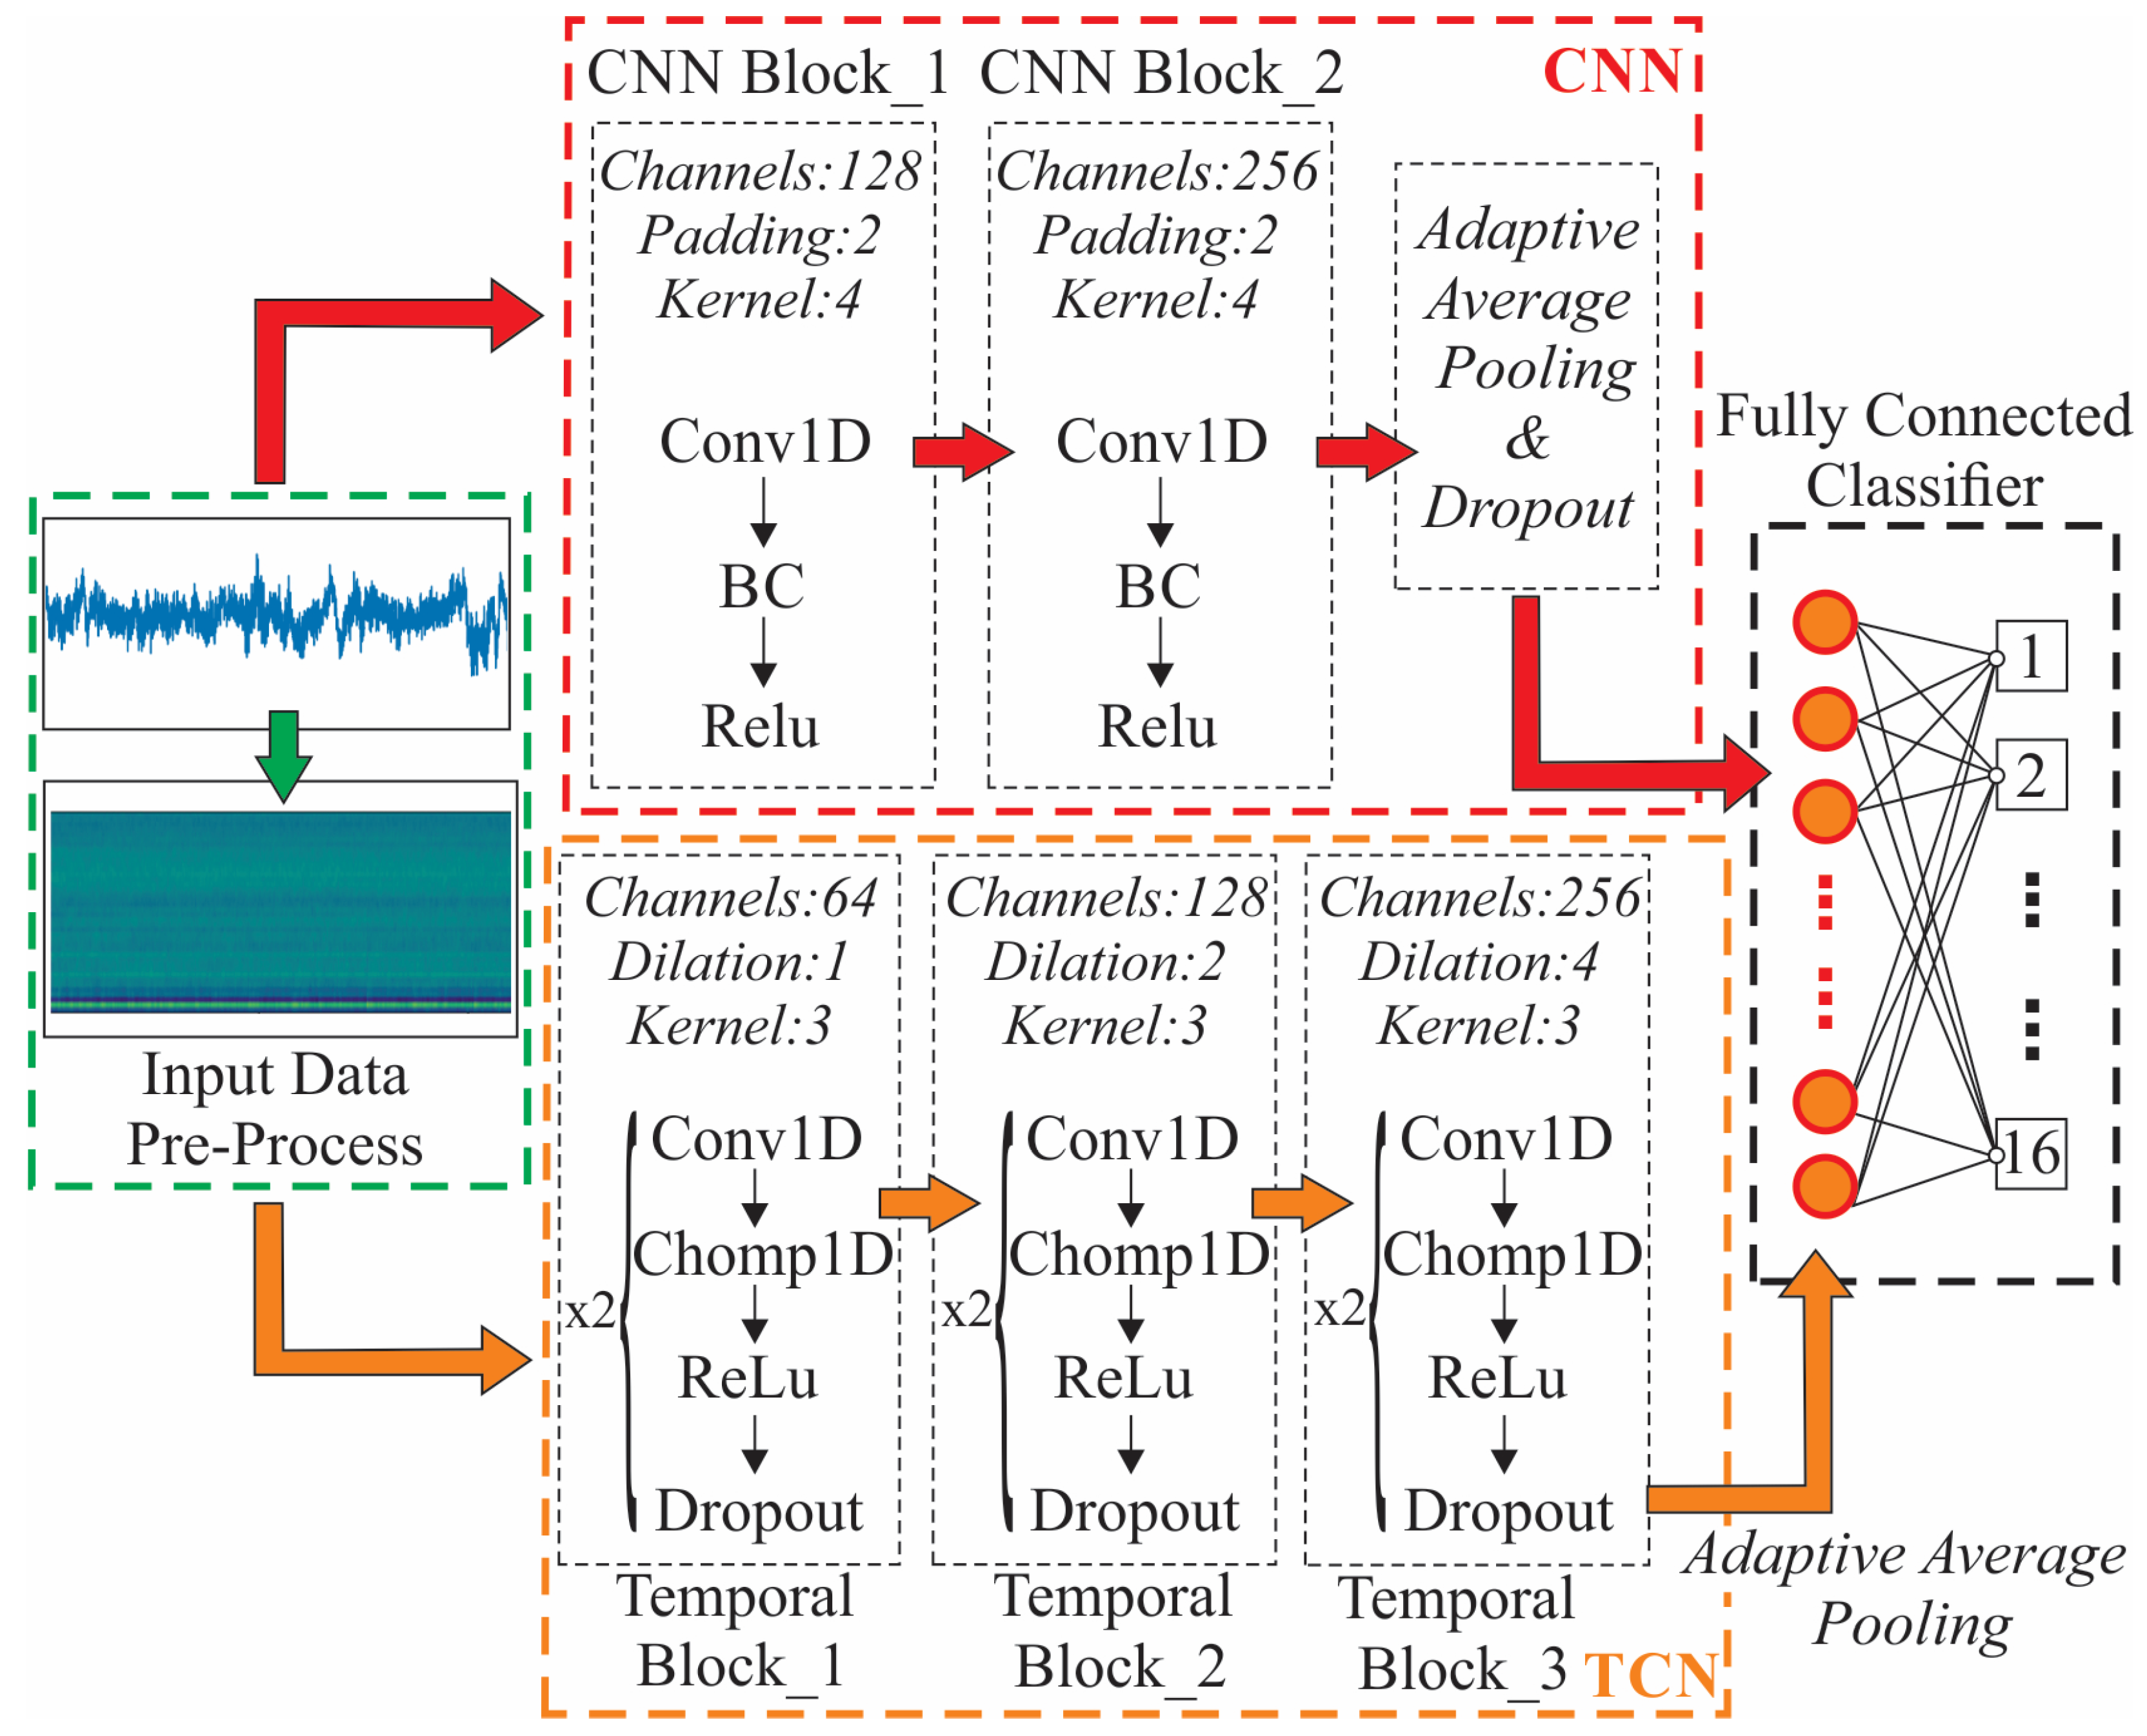
The main objective of the present work is to develop an autonomous system that can receive audio signals from a milling center in real-time and evaluate the surface finish of the manufactured component. In order to approach this behavior, four AI models (CNN, TCN, RF and SVM) were developed to classify audio signals captured during milling operations. The models like CNN and TCN take as input a 2D representation of MFCCs, which encode time–frequency information of the audio signals as described in the previous paragraph. Upon loading, the audio signals are converted to mono and normalized to zero mean and unit variance. Considering the CNN, the upper part of
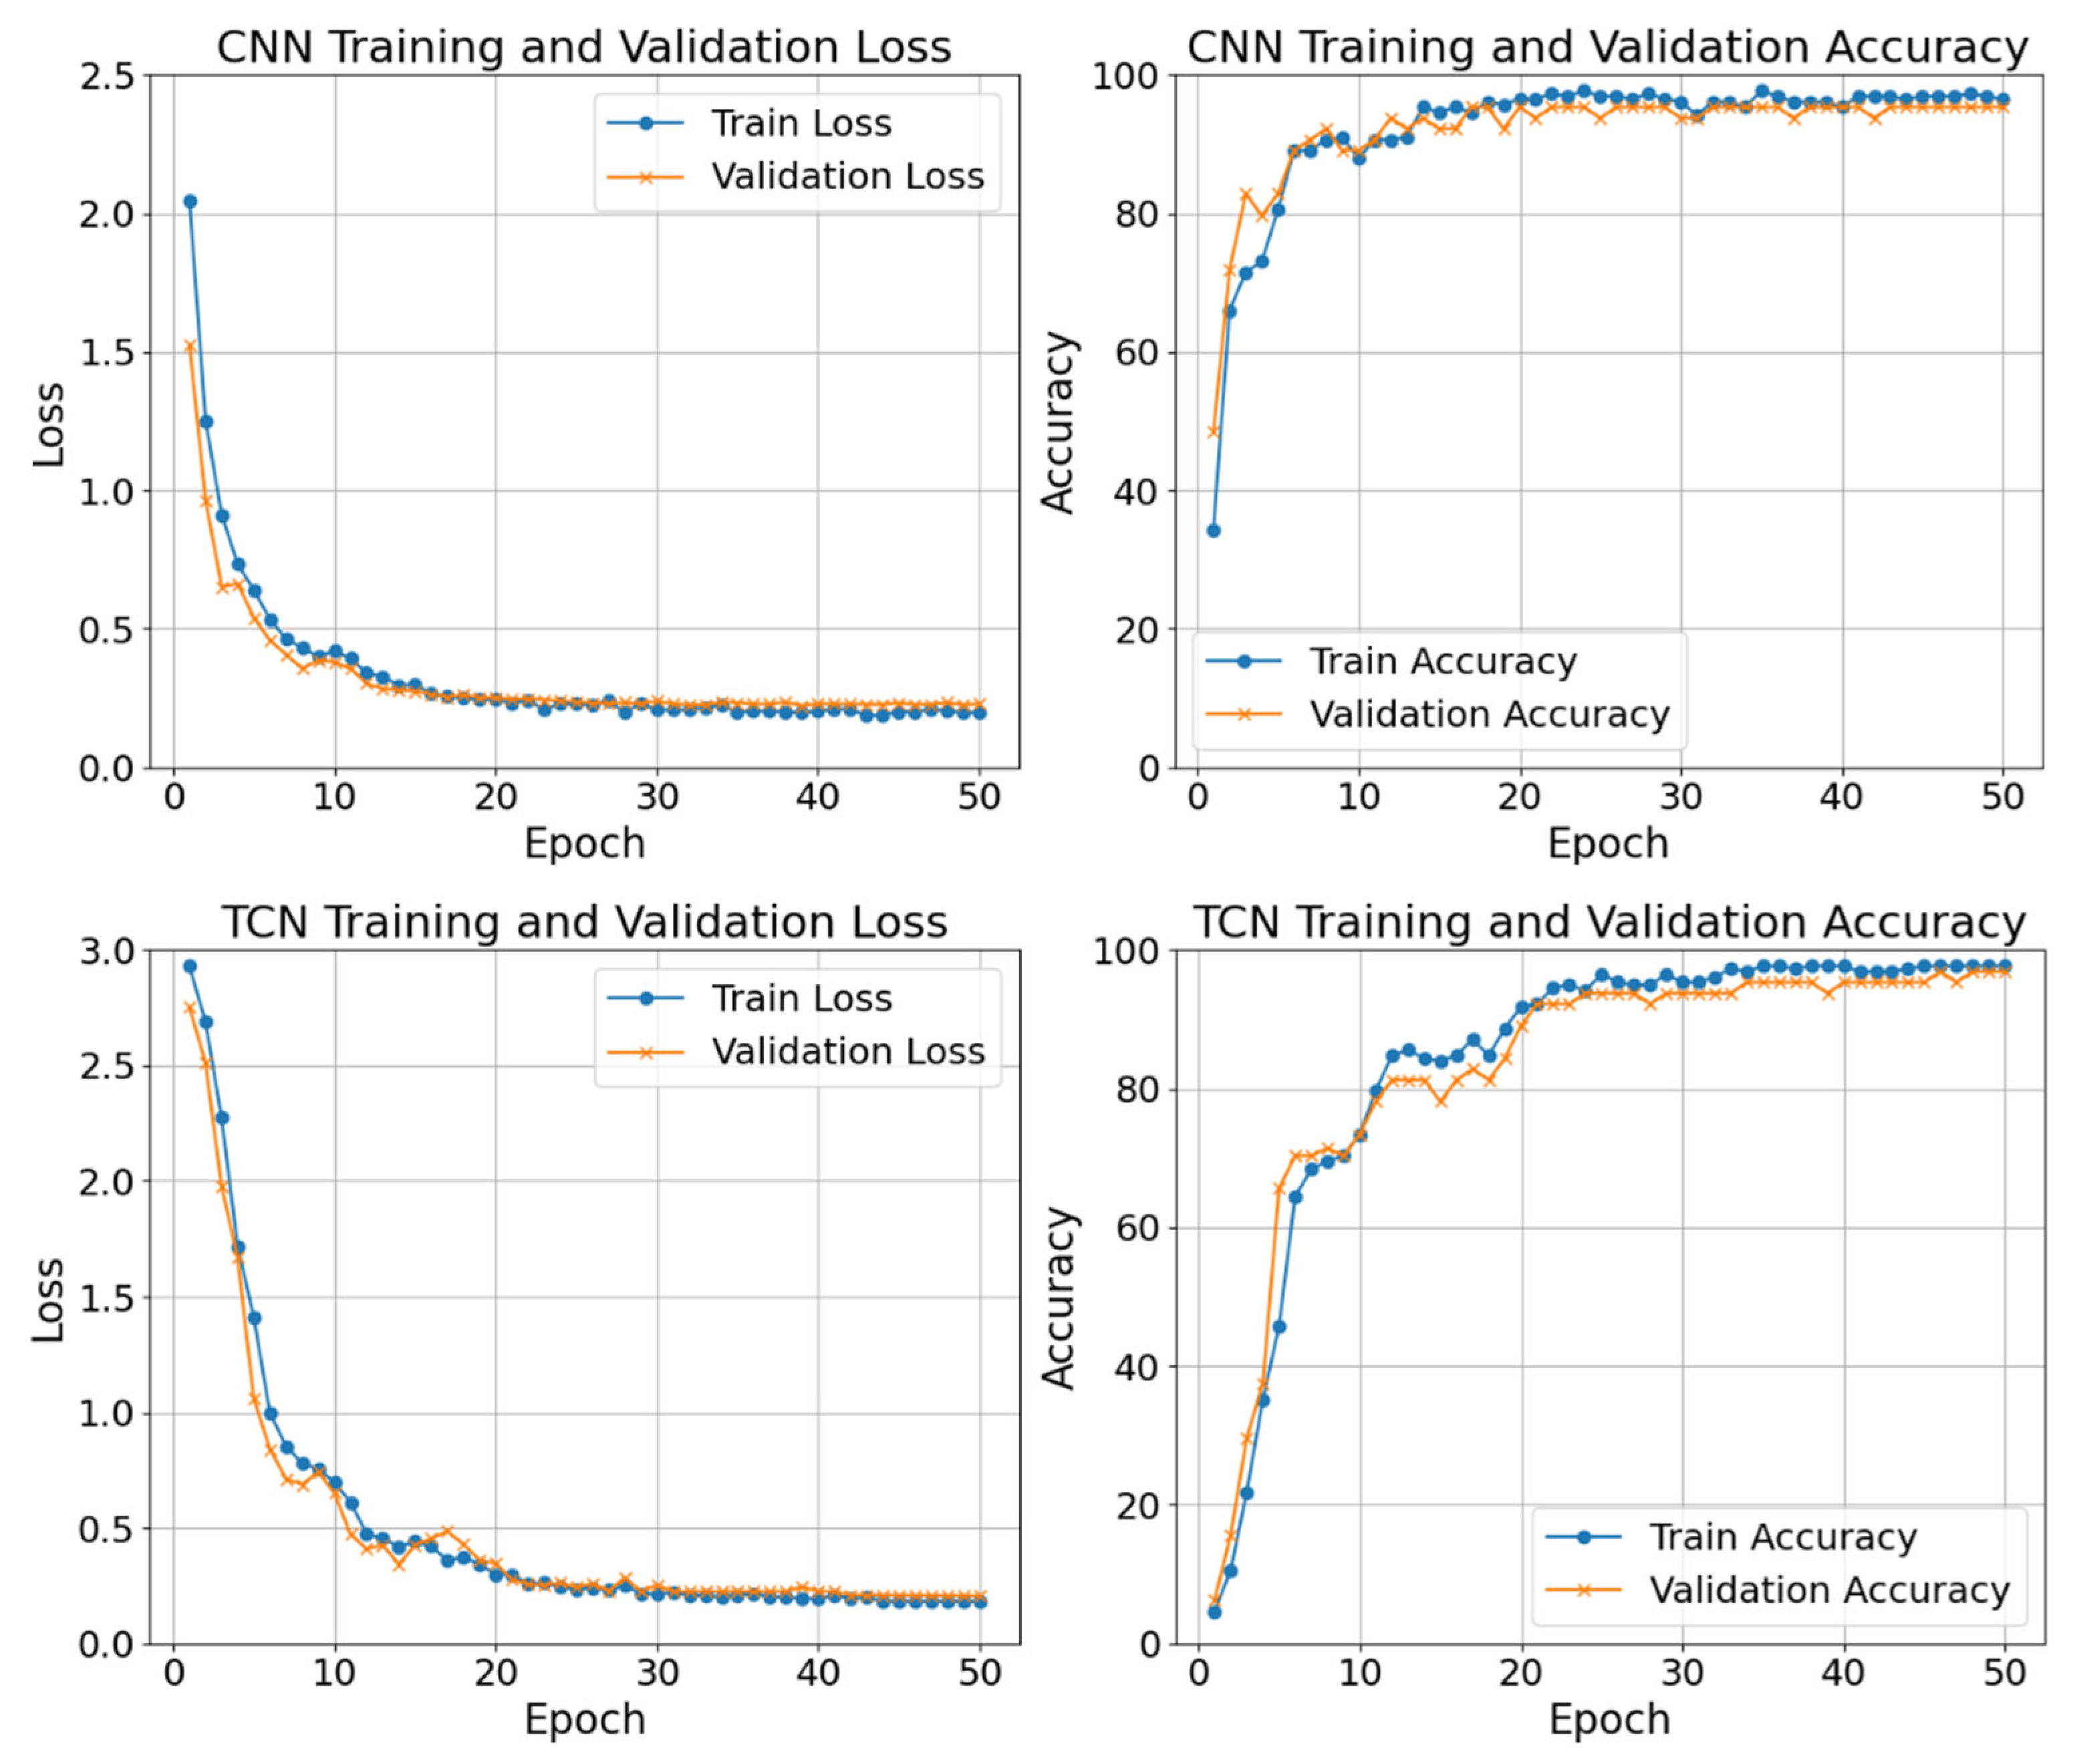
Figure 4 displays the employed network that is comprised of two convolutional layers with ReLU activations and batch normalization to enhance training stability and convergence. The first convolutional layer maps the input MFCC features with 40 coefficients to 128 channels, followed by a second layer that increases this to 256 channels. Both layers use a kernel size of four with padding to preserve temporal dimensions. An adaptive average pooling layer reduces the temporal dimension to a fixed size of one, followed by a dropout layer with rate equal to 0.2 to mitigate overfitting. The final fully connected layer maps the resulting feature representation to 16 output classes corresponding to different experimental configurations. In addition, the training is conducted for 50 epochs using the Adam optimizer with a learning rate of 0.001. Finally, the loss function used is categorical cross-entropy, suitable for multi-class classification.
Regarding the primary differences between the CNN classifier and the TCN classifier, they lie in their architectural design and temporal modeling capabilities, as exhibited in the bottom part of
Figure 4. The TCN classifier is specifically designed to model sequential dependencies through the use of dilated causal convolutions. Particularly, the model comprises three stacked temporal blocks, each containing two causal, dilated 1D convolutional layers where each convolution is followed by a ReLU activation and a dropout. Furthermore, causality is enforced using a trimming operation using a custom Chomp1d layer that removes the excess padding introduced by dilation, and its rate doubles with each subsequent block in order to enable an exponentially increasing receptive field. Finally, the network processes sequences of MFCCs and aggregates the temporal information via adaptive average pooling, followed by a fully connected output layer for final classification. This enables the TCN to capture long-term temporal patterns while preserving the temporal ordering of the input data.
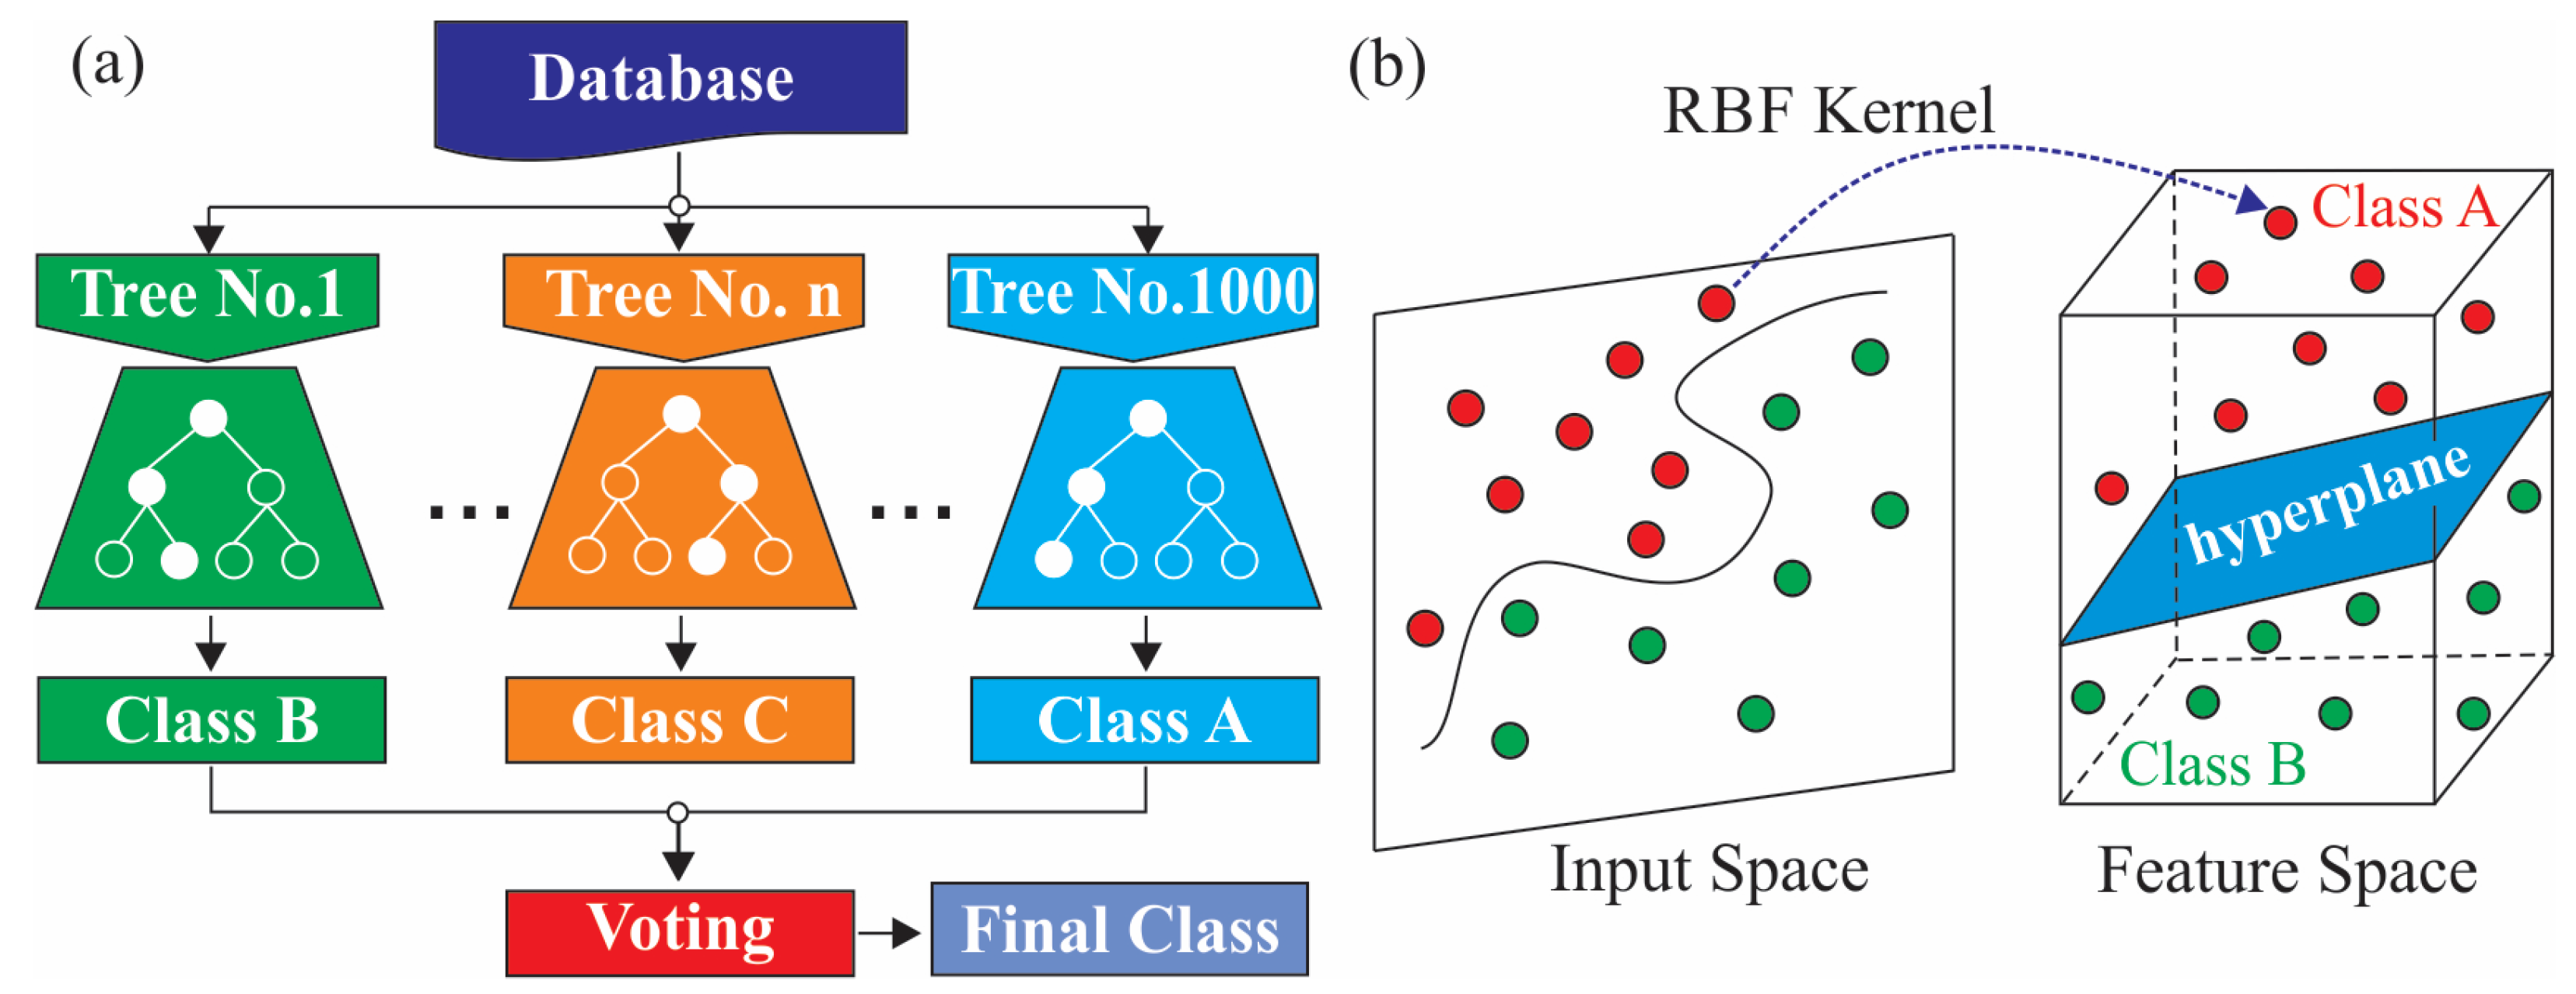
The RF classifier employed in this study utilizes an ensemble learning approach, constructing multiple decision trees during training and determining the final output based on the majority vote of the individual tree predictions. To generate a compact feature set suitable for the RF classifier, statistical descriptors are computed by taking the mean and standard deviation of each MFCC across the time dimension, resulting in an 80-dimensional feature vector (40 MFCC means and 40 MFCC standard deviations). The designed classifier consists of 1000 decision trees, generated through bootstrap aggregation. Each tree is trained on a random subset of features and samples, promoting diversity and reducing overfitting. During inference, the ensemble assigns class labels by aggregating the outputs of individual trees through majority voting, as presented in
Figure 5a. This architecture demonstrates particular efficiency for audio classification tasks where feature interpretability and robustness to noise are prioritized, while the non-parametric nature of the algorithm accommodates the potentially nonlinear relationships inherent in audio feature spaces. Considering the SVM classifier, it composes a margin-based learning algorithm that seeks to find an optimal hyperplane that separates classes with the maximum margin in a high-dimensional space. In order to produce fixed-length feature vectors, statistical descriptors comprising the mean and standard deviation of each MFCC across time were computed, yielding an 80-dimensional representation for each audio file, as in the case of the RF model. This approach ensures that variations in signal duration do not affect the input dimensionality, thereby standardizing the input space for classification. Moreover, the classification model is based on a radial basis function (RBF) kernel SVM, chosen for its capability to model nonlinear decision boundaries in high-dimensional spaces, as schematically illustrated in
Figure 5b. Finally, regarding the model’s configuration, the penalty parameter ‘C’ was equal to 40, balancing margin maximization and classification errors, and the kernel coefficient ‘γ’ was set to ‘scale’, which automatically adjusts based on the input feature variance.
4. Conclusions and Outlook
The present study successfully demonstrated a robust pipeline for evaluating the surface roughness in milling processes using sound data and learning-based methodologies. By associating each recorded sound signal with a corresponding surface roughness quality, the proposed methodology enables precise classification through a series of well-integrated stages, ranging from signal acquisition and preprocessing to feature extraction, model training, and evaluation. The signal preprocessing pipeline ensures data consistency and maximizes the information retained for classification purposes. In addition, the utilization of MFCCs as the primary feature representation effectively captures relevant spectral and temporal information from the sound signals, enabling the applied AI classifiers to distinguish between various surface finish classes. The architectures of the developed models successfully extract discriminative patterns and demonstrate efficient training convergence and generalization capabilities when validated on a test dataset. In addition, due to the model’s learned representation space, unseen sound signals would be mapped to the closest existing cluster in the feature space, enabling reliable classification even with minor variations. Overall, the proposed framework provides a lightweight, non-intrusive, and scalable solution for surface roughness classification and enhancement, making it well-suited for deployment in intelligent manufacturing environments. However, it is important to note that this study has limitations stemming from its specific experimental setup. The analysis was conducted using a single material, cutting tool, and milling machine under fixed operating parameters. These restrictions underscore the need for additional validation across a wider range of operational conditions. In order to enhance generalizability, future research could expand the dataset to include multiple machines, tool types, workpiece materials, and cutting conditions beyond those used in training. This approach would allow the model to develop more robust and generalizable sound signal representations. Furthermore, domain adaptation and transfer learning methods could be investigated to fine-tune pre-trained models for new operating environments using limited labeled data. Another promising strategy is to enhance the training dataset through synthetic or semi-synthetic audio signals that emulate diverse machining conditions, thereby improving model variability and operational resilience.
Finally, it should be stated that the introduced research paves the way for further studies that can explore real-time deployment, multi-sensor fusion, and broader generalization across different machining conditions and materials. By integrating AI models into CNC systems, it could become possible to monitor the machining quality and dynamically adjust cutting parameters to maintain optimal surface finish quality. This closed-loop control would also reduce production defects and enhance the cutting tool’s life. Another promising direction involves the deploying of AI models on edge computing devices, enabling decentralized processing and decision-making directly on the shop floor. This approach would support faster response times and shall reduce dependence on cloud infrastructure, aligning with the real-time demands of Industry 4.0 environments. Further advancements could potentially explore multi-modal data integration, combining signals from various sensors such as dynamometers, temperature cameras, and vision cameras. By training learning-based models on fused sensor data, the corresponding predictions and recommendations can achieve greater accuracy and resilience under varying operating conditions during machining.


