Article

Knowledge Generation of Wire Laser-Beam-Directed Energy Deposition Process Combining Process Data and Metrology Responses

by
Adriano Nicola Pilagatti
1,
Eleonora Atzeni
1,
Alessandro Salmi
1,
Konstantinos Tzimanis
2,
Nikolas Porevopoulos
2 and
Panagiotis Stavropoulos
2,*
1
Department of Management and Production Engineering (DIGEP), Politecnico di Torino, Corso Duca degli Abruzzi 24, 10129 Torino, Italy
2
Laboratory for Manufacturing Systems and Automation, Department of Mechanical Engineering and Aeronautics, University of Patras, Rion, 26504 Patras, Greece
*
Author to whom correspondence should be addressed.
J. Manuf. Mater. Process. 2025, 9(7), 230; https://doi.org/10.3390/jmmp9070230
Submission received: 19 May 2025 / Revised: 26 June 2025 / Accepted: 30 June 2025 / Published: 3 July 2025

Abstract

Industries are leveraging the wire laser-beam-directed energy deposition (DED-LB) additive manufacturing (AM) process to manufacture and repair high-quality, defect-free, and cost-effective parts. However, expensive, non-easily accessible, and complex metrology equipment is needed to quantify part-related performance metrics such as cross-sectional dimensional accuracy and intrinsic defects. This information is necessary for establishing the operating process window and for the quality characterization of the part. Therefore, this work presents a methodology that combines information captured from a vision-based monitoring system with the output of Computed Tomography (CT) towards the knowledge generation and process optimization of wire DED-LB. The design of experiments as well as the interpretation of the results are achieved by employing Nested ANOVA where the dependency of cross-sectional stability on the laser power parameter is demonstrated, enabling, at the same time, the understanding of unstructured datasets where multiple parameters vary at different levels. Finally, this work can be the pillar for adopting new production and part requirements while also giving directions about the effect of control strategies on the part quality.

1. Introduction

Additive manufacturing (AM) processes are being adopted from various industrial sectors including heavy industries such as automotive, aeronautical, medical, naval, etc., as well as small–medium enterprises (SMEs), which have identified the potential of expanding their business opportunities by providing, manufacturing, repair services, and reverse engineering workflows [1,2,3,4]. The latter refers to the manufacturing of parts without relying on fully detailed 3D CADs which are impossible to find due to either property rights or discontinued parts.

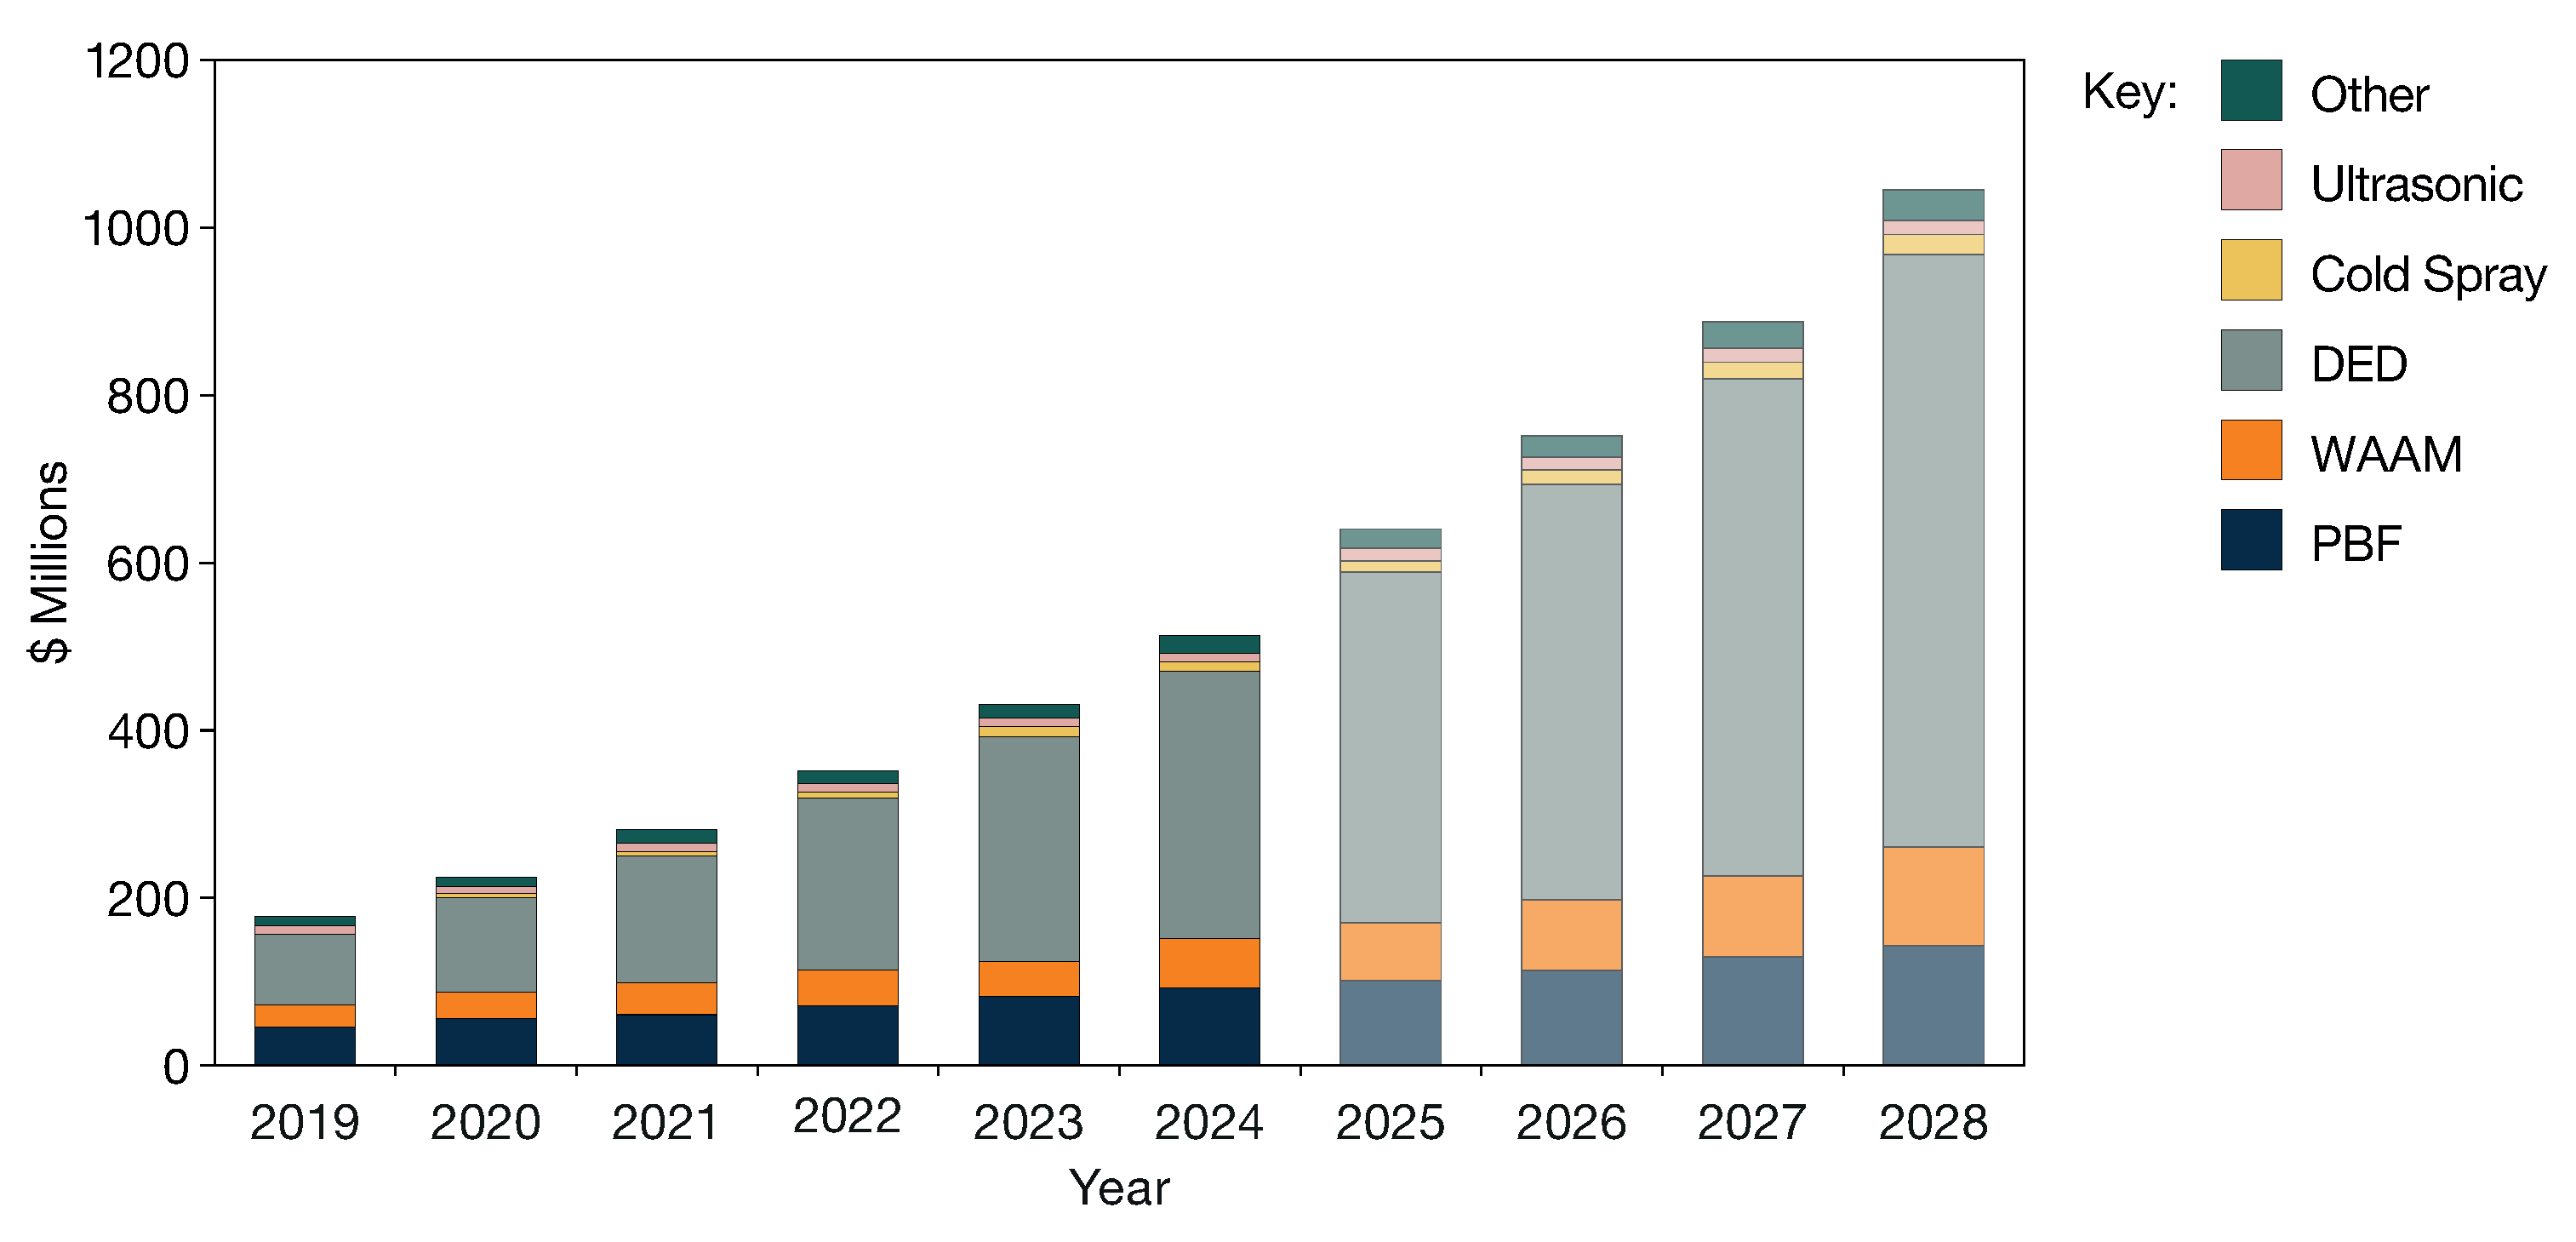
1.1. Directed Energy Deposition (DED) Market Adoption

Until recently, the most applied AM processes on the industrial level were polymer-based processes, which are linked with metal-replacement applications as well as pre-production steps where functional prototypes, fixtures, and jigs are developed [5,6,7]. Despite this early adoption, improvements in the equipment and the continuously increasing process knowledge for the layer-by-layer development of AM parts have moved the interest towards metal processes to create components with a quality similar to those that were traditionally made with conventional processes [8]. This technology is appealing since it can create parts with free-form shapes and internal cavities that can be further optimized following Design for Additive Manufacturing (DfAM) workflows while also being linked with repair and re-purposing services. Also, when it is compared with the capital costs that are linked with casting processes, it can provide small batches with significantly lower costs and production times. The last two application areas of metal AM processes enable an extended life cycle of parts, providing an alternative to the delays that can be linked with the supply chain and maintain the productivity at the desired levels, minimizing the downtime of components such as industrial impellers, molds, blades, etc. [1,9].
Metal AM processes are classified according to the raw material feedstock and its variation (single material, cored wire metal matrix composite etc.), the machine configuration, and the heat source [10,11]. These factors directly affect the process mechanism and the capabilities and limitations of each process. For the development of a functional component with metal AM processes, significant engineering background is needed to select the appropriate process family and the correct process inputs for the studied material as well as to deliver the optimal output considering the special characteristics and the size of the components. The two main processes that belong in the metal AM process family are powder bed fusion (PBF) and directed energy deposition (DED). In the industrial current state, PBF processes possess the higher market share due to the mature, monitored, and controllable equipment that enable the provision of “turnkey” solutions where process-agnostics users can develop high-quality parts, assuming guidance from the machine maker.
However, by carefully examining new business trends, it can be determined that most of the machine makers introduce new DED machines in the market, specifically wire-based systems [12,13]. For almost two decades, the most known DED process was powder laser-beam DED (DED-LB), also known as laser cladding with various applications such as coatings, repair of thin geometries, and the development of high-value, medium–large-scale parts, with complex and detailed features. Nevertheless, the reputation of such systems drops compared to the wire-based DED systems, Wire Arc DED (WAAM) and wire DED-LB, due to the emergence of transforming conventional CNC machines to hybrid systems by retrofitting AM deposition heads. Powder particles may be inserted into sliders and bearings, creating risks for the proper operation of the equipment. Therefore, wire-based systems have been promoted to a preferable solution, not only in terms of compatibility with different machine layouts and robotized systems but also due to the more affordable hardware and consumables over the years. Wire feedstock is almost five times cheaper compared to powder, while it can also be found from different suppliers as it can be the same feedstock with the traditional MIG/TIG welding processes. On top of that, it can be found in many sizes, being compatible with WAAM and wire DED-LB heads. The increase in wire diameter can also lead to improved productivity. Additionally, wire feedstock is used more efficiently during the process, being fed to the melt pool without any material loss, while it provides controllable dimensions, being at a consistent diameter across its length. Lastly, one more advantage compared to powder DED-LB is the usage of less demanding Personal Protective Equipment (PPE) and, in general, precautions for safety which make it more attractive for the industrial environment.
Figure 1 depicts the market distribution for hybrid manufacturing, positioning the DED systems in the total market. It has been discussed that metal AM systems have grown 5% per year in the last five years, while the number of services (finished parts) has grown more than 15% in the same period. Additionally, 70% of the DED systems use of lasers and the market for laser-based DED systems is expected to grow by 200% throughout 2024–2029.

1.2. Wire DED-LB Process Window Development

The process mechanism of wire DED-LB contributes to an increased reputation among users reaching the same levels of WAAM process. This process provides more precise heat input that leads to narrower heat-affected zones (HAZs), achieving fine microstructure and small grains while it is a good compromise of surface quality and productivity. Bead dimensions in WAAM are usually more than 5 m m in width and more than 1 m m in layer height, while in wire DED-LB, the size of bead width can be less than 2 m m and the layer height more than 0.4   m m . Due to the more precise heat input, wire DED-LB can be used in high-value repair applications in molds, impellers etc. [15,16]. Although the significant benefits that contribute to an improved adoption from industry, wire DED-LB is more sensitive on key process variables such as the standoff distance (SoD) and process phenomena such as the heat accumulation and deviation of working distance. The deviation from the optimal conditions leads to unstable processes, which are linked with the wrong interaction point of laser beam with the wire feedstock, causing either droplets or collision of wire to the substrate (Figure 2a). Each one of these situations affects the continuity of material deposition and finally leads to failed processes as illustrated in Figure 2b.
To address this issue, process modeling, monitoring, and inspection techniques are needed to capture and evaluate the critical phenomena and suggest control actions [17,18,19,20,21,22]. Although over the last few years, there have been numerous attempts to industrialize these solutions and such to increase the individual users of the systems, there are no established workflows for process window development. These workflows do not include only the definition of working parameters but also the quantification of the effect of these parameters on bead dimensions, heat accumulation, over-under built, etc. However, the lack of industrialized tools hinders the so-called flexibility of wire DED-LB processes, making the transition from one material to another and to various geometries with different requirements time-consuming. To identify the optimal parameters for each case, an extensive experimental campaign is needed which relies on the selection of the appropriate sample geometry and the metrology responses (Figure 3).
The latter is not a trivial task since, based on the required insights, different geometries should be examined and, therefore, the compatibility with different metrology devices is not ensured, not only in terms of cost but also in terms of accessibility and availability [23]. Additionally, the variation between different part designs and metrology devices introduces complexity with regard to data interpretation. For a real industrial environment, an intermediate step is needed to link the process variables, with metrology responses which is the feedback from process monitoring devices. This accelerates the link of inputs with melt pool quality and overall part dimensions, contributing to real-time feedback to the operator and generation of process understanding. To this end, this work presents a methodology that can be found on the second step of the effort for process window development, where single-wall geometries are built exactly after the single beads so as to investigate the effect of the various process variables on the process stability, on part dimensions, and finally to adjust the layer height corrective factor. For the development of single walls, the successful parameters of single tracks are used, while the outputs of the prior statistical analysis also guide the corrective actions where needed based on the data captured from the monitoring devices.
This work has been structured as follows. In Section 2, the current state of practice with regard to the metrology devices that can be used out of line and give feedback for process optimization are introduced, focusing on the Computed Tomography (CT) technology that provides the more detailed, but at the same time, the most complex analysis of the data. The CT scan presented in Section 3 is used to provide the cross-sectional stability of a reference geometry developed with a robotized wire DED-LB system. Although CT devices can also provide details about the intrinsic defects, in the case of wire DED-LB, it is not typical to find pores in thin walls, since the raw material is fully dense. However, visible cracks may be generated close to the substrate. The developed reference geometry accommodates the understanding of the behavior of a robotized system on the overall process and reveals the effect of the laser power (P) decay strategy on the overall part dimensions, considering only in-line inspection of melt pool features by using vision-based monitoring. The methodology and the pillars of this work are presented in Section 4. Finally, in Section 5, we demonstrated that in wire DED-LB, a stable process, it is considered as the first indicator for a high-quality process output as well as that obtained by implementing Nested ANOVA; the effect of process inputs on the process responses can be interpreted as depicting the optimal set of process parameters and the effect of P decay strategy on overall quality.

2. State of Practice on Part Inspection

Inspection systems for DED components offer various capabilities, with contact systems like Coordinate-Measuring Machines (CMMs) widely used for their high accuracy in measuring accessible and regular surfaces. Equipped with tactile probes, CMMs can capture discrete points or scan freeform geometries, making them effective for verifying critical features. However, their efficiency decreases with rough or complex geometries, and complex internal features are not discernible.
Optical systems are more versatile, but they are subject to several limitations when applied to complex geometries such as those characteristics of DED components [24,25]. These challenges mainly arise due to shaded areas of the parts, which prevent complete surface acquisition [26].
X-ray Computed Tomography (CT) is a highly versatile and non-destructive technique for inspecting both internal and external features of components. This makes it particularly suitable for complex geometries. The process involves capturing X-ray projections from multiple angles, which are reconstructed into a 3D voxel-based model. This approach enables precise evaluation of dimensional tolerances and identification of internal defects in a single procedure, surpassing the limitations of traditional tactile and optical inspection methods. CT is particularly effective for freeform geometries and multi-material components, where other methods often face difficulties. Sub-voxel accuracy is achieved through advanced algorithms for edge detection and segmentation, allowing detailed analysis of intricate features [27]. Challenges such as beam hardening, scattering, and reconstruction artifacts are addressed through optimized acquisition parameters and correction techniques, ensuring the reliability of measurements [28]. However, limitations include extended acquisition times and the substantial costs associated with high-resolution equipment. Industrial tomography systems are well-suited for the measurement of components at nano-, micro-, and small scales. Nevertheless, the effectiveness of these systems is constrained by the material thickness, the material type, and the inherent capabilities of the system.
The choice of the most appropriate method depends on factors such as the complexity of the geometry, the required accuracy, the need for internal or external inspection, the type of material, the material condition (e.g., deformable, transparent, opaque), the dimensions of the component, the traceability requirements, and, last but not least, the associated costs. For reference, contact-based systems have been used extensively in freeform geometries such as the liner of automotive engines, the shape of the blade of a large turbine, etc., as well as to find specific information such as the center of a hole, its diameter, and the length of an arc. However, this method requires significant time since the surface is scanned by contact, and as such, large parts may require some hours to be measured and represented in a digital environment [29]. On the other hand, 3D vision and scanning systems can deliver the 3D geometry of the part in a matter of minutes, but with less accurate information, especially when it comes to internal or hidden features. Moreover, these methods are affected by the reflectivity of the inspected part, and they often require alignment markers to orient the part in the space. These methods are used extensively in repair operations where the surface should be scanned so as to compare with the initial CAD and extract the volume which should be repaired (e.g., turbine blades). In this case, the accuracy of the representation is not very important since it is common practice to add excess material which is later post-processed. Finally, X-ray is opted in the case of thin-wall geometries like the parts from the nuclear industry where the specifications of the parts should lie within standards, and therefore, the existence of intrinsic defects should be examined. Table 1 summarizes the key inspection technologies, highlighting their main advantages and limitations.
The investigation of the literature provided enough evidence about the different types of inspection devices that can be used for the extraction of dimensional accuracy and determination of internal quality. Our work aims to leverage information that will be extracted from a CT scan towards the evaluation of different experiments in terms of dimensional accuracy. The precision of the equipment has been selected in accordance to the quality metrics that are defined for DED AM processes, aiming to provide sufficient insights into the effect of process variables on the thin-wall morphology and cross-sectional stability. The interior surface of the part could not be captured with none of the other mentioned inspection devices (Contact and 3D vision/Scanning Systems). Finally, the understanding of the capabilities of various inspection devices guided the design of the examined part and the number of experiments so as to maintain a high reward-efficient experimental design.

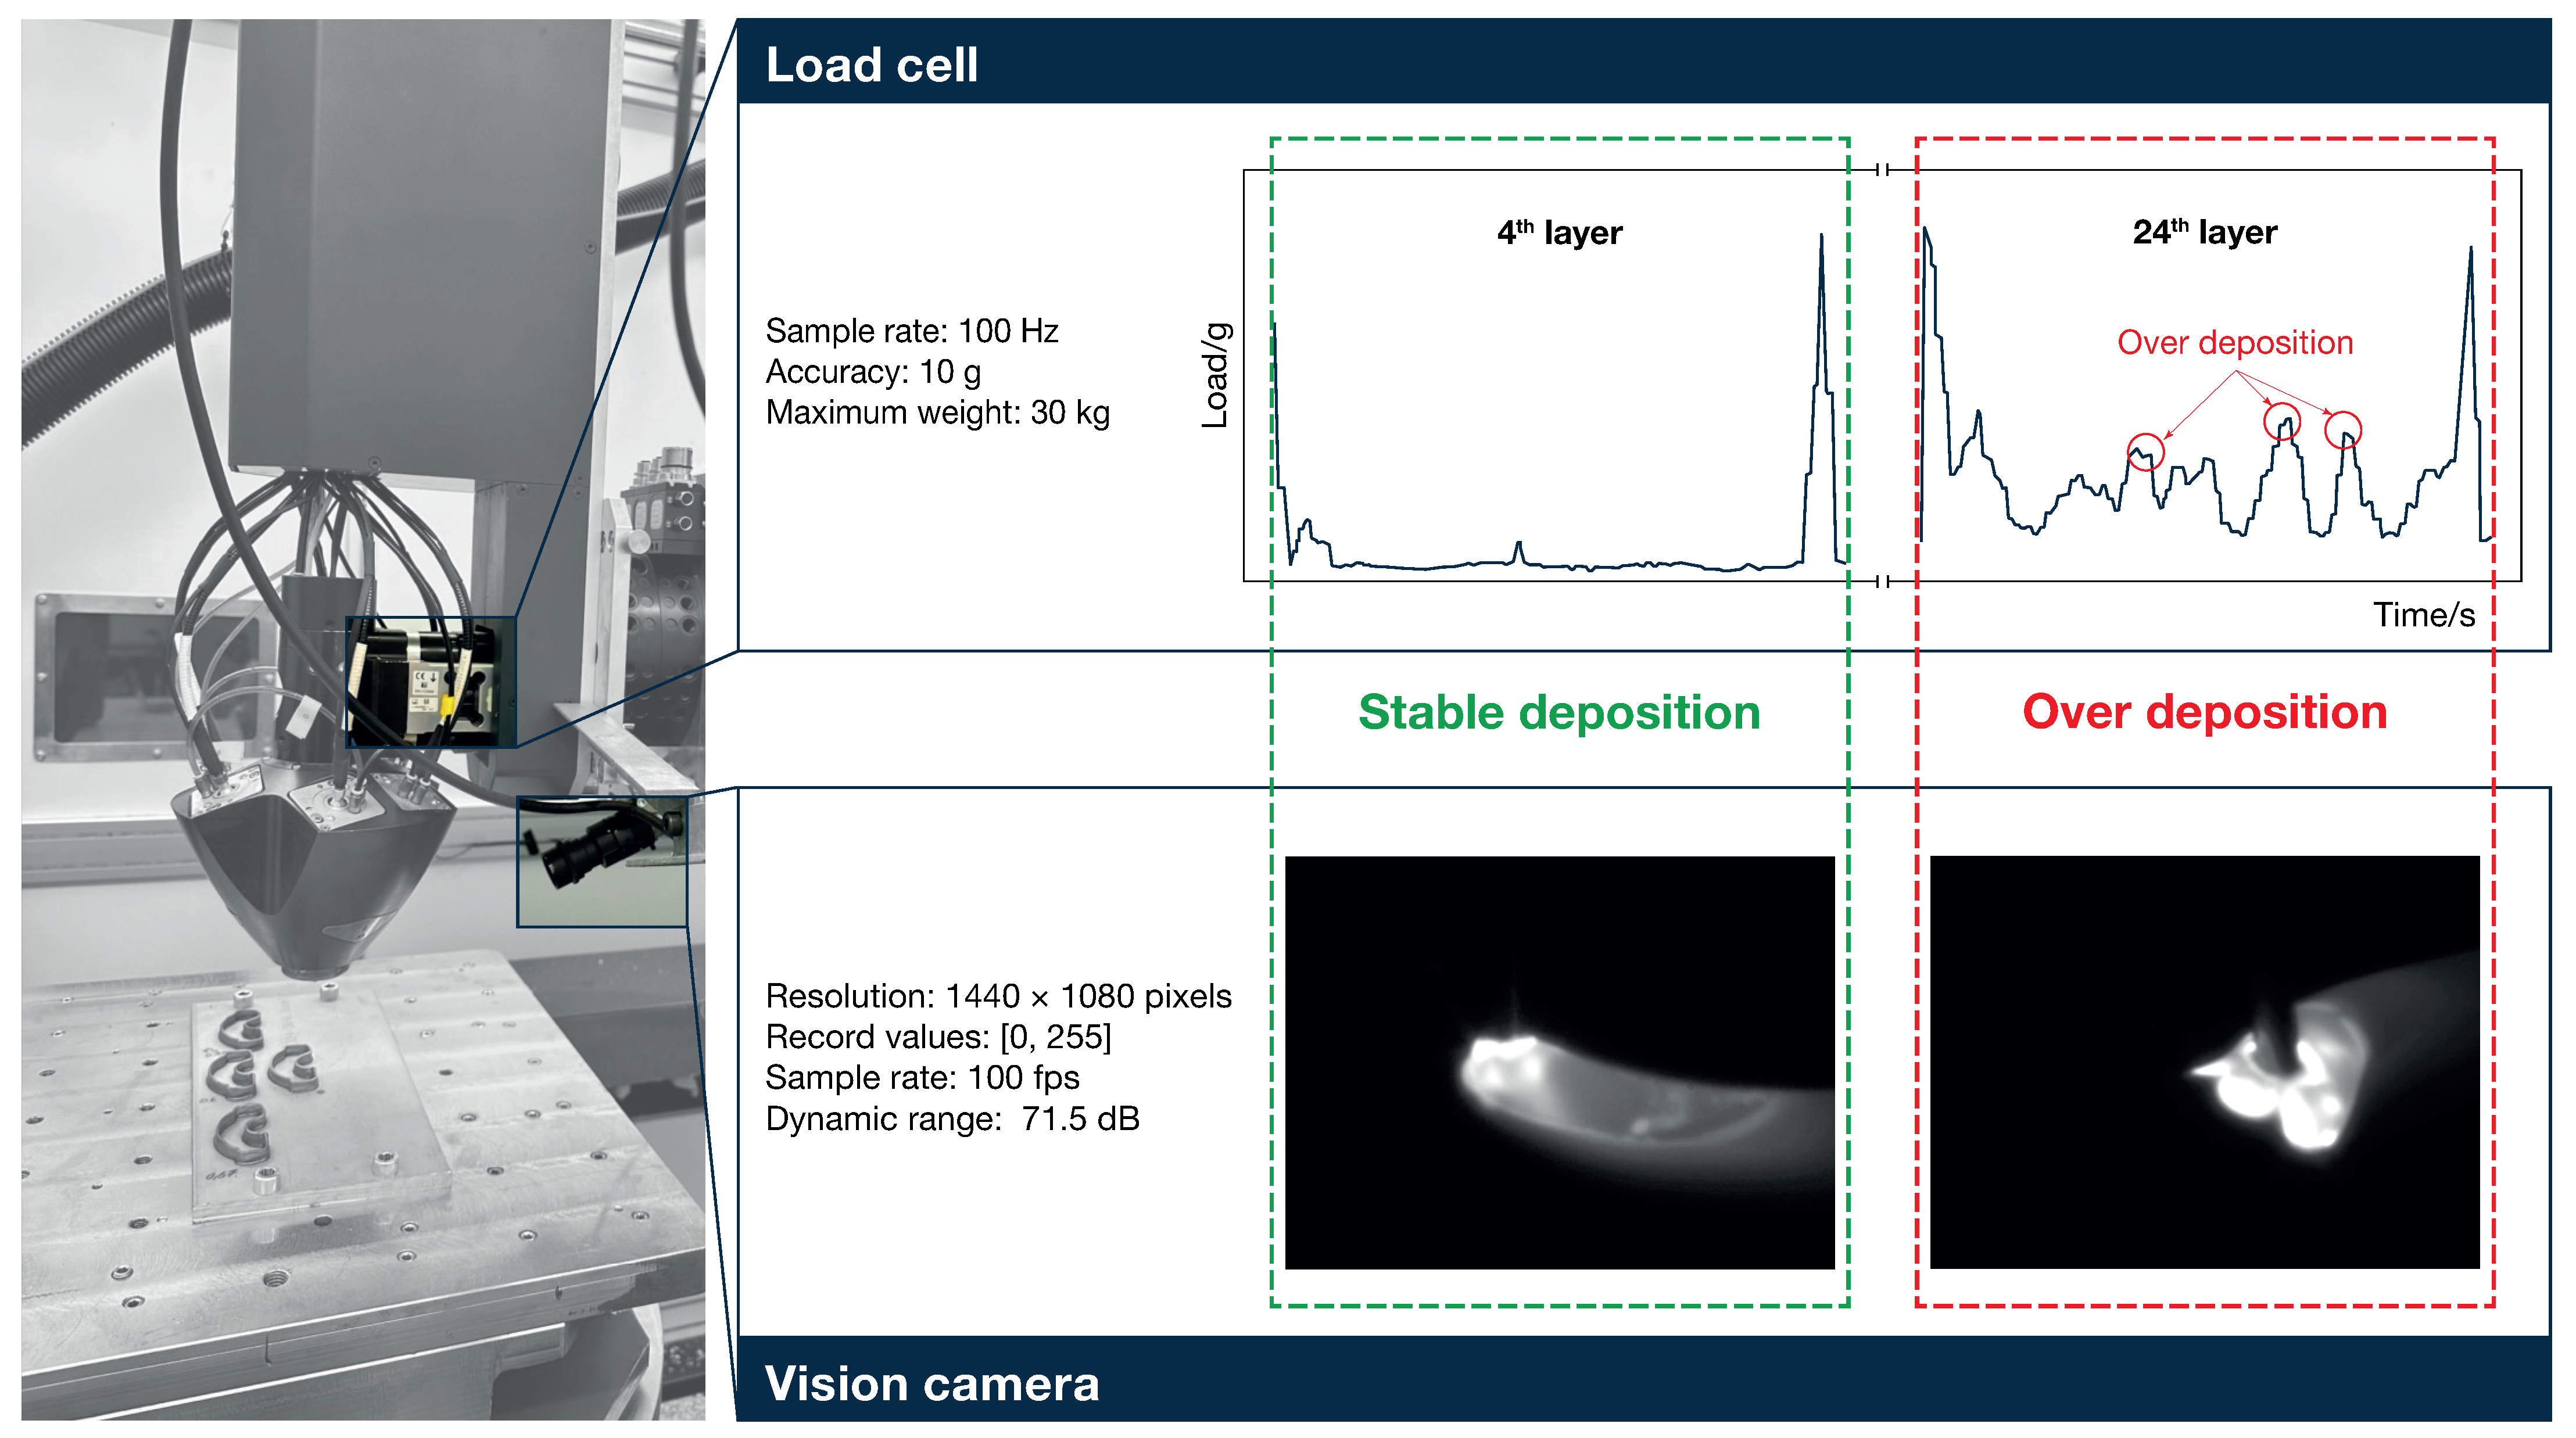
3. Experimental Set-Up

The experimental set-up is divided into two individual systems. The first one is the wire DED-LB robotized system and the second is the metrology device that is used for the CT scan of these geometries (Figure 4). The DED system comprises of 6-off-axis, infrared wavelength (976 n m ), continuous laser beams, and a coaxial wire feeding system. The working distance is kept constant for all the experiments at 6 m m above the surface, while the material for these experiments (feedstock and base plate) has been decided to be the stainless steel AISI 316 so as to generate process-related knowledge, identifying the effect of process inputs to process outputs without dealing with the special characteristics of more complex materials which depend on the inert atmosphere and surface pre-heating. The wire diameter has been consistently measured at 1 m m and the substrate thickness 10 m m .
In order to obtain the desired information, monitoring devices are used. The first one is an embedded load cell that captures the loads on the deposition head (feeding system), and it ensures that, in the case of over load, the feeding/retract activities immediately stop without causing failure to the equipment. This is typical in the case that the laser stops when the wire is within the melt pool. It is a bending beam load cell which captures information with a sample rate of 100 Hz , reduced to 10 Hz so as to match the sampling frequency of the vision-based system. The sampling frequency has been decided so as to follow the evolution of process phenomena. The load cell value is calibrated each time before the process by the machine software so as to ensure the same starting level for each experiment. The information is stored in a CSV with a timestamp and the relative robot position each time, considering the use of Ethercat and ModBus protocols. For communication with the machine, the TCP/IP data exchange protocol has been used. By linking the information of this signal with the part height, significance insights can be extracted from the evolution of layer height between the layers.
The second device that has been used is a BASLER CMOS camera (Basler, Ahrensburg, Germany) which has been installed in an off-axis configuration, capturing the heat-affected zone. For each process, the raw frames are and reflect the melt pool evolution. The resolution of the camera is (1440 × 1080) pixels, with a 0 to 255 range of values for each pixel, and the dynamic range is 71.5 dB. By visually inspecting the frames as captured by the PylonViwer software, the status of the process is evaluated, which is classified in stable deposition, under-build and over-build. By analyzing the frames of Figure 4, the process status can be characterized by the operator only by observing the frames, while for the last two phenomena linked with the part height, the signal of load cell is evaluated in real time so as to validate the process understanding by providing critical details about the melt pool quality through evaluating the interaction point of laser beams and provided feedstock. Also, as demonstrated later in Section 4, by evaluating the melt pool shape and brightness and the evolution of these metrics among the layers, the heat accumulation of the part can be extracted, guiding corrective actions on the fly by inserting manually changes on the DED machine controller.
The second part of the experimental setup is linked with the CT scan that has been used throughout the evaluation. The samples were removed from the platform using a wire Electrical Discharge Machining (wire EDM) system by Suzhou Baoma (Suzhou, China). Each sample was then subjected to CT scanning using a Phoenix V|tome|x S240 system by Baker Hughes (Houston, TX, USA). The geometry exceeded the sensor field of view (FOV), and to avoid losing resolution, the scanning was divided into two steps. First, the bottom section was scanned, followed by the top, with both scans later merged during post-processing. In addition to this two-step acquisition, the shifted detector mode was employed during reconstruction to further enlarge the effective FOV by laterally displacing the detector, thereby enabling complete coverage of the object. For each step, 2800 images were captured, resulting in a total of 5600 images over a full 360° rotation. After the scanning procedure, the initial data were processed using Phoenix datos|x (version 2.8.0-RTM) to remove any noise and correct for potential shifts in the sample or detector. The refined data were then imported into VGSTUDIO MAX 3.5 by Volume Graphics (Heidelberg, Germany) to perform the analysis.

4. Materials and Methods

Overall, the idea is to create a methodology for step-by-step establishment of the functional process window alongside with the generation of process knowledge not only in terms of statistical tools and methods that evaluate the condition of the machine but also in terms of human-based process understanding and wisdom [34,35]. The latter is very important since it determines the type of design of the experiment that is followed. For the non-mature wire DED-LB process, the experimental strategy should be designed based on the agent that is going to use the extracted information. In the case of human-based interpretation of outputs, the experimental work should depict a clear link between process inputs and outputs and clarify the aspects that are related to the process mechanism. The correct understanding of this effect could lead to a very first decision about the parameters that can be adjusted on the fly and the very sensitive parameters that should be kept constant during the entire build. On the other hand, when the experimental work is oriented to create data for artificial intelligence and machine learning models, nested and full factorial approaches can be followed since the hidden relationships between the inputs and outputs, which sometimes cannot be interpreted easily from engineers, can be identified. Finally, the target of this methodology is to provide the necessary human-based knowledge in each step of the process window development and guide the establishment of functional working parameters as well as determine the corrective actions that should be performed on the fly so as to control the process.

4.1. Selection of Sample Geometry

The present study is focused on the development of thin-wall geometry and the implementation of knowledge that has been generated during single beads as described in Figure 3. The single-wall geometry is studied before the multiwall/solid parts since it provides, in a more obvious way, the effect of process inputs on process output using, “close to the machine” devices such as Vernier caliper to depict the accuracy of part dimensions compared to the nominal values. The thin cross-section deviates from the nominal when the process variables are not the optimal due to the change in the heat diffusion mechanism as the layers are being developed, extracting, with visual evaluation, significant outputs related to heat accumulation and process stability which can be also linked to the properties of the part [36]. As such, the implementation of process understanding is necessary in each process so as to deliver a “visually” stable process. This step includes the determination of minimum dwell time between layers, the values of the working process parameters as well as the development of robot path. On top of that, the responses of the monitoring devices can be understood more easily when simplifying and reducing the process inputs that may affect the captured signals. As an example, intensive work is needed when studying a full solid or overlapping part in order to transform the data captured from costly scanners and CT scan devices into useful information.

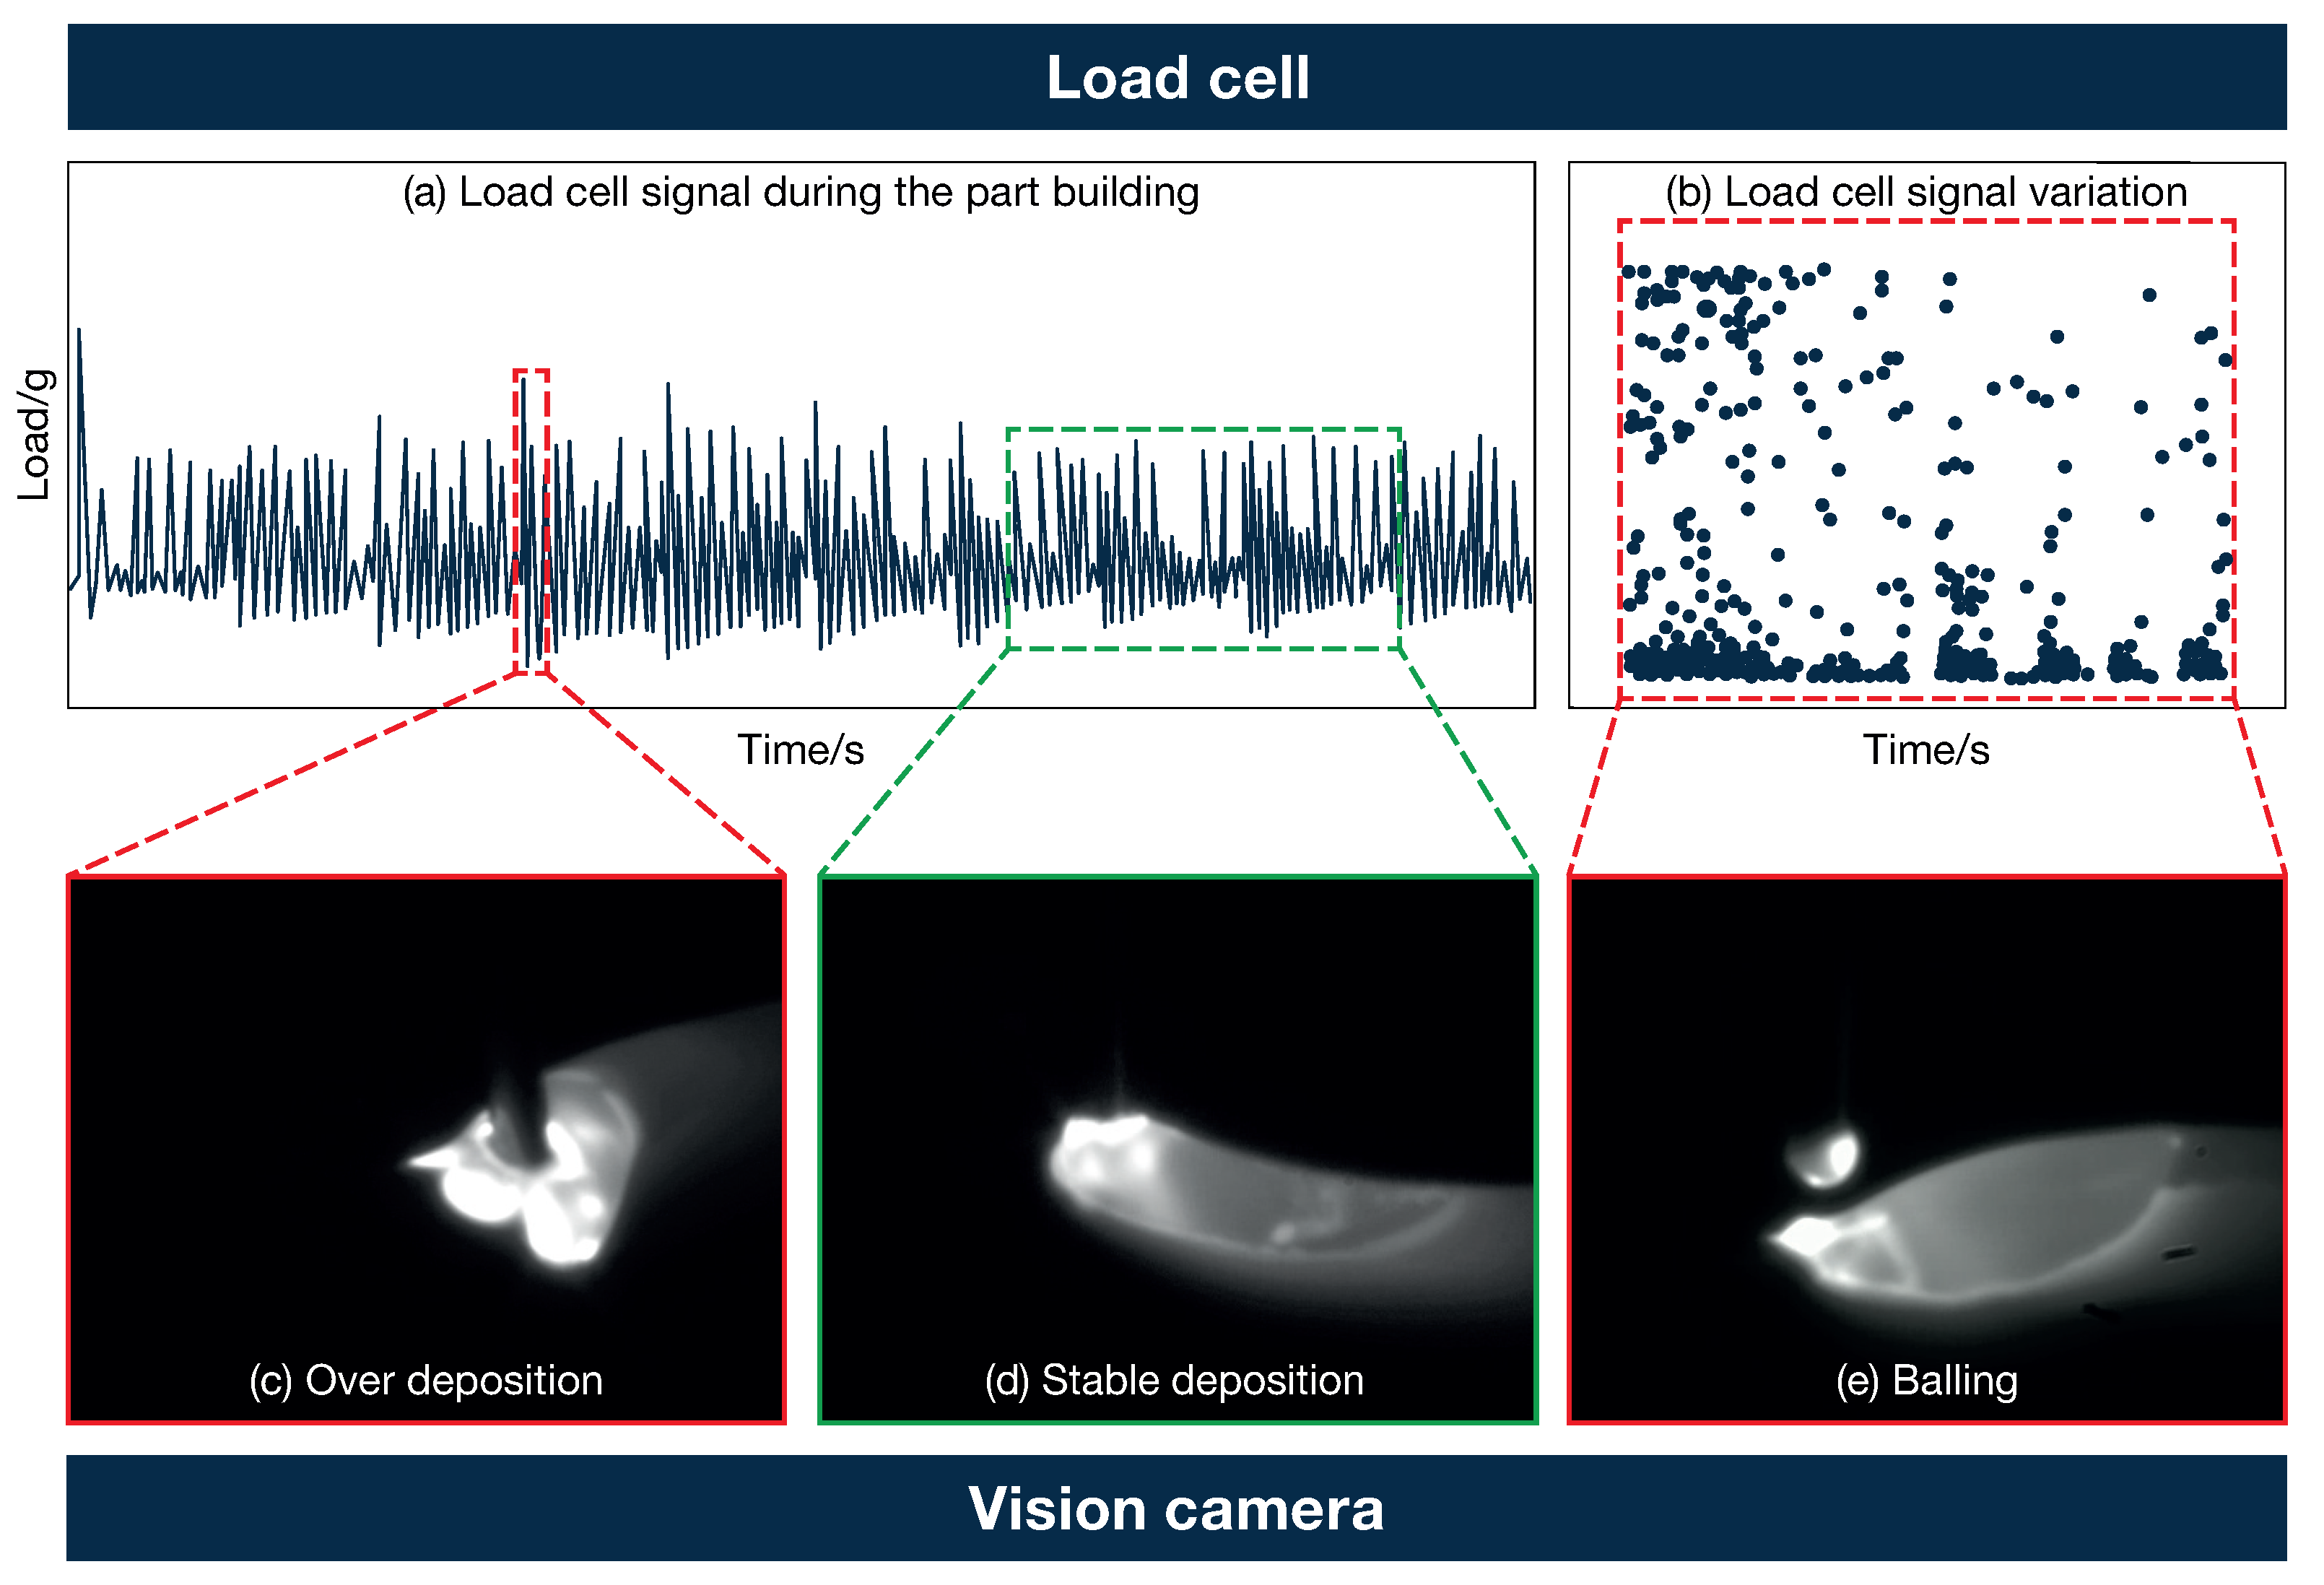
4.2. Wire DED-LB Process Phenomena and Their Effect on Process Stability

In the previous paragraph, the reasoning behind the study of thin-wall geometries has revealed the correlation of cross-sectional thickness consistency and process stability through controlled heat accumulation. Therefore, to better understand the effect of process variables on the process mechanism, the following paragraphs unfold the critical process phenomena while linking them with the evolution of bead dimensions. During the implementation of the thin-wall experiments, the main process-related phenomena as well as the difficulties of accurately predicting the layer height have been considered. The first critical phenomenon is the one of heat accumulation which evolves with the increasing number of layers. When the accumulated heat reaches a critical condition, surface re-melting is expected leading to a non-stable process due to the working distance deviation from the SoD, causing change of melt pool dimensions and intrinsic as well as visible defects such as cracks and poor interlayer bonding. Among the process variables that determine the heat influx (i.e., laser power, laser spot size, SoD) and the deposition rate (i.e., deposition head speed, wire feed rate) which are crucial for the determination of the process stability, the most important one is the working distance. When the working distance deviates from the SoD, the alignment point of laser beams with the feedstock material change. When the distance between the deposition head and the built part increases, droplets of material are expected, while in the case where this distance decreases, collision of the wire feedstock material within the melt pool is expected. In both cases, the dimensions of melt pool cannot be controlled, leading to a wavy surface and finally to a failed process if this issue remains for many layers (Figure 2d,f).
On top of that, the wavy surface, even if it is within acceptable limits (Figure 2 and Figure 5), creates a lack of continuity since there is a gap between consecutive points across the path, leading to a non-uniform shape of the melt pool (Figure 6).
The phenomenon of heat accumulation is detected by visually inspecting the melt pool geometry via a vision camera, linking the expansion of melt pool area with the accumulated heat, as it has been presented in a previous work [38,39]. By visually detecting increased melt pool area as the height increases (Figure 7), the P is set to a lower value. Into this specific figure, the melt pool area varies from 12 mm2 during the deposition of the 2nd layer to 34 mm2 at the final layer. Throughout this study, there was not any specific laser power decay strategy or pre-defined drop step, but each change was based on the operator’s feedback. For the first layers, the laser power remained constant considering higher cooling rate and heat dissipation to the substrate. After almost 10 layers, corrective actions were enforced. The change in laser power remained for some layers each time, letting the system be stabilized. The interval between each change also was not pre-defined. At higher layers, the minimum value of laser power was reached. The lower limit was found to be close to 600 W by closely investigating the wire oscillation on top of the surface. The wire was partially melted above the surface, not being able to penetrate the already built part due to the less energy provided and the lower surface temperature.
The second critical phenomenon is the kinematic overbuilt that evolves at the areas where the head accelerates and decelerates, which is usually the cornering areas and the starting and end points of a track. Although, for the enclosed machine tools, this kind of issue can be controlled from the software that manipulates, at the same time, the wire feed rate ( W F R ) and the head speed, this is not the case for the robotized systems where the head motion and the feeding system are manipulated from different controllers. The latter set-up introduces delays during the data acquisition, making it difficult to develop a software that obtains this information and guides the corrective actions. The footprint of this phenomenon is the satellite defect that can lead to discontinuity of material, like what was presented in the previous paragraph. On top of that, in multiwall parts, this can lead to failed processes considering short track length and the development of fine features.
To understand the severity of this issue in our machine, the same starting point was selected for all the layers and all the samples. This point is decided to be close to a straight line of adequate length that has been selected to avoid a sequence of changes in speed that could create unstable deposition (Figure 8). On top of that, by tuning the feeding system parameters and the laser activation procedure, minimal over-built was achieved at the starting point, visually inspecting the end part after a pre-defined number of layers. To facilitate the analysis, the deposition was segmented into blocks of 11 tracks, referred to as Layers Blocks (LBlk). Within each block, the process parameters were kept constant. These include the P, the robot scan speed v, and the W F R , which were then modified in the following block.
The last of the issues related to the process mechanism was linked with the assumptions about the layer height calculation. As it has been stated in another work, the bead geometry is approximated by a rectangular shape while it is closer to an ellipsoidal shape, inserting calculation errors [37]. Moreover, the procedure of calculating layer height, apart from the utilization of law of mass conservation, requires calibration with actual measurements which are performed on the microscope. The theoretical layer height is multiplied with the correction factor and the value that has been used as the actual layer height is generated for the different combination of process parameters. However, it cannot be considered a priori that the correction factor will be equal for all the combination of process parameters. Therefore, a close evaluation of the part height between specific intervals as well as the corresponding trend of the load cell signal at the same intervals could provide meaningful information about the part height increase. The values also captured from the embedded load cell have been correlated with the over- and under-built, which has also been validated by analyzing the signal from the vision camera [37]. Finally, height measurements are taken every almost one or two batches of layers to ensure the stable increase in height. In the case where deviations are observed and the part is higher than expected, the W F R is reduced considering the immediate effect of this parameter without a significant effect on the bead width dimensions, while in the case of the under-built, the W F R increases to counteract the lack of material (Figure 5).

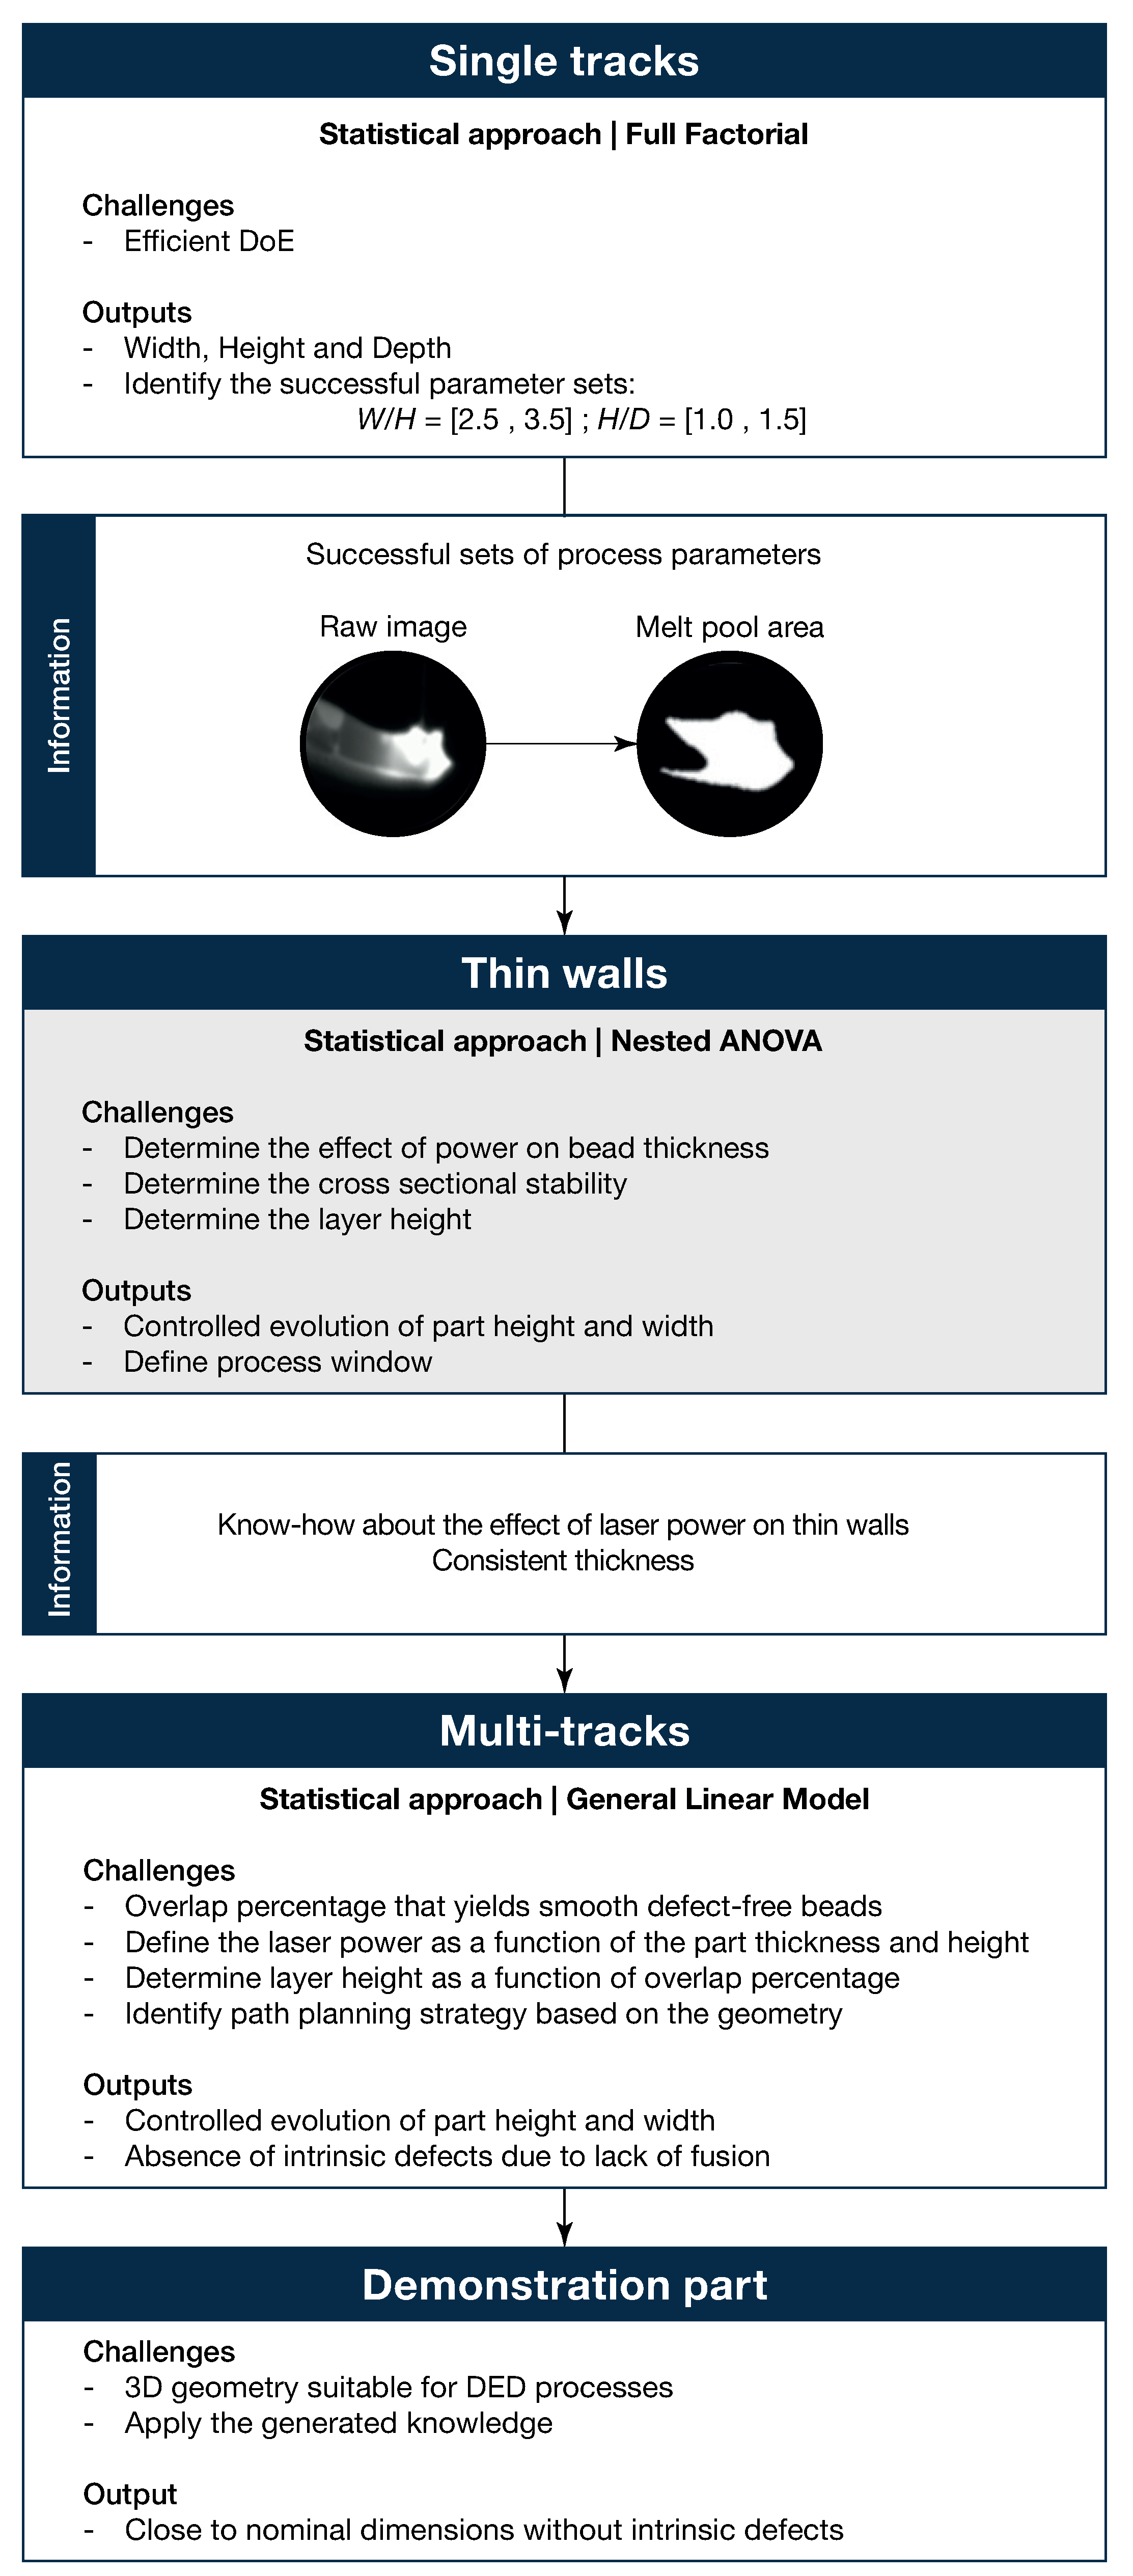
4.3. Thin-Wall Development as a Multi-Factorial Problem

From our previous research work, a set of functional process parameters has been identified [17]. However, it cannot be assumed that the initial values of these parameters can remain constant during the process, due to the process phenomena that can appear in every print. In this work, the corrective actions have not applied based on a pre-described strategy but based on the knowledge that has been gained through the ongoing experimental work and the quick evaluation of the effect of process variables on the process key performance indicators (KPIs). For this study, different sets of initial process parameters have been tested. During the process, the laser power and the W F R values are modified based on the signal captured by the vision camera and the load cell devices. The W F R parameter is tuned during the process based on the part’s height measurements that have been obtained between pre-defined time intervals, considering this parameter being linked directly to the bead height. Additionally, as it is presented in a previous work [37], the trend of the load cell values has been correlated with the over- and under-built. Therefore, by combining the metrology responses and the visual inspection of the load cell signal, the W F R parameters has been modified. The cooling time between layers, the path planning strategy, and the number of layers remain constant between the different experiments. More specifically, the cooling time and idling time between layers have been selected according to the manufacturability threshold for the studied material that has been extracted from the literature [38]. However, when the v increases, the cooling time is expected to increase accordingly so as to keep constant the deposition time plus cooling time between each layer. In the case of SS316L, the total time between consecutive layers has been found to be 26 s . The outputs of the present work can be very useful in multiple ways. First, the effect of the laser power drop strategy not only on heat accumulation but also on the cross-sectional stability is detected. Secondly, the effect of W F R on process stability is demonstrated. Lastly, the last two points are used for the design of control strategies based on the captured signal and its relation to the part quality for each one of the samples.

4.4. Challenges on the Data Analysis

In the DED process, each layer is deposited on top of the previous one, causing the effects and errors in subsequent layers to depend on those in earlier ones due to error propagation. This interdependence complicates the assessment of defects in the later layers compared to the initial ones and becomes even more challenging when comparing different layers across various deposition strategies. To address this, each LBlk was treated as an individual volume for analysis, and the hierarchical nature of the deposition process was taken into account. The temporal order of the blocks introduces dependencies: the first block is only influenced by the substrate, while each subsequent block is affected by all those previously deposited. Each specimen includes 10 LBlks, each with its own combination of process parameters. It is important to interpret LBlk as a feature-engineered variable [40] that aggregates both the process parameters and the cooldown intervals between blocks. Although this approach does not capture all physical differences (such as those from local thermal conditions or robot positioning errors), it effectively reduces noise and enables a more tractable comparison of the evolving process parameters across specimens.
The specimens were separated from the platform, scanned with CT scan, and analyzed. For each specimen, the wall thickness distribution was first analyzed to assess the median thickness. The reference CAD model was then generated based on the robot path and the median thickness. This eliminates any bias due to the process parameters used and their effect on the width of the deposited tracks. The CT scan data was subsequently aligned to the reference CAD, and defect analysis was conducted. The chosen responses were thickness, surface deviations, height of the LBlks and their deviations, as these metrics are closely related, with interactions influencing one another. To provide a reliable indication of central tendency and dispersion, two robust descriptive statistics that are less affected by outliers were adopted: the median and the median absolute deviation (MAD) [41]. The median represents the central value of the dataset, while MAD measures the variability by calculating the median of the absolute deviations from the overall median, providing a robust estimate of dispersion.

4.5. Structure of Statistical Model

To include in the analysis the hierarchical structure of the experiment and the sequential correlation in the measurements, the linear statistical model is formulated with an autoregressive residual structure of order 1 (AR(1)), where each residual is linearly dependent on the immediately preceding one. The general form of the model is
y i j k = μ + τ i + δ 1 P i j k + δ 2 v i j k + δ 3 WFR i j k + ϵ i j k , ϵ i j k AR ( 1 )
where y i j k represents the response, μ is the overall mean, and τ i denotes the effect of the ith Specimen. The covariates P, v, and WFR are included as fixed predictors with corresponding coefficients δ 1 , δ 2 , and δ 3 . The residual term ϵ i j k is modeled as a AR(1), which captures the temporal correlation across sequential LBlks within each Specimen.
The objective is to assess the impact of Specimen and the process covariates on the manufacturing outcomes, accounting for the inherent correlation introduced by the ordered layering process.

5. Results and Discussion

In this study, five specimens were produced, and each specimen contained 10 LBlks of 11 tracks, each representing a different combination of process parameters. The total time between consecutive layers has been selected at 26 s for the AISI 316L based on the recommendations of our previous work to avoid a direct effect of the heat accumulation on the process stability at the very first layers. In that way, the phenomenon of heat accumulation would be controlled with minor corrections of heat input [9,42,43,44,45]. The experimental layout and process parameters are shown in Table 2, and the resulting specimens are shown in Figure 9. Each specimen is identified as S#, where # represents the specimen number.
After manufacturing, the specimens were detached from the platforms using a wire EDM system and prepared for CT scanning, as detailed in Section 3. The chosen CT scanning parameters (Table 3), along with the sample dimensions, allowed for a clear distinction between the material and the background, yielding a volumetric picture element (voxel) size of 40.7 μm. After the scanning procedure, the initial data were processed using Phoenix datos|x to remove any noise and correct for potential shifts in the sample or detector. The refined data were then imported into VGSTUDIO MAX 3.5 to perform the analysis. The reconstructed surface, after processing, achieved a determination error of approximately 1/10th of the voxel size. This was accomplished using optimized sub-voxel edge detection algorithms [46], ensuring precise local surface calibration directly from the voxel data to minimize measurement uncertainties [47,48]. As the analysis focused on two closely spaced and parallel surfaces, the combined effect of errors from both surfaces was calculated using the L 2 norm. Consequently, the accuracy of the geometric analyses was on the order of 10 μm, ensuring consistency with the measurement uncertainty. A complete visualization of the deviation analysis is shown in Figure 9. The accuracy level has been decided according to the directions of the literature where the effect of the critical parameters on the bead geometry has been measured to vary by ± 0.1   m m [49]. The idea is to correlate the accumulated dimensional error that could steer the process out of the stable process window within subsequent layers and guide corrective actions.

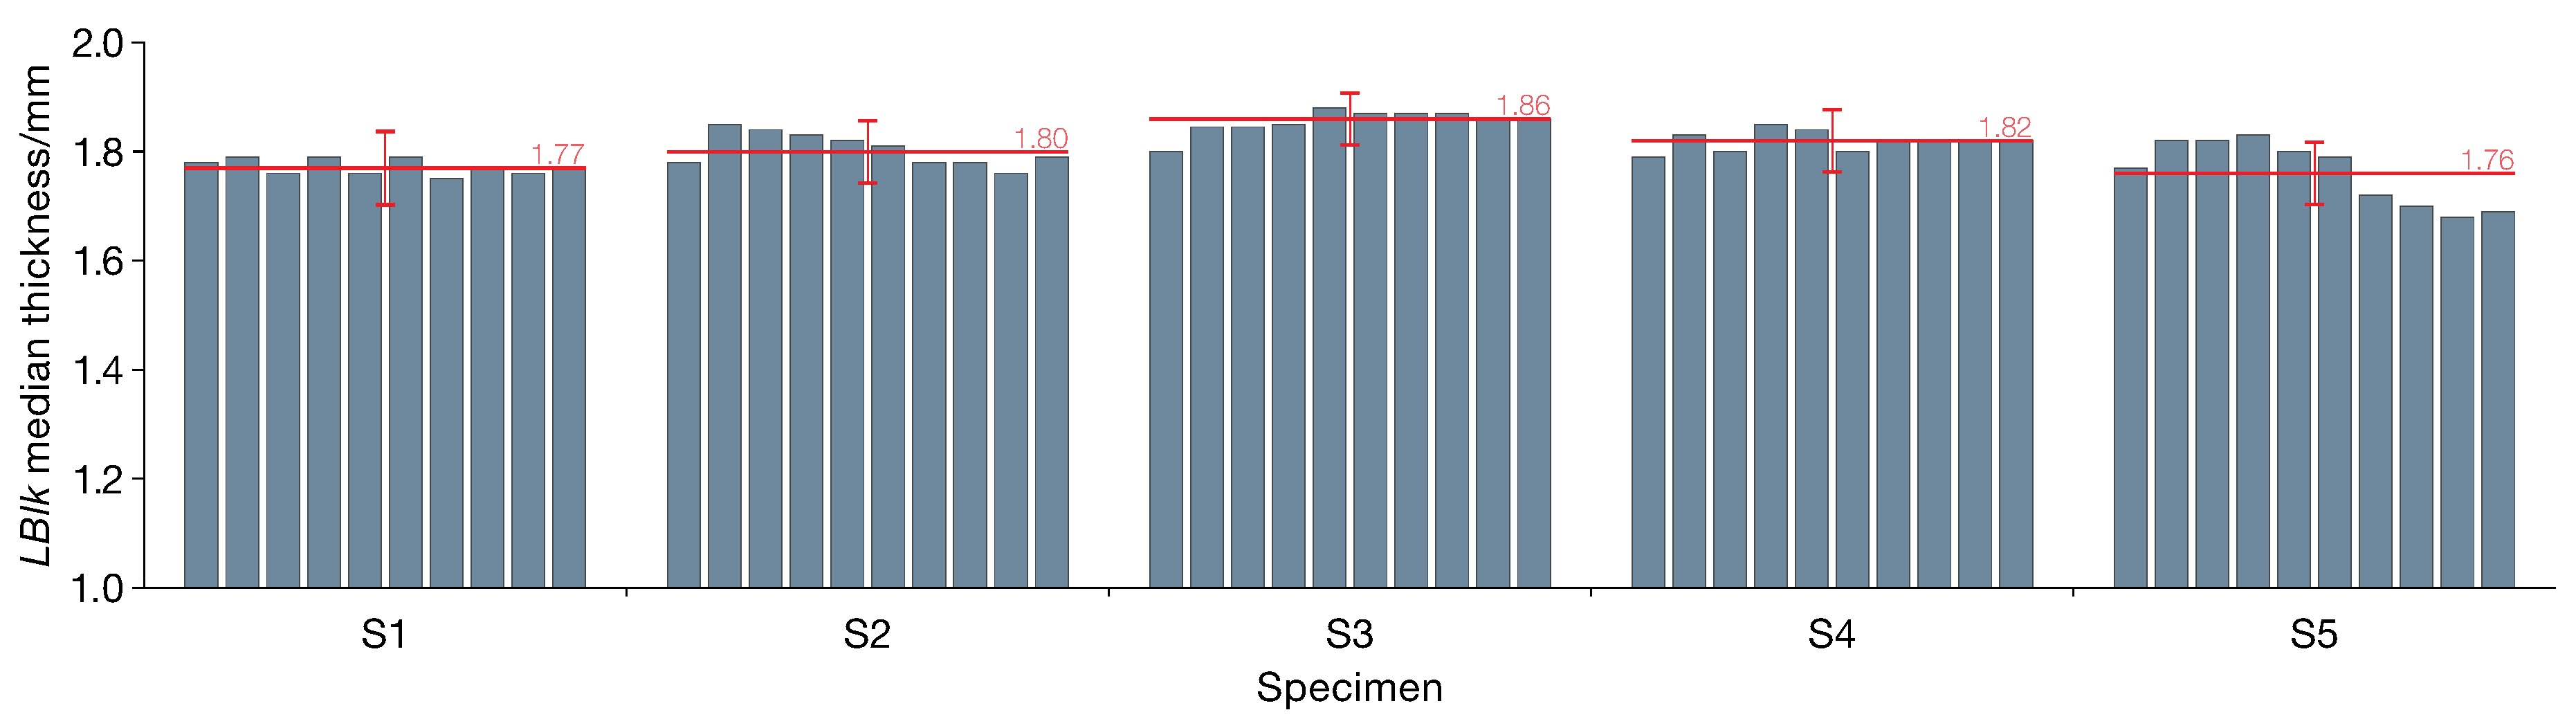
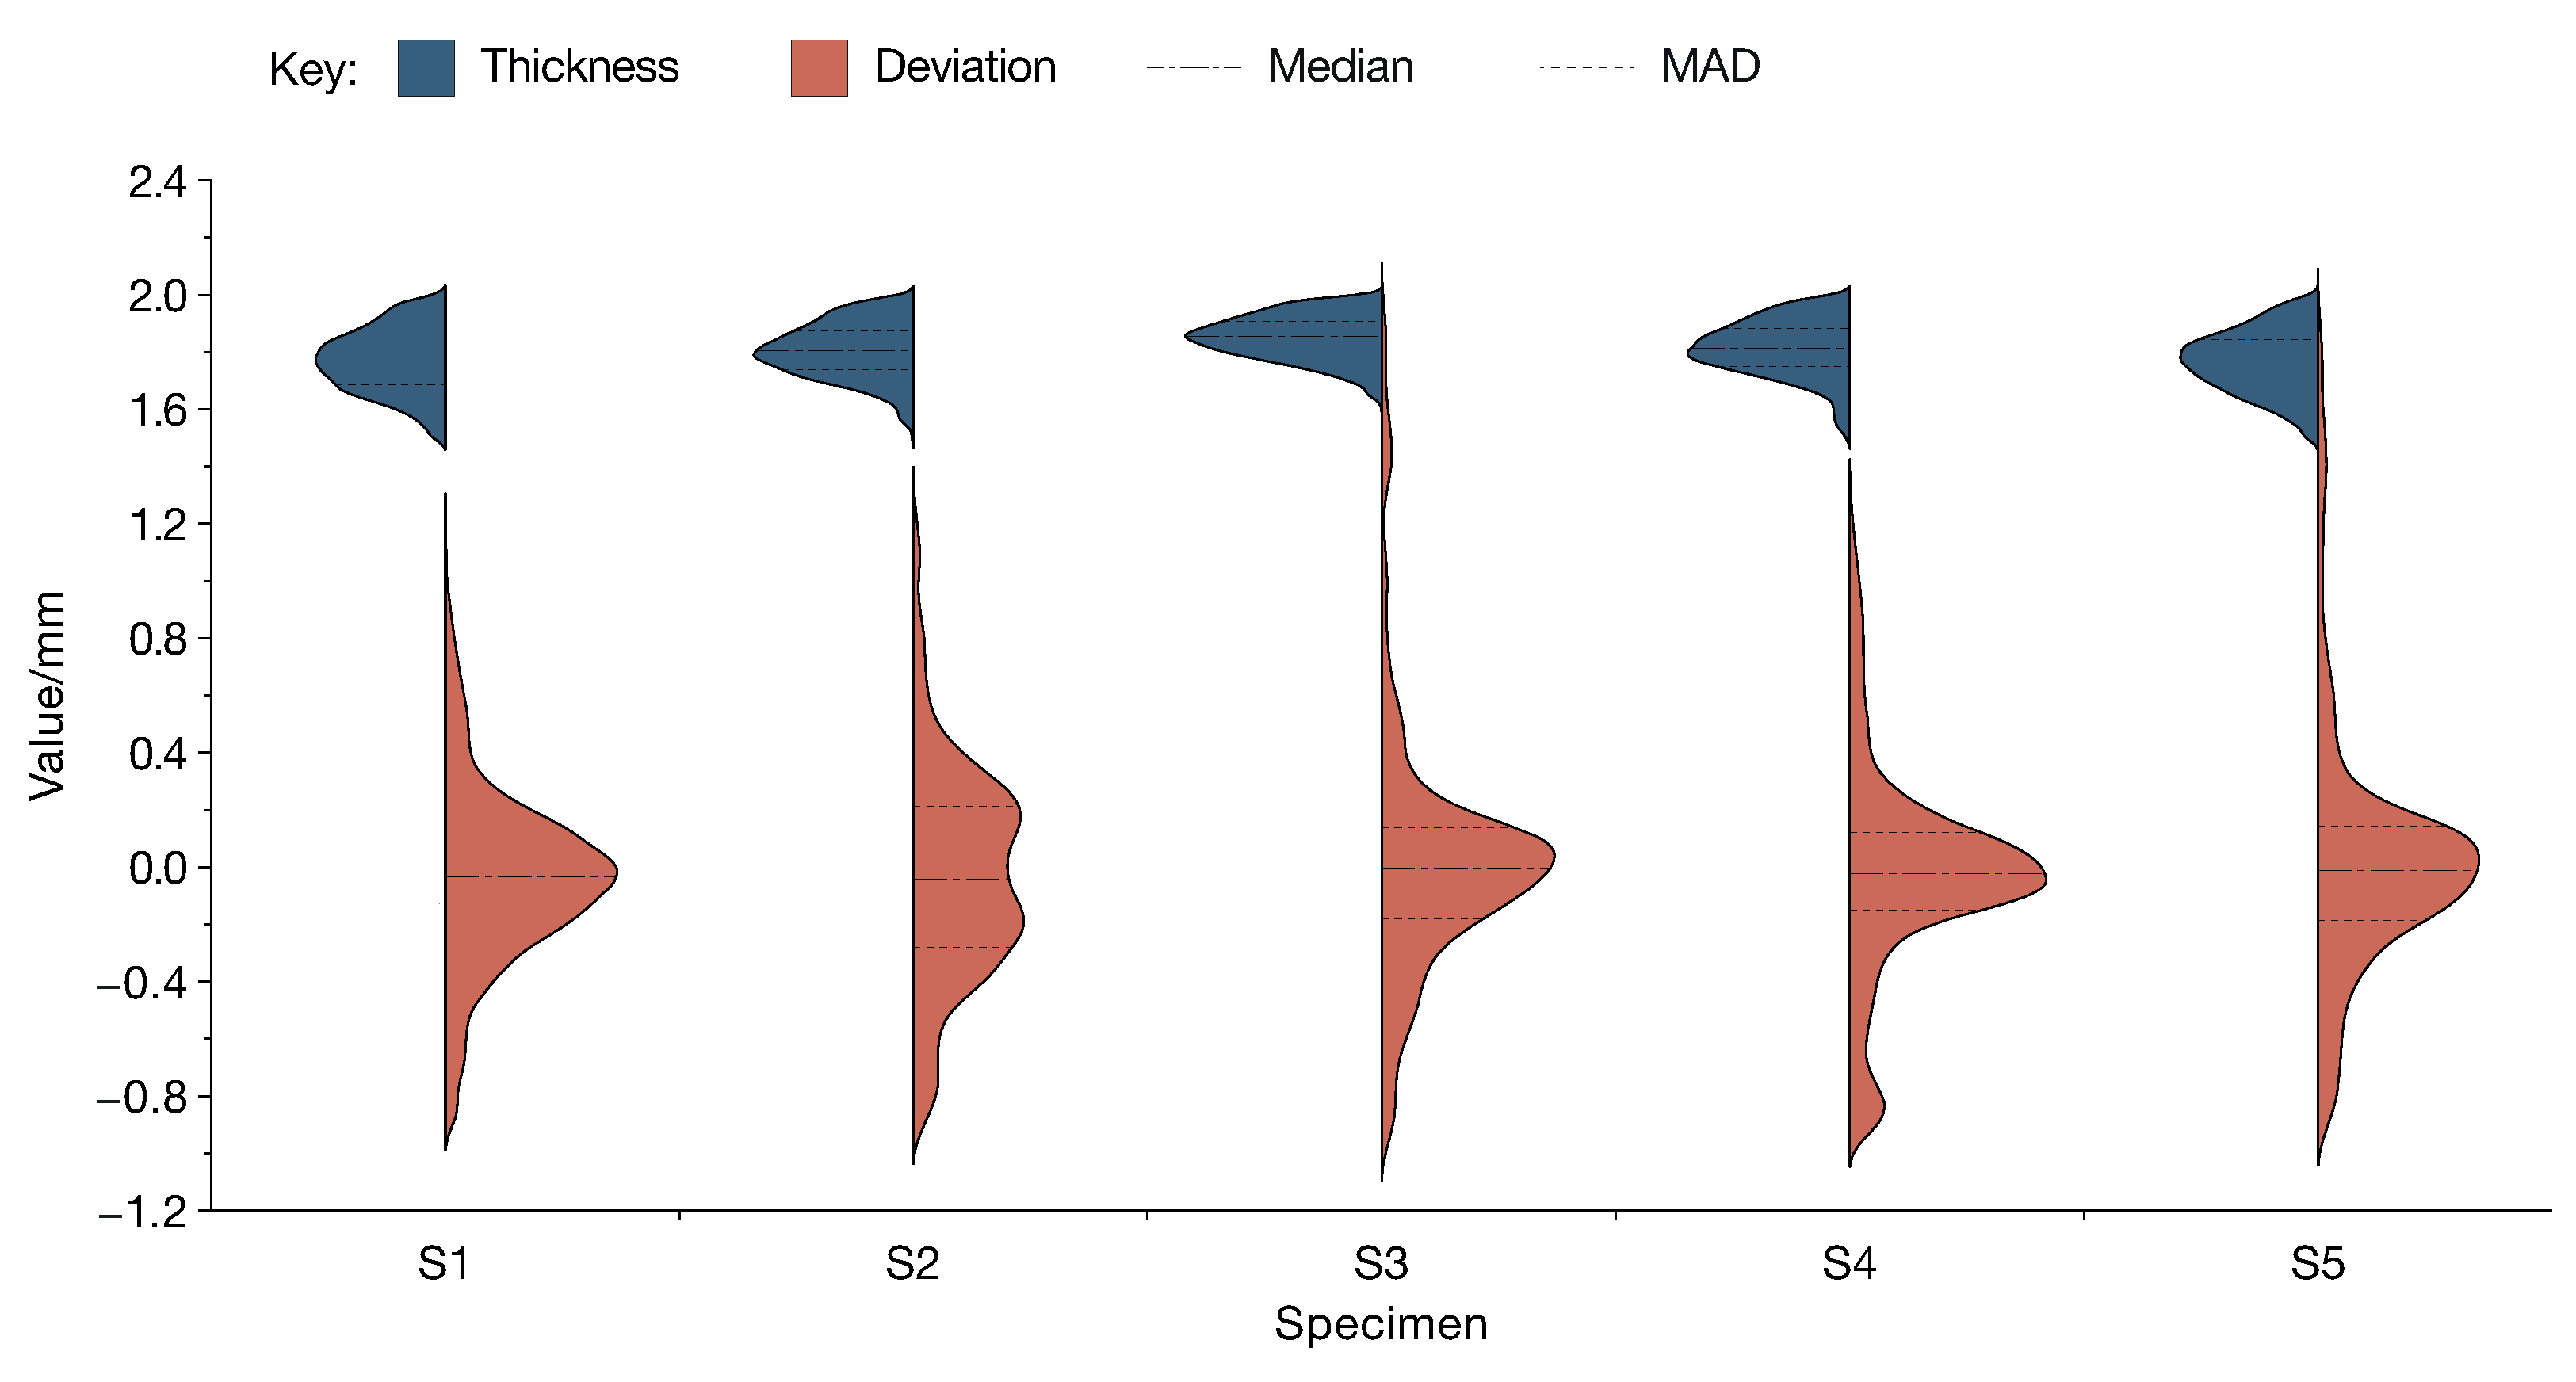
5.1. Thickness Analysis

The first step in the analysis was to measure the wall thickness of the samples. Given that the walls consisted of single overlapping tracks generating ideally flat parallel surfaces, thickness measurements were conducted using the Ray method. In this algorithm, a thickness range of 1.5 mm to 2.0 mm and a search angle of 10° were set, allowing the identification of the shortest distances between opposing surfaces for each surface point. The raw data obtained were processed in MATLAB R2023b by MathWorks (Natick, MA, USA) to calculate the median and MAD of the thickness values. These findings indicate a MAD close to 0.2   m m , which lies within the process tolerance. However, the deviation of the width on consecutive measurements across the height indicate that the thickness oscillates around a central value but with different trend line and magnitude each time. Moreover, this change in thickness is not always on the same side (positive or negative), indicating that the process mechanism is affected in a different way each time a process variable changes. These observations dictate a direct link between the measured width and the change in process variables since the boundary conditions has not changed throughout the experimental work. The consistency of wire diameter across its length and the simplified process mechanism that does not require an inert gas to carry on the raw material reduces the impact of external factor on the observed measurements, enabling the correlation of process parameters with the metrology outputs [50]. Therefore, to understand this effect, a statistical analysis was conducted. The data were analyzed using Python 3.11.2, employing the statsmodels package for statistical modeling (including linear models and ANOVA) and scipy.stats for computing F-distribution p-values. Data visualization was performed using the matplotlib and seaborn libraries. The statistical modeling was based on a Generalized Least Squares (GLS) framework with AR(1)-correlated errors, incorporating a fixed effect for the Specimen factor, continuous covariates (P, v, and WFR), and an autoregressive structure to account for the sequential nature of LBlks, as described in the methodology section. All confidence intervals were set at 95% (two-sided), and Type I SS were used for the tests. The results of the ANOVA for the median thickness are presented in Table 4.
All factors were statistically significant significance level (SL) of 5%, with a positive sequential trend indicated by the autocorrelation estimate ( 0.517 ), indicating a positive trend among sequential LBlks and confirming the importance of accounting for temporal correlation in the modeling approach. The deposition height is a very important process parameter since it determines the heat diffusion mechanism to the substrate as well as on the already built part, influencing the heat accumulation and the resulting bead shape [51]. This finding parallels the influence of P, W F R , and v on track width, as demonstrated by [52,53]. Regarding the thickness dispersion index (MAD), only the factors P and v were found to be statistically significant at an SL of 5%. The estimated autocorrelation coefficient indicates a positive correlation across sequential layers, suggesting that thickness irregularities tend to persist over consecutive LBlks during the manufacturing process.
The results for the median thickness of each LBlk are presented in Figure 10 as a bar chart, with the red lines indicating the mean values and the red whiskers representing the corresponding MAD values. It is interesting to observe that higher median thickness values are associated with lower dispersion, as seen in specimen S3. Conversely, as the median thickness decreases, the dispersion increases, resulting in specimens that are less consistent. This observation is further supported by the correlation analysis between the median thickness and the respective MAD for each LBlk across all measurements (total of 100 data points). The resulting ρ of 0.55 , with a significant p-value, indicates a negative relationship between the wall thickness and its uniformity within the specimen. Despite the statistically significant differences identified by the analyses, from a practical process perspective, all five strategies, though distinct, result in deviations within typical manufacturing tolerances and acceptable error margins (approximately one-tenth of a millimeter).

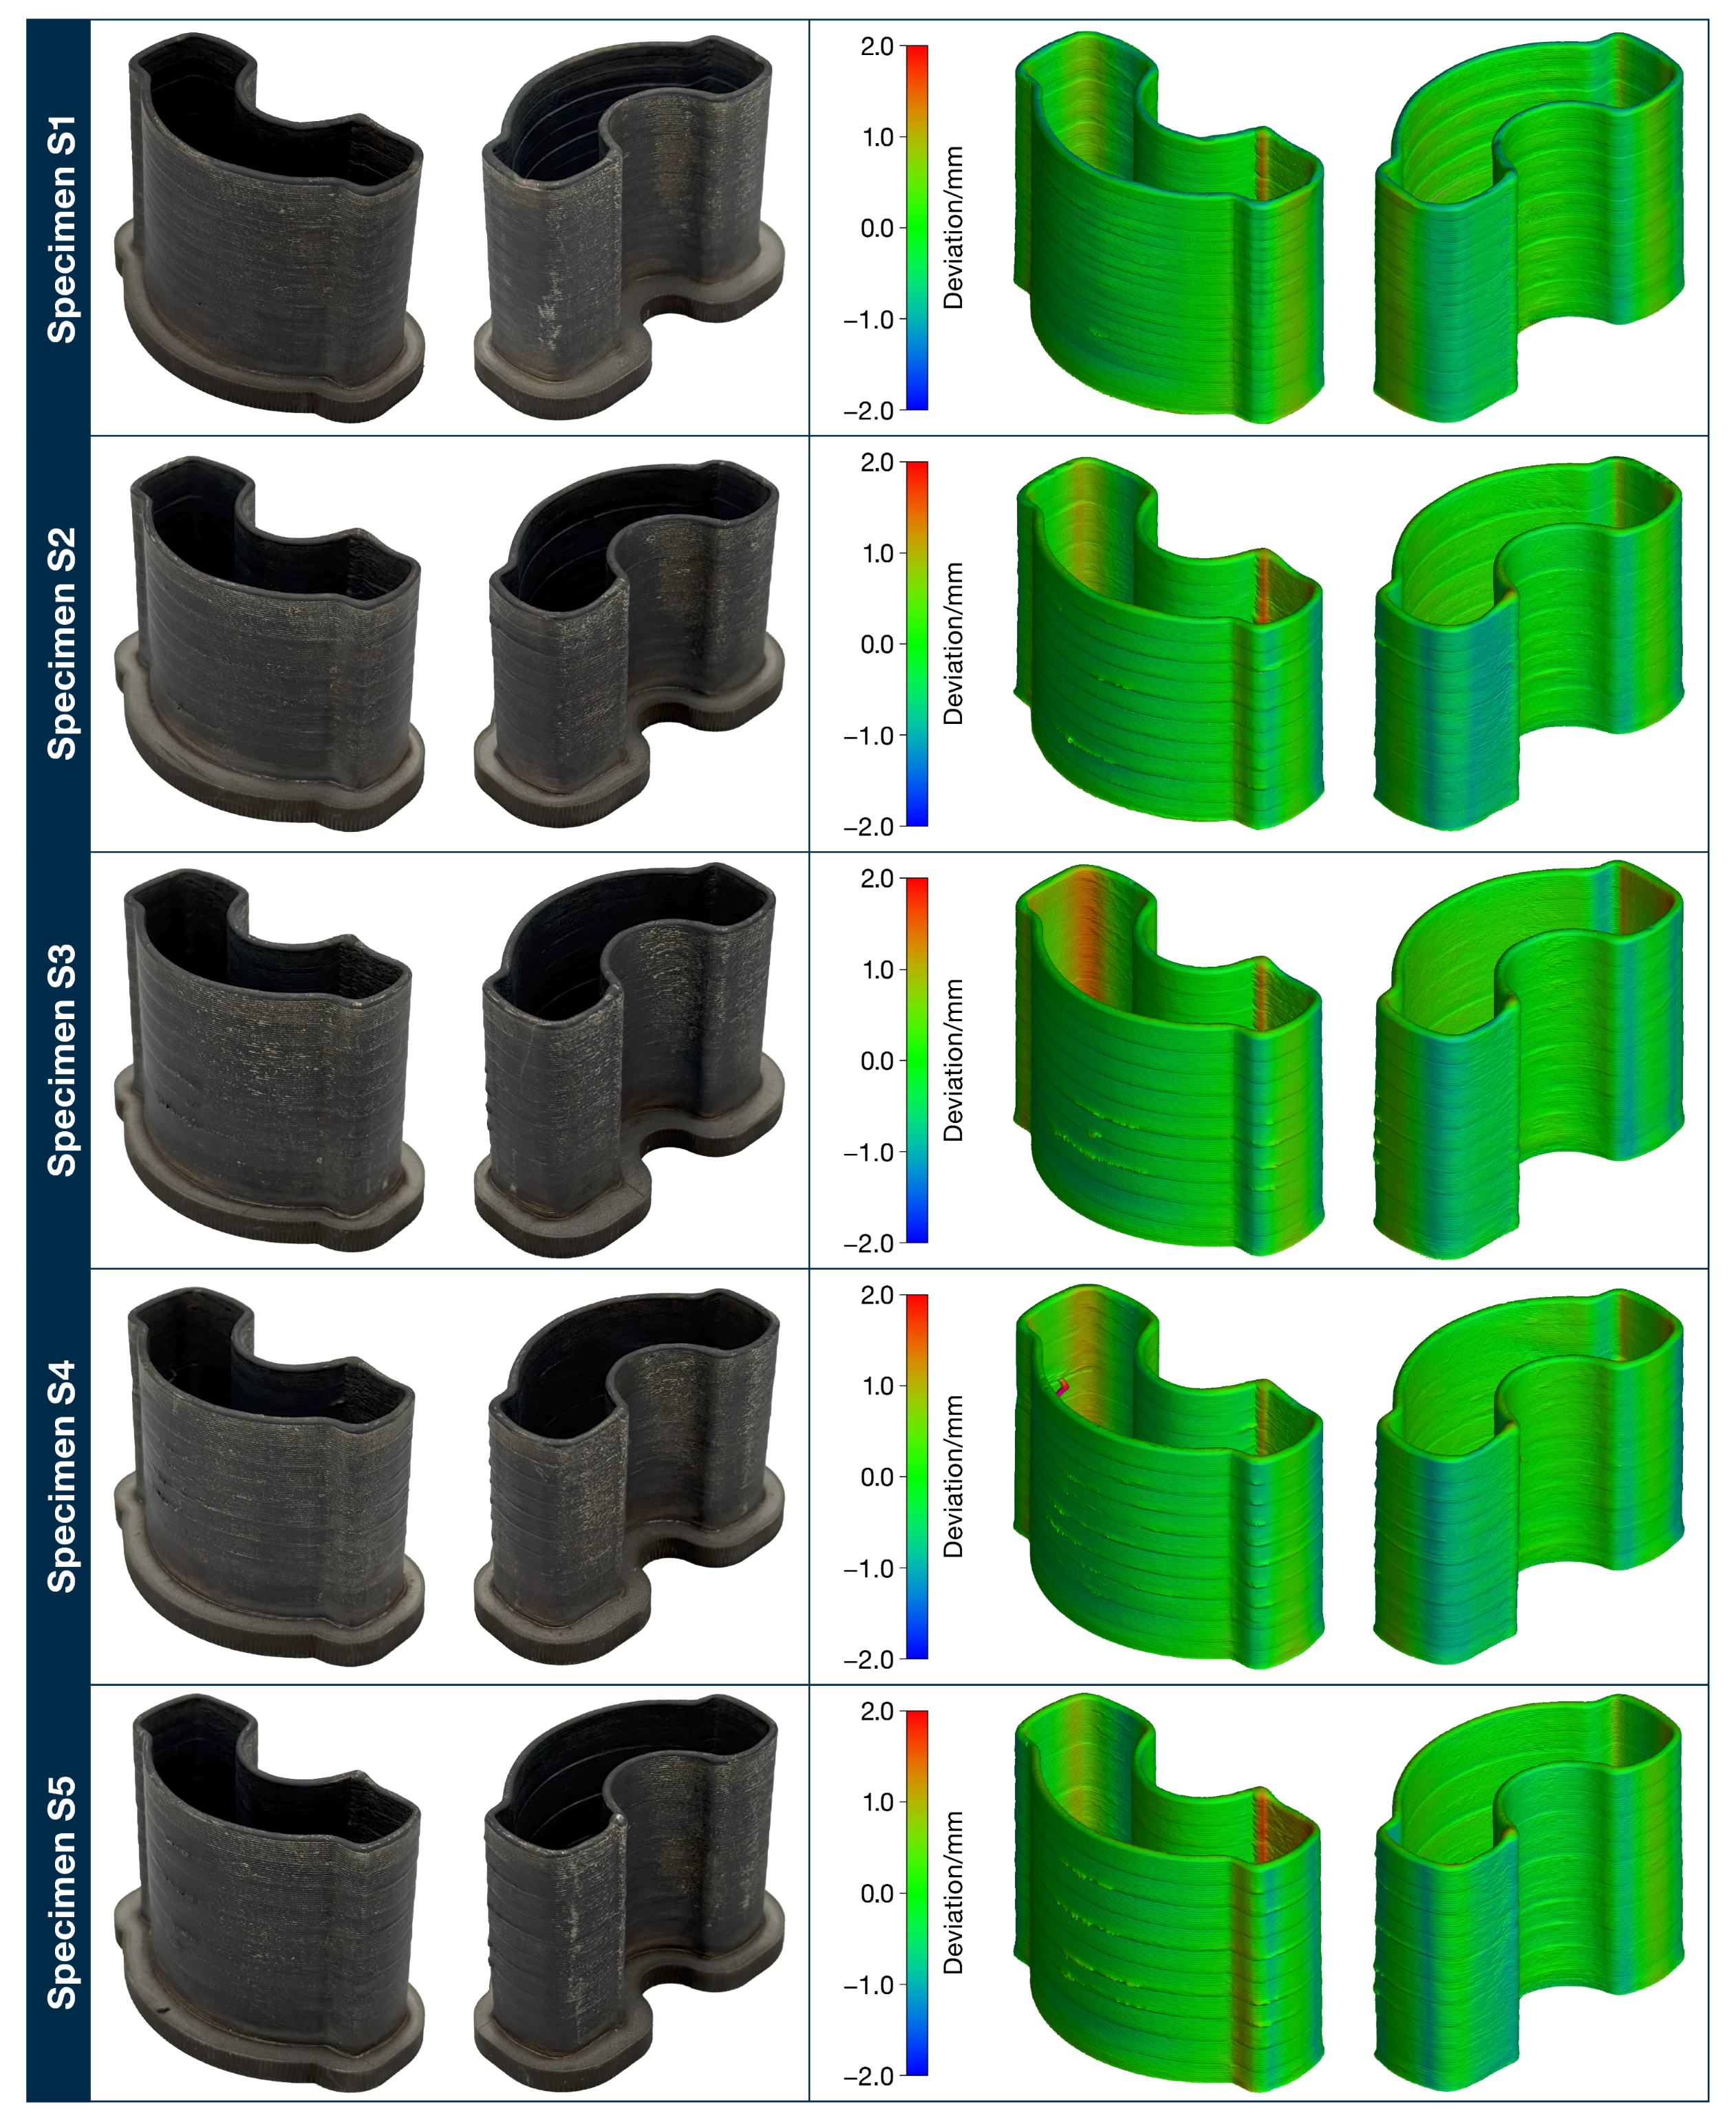
5.2. Surface Deviation Analysis

From the multiple comparison analyses conducted using Tukey’s method with a Type I error ( α ) of 5% for both the thickness medians and MADs, no similarities were observed among the specimens (strategies). This supported the decision to create a dedicated CAD model for each specimen, tailored to its specific mean median thickness. Each actual sample geometry acquired through CT scanning was aligned with the respective CAD model using a feature-based alignment method. After alignment, a Nominal/Actual Comparison was carried out. The results of the analysis are shown in Figure 11 in terms of the violin plots of the thickness and deviations calculated for each specimen.
The violin plots (Figure 11) offered a robust and intuitive visual representation of the data distribution for the different specimens. The median deviation provides a robust measure of central tendency, helping to identify systematic issues. The MAD of the deviations is used as an index of dispersion, indicating how far the surfaces deviate from the median. In particular, a higher MAD corresponded to a greater presence of defects, due to material shrinkage, dynamics of the robot, and material overlaps at the start and stop points of the deposition path. Overall, these results provided valuable information about the quality of the surfaces and of the deposition. Statistical analysis of the median deviations showed that only the factors v and WFR were statistically significant. The estimated autocorrelation coefficient was 0.194 , indicating a slight positive correlation among sequential LBlks. This suggests a moderate persistence of deviations across subsequent layers, potentially linked to cumulative process effects. A slight negative trend in surface dispersion was observed along the sequential LBlks. Only P, and marginally v, showed a significant effect, while overall dispersion remained stable across specimens and process conditions.
All specimens exhibited localized defects at the starting/ending points of the deposition paths, mainly due to material accumulation (see Figure 9), which is very common in robotized systems where the kinematic behavior of the head manipulator needs to be controlled in relation to the tool path positioning and the desired kinematic characteristics (speed, acceleration) [54]. S1 showed the most regular deposition, with minimal surface deviations. S2 presented prominent material build-ups at the third and seventh LBlks on the frontal side, and a lateral defect at the ninth LBlk. S3 exhibited visible defects particularly between the fourth and seventh LBlks. S4 displayed a major defect at the beginning of the sixth LBlk, where the deposition deviated significantly from the programmed path; this anomaly was treated as an outlier during data analysis. Additionally, S4 showed consistent surface irregularities across almost all LBlks, mainly on the frontal side, likely caused by material shrinkage during deposition pauses. Finally, although S5 exhibited marked defects at the fourth, fifth, seventh, and ninth LBlks, especially on the frontal and lateral sides, it achieved, after S1, the best overall surface quality, as confirmed by the violin plots (Figure 11).

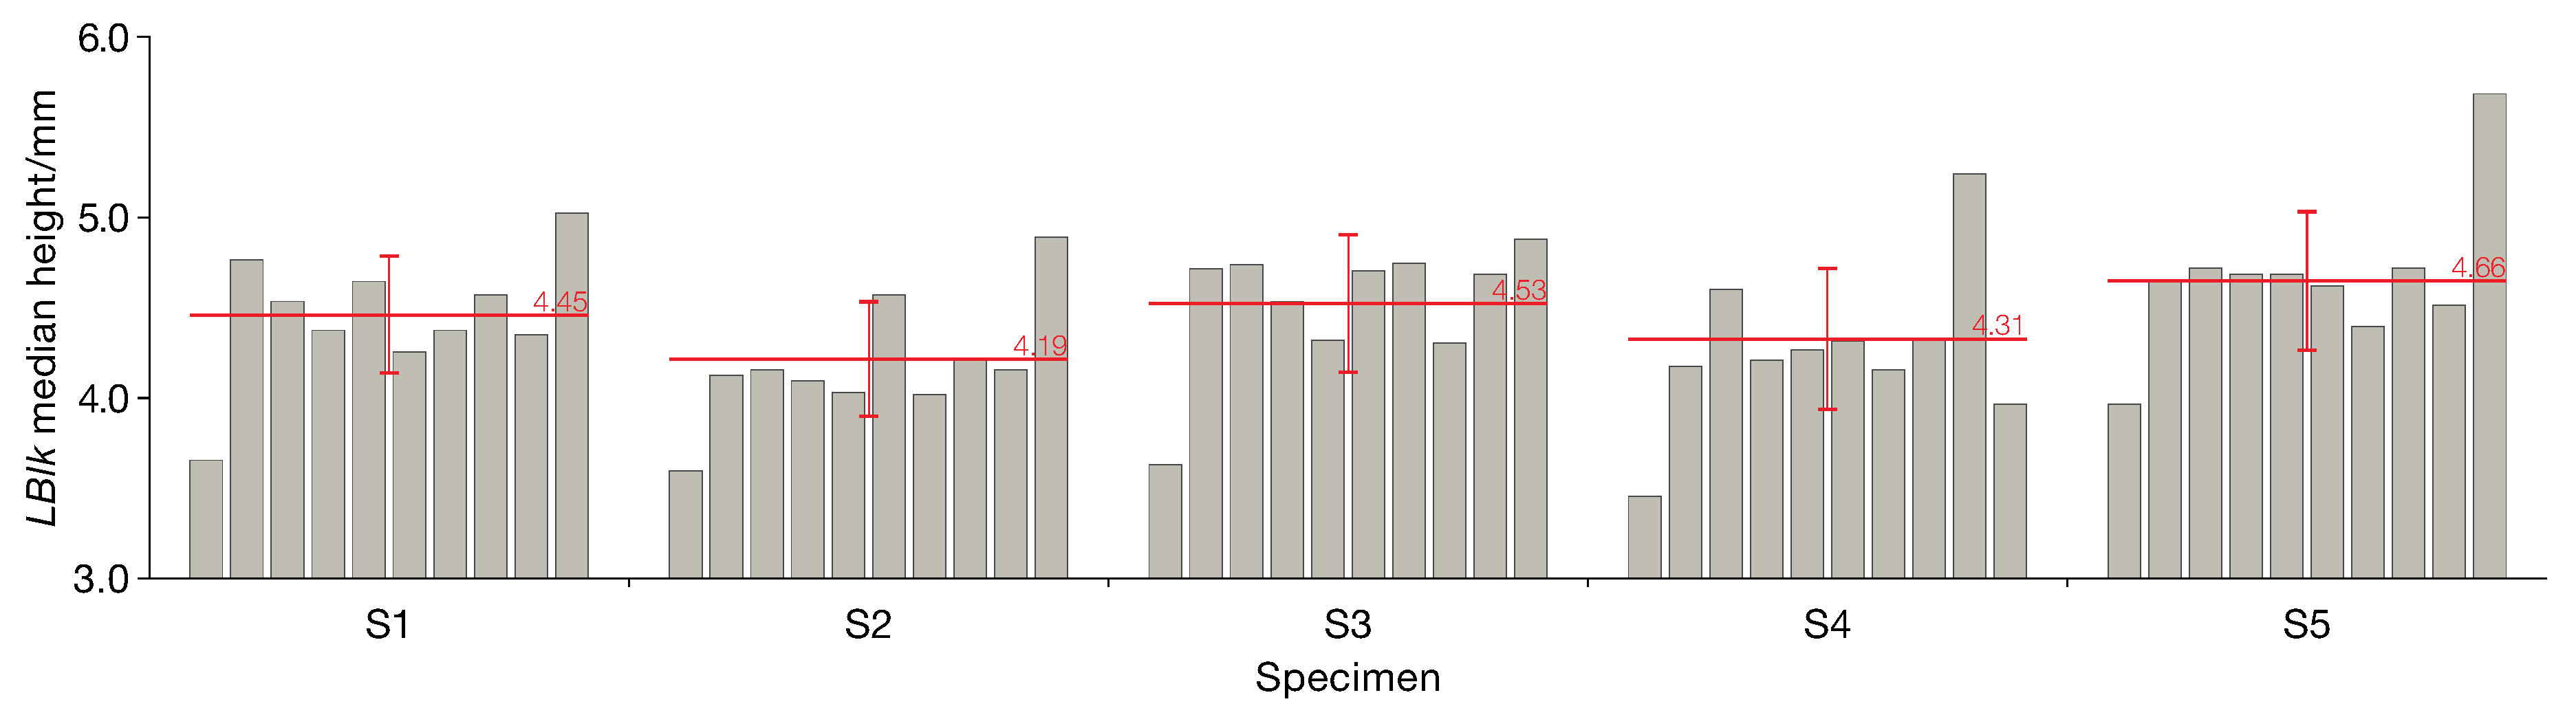
5.3. Height Analysis

The final analysis addressed the height of the LBlk. The height was measured as the distance between two planes parallel to the building direction, constructed respectively on the bottom surface of the 1st track and on the top surface of the 11th track of each LBlk. As shown in Table 5, all factors considered are statistically significant, confirming the substantial influence of both the process setting and the specimen-specific strategy on the evolution of the track height. This finding is in accordance with the literature, where the critical process parameters simultaneously affect the bead shape in both width and height as a result of the law of mass conservation and the effect of heat-affected zone temperature profile on the material viscosity [6]. The autoregressive coefficient ( 0.154 ) indicates a slight but consistent temporal correlation across successive LBlks.
However, this evaluation becomes more complex when dealing with geometries beyond simple single tracks. The bar chart for LBlk height, presented in Figure 12, provide further insights. The plot reveals that specimens S2 and S4 exhibit a lower average LBlk height response compared to the other specimens. This demonstrates that, despite the identification of systematic effects, the process remains stable within the selected parameter window. Although the height of each LBlk depends both on its sequence number and the adopted strategy, the overall growth appears quite uniform. In particular, the LBlk heights remain comparable within their respective error bands, even when varying the W F R by up to 20%. This suggests that within the chosen parameter range, the deposition remains stable despite potential inaccuracies in wire feeding, such as slipping, measurement errors, or wire inhomogeneity. In particular, in the case of wire DED-LB, the correct calculation of layer height is vital since, as presented in Section 1, the process stability is directly linked with the SoD parameter. Therefore, even a deviation of 0.02   m m per layer when maintained for each consecutive layer can lead to an out-of-stability process after 10 layers when the deviation would reach 1 / 3 of the SoD. The results indicate at first that the corrective actions that were performed during the process assisted to maintain a process within the stable window, enriching the process knowledge, while also detecting that the height oscillates around a value, indicating the simultaneous effect of laser power on both bead width and height. The latter statement consist a major outcome of this work.
To provide a broader perspective on the complexity of the process and its underlying phenomena, a special correlation matrix was developed (Figure 13). This matrix combines the lower triangle of the Pearson correlation ( ρ ) and the upper triangle of Spearman correlation ( r s ), offering a comprehensive view of both linear and monotonic relationships between key process parameters and responses [55,56]. The Pearson correlation evaluates the strength of a linear relationship between variables, making it suitable for continuous data where a linear trend is expected. On the other hand, the Spearman correlation assesses monotonic relationships by ranking the data, making it more robust to outliers and applicable to variables with non-linear trends. The analysis reveals several noteworthy relationships. A negative correlation ( ρ = 0.65 and r s = 0.62 ) was observed between P and thickness (MAD) in both Pearson and Spearman correlations, indicating that higher P levels significantly reduce variability in thickness. This finding suggests that increasing P improves deposition stability, leading to more consistent tracks. In contrast, a moderate positive correlation ( ρ = 0.57 ) between LBlk and thickness (MAD) indicates a monotonic relationship, where greater heights correspond to higher variability in thickness. This underscores the importance of controlling height growth to minimize inconsistencies in track formation. Interestingly, the Spearman correlation ( r s = 0.57 ) in the upper triangle further emphasizes this trend, as its rank-based nature reinforces the monotonic association. Additionally, a moderate positive correlation ( ρ = 0.48 and r s = 0.58 ) was observed between thickness (median) and deviations (median). This indicates that larger thicknesses are associated with greater deviations, underscoring the influence of geometry on process stability. While the Pearson correlation confirms this linear relationship, the Spearman correlation also captures the monotonic trends, illustrating the robustness of this dual representation. These results underline the intricate relationships between process parameters and part geometry, demonstrating that factors such as P and LBlk height play pivotal roles in determining both the stability and consistency of the deposited layers.
By observing these strategies, it can be found that irrespective of the initial P value, for a given number of layers, the P drops in order to counteract the accumulated heat within the part aiming to maintain a stable process across the height. The process stability at this level is defined as a process with predictable bead dimensions and without macroscale defects (cracks). However, from the findings of this work, it can be extracted that although some strategies can deliver parts with acceptable dimensional accuracy, the analysis of the LBlk demonstrate not consistent grow of part, followed by non-consistent bead width dimensions. This is directly linked with the modification of P, at intervals, where the process is not stabilized yet, directly affecting the penetration depth [57,58]. This issue is more obvious in cases where higher feed rate values are selected, since in this case, the bead quality is much more sensible to the heat input. Additionally, from the same findings, it is concluded that a P drop equal to 50 W , it is aggressive and can lead to unstable bead dimensions until the “thermal stability” is reached by keeping the same laser power for a number of subsequent layers. In the literature, there are few studies that discuss the effect of laser power parameter on process stability, demonstrating that automated in-line control adjusts the power level layer by layer less than 5% of the initial parameter. In that way, they do not impose significant change on the heat input to cause instability, but they reduce its intensity so as to control the bead dimensions and the temperature profile [59,60].
Overall, the thickness deviation lies within acceptable limits for all the experiments considering the case of post-processing that would be needed for improved surface quality as well as the process stability in multiwall or multi-layer parts, where even a very small error is accumulated. The immediate effect of P drop strategy on the process stability is considered the most valuable output of this work. Increased heat accumulation can lead to surface over-heat and re-melting and as such failed processes. These can be avoided by following control strategies that can be built around the control variable of P. Cooling time, on the other hand, does not have such a significant impact on the heat accumulation control since the heat loss due to heat transfer to the surroundings affects the melt pool in a much slower way than the laser power. In the current work, the latter statement relies on the evaluation of the results of the case of S2, where the deposition speed increases while keeping the same deposition length. Despite the fact that the cooling time in this case was elongated, the laser drop was the highest between all the specimens (950 W to 660 W). This demonstrates that the P value has a higher effect on the melt pool area growth than the cooling time. On top of that, this conclusion is also supported by the literature where various cooling time values have been tested towards the understanding of this parameter’s effect on the process stability [38]. Last but not least, the dimensional aspect is only one of the responses that characterize the quality, but it is the first important indicator for a stable process and later microstructure can be examined for the different set of parameters.
Finally, the importance of applying in line control agents is demonstrated by combing the outputs of height and thickness analysis which are presented in Figure 13. The findings point out that a different set of working parameters delivered stable processes. However, some of the combination may needed more careful examination with regard to the layer height that was initially selected. The calculation of layer height and the linked correction factor seems to be linked with the P, and as such, there should a unique value for each P level. The fact that when greater height is achieved, the variability in thickness also increases, as well as the fact that larger thicknesses are associated with greater deviations means that the melt pool shape is not predictable and controlled with the variation in specific parameters. The areas where these deviations have been observed are close to the substrate where the initial layers are formed and at the areas where the modification of P has been observed. In the case with combined drop of P value and drop of W F R , the influence of the part dimensions is observed some layer after the change, considering the inertia of the heat mechanism. From the present analysis, we observed not only the effect of P value on controlling the bead dimensions but also the significance of performing these activities after identifying the “thermal stability” of the process. The latter demonstrates a specific height (especially in thin walls) where the heat diffusion mechanism transforms from three-dimensional, considering heat loss to the substrate, to two-dimensional. The main heat transfer mechanism in this case includes the heat dissipation in height and length directions. Compared to other impractical control strategies where the cooling time is tuned so as to enable constant interlayer temperature, the process control through the reduction in laser power does not affect the process planning and the process duration while ensuring reduced thermal stresses, which could be linked with variable cooling time. Critical information for process control can be extracted from process modeling and monitoring capturing either the thermal field or the melt pool dimensions. This information can be extracted from process modeling and monitoring capturing either the thermal field or the melt pool dimensions. Summing up, this work demonstrates the need for in-line melt pool shape and quality characterization since these process responses can be linked with failed processes and unpredictable part quality if the error is accumulated. By employing process monitoring, the direct effect of standoff distance on the melt pool shape can be detected. This information cannot be found after the process by just measuring the part but should be detected within the process so as to capture progressive evolution.

6. Conclusions

This study used CT scans from a small number of thin-wall specimens to derive process knowledge about the influence of deposition parameters on cross-sectional stability and part height in the DED-LB process. The key findings are summarized as follows:
  • A clear relationship was identified between the laser power decay strategy and cross-sectional stability, offering insights into which levels of power reduction lead to process stability without compromising bead width.
  • The analysis of height response highlighted a direct correlation with bead width, underlining the importance of maintaining a continuous and consistent mass flow throughout the build.
  • It was observed that the process should first reach a plateau in heat accumulation, which corresponds to a shift in the heat diffusion mechanism from the substrate toward the deposited material. Only after this condition is met should the laser power be reduced. Otherwise, a premature drop in energy input may cause narrower and taller beads, increasing the risk of lack of fusion and cumulative geometric instability.
  • The investigation also defined the acceptable range of laser power reduction, identifying thresholds beyond which reduced heat input degrades process stability.
  • Although based on thin-wall geometries, the insights obtained are transferable to the deposition of solid parts. The effect of laser power on bead dimensions follows the same underlying thermal principles, even with different control strategies.
In future work, the samples are going to be investigated in terms of microstructure being compared with experiments where the laser power value remained constant throughout the build of the part. The developed datasets and knowledge will also be used to build data-driven control algorithms, achieving not only dimensional stability but also a constant microstructure across the entire part.

Author Contributions

Conceptualization, P.S., E.A. and A.S.; methodology, K.T. and A.N.P.; validation, A.N.P. and N.P.; formal analysis, A.S. and K.T.; investigation, A.N.P., N.P. and K.T.; resources, P.S.; writing—original draft preparation, A.N.P., N.P. and K.T.; writing—review and editing, P.S., E.A. and A.S.; visualization, A.S., A.N.P. and E.A.; supervision, P.S.; project administration, P.S. All authors have read and agreed to the published version of the manuscript.

Funding

This research received no external funding.

Data Availability Statement

Dataset available on request from the authors.

Acknowledgments

The authors would like to thank Luca Iuliano, coordinator of the Interdepartmental Centre for Integrated Additive Manufacturing (IAM@PoliTo) at the Politecnico di Torino, Torino, Italy, for his invaluable support. The authors also wish to thank Gianfranco Genta for his availability, assistance, and insightful suggestions in the fields of statistics and metrology.

Conflicts of Interest

The authors declare no conflicts of interest.

Abbreviations

The following abbreviations are used in this manuscript:
DED-LBLaser-Beam-Directed Energy Deposition
AMAdditive Manufacturing
CTComputed Tomography
ANOVAAnalysis of Variance
SMEsSmall–medium enterprises
3D CADThree-dimensional Computer-aided design
DEDDirected Energy Deposition
DfAMDesign for Additive Manufacturing
PBFPowder Bed Fusion
WAAMWire Arc DED
PPEPersonal Protective Equipment
HAZHeat affected zone
SoDstandoff distance
PLaser Power
CMMCoordinate-Measuring Machines
wire EDMWire Electrical Discharge Machining
FOVfield of view
KPIsKey performance indicators
L B l k Layers Block
vRobot scan speed
W F R Wire Feed Rate
MADMedian absolute deviation
S S Sum of Square
M S Mean Square
GLSGeneralized Least Squares
AR(1)Autoregressive model of order 1
SLSignificance level

References

  1. Porevopoulos, N.; Tzimanis, K.; Souflas, T.; Bikas, H.; Panagiotopoulou, V.C.; Stavropoulos, P. Decision support for repair with DED AM processes based on sustainability and techno-economical evaluation. Procedia CIRP 2024, 130, 9–14. [Google Scholar] [CrossRef]
  2. Saboori, A.; Aversa, A.; Marchese, G.; Biamino, S.; Lombardi, M.; Fino, P. Application of Directed Energy Deposition-Based Additive Manufacturing in Repair. Appl. Sci. 2019, 9, 3316. [Google Scholar] [CrossRef]
  3. Gardner Business Media, Inc. AM for Repair of Large Shafts. Additive Manufacturing by Gardner Business Media. 2025. Available online: https://www.additivemanufacturing.media/articles/video-am-for-repair-of-large-shafts (accessed on 17 June 2025).
  4. SmarTech Analysis. Industry Analysis, Market Forecasting and Data for the Additive Manufacturing Business; SmarTech Publishing: Charlottesville, VA, USA, 2024; Available online: https://www.smartechpublishing.com (accessed on 16 November 2024).
  5. Stavropoulos, P.; Bikas, H.; Souflas, T.; Tzimanis, K.; Papaioannou, C.; Porevopoulos, N. Additive Manufacturing in the Automotive Industry. In 3D Printing. Fundamentals to Emerging Applications; Gupta, R.K., Ed.; CRC Press: Boca Raton, FL, USA, 2023; pp. 453–470. [Google Scholar] [CrossRef]
  6. Surmen, H.; Ortes, F.; Arslan, Y.Z. Fundamentals of 3D Printing and Its Applications in Biomedical Engineering. In 3D Printing Applications in Biomedical Engineering; Springer: Singapore, 2020; pp. 23–41. [Google Scholar] [CrossRef]
  7. NASA. Principles of Directed Energy Deposition for Aerospace Applications. NASA Technical Reports Server. 2025. Available online: https://ntrs.nasa.gov/ (accessed on 17 June 2025).
  8. Stavropoulos, P. AM Applications. In Additive Manufacturing: Design, Processes and Applications; Springer International Publishing: Cham, Switzerland, 2023; pp. 95–121. [Google Scholar] [CrossRef]
  9. Stavropoulos, P.; Pastras, G.; Tzimanis, K.; Bourlesas, N. Addressing the challenge of process stability control in wire DED-LB/M process. CIRP Ann. 2024, 73, 129–132. [Google Scholar] [CrossRef]
  10. Bikas, H.; Stavropoulos, P.; Chryssolouris, G. Additive manufacturing methods and modelling approaches: A critical review. Int. J. Adv. Manuf. Technol. 2016, 83, 389–405. [Google Scholar] [CrossRef]
  11. Schmidt, M.; Merklein, M.; Bourell, D.; Dimitrov, D.; Hausotte, T.; Wegener, K.; Overmeyer, L.; Vollertsen, F.; Levy, G.N. Laser based additive manufacturing in industry and academia. CIRP Ann. 2017, 66, 561–583. [Google Scholar] [CrossRef]
  12. Associates, W. Wohlers Report 2023. Available online: https://wohlersassociates.com/product/wr2023/ (accessed on 24 September 2023).
  13. Holdings, D. The Leading Source of Industry Analysis, Market Forecasting and Data for the Additive Manufacturing Business. Available online: https://additivemanufacturingresearch.com/ (accessed on 6 December 2024).
  14. Digital Media Innovations, LLC. Hybrid Manufacturing Markets. GlobeNewswire by Notified. 2024. Available online: https://www.globenewswire.com/NewsRoom/AttachmentNg/bd835b5c-4818-4c99-ab1d-e2fa31d4b16b (accessed on 6 December 2024).
  15. Technologies, F. Printing and Certifying AM Propellers: The Future of Large Component Repair and Manufacture. 2024. Available online: https://www.faro.com/en/Resource-Library/Case-Study/printing-certifying-am-propellers-the-future-of-large-component-repair-manufacture (accessed on 8 March 2024).
  16. Additive Manufacturing Media. How Additive Manufacturing Plus Robotic Finishing Will Expand Capacity for Blade Repair. 2024. Available online: https://www.additivemanufacturing.media/articles/turbine-blade-mro-how-additive-manufacturing-plus-robot-finishing-will-scale-repair (accessed on 24 March 2024).
  17. Stavropoulos, P.; Bikas, H.; Tzimanis, K.; Porevopoulos, N.; Pilagatti, A.N.; Atzeni, E.; Iuliano, L.; Salmi, A. Process window development of DED-LB/M process with coaxial wire for stainless steel AISI 316L. Int. J. Exp. Des. Process Optim. 2024, 7, 1–26. [Google Scholar] [CrossRef]
  18. Rey, P.; Prieto, C.; González, C.; Tzimanis, K.; Souflas, T.; Stavropoulos, P.; Rathore, J.S.; Bergeaud, V.; Vienne, C.; Bredif, P. Data analysis to assess part quality in DED-LB/M based on in-situ process monitoring. Procedia CIRP 2022, 111, 345–350. [Google Scholar] [CrossRef]
  19. Thompson, M.K.; Moroni, G.; Vaneker, T.; Fadel, G.; Campbell, R.I.; Gibson, I.; Bernard, A.; Schulz, J.; Graf, P.; Ahuja, B.; et al. Design for Additive Manufacturing: Trends, opportunities, considerations, and constraints. CIRP Ann. 2016, 65, 737–760. [Google Scholar] [CrossRef]
  20. Liao, S.; Jeong, J.; Zha, R.; Xue, T.; Cao, J. Simulation-guided feedforward-feedback control of melt pool temperature in directed energy deposition. CIRP Ann. 2023, 72, 157–160. [Google Scholar] [CrossRef]
  21. Hirono, Y.; Mori, T.; Sugimoto, S.; Miyata, Y. Investigation on influence of thermal history on quality of workpiece created by directed energy deposition. CIRP Ann. 2024, 73, 133–136. [Google Scholar] [CrossRef]
  22. Stavropoulos, P.; Pastras, G.; Souflas, T.; Tzimanis, K.; Bikas, H. A Computationally Efficient Multi-Scale Thermal Modelling Approach for PBF-LB/M Based on the Enthalpy Method. Metals 2022, 12, 1853. [Google Scholar] [CrossRef]
  23. Gapinski, B.; Janicki, P.; Marciniak-Podsadna, L.; Jakubowicz, M. Application of the Computed Tomography to Control Parts Made on Additive Manufacturing Process. Procedia Eng. 2016, 149, 105–121. [Google Scholar] [CrossRef]
  24. Piscopo, G.; Salmi, A.; Atzeni, E. Investigation of dimensional and geometrical tolerances of laser powder directed energy deposition process. Precis. Eng. 2024, 85, 217–225. [Google Scholar] [CrossRef]
  25. Jardon, Z.; Ertveldt, J.; Hinderdael, M.; Guillaume, P. Process parameter study for enhancement of directed energy deposition powder efficiency based on single-track geometry evaluation. J. Laser Appl. 2021, 33, 042023. [Google Scholar] [CrossRef]
  26. Savio, E.; De Chiffre, L.; Schmitt, R. Metrology of freeform shaped parts. CIRP Ann. 2007, 56, 810–835. [Google Scholar] [CrossRef]
  27. Mueller, K.; Xu, F.; Neophytou, N. Why do commodity graphics hardware boards (GPUs) work so well for acceleration of computed tomography? In Computational Imaging V; Bouman, C.A., Miller, E.L., Pollak, I., Eds.; International Society for Optics and Photonics, SPIE: San Jose, CA, USA, 2007; Volume 6498, pp. 183–194. [Google Scholar] [CrossRef]
  28. Kruth, J.; Bartscher, M.; Carmignato, S.; Schmitt, R.; De Chiffre, L.; Weckenmann, A. Computed tomography for dimensional metrology. CIRP Ann. 2011, 60, 821–842. [Google Scholar] [CrossRef]
  29. Acko, B. Calibration of measuring instruments on a coordinate measuring machine. Adv. Prod. Eng. Manag. 2007, 2, 4–127. [Google Scholar]
  30. Trapet, E.; Savio, E.; De Chiffre, L. New advances in traceability of CMMs for almost the entire range of industrial dimensional metrology needs. CIRP Ann. 2004, 53, 433–438. [Google Scholar] [CrossRef]
  31. Rocchini, C.; Cignoni, P.; Montani, C.; Pingi, P.; Scopigno, R. A low cost 3D scanner based on structured light. Comput. Graph. Forum 2001, 20, 299–308. [Google Scholar] [CrossRef]
  32. Withers, P.J.; Bouman, C.; Carmignato, S.; Cnudde, V.; Grimaldi, D.; Hagen, C.K.; Maire, E.; Manley, M.; Du Plessis, A.; Stock, S.R. X-ray computed tomography. Nat. Rev. Methods Prim. 2021, 1, 18. [Google Scholar] [CrossRef]
  33. Calaon, M.; Yeh, H.P.; Shan, S.; Hattel, J.H.; Zhang, Y.; Hansen, H.N. Advancing quality prediction in polymer PBF-LB: A hybrid AI and physics-guided approach. CIRP Ann. 2025. [Google Scholar] [CrossRef]
  34. Stavropoulos, P.; Alexopoulos, K.; Makris, S.; Papacharalampopoulos, A.; Dhondt, S.; Chryssolouris, G. AI in manufacturing and the role of humans: Processes, robots, and systems. In Handbook of Artificial Intelligence at Work; Edward Elgar Publishing: Cheltenham, UK, 2024; pp. 119–141. [Google Scholar] [CrossRef]
  35. Gao, R.X.; Krüger, J.; Merklein, M.; Möhring, H.C.; Váncza, J. Artificial Intelligence in manufacturing: State of the art, perspectives, and future directions. CIRP Ann. 2024, 73, 723–749. [Google Scholar] [CrossRef]
  36. Zhou, H.; Yang, Y.; Han, C.; Wei, Y.; Liu, Z.; Tai, Z.; Zhang, S.; Wang, D. Laser directed energy deposition/milling hybrid additive manufacturing of thin-walled GH4169 alloy: Effect of processing strategy on its microstructure and mechanical properties. Mater. Sci. Eng. A 2023, 882, 145480. [Google Scholar] [CrossRef]
  37. Gudur, S.; Shukla, S.; John Rozario Jegaraj, J.; Mastanaiah, P.; Gopinath, M.; Simhambhatla, S. Controlling Waviness in Additive Manufacturing of Thin Walls by Laser-Directed Energy Deposition Process; Springer Nature Singapore: Singapore, 2023; pp. 81–90. [Google Scholar] [CrossRef]
  38. Bourlesas, N.; Tzimanis, K.; Sabatakakis, K.; Bikas, H.; Stavropoulos, P. Over-deposition assessment of Direct Energy Deposition (DED) using melt pool geometric features and Machine Learning. Procedia CIRP 2024, 124, 797–802. [Google Scholar] [CrossRef]
  39. Ben Hammouda, A.; Mrad, H.; Marouani, H.; Frikha, A.; Belem, T. Process Optimization and Distortion Prediction in Directed Energy Deposition. J. Manuf. Mater. Process. 2024, 8, 116. [Google Scholar] [CrossRef]
  40. Ng, A.; Ma, T. Stanford University CS229 Lecture Notes. Available online: https://cs229.stanford.edu/main_notes.pdf (accessed on 1 July 2025).
  41. Hoaglin, D.; Mosteller, F.; Tukey, J. Understanding Robust and Exploratory Data Analysis; Wiley: New York, NY, USA, 1983. [Google Scholar]
  42. Bambach, M.; Sideris, I.; Fabbri, M.; Wegener, K. Faster than real-time path-sensitive temperature modeling of wire-arc additive manufacturing by a data-driven finite volume method. CIRP Ann. 2022, 71, 189–192. [Google Scholar] [CrossRef]
  43. Vafadar, A.; Guzzomi, F.; Rassau, A.; Hayward, K. Advances in Metal Additive Manufacturing: A Review of Common Processes, Industrial Applications, and Current Challenges. Appl. Sci. 2021, 11, 1213. [Google Scholar] [CrossRef]
  44. Wits, W.W.; Carmignato, S.; Zanini, F.; Vaneker, T.H. Porosity testing methods for the quality assessment of selective laser melted parts. CIRP Ann. 2016, 65, 201–204. [Google Scholar] [CrossRef]
  45. Yao, M.; Kong, F. A review on laser cladding with wire feeding: Process fundamentals, theoretical analyses, online monitoring, and quality controls. Int. J. Adv. Manuf. Technol. 2025, 137, 4209–4242. [Google Scholar] [CrossRef]
  46. Genta, G.; Maculotti, G. Thin coatings thickness measurement by augmented nanoindentation data fusion. CIRP Ann. 2024, 73, 409–412. [Google Scholar] [CrossRef]
  47. Reinhart, C.; Weg, W. Industrial Computer Tomography: A Universal Inspection Tool. In Proceedings of the Industrial Computed Tomography Conference, Shanghai, China, 25–28 October 2008. [Google Scholar]
  48. Villarraga Gómez, H. Studies of Dimensional Metrology with X-ray CAT Scan. Ph.D. Thesis, University of North Carolina at Charlotte, Charlotte, NC, USA, 2018. [Google Scholar]
  49. Roberts, M.; Xia, M.; Kennedy, A. Data-driven Process Parameter Optimisation for Laser Wire Metal Additive Manufacturing. In Proceedings of the 2022 27th International Conference on Automation and Computing (ICAC), Bristol, UK, 1–3 September 2022. [Google Scholar] [CrossRef]
  50. Mirkoohi, E.; Li, D.; Garmestani, H.; Liang, S.Y. Residual Stress Modeling Considering Microstructure Evolution in Metal Additive Manufacturing. J. Manuf. Process. 2021, 68, 383–397. [Google Scholar] [CrossRef]
  51. Jamnikar, N.; Liu, S.; Brice, C.; Zhang, X. Comprehensive Molten Pool Condition-Process Relations Modeling Using CNN for Wire-Feed Laser Additive Manufacturing. J. Manuf. Process. 2023, 98, 42–53. [Google Scholar] [CrossRef]
  52. Piscopo, G.; Atzeni, E.; Salmi, A.; Iuliano, L.; Gatto, A.; Marchiandi, G.; Balestrucci, A. Mesoscale modelling of laser powder-based directed energy deposition process. Procedia CIRP 2020, 88, 393–398. [Google Scholar] [CrossRef]
  53. Guan, X.; Zhao, Y.F. Modeling of the laser powder–based directed energy deposition process for additive manufacturing: A review. Int. J. Adv. Manuf. Technol. 2020, 107, 1959–1982. [Google Scholar] [CrossRef]
  54. Zapata, A.; Benda, A.; Spreitler, M.; Zhao, X.F.; Bernauer, C.; Yoshioka, H.; Zaeh, M.F. A Model-Based Approach to Reduce Kinematics-Related Overfill in Robot-Guided Laser Directed Energy Deposition. CIRP J. Manuf. Sci. Technol. 2023, 45, 200–209. [Google Scholar] [CrossRef]
  55. Verna, E.; Puttero, S.; Genta, G.; Galetto, M. Toward a concept of digital twin for monitoring assembly and disassembly processes. Qual. Eng. 2023, 36, 453–470. [Google Scholar] [CrossRef]
  56. Rossi Sebastiano, A.; Poles, K.; Gualtiero, S.; Romeo, M.; Galigani, M.; Bruno, V.; Fossataro, C.; Garbarini, F. Balancing the Senses: Electrophysiological Responses Reveal the Interplay between Somatosensory and Visual Processing During Body-Related Multisensory Conflict. J. Neurosci. 2024, 44, e1397232024. [Google Scholar] [CrossRef]
  57. Javidrad, H.; Aydin, H.; Karakaş, B.; Alptekin, S.; Kahraman, A.S.; Koc, B. Process Parameter Optimization for Laser Powder Directed Energy Deposition of Inconel 738LC. Opt. Laser Technol. 2024, 176, 110940. [Google Scholar] [CrossRef]
  58. Svetlizky, D.; Zheng, B.; Steinberg, D.M.; Schoenung, J.M.; Lavernia, E.J.; Eliaz, N. The Influence of Laser Directed Energy Deposition (DED) Processing Parameters for Al5083 Studied by Central Composite Design. J. Mater. Res. Technol. 2022, 17, 3157–3171. [Google Scholar] [CrossRef]
  59. Gibson, B.T.; Bandari, Y.K.; Richardson, B.S.; Roschli, A.C.; Post, B.K.; Borish, M.C.; Thornton, A.; Henry, W.C.; Lamsey, M.; Love, L.J. Melt Pool Monitoring for Control and Data Analytics in Large-Scale Metal Additive Manufacturing. In Proceedings of the International Solid Freeform Fabrication Symposium (SFF 2019), Austin, TX, USA, 12–14 August 2019; pp. 1–19. [Google Scholar]
  60. Liu, Y.; Wang, L.; Brandt, M. Model Predictive Control of Laser Metal Deposition. Int. J. Adv. Manuf. Technol. 2019, 105, 1055–1067. [Google Scholar] [CrossRef]
Figure 1. Positioning and forecast of DED processes in the hybrid manufacturing market [14].
Jmmp 09 00230 g001
Figure 2. Subfigures (ac) illustrate the interaction between laser, wire, and substrate under different SoD conditions: (a) reduced SoD, (b) correct SoD, and (c) increased SoD. Subfigures (df) show the resulting deposition outcomes corresponding to those conditions: (d) over-deposition, (e) stable deposition, and (f) balling effect (adapted from Stavropoulos et al. [17]).
Jmmp 09 00230 g002
Figure 3. Process window development workflow. The parameters for the single tracks were identified in a previous study by Stavropoulos et al. [17].
Jmmp 09 00230 g003
Figure 4. Wire DED-LB-robotized system and monitoring devices.
Jmmp 09 00230 g004
Figure 5. (a) Load cell signal during the part building and (b) load cell signal variation when balling occurs. Effect of melt pool quality on vision camera signal: (c) over deposition, (d) stable increase in height, (e) balling under deposition.
Jmmp 09 00230 g005
Figure 6. Surface re-melting in the DED process, illustrating the waviness error on the deposited surfaces with overall dimensions (120 × 50 × 20) mm3 [37].
Jmmp 09 00230 g006
Figure 7. Evolution of melt pool with increasing number of layers (Constant P 750 W).
Jmmp 09 00230 g007
Figure 8. Thin-wall geometry with annotated dimensions, highlighting the starting point and path direction (red arrow).
Jmmp 09 00230 g008
Figure 9. Final builds of the specimens corresponding to the experimental parameters in Table 2, separated from the platforms using wire EDM. The right panel shows the Nominal/Actual Comparison analysis of surface deviations obtained using VGSTUDIO.
Jmmp 09 00230 g009
Figure 10. Bar chart of median thickness values for each LBlk. The standard deviation within each LBlk is approximately 0.05 mm. The red line indicates the overall mean, and the red whiskers represent the MAD values.
Jmmp 09 00230 g010
Figure 11. Overlapped split violin plots of thickness (in blue) and deviations (in red).
Jmmp 09 00230 g011
Figure 12. Bar chart of LBlk height values, with red lines indicating the mean heights and red whiskers representing the corresponding MAD values. The standard deviation within each LBlk is approximately 0.1 mm, reflecting the typical variability of the process.
Jmmp 09 00230 g012
Figure 13. Combined Spearman (upper) and Pearson (lower) correlation matrix.
Jmmp 09 00230 g013
Table 1. Overview of inspection systems for DED components.
Inspection SystemAdvantagesLimitationsReferences
Contact SystemsHigh accuracy for accessible and regular surfacesLimited by surface roughness and difficulty in accessing complex geometries[30]
3D Vision/Scanning SystemsWell-suited for freeform surfaces, fast acquisition timesChallenges with internal features, shadowed areas, and reflective surfaces[26,31]
X-ray CTComprehensive inspection of internal and external surfaces, with material structure analysisLong acquisition times, and higher costs[32,33]
Table 2. Experimental set-up.
SpecimenLBlkP/Wv/(mm·s−1) WFR /(mm·s−1)
S118001110
27501110
37001110
47001110
56501110
66501110
76201110
86201110
96201110
106201110
S2195013.111.9
285013.111.9
385013.111.3
480013.111.3
575013.111.3
675013.111.3
770013.111.3
870013.111.3
966013.111.3
1066013.111.3
S319001111
28501111
37751111
47001111
57201111
67201111
77201111
87201111
97201111
107001111
S4190012.411.3
285012.411.3
377512.411.3
475012.411.3
570012.411.3
665012.411.3
765012.411.3
865012.411.3
967012.411.3
1067012.411.3
S5195013.113.1
290013.113.1
385013.113.1
480013.113.1
580013.112.5
675013.112.5
770013.112
867013.112
967013.112
1067013.112
Table 3. Set-up and parameters values used during CT scan.
CT ParameterValue
Voltage, V/ k V 200
Current, I/ μ A 140
Filter0.5 mm of Sn
Timing/ms333
Averaging3
Skip frames2
Table 4. ANOVA for thickness/ m m (median).
SourcedfContribution/%SSMSFp-Value/%
Specimen416.810.4340.1096.410.01
P12.710.0700.0704.124.53
v18.330.2150.21512.650.06
WFR110.110.2610.26115.350.02
Error9264.901.6020.017
Total99100.002.582
Table 5. ANOVA for LBlk height/ m m .
SourcedfContribution/%SSMSFp-Value/%
Specimen40.160.0300.0086.09<0.01
P122.614.2724.27232.12<0.01
v16.511.2301.2309.250.31
WFR15.831.1011.1018.280.49
Error9264.9012.2620.133
Total99100.0018.895
Disclaimer/Publisher’s Note: The statements, opinions and data contained in all publications are solely those of the individual author(s) and contributor(s) and not of MDPI and/or the editor(s). MDPI and/or the editor(s) disclaim responsibility for any injury to people or property resulting from any ideas, methods, instructions or products referred to in the content.

