1. Introduction
Manufacturers are under increasing pressure to remain competitive in today’s fast-changing global economy while navigating the challenges of mass customisation, rising operating costs, and growing sustainability expectations [
1]. In the UK alone, manufacturing accounted for approximately 34% of the nation’s total final energy consumption in 2022 [
2], with the sector contributing an estimated 60 million metric tonnes of carbon dioxide emissions [
3]. These figures underscore the pressing need for manufacturers to adopt innovations that not only boost productivity but also enhance energy efficiency and mitigate environmental impacts.
To adopt these changes, Industry 4.0 presents a transformative paradigm in which data analytics, the Internet of Things (IoT), and artificial intelligence (AI) form the basis for smarter, more efficient industrial processes. Small to medium-sized businesses (SMEs) have failed to implement these technologies due to limited technical resources, infrastructural expenses, and organisational inertia, even when big manufacturers are using them to achieve notable results. When used appropriately, however, these technologies enable SMEs to automate decision-making, reduce energy consumption, enhance product quality, and increase their overall equipment effectiveness (OEE). Studies imply that such implementation could result in 10–30% decreases in quality management, logistics, and manufacturing costs [
4].
A key enabler of this transition is artificial intelligence, particularly machine learning (ML), which supports anomaly detection, predictive maintenance (PdM), and the optimisation of production processes. Despite its promise, the widespread adoption of ML-based solutions in SME environments remains hampered by technical complexities, data integration challenges, and cost barriers [
5]. Recent advances in embedded machine learning, especially TinyML, offer a promising avenue for overcoming these obstacles by enabling lightweight, edge-based analytics on affordable hardware [
5]. In this work, we present a practical, deployable solution that integrates TinyML, non-invasive current sensors, and edge devices (e.g., Raspberry Pi) to monitor and optimise machine utilisation in SME manufacturing environments. The system automatically classifies machine states off, idling, and working) using an unsupervised Gaussian mixture model (GMM) applied to real-time electrical current data, and further segments operational periods into discrete production events.
Unlike conventional SCADA- or PLC-based solutions, our system leverages low-cost, non-invasive sensing and unsupervised learning to deliver real-time machine utilisation analytics without requiring labelled data, proprietary hardware, or complex system integration. Furthermore, by integrating energy analytics directly with machine state classification and production event detection, our approach provides a unified, scalable framework that extends beyond monitoring to actionable operational optimisation, particularly tailored for the needs and constraints of SMEs. Our approach enables manufacturers to compute OEE and related lean metrics such as the cycle time and machine availability while also estimating energy usage and costs using time-of-use tariffs. Importantly, the entire pipeline is designed for plug-and-play installation and scalable use without the need for manual labelling or complex calibration, making it ideally suited for SMEs aiming to transition toward Industry 4.0 with minimal investment.
Building upon the literature on machine utilisation monitoring, low-cost sensor systems, and edge-based machine learning, this study is guided by the following research questions:
Can non-invasive current sensing combined with unsupervised learning accurately classify machine states and detect production events in diverse SME manufacturing environments?
Can such an approach deliver actionable energy insights and operational metrics without the need for expensive instrumentation or extensive labelled data?
How does this solution compare to traditional rule-based and SCADA- or PLC-based systems in terms of scalability, flexibility, and practical applicability for SMEs?
These questions inform the design, evaluation, and comparative analysis of the proposed methodology as presented in the following sections. The remainder of this paper is structured as follows.
Section 2 reviews the related literature in machine utilisation monitoring, energy analytics, and low-cost sensor deployment.
Section 3 details our proposed methodology, including the sensor setup, preprocessing, ML techniques, and clustering strategies.
Section 4 presents the experimental validation and comparative analysis of our approach across multiple real-world industrial use cases. Finally,
Section 5 discusses the conclusions, limitations, and future research directions.
2. Literature Review
The manufacturing sector has seen a notable change recently toward data-driven decision-making and the acceptance of advanced analytics solutions to maximise operational efficiency. Recent studies have investigated the potential of data analytics to enhance the utilisation of machinery and provide meaningful insights into manufacturing operations.
Within the context of contemporary industrial operations, IoT technologies have transformed machine monitoring and maintenance policies. Real-time data collection from multiple sensors installed inside equipment is made possible by IoT-based machine monitoring systems, thereby allowing ongoing control of the operating parameters [
6]. Early anomaly detection relies on this constant data stream, which if neglected can lead to equipment failures and unscheduled downtime [
6].
This section provides a comprehensive review of the contemporary research focused on optimising machine utilisation through machine learning (ML) methodologies, specifically highlighting predictive maintenance (PdM), process optimisation, and energy savings in manufacturing settings. Cost-effective sensor technologies, IoT-based monitoring systems, and AI-driven analytics will become increasingly important as companies shift towards data-driven decision-making and digital transformation, thereby enhancing the operational efficiency. The advancement of monitoring methods, the importance of machine learning in predictive analytics, and the challenges in applying scalable and reasonably priced solutions are underlined in this section. Additionally, a review of substantial studies investigating these developments is provided. The constraints of the current research are examined, along with significant deficiencies that necessitate a focus on developing more efficient, flexible, and real-time machine learning systems for industrial use.
2.1. Introduction to Machine Utilisation Monitoring
Modern production relies primarily on the effective use of machines, which directly impacts the sustainability, cost-effectiveness, and output. Developed by Nakajima, the OEE framework has been widely adopted as a primary indicator of machine performance by monitoring availability, performance, and quality losses in manufacturing operations [
7]. However, conventional machine use monitoring has been plagued by inefficiencies, including manual data collection, infrequent inspections, and a reliance on costly industrial sensors that require sophisticated integration with supervisory control and data acquisition (SCADA) systems [
8]. These difficulties often cause delays in identifying machine inefficiencies and downtime, prohibiting real-time action to maximise outputs. Furthermore, sustainability issues in manufacturing include the need for reduced energy waste, enhanced resource efficiency, and the implementation of real-time process monitoring systems in line with Industry 4.0 concepts [
8].
By using cyber–physical systems, IoT-based sensing networks, and advanced data analytics to measure real-time machine performance, Industry 4.0 has transformed machine use monitoring [
9]. By incorporating smart sensors, edge computing, and AI-driven analytics, manufacturers can obtain actionable insights into machine usage patterns, identify anomalies, and optimise maintenance schedules [
10]. The research indicates that real-time process monitoring significantly enhances OEE, especially in high-precision sectors such as welding, printing, and semiconductor manufacturing [
11]. Additionally, low-cost sensing solutions, including non-invasive current clamp sensors, have become effective alternatives to conventional industrial sensors, enabling manufacturers and small to medium-sized enterprises (SMEs) to implement cost-effective and scalable monitoring of machine utilisation [
7]. The evolution of manufacturing systems towards autonomous, self-optimising factories necessitates the integration of IoT, predictive analytics, and energy-efficient monitoring solutions for improved overall sustainability in manufacturing.
2.2. The Role of Low-Cost Sensors in Machine Monitoring
The swift progress of cost-effective sensor technology has transformed the oversight of industrial machinery, providing instantaneous data on machine usage and allowing predictive maintenance (PdM) and energy consumption assessments. The use of the current clamp sensors has become one of the most efficient and economical methods for monitoring industrial machinery, as they are non-invasive devices that measure electrical currents without requiring the physical disconnection of machinery [
12]. In industrial monitoring applications, these sensors provide a cost-effective alternative to expensive, invasive industrial sensors, thereby achieving an optimal balance between cost and performance.
Faraday’s law of induction forms the basis of a current clamp sensor, whereby a magnetic field is produced around a conductor carrying an electric current. The sensor identifies variations in the magnetic field and transforms them into an electrical signal that reflects the current flow [
13]. Current clamps are non-contact sensors, unlike conventional shunt resistors that require direct electrical contact and incur significant power losses. This renders them particularly advantageous for machine surveillance in high-voltage and industrial settings. Smart energy management and non-intrusive load monitoring (NILM) systems [
13] favour their ability to measure alternating current (AC) circuits, and in some configurations direct current (DC) circuits, without necessitating circuit modifications.
The non-invasive nature of current clamp sensors is a primary advantage, facilitating straightforward deployment without disrupting the current connections. SMEs that may lack the resources to develop sophisticated industrial monitoring systems [
14] would find this feature particularly beneficial, since it significantly reduces the installation time and costs. Non-invasive current sensors enhance workplace safety by eliminating the need for direct interaction with live electrical components, thereby reducing the risk of electrical accidents.
The scalability of current clamp sensors and their compatibility with IoT-based systems are substantial advantages. Inexpensive, wireless current sensors can be integrated with industrial Internet of Things (IIoT) networks to allow the real-time monitoring of machine conditions, facilitate PdM, and enhance energy efficiency efforts [
14]. By distributing these sensors across multiple machines, manufacturers can monitor entire production lines with minimal equipment required. Advancements in edge computing and TinyML have enabled low-power, AI-driven current sensors to perform real-time data analyses directly at the sensor level, therefore reducing latency and a reliance on cloud services.
The use of non-invasive current sensors entails specific challenges, notwithstanding their advantages. Their susceptibility to external electromagnetic interference (EMI) constrains them and may affect the measurement precision in high-noise industrial environments [
12]. Inexpensive models may have a limited measuring range, making them unsuitable for applications that require high precision or substantial current measurement capacity. The recent research indicates that advanced filtering techniques and calibration algorithms can effectively mitigate these issues, thereby enhancing the accuracy of low-cost current sensors [
13].
The decision between low-cost sensors and premium industrial monitoring solutions is influenced by budget, measurement precision, implementation difficulty, and scalability factors. Premium industrial sensors, which are ideal for applications requiring precise current measurements [
12], such as Rogowski coils, Hall-effect sensors, and industrial-grade programmable logic controller (PLC)-integrated monitoring systems, offer enhanced accuracy and superior bandwidth. Integrated analytics tools frequently offer comprehensive process optimisation and automated issue identification advantages. However, for small-scale producers and SMEs seeking cost-effective monitoring solutions, these options frequently appear to be prohibitively expensive [
15].
Conversely, inexpensive current sensors, such as current clamps, provide a cost-effective alternative for essential energy monitoring and machinery oversight. The research has demonstrated that IoT-enabled low-cost sensors can perform comparably to high-end monitoring solutions at a fraction of the cost [
14]. The swift adoption of monitoring systems by manufacturers, facilitated by plug-and-play sensor solutions designed for rapid deployment, allows them to circumvent the substantial initial costs and specialised technical expertise that is required [
16].
The recent research has focused on the development of effective, low-cost sensor network implementations in industrial environments. A cost-effective, IoT-based system for electric motor status monitoring demonstrated that despite offering reduced expenses and enhanced flexibility, wireless vibration and current sensors could identify operational anomalies with accuracy comparable to industrial-grade instruments [
14]. In the research on real-time energy monitoring in smart manufacturing, low-cost, non-invasive current sensors have proven to provide extensive power consumption data, enabling manufacturers to optimise energy utilisation efforts and reduce operational expenses [
13].
The specific requirements of the application ultimately dictate the suitability of low-cost versus high-end sensors. Premium industrial solutions entail higher costs and greater implementation complexity, yet they offer enhanced precision and advanced functionality. In contrast, low-cost sensors attract manufacturers seeking optimised machine utilisation and energy efficiency with minimal investment due to their affordability, ease of use, and compatibility with emerging IoT-based monitoring systems [
15].
By incorporating low-cost, non-invasive current sensors into industrial machine monitoring, manufacturers striving for improved machine utilisation, energy efficiency, and predictive maintenance (PdM) have found a workable and scalable solution. By providing a reasonable and affordable alternative to conventional invasive sensing techniques, current clamp sensors enable real-time monitoring, eliminating the need for complicated wiring or circuit modifications. Low-cost substitutes show great promise in industrial applications, especially when combined with IoT-based monitoring systems and AI-driven analytics, despite their lower accuracy and the advanced analytics given by premium industrial sensors. Future studies should focus on enhancing the accuracy of low-cost sensors, reducing their vulnerability to external interference, and incorporating advanced data analytics approaches to maximise machine monitoring in Industry 4.0 systems.
2.3. Energy Consumption Monitoring in Manufacturing
Modern manufacturing relies fundamentally on energy efficiency, which directly influences cost management, sustainability, and adherence to regulations. Abdel-Aty et al. [
17] contend that as businesses worldwide aim to reduce their carbon footprints and maximise resource utilisation, energy management in manufacturing must align with sustainability objectives. Governments and international organisations have instituted policies requiring businesses to adopt energy-efficient practices; nonetheless, many SMEs suffer because of the high costs of advanced energy monitoring systems. Attaining financial and environmental sustainability relies on efficient and accessible energy monitoring solutions.
In manufacturing, traditional energy monitoring calls for high-end power meters, PLC integration, and SCADA systems. Although these techniques offer accurate real-time monitoring, they are sometimes costly, challenging to install and maintain, and call for particular knowledge for use [
18]. SCADA-based monitoring solutions, frequently employed in large-scale industrial facilities, entail significant initial costs, rendering them impractical for several SMEs [
19]. Although effective in providing machine-level insights, PLC-based solutions are associated with elevated costs and restricted compatibility with legacy industrial equipment. Moreover, the absence of a comprehensive, machine-level understanding is necessary for efficient energy utilisation, resulting in power meters installed at the facility level providing only aggregated energy consumption data.
Specifically, current clamp sensors offer an effective alternative to traditional energy monitoring through low-cost sensor-based solutions. Current clamp sensors facilitate effortless scaling for SMEs [
20] by providing a non-invasive method to assess electrical usage, thereby obviating the need for direct electrical modifications. Research has shown that low-cost current clamp sensors integrated with IoT-based monitoring systems can provide real-time insights into machine-level energy use at a fraction of the expense of SCADA or PLC systems. According to EMPIOT [
21], an IoT energy monitoring system that employs inexpensive hardware alongside sophisticated algorithms can achieve accuracy comparable to industrial-grade energy meters while significantly reducing the installation costs.
Despite these advantages, traditional energy monitoring systems remain prevalent due to concerns over the precision and reliability of more economical alternatives. Recent research has demonstrated that real-time data analytics and machine learning algorithms can enhance the precision of low-cost energy monitoring devices [
22]. Inexpensive current sensors can effectively identify energy inefficiencies, detect anomalies, and provide manufacturers with actionable insights through edge computing and cloud-based analytics, thereby optimising energy consumption [
18]. Moreover, studies indicate that in industrial environments, hybrid solutions integrating low-cost sensors with AI-driven anomaly detection can enhance the energy efficiency by as much as 30% [
23].
Ensuring that all manufacturing sectors, especially SMEs, can actively participate in sustainable energy management depends on transitioning from conventional, costly energy monitoring systems to low-cost, sensor-based solutions. Low-cost energy monitoring solutions are a sensible choice for businesses seeking to maximise their energy efficiency while maintaining profitability, as they not only reduce expenses but also offer better flexibility, scalability, and access. Low-cost energy monitoring solutions will become increasingly feasible for industrial use as IoT, ML, and edge computing continue to develop, thereby bridging the gap between cost and efficacy in energy management.
2.4. Machine Learning for Machine Utilisation Optimisation
Machine learning applied in manufacturing has greatly enhanced energy economy, process optimisation, and predictive maintenance efforts. Time-based or reactive maintenance approaches have long been the foundation of conventional manufacturing processes, often resulting in unanticipated equipment breakdowns, downtime, and higher operating costs. ML-driven predictive maintenance has, nevertheless, revolutionised industry equipment management by anticipating failures, optimising manufacturing schedules, and lowering needless maintenance expenses [
18].
Through predictive maintenance (PdM) driven by machine learning, manufacturers can track real-time machine conditions and forecast potential issues before they occur. Predictive maintenance trains models that can identify abnormalities, classify failure modes, and suggest maintenance schedules by means of sensor data, past maintenance records, and operational patterns [
24]. Low-power, on-device ML systems that can run directly on manufacturing equipment have recently become possible due to recent developments, thereby reducing the need for cloud computing and lowering the latency in decision-making [
18]. ML-based PdM systems have been shown in studies to prolong equipment lifetimes by 20–40% and save downtime costs by up to 30%.
Another important area where ML has significant benefits is in energy optimisation. Among the largest consumers of energy are manufacturing facilities; hence, inefficiencies in production can lead to excessive energy waste and increased carbon footprints [
20]. ML algorithms can analyse energy consumption trends, which also helps maximise machine scheduling and pinpoint areas where energy savings are likely to occur. Recently, the research on reinforcement-learning-based energy management systems, which dynamically adjust machine operations in response to real-time energy pricing and workload demand, has led to significantly reduced running costs [
25].
Apart from PdM and energy management, the analysis of machine states depends critically on classification and clustering methods. There are several states of machine use—idle, running, and off—each of which adds to the OEE. Two often used clustering methods for segmenting machine state data are GMMs and density-based spatial clustering of applications with noise (DBSCAN). These models enable producers to identify inefficiencies, including overuse, extended idleness, and abnormalities, suggesting potential approaches to address these issues. Manufacturers can maximise their machine task allocation efforts, reduce wasteful energy consumption, and increase the OEE [
26] by using clustering approaches.
Bresica et al. [
27] proposed an automated GMM (AutoGMM) approach combined with decision trees for the online monitoring of electrical industrial machines, overcoming the need to predefine mixture components. The method clusters normal operating states from power consumption data and detects novel anomalies or new operating modes in real time, enhancing fault detection and operational state classification efforts for industrial loads.
Maliuk et al. [
28] introduced a GMM-based signal processing technique for rotating machinery fault diagnosis. The study uses GMM windowing to isolate bearing fault frequency harmonics from normal vibration noise, thereby improving feature extraction efforts for bearing fault detection. By filtering out irrelevant frequency content, the method enhanced the classification of bearing health conditions (using a k-NN classifier) and reliably distinguished faulty bearings in an industrial motor dataset.
Huang et al. [
29] demonstrates a real-time machine state monitoring application where a GMM (with Kullback–Leibler divergence) tracks changes in a CNC machine’s spindle speed. An accelerometer and current sensor feed the model to detect anomalies in machining parameters. The proposed unsupervised GMM approach successfully self-diagnosed spindle speed deviations during milling, achieving high detection performance (F1-scores ~0.9) and enabling timely warnings for process parameter changes.
Roy et al. [
30] presented an action research case study of a Canadian manufacturing SME’s tailored Industry 4.0 transformation, emphasising agility, modular design, and lean principles to enable mass customisation and overcome resource constraints. Through simulation and pilot implementation efforts, individualised planning and modular technology adoption proved critical for successful deployment. Antosz et al. [
31] reported on a drive shaft manufacturing SME that utilised neural networks, bagged trees, and SVM to predict defects, achieving an accuracy rate of ~94.7%, thereby significantly enhancing quality control efforts. They recommended combining machine learning (ML) with traditional methods to optimise processes, reduce scrap rates, and boost productivity. Pejić Bach et al. [
32] described an SME-focused predictive maintenance implementation method using an IoT-based decision support system, which leveraged open source tools and machine learning in R. The case validated the benefits of affordability, flexibility, and accuracy, while highlighting the challenges of integrating open source solutions into daily operations. It offered practical insights for AI-driven maintenance in resource-limited small factories.
TinyML, which provides lightweight, edge-based machine learning for resource-limited contexts, is a recent innovation in machine learning for manufacturing. By enabling machine learning models to run on microcontrollers and edge devices, TinyML reduces the need for cloud-based processing and facilitates real-time, manufacturing-floor-level decision-making [
33]. Low-power predictive maintenance systems, in which energy consumption is a restriction, such as battery-operated sensors for remote industrial monitoring, are especially helpful, as noted by Chen et al. [
18]. All of these factors can lead to improved operating efficiency and reduced maintenance costs. TinyML approaches have been effectively utilised in real-time vibration analyses, motor health monitoring, and problem identification [
34].
An area of growing importance that drives manufacturers toward more automation, efficiency, and sustainability is the integration of ML into machine-use optimisation. PdM, energy-efficient computing, and real-time anomaly detection all help to create enormous possibilities for AI-driven manufacturing. Going forward, research studies should concentrate on enhancing the interpretability of ML models, integrating multiple sensor data sources, and progressively optimising TinyML algorithms for practical use.
2.5. Low-Cost Sensor Systems and Edge Computing in Manufacturing
Mennilli et al. [
35] explored TinyML deployment at the edge, successfully running a convolutional neural network on a resource-limited industrial PLC (Arduino-based Finder Opta controller) to predict machine rotational speeds from acoustic sensor data. This proof-of-concept demonstrated effective local inference ability, reducing cloud dependency and enhancing data security, highlighting the feasibility of responsive predictive maintenance through low-cost edge computing hardware.
Failing et al. [
36] presented a low-cost, plug-and-play tool condition monitoring (TCM) system suitable for rapid deployment in SMEs. Utilising an Arduino and inexpensive sensors to measure spindle noise and current, combined with a Linux-based edge controller (BeagleBone Black), the system achieved approximately 88% accuracy in detecting worn tools in a turning machine case. Costing only around €170 and requiring minimal installation, the solution showcases affordable edge analytics and IoT integration for predictive tool maintenance with minimal disruption.
Hanifi et al. [
37] described an IIoT retrofit at a manufacturing plant aimed at monitoring and reducing energy and compressed air waste through the use of low-cost IoT sensors. By continuously tracking electricity and air usage on legacy production equipment, the data analysis revealed inefficiencies, including air leaks. Addressing these issues resulted in a 56% reduction in energy consumption, demonstrating the significant sustainability and efficiency benefits achievable through the use of affordable sensor networks and edge analytics in small to medium-sized enterprise (SME) environments.
Khan et al. [
38] proposed an inexpensive IoT-based energy monitoring system suitable for industrial or building contexts. The solution utilises Arduino-based sensor modules equipped with an ESP8266 Wi-Fi chip for wireless data transmission, providing compatibility with Wi-Fi, cellular, and Ethernet communication protocols. Combined with a user-friendly web interface for real-time power visualisation, the system provides SMEs with an accessible means to track and manage energy usage effectively, facilitating improved energy efficiency and cost savings.
2.6. Limitations of Current Research and Research Gap
A significant barrier exists in the form of insufficient scalable, low-cost, and easily deployable solutions for SMEs, despite substantial advancements in ML applications aimed at optimising machine usage. The current ML-based monitoring solutions often require expensive industrial sensors, significant computational resources, and complex system integrations, rendering them impractical for smaller enterprises with constrained budgets [
19]. Numerous studies have examined low-cost alternatives such as current clamp sensors and IoT-based solutions; however, these approaches often lack a cohesive framework for widespread implementation [
20]. The accessibility of ML for SMEs relies on the development of cost-effective, plug-and-play monitoring devices that integrate ML-driven anomaly detection with insights into energy efficiency.
The accurate identification of anomalies and determination of thresholds in machine states pose significant challenges in monitoring machine usage through machine learning. The current solutions often rely on supervised learning models that necessitate extensive labelled datasets, which may not be readily available in practical industrial contexts [
25]. The current classification and clustering techniques, such as DBSCAN and GMMs, often encounter challenges with dynamic machine behaviour, where machine states fluctuate due to external factors such as temperature, load variations, and power supply inconsistencies [
39]. The research on PdM continues to reveal a significant gap in the development of adaptive and self-learning models that can dynamically adjust thresholds in real time.
The requirement for lightweight ML models capable of efficient operation on edge devices such as Raspberry Pi and microcontrollers introduces an additional constraint to the current research. Numerous machine learning (ML) systems rely on cloud-based processing, which can result in delays, raise concerns regarding data security [
18], and increase costs. The current implementations of TinyML are in their nascent stages and generally exhibit insufficient computational efficiency for industrial-scale applications. Nonetheless, TinyML has surfaced as a promising approach for enabling low-power, real-time ML inference ability at the edge [
33]. Further research is necessary to optimise TinyML models for real-time industrial monitoring, reduce energy consumption, and enhance their ability to handle large sensor data streams efficiently.
The research integrating real-time energy monitoring with machine learning (ML) for machine optimisation is notably insufficient. While numerous studies have examined ML-driven PdM and anomaly detection, few research studies have focused on the utilisation of real-time energy usage data to enhance machine operations dynamically [
34]. The current energy monitoring technologies primarily provide historical data, limiting their effectiveness in real-time adaptive decision-making, which in turn constrains their potential for process optimisation and cost reductions [
20]. Future research studies should focus on developing hybrid ML models that integrate energy efficiency optimisation with machine usage data, enabling manufacturers to reduce energy waste while maximising real-time machine production.
3. Methodology
3.1. Data Acquisition Framework
The data acquisition process was designed to capture high-resolution power consumption signals from industrial machinery in real-world manufacturing environments. The primary objective was to gather a continuous and reliable time series of electrical activity that could be subsequently analysed to infer machine utilisation and detect production-related events.
Current sensors (as shown in
Figure 1) are used to collect the electrical current drawn by each machine. Operating on the concept of electromagnetic induction, these clamp-on sensors let current measurements be collected without physically changing the current power distribution of the machine. For SMEs, where cost-effective deployment and minimal disturbance of operations were vital factors, this strategy was especially suitable.
Depending on the equipment, the sensors were mounted on either three-phase or single-phase machines. In three-phase systems, the total apparent power could be computed by independently measuring the current on each phase. Usually at sub-minute resolution, data were gathered and then combined into predetermined time windows, mostly one-minute intervals, to support the downstream analysis. For activities’ recognition, this aggregation led to simplified processing and lowered noise, and gave a natural temporal granularity.
Each data point in the resulting time series consisted of the aggregate current or power consumption at a given timestamp. These measurements form the basis for inferring operational states, production patterns, and energy usage trends.
To ensure a representative dataset, sensors were deployed over extended observation periods ranging from two weeks to one month, capturing the natural variability in machine operation across different shifts and production schedules. The resulting dataset exhibited diverse temporal patterns, including machine startup and shutdown sequences, intermittent idle periods, and sustained operation intervals, which are crucial for training unsupervised models and deriving meaningful utilisation metrics.
3.2. Signal Preprocessing
Following data acquisition, the raw current measurements were subjected to a series of preprocessing steps to ensure temporal consistency, reduce noise, and prepare the data for the machine learning (ML)-based analysis. These steps were necessary to convert the heterogeneous, sometimes incomplete sensor outputs into a structured and analysable time series that accurately reflects machine activity.
3.2.1. Time Alignment and Aggregation
The first preprocessing task involved aligning all sensor readings to a unified time grid. For machines with three-phase power, current readings from individual phases were synchronised and aggregated into one-minute windows using the mean current per phase. The total apparent power was then calculated using:
where
IA,
IB,
IC denote the averaged current values from the three phases over the one-minute interval. This transformation produced a univariate time series representing the total power draw, which formed the basis for the subsequent analysis.
3.2.2. Noise Reduction and Outlier Filtering
Spurious readings, such as isolated spikes or dips in current values due to transient electrical noise or sensor anomalies, were filtered using a combination of moving average smoothing and statistical outlier detection. Points exceeding a predefined z-score threshold within a sliding window were flagged and optionally replaced using local interpolation.
3.2.3. Handling Missing Data
Gaps in the time series, typically caused by transient sensor disconnections or transmission errors, were addressed by forward-filling short missing intervals (under five minutes) and flagging longer gaps for exclusion. This ensured continuity in the dataset without introducing significant bias in the machine state inference process.
3.2.4. Normalisation
Although not always necessary, in some cases the power signal was normalised (e.g., min–max scaling or standardisation) to improve the clustering stability during machine state classification, particularly when analysing multiple machines with vastly different load profiles together.
These preprocessing steps yielded a clean and temporally consistent power time series for each machine, which preserved the essential operational dynamics while mitigating noise-related artefacts. This prepared dataset was then used for the unsupervised classification of machine states and detection of production cycles.
3.3. Machine State Classification
The choice of an unsupervised GMM was guided by two key factors: (1) the absence of labelled ground truth data for machine states in SME deployments; (2) the need to model machines exhibiting multiple latent operating modes reflected in continuous power signals. The GMM provides a probabilistic clustering framework that can robustly model multi-modal distributions in power consumption data, enabling natural separation into off, idle, and working states. Compared to threshold-based heuristics or k-means clustering, the GMM offers superior flexibility in capturing overlapping state distributions and modelling uncertainty during classification.
An unsupervised machine learning (ML) approach was adopted to identify and characterise machine operational states, including off, idle, and working. This approach was necessary due to the absence of labelled ground truth data, a common constraint in SME environments where manual annotation is impractical.
3.3.1. Gaussian Mixture Model (GMM)
The primary algorithm used for state classification was the GMM, a probabilistic model that assumes the observed data are generated from a mixture of several Gaussian distributions, each representing a latent class or operational state. In this context, each Gaussian component corresponds to a distinct machine state, along with its mean and variance in power consumption.
Let
denote the time series of power readings. The GMM models the data likelihood as:
where
K is the number of machine states (typically set to 3);
represents the mixing coefficients;
are the mean and standard deviation of the
k-th Gaussian component, respectively.
The expectation–maximisation (EM) algorithm was used to estimate the model parameters. Once fitted, each data point was assigned to the most likely state based on the maximum posterior probability.
3.3.2. Post-Processing and Threshold Refinement
In some cases, the initial clustering results included spurious components caused by outliers or transitional behaviour. These were addressed by:
Merging low-support components with adjacent states based on proximity and domain knowledge.
Applying a persistence filter to suppress rapid state oscillations below a minimum duration threshold (e.g., transitions shorter than 2 min were smoothed).
This refinement ensured a robust and interpretable classification process, preserving the physical intuition behind operational states. The final result was a labelled time series where each interval was assigned a discrete state, enabling a further analysis of utilisation and production dynamics.
3.3.3. Cross-Machine Generalisability
Although the GMM model was fitted independently per machine, a common three-state configuration (off, idle, working) was found to generalise well across multiple deployments, with the threshold positions varying depending on the machine’s power profile. This consistency facilitated the development of a standardised methodology for utilisation estimation.
3.4. Production Event Detection
Once the machine states were classified into off, idle, and working, the next step involved detecting individual production events within the working state. The aim was to segment the time series into discrete production units, each corresponding to creating one or more products. This segmentation enabled a downstream analysis of production volumes, cycle times, and product typologies. DBSCAN was selected for the production event clustering due to its ability to detect clusters with arbitrary shapes without requiring prior specification of the number of product types and the robustness to noise and outliers—key advantages in heterogeneous SME production environments.
3.4.1. Temporal Segmentation Heuristic
The production event detection was based on a simple but effective temporal heuristic, whereby a production event was defined as a contiguous sequence of working state intervals, separated from adjacent working periods by gaps of sufficient duration. A gap exceeding a predefined threshold (e.g., 5 min) between two working periods was interpreted as a break in production, marking the boundary between two distinct events.
Let
represent the timestamps at which the machine was in the
working state. We define a production event boundary at timestamp t
i if:
where Δ is the minimum inter-event interval (empirically set between 3 and 10 min depending on the use case). This approach allowed the reconstruction of a sequence of production runs from the continuous operational data.
3.4.2. Event Duration as a Proxy for Product Complexity
Each production event was summarised by its duration, defined as the length of the corresponding contiguous working interval. This scalar value served as a proxy for the production effort and complexity. Shorter events typically represented simple or repetitive product types, while longer durations often corresponded to complex or multi-component items.
In the case studies involving different companies, this method demonstrated high agreement with manually recorded production logs, with a relative error rate of less than 2% in the total product count over a one-month dataset. This validated the approach’s effectiveness in practical industrial contexts.
3.4.3. Considerations and Edge Cases
For improved reliability, very short working bursts (e.g., <2 min) were optionally filtered out or marked as potential false positives due to transient noise or setup operations. Similarly, working sequences that immediately followed long idle periods were reviewed to ensure they represented genuine production activity rather than non-productive energy consumption.
3.5. Product Typology via Clustering
After production events were detected and segmented based on working state intervals, the following analytical step involved grouping them into distinct product types based on their temporal characteristics. The goal was to uncover latent structures in production cycles, such as standardised vs. custom runs, by clustering events according to their duration.
3.5.1. Feature Selection
Each production event was represented by its duration (in minutes), serving as a low-dimensional proxy for the complexity, size, or quantity of the product manufactured during that cycle. In some use cases, additional features such as the average power draw or inter-event idle time were included to enrich the clustering space. However, in the majority of deployments, the event duration alone proved sufficient for identifying meaningful clusters.
3.5.2. Density-Based Clustering with DBSCAN
The DBSCAN algorithm was applied to discover groups of similar production events. DBSCAN is well-suited for this task because it can identify clusters with arbitrary shapes, handle noise and outliers effectively, and operate without specifying the number of clusters in advance.
Let denote the set of production durations. DBSCAN requires two parameters:
DBSCAN then assigns each event to one of the following:
A core cluster, if it is part of a dense region;
A border point, if it is close to a dense region;
Or noise, if it lies in a low-density area (e.g., very short or anomalously long events).
3.5.3. Interpretation and Business Relevance
Each resulting cluster was interpreted as a product type or category:
Short-duration clusters—small or standardised components;
Medium-duration clusters—typical production batches;
Long-duration clusters—bespoke or multi-stage operations;
Outliers—anomalies such as faulty cuts or non-standard runs.
In one case study, five main clusters and a set of outliers were identified, later flagged as likely quality issues or one-off jobs. The clustering aligned closely with the SME-provided labels, suggesting the method’s validity in practical settings.
3.5.4. Applications
The identified product typologies enabled several downstream benefits:
Production forecasting—based on the observed frequency of each product type;
Capacity planning—via aggregate duration statistics per category;
Quality control—by monitoring the outlier rates and production consistency.
This unsupervised classification approach provided an interpretable, data-driven method for understanding the production complexity and diversity without requiring any labelled inputs.
3.6. Derived Metrics and Inferences
With the machine states and production events accurately identified, quantitative metrics were derived to assess machine utilisation, operational efficiency, and production characteristics. These metrics provide interpretable summaries of system performance, serving as key indicators for benchmarking and decision-making in manufacturing environments.
3.6.1. Machine Utilisation Rate
The machine utilisation rate quantifies the proportion of total monitored time during which the machine was in the working state. Formally, for a monitoring period of duration
T, the utilisation rate
U is defined as:
where
Tworking is the cumulative duration classified as working. This metric reflects how effectively a machine’s operational capacity is being exploited.
3.6.2. State Time Distribution
To capture the full behavioural profile of the machine, the total time spent in each state (off, idle, working) was computed and expressed as a percentage of the total observed time:
This distribution supports the identification of inefficiencies such as excessive idling or downtime.
3.6.3. Production Volume and Composition
The total number of products was inferred over a given period using the segmented production events. In cases where clustering had been applied, the product types were also counted, enabling the generation of production mix profiles.
These counts can be aggregated by day or shift to reveal patterns in production throughput and diversity.
Idle-to-Work Ratio and Transition Frequency
Two complementary metrics were used to understand the process dynamics:
The idle-to-work ratio, , indicates the process stability and potential setup inefficiencies;
The state transition count, particularly for transitions from idle to working, serves as a proxy for manual interventions or start–stop operations.
3.6.4. Energy Consumption Estimation
Energy consumption was one of the important metrics for understanding the machine efficiency and operational costs. Our methodology approximates energy consumption using the same electrical current data, which involves calculating both the instantaneous power and the energy consumed per unit time to derive a cost metric that supports real-time and historical efficiency assessments.
To estimate the real power, we use the average current measured across the three phases. The real power P is calculated using the following formula:
where:
V is the line voltage, assumed to be 400 V for industrial three-phase systems and 230 V in the case of using a single-phase sensor;
Iavg is the average of the root mean square current from the three phases;
PF is the power factor, assumed to be 0.85 based on typical load characteristics in manufacturing environments.
This formula accounts for the three-phase configuration and reasonably accurately estimates the real power consumption without requiring complex instrumentation.
The energy consumed per minute is then calculated by multiplying the estimated power by time (in minutes). Since energy is measured in kilowatt-hours (kWh), and 1 kWh = 1000 W × 60 min, we apply a conversion factor to obtain the energy per minute:
From this, we compute the cost of the energy consumption per minute:
where:
The energy analysis complements our machine utilisation detection and clustering methodologies, creating a unified framework for productivity, sustainability, and cost optimisation in manufacturing environments.
3.7. Clustering Hyperparameters
To ensure the transparency and reproducibility of the machine state classification and product typology clustering process, this section provides a detailed list of the hyperparameters used in the core unsupervised learning components of the analytics pipeline. The tuning of these parameters was guided by empirical testing across multiple machines and production environments, with the goal of achieving interpretable clusters aligned with actual operational behaviours.
3.7.1. GMM for Machine State Classification
The GMM was used to classify the power consumption time series into discrete machine states (off, idle, working). The following hyperparameters were used in the fitting process:
While the core machine state model typically focused on three primary states (off, idle, working), additional components were included during the exploratory analysis to capture transitional or ambiguous states and to improve the model’s flexibility in machines with complex load patterns.
This setting assumes that each Gaussian component has its own single variance parameter, which was found to be
suitable given the one-dimensional nature of the aggregated power signal and the need to avoid overfitting.
3.7.2. DBSCAN for Product Typology Clustering
The DBSCAN algorithm was used to cluster production events based on their duration, identifying groups of similar production cycles corresponding to different product types or process modes. The following hyperparameters were applied:
The choice of eps (maximum distance between points in the same cluster) was empirically tuned to match the production characteristics. An eps of 3 min worked well for most machines with well-separated production cycle durations. In scenarios with highly granular or short production cycles, a smaller eps of 1 min was employed to capture finer distinctions.
The minimum number of points required to form a dense region was set to 8, balancing the sensitivity to small production runs with robustness against noise and outliers.
3.7.3. Parameter Selection Rationale
The parameter values were selected through iterative experimentation across multiple SME deployments, informed by production logs and visual inspections of the clustering results. In particular:
The GMM n_components setting was intentionally flexible to accommodate variations in machine behaviour across different equipment types;
The DBSCAN eps parameter was adapted based on machine operation patterns, with smaller values preferred for fast-cycle machines and larger values for batch-oriented production;
A fixed min_samples value provided consistency in outlier detection across diverse datasets.
Providing these hyperparameter details supports the reproducibility of the presented methodology and facilitates its adaptation to other industrial contexts where machine utilisation analytics and production insights are required.
3.8. Data Sources
The machine utilisation analytics framework presented in this study was validated across an extensive set of real-world industrial deployments conducted as part of the SMDH initiative. The data were collected from more than 50 machines operating within over 20 diverse manufacturing facilities across the UK. These deployments were selected to cover a representative cross-section of machine types, production environments, and business scales, ensuring the broad applicability of the proposed methodology.
The machines monitored included:
CNC machining centres and routers;
Plastic injection moulding presses;
Timber processing equipment (moulders, resaws, CNC routers, sanding machines);
Plasma cutting and robotic welding machines;
Metal casting, rolling, and forming equipment;
Packaging and printing machines;
3D printers and post-processing equipment;
Compressors, chillers, and auxiliary process equipment;
Yarn dyeing machinery;
On-site power generation units.
The corresponding facilities ranged from small-batch precision engineering workshops to large-scale timber joinery manufacturers, plastics and composites suppliers for the aerospace and automotive sectors, lead product manufacturers, additive manufacturing service providers, textile finishing plants, and offsite construction manufacturers.
Across all deployments, non-invasive split-core current clamp sensors were installed on either single-phase or three-phase power supplies of the machines. The sensors were connected to edge devices (e.g., Raspberry Pi or equivalent) and integrated with factory Wi-Fi networks to enable continuous data collection. The sensor data, sampled at approximately 1 s intervals and aggregated to 1 min resolution, were transmitted to a cloud-based storage and processing pipeline for the subsequent machine learning analysis.
This heterogeneous dataset provided a robust and varied foundation for testing the scalability, generalisability, and practical utility of the machine state classification, production event detection, and energy analytics techniques presented in this work.
4. Results and Discussion
The proposed methodology was evaluated across multiple industrial settings involving different machine types, including CNC machines, timber processing equipment, and high-powered cutting machinery. The application of the analytics pipeline led to actionable insights related to machine state behaviour, production characteristics, and energy efficiency.
The initial output of the analysis was the classification of the machine activity into three states: off, idle, and working. This segmentation was achieved through the use of GMMs trained on the aggregated power signal. In all test cases, the GMMs converged on a stable solution, with three distinct components corresponding to the expected operational modes. A visual inspection of the clustered distributions confirmed the interpretability of each component.
Figure 2 presents an example of a clustered power histogram for one of the machines, illustrating the clear separation between low, moderate, and high power consumption states. Such delineation forms the backbone of the utilisation metric calculations.
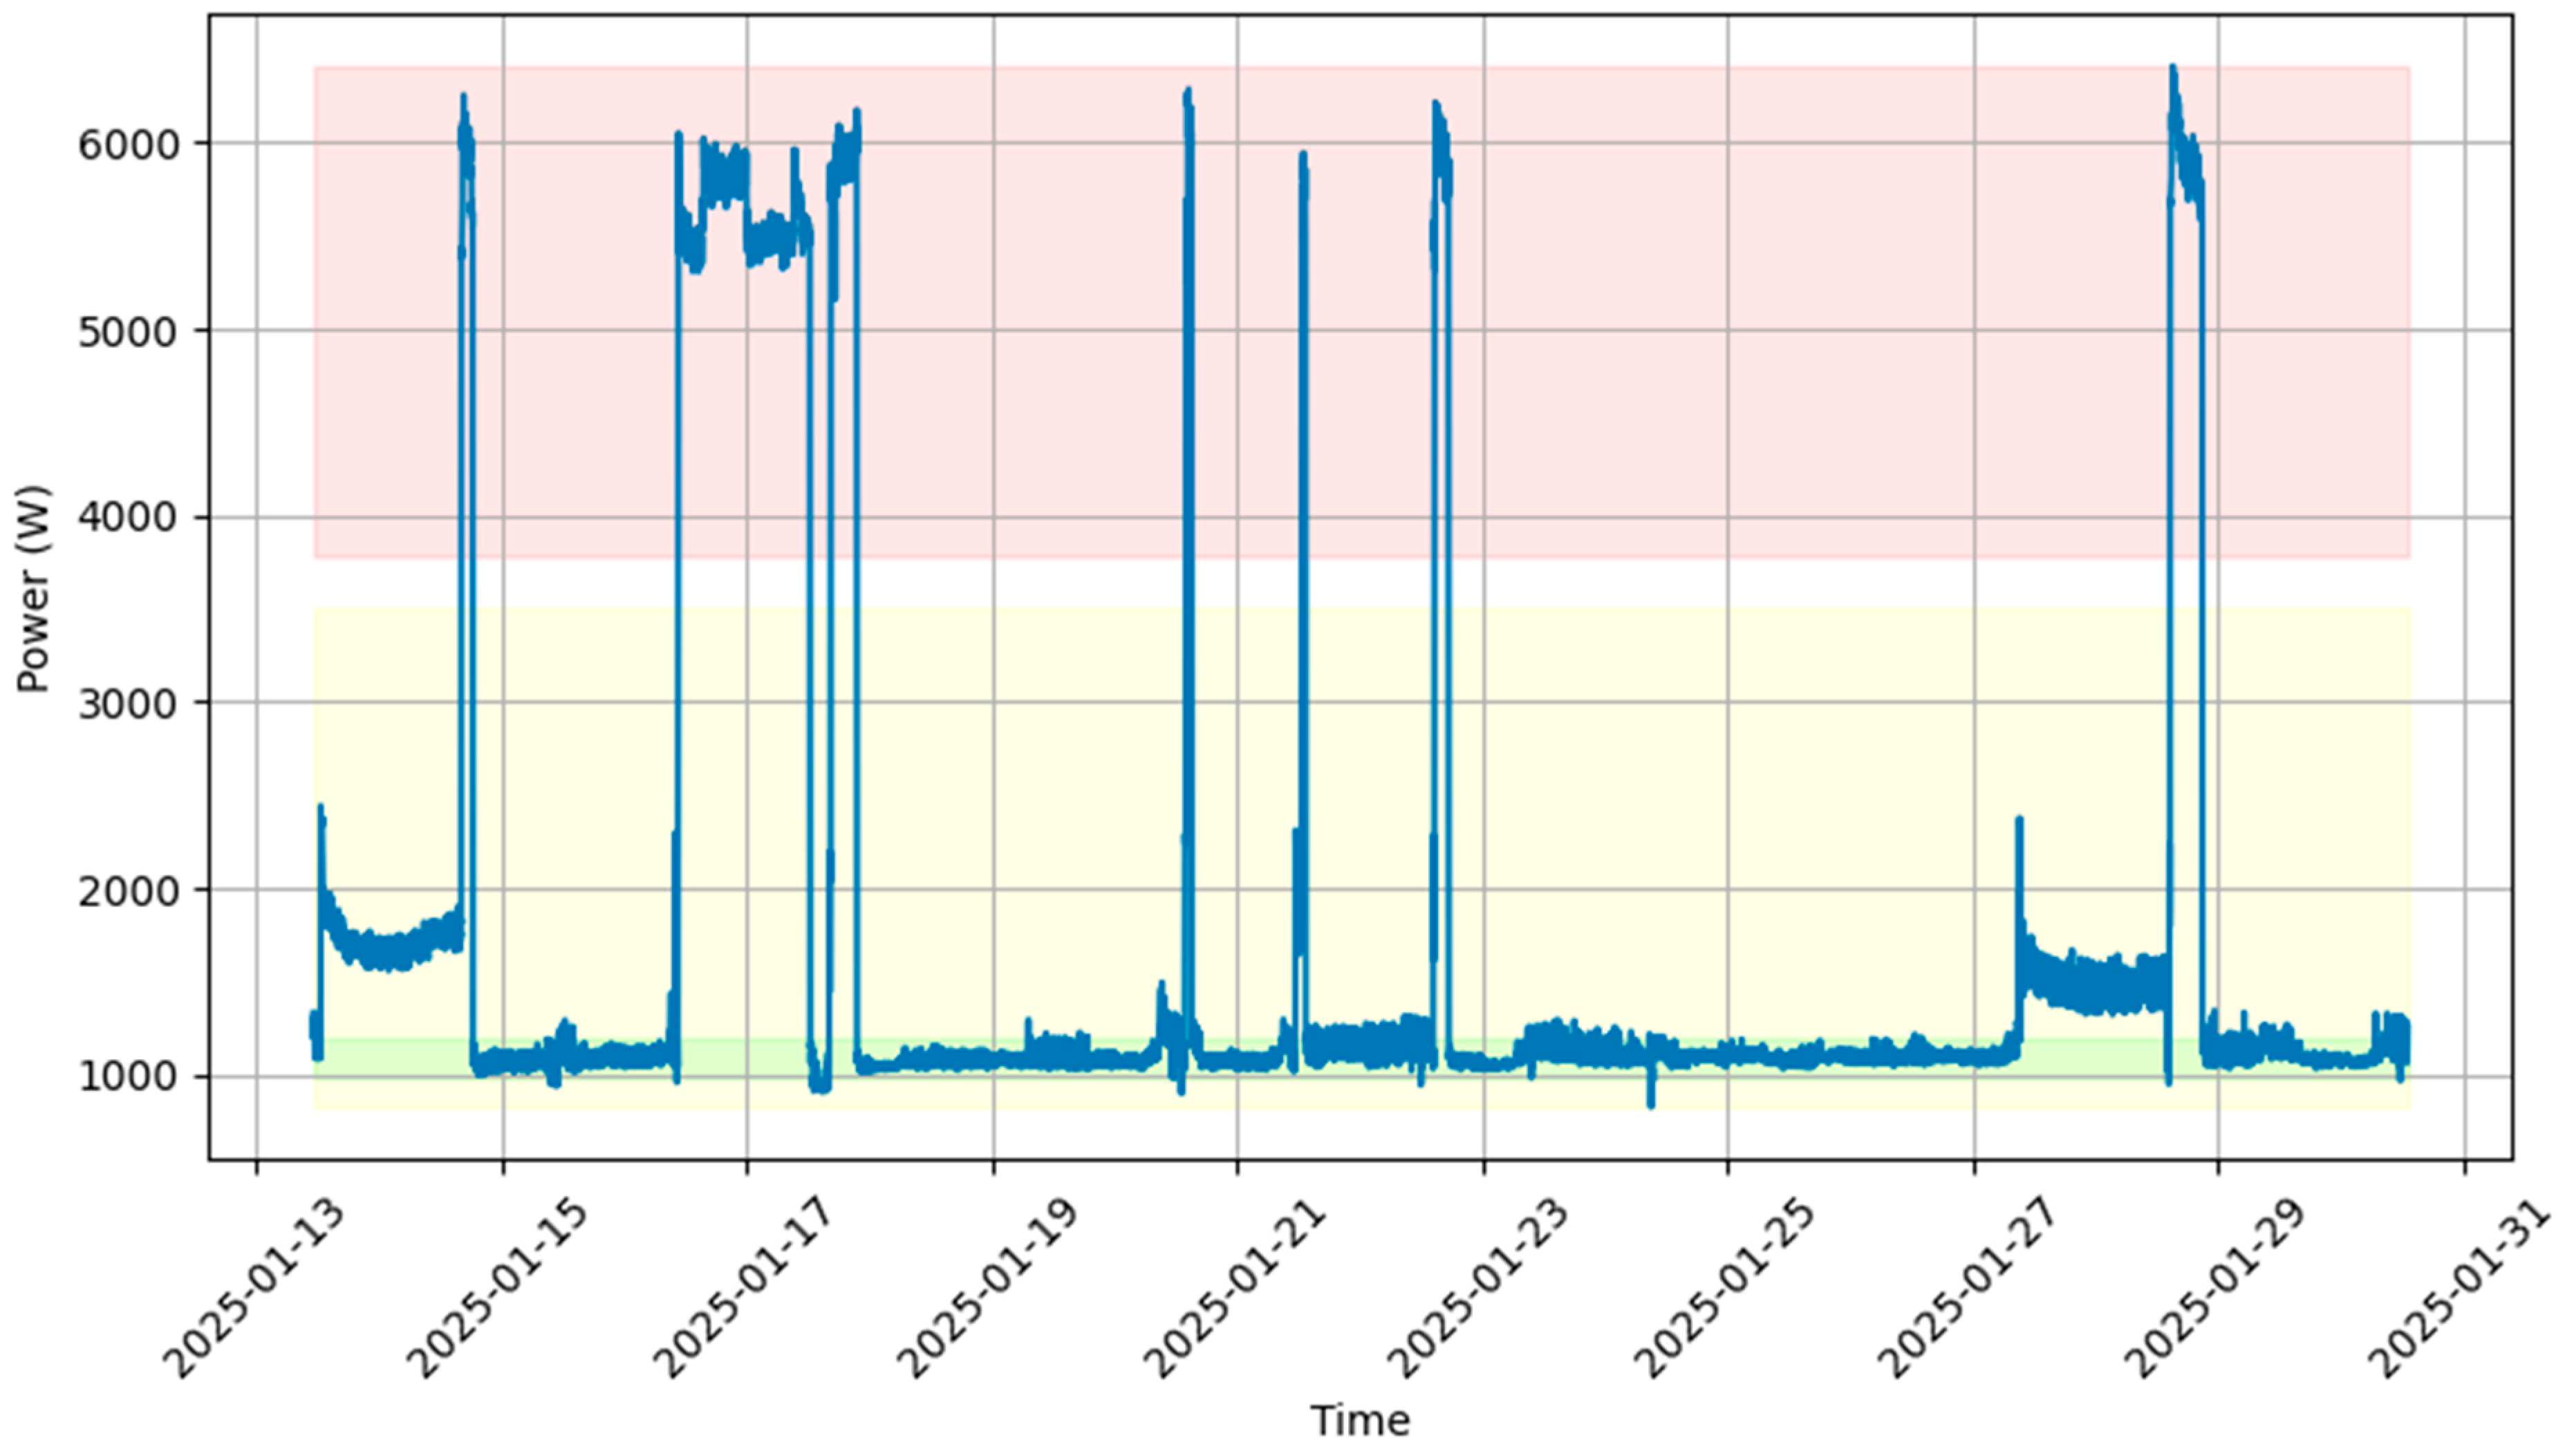
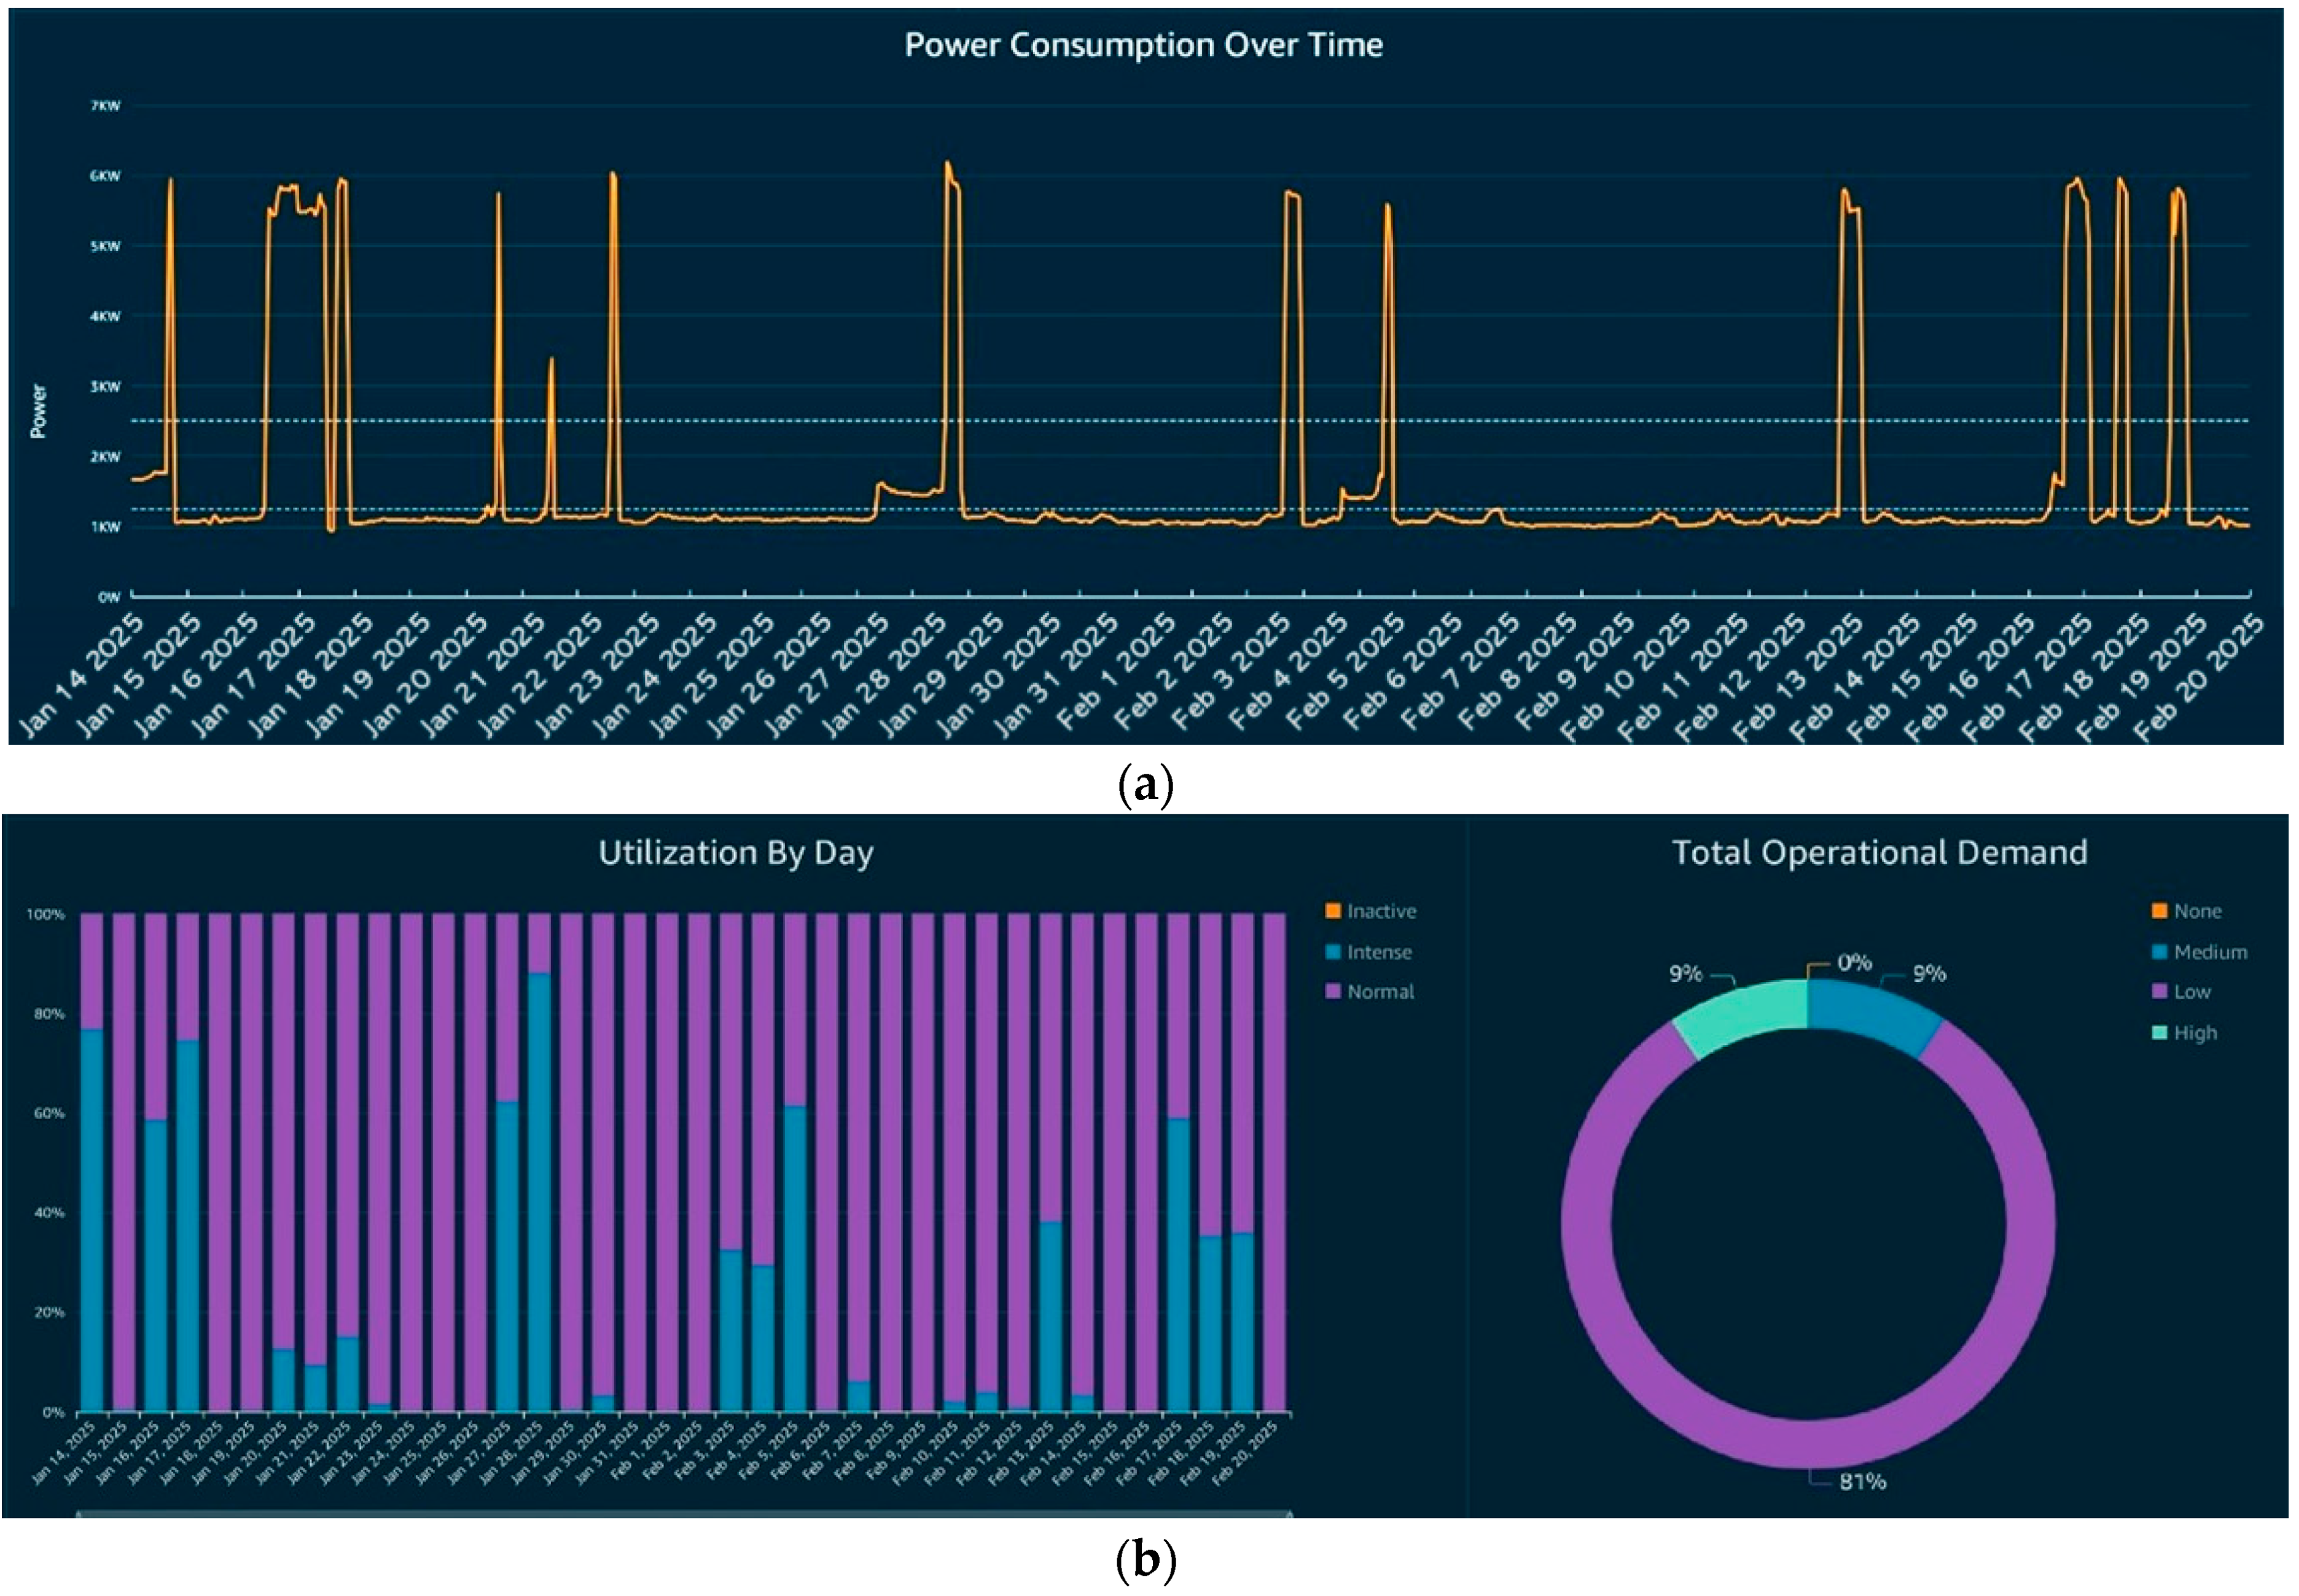
Across deployments, the machine utilisation rates varied between 30% and 65%, with considerable variation across days and shifts. As shown in
Figure 3, which presents a daily time series of machine states, fluctuations in utilisation were often correlated with production schedules and human operator availability. Notably, some machines exhibited extended
idle phases at the beginning or end of a shift, suggesting opportunities to improve the scheduling efficiency or shutdown procedures.
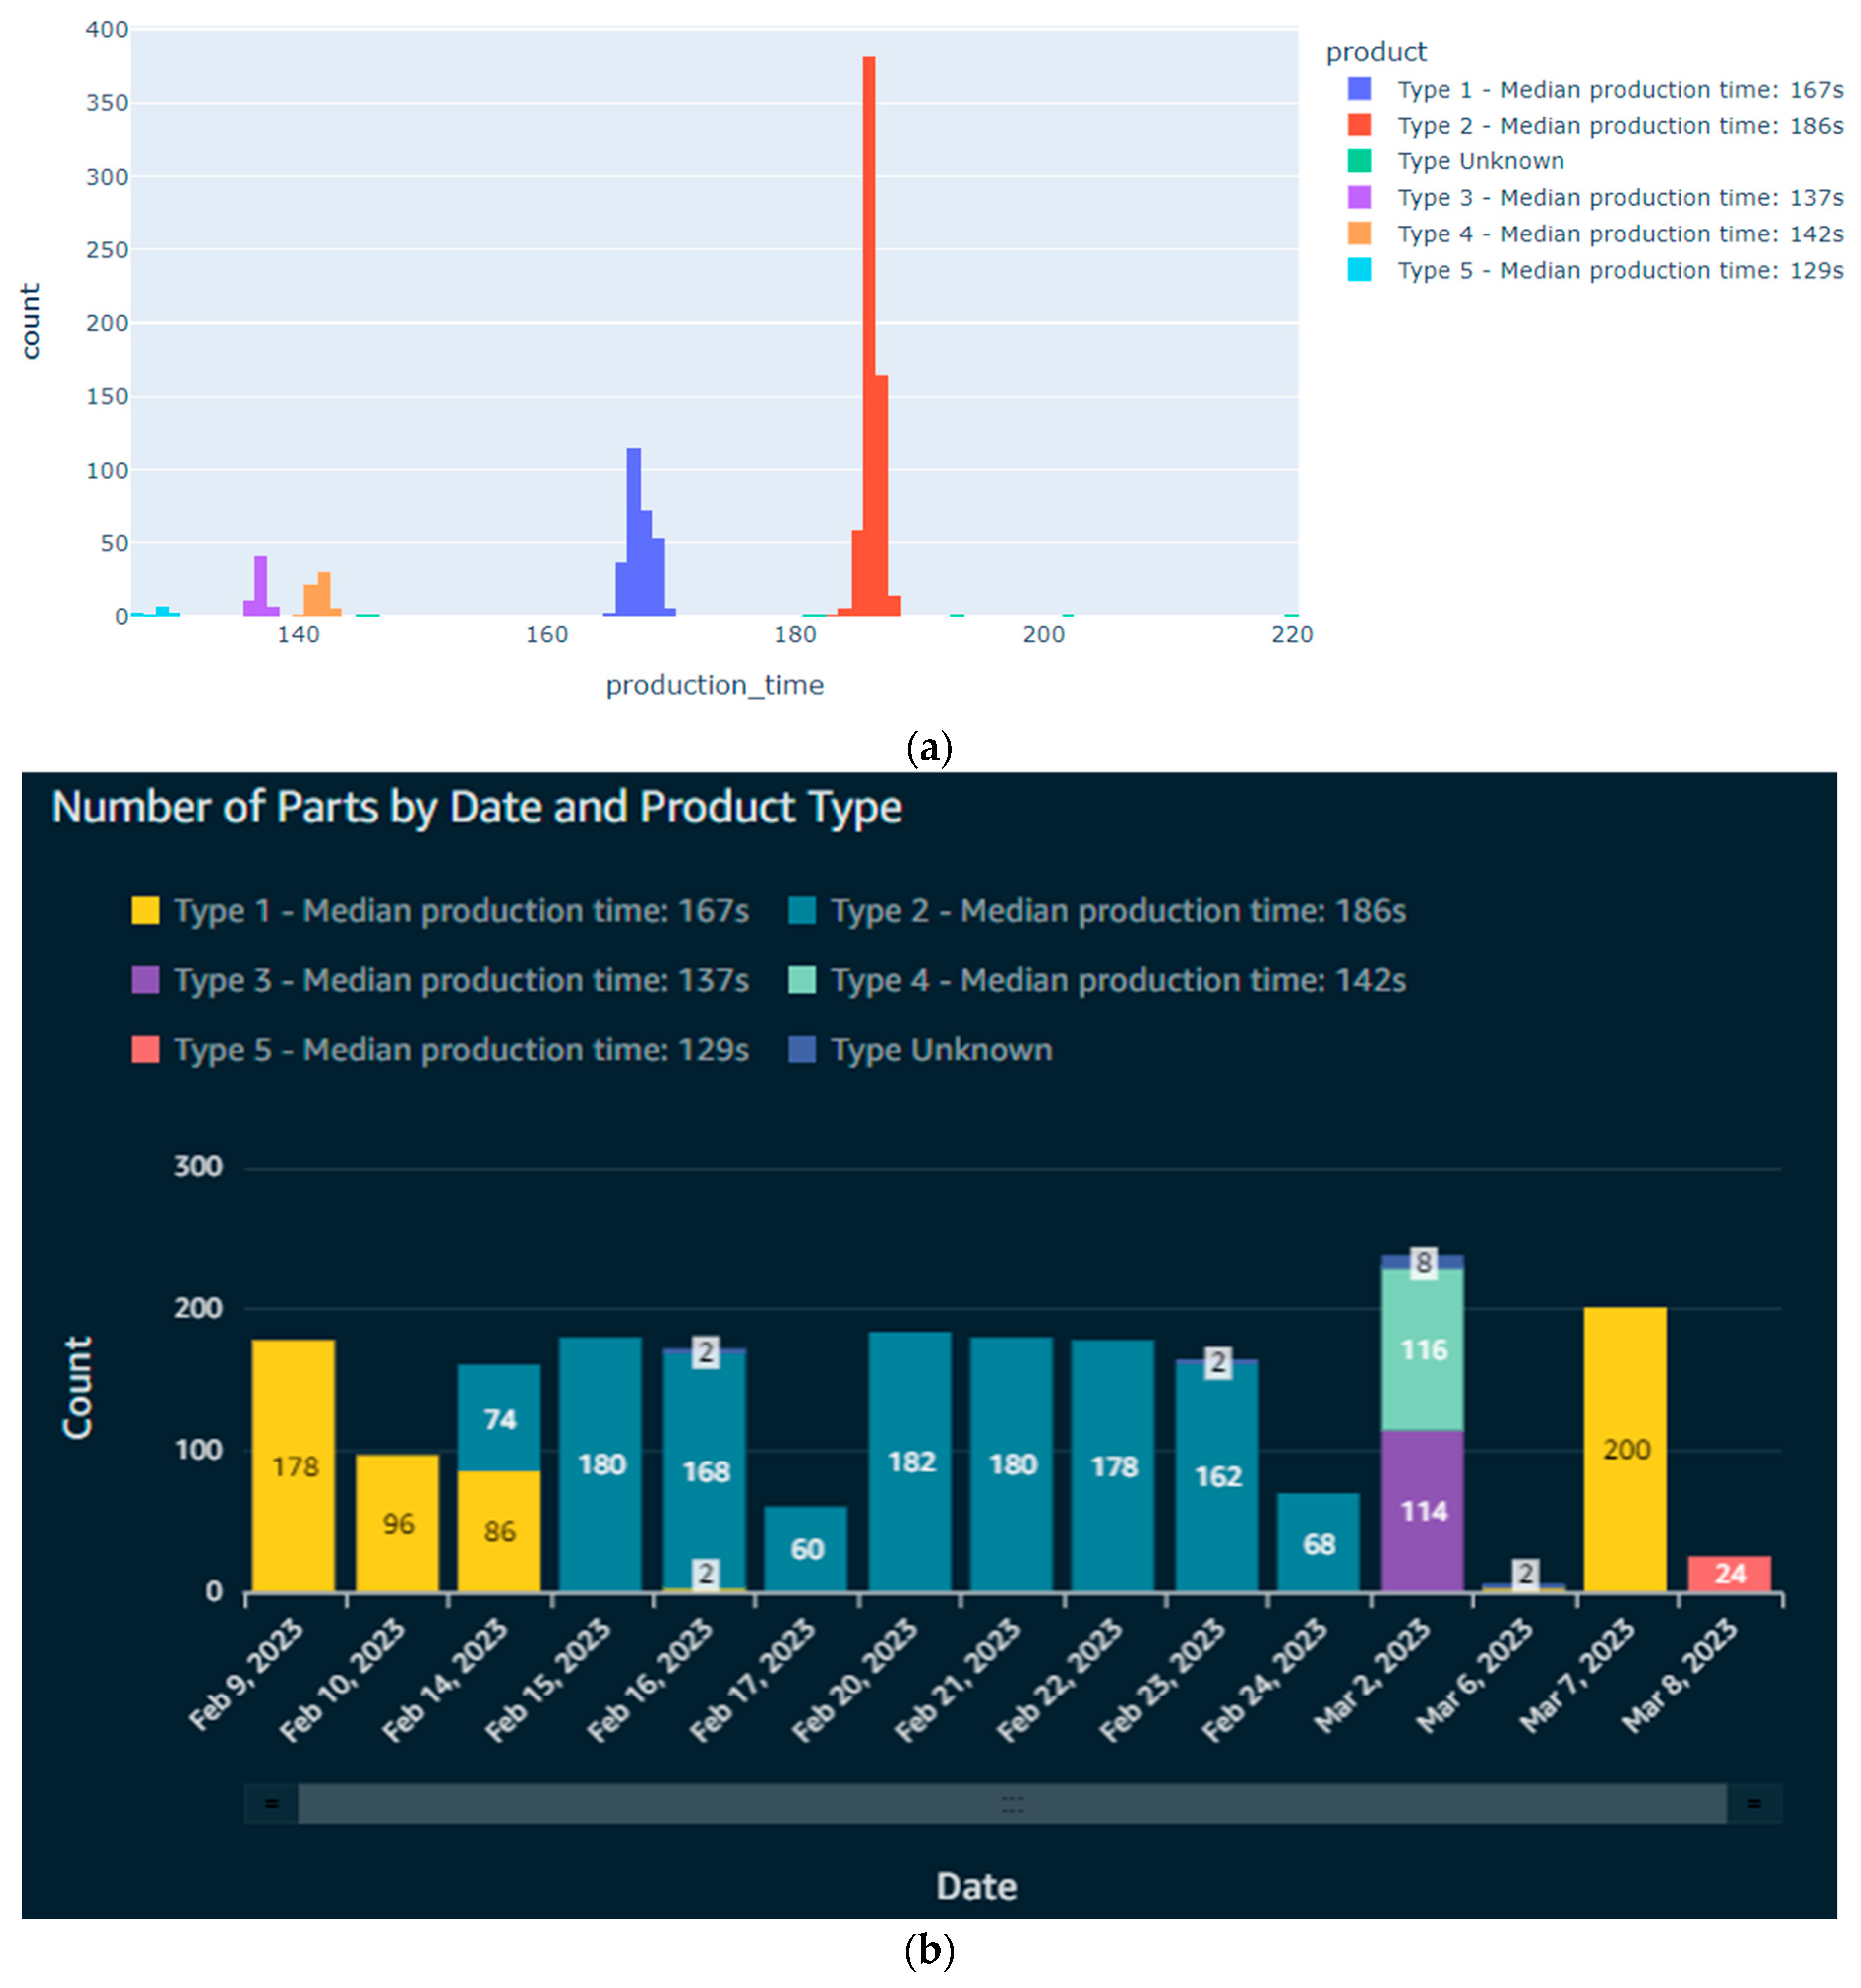
The production events were extracted from
working state segments using temporal heuristics, and their durations were clustered using DBSCAN. This yielded a spectrum of production types, each defined by the length of operation.
Figure 4 demonstrates different examples of clustered bar plots of event durations, where five dominant groups emerge alongside a sparse set of anomalous points (labelled as type “unknown”). These outliers, typically longer or shorter than the bulk of events, are often aligned with known incidents of faulty operation, improper setup procedures, or issues during prototype manufacturing. The clustering results not only reveal the production mix but also provided a basis for quality assurance and quality control assessments.
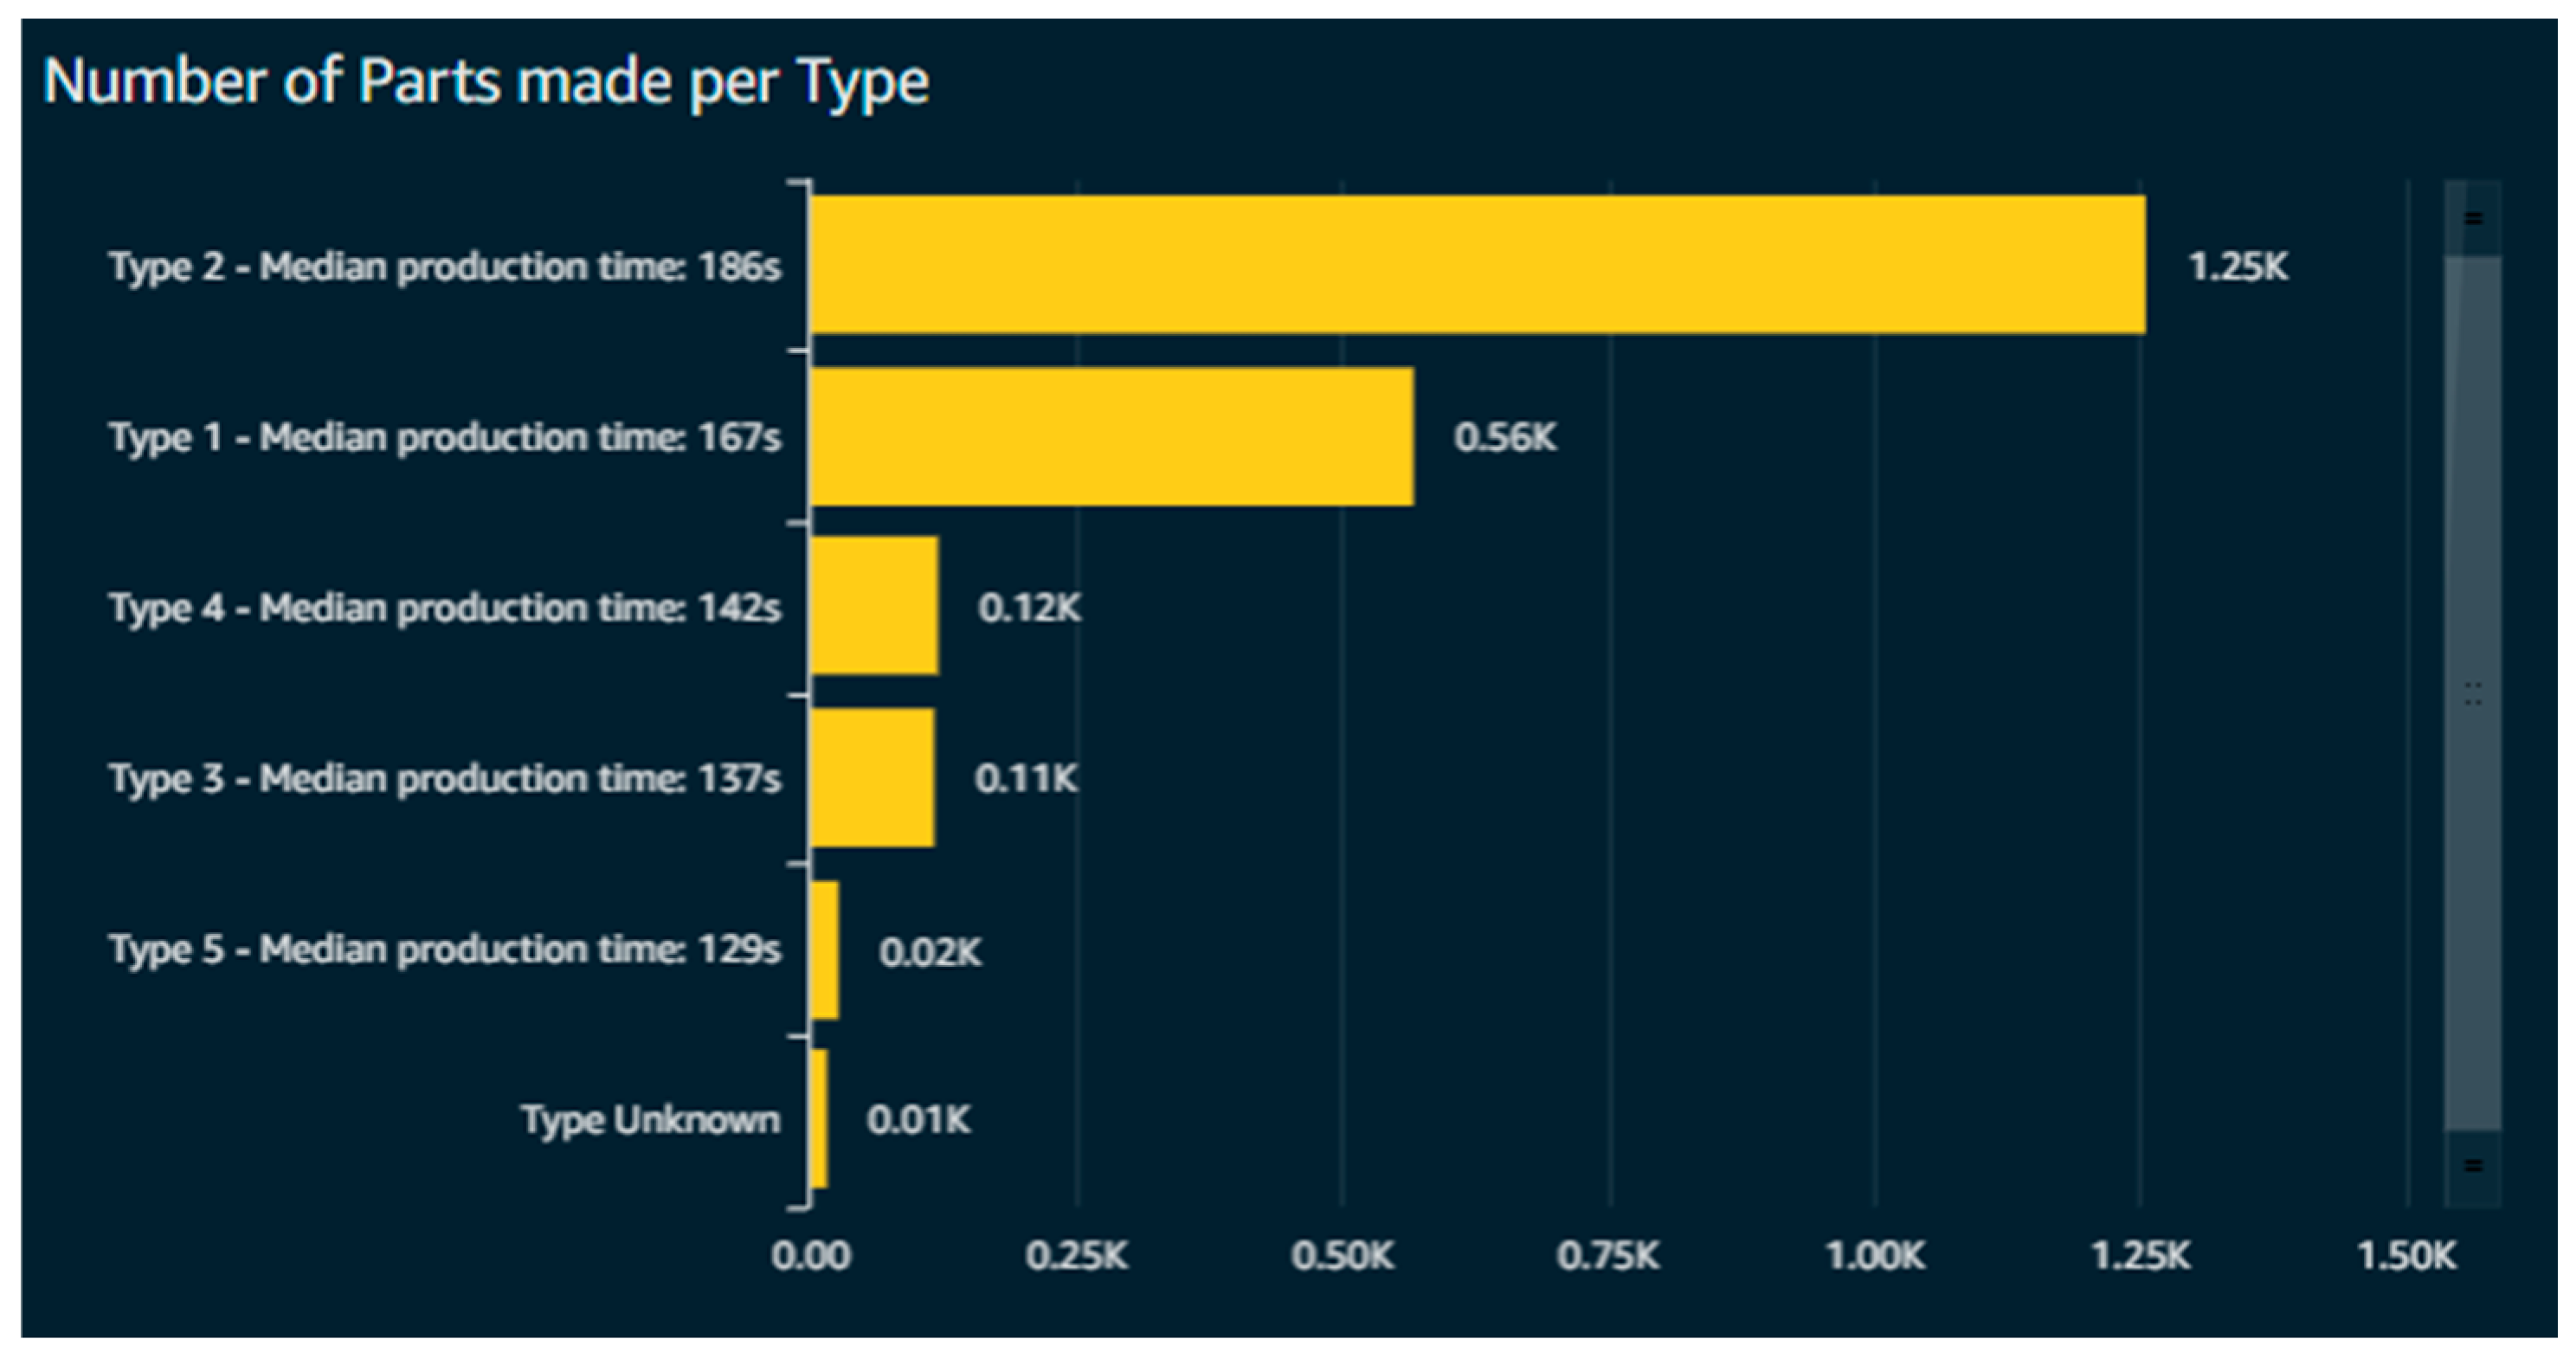
In a specific use case seen in
Figure 5, the estimated production count of a CNC machine was analysed by comparing data from clustered events to manually recorded logs, wherever they were accessible. This comparison aimed to assess the accuracy and reliability of the automated estimation process. The agreement levels exceeded 97% in the most complete datasets, with discrepancies primarily arising from minor timing mismatches or unrecorded special jobs. This level of correspondence supports the validity of the proposed event segmentation and clustering approach. This comparison against manually recorded production logs served as the primary evaluation metric for assessing the classification accuracy and production count reliability. In addition, qualitative validation with SME operators confirmed the interpretability and business relevance of the inferred machine states and product typologies.
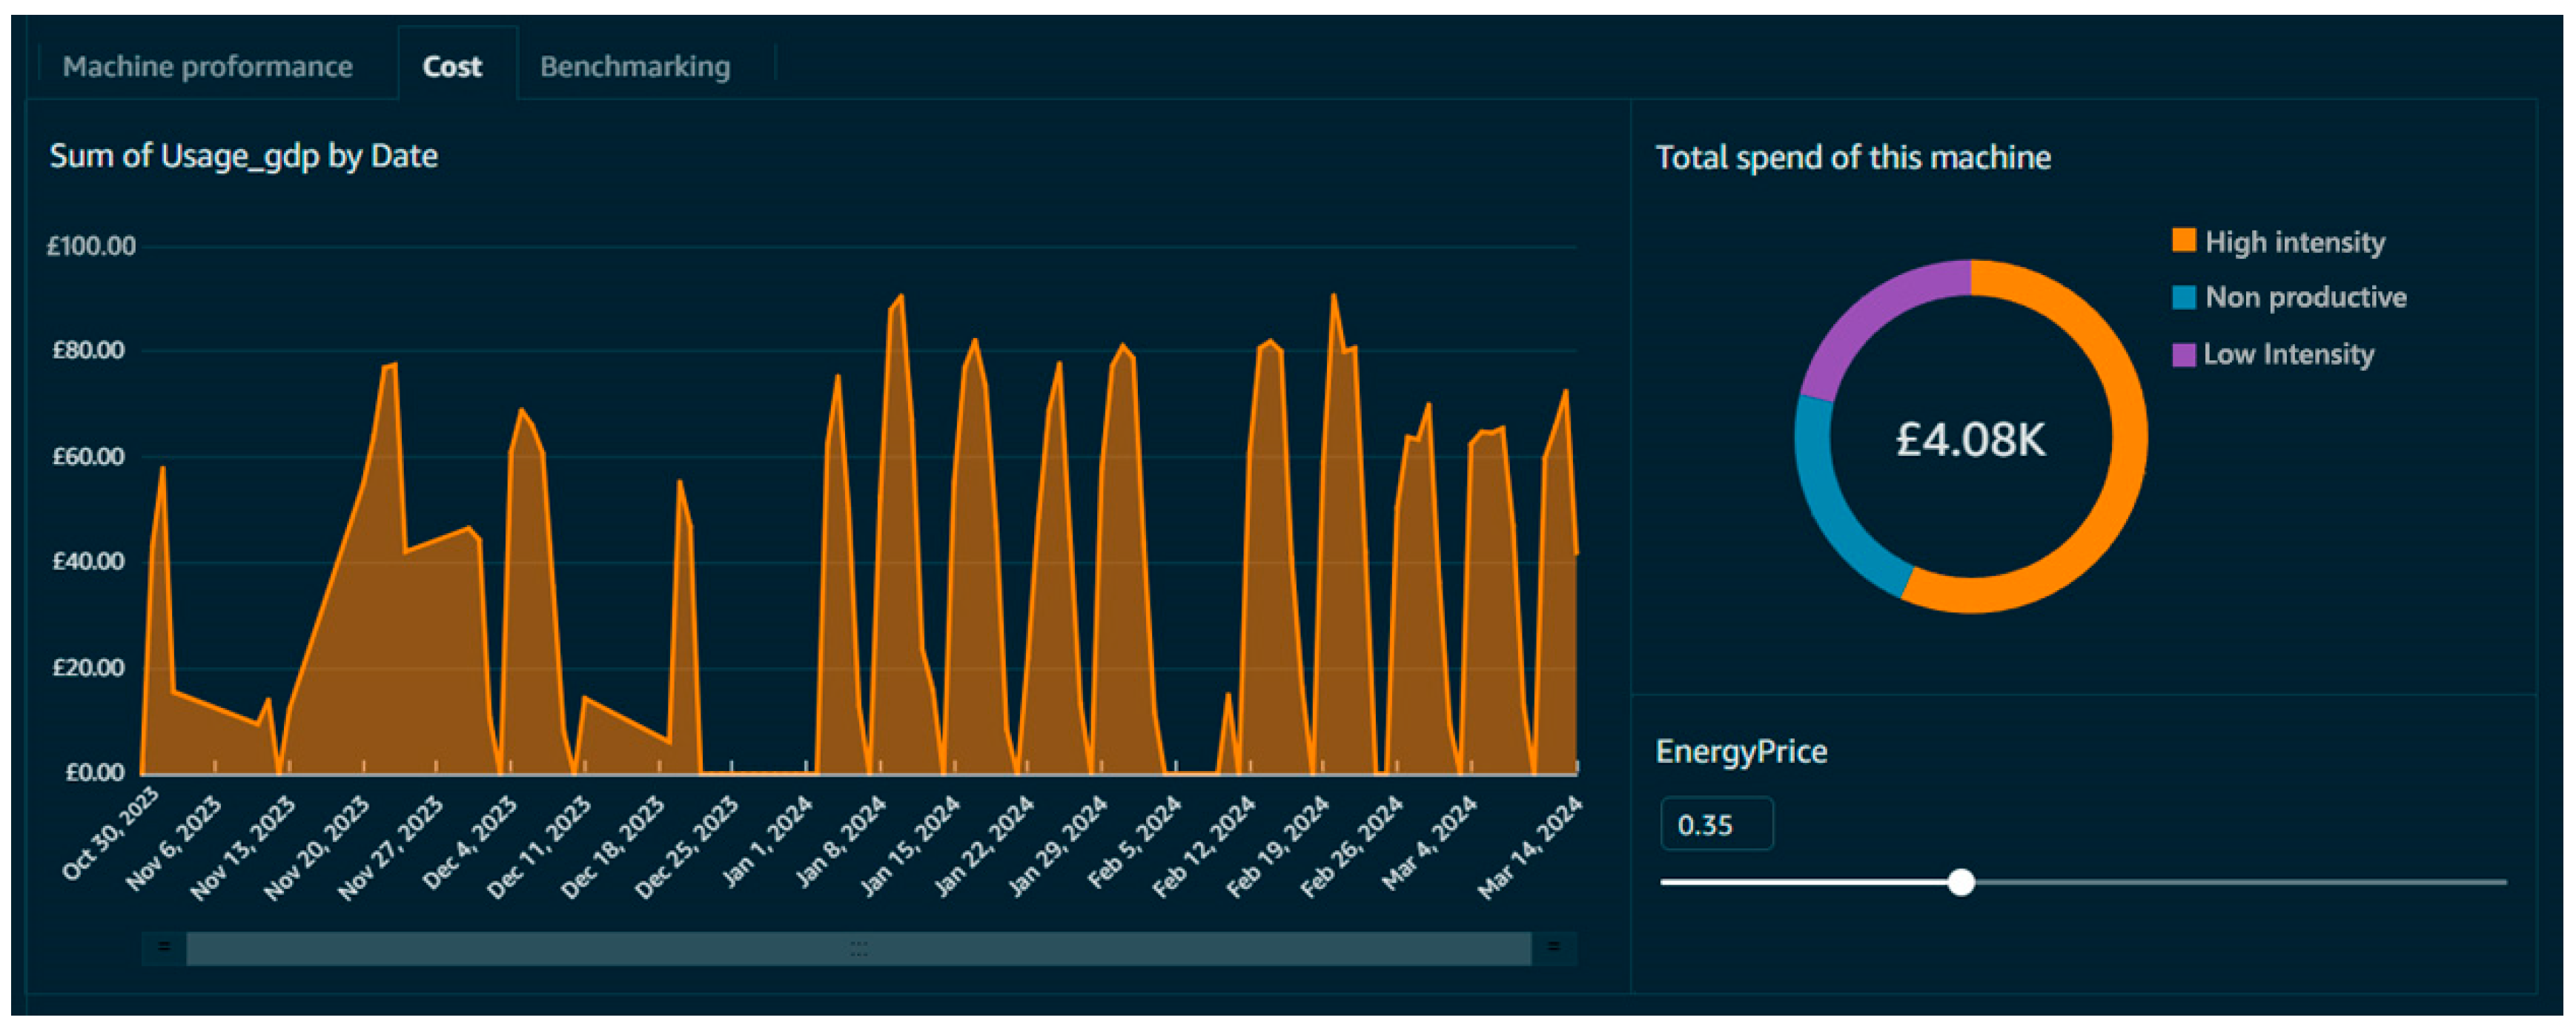
The energy consumption analysis was enabled by integrating power values over time. By summing the power usage within each operational state, it was possible to identify which modes were responsible for the greatest energy expenditure. In several cases, the
idle periods accounted for a disproportionately high share of the total consumption, underscoring inefficiencies related to unproductive energy draw.
Figure 6 shows a breakdown of the energy use by operational state across a representative week, highlighting that even short
idle phases—when aggregated—can constitute a significant cost centre.
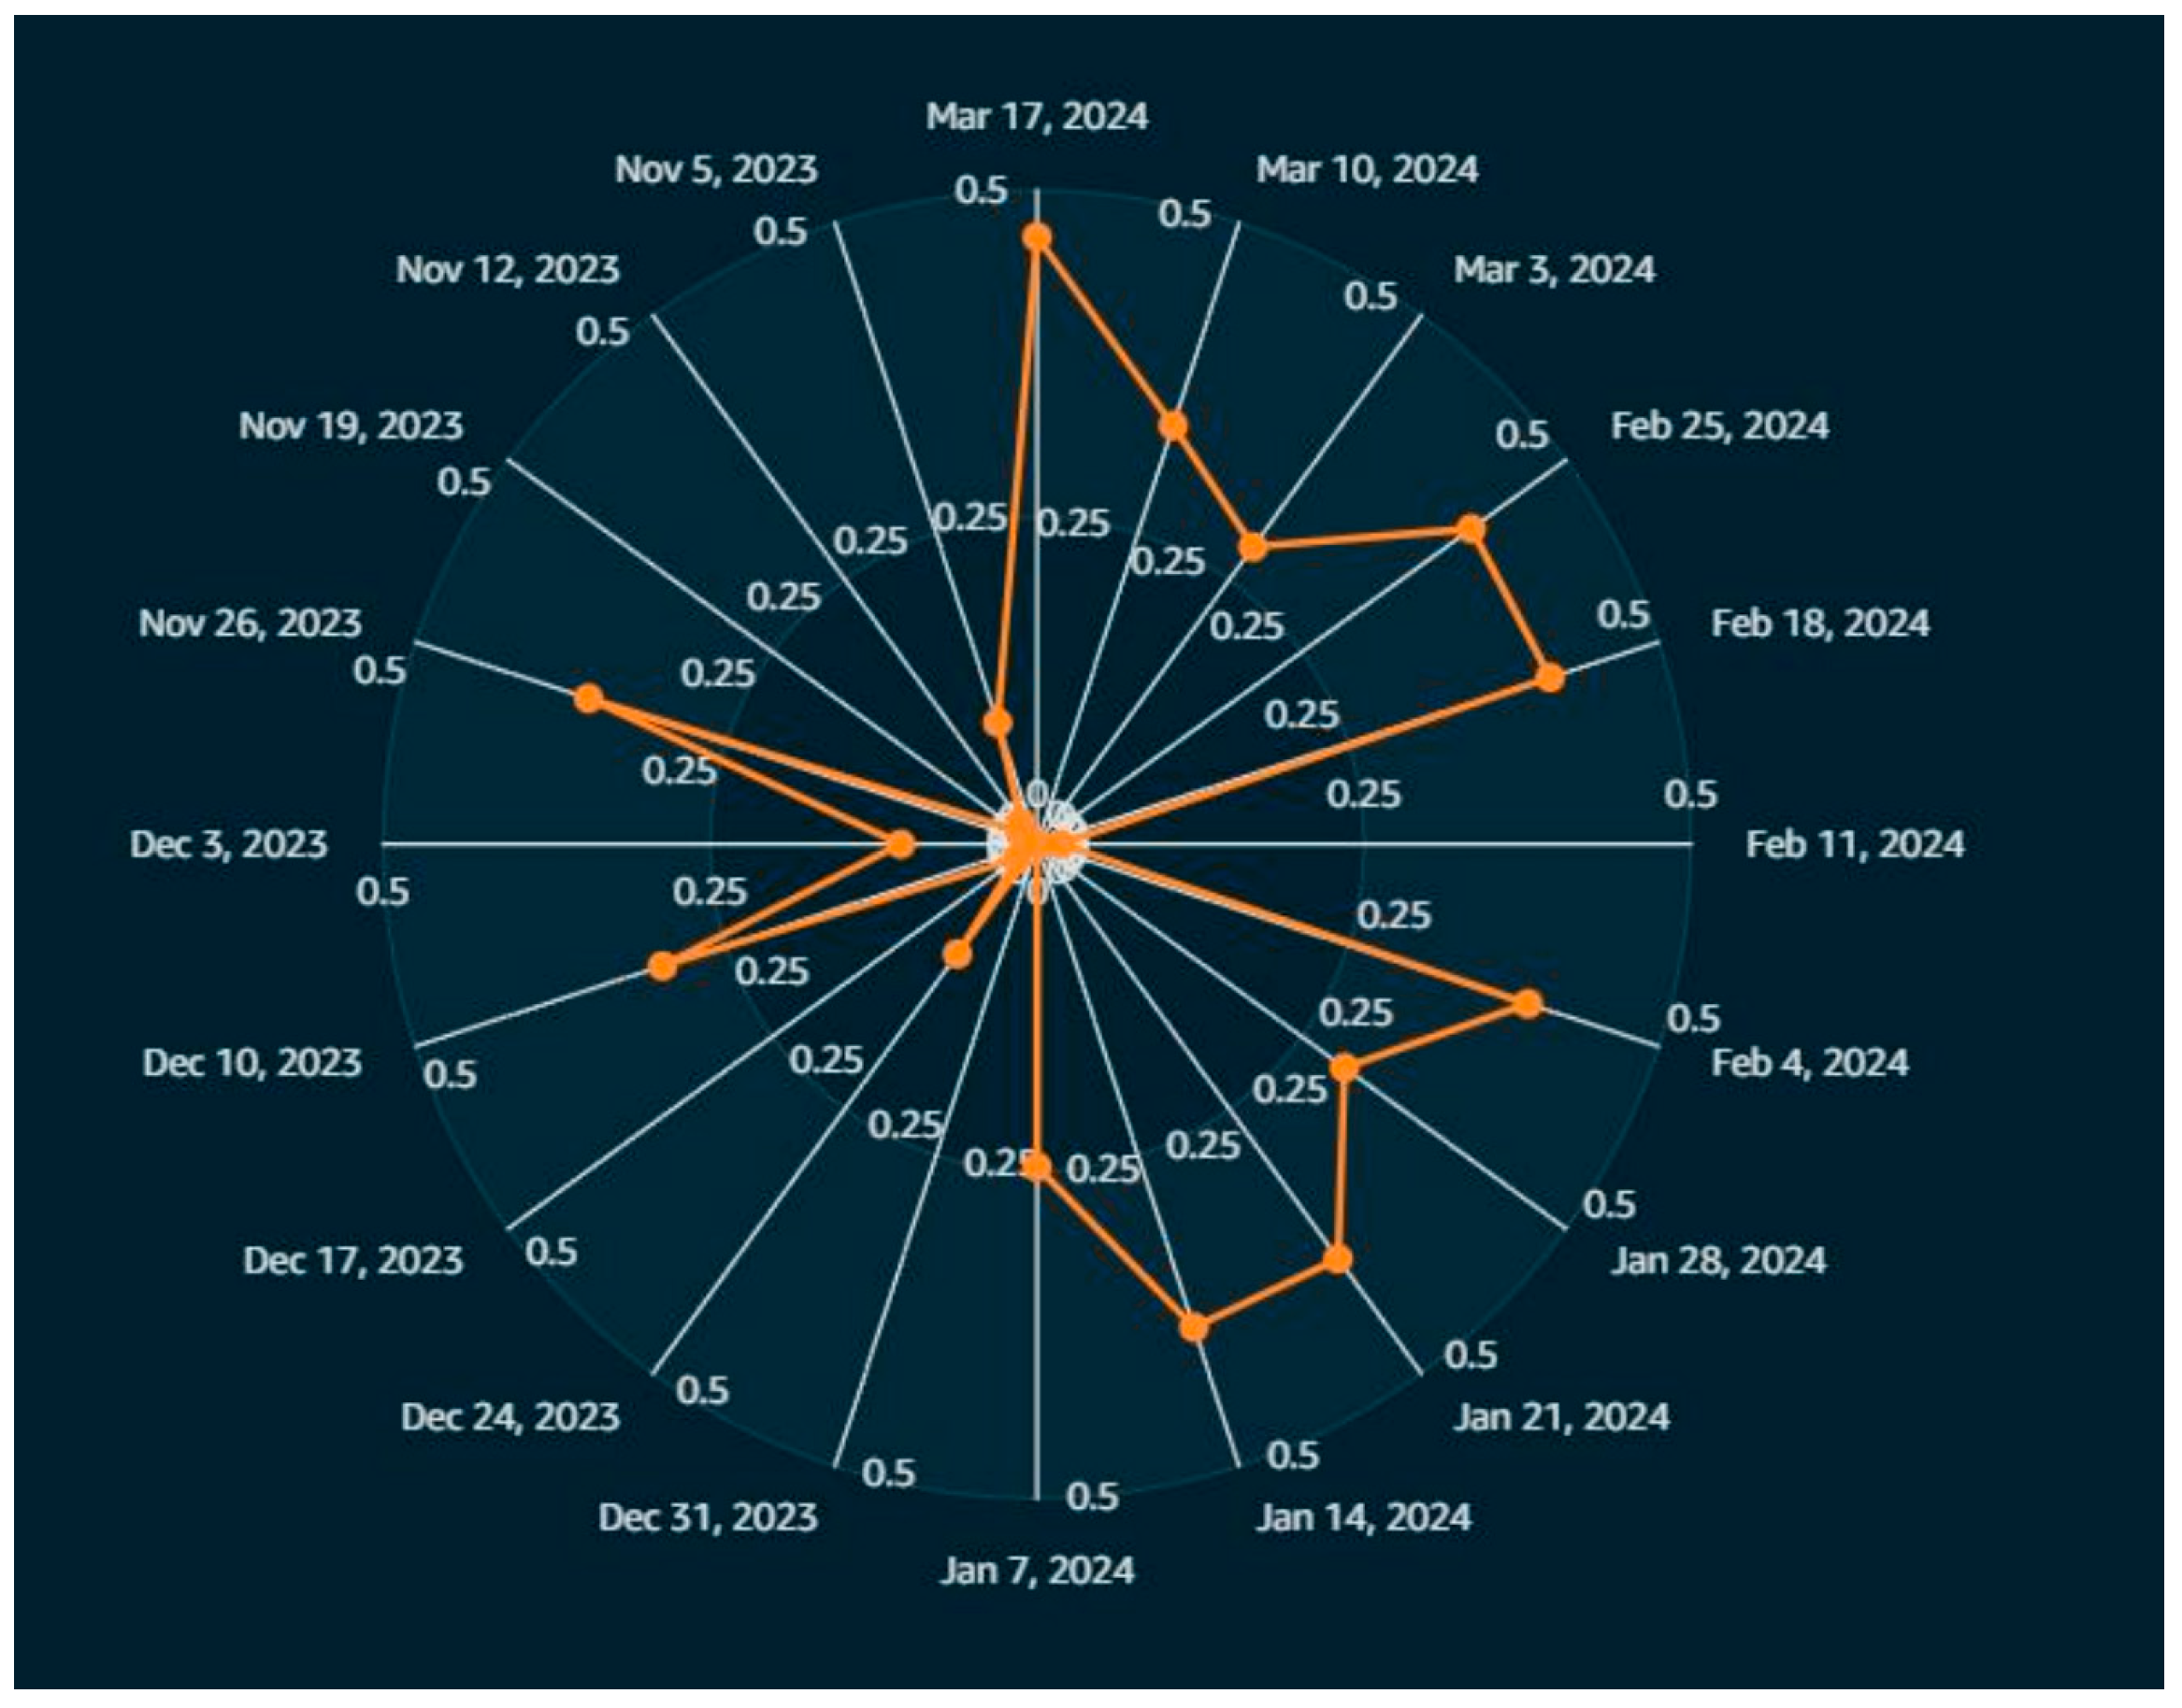
In addition, temporal benchmarking further revealed insights into operational consistency.
Figure 7 illustrates a radar plot for a single machine, comparing daily utilisation patterns over several weeks. The shape and symmetry of these patterns provided a compact summary of the production rhythm, with some machines showing regular behaviour and others exhibiting sporadic peaks and troughs. These profiles were useful for identifying best-practice days or flagging anomalies.
Several practical benefits emerged from the deployment of this methodology. First, machines that were previously monitored via manual logs or not at all were now subject to continuous, high-resolution observations. This led to increased visibility over both productivity and inefficiencies. Second, the automated generation of operational thresholds via GMMs avoided the need for machine-specific manual calibration, making the approach scalable and repeatable across sites. Finally, by using unsupervised learning throughout, the system remained generalisable to various manufacturing contexts without requiring labelled data.
Despite these strengths, certain limitations were also observed. The system’s accuracy in classifying machine states depends on a clear separation of power profiles between states. In cases where idle and working states overlapped significantly due to low-load operations, the clustering became less distinct. In such scenarios, incorporating additional sensing modalities—such as vibration or acoustic data—may help disambiguate these states. Furthermore, the temporal segmentation of production events relies on domain-specific heuristics. While robust in practice, these rules may require minor tuning when transferred to highly heterogeneous production settings.
In summary, the results support the viability of a low-cost, non-invasive, and data-driven approach to machine utilisation analytics. By combining current sensing with unsupervised learning and minimal manual intervention, the system delivered valuable insights into the machine activity, production structure, and energy usage. The figures presented in this section illustrate key aspects of the system performance, including state classification quality, production pattern recognition, and energy consumption profiling.
Across deployments, the analytics outputs enabled measurable operational improvements. For example, one site reduced the machine idle energy consumption by over 20% through adjustments to shift-end shutdown procedures. Another site achieved a 15% reduction in the idle phase duration via improved operator scheduling and coordination. In textile processing, the visibility provided by real-time energy monitoring enabled operational changes that resulted in estimated 10–15% reductions in overall energy costs. The automated product count accuracy, exceeding 97%, enabled the replacement of manual logging processes, thereby improving production reporting and quality assurance processes. These quantified outcomes demonstrate the real-world value of the proposed approach in supporting continuous improvements and cost optimisation in SME manufacturing environments.
5. Discussion of System Limitations and Comparative Advantages
5.1. Limitations of Edge-Based Machine Learning in Industrial Settings
While the proposed ML-enabled system offers a scalable and cost-effective approach for monitoring machine utilisation, it also introduces specific limitations inherent to edge-based deployment, particularly within noisy and resource-constrained industrial environments.
Limitations in processing power, memory, and storage capacity characterise edge devices, which limit the depth and intricacy of the available ML models for application. For low-frequency signals, for example, real-time inference ability using GMMs or clustering techniques such as DBSCAN may be feasible, although for high-dimensional data streams or systems requiring sub-second latency, these approaches are not practical.
Industrial settings are prone to high levels of electromagnetic interference (EMI), thermal fluctuations, and load variability, all of which can corrupt sensor signals. In such environments, non-invasive current sensors may produce noisy readings, reducing the accuracy of the state classification. Without proper filtering and calibration, false positives or misclassifications (e.g., confusing idle with operational states) can arise, especially in low-load or standby operation modes.
Sensors may drift over time due to environmental stress or material fatigue. Since classification algorithms depend on power thresholds inferred from historical distributions (e.g., via Gaussian mixture models—GMMs), uncorrected drift can lead to threshold misalignment. This is particularly problematic in setups lacking periodic recalibration routines or reference baselines.
Unlike cloud-based systems that can aggregate and cross-validate multiple sensor streams, edge systems typically operate with minimal redundancy. If a sensor fails or an edge device becomes unresponsive, the data continuity is compromised, potentially degrading the decision-making or predictive maintenance capabilities. Future implementations should consider hybrid architectures that combine edge inference ability with periodic cloud validation for enhanced performance and reliability.
While TinyML models are deployable to embedded systems, updating them, especially in field deployments, can be cumbersome. Unlike centralised architectures, rolling out model updates or hyperparameter tuning processes in distributed edge environments may require manual intervention, increasing the maintenance overheads for SMES.
5.2. Comparison with Traditional Monitoring Approaches
The proposed ML-powered system offers several clear benefits and trade-offs compared to conventional rule-based systems and industrial PLC solutions. Often based on manually specified static thresholds, rule-based systems fail to adjust to machine wear, load changes, or the operational context, resulting in either high false alert rates or missing anomalies. On the other hand, our approach utilises data-driven, unsupervised learning methods, such as GMMs and DBSCAN, to independently infer dynamic thresholds and identify operational changes, thereby enhancing the sensitivity and robustness over time.
Particularly for SMEs, the proposed system is much more cost-effective and simpler when benchmarked against PLC-based monitoring. The need for expert maintenance, customised software configurations, and specialist hardware integration creates a great barrier to access. Moreover, their usual architecture is centralised, which often calls for sophisticated networking infrastructures or proprietary platforms. On the other hand, the TinyML-based system reported in this work is built on cheap, non-invasive current sensors and edge-computing hardware (e.g., Raspberry Pi), with a plug-and-play configuration that reduces the installation effort and manufacturing disturbances.
Furthermore, the edge-based architecture provides real-time responsiveness without relying on cloud services or constant internet connectivity, thereby leading to improved latency performance and enhanced data privacy—an increasingly crucial issue in regulated industries. Although SCADA systems offer thorough control and visualisation opportunities, they are less flexible in adjusting to shifting production patterns without manual reconfiguration. Especially in heterogeneous and changing production contexts, the proposed approach offers greater scalability and flexibility, as it can learn from raw sensor data and self-adjust.
5.3. Practical Use of Analytics by Factory Managers
In practical deployments, the analytics outputs generated by this system were used by factory managers and engineers to inform a range of operational decisions. The visualisation of machine state distributions and idle time patterns enabled the identification of inefficiencies in scheduling and shift management, prompting targeted changes to operator start-up and shut-down practices. The production event clustering provided an objective basis for production reporting and a product mix analysis, which are particularly valuable in SME contexts where the manual logs are incomplete or absent. The energy consumption breakdowns highlighted cases where idle modes accounted for a disproportionate share of the total energy costs, motivating the adoption of enhanced power-down policies. In several instances, the detection of anomalous production events led to proactive maintenance interventions or quality investigations. Overall, the system provided the factory teams with actionable and interpretable insights that supported continuous improvement, informed scheduling, and enhanced energy management efforts, complementing existing lean and sustainability initiatives.


