Abstract
In functionally graded polymer foam, mechanical properties and chemical composition vary in a prescribed direction according to a power law distribution. However, most manufacturing methods lack precise control over pore size, limiting their application. In this case, the graded foam structure can be formed from separate layers, with each layer assigned unique values in terms of mechanical properties or chemical composition based on the power law distribution. The hypothesis of the work is that the application of functionally graded (FG) foam materials inside the rotor blades or wings of an unmanned aerial vehicle can provide the ability to vary their stiffness properties. The aim of this work is to conduct an investigation of the static behaviour of a composite box plate with constant and variable heights that simulate the dimensions and changing profile of a helicopter rotor blade. In the numerical analysis, two models of composite box plate are considered and the material properties of graded polymeric foam core are assumed to vary continuously by the power law along the width of cross-sectional structures. It is not possible to model the continuous flow of graded properties through the foam in construction; therefore, the layers of foam are modelled using discontinuous gradients, where the gradient factor changes step by step. The numerical results are obtained using ANSYS software. The results of the numerical calculation showed that the use of graded foam affects the parameters under study. The stiffness of a structure significantly decreases with an increase in the power law index.
1. Introduction
The development of new materials is one of the main directions of progress in the modern world. The evolution of materials from monolithic single-component structures to multi-component alloys and composites, combining the physical–mechanical properties of different types of constituent, ensures the creation of new materials with improved characteristics. One such method is the creation of functionally gradient materials (FGMs).
FMGs are traditionally characterized by a smooth change in composition or structure within their volume in accordance with a prescribed law. This ensures the possibility of controlling the physical–mechanical properties of the material and obtaining products with unusual characteristics. As a first approximation, FGM can be represented as a layered material in the surface layers whose properties differ sharply from those of the underlying material [1]. FGMs with spatially variable properties were created for special applications such as rocket engine components, aerospace structures, turbine blades, etc. The FGM concept was proposed in 1984 in Japan during the development of thermal insulation coatings for reusable spacecraft [2,3]. The coatings developed, with a thickness of 10 mm, had an external refractory ceramic layer that smoothly transitioned into an internal heat-conducting metal layer, which made it possible to withstand temperature differences of up to 1000 K without destruction.
The development of FGMs led to studies on the static and dynamic analysis of beams, plates, and shells made of these materials using analytical and numerical methods based on the Euler–Bernoulli theory, first-order shear deformation theory (FSDT), quasi-3D theory, higher-order shear deformation theory (HSDT), and the finite element method (FEM) [4,5,6].
Sandwich structures, such as beams and plates, with a core made of FGMs are of particular interest. Most often, ceramics and metals with porous structures are used as the core of a sandwich structure, the properties of which change throughout the thickness of the structure [7,8,9,10,11].
Polymer foams are among the promising FGMs in sandwich structures, displaying low density, chemical resistance, heat and sound insulation characteristics, and energy absorption capacity. The combination of these properties allows one to design multifunctional products [12]. Polymer foams are generally porous materials consisting of two or more phases. In two-phase polymer foam, the polymer matrix forms the continuous phase and the gas bubbles form the porous phase. The porous structure is generated by using a chemical or physical blowing agent, causing the formation of gas bubbles in the polymer matrix. When using chemical blowing agents, the gas bubbles are formed by a chemical reaction, usually due to the decomposition of a chemical substance [13,14,15]. At present, various approaches have been proposed to obtain composite polymer foams with variable gradients of density and elastic modulus, including moulding, additive processes, templating, solvent-based approaches, etc. [16,17,18,19,20]. Gradient changes in the physical–mechanical properties of polymer foams allow the material to be adapted to specific loads, thermal conditions, or other operational requirements.
Compared to ceramic- and metal-based functionally graded materials, the manufacturing applications for graded polymer foam remain limited [21]. Composition gradients were achieved by incorporating filler particles while simultaneously adjusting the viscosity of polymer solutions and the rotational speed during centrifuge mixing [22,23]. A method in which microstructural gradients were introduced through lamination techniques was reported in [24]. For instance, in epoxy matrices reinforced with long fibers, gradients were formed by sintering fiber bundles under a graded temperature field. Slices of syntactic foams with varying densities were laminated by Chen et al. to fabricate graded foam structures [25]. Polymer blending represents another approach for generating graded porous structures. By applying tailored thermal boundary conditions and introducing thermal gradients during compression molding, various types of gradient porous structures have been produced [26,27]. Additionally, microstructural gradients were created in polyurethane foams—such as variations in cellular architecture and pore size distribution—by Torres-Sanchez et al. by applying ultrasound during the foam solidification process [28]. Elsing et al. present approaches to producing graded foams with a defined gradient in pore size and/or density [29]. The approaches are based on routes to produce monodisperse polystyrene foams, which were developed in laboratory. A fabrication process was reported by Zhou et al. to produce functionally graded porous polymers via supercritical carbon dioxide (sCO2) foaming [30]. They demonstrated that functionally graded foam structures can be created from partially saturated polymer samples.
One of the possible applications of FG polymer foams is in the field of aircraft construction. The blades of a helicopter rotor during flight are subjected to significant vibrations and oscillations, arising due to the influence of aerodynamic loads during their rotation. Methods for reducing the vibration of helicopter blades are divided into passive and active. Passive methods use various damping devices and shock absorbers [31]. Active methods use electric or hydraulic drives that control blade vibrations using higher harmonics: higher harmonic control (HHC) and individual blade control (IBC) [32].
Piezoelectric materials have given a new impetus to the study of vibration and oscillation control in the helicopter blades, leading to the development of active trailing-edge [33] and active-twist blades [34]. The active trailing-edge concept involves the deformation of the tail section of the rotor blade and the control of aerodynamic loads. Active-twist blade is achieved by creating a controlled twist in the blade around its longitudinal axis using piezoelectric actuators (Macro Fiber Composites) that are located on the blade surface at an angle of ±45°. The development and application of functionally graded foams as filler inside the rotor blades opens up the possibility of changing their stiffness characteristics, as well as changing the position of the elastic axis and the centre of gravity of the blade. This, in turn, contributes to the more efficient control of the rotor blades during flight, requiring less electrical energy to implement active twist [35].
The novelty of this work lies in the study of a simplified full-scale model of a helicopter blade with the distributed gradient properties of foam material inside the structure. The influence of the distribution law of functionally graded foam on the rigidity characteristics of the structure, including bending and torsional stiffnesses, as well as the position of the elastic axis and the centre of gravity, is analysed. The problem stated is solved numerically via the finite element method using ANSYS software, which allows us to perform parametric studies using different values of the power law index [36,37,38,39,40].
The present study is not only of interest from the helicopter engineering point of view, but also has wider engineering potential. In particular, the results can be used in the design of adaptive and lightweight structures for other aerospace or transport applications, where it is important to fine-tune the distribution of masses and stiffness.
2. Materials and Methods
2.1. Configuration of Composite Box Plate
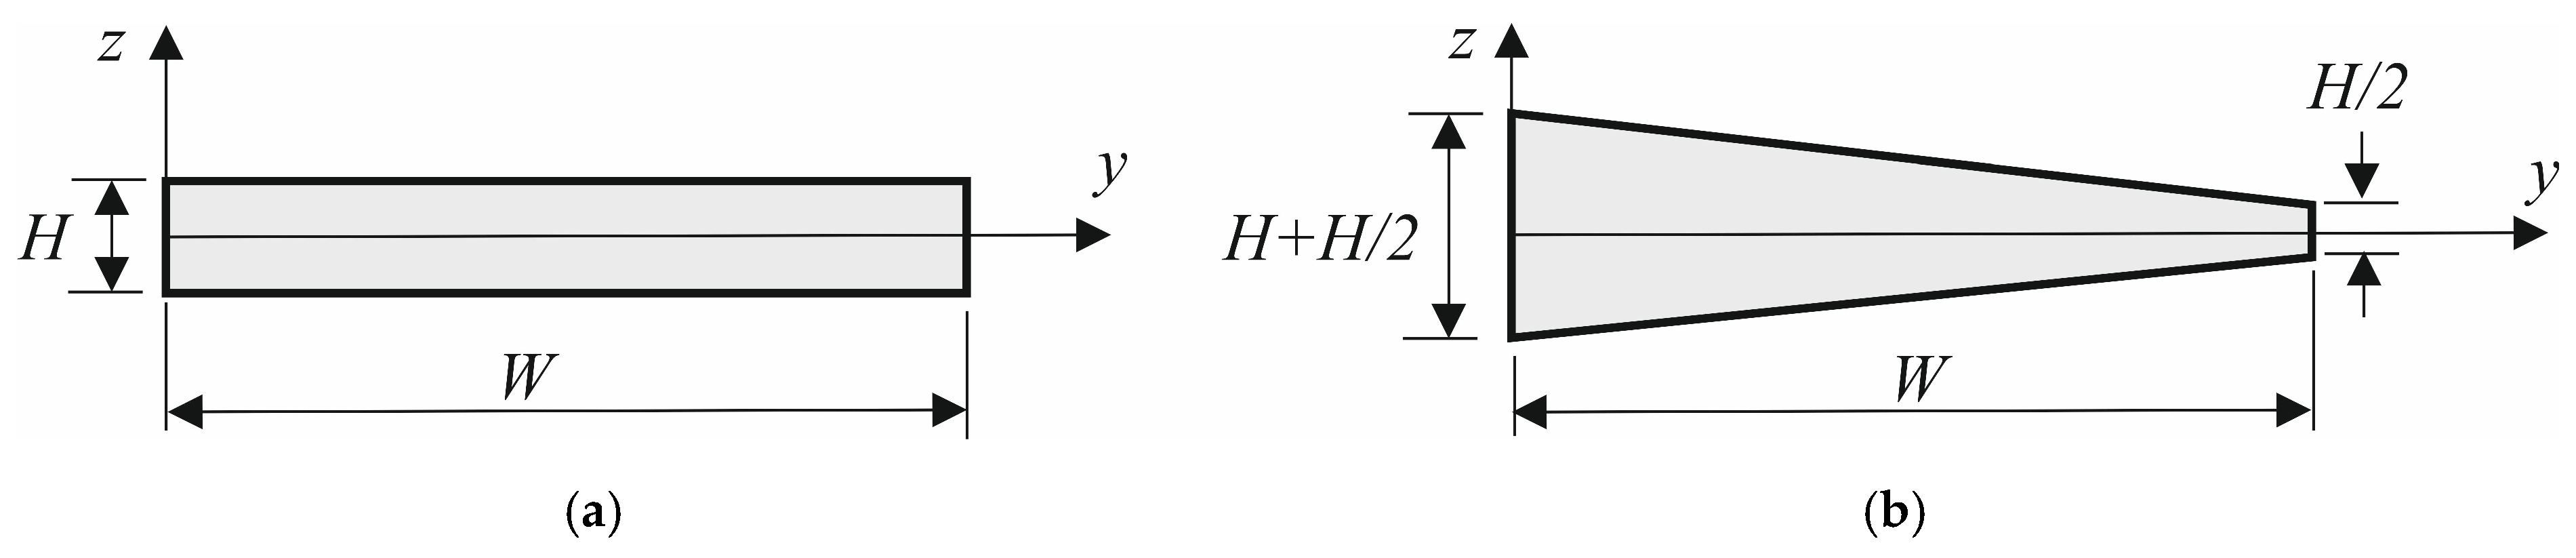
A structure that is typically used in aerospace applications is analysed in this paper. Two types of configuration of composite box plate with functionally graded foam are considered in this research. The cross-sections of composite box plates are shown in Figure 1. A composite box plate of Type 1 has a constant thickness (see Figure 1a), whereas the thickness of composite box plate of Type 2 varies linearly along the -axis, as shown in Figure 1b. The dimensions of composite box plate are as follows: width (W) = 0.3 m, thickness (H) = 0.03 m, and length (B) = 3.75 m. The core in the box plate is modelled using graded polymeric foam, whose properties vary smoothly across along the x-axis. Unidirectional glass fiber-reinforced polymer (GFRP) was used to model the skin. The skin consists of two layers of glass fibers with a stacking sequence of [+45/−45]. The thickness of one layer is 0.125 mm.

Figure 1.
Configuration of composite box plate with functionally graded foam: (a) Type 1, with constant thickness, and (b) Type 2, with variable thickness.
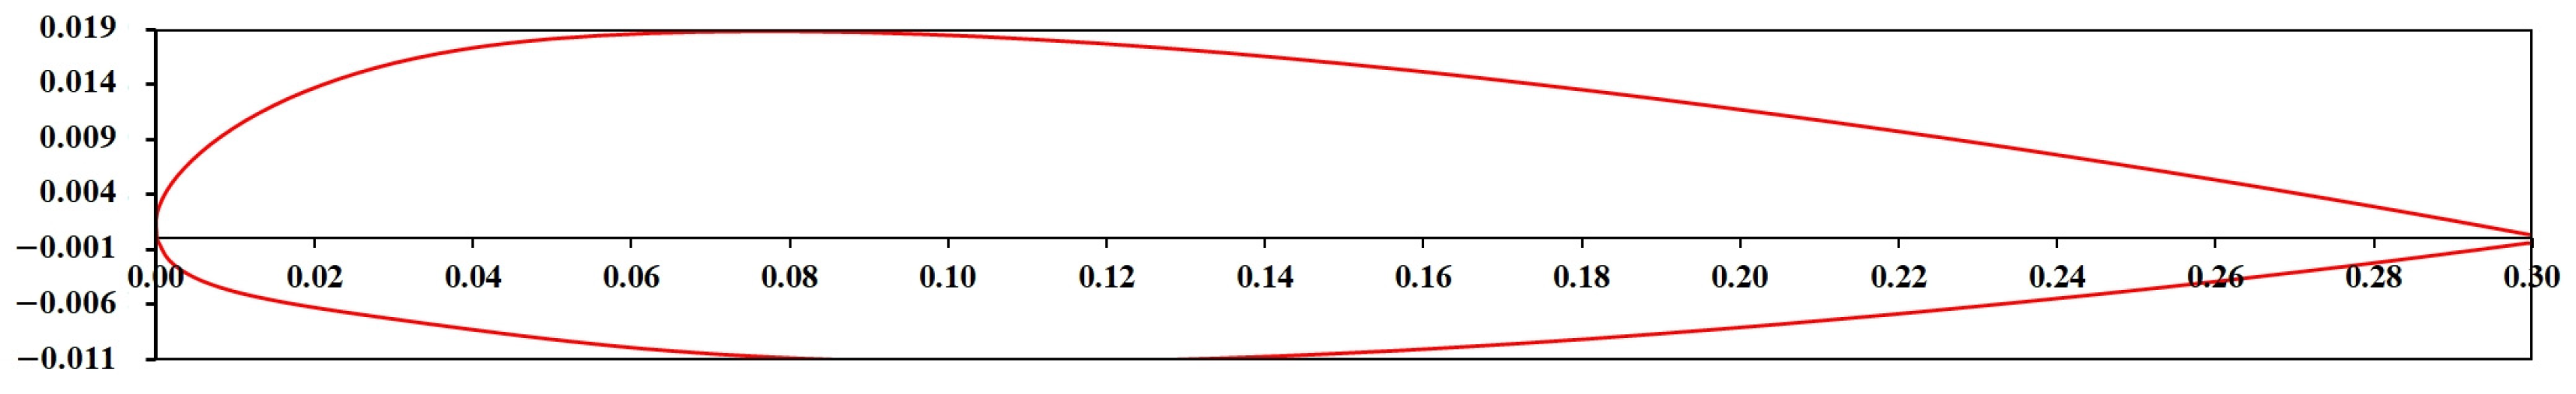
These configurations and dimensions were not chosen by chance. The investigated configurations of the composite box plate are based on the passive BO105 full-scale rotor blade with a C−spar, equipped with NACA23012 airfoils. Figure 2 illustrates the cross-sectional dimensions selected for the full-scale rotor blade BO105. The chord length of the full-scale rotor blade is 0.3 m, which corresponds to the width of box plate W. The thickness of the blade is 0.03 mm and this size corresponds to the height of plate H. The blade planform with a root is 4.9 m in length. The length of a blade without a root and tips, with constant airfoil and stiffness of the blade, is 3.75 m. This dimension corresponds to the length of plate B, respectively.
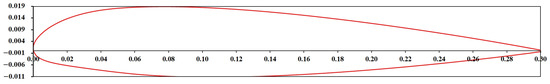
Figure 2.
Configuration of airfoil NACA23012 in composite box plate.
A Type 1 configuration is selected according to the maximum width and thickness of the blade profile. A Type 1 configuration model is convenient for studying structural behaviour, as it is known to be symmetrical, and because, when calculating the centre of gravity and the centre of torsion, the values obtained will be in the centre of the calculation model. A Type 2 configuration simulates an increasing profile height at the beginning and a gradual decrease at the end (see Figure 1b).
2.2. Material Properties
2.2.1. Material Properties of Foam and GFRP
The maximum and minimum values of the foam material properties for modelling their gradient distribution were selected in a way that considered the actual properties of the foam material, produced by company EVONIK (Essen, Germany) [41]. The company produces Polymethacrylimide ROHACELL Foam, which was primarily designed for use in aerospace applications. The material properties of ROHACELL Foam are presented in Table 1.

Table 1.
Properties of ROHACELL WF [32].
Using Rohacell-31 foam material, a concept was developed for a crashworthy subfloor for the fuselage of a medium-sized or larger transport aircraft [42]. It was noted that by introducing Rohacell-31 foam blocks into the space between the cargo floor and the belly skin, a space could be maintained for the cargo compartment.
The data of Table 1 demonstrate that Young’s modulus can vary from 75 to 350 MPa, and the density varies from 52 to 205 kg/m3. Thus, Young’s modulus increases by approximately 4.7 times and density increased by 3.9 times. Note that Poisson’s ratio remains constant for each type of foam material declared by the manufacturer. Therefore, in this study, as well as in research papers [43,44], it is assumed that Poisson’s ratio is equal to 0.3 and does not change according to the power law.
One of the problems in FGM design is determining the optimal spatial dependence of the gradient to change the properties of the material in the way which best suits its intended purpose.
Another problem is to predict the FGM characteristics for a given law of gradient change, realized during material manufacturing and in service conditions. The use of theoretical models is crucial to achieve this goal. Once a model is created, it can easily be applied to carry out a wide range of computer “experiments”, in which the effects of changing the input parameters that determine the gradient change in the material’s properties are systematically evaluated.
Based on the tabular data (see Table 1) and the numerical experiment strategy, the following four material models were adopted to study the influence of the distribution of foam properties on composite box plates (Table 2).
Table 2.
Material models.
Model 1. The elastic modulus and density of the material change simultaneously by 5 times, which practically corresponds to the real properties of the foam.
Model 2. The elastic modulus and density of the material change simultaneously by 50 times.
Model 3. The elastic modulus of the material changes by 5 times, and the density of the material changes by 50 times.
Model 4. The elastic modulus of the material changes by 50 times, and the density of the material changes by 5 times.
The material properties specified for Models 2, 3, and 4 are not declared by the manufacturer. Usually, the company does not produce foam with low density for structures. The low-density foam has lower mechanical and thermal properties. The low-density foam is much softer, and it is ideal for packaging infill. These data are taken for comparative behavioural analysis of the construction dependence of material properties. They are selected for the purpose of parametric research and can be implemented in practice if necessary.
The material properties of the GFRP material used in the research are as follows: Young’s modulus, Ex = 45.166 GPa, Ey = Ez = 11.981 GPa; shear modulus, Gxy = Gxz = 4.583 GPa, Gyz = 1.289 GPa; Poisson’s ratio, νxy = νxz = 0.238, νyz = 0.325; and density, = 2008 kg/m3 [36].
2.2.2. Formulation of FGM Model
In this paper, the gradient model of material property variation consists of two dissimilar isotropic materials whose properties vary throughout the width of the structure’s cross-section. The effective properties, i.e., density and elastic modulus, vary along the direction of the plate width according to the volume fraction function based on the Voight rules, the most popular and widely used model for evaluating the properties of FG materials throughout the volume [45,46,47]. Thus, the changing properties of the foam material throughout the width of the model can be represented by the power law [48,49,50]:
where P represents the material properties such as Young’s modulus and material density, V represents the volume fraction of the material, p represents the exponent of the volume fraction that is non-negative, and the subscripts L and R represent the various material properties on the left and right sides. The profile of changing the material properties along the width of the composite box plate can be obtained depending on the value of power index p.
According to Equation (4), the Young’s modulus and density variation along the width direction can be obtained as follows:
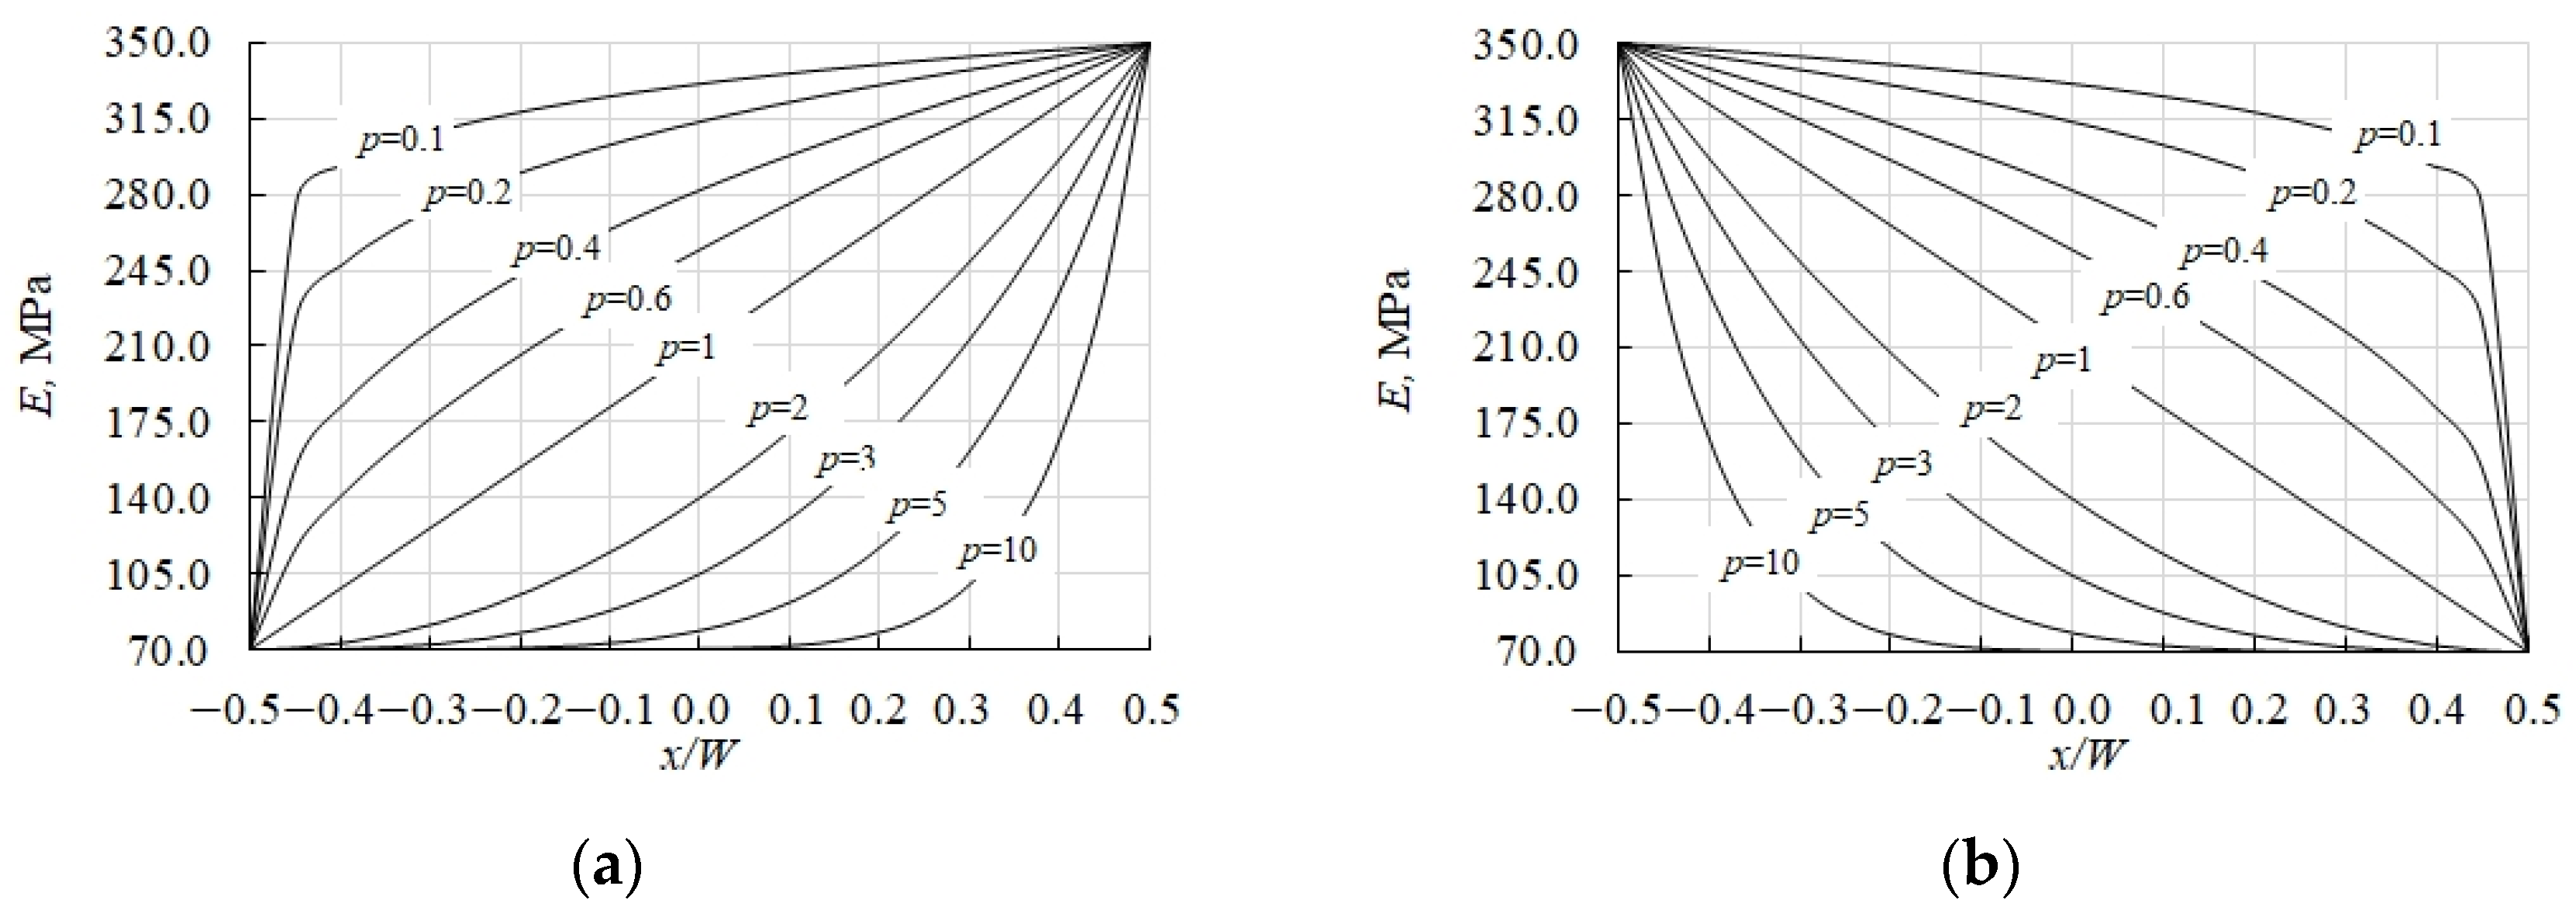
Figure 3a shows the variation in the Young’s modulus throughout the width of the composite plate for Model 1. Variable x represents the distance to the midplane of the composite box plate varying from −L/2 to L/2. Equation (4) shows that E is equal to EL when −x = −L/2 and E is equal to ER when x = −L/2.
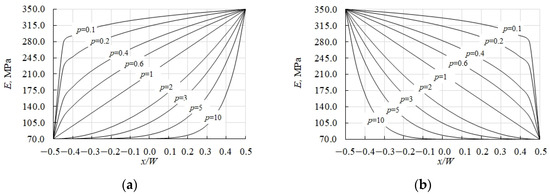
Figure 3.
Variations in the Young’s modulus throughout the width of composite box plate for different values of the power law index p: (a) increase in mechanical properties; (b) decrease in mechanical properties.
According to Figure 3a, Young’s modulus increases from the left side to the right side. However, in this study, the main calculations are performed for the opposite situation, when the elastic modulus and the filler density decrease from left to right. This is because for aircraft structures such as a blade, the centre of mass is located at the beginning of the profile to prevent flutter [51]. In this case, Equations (5) and (6) have the following forms:
The variation in the Young’s modulus throughout the width of the composite plate for Model 1 is shown in Figure 3b. It is seen that Young’s modulus reduces from left to right and density, respectively, reduces in the same direction. The variation in the Young’s modulus in Figure 3b is symmetrical with respect to the variation in the Young’s modulus in Figure 3a.
The laws of gradient distribution presented do not take into account the porosity of the material. It is assumed that each layer has its own unique value of Young’s modulus and density, determined by the power law of distribution. The author used a similar distribution law when calculating graded foam materials in structures.
In this study, the power law is as follows:
where P represents the material properties, such as elastic modulus and density, x is the position, and H is the initial length of graded foam. If VR in Equation (3) is plotted in dimensionless values from −0.5 to 0.5, then the power law in Equation (9) describes in the dimensionless values from 0 to 1. If one construes volume fraction variation according to Equations (4) and (9), the result will be the same [52,53,54,55,56].
2.3. Static Behaviuor of FG Composite Box Plate
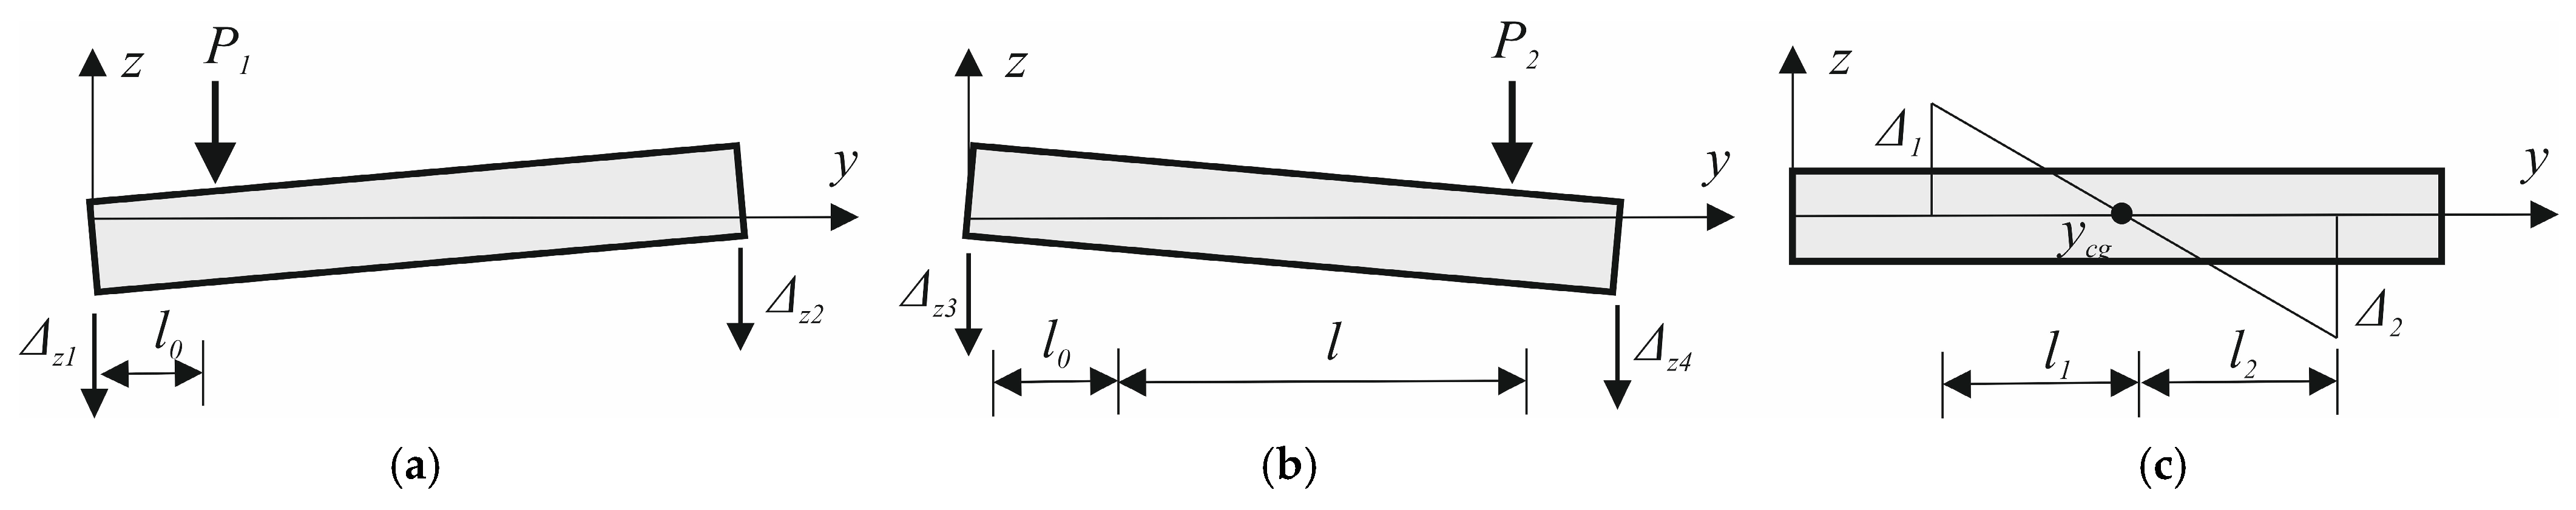
The main design parameters used in the study of composite box plates with functionally graded foam are considered the parameters relevant for the study of helicopter blades. Firstly, this is the location of the centre of gravity ycg and the mass m of the model. These values can be obtained from the numerical solution of the finite element model. The next parameter is the location of the elastic axis yea, the determination of which is a more complex task, requiring the solution of an additional static torsion problem, with two forces applied independently to the two sides of the elastic centre being sought (Figure 4). The force P1 is applied at a small distance from the blade tip. The resulting blade displacement is calculated as Δ1 = Δz1 − Δz2. The second force P2 is applied at a distance l from the force P1 (Figure 4b). The resulting blade displacement is calculated as Δ2 = Δz3 − Δz4.
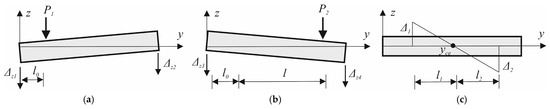
Figure 4.
Graphical illustration of location of elastic axis: (a) application of force closer to blade nose; (b) application of force closer to the blade tail, and (c) resulting displacements.
Based on the similarity of the triangles (see Figure 4c), the location of the elastic axis is determined as
The location of the centre of gravity ycg and the elastic axis yea are described as a percentage of the width (W).
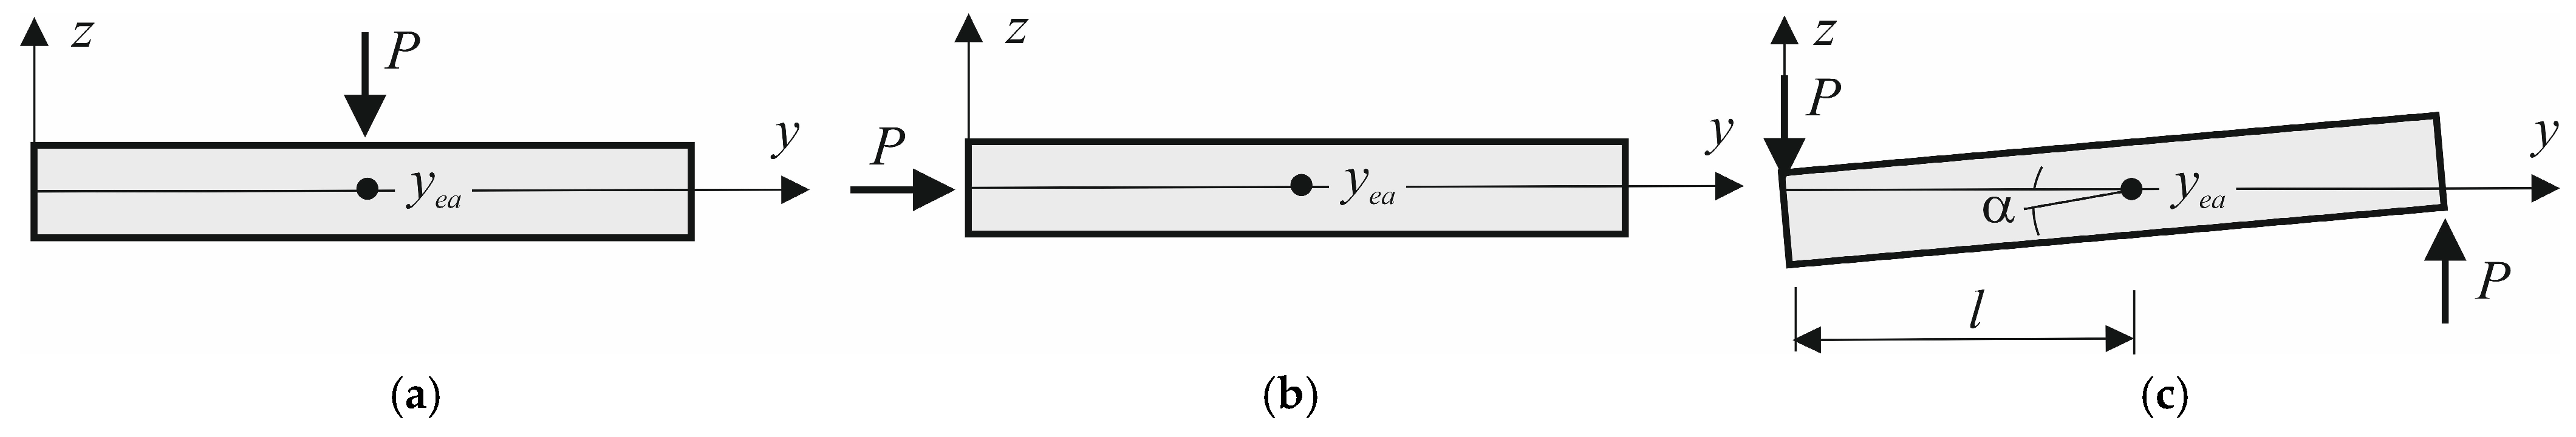
Flap and lag bending stiffnesses were obtained from the following equation [57]:
where F is the unit load, B is the length of composite box plate, and is the displacement (Figure 5a,b).
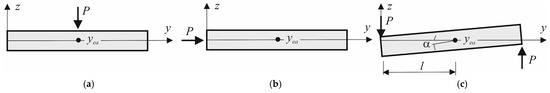
Figure 5.
Graphic illustration of applied forces for determination of construction stiffnesses: (a) flap bending, (b) lag bending, and (c) torsion.
Torsion stiffness was computed from equation [57]
where F is the force, l is the distance between the centre of elastic axis and applied force P, B is the length of composite box plate, and is the angle of twist (see Figure 5c).
2.4. Static Deflection Analysis
In static deflection analysis, the solutions can be obtained by solving the following equation:
where K is the global stiffness matrix for each control volume, including characteristics of bending, shearing, and tensioning; F is the global force vector; and d is the vector of unknowns.
2.5. Numerical Accuracy and Modelling
2.5.1. Comparison Studies
This section presents the modelling of gradient materials in the ANSYS software. Unfortunately, the author did not find an analytical solution for the distribution of material properties by width, so a beam model was chosen, in which the gradient properties of the material varied by thickness.
We investigated a clamped FGM beam made of two materials—aluminium and alumina—with thickness h and length L, subjected to a uniform load of q = 100 N/m. The Young’s modulus of aluminium (bottom surface of the beam) is Em = 70 GPa and that of alumina (top surface of the beam) is Ec = 380 GPa. The Poisson’s ratios of both materials are equal at 0.3.
Based on the rule of mixtures, the effective modulus was estimated using Equation (14):
To perform a comparative calculation using the FEM, a 3D finite element model of the beam was created. The beam was modelled by eight-node SOLID18 elements.
To model the stepped distribution of elastic moduli, the beam cross-section is divided along its height into 20 layers of equal thickness.
Depending on the application area, FGMs are designed as step-gradient or continuous-gradient structures. Therefore, it is not a mistake to use a step-gradient structure for the distribution of material properties throughout the thickness [58,59]. For each layer, the material properties were calculated according to the power law distribution. In this way, the material properties were modelled as a discrete distribution. The size of the finite element is equal to the thickness of one gradient layer of the material, i.e., equal to 5 mm.
The dimensionless formulae are applied as follows:
where w(L,0) is the displacement of the beam, h is the thickness of the beam, l is the length of the beam, and q is the uniform load. The displacements were determined at the free end of the beam. The width anterior thickness of the beam is 0.1 m.
Table 3 presented the numerical results for some cases of l/h ratios and the comparison of dimensionless displacements under uniform load. Excellent agreement was observed between the numerical results obtained using the finite element model developed in ANSYS software and the results obtained by Nguyen et al. [60] using euasi-3D theory (see Table 3).
Table 3.
Comparison of dimensionless displacements under uniform load conditions.
2.5.2. Convergence and Validation of Finite Element Model of Composite Box Plate with FG Foam Filled
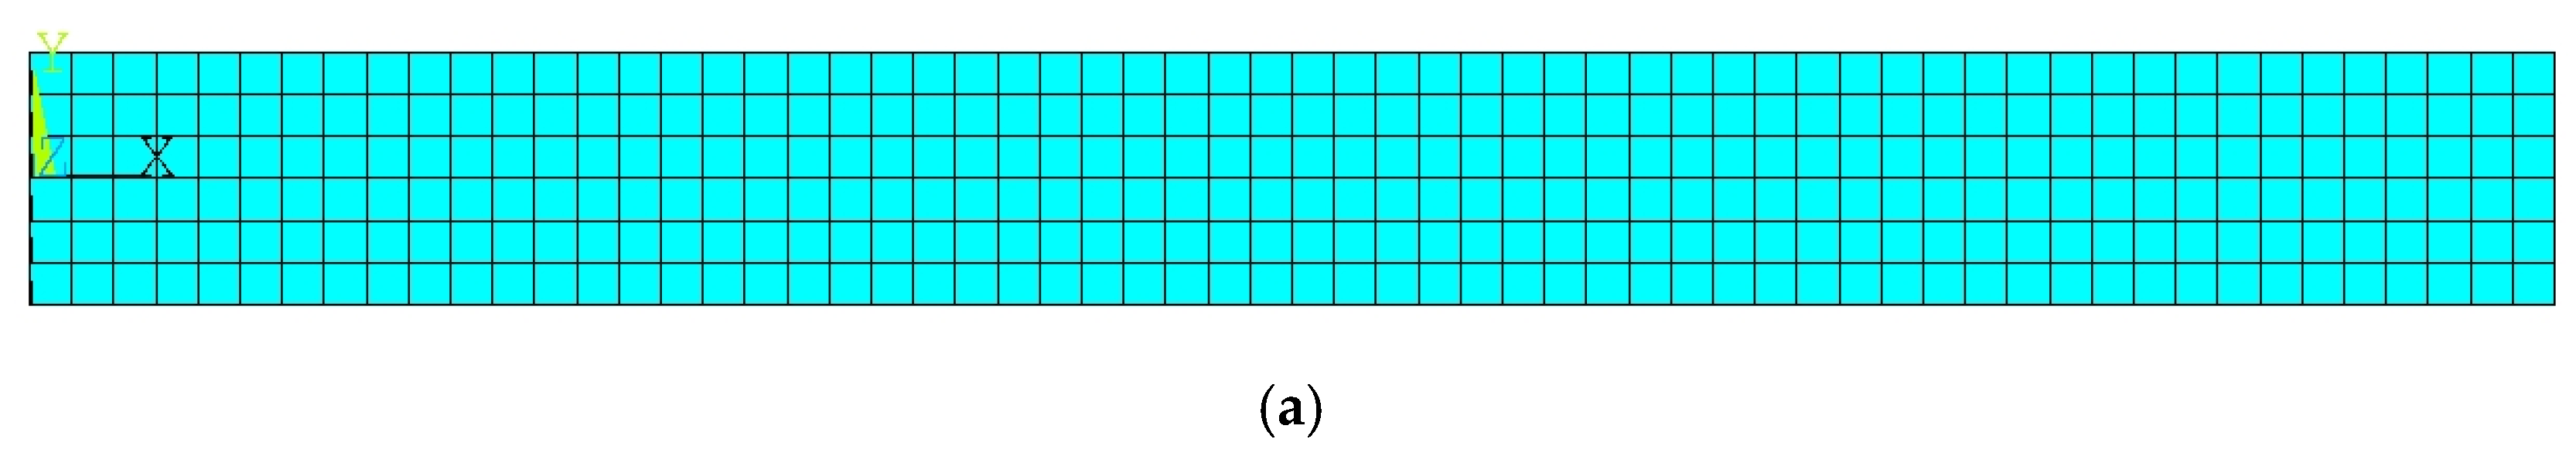
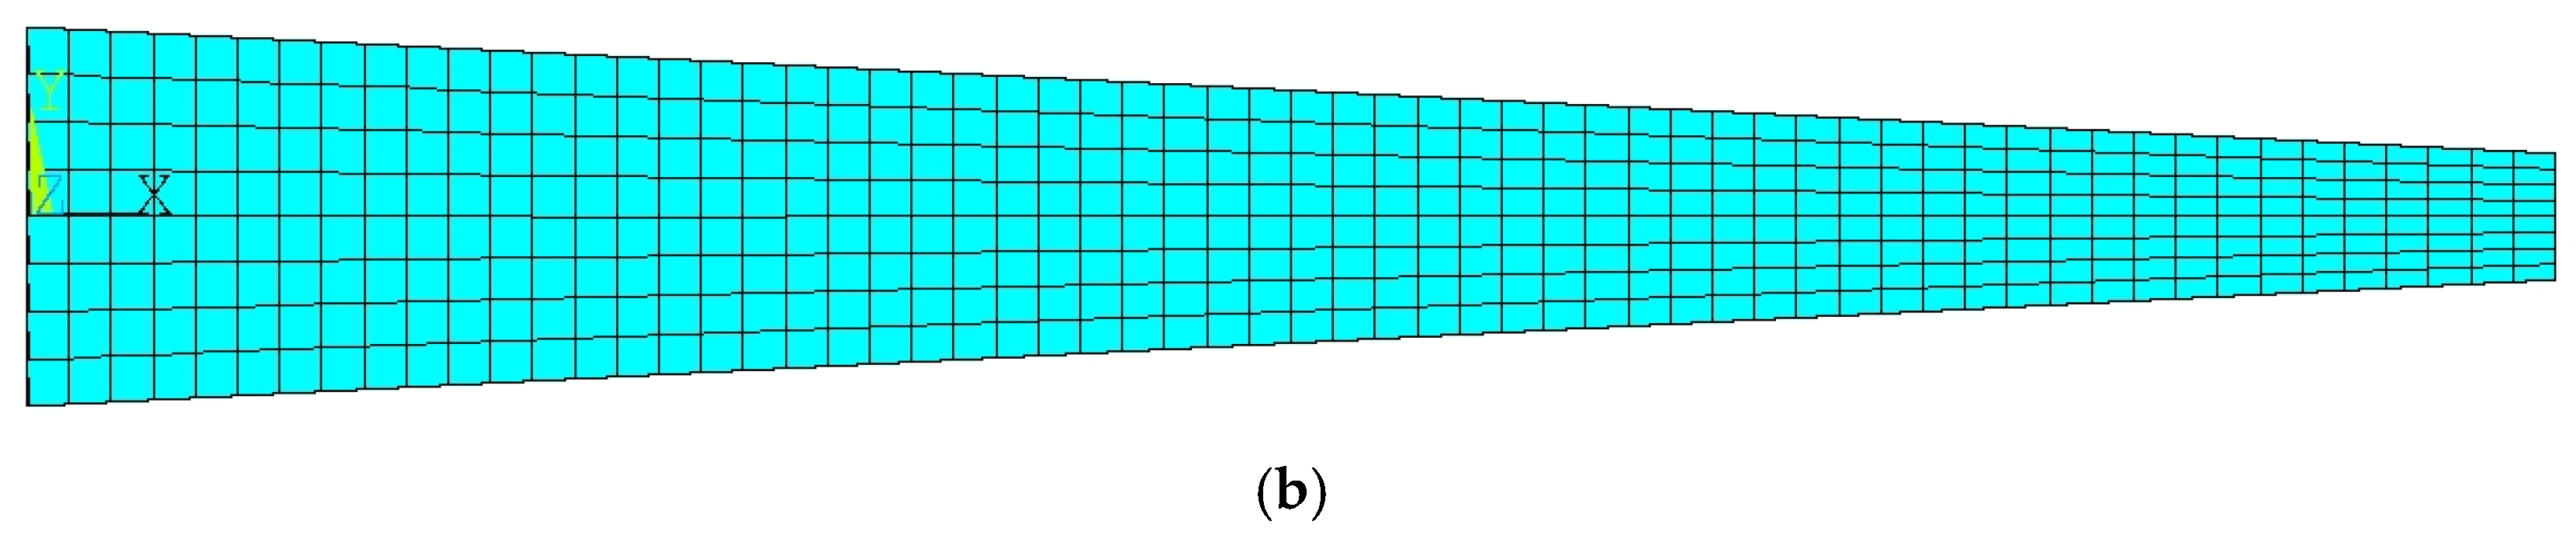
A 3D finite element model was developed using the ANSYS 16.0 software to provide a cost-effective method for evaluating the influence of power law on the stiffness properties of the composite box plate filled with FG foam. The cross-section of the FE model is shown in Figure 6a according to its geometric configuration. The FG foam is modelled with the linear eight-node SOLID185 elements. For the modelling of multilayered composite skin, linear four-node SHELL181 elements were used. According to real conditions, a clamped boundary condition was considered in the model.
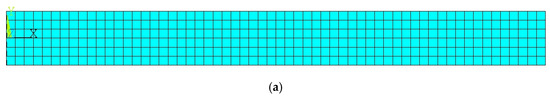
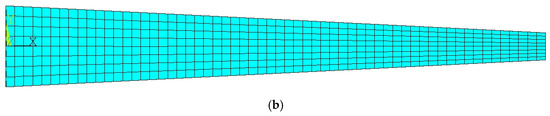
Figure 6.
Cross-section of FE model with FG foam inside and element size of 5 mm: (a) Type 1; (b) Type 2.
Before numerical calculation, the mesh sensitivity was assessed to obtain results with acceptable accuracy. The finite element sizes used in FE modelling are as follows: 15, 7.5, 5, 3.75, and 3 mm. The number of layers of foam varied depending on the element size chosen in the FE model. Each layer was assigned its own unique values of Young’s modulus and density, determined from the power law distribution. The first material model from Table 4 was used for the convergence calculations. The power index is p = 1. Calculations were performed for the FE model without a composite shell. The results obtained when assessing the effect of mesh size sensitivity on stiffness parameters are shown in Table 4.
Table 4.
Mesh size sensitivity.
Stiffness parameters, the centre of gravity, and elastic axis locations stay similar, regardless of the element size. The element size affects the calculation time. However, the longest calculation times were seen for FE models with element sizes of 3.75 and 3.0 mm. For the other FE models, the calculation times did not differ significantly. Thus, the finite element model with element size of 5 mm was chosen to decrease the calculation time. The FE models with element sizes of 15 and 7.5 mm were not used due to the coarseness of the mesh.
3. Results
3.1. Results for Type 1 Model with Constant Thickness
3.1.1. Numerical Modelling of Box Plate with FG Foam
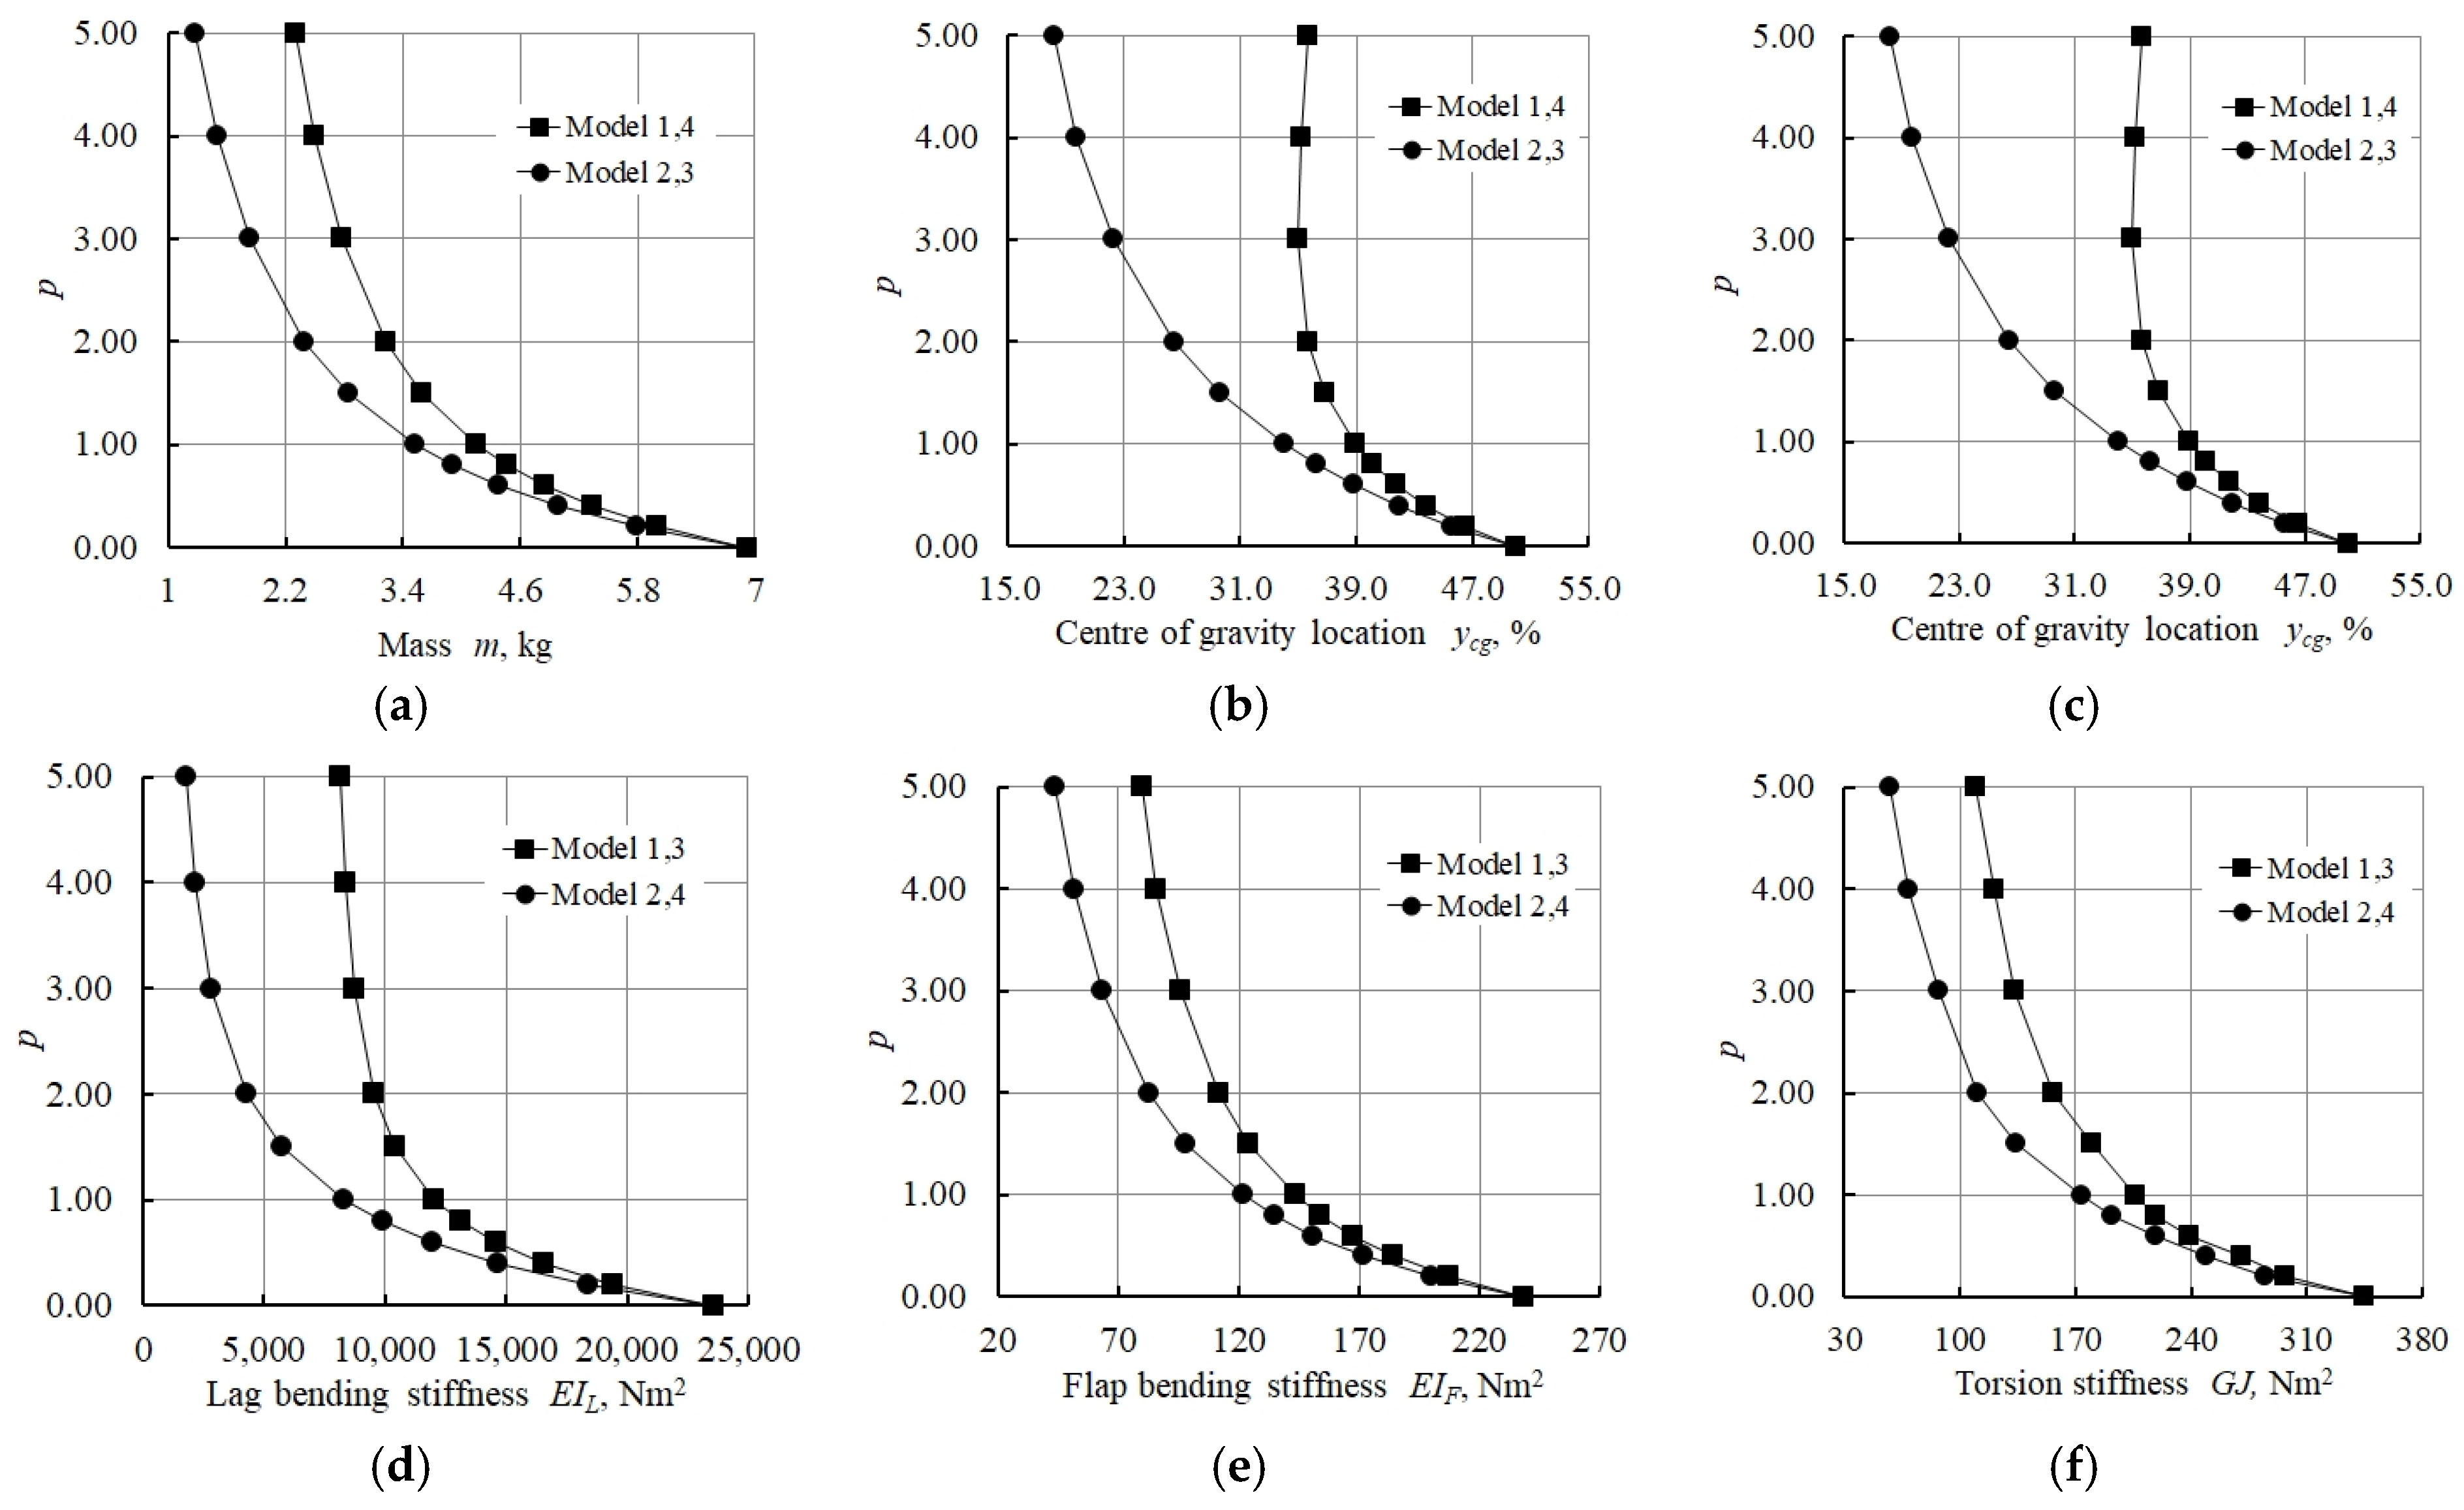
The influences of the distribution law of functionally graded foam on the stiffness characteristics of the Type 1 structure, including bending and torsional stiffnesses, as well as the locations of the elastic axis and the centre of gravity, are illustrated in Figure 7. The plate with only functionally graded foam without a composite shell is considered in order to evaluate the effect of graded foam on the parameters under study.
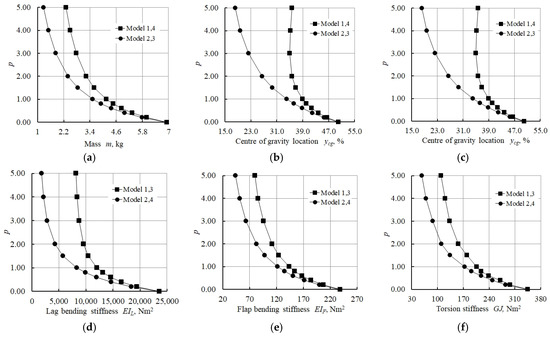
Figure 7.
Graphic representational of studied parameters of foam structure: (a) mass of model, (b) centre of gravity, (c) 3lastic axis location, (d) lag bending stiffness, (e) flap bending stiffness, and (f) torsion stiffness.
The study of numerical models begins when the power law index p = 0. With this coefficient, the foam material possesses the maximum values of Young’s modulus E = 350 MPa and density ρ = 205 kg/m3, according to Table 2.
Models 1 and 4 have the same density distribution boundaries (see Table 2); therefore, the mass distribution in them is the same, while the mass of Model 2 corresponds to the mass of Model 3 (see Figure 7a). Since the mass of the structure and its distribution affects the centre of gravity’s location, Models 1 and 4, and Models 2 and 3, respectively, have centres of gravity that share locations (see Figure 7b). The changes in elastic axis location, lag bending stiffness, flap bending stiffness, and torsion stiffness are affected by the overall rigidity of the structure, which includes the geometry and elastic modulus. Therefore, the behaviour of the corresponding curves (see Figure 7c–f), according to the change of material properties and geometry in Table 2, is the same for Models 1 and 3, and Models 2 and 4, respectively.
Figure 7a shows that with increasing the power law index p, the density gradually decreases across the entire width of the box plate, which leads to a decrease in the mass of the structure. Decreasing the density of the box plate from right to left changes the centre of gravity’s location (see Figure 7b). The left side of the box plate becomes heavier, which shifts the centre of gravity to the left. The minimum value of density for Models 2 and 3 is 50 times lower than that for Models 1 and 3. Therefore, with an increasing power law index p, the centre of gravity of Models 2 and 3 shifts much further to the left than in Models 1 and 4.
The elastic modulus in Models 2 and 4 varies in the range from 350 to 7 MPa, and in Models 1 and 3 it varies in a narrower range from 350 to 70 MPa. This variation reduces the rigidity of the structure of Models 2 and 4 to a greater extent. Therefore, the elastic axis locations in Models 2 and 4 shift more to the right (see Figure 7c).
The changes of lag bending stiffness, flap bending stiffness, and torsion stiffness are shown in Figure 7d,e. It can be seen from the figures that the stiffness of Models 2 and 4 is less than that of Models 1 and 3 and decreases with the increasing power law index p.
An additional research parameter is the distance between centre of gravity and the elastic axis location. The development and application of functionally graded foams as a filler inside the rotor blades changes the locations of the elastic axis and the centre of gravity of the blade. This, in turn, contributes to the more efficient control of the rotor blades during flight, requiring less electrical energy to implement active twist concept.
The values of the distance between the centre of gravity and elastic axis location are shown in Table 5. Minimal values of this distance were obtained for Models 1 and 2. The distance between the locations of the centre of gravity and elastic axis for Models 3 and 4 grows with the increasing power law index p.
Table 5.
Distance between centre of gravity and elastic axis location.
3.1.2. Numerical Modelling of Composite Box Plate with FG Foam
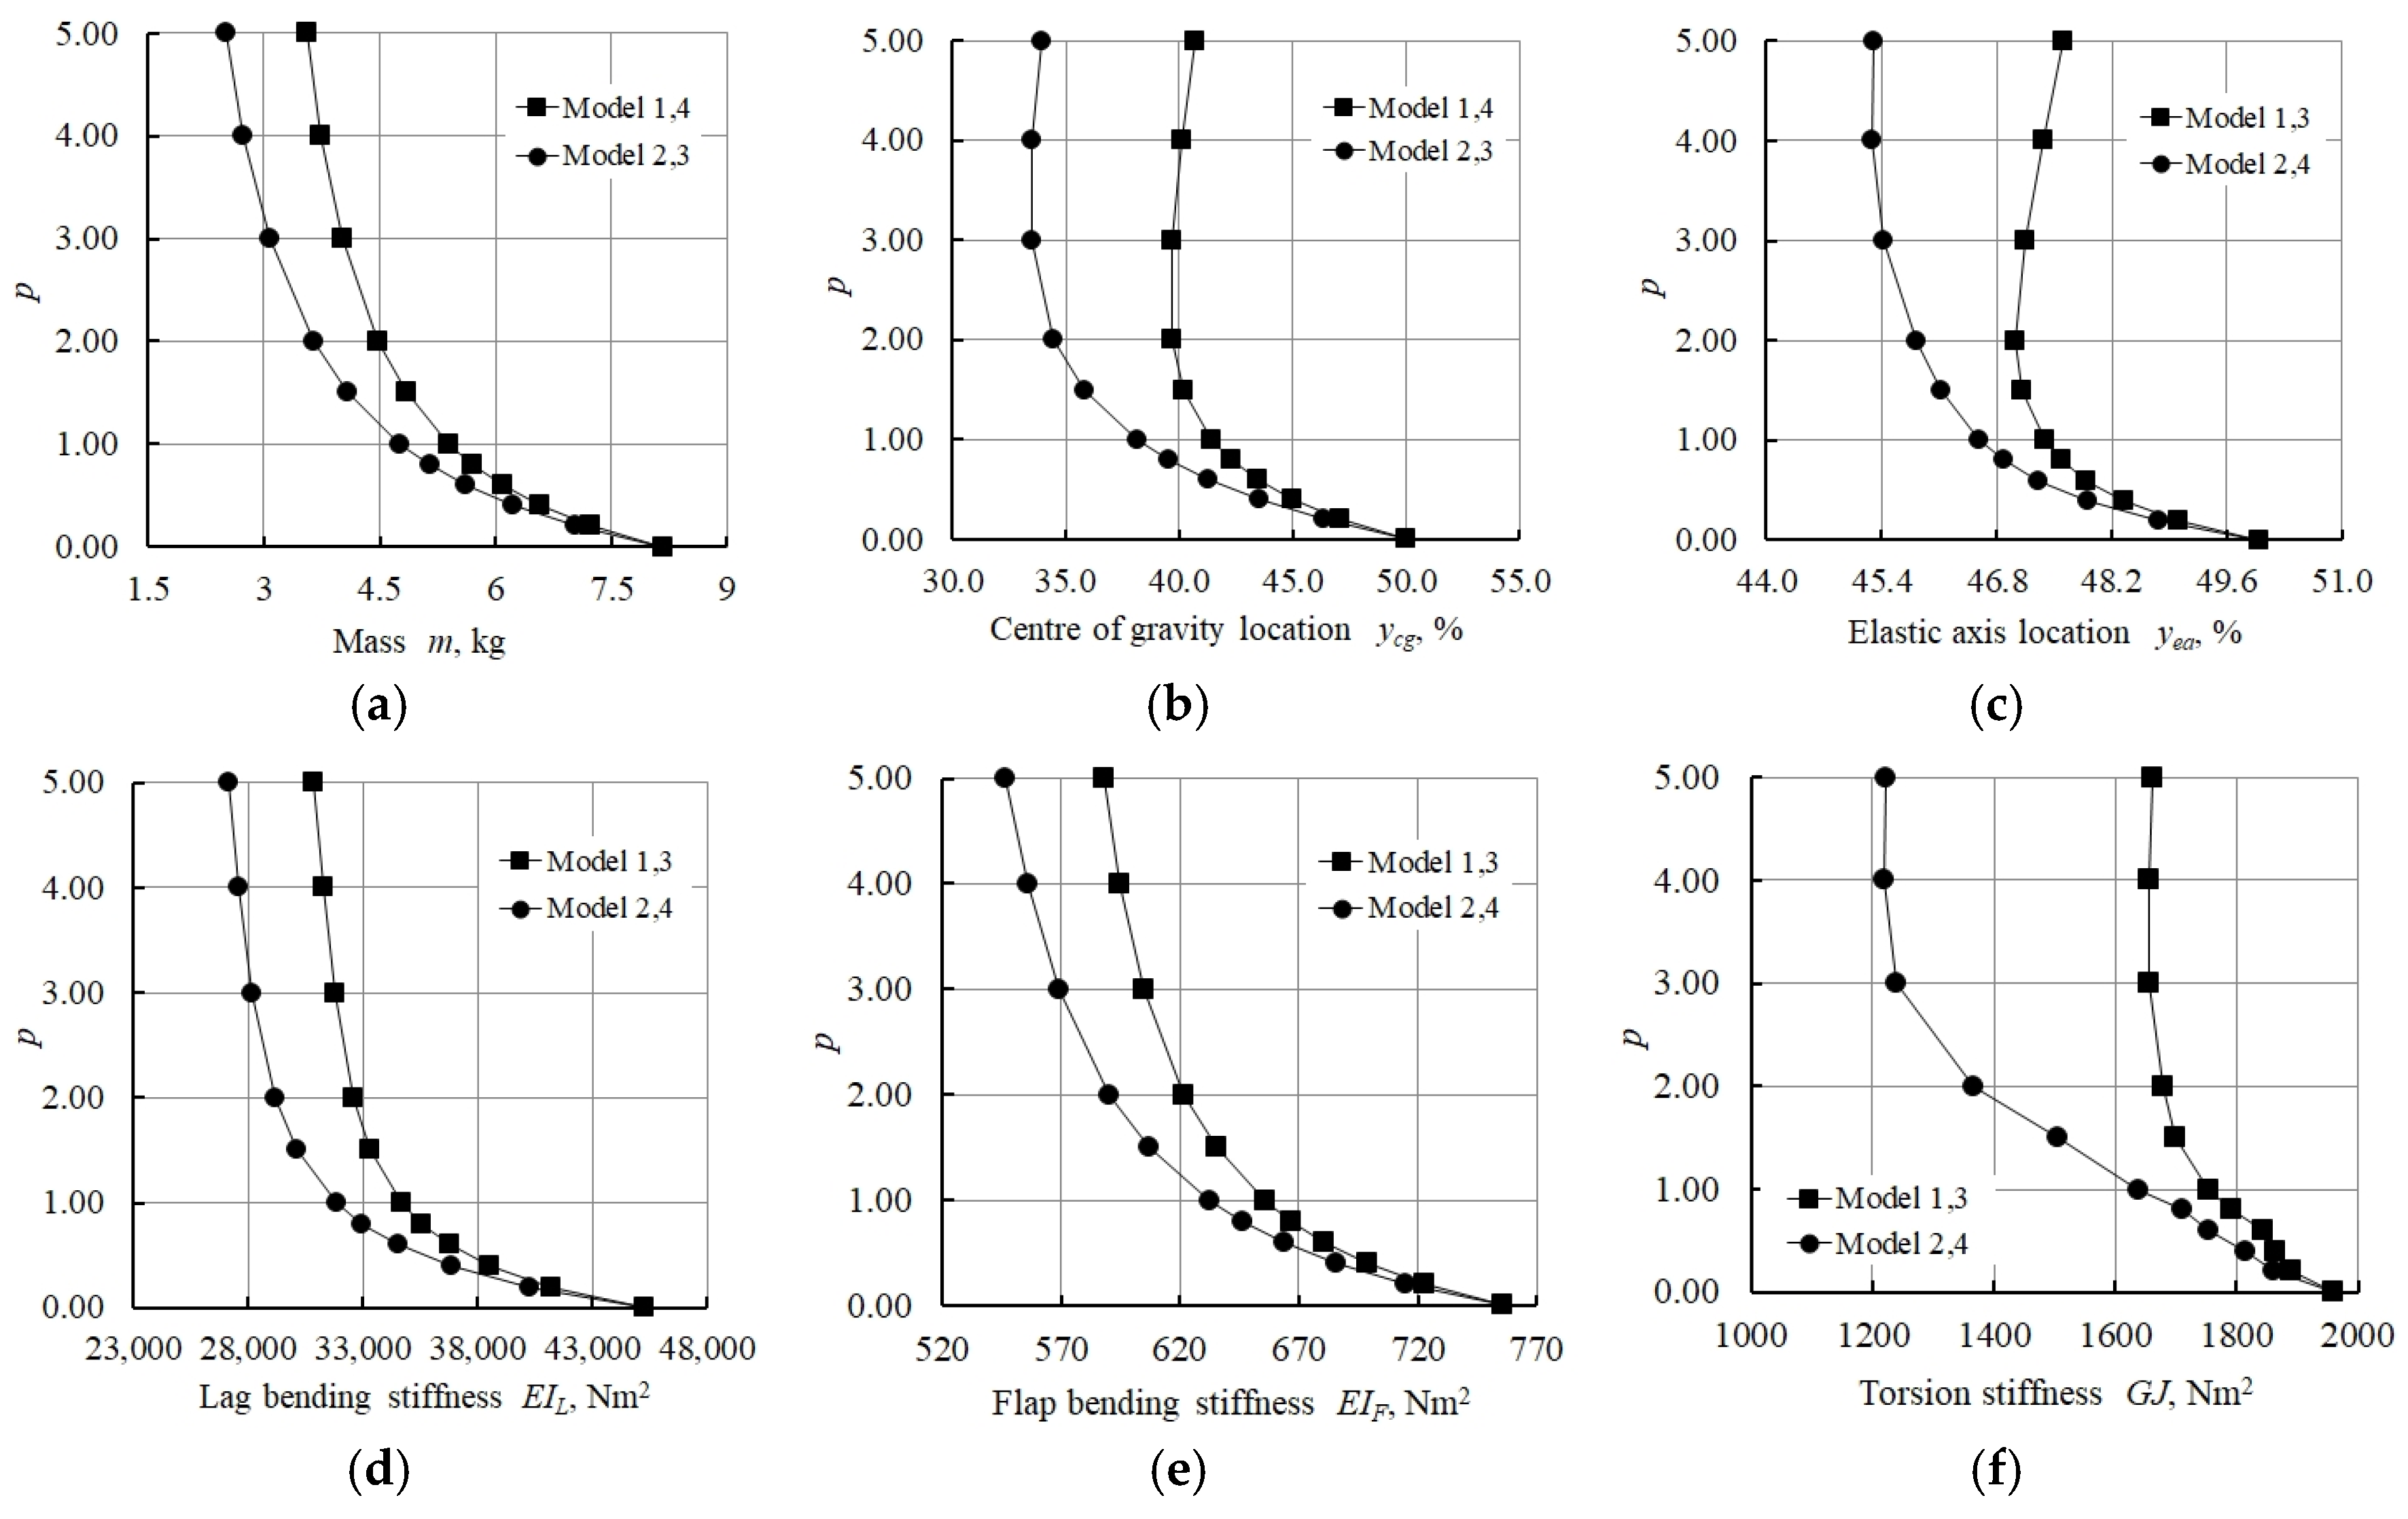
The results of modelling a composite box plate with a functionally graded foam core are shown in Figure 8.
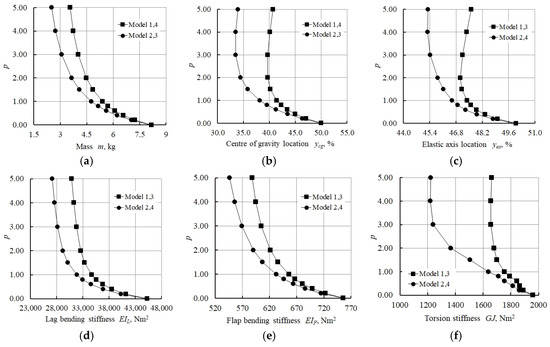
Figure 8.
Graphical representation of studied parameters of foam and composite shell structure: (a) mass of model, (b) centre of gravity, (c) elastic axis, (d) lag bending stiffness, (e) flap bending stiffness, and (f) torsion stiffness.
The addition of the composite shell increased the mass of the structure (see Figure 8a) and reduced the displacement of the centre of gravity across the width of the structure (see Figure 8b). The location of the elastic axis is shifted by only 5% (see Figure 8c). Models 1 and 3 showed the greatest rigidity of the structure (see Figure 8d,e). The values of the distance between the centre of gravity and elastic axis location for construction with composite shell are presented in Table 6. The distance between the locations of these parameters begins to increase with the growth of the power law index p. Depending on p, the smallest difference values were obtained for Models 1 and 4.
Table 6.
Distance between centre of gravity and elastic axis location.
3.2. Results for Type 2 Model with Variable Thickness
3.2.1. Numerical Modelling of a Variable Thickness Box Plate with FG Foam
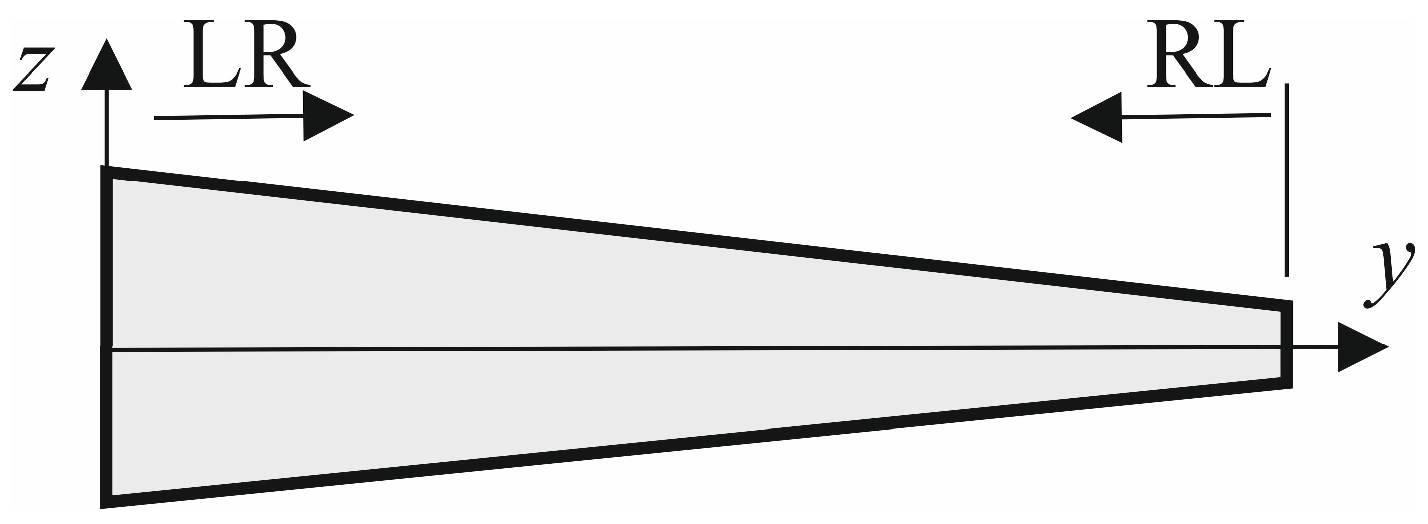
Variations in the Young’s modulus and density across the width of the composite box plates with functionally graded foam of Type 2 (LR) are considered from left to right according to Equations (5) and (6), and from right to left (RL) according to Equations (7) and (8) (Figure 9).
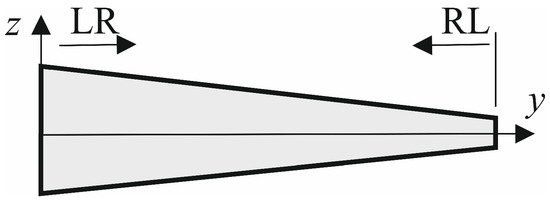
Figure 9.
Directions of variations in the foam properties graded across the width.
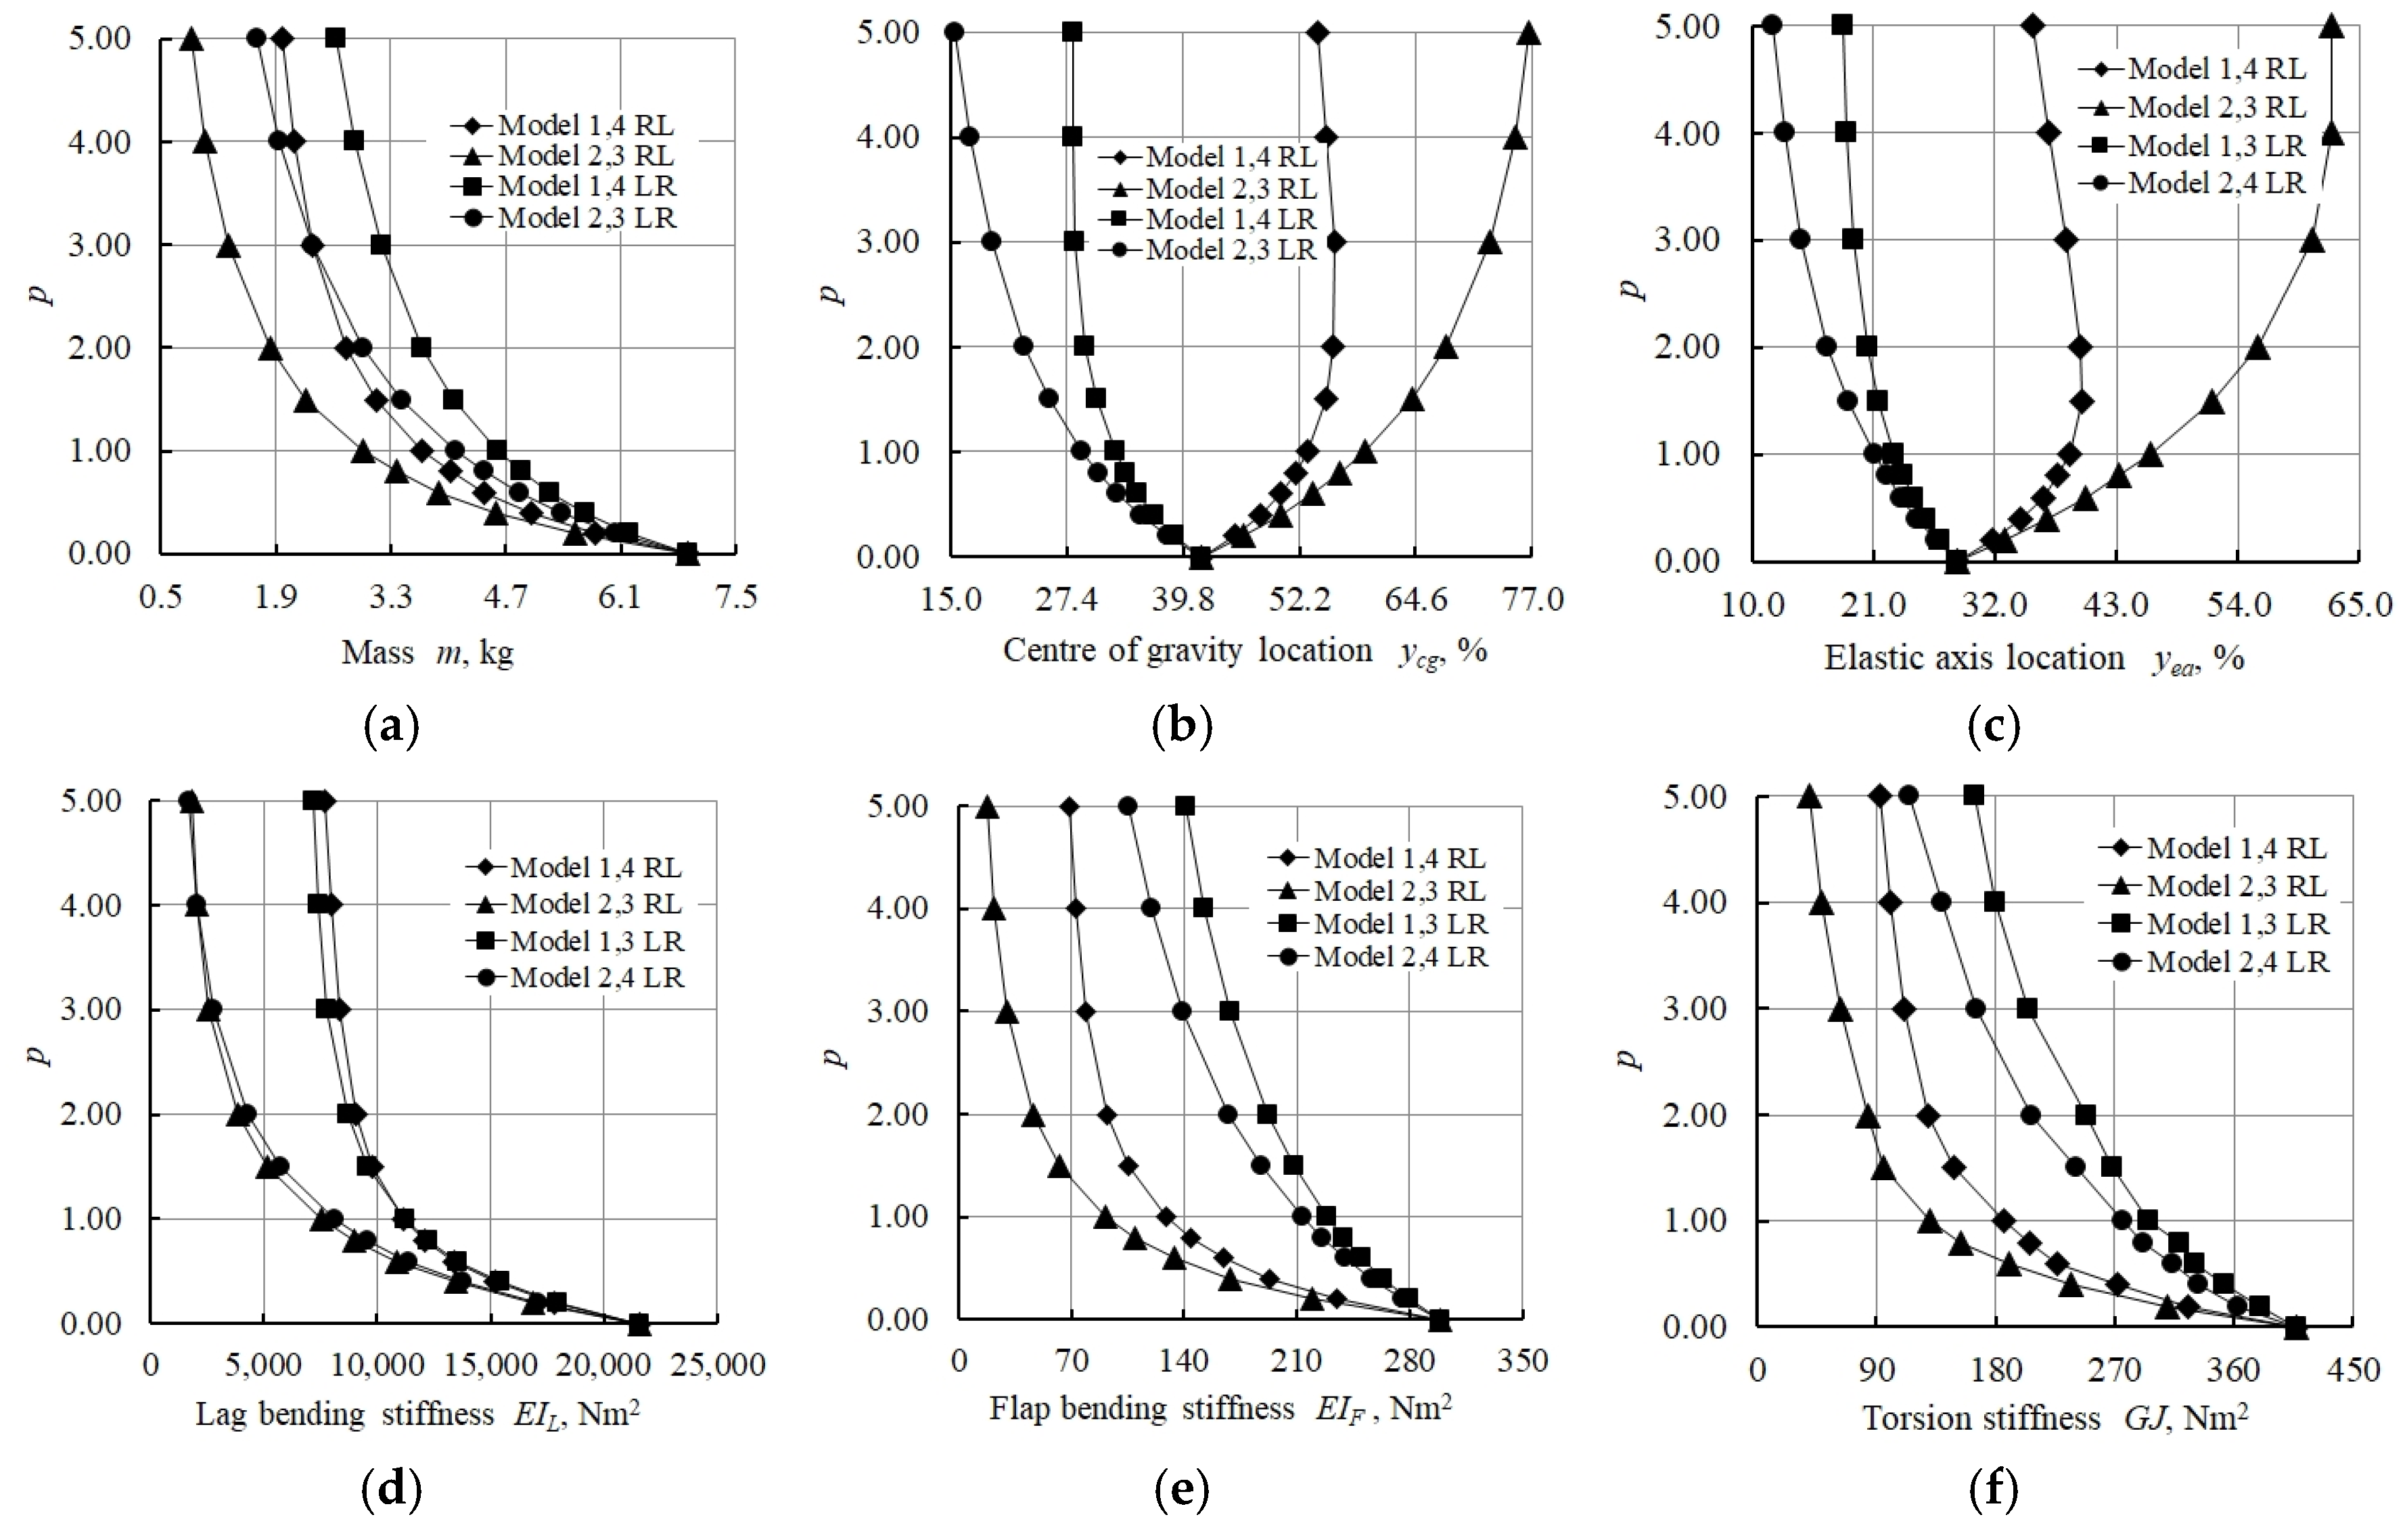
The influences of the distribution law of functionally graded foam on the rigidity characteristics of the composite box plate with FG foam of Type 2, including bending and torsional stiffnesses, as well as the locations of the elastic axis and the centre of gravity, are demonstrated in Figure 10.
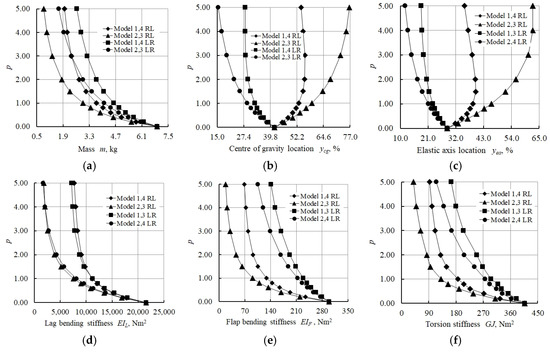
Figure 10.
Graphical representation of studied parameters of foam structure without composite material: (a) mass of model, (b) centre of gravity, (c) Elastic axis, (d) Lag bending stiffness, (e) Flap bending stiffness, and (f) Torsion stiffness.
The changing mass of the models, depending on their properties and direction of gradient change, is shown in Figure 10a. The results obtained indicate that the mass of Models 1 LR and 4 LR and Models 2 LR and 3 LR is greater than that of Models 1 RL and 4 RL and Models 2 RL and 3 RL, respectively.
Figure 10b,c illustrate the changes in the centre of gravity and elastic axis location in relation to the direction of the gradient, which alters the material properties of the polymer foam across the width of the box plate. Preliminary calculations showed symmetrical shifts in the locations of centre of gravity and elastic axis. In the case of the box plates with variable thickness (see Figure 9), we observe an asymmetrical pattern regarding the changing locations of the centre of gravity and elastic axis. This depends on the direction of the gradient’s change in the density of the polymer foam material (Figure 10b,c).
The numerical results of lag bending stiffness calculations (Figure 10d) for Models 1 RL and 4 RL are almost identical to those for Models 1 LR and 3 LR. The results for Models 2 RL and 3 RL are almost identical to those for Models 2 LR and 4 LR.
The behaviour of the curves, describing the flap bending and torsion stiffnesses depending on the power law index p, is shown in Figure 10e,f. It is evident from the figures that the stiffness of the RL models is less than that of the LR models.
The distance values between the centre of gravity and elastic axis locations are presented in Table 7. For most of the models studied, the distance between centre of gravity and elastic axis locations does not change. A decrease in this distance the increasing power law index p was observed for Models 2 LR and 3 LR. The best result for the constructions with a gradient distribution of foam properties from right to left was demonstrated by Model 4 RL, in which the distance between the centre of gravity and elastic axis locations equals 0.04 when the power law index p = 2.
Table 7.
Distance between centre of gravity and elastic axis location.
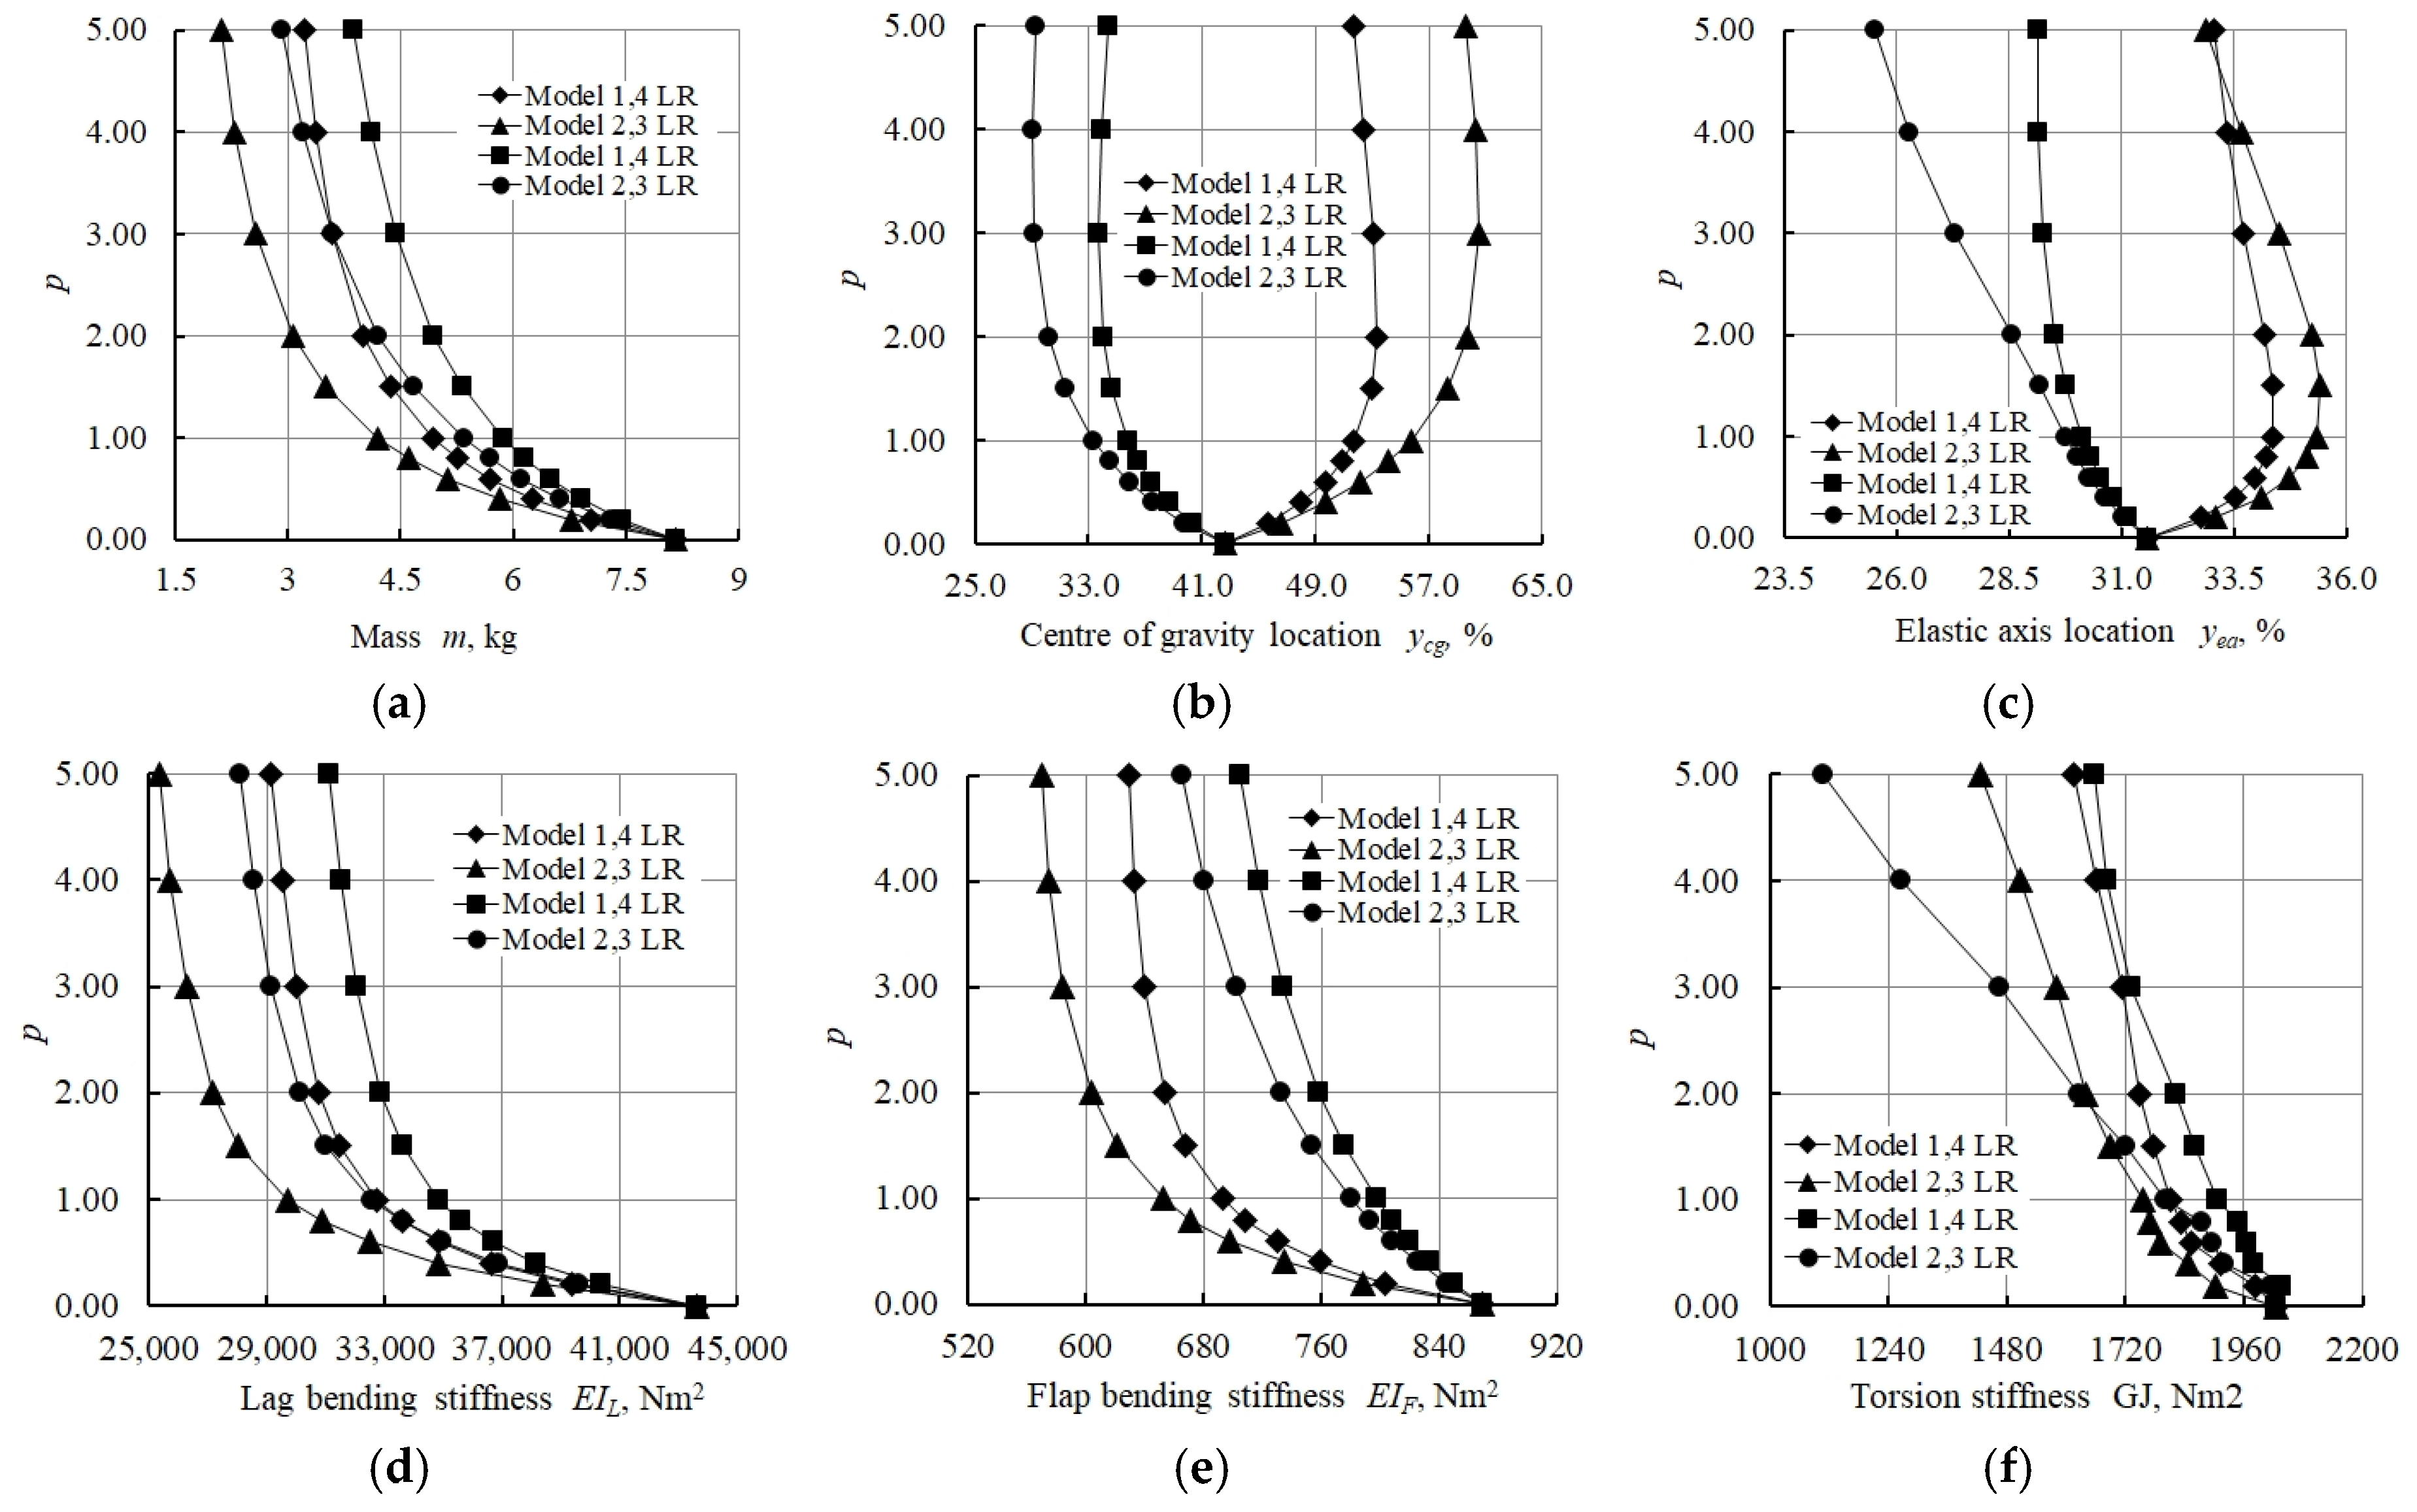
3.2.2. Numerical Modelling of a Variable Thickness Composite Box Plate with FG Foam
Figure 11 is a graphical representation of the studied parameters of a composite shell with a graded foam. The use of FG foam within the composite shell increased the mass of the structure (Figure 11a) and reduced the displacement of the centre of gravity along the width of the structure (Figure 11b). Figure 11c illustrates the change in the location of the elastic axis depending on the power law index p.
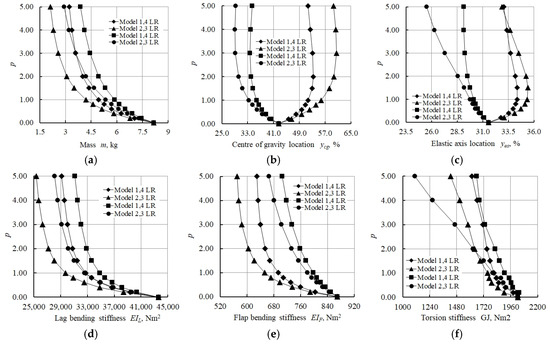
Figure 11.
Graphical representation of studied parameters of composite shell with foam core: (a) mass of model, (b) centre of gravity, (c) elastic axis, (d) lag bending stiffness, (e) flap bending stiffness, and (f) torsion stiffness.
Figure 11d–f show significant increases in the bending and torsional stiffnesses of the structure with graded polymer foam.
The values of the distance between the centre of gravity and elastic axis location for constructions with composite shells are presented in Table 8. This distance decreases for Models 1 and 4 LR. The lowest value of 0.05 was obtained for Model 3 LR at p = 3.0. However, the distance between the centre of gravity and the elastic axis location increased for Models 1 RL to 4 RL with the increasing power law index.
Table 8.
Distance between centre of gravity and elastic axis locations.
4. Conclusions
This study focuses on investigation of the static behaviour of a composite box plate with constant and variable thicknesses that simulate the dimensions and changing profile of a blade or wing. The finite element models were developed using ANSYS software. Preliminary models, taken from the literature, were validated and compared. Four models showing how the gradient changes the material properties across the cross-section were considered and the influences of material properties and power law index on the centre of gravity, elastic axis, bending, and torsion stiffnesses were examined and discussed in detail. The numerical results obtained allow us to make the following conclusions.
- The lowest values of the distance between the locations of the centre of gravity and elastic axis in the study of the numerical model of a graded foam with constant thickness, without considering the composite shell, were obtained for Models 1 and 2 (see Table 4).
- The lowest values of the distance between the locations of the centre of gravity and elastic axis in the study of the numerical model of a graded foam of variable thickness, without considering the composite shell, were obtained for Models 2 LR and 3 LR (see Table 6).
- The addition of a composite shell limited the shifting of the centre of gravity and elastic axis locations along the width of the structure and increased the overall rigidity of all structures considered.
- The distance between centre of gravity and elastic axis locations decreased with the increasing power law index p for Models 1 LR to 4 LR. The lowest value, equal to 0.05, was displayed by Model 3 LR.
- RL models with the direction of the gradient change of foam material properties from right to left, on the contrary, showed an increasing distance between the centre of gravity and elastic axis, with growing power law index p.
Funding
This research was funded by the Latvian Council of Science, project “Smart twisting active rotor blades with a functionally graded foam core (SmarTARB)” No. lzp-2023/1-0587.
Data Availability Statement
The original contributions presented in this study are included in this article; further inquiries can be directed to the corresponding author.
Conflicts of Interest
The author declare no conflicts of interest.
Abbreviations
The following abbreviations are used in this manuscript:
| FG | Functionally graded |
| FGM | Functionally gradient materials |
| FE | Finite element |
| FEM | Finite element method |
| LR | Left to right |
| RL | Right to left |
References
- Suresh, S.; Mortensen, A. Fundamental of Functionally Graded Materials; CRC Press: London, UK, 1998; 176p. [Google Scholar]
- Niino, M.; Hirai, T.; Watanabe, R. The functionally gradient materials. J. Jpn. Soc. Compos. Mater. 1987, 13, 257–264. [Google Scholar] [CrossRef]
- Koizumi, M. FGM activities in Japan. Compos. Part B Eng. 1997, 28, 1–4. [Google Scholar] [CrossRef]
- Thai, H.T.; Kim, S.E. A review of theories for the modelling and analysis of functionally graded plates and shells. Compos. Struct. 2015, 128, 70–86. [Google Scholar] [CrossRef]
- Van, T.D.; Van, V.P.; Hoang, N.N. On the development of refined plate theory for static bending behaviuor of functionally graded plates. Math. Probl. Eng. 2020, 2836763. [Google Scholar] [CrossRef]
- Reddy, J.N. Analysis of functionally graded plates. Int. J. Numer. Methods Eng. 2000, 47, 663–684. [Google Scholar] [CrossRef]
- Sayyad, A.S.; Ghugal, Y.M. Modelling and analysis of functionally graded sandwich beams: A review. Mech. Adv. Mater. Struct. 2009, 26, 1776–1795. [Google Scholar] [CrossRef]
- Srikarun, B.; Songsuwan, W.; Wattanasakulpong, N. Linear and nonlinear static bending of sandwich beams with functionally graded porous core under different distributed loads. Compos. Struct. 2021, 276, 114538. [Google Scholar] [CrossRef]
- Pandey, S.; Pradyumna, S. Analysis of functionally graded sandwich plates using a higher-order layerwise theory. Compos. Part B Eng. 2018, 153, 325–336. [Google Scholar] [CrossRef]
- Van Vinh, P. Static bending analysis of functionally graded sandwich beams using a novel mixed beam element based on first-order shear deformation theory. Forces Mech. 2021, 4, 100039. [Google Scholar] [CrossRef]
- Huang, Z.; Chen, Y.; Wang, X.; Chu, F. Bending Analysis of Symmetrical Porous Functionally Graded Sandwich Panels. Symmetry 2025, 17, 327. [Google Scholar] [CrossRef]
- Suethao, S.; Shah, D.U.; Smitthipong, W. Recent Progress in Processing Functionally Graded Polymer Foams. Materials 2020, 13, 4060. [Google Scholar] [CrossRef] [PubMed]
- Yu, J.; Song, L.; Chen, F.; Fan, P.; Sun, L.; Zhong, M.; Yang, J. Preparation of polymer foams with a gradient of cell size: Further exploring the nucleation efect of porous inorganic materials in polymer foaming. Mater. Today Commun. 2016, 9, 1–6. [Google Scholar] [CrossRef]
- Timothy, J.J.; Meschke, G. A cascade continuum micromechanics model for the effective elastic properties of porous materials. Int. J. Solids Struct. 2016, 83, 1–12. [Google Scholar] [CrossRef]
- Bashir, A.S.; Munusamy, Y.; Chew, T.L.; Ismail, H.; Ramasamy, S. Mechanical, thermal, and morphological properties of (eggshell powder)–filled natural rubber latex foam. J. Vinyl Addit. Technol. 2015, 23, 3–12. [Google Scholar] [CrossRef]
- Tan, X.M.; Rodrigue, D. Density graded polymer composite foams. Cellular Polymers 2023, 42, 25–51. [Google Scholar] [CrossRef]
- Pinto, J.; Escudero, J.; Solórzano, E.; Rodriguez-Perez, M.A. A novel route to produce structural polymer foams with a controlled solid skin–porous core structure based on gas diffusion mechanisms. J. Sandw. Struct. Mater. 2020, 22, 822–832. [Google Scholar] [CrossRef]
- Llewelyn, G.; Rees, A.; Griths, C.A.; Jacobi, M. A novel hybrid foaming method for low–pressure microcellular foam production of unfilled and talc–filled copolymer polypropylenes. Polymers 2019, 11, 1896. [Google Scholar] [CrossRef]
- Onder, O.C.; Yilgor, E.; Yilgor, I. Preparation of monolithic polycaprolactone foams with controlled morphology. Polymer 2018, 136, 166–178. [Google Scholar] [CrossRef]
- Song, W.; Barber, K.; Lee, K.Y. Heat–induced bubble expansion as a route to increase the porosity of foam–templated bio–based macroporous polymers. Polymer 2017, 118, 97–106. [Google Scholar] [CrossRef]
- Kieback, B.; Neubrand, A.; Riedel, H. Processing techniques for functionally graded materials. Mater. Sci. Eng. A 2003, 362, 81–106. [Google Scholar] [CrossRef]
- Lee, N.J.; Jang, J.; Park, M.; Choe, C.R. Characterization of functionally gradient epoxy/carbon fibre composite prepared under centrifugal force. J. Mater. Sci. 1997, 32, 2013–2020. [Google Scholar] [CrossRef]
- Klingshirn, C.; Koizumi, M.; Haupert, F.; Giertzsch, H.; Friedrich, K. Structure and wear of centrifuged epoxy-resin/carbon fiber functionally graded materials. J. Mater. Sci. Lett. 2000, 19, 263–266. [Google Scholar] [CrossRef]
- Stellbrink, K.; Hausser, G.; Steegmuller, R. One-component composites as functionally gradient materials. J. Thermoplast. Compos. Mater. 1999, 12, 188–200. [Google Scholar] [CrossRef]
- Chen, Z.; Yan, Q.; Huang, Z.; Shen, Q.; Zhang, L. Preparation and characterization of novel functional gradient syntactic foam. Adv. Mater. Res. 2009, 66, 284–287. [Google Scholar] [CrossRef]
- Zhang, W.; Deodhar, S.; Yao, D. Geometrical confining effects in compression molding of co-continuous polymer blends. Ann. Biomed. Eng. 2010, 38, 1954–1964. [Google Scholar] [CrossRef]
- Yao, D.; Zhang, W.; Zhou, J.G. Controllable growth of gradient porous structures. Biomacromolecules 2009, 10, 1282–1286. [Google Scholar] [CrossRef]
- Torres-Sanchez, C.; Corney, J.R. Toward functionally graded cellular microstructures. J. Mech. Des. 2009, 131, 8. [Google Scholar] [CrossRef]
- Elsing, J.; Quell, A.; Stubenrauch, C. Toward functionally graded polymer foams using microfluidics. Adv. Eng. Mater. 2017, 19, 1700195. [Google Scholar] [CrossRef]
- Zhou, C.; Wang, P.; Li, W. Fabrication of functionally graded porous polymer via supercritical CO2 foaming. Compos. Part B Eng. 2011, 42, 318–325. [Google Scholar] [CrossRef]
- Reichert, G. Helicopter vibration control—A survey. Vertica 1981, 5, 1–29. [Google Scholar] [CrossRef]
- Friedmann, P.P.; Millott, T.A. Vibration reduction in rotorcraft using active control—A comparison of various approaches. J. Guid. Control Dyn. 1981, 18, 664–673. [Google Scholar] [CrossRef]
- Grohmann, B.A.; Maucher, C.; Prunhuber, T.; Jänker, P.; Dieterich, O.; Enenkl, B.; Bauer, M.; Ahci, E.; Altmikus, A.; Baier, H. Multidisciplinary Design and Optimization of Active Trailing Edge for Smart Helicopter Rotor Blade. Mech. Adv. Mater. Struct. 2008, 15, 307–324. [Google Scholar] [CrossRef]
- Wierach, P.; Opitz, S.; Kalow, S. Experimental investigation of an active twist model rotor blade with a low voltage actuation system. Aeronaut. J. 2015, 119, 1499–1512. [Google Scholar] [CrossRef]
- Kovalovs, A.; Barkanov, E.; Ruchevskis, S.; Wesolowski, M. Modelling and Design of a Full-Scale Rotor Blade with Embedded Piezocomposite Actuators. Mech. Compos. Mater. 2017, 53, 179–192. [Google Scholar] [CrossRef]
- Mohamed, I.; Şimşek, S.; Kahya, V.; Lanc, D. Computational modelling of functionally graded sandwich beams with porous core using an Ansys APDL-based approach. Mech. Based Des. Struct. Mach. 2024, 53, 4337–4358. [Google Scholar] [CrossRef]
- Al-Itbi, S.K.A.; Noori, A.R. Finite Element Analysis for the Static Response of Functionally Graded Porous Sandwich Beams. Int. J. Eng. Technol. 2023, 8, 13–20. [Google Scholar] [CrossRef]
- Ozmen, U.; Ozhan, B.B. Computational Modelling of Functionally Graded Beams: A Novel Approach. J. Vib. Eng. Technol. 2022, 10, 2693–2701. [Google Scholar] [CrossRef]
- Zainab, A.M.; Luay, A. Calculating the fundamental frequency of power law functionally graded beam using ANSYS software. IOP Conf. Ser. Mater. Sci. Eng. 2021, 1090, 012014. [Google Scholar] [CrossRef]
- Yildirim, S. Free Vibration Analysis of Sandwich Beams with Functionally-Graded-Cores by Complementary Functions Method. AIAA J. 2020, 58, 5431–5439. [Google Scholar] [CrossRef]
- EVONIK Homepage. Available online: https://performance-foams.evonik.com/en/downloads/product-information (accessed on 31 May 2025).
- Zheng, J.; Xiang, J.; Luo, Z.; Ren, Y. Crashworthiness design of transport aircraft subfloor using polymer foams. Int. J. Crashworthiness 2011, 16, 375–383. [Google Scholar] [CrossRef]
- Zhang, D.G.; Zhou, Y.H. A theoretical analysis of FGM thin plates based on physical neutral surface. Comp. Mater. Sci. 2008, 44, 716–720. [Google Scholar] [CrossRef]
- Ruan, M.; Wang, Z.M. Transverse vibrations of moving skew plates made of functionally graded material. J. Vib. Control. 2016, 22, 3504–3517. [Google Scholar] [CrossRef]
- Nayak, P.; Armani, A. Optimal Design of Functionally Graded Parts. Metals 2022, 12, 1335. [Google Scholar] [CrossRef]
- Gupta, A.; Talha, M. Recent developments in modelling and analysis of functionally graded materials and structures. Prog. Aerosp. Sci. 2015, 79, 1–14. [Google Scholar] [CrossRef]
- Ferreira, A.J.M.; Batra, R.C.; Rouque, C.M.C.; Qian, L.F.; Martins, P.A.L.S. Static analysis of functionally graded plates using third-order shear deformation theory and a meshless method. Compos. Struct. 2005, 69, 449–457. [Google Scholar] [CrossRef]
- Srividhya, S.; Basant, K.; Gupta, R.K.; Rajagopal, A.; Reddy, J.N. Influence of the homogenization scheme on the bending response of functionally graded plates. Acta Mech. 2018, 229, 4071–4089. [Google Scholar] [CrossRef]
- Kadoli, R.; Akhtar, K.; Ganesan, N. Static analysis of functionally graded beams using higher order shear deformation theory. Appl. Math. Modell. 2008, 32, 2509–2525. [Google Scholar] [CrossRef]
- Li, X.F.; Wang, B.L.; Han, J.C. A higher-order theory for static and dynamic analyses of functionally graded beams. Arch. Appl. Mech. 2010, 80, 1197–1212. [Google Scholar] [CrossRef]
- Wright, J.R.; Cooper, J.E. Introduction to Aircraft Aeroelasticity and Loads, 2nd ed.; John Wiley & Sons, Ltd.: Hoboken, NJ, USA, 2015. [Google Scholar]
- Cui, L.; Kiernan, S.; Gilchrist, M.D. Designing the energy absorption capacity of functionally graded foam materials. Mater. Sci. Eng. A 2009, 507, 215–225. [Google Scholar] [CrossRef]
- Sun, G.; Li, G.; Hou, S.; Zhou, S.; Li, W.; Li, Q. Crashworthiness design for functionally graded foam-filled thin-walled structures. Mater. Sci. Eng. A. 2010, 527, 1911–1919. [Google Scholar] [CrossRef]
- Koohbor, B.; Kidane, A. Design optimization of continuously and discretely graded foam materials for efficient energy absorption. Mater. Des. 2016, 102, 151–161. [Google Scholar] [CrossRef]
- Li, S.; Li, Q.M.; Tse, K.M.; Pang, T. Functionally graded foam materials for head impact protection. Thin-Walled Struct. 2024, 203, 112193. [Google Scholar] [CrossRef]
- Zhang, Y.; Xu, X.; Liu, S.; Chen, T.; Hu, Z. Crashworthiness design for bi-graded composite circular structures. Constr. Build. Mater. 2008, 168, 633–649. [Google Scholar] [CrossRef]
- Riemenschneider, J.; Keye, S.; Wierach, P.; Mercier Des Rochettes, H. Overview of the common DLR/ONERA project active twist blade (ATB). In Proceedings of the 30th European Rotorcraft Forum, Marseille, France, 14–16 September 2004; pp. 273–281. [Google Scholar]
- Shojaeefard, M.H.; Googarchin, H.S.; Mahinzare, M.; Ghadiri, M. Free Vibration and Critical Angular Velocity of a Rotating Variable Thickness Two-Directional FG Circular Microplate. Microsyst. Technol. 2018, 24, 1525–1543. [Google Scholar] [CrossRef]
- Mahinzare, M.; Barooti, M.M.; Ghadiri, M. Vibrational Investigation of the Spinning Bi-Dimensional Functionally Graded (2-FGM) Micro Plate Subjected to Thermal Load in Thermal Environment. Microsyst. Technol. 2018, 24, 1695–1711. [Google Scholar] [CrossRef]
- Nguyen, H.N.; Hong, T.T.; Vinh, P.V.; Thom, D.V. An Efficient Beam Element Based on Quasi-3D Theory for Static Bending Analysis of Functionally Graded Beams. Materials 2019, 12, 2198. [Google Scholar] [CrossRef]
Disclaimer/Publisher’s Note: The statements, opinions and data contained in all publications are solely those of the individual author(s) and contributor(s) and not of MDPI and/or the editor(s). MDPI and/or the editor(s) disclaim responsibility for any injury to people or property resulting from any ideas, methods, instructions or products referred to in the content. |
© 2025 by the author. Licensee MDPI, Basel, Switzerland. This article is an open access article distributed under the terms and conditions of the Creative Commons Attribution (CC BY) license (https://creativecommons.org/licenses/by/4.0/).