1. Introduction
The bending process within the metal-forming operation is significant in the industrial, construction, and commercial sectors. This process allows the adaptation and structuring of mechanical elements and their contiguous use. The primary analysis for this process focuses on the several factors that influence the bending process. The correct bending process will allow controlling factors that can weaken the bending zone, as well as the natural return process, known as “spring-back,” which is generated after the metal is plastically deformed. The study of these factors is essential to define the quality and precision of the components manufactured to achieve functional efficiency and a long service life. In metal-forming manufacturing, the most common elements for the bending process are sheets, tubes, and wires. It is important to be familiar with research carried out on sheets and tubes to consider possible aspects of analysis for the wire case.
The bending of metal sheets is the most extensively addressed process in this field. Studies conducted in [
1] consider several factors directly affecting spring-back as a complex and undesirable phenomenon. The most common factors include punching characteristics [
2,
3], die shape opening, sheet thickness, geometric characteristics and dimensions, load and speed of the punch, friction coefficients [
4], and coining force [
5]. Common shapes produced from sheets include U [
6,
7], V [
4,
7], L [
8], and T [
9], where the precision of the process and study of the stress distribution are essential [
10].
In the case of tubes as hollow elements that maintain excellent mechanical properties even with their reduced weight compared to solid elements, the manufacturing process for the bending requires additional considerations compared with the bending of sheets or wires. For the tube-bending process, guide elements are sometimes introduced in the bending region to help maintain uniform curvature radii [
11]. In some cases tube-bending equipment needs to be modified to improve results [
12]. In industries as demanding as aeronautics and aerospace, titanium tubes are used due to their special characteristics [
13]. The defects that may arise from bending curvature in the case of tubes are cracking, thinning, wrinkling [
14], and flattening [
12]. In addition to wrinkling, thickness reduction, ovalization, and spring-back have been analyzed in [
15]. The complexity of the bending process requires computer simulation support to validate and improve results. In [
15,
16], a series of virtual tests were conducted by varying the tube thickness and the friction coefficient during contact with the bending elements to estimate spring-back behavior.
The wire-bending process, which is also of great importance and complexity, is carried out with the support of rollers. In some cases, additional control tools are required for its execution due to undesirable factors such as spring-back and “the slip-warping phenomenon” [
17]. In recent years, studies of wire bending have been employed in orthodontics for human comfort [
3,
18].
Although spring-back is a complex and unpredictable effect, it is an important factor for the bending process, and the need for greater precision and quality in production arises. Advances in technology and computer simulation allow for the prediction of spring-back for product improvement [
4,
6,
7,
19]. In [
20], a computer simulation for a titanium alloy wire was developed; the results were validated through experimental test, demonstrating that spring-back depends mainly on the bending radius, bending angle, and wire diameter. There are cases such as [
21] where the precision of the radius of curvature in the bending of wires impacts the dielectric properties of the turn-to-turn insulation through thermal aging. Nowadays, modern analysis methodologies are used, where neural networks [
22,
23] and artificial intelligence [
24] are applied to predict this phenomenon. For tube bending, a CNC-controlled process is validated through computer simulation and experimentation [
25]. For wire bending, a flexible CNC-controlled machine has been implemented, supported by a precision algorithm based on the fundamental beam-bending equations [
26]. Additionally, recent studies highlight that the quality of metal foam materials—widely used in industrial applications due to their unique structural properties—depends increasingly on secondary processing steps such as precise cutting and reliable joining techniques, which present significant challenges due to their complex geometry and porous nature [
27].
The bending of a metallic element indicates that for each material, there is a distinct “rule”, which prevents understanding the true principle of the behavior of the same process across different materials. Spring-back is so unpredictable that even for the bending process in the present case study, the execution tool must be calibrated according to each batch, even when the material has the same specifications.
The contribution of this study is of great importance, as it consists in establishing the necessary engineering tools to define a correct bending range in wires that allows the wire to develop its function optimally. These tools are essential in the present work which closes a gap in design and manufacturing, by establishing a minimum bending radius criterion for SUS304 wires through a tripartite methodology: (1) analytical modeling incorporating strain-hardening anisotropy, (2) FEM simulation with explicit grain-structure effects, and (3) experimental validation using digital image correlation (DIC). Our approach specifically addresses the slip-warping phenomenon [
17], a defect unique to wire bending that remains understudied in prior works.
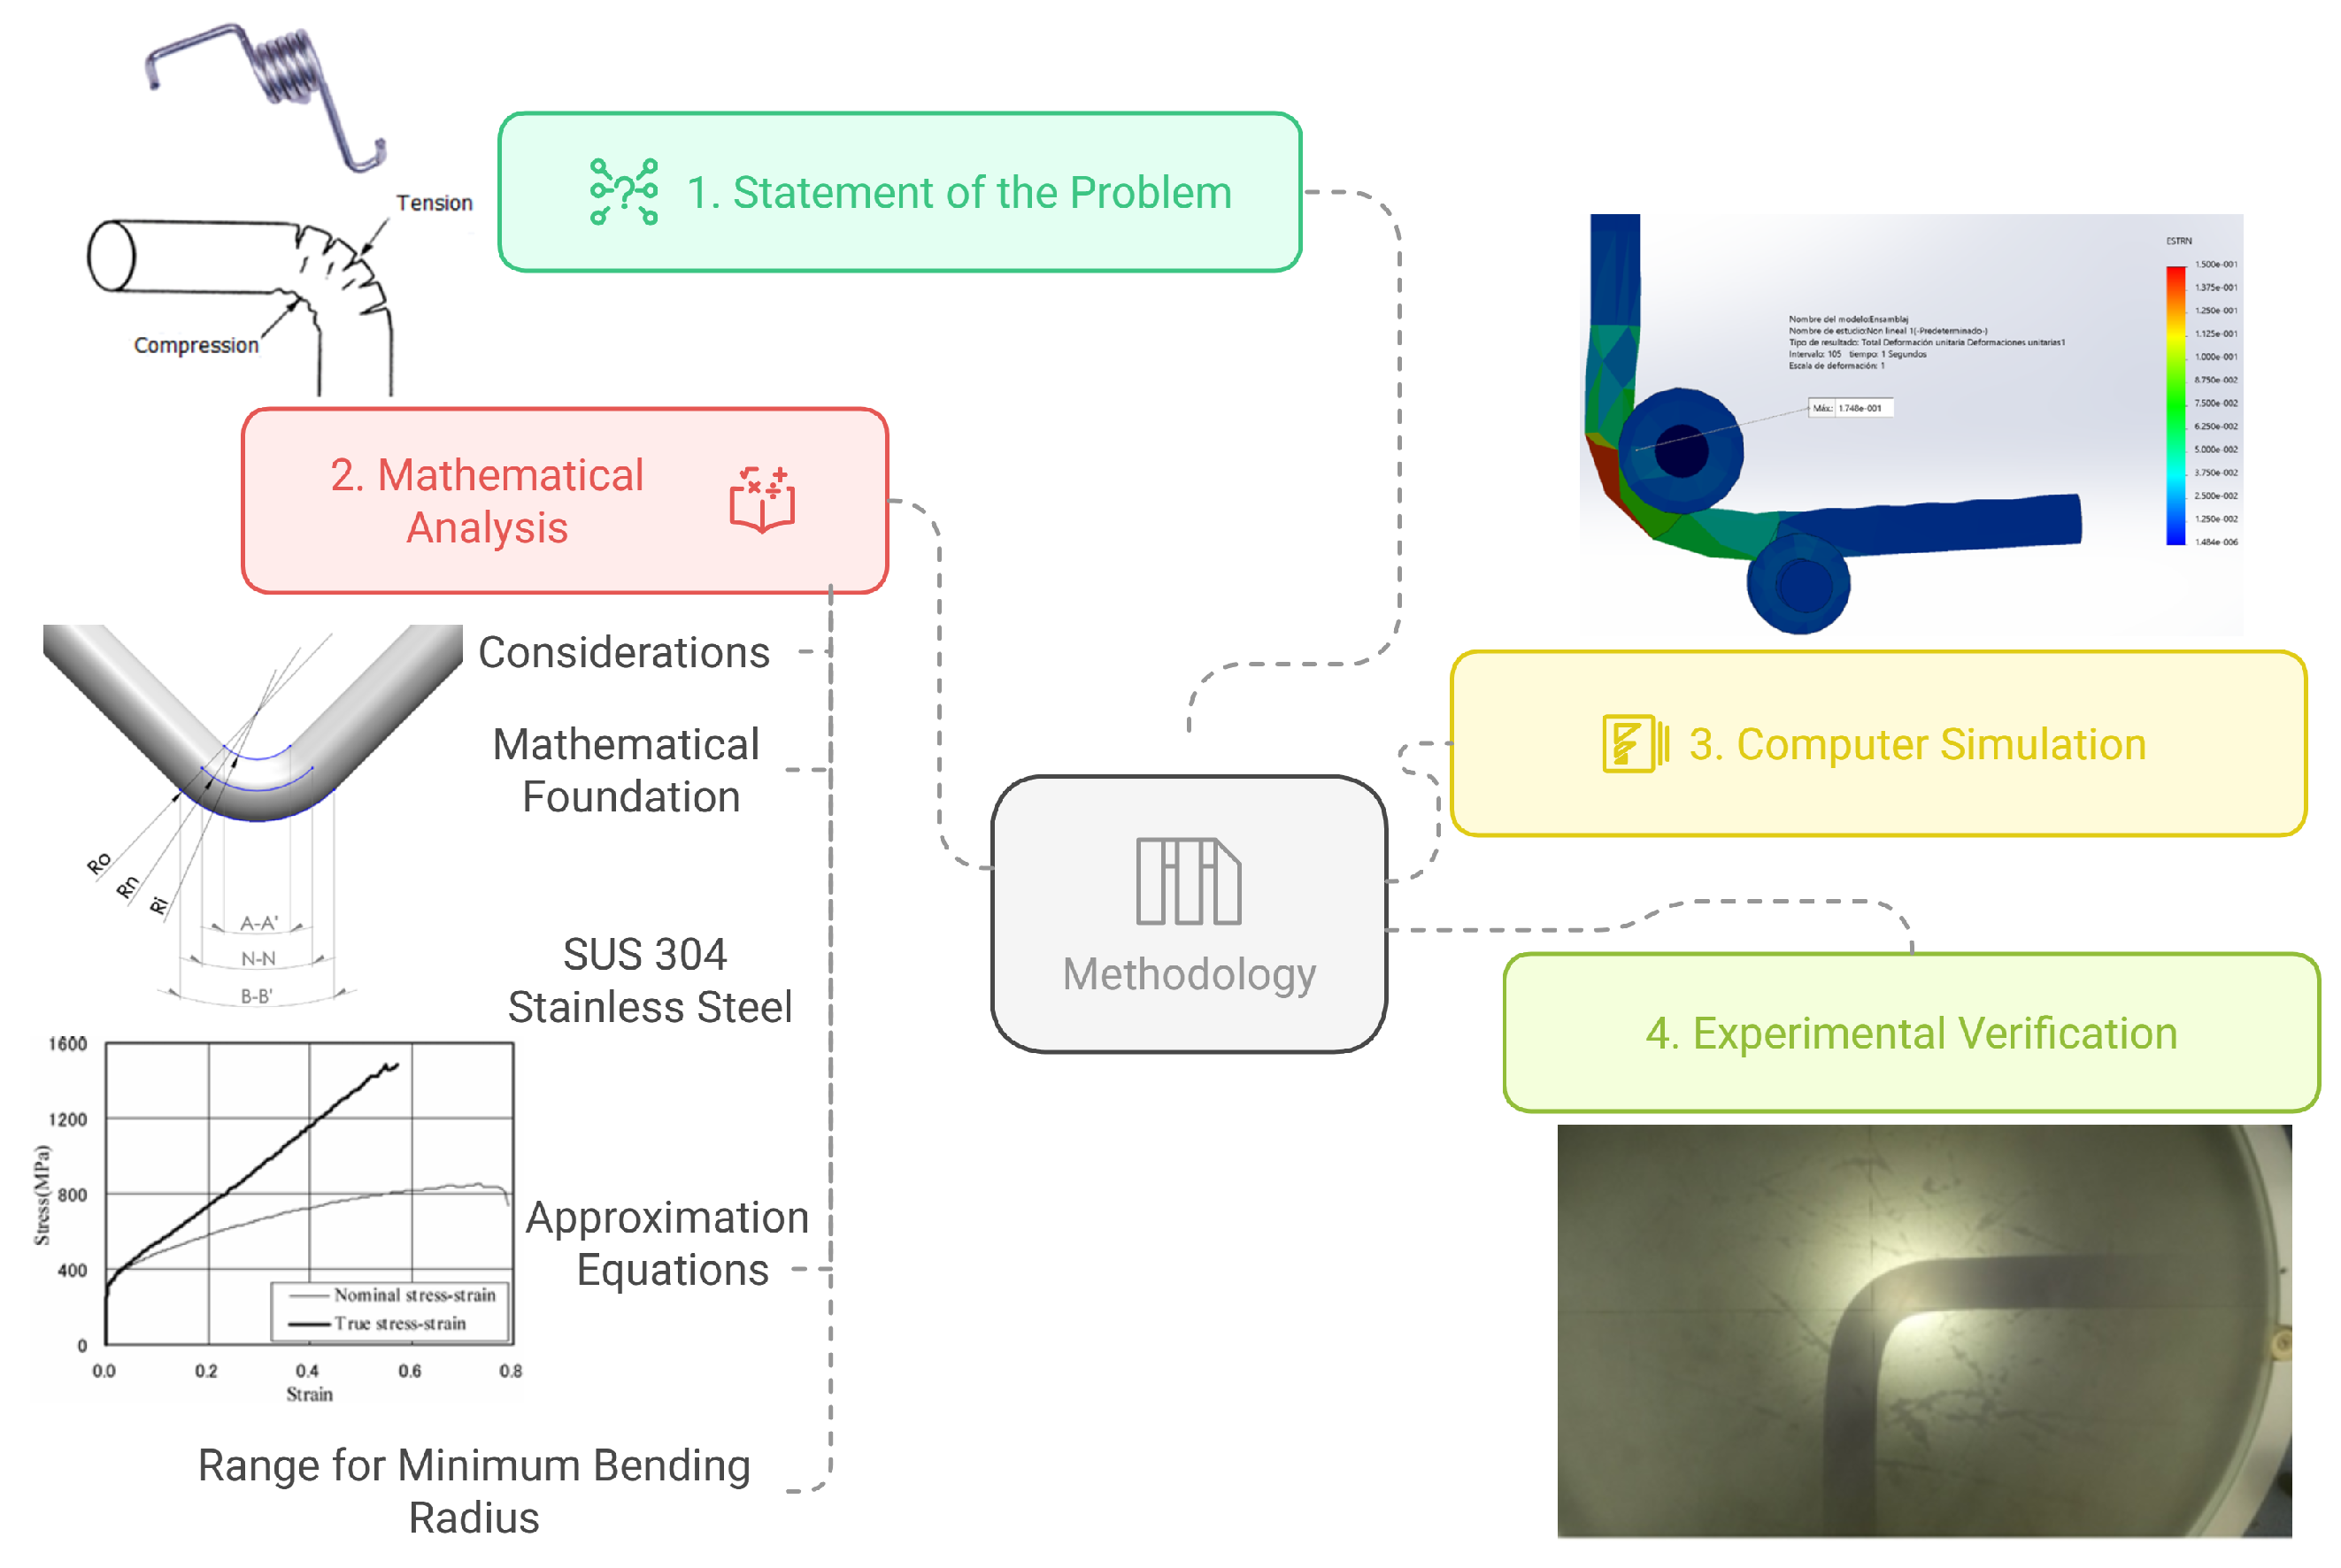
The methodology developed in this article is defined in
Figure 1. In
Section 2, the bending process is presented as an essential part of metal forming, impacting various industrial and commercial manufacturing sectors. In
Section 3, a mathematical model is developed to analyze the bending process, focusing on parameters such as the bending radius and the unit strains generated by bending. This model aids in defining the operational range necessary for effective bending, particularly for materials like SUS304 stainless steel. In
Section 4, the bending process is validated through finite element analysis (FEA), which involves simulating the bending operation to predict deformation outcomes. This simulation is critical in establishing the necessary conditions for accurate bending. Finally, in
Section 5, a practical-experimental verification is reported to calibrate the bending process effectively; this involved using specific machinery and tools to perform controlled bends, ensuring that the theoretical models align with real-world applications.
2. Statement of the Problem
Several designs of torsion springs typically have bends of 90° at their ends, as shown in
Figure 2. These types of springs have various uses, such as handles, clocks, doors, levers, machinery, cup holders, automotive components, and the butterflies of intake valves, to name just a few. Wires with 90° bends have applications in household appliances, the agricultural sector, and sport fishing.
A precise definition of the minimum curvature radius prevents material weakening during bending and premature fatigue during service. The objective is to determine the necessary specifications so that during the bending process, the elastic region is surpassed and permanent deformation occurs without exceeding the fracture or ultimate stress.
2.1. Schematic Description of the Problem
According to the standards for interpreting technical drawings, a 90° bend can be assumed to represent a “pure corner” with no predetermined radius. In forming processes, this is not feasible because the inner fibers would need to compact to zero, while the outer fibers would elongate exponentially. Attempting this would be detrimental, as it causes damage in the bending area of the wire, being maximum in the internal and external fibers. These regions are the most critical in relation to stress and deformation. The problems or defects that arise include bulging and fracture, as shown in
Figure 3; for this reason, it is necessary to define a minimum bending radius in the manufacturing drawing and consider it during the manufacturing process to ensure the quality and integrity of the part.
2.2. Design and Manufacturing Specification
A design and manufacturing specifications issue occurs where there is a lack of consideration in design for the internal radii, which are necessary to avoid stress and deformation concentrations at the corners produced during bending processes. The omission of this consideration leads to two problems:
Mechanical failure of the spring due to material weakening, as it will fatigue prematurely.
Failure when reviewing the dimensions on the manufacturing drawing because a radius is added, resulting in the rejection of the part before verifying its application; according to technical drawing standards, there should be no radius in a straight bend. The spring is manufactured according to specifications, and omitting this radius will lead to failure of the element; thus, there is an opportunity to develop the study on this condition and present evidence to justify and support quality criteria.
For the industrial context, the analysis described here can be applied as a reference for methods used in the wire-bending process to avoid potential quality issues in products whose designs lack proper dimensioning. In the context of research, three key aspects are established:
- (a)
An effective methodology that defines a range for straight bending in wires based on the minimum radius as a geometric factor.
- (b)
Necessary considerations for accurate computer simulation in wire bending.
- (c)
Validation of the effectiveness of the established considerations so that satisfactory results are obtained in real tests.
3. Mathematical Analysis
The Euler–Bernoulli theory [
28] correctly models small bends or deformations within the elastic modulus. Other theories, such as the Timoshenko beam theory [
28], can also be used to model plastic deformations. Even so, more in-depth studies are needed for these theories since their postulates are generally used for elastic limits in failure theory, not for plastic deformations. Creep or yielding is the unrecoverable deformation, beyond which only part of the deformation corresponding to elastic deformation is restored, resulting in irreversible deformation. This phenomenon occurs just above the elastic limit and produces an abrupt deformation without a linear change in the applied stress. When plastic or permanent deformation occurs, the behavior of metals is nonlinear, which adds to the complexity of the mathematical analysis. According to [
29], several analytical and numerical models for bending sheets have already met the required accuracy for each case. The mathematical prediction of the nonlinear behavior of spring-back in sheet bending requires a relatively complex analysis; however, there are studies such as those reported in [
5] that develop semi-empirical equations validated through experimental tests and computer simulations using FEM. In the case of tubes, few research works have also developed analytical models of the bending process due to its complexity [
30].
For the mathematical study of wire bending, similarly to sheets, it is also necessary to analyze deformation applying both elastic and plastic analyses. Recently, a comprehensive study was conducted to improve the precision of bending cylindrical helical springs with circular cross-sections [
31]; this study included mathematical analysis, finite element simulation, and experimental tests for various diametrical values. For wire bending, mathematical models described in [
29,
32] analyze the elastoplastic behavior of the element. The study of this nonlinear behavior in [
29] is divided into three sections: 1. Elastic–perfectly plastic; 2. Linear strain hardening; and 3. Elastic and plastic with exponential strain hardening based on Ludwick’s model. The mathematical analysis was developed for two types of cross-sections: rectangular and circular; according to Bernoulli, it is assumed that the ends of the wire remain flat, perpendicular to each other, and without deformation after bending. The analysis in [
32] is based on an elastoplastic study focused on predicting spring-back in beams subjected to fatigue, specifically, repeated bending/unbending. The elastoplastic study was conducted from a state of stress based on geometry, considering circular, rectangular, and isosceles trapezoidal cross-sections. Even today, the analysis of bending wires continues to represent a significant contribution to the field of research.
3.1. Considerations for Analysis
Practice indicates that if the diameter of the wire is larger, regardless of the material, the minimum bending radius must also be larger. Similarly, with an increased hardness of the wire material, the minimum bending radius will need to be greater to avoid adverse conditions. The deformations associated with the plastic modulus when formed cold cause the material to harden (strain-hardening). This phenomenon changes the material’s mechanical properties in the bending “elbow” region, where plastic deformation occurs; this represents an additional factor that requires a comprehensive analysis for estimating the process.
3.1.1. The Recovery of Bending, “Spring-Back”
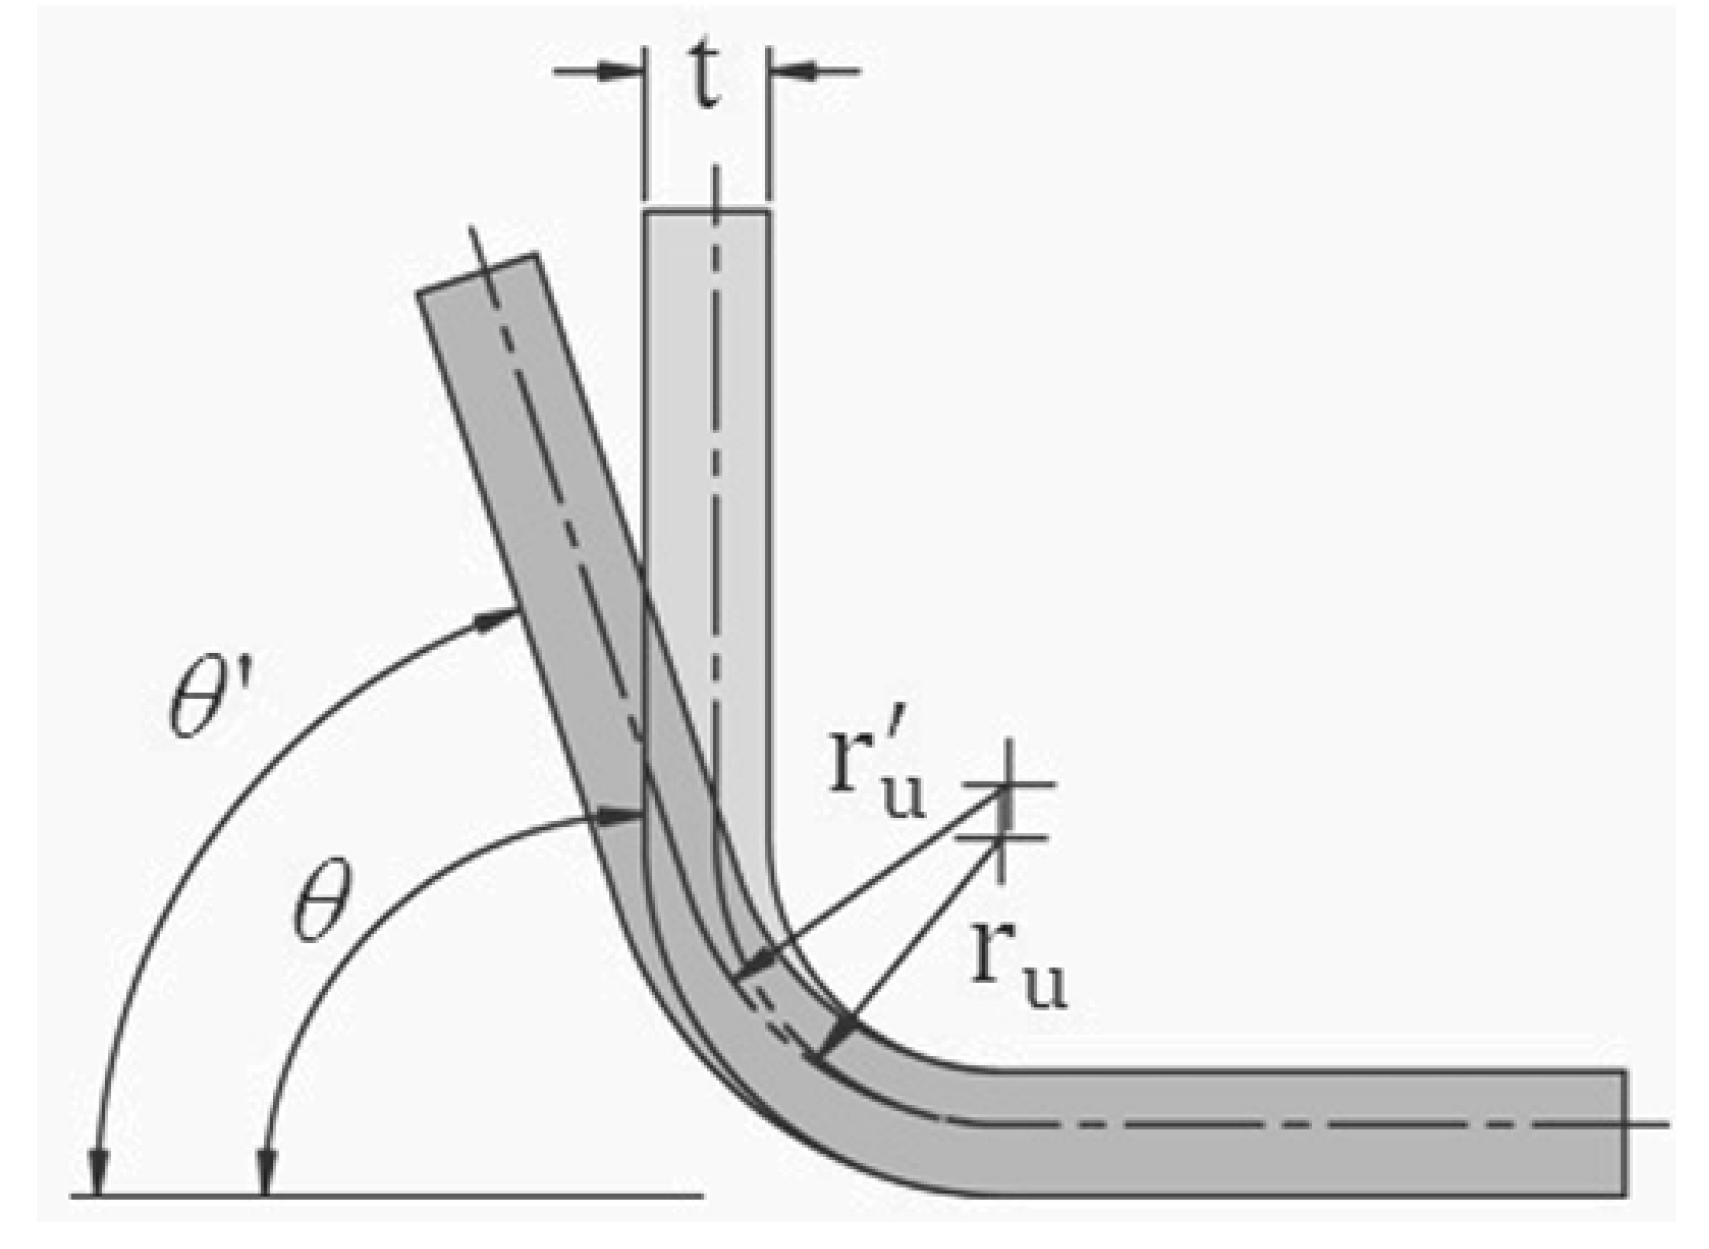
Steels exhibit elastic recovery after the release of bending forces, known as “spring-back,” during the forming process, as shown in
Figure 4. This is defined as the release of elastic tension and is directly related to the material’s yield strength.
This phenomenon requires a greater deflection angle to achieve the expected angle after bending; this type of “recovery” is especially observed in high-strength steels. Depending on the elastic modulus of each material, there is a different rebound or recovery effect, which is more significant in materials with an elastic regime that allows for substantial deflection before plastic deformation. Materials used for springs commonly possess this characteristic.
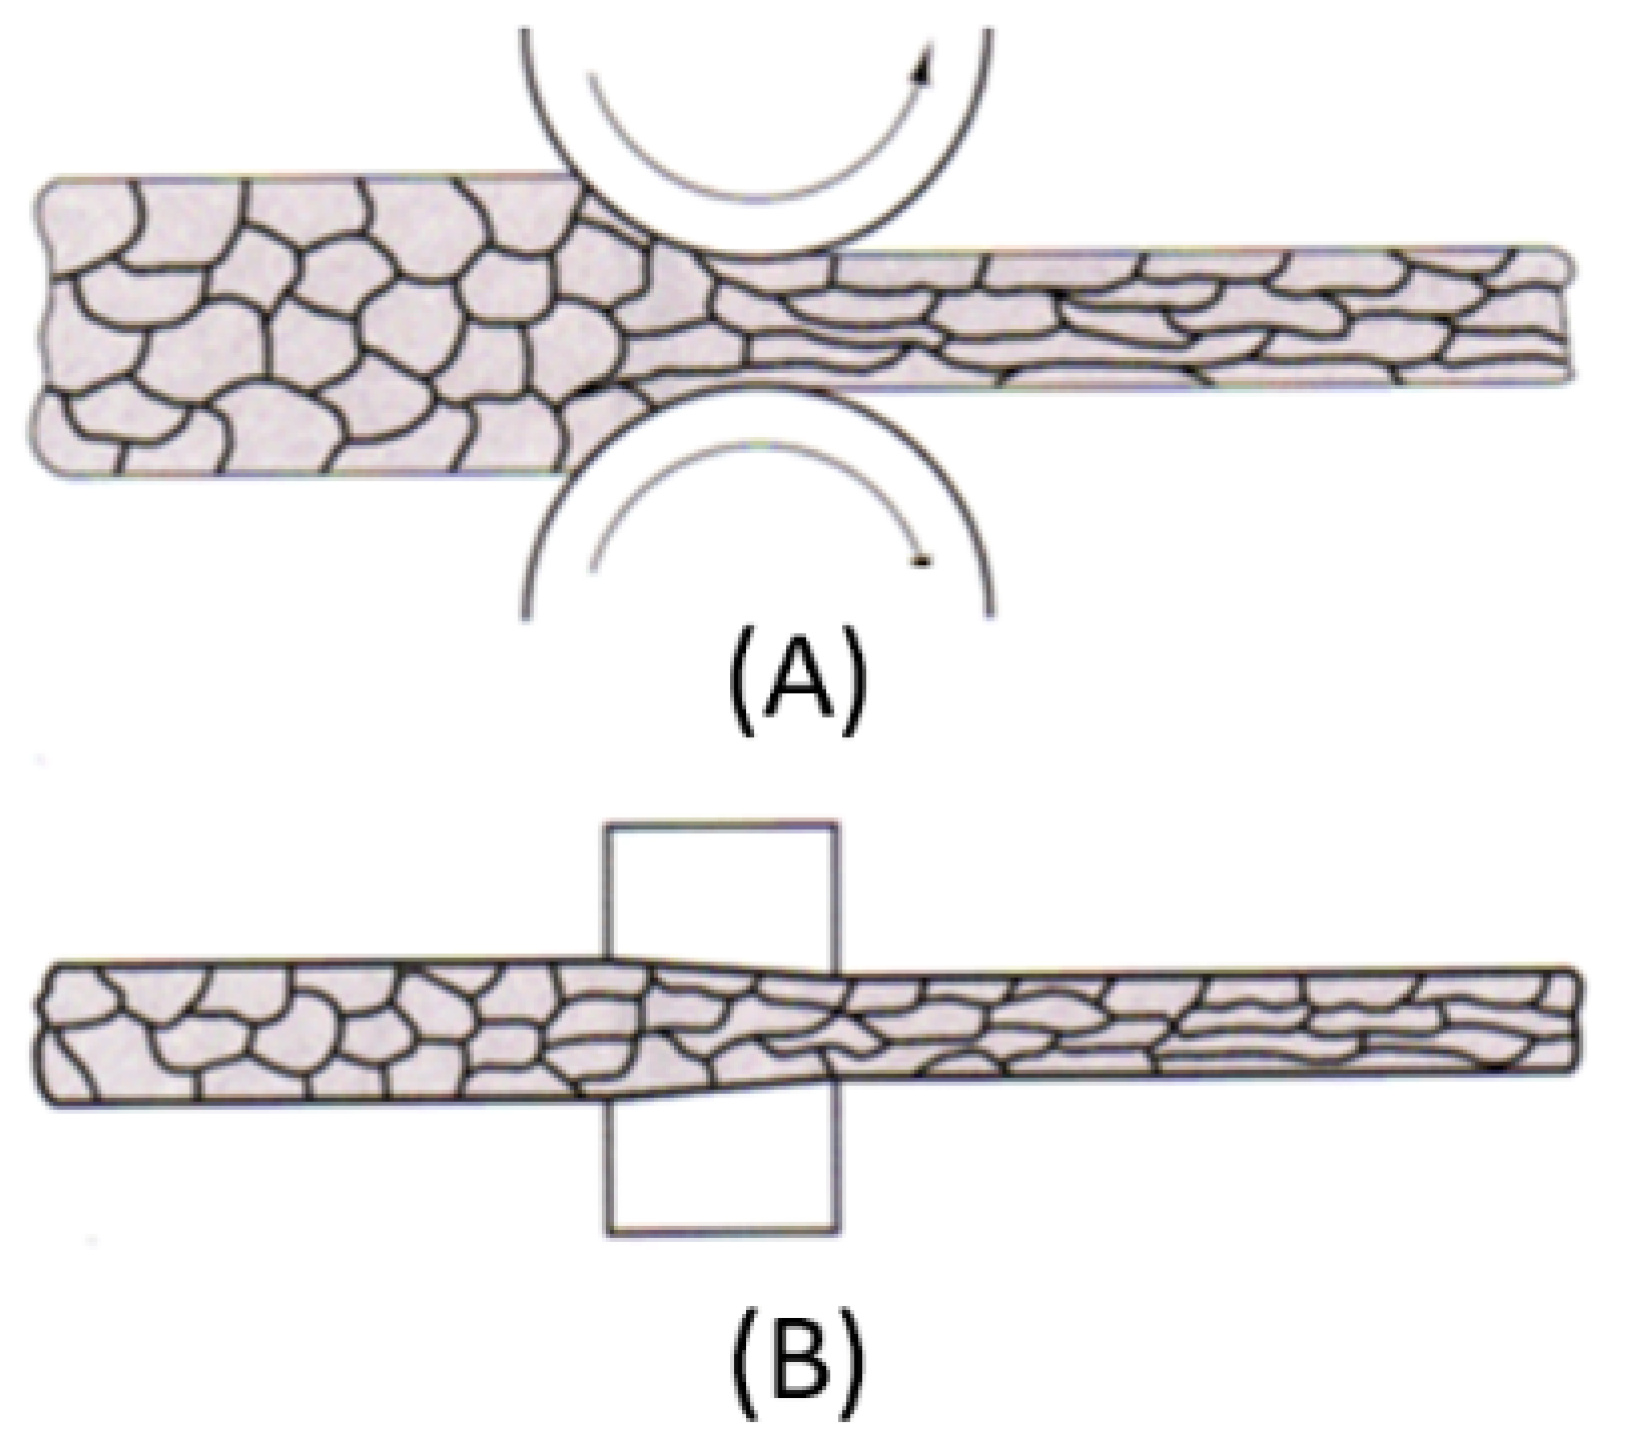
3.1.2. The Importance of Granular Structure in the Cold-Forming of Wires
The raw material for springs (wire) is obtained by a drawing process, either by rollers or dies, as shown in
Figure 5. This produces a fibrous structure where the grains are elongated in a direction parallel to the wire axis. This condition requires greater effort to achieve the same bends, as the material has hardened due to deformation during the previous process. To restore ductility to the wire, the material is annealed to its recrystallization temperature, and the crystalline structure no longer influences subsequent deformation processes, as the grains will reform free of residual stress, resulting in an isotropic structure.
3.2. Mathematical Foundation
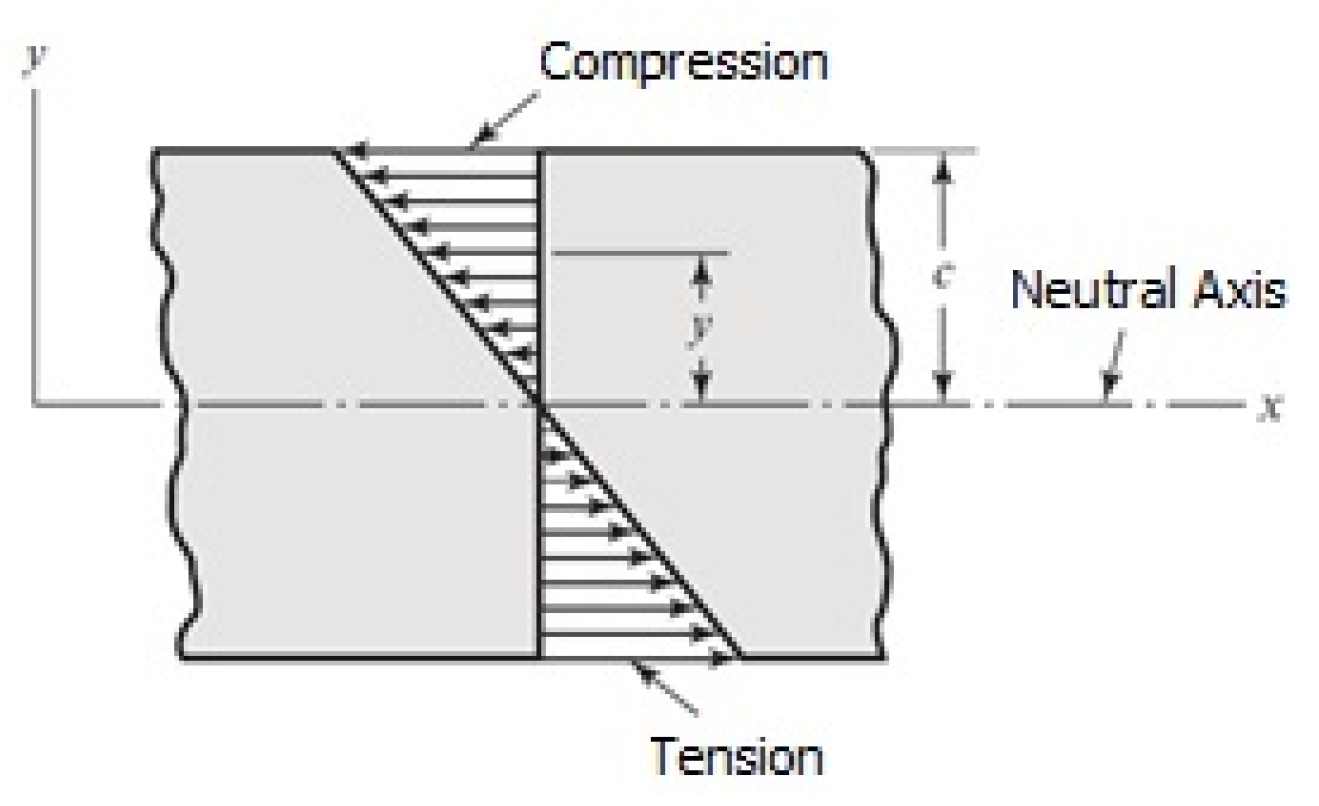
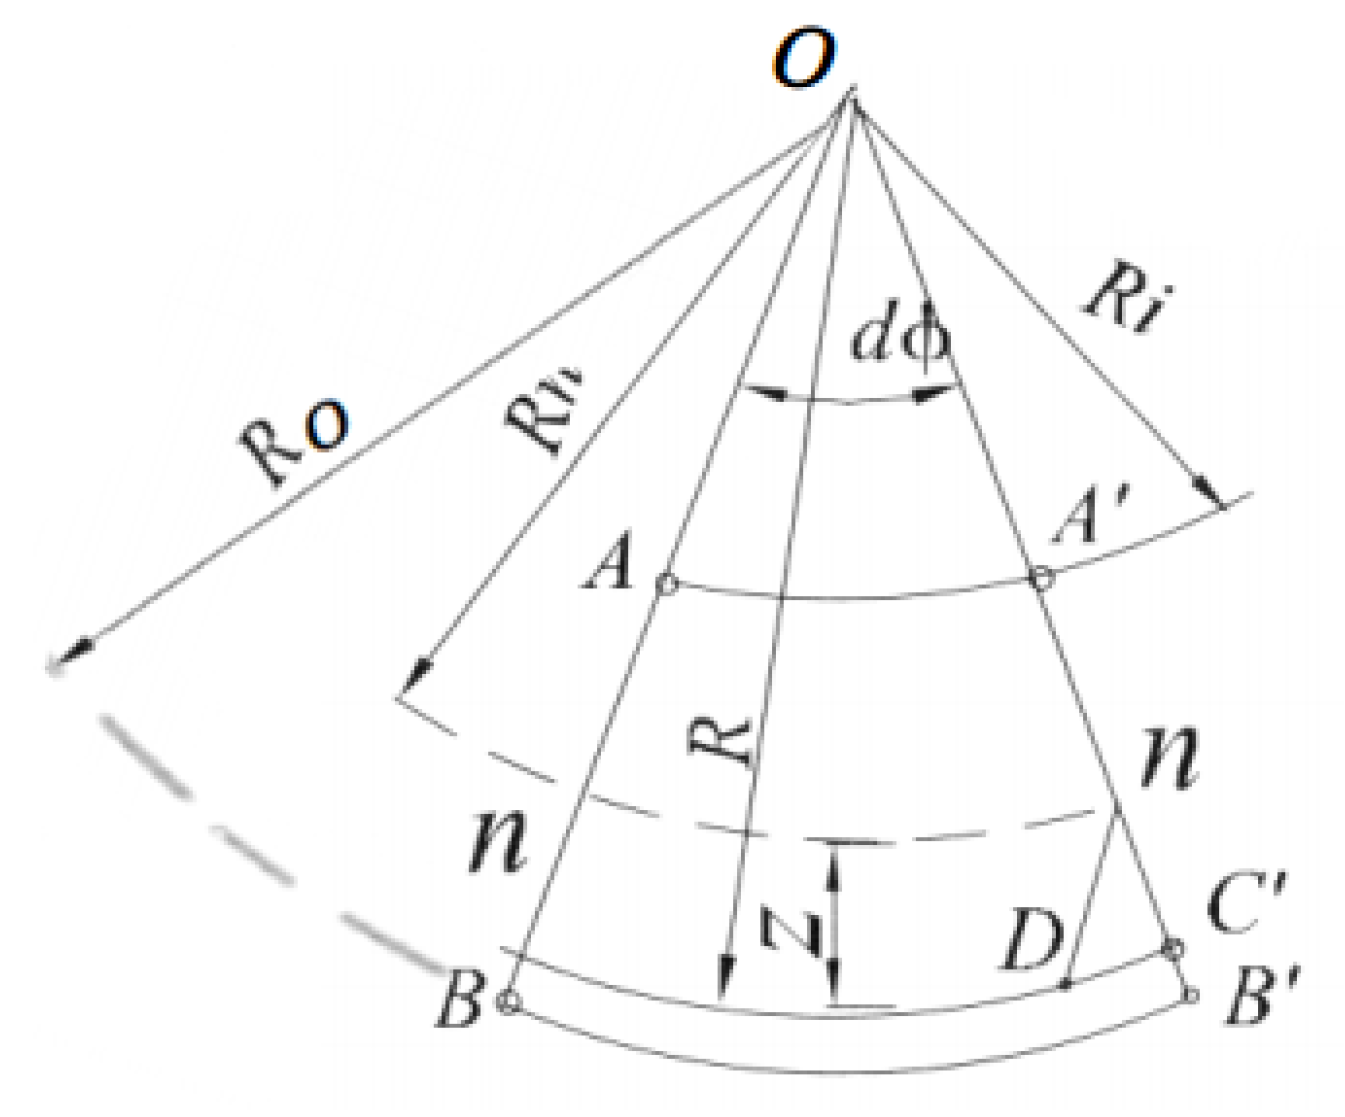
The problem pertains to a solid circular cross-section beam (wire). The Euler–Bernoulli theory has various postulates for modeling bending problems in beams, as shown in
Figure 6. For this case, the following points must be considered:
The Euler–Bernoulli theory is applicable in the elastic region, which requires expanding the already-defined equations.
From the classical theory of material strength, bending in beams is defined by Equation (
1).
where
is the normal stress,
M is the bending moment,
y is the perpendicular distance from the neutral axis to the fiber under analysis, and
I is the moment of inertia of the cross-section based on the neutral axis and the direction of the bending axis.
When the load is applied progressively and consistently over time, it eventually exceeds the yield strength of the material, creating the need for a nonlinear diagram of stress vs. strain.
3.3. SUS304 Steel Analyzed
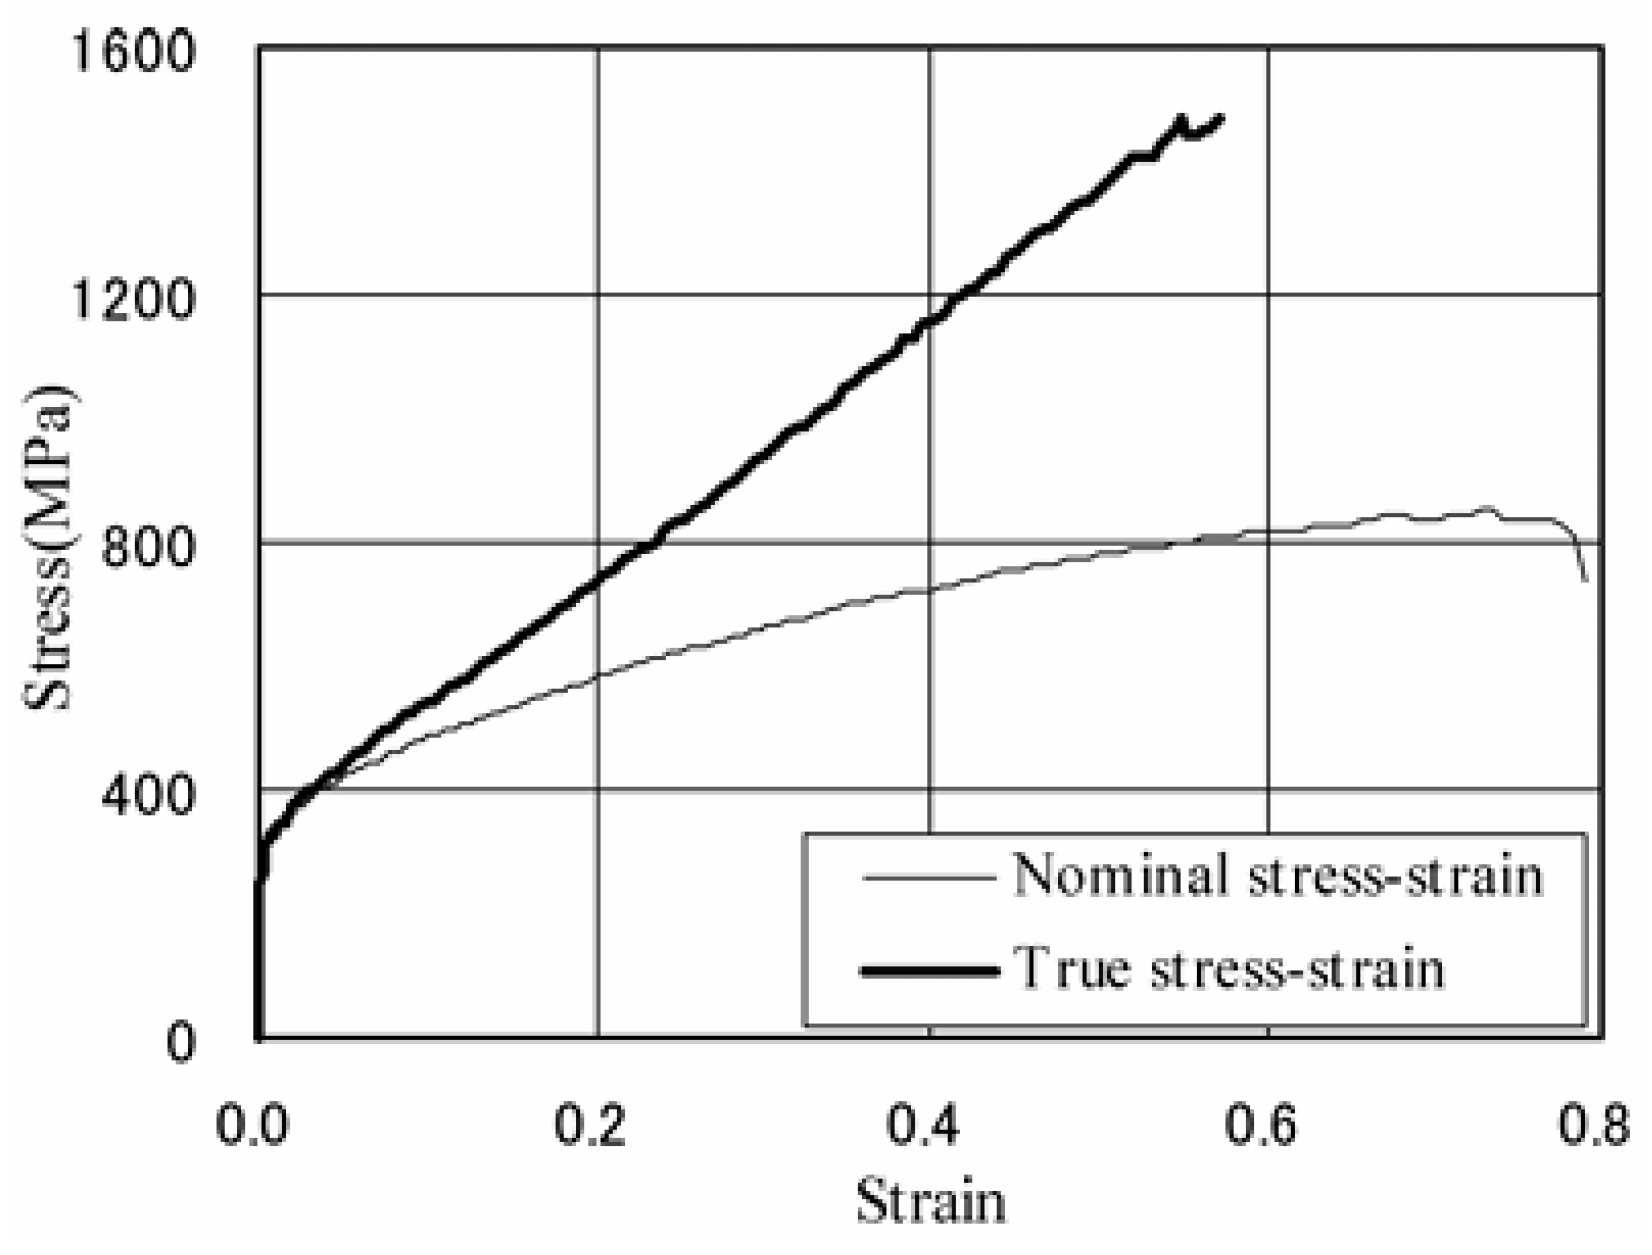
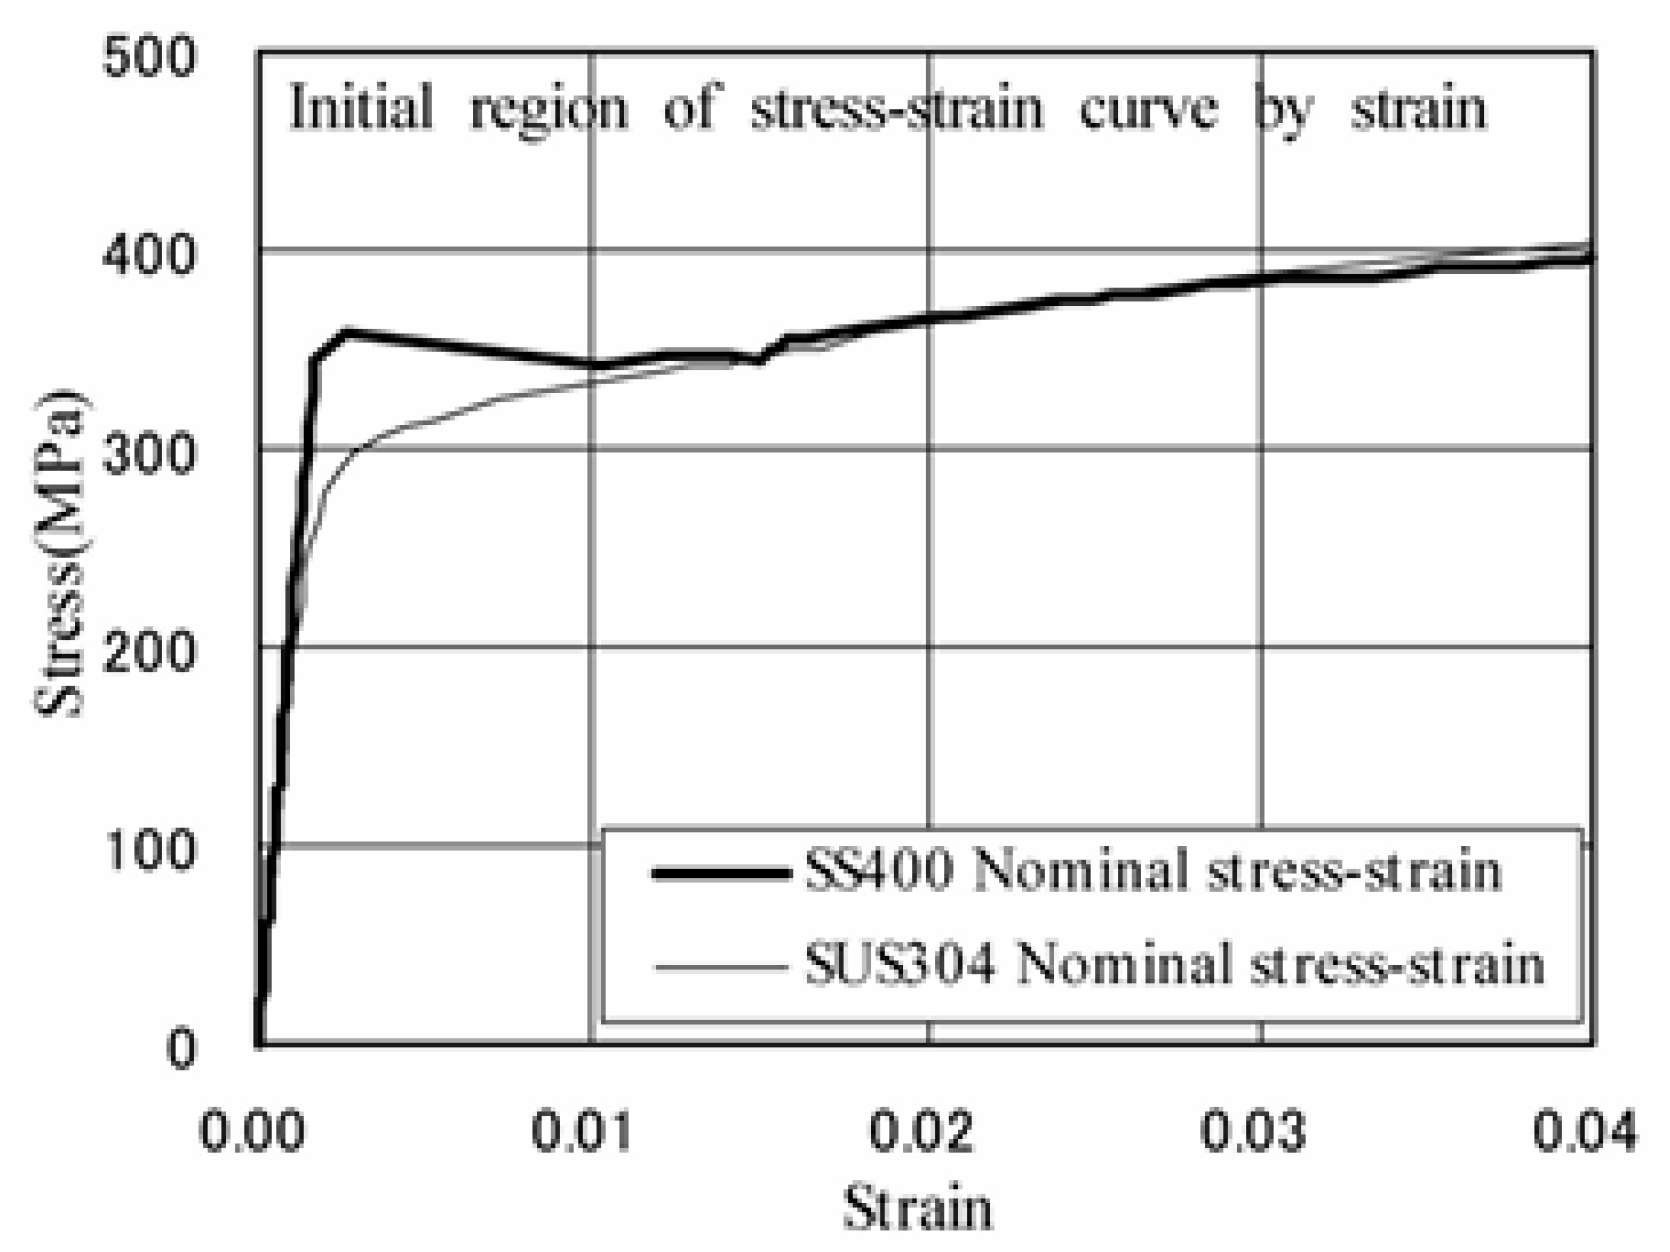
The SUS 304 steel composition employed here ranges from 99.4% to 99.9% aligning with the American standard AISI304. This minimal difference arises because the nitrogen percentage is not specified for SUS 304 steel. The 300 series indicates austenitic stainless steel, while the 400 series refers to ferritic or martensitic stainless steel. According to [
35], the maximum elongation that SUS304 steel can withstand before fracturing is approximately 58% for the true stress and 70% for the nominal stress, as shown in
Figure 9. In the nominal stress, the reduction in area during the application of force is not considered.
The percentage of elongation quantifies the permanent deformation at fracture (plastic deformation), meaning that it does not include the deformation recovered after fracture (elastic deformation). Thus, it measures the distance between the calibrated measurements on the sample before and after the test. The deformation after failure or fracture is less than the deformation at the breaking point because elastic stress is recovered when the load ceases.
From
Table 1 for SUS304 steel, the maximum elongation limit is 63%. Therefore, according to the Euler–Bernoulli’s theory, the fiber farthest from the neutral axis must not be stretched more than 63% of its original length; any greater elongation will exceed the permissible stress, leading to fractures in the material or necking.
3.4. Mathematical Model for the Case Study
To establish a range of values based on the minimum radius of plastic bending, the values from the stress and unit strain graph shown in
Figure 9 are used, along with the suggestion by the authors in [
36], who indicate 40% as an allowable amount of deformation for this material. According to the Euler–Bernoulli theory, the fibers expand proportionally, and while they cease to exhibit linear behavior outside the elastic region, they remain proportionally stretched in the plastic region; the difference lies in the fact that now the unit strain reaches higher values.
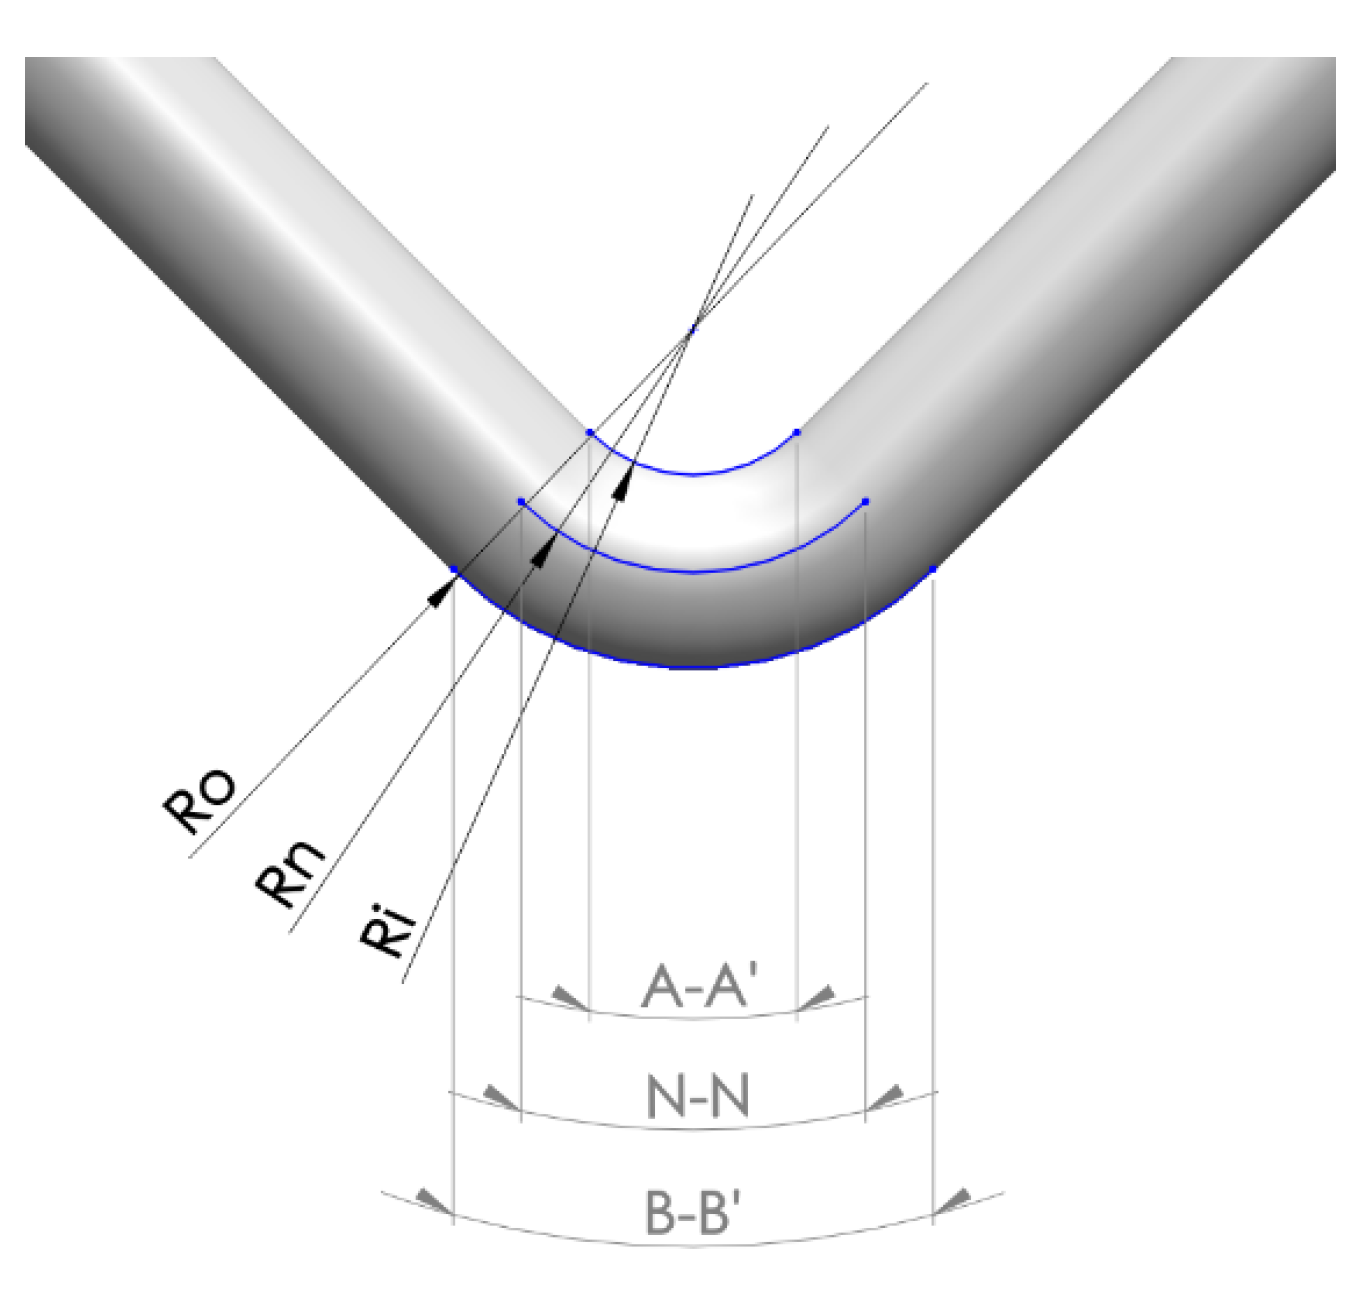
In
Figure 10, the internal fiber A and the external fiber B have altered their lengths after bending, while the fiber at the neutral axis N retains the same length. Thus, the outer fiber of the material should not exceed the limit of 40% unit strain compared to its initial length to avoid damage from necking or cracking, keeping in mind that for steels, the tensile stress they can withstand is lower than that of compression.
Table 1 and
Figure 11 include both steels because [
35] carried out a comparison and research on the mechanical behaviors for bolted connections in carbon steel SS400 and in stainless steel SUS304 using FEM.
From the circle’s perimeter and based on the radius to the neutral axis
, Equation (
3) defines the base expression for analyzing the minimum radius.
A 90° bend represents one-fourth of the perimeter of the circle:
The radial distance from the outermost fiber
(outer radius) minus the radius of the wire’s cross-section r (0.5 mm) defines the radial distance to the neutral axis:
By substituting
into Equation (
4), we have:
The percentage of elongation can be found from the maximum allowable strain for the outermost fiber subjected to tension, and with this relationship, we can also define the length of the outer fiber in terms of
and
.
This can be rewritten to solve for
in Equation (
7),
Thus, we have two equations that relate both terms
and
, Equations (
6) and (
8), so we can solve for
, which defines the minimum bending radius as a function of the maximum elongation that can be achieved without weakening the material:
This relationship applies to any bending of wire, defining the minimum bending radius as a property that depends on the ductility and the element’s radius. Due to bending, the outer length will increase after the process. Therefore, another factor must be added to include the elastic region that must be exceeded before material yielding occurs. To approximate the additional strain required to make a 90° bend while considering “elastic spring-back,” we must add the unit strain inherent to the elastic region. According to some authors, elastic strain is often negligible in highly ductile materials (>30%) since it represents a very low percentage of unit strain [
34], based on the stress–strain diagram.
Figure 11 shows the expansion of the stress–strain graph.
According to [
35] and based on
Figure 11, the elastic region is surpassed at approximately 288 MPa. This indicates that there will be a unit strain of less than 0.005% compared to the initial length. To add this percentage to Equation (
9), the percentage of elongation required to exceed the elastic region by approximately 0.005% must be added to the maximum acceptable deformation percentage; thus, the unit strain for the elastic-plastic region will be expressed as the sum of both (
). Thus, Equation (
9) yields:
In this way, the relationship can also be applied to materials that have a high yield strength and whose elastic region is considerable for the final displacement of the bend. In the case of steel, the outer fiber in tension is the most susceptible; Equations (
10) and (
11) determine how much unit strain is permissible for the outer bending radius
.
3.5. Equations Based on the Minimum Bending Radius Criterion
The maximum percentage of ductility is obtained through a tensile test, and the percentage of ductility varies within a range, similar to the permissible variations in the composition of the material.
In the production of torsion springs, tensile tests are not conducted for each batch of incoming material because the certification of the material standard verifies its composition, but not its ductility precisely or other factors. Therefore, it is advisable to rely on a ductility percentage lower than the maximum to ensure that this value is not exceeded. According to [
35], SUS304 steel has variability between its maximum and minimum ductility due to its composition.
To estimate what value of the ductility percentage should be used, reference is made to two terms that derive from the minimum bending radius [
37]:
The theoretical minimum radius is the smallest radius at which bending of the element is physically possible and corresponds to the case that uses the maximum allowable percentage of elongation before mechanical stricture occurs.
The recommended minimum radius uses the lower value of the reported percentage of elongation for the material, meaning a value less than the previous case, ensuring that the radius will always be elongated by a distance less than the maximum ductility of the material, thus avoiding undesirable effects, because the ductility does not reach the maximum theoretical limit.
The percentage of deformation to be considered in this project is 40%, based on [
36], which indicates the amount of allowable deformation for SUS304 steel. The deformation values are defined as follows:
By substituting the necessary values into the relationship (
), the result is 0.405 as the permissible unit strain percentage considering both regions, plastic and elastic. Substituting and developing now in Equation (
11) with r = 0.5 yields:
The maximum allowable elongation for the outer fiber of the bend has been determined to not exceed the ductility of this material; otherwise, it is possible that undesirable defects may begin to appear. To know the limit at which defects will begin or the limit where the ductility of the material is exceeded, we substitute with the higher percentage, which according to [
35] can be up to 70%. In this case,
a value of 67% will be used, which falls within the stipulated range of maximum allowable values, between 63% and 70%; see
Table 1 and
Figure 8.
Now, both values for the limit bending radii are known:
Bending can be performed based on a defined range between the minimum recommended radius and the theoretical minimum radius; otherwise, there will be damage to the cross-section that will affect the performance of the piece. This range of bending is illustrated graphically based on the lengths defined by the outer fiber as a dimensional reference and the unit strain.
3.6. Graph for Recommended Value Range for Minimum Bending Radius
It is also possible to use Equation (
11) to generate a series of values to create a table that helps understand the behavior of the outer radius
as the neutral fiber radius
increases or decreases, depending on the ductility required for deformation.
Table 2 shows the values of
and
and their final lengths for a 90° bend.
The last column of
Table 2, where
, was obtained from
, Equation (
5), and the equality of
from Equations (
7) and (
8).
From
Table 2, since the wire has a diameter of 1 mm and 0.5 mm radius, the smallest possible value would be 0.51 mm, considering 0.01 mm for the support of the bend.
Figure 12, generated from
Table 2, indicates the reference points for the recommended minimum radius of 40% and the theoretical minimum radius of 67%. These points indicate the appropriate range for executing the bend.
From
Figure 12, a bend with
less than approximately 1.2 mm requires a unit strain greater than the maximum obtained in the tensile tests of 67%. If this value is exceeded, there will likely be defects that weaken the cross-section, primarily with cracking in the outer region of the bend. Any plastic bend that does not exceed the theoretical minimum radius is considered acceptable. The objective of this research is to determine the smallest radius
that can be obtained without damaging the curvature section. The range defined in
Table 2 and
Figure 12 define the diameter of the pin required for a correct bend. A range is defined within which the standards for bending are met; variations in the material composition must be considered, and it is advisable to conduct preliminary tests on each batch of wire rolls to calibrate the bending tool.
4. Validation Through Finite Element Analysis
In this section, the necessary elements for the simulation are defined, starting with the auxiliary elements and the wire, followed by the positional relationships, and concluding with the loads, constraints, and additional conditions required for the simulation to yield deformation results based on the wire bending (see
Figure 13).
4.1. PRE-PROCESS: Definition of Auxiliary Elements in Wire-Bending Process
This section uses the design and simulation software SOLIDWORKS© to emulate the bending process. The aim is to verify that, with the bend of the radius proposed by the previously described analytical results, the stresses do not exceed the ultimate tensile stress, ensuring the piece’s quality.
The parts modeled in
Figure 14 and
Figure 15 are used for the analysis.
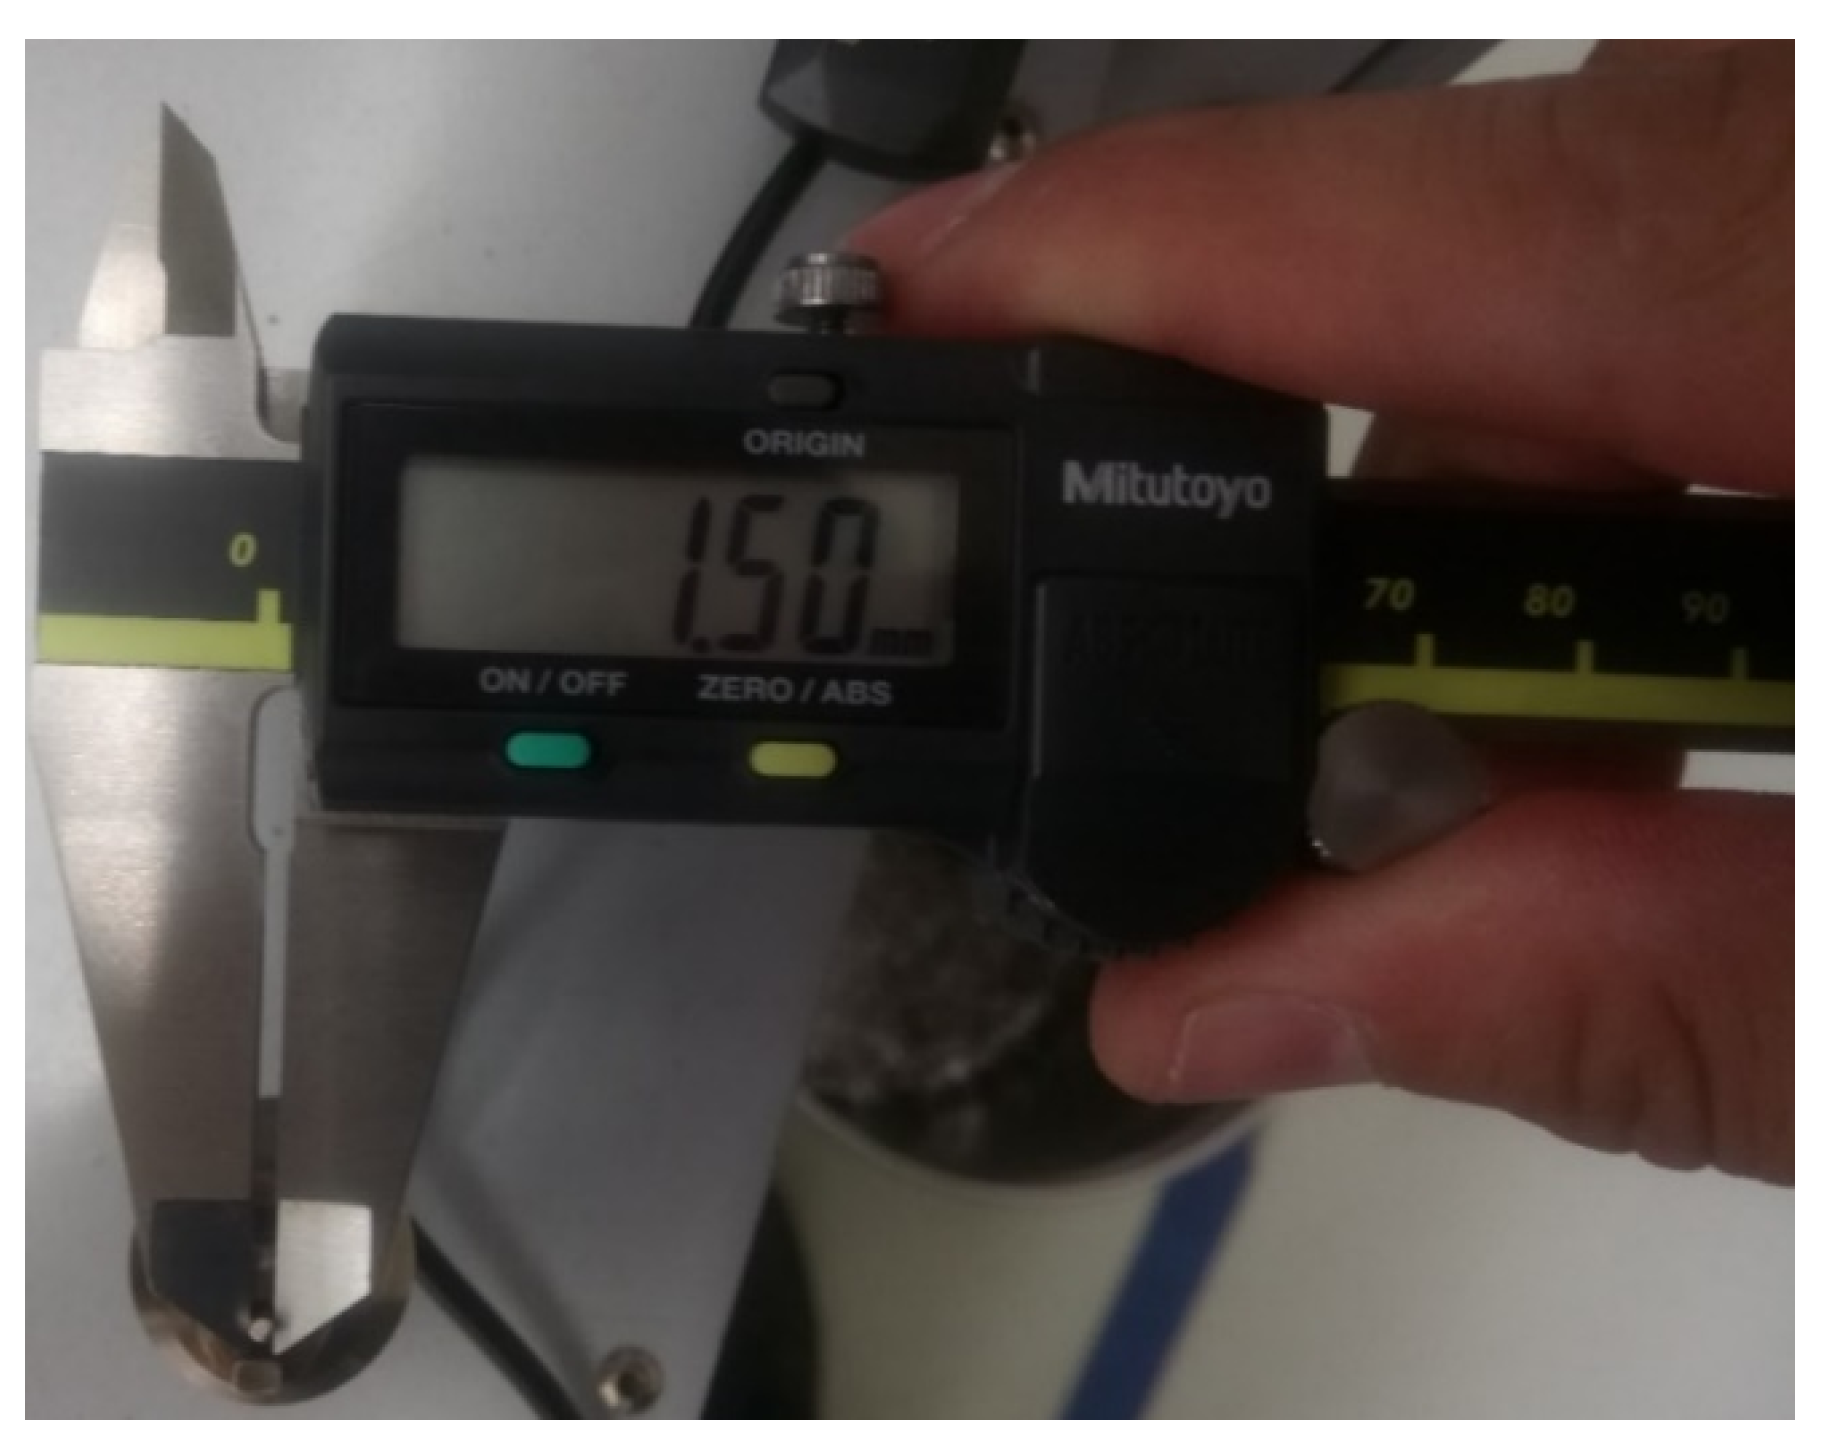
Figure 14 defines the wire, which consists of a cylinder with a diameter of 1 mm and a length of 200 mm, made of AISI304 material. It also includes the part Roll 1-75, which serves as support for bending based on the recommended minimum radius; the deepest part of the groove has a diameter of 1.5 mm; this value was established under the range defined by the criterion of the minimum bending radius.Thus, a radius of 0.75 mm is added to the diameter of the wire (1 mm), resulting in
being 1.75 mm.
To establish the FEA model and conduct the simulation, a bilinear elastoplastic model was employed using a free mesh approach. The nonlinear material behavior was customized to reflect the mechanical properties of SUS304 steel.
In
Figure 15, from left to right, the Wheel, the Frame, and the Stand are defined. The Wheel applies the bending force on the wire to produce the bend; it does not have specific design requirements, but a groove with a radius of 0.5 mm has been added to prevent any deviation during bending. Like the Wheel and some auxiliary pieces, for the Roll 1-75 piece, the material used in the bending process is omitted for analysis to reduce the resolution time in the simulation. The Frame serves as a lever arm for the Roll 1-75 and the Wheel, allowing for bending movement. The Stand acts as the base for determining the positions of the other elements.
4.2. PRE-PROCESS: Assembly and Analysis Method
The previously described pieces were assembled to develop the simulation in order to determine the unit strains during bending according to finite element analysis (see
Figure 16). The bending was executed by rotation, using the concentric hole of the Stand and Roll 1-75 as the axis.
4.3. PRE-PROCESS: Positional Relationship
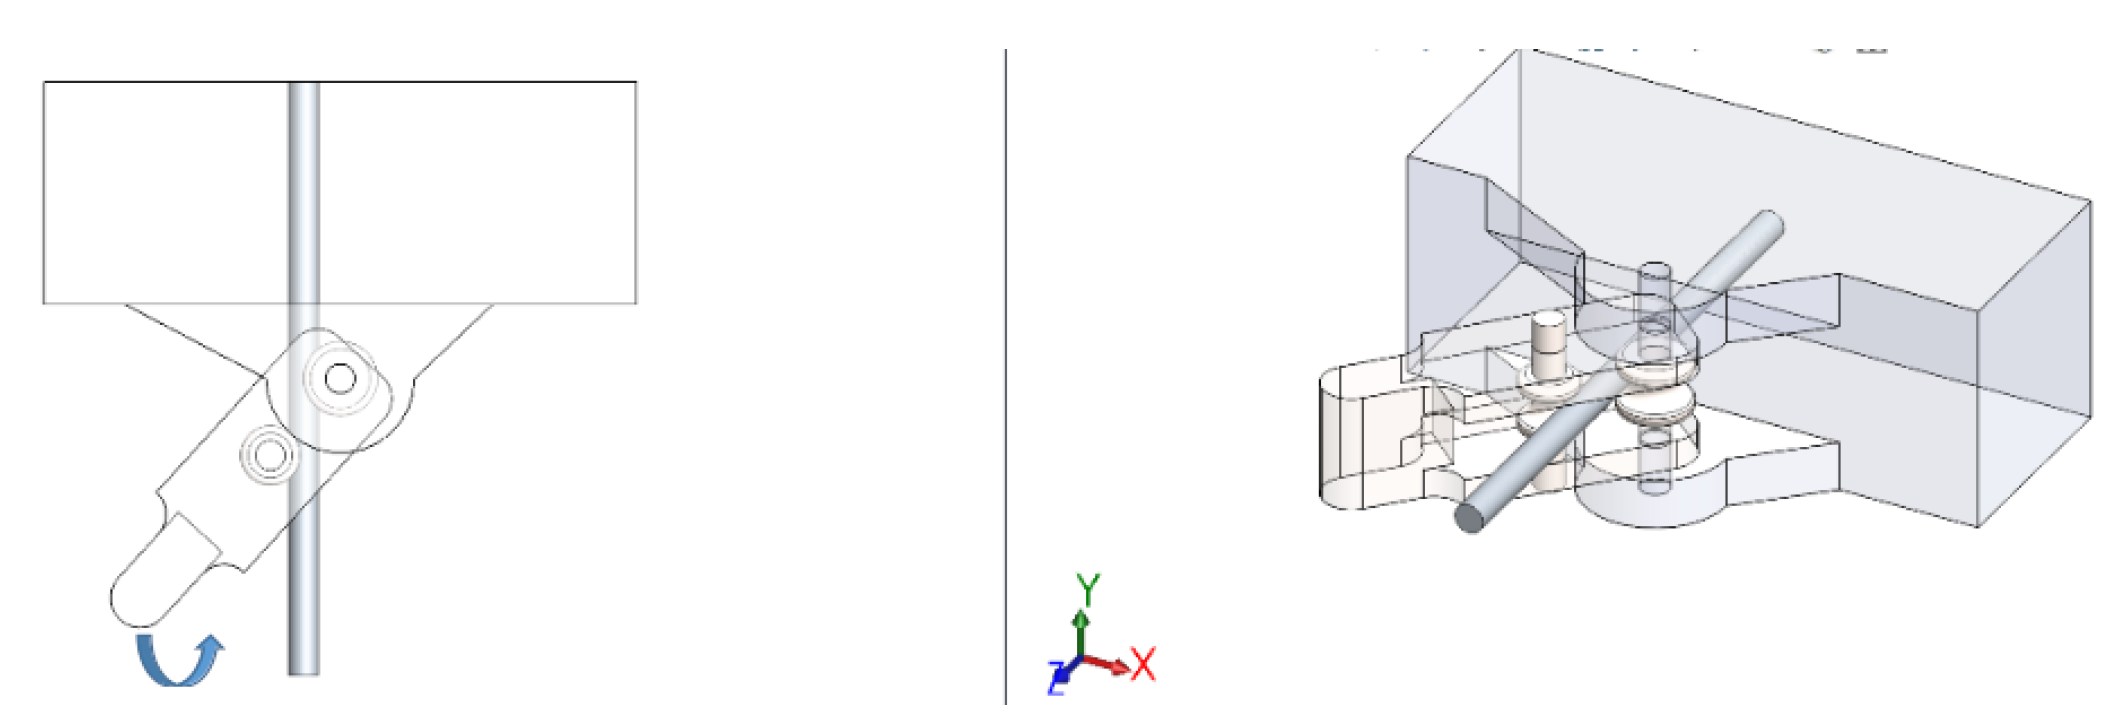
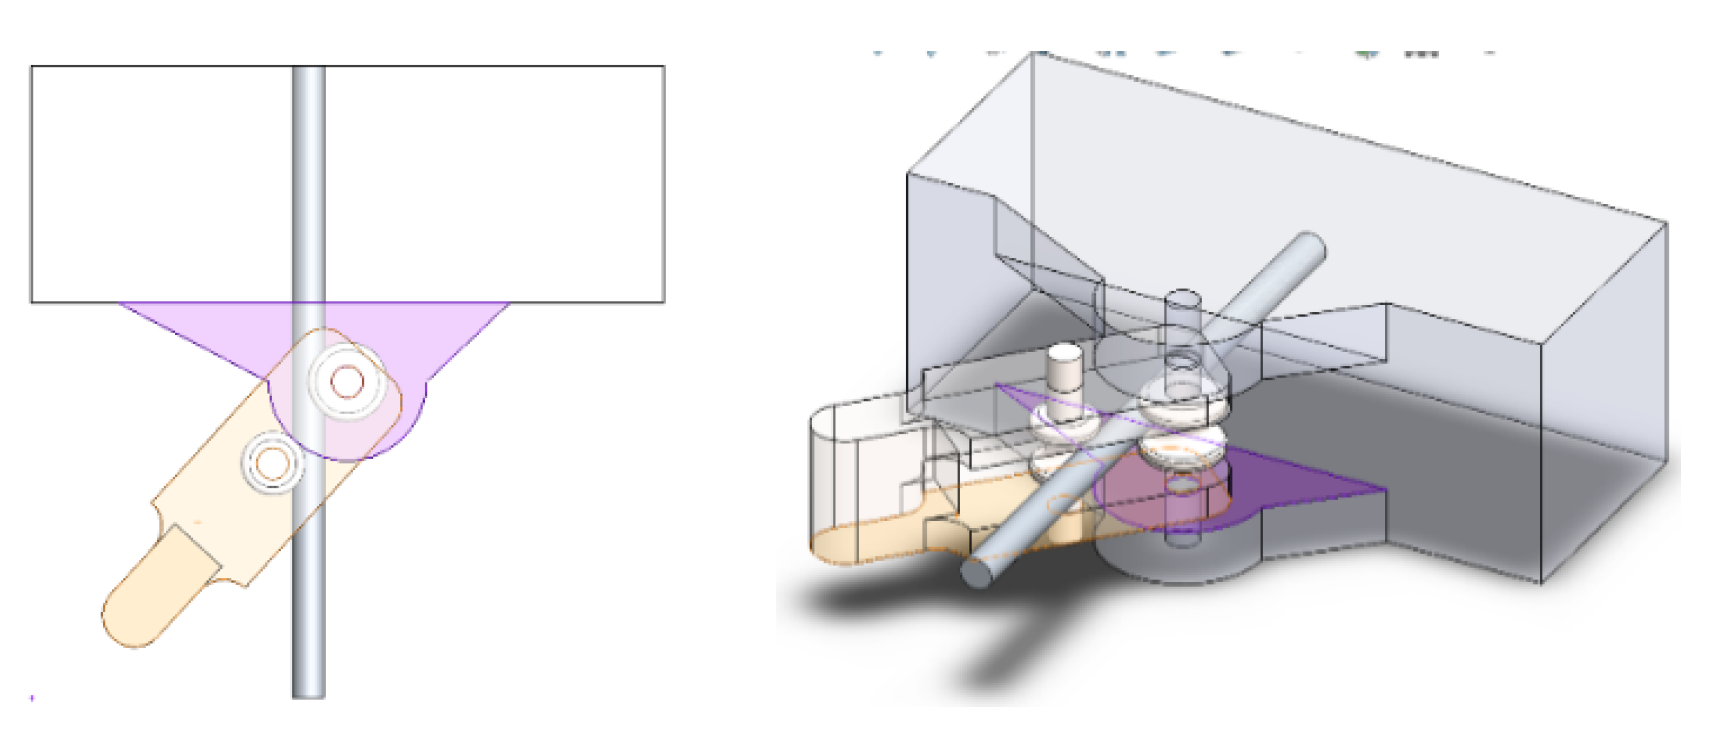
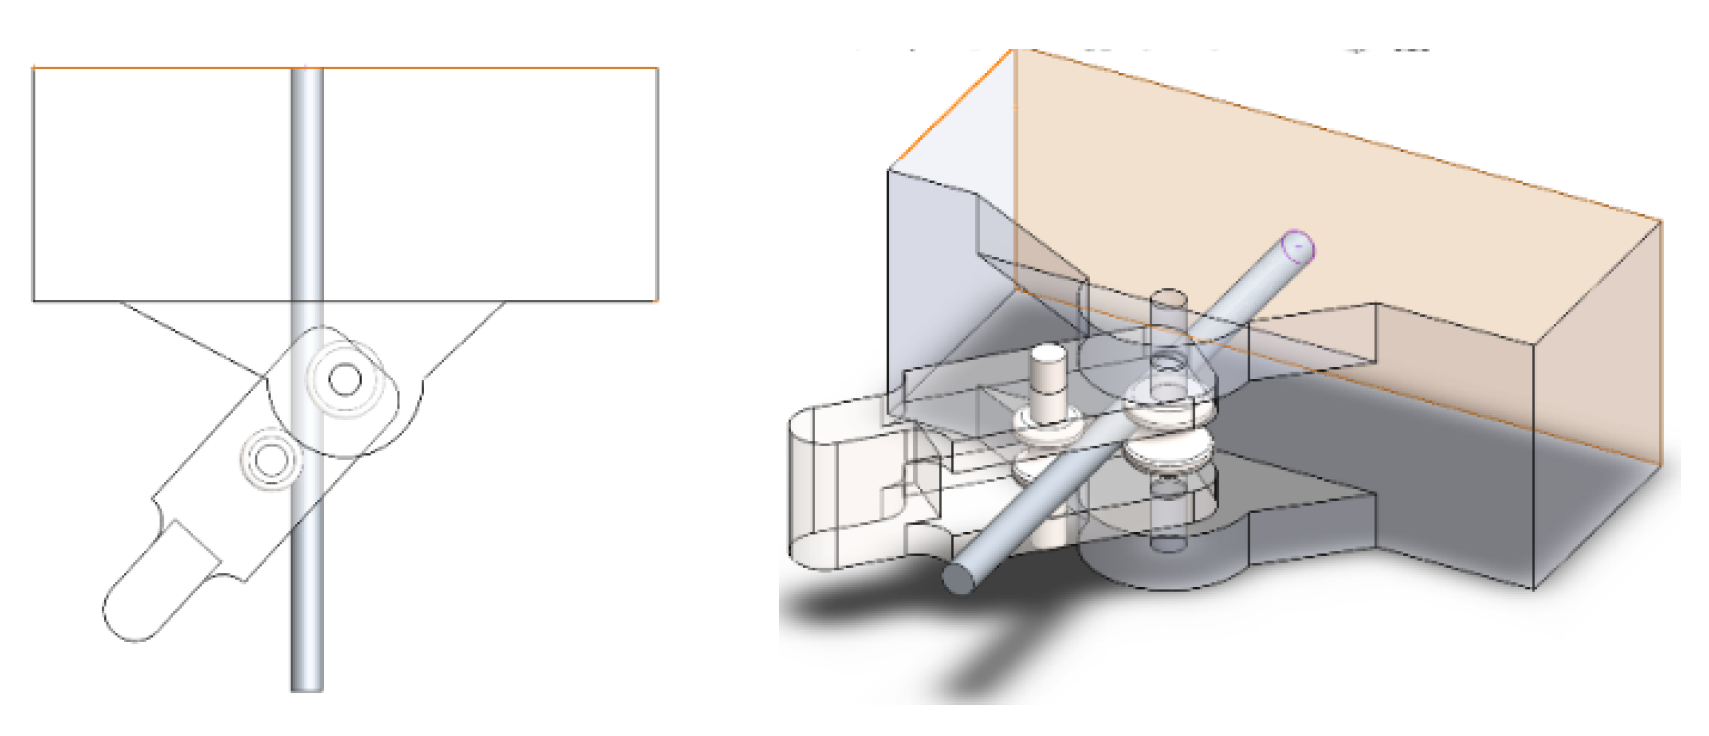
The basic geometric relationships are used to locate the components in the workspace and, in this case, also to restrict the lines of action. Positional relationships are also important for executing the bend. In
Figure 17, the relationship between the Stand (purple) and Frame (orange) is represented, which concentrically defines the axis of rotation. The wire should not rotate or slide with the rest of the assembly when applying the force for bending.
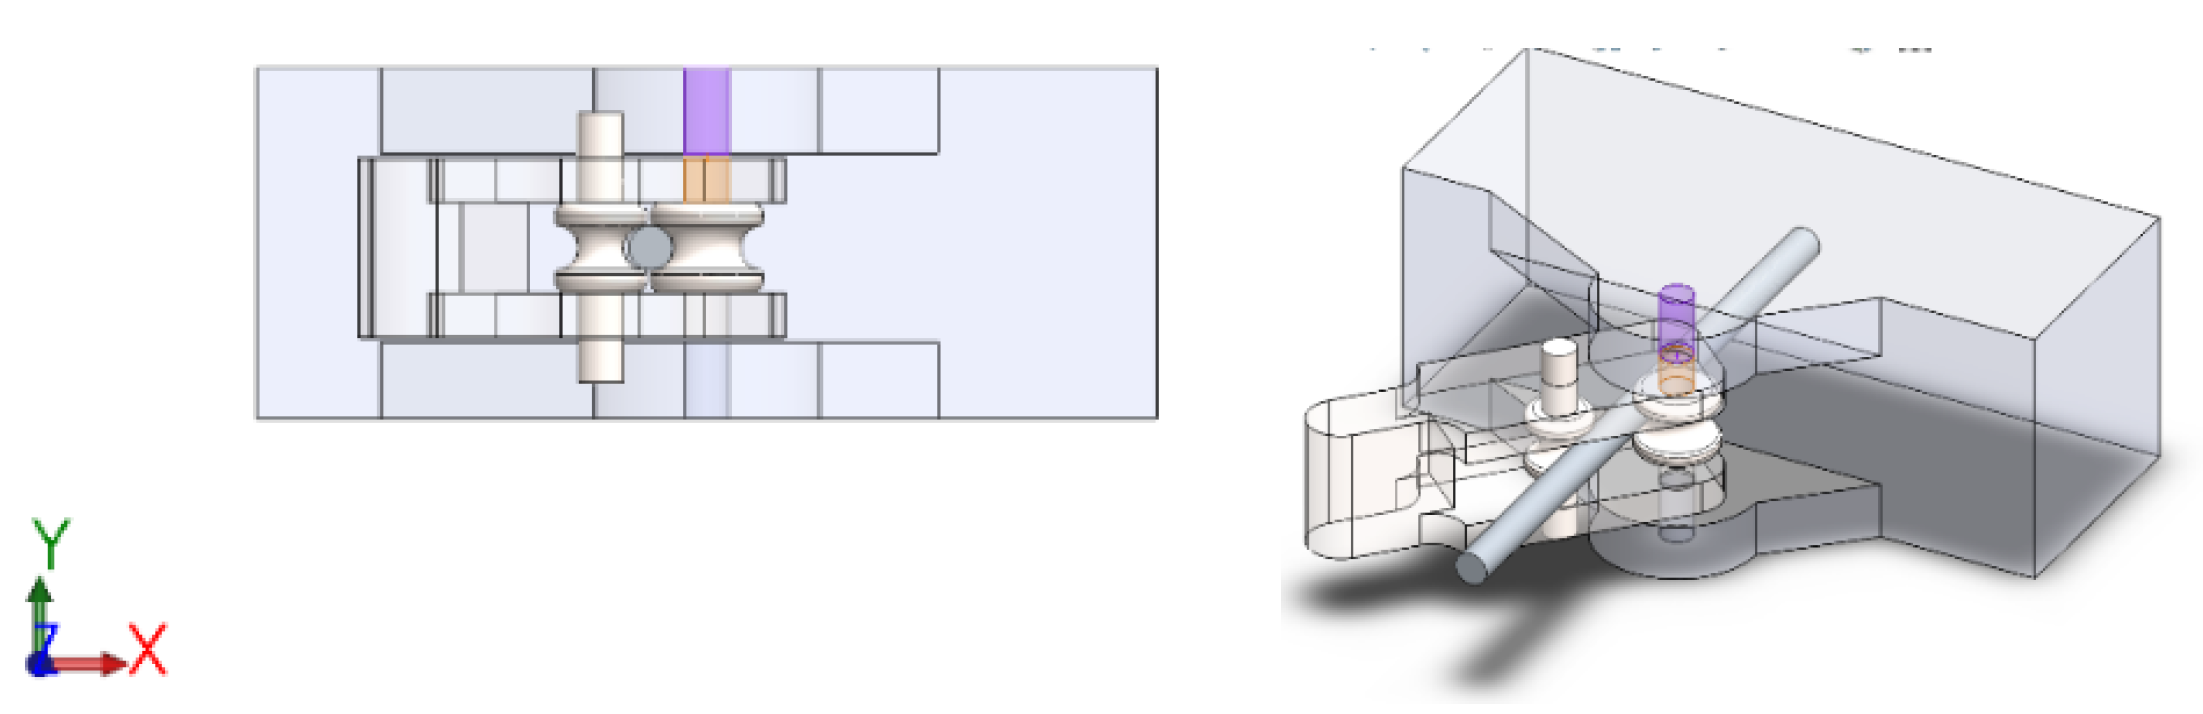
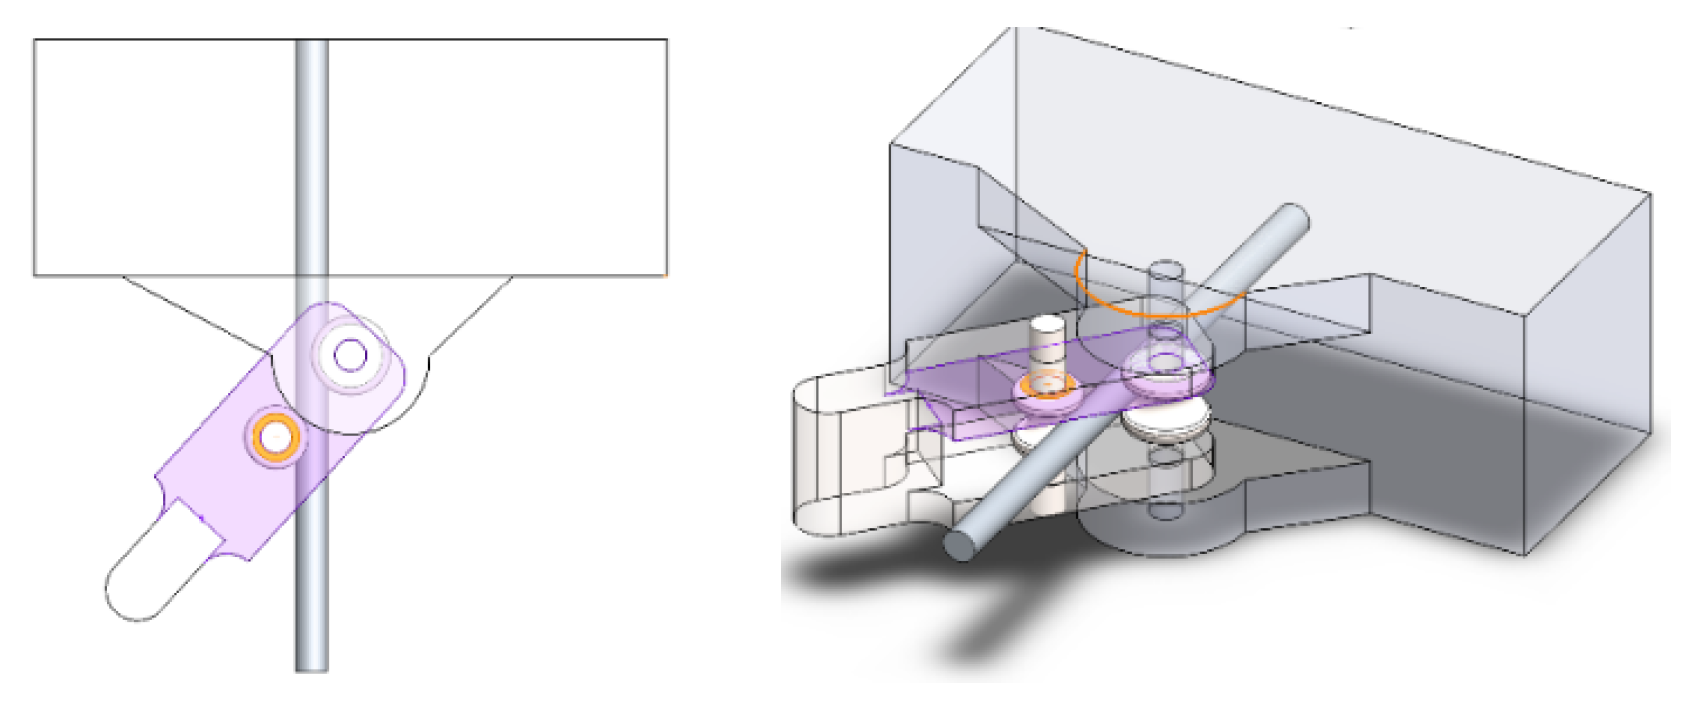
The distance relationship shown in
Figure 18 acts between the Stand (purple) and Frame (orange) pieces, defining that their faces are parallel with a separation distance of 0.1 mm between them to avoid friction.
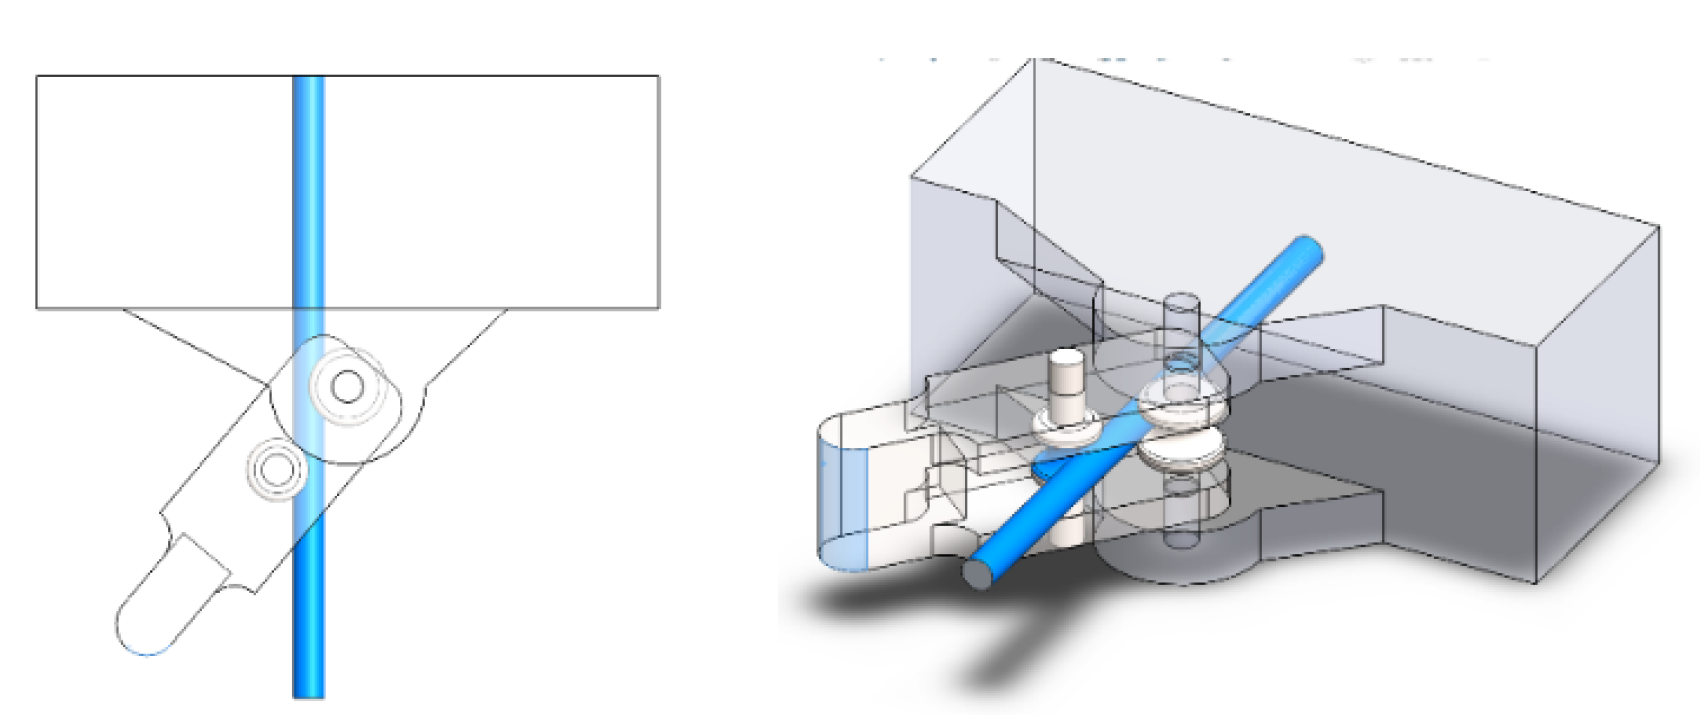
The coinciding relationship in
Figure 19 between the Wire (gray) and the Stand or wall (orange) defines a fixed point to prevent the wire from slipping during bending.
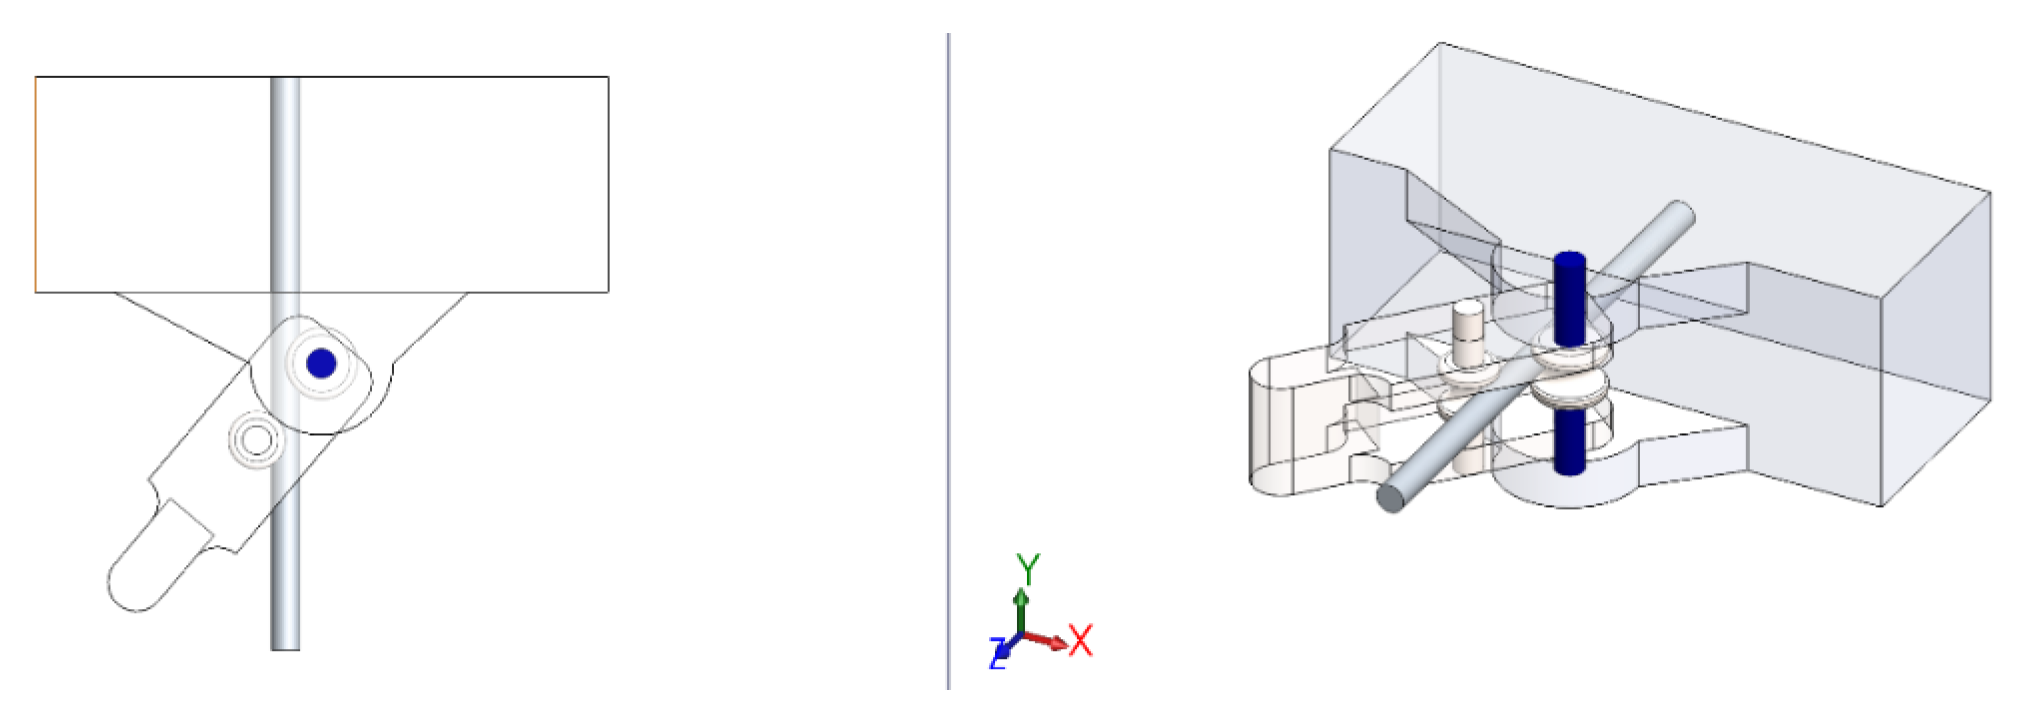
The coinciding relationship between the Frame (purple) and the Wheel (orange) in
Figure 20 aligns the slot axis of the Wheel piece with the Wire axis to ensure that the rotational movement is perpendicular.
4.4. PROCESS: Restrictions, Loads, and Additional Conditions
Once the necessary relationships have been established, the assembly must be positioned in the contact position between the Wheel component and the Wire component through manual dragging until a collision occurs without penetration, as shown in
Figure 21.
A nonlinear dynamic analysis is employed in SolidWorks, establishing the following primary relationships:
Define the fixed part that will serve as support for the wire.
Define the force that will be applied by the lever arm.
Define the contact at the rotation hinge.
Define the contact between the wire and the guide slots during bending.
4.5. PROCESS: Definition of Fixations and Restrictions
Figure 22 shows the selection of the fixed part that will serve as support. This prevents misalignment of the pieces or displacement during the application of force for bending.
4.6. PROCESS: Definition of Forces
For the application of the distributed force (
Figure 23), the rounded and flat surface of the frame component is considered, which allows the force to remain perpendicular to the plane of action at all times.
The value of the force will determine how much the Wire is deformed. For practical purposes, this is not a reference, as the actual process has variables that are not accounted for in this study, where a series of iterations in the simulation were used to find the appropriate value of 400 N. When setting the start boundary conditions, this value of 400 N represents an equivalent reaction force necessary to reach the required deformation level. In the real process, the applied force is calibrated so that the piece performing the bending of the wire produces the required angle through trial and error, based on the properties of each batch of material. Although these batches meet standard specifications, their properties can sometimes vary from one batch to another, as previously mentioned.
Substituting values in Equation (
1).
Where this value of the bending stress of 325.9 MPa is less than the ultimate tensile stress of SUS304 steel indicated in
Table 1 of 842.35 MPa. This means that the material does not reach its breaking point, only a plastic deformation exceeding the yield stress value of 288 MPa.
4.7. PROCESS: Definition of Special Connections
It is necessary to define pin connections at the joints between components to prevent the inclusion of stress results in these sections during simulation.
Figure 24 shows this type of connection with contact at the hinge area to facilitate the rotation of the components during bending.
4.8. PROCESS: Definition of Special Contacts
Relevant contacts will be assigned between the parts that directly participate in the bending during the simulation, namely, the Wire, Roll 1-75, and Wheel. These components must have non-penetrating contact so that the solid wire can be deformed. To define them, the external surface of the wire and the guide slots found on each of the wheels performing the bending are used as reference.
Figure 25 shows these surfaces highlighted in blue and purple. By defining non-penetrating contact, the force will be transmitted correctly from one component to another.
This is the final special restriction for the simulation; we can now proceed to create the mesh as well as the solution.
4.9. POST-PROCESS: Results of Simulation Analysis
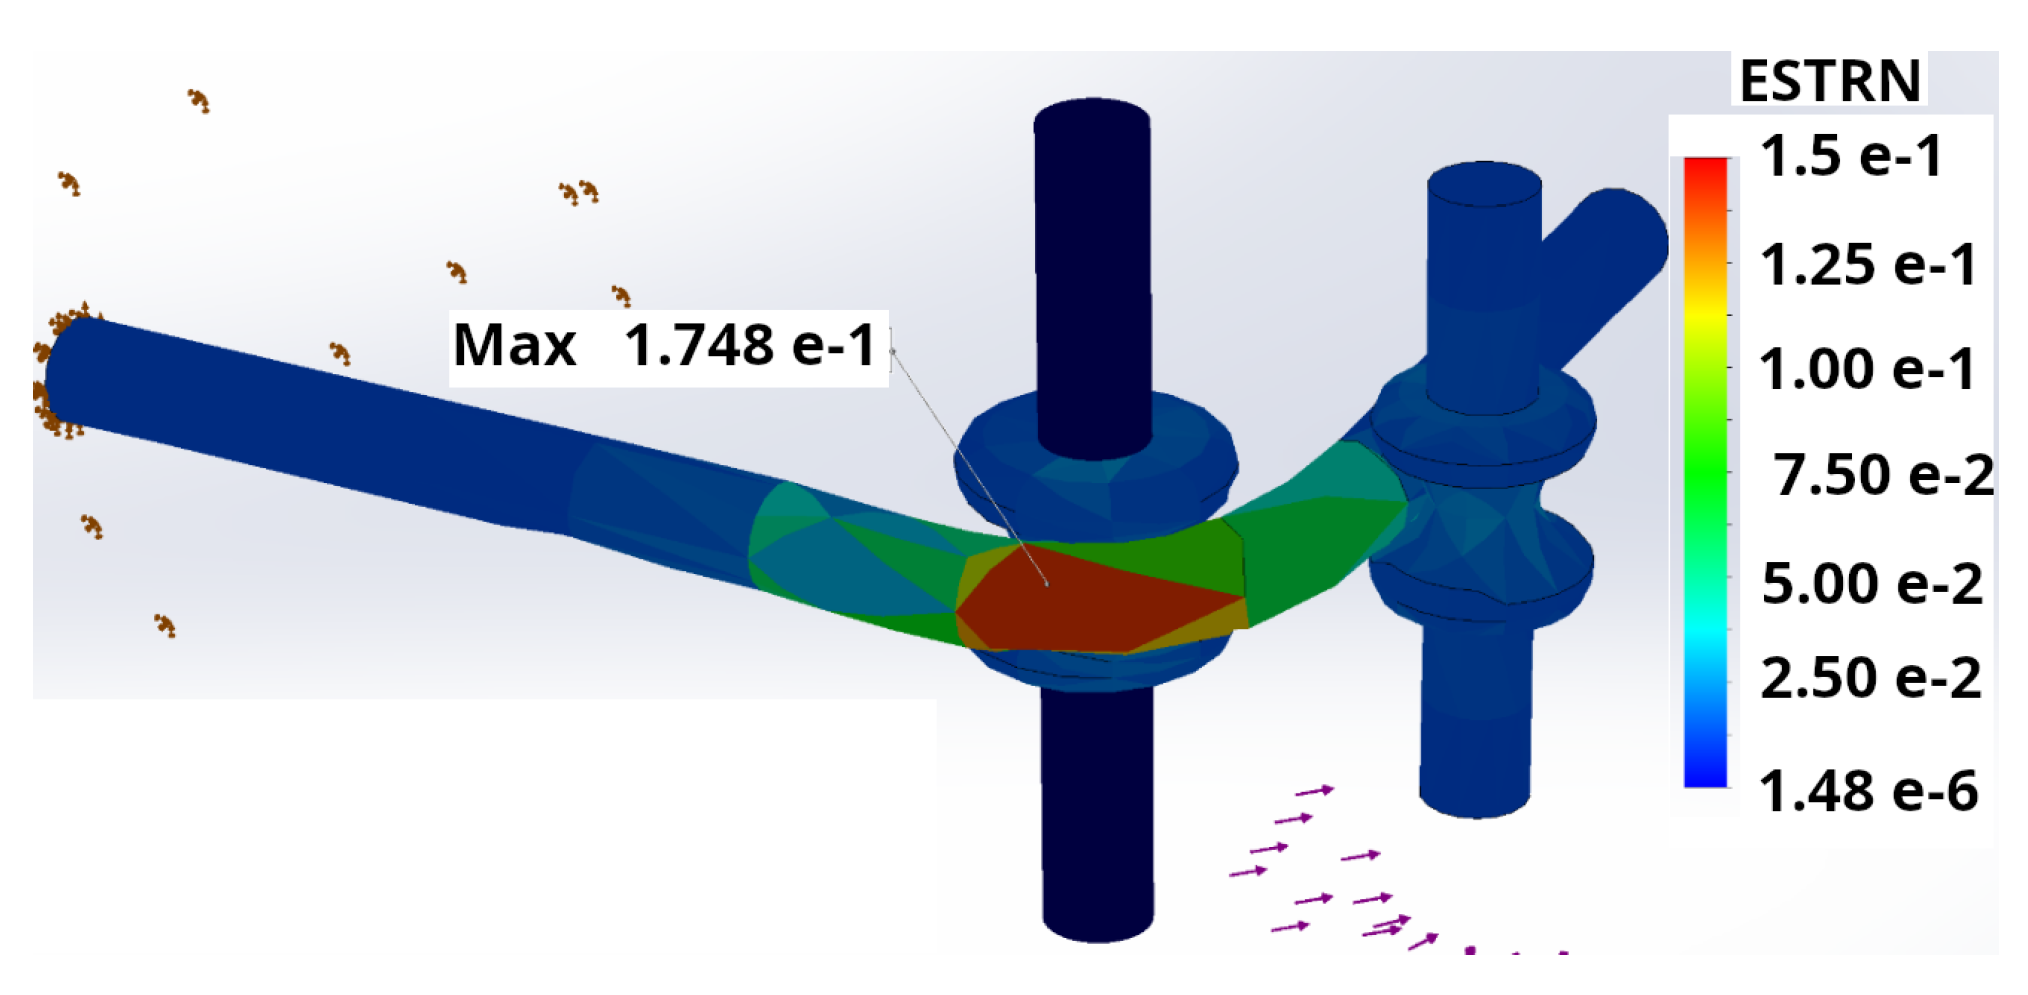
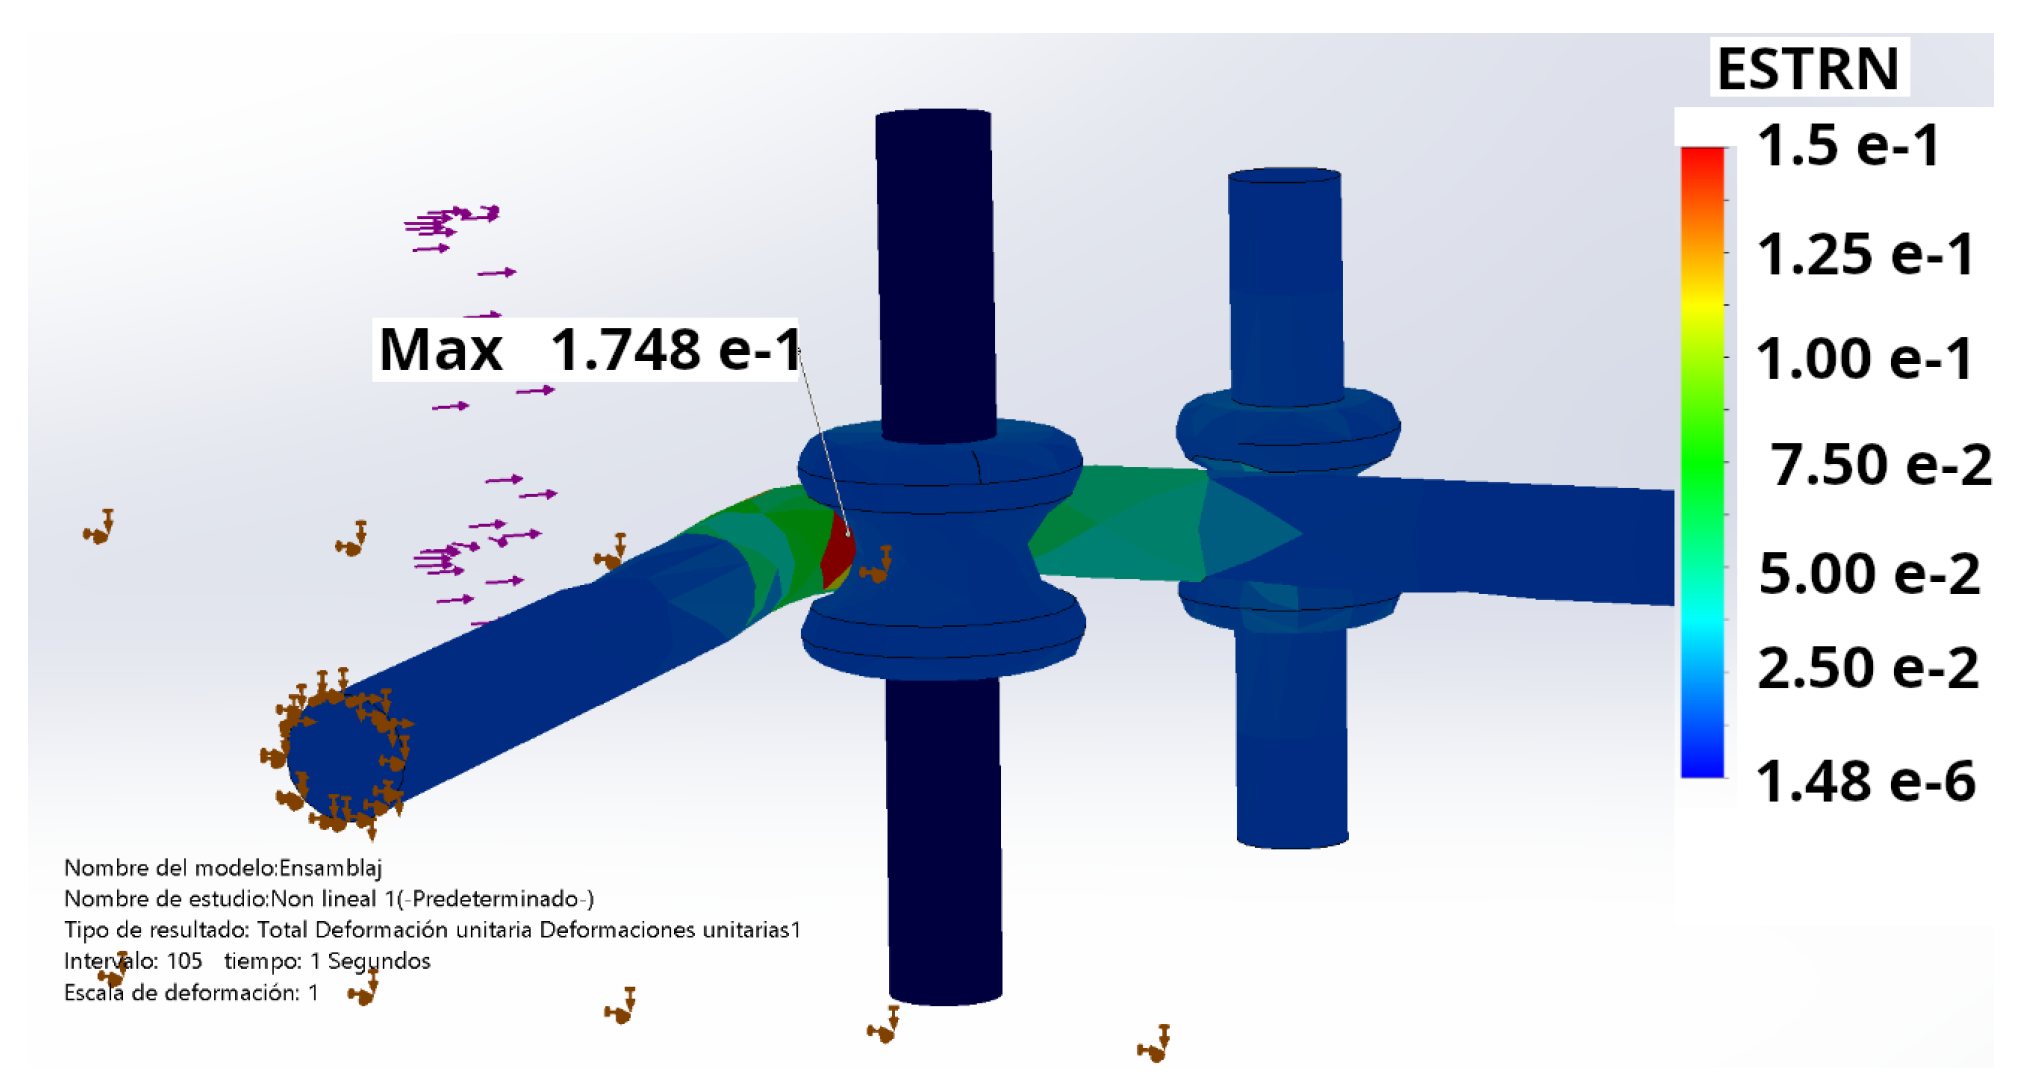
The process was carried out by bending the body of the “Wire”. A nonlinear dynamic simulation analysis was used to account for the plastic deformations and displacements involved in a 90° bend. The result of the bending simulation in SolidWorks® is shown in
Figure 26 for the case of unit strains.
The highest deformations are located in the outer and inner fibers at the bend. For this analysis based on
, a maximum elongation of 17% is shown relative to its original length. A deformation of 40% was assumed in the formulation of the recommended minimum radius.
Figure 27 shows the same study, but it highlights the stress in the inner fibers of the bend.
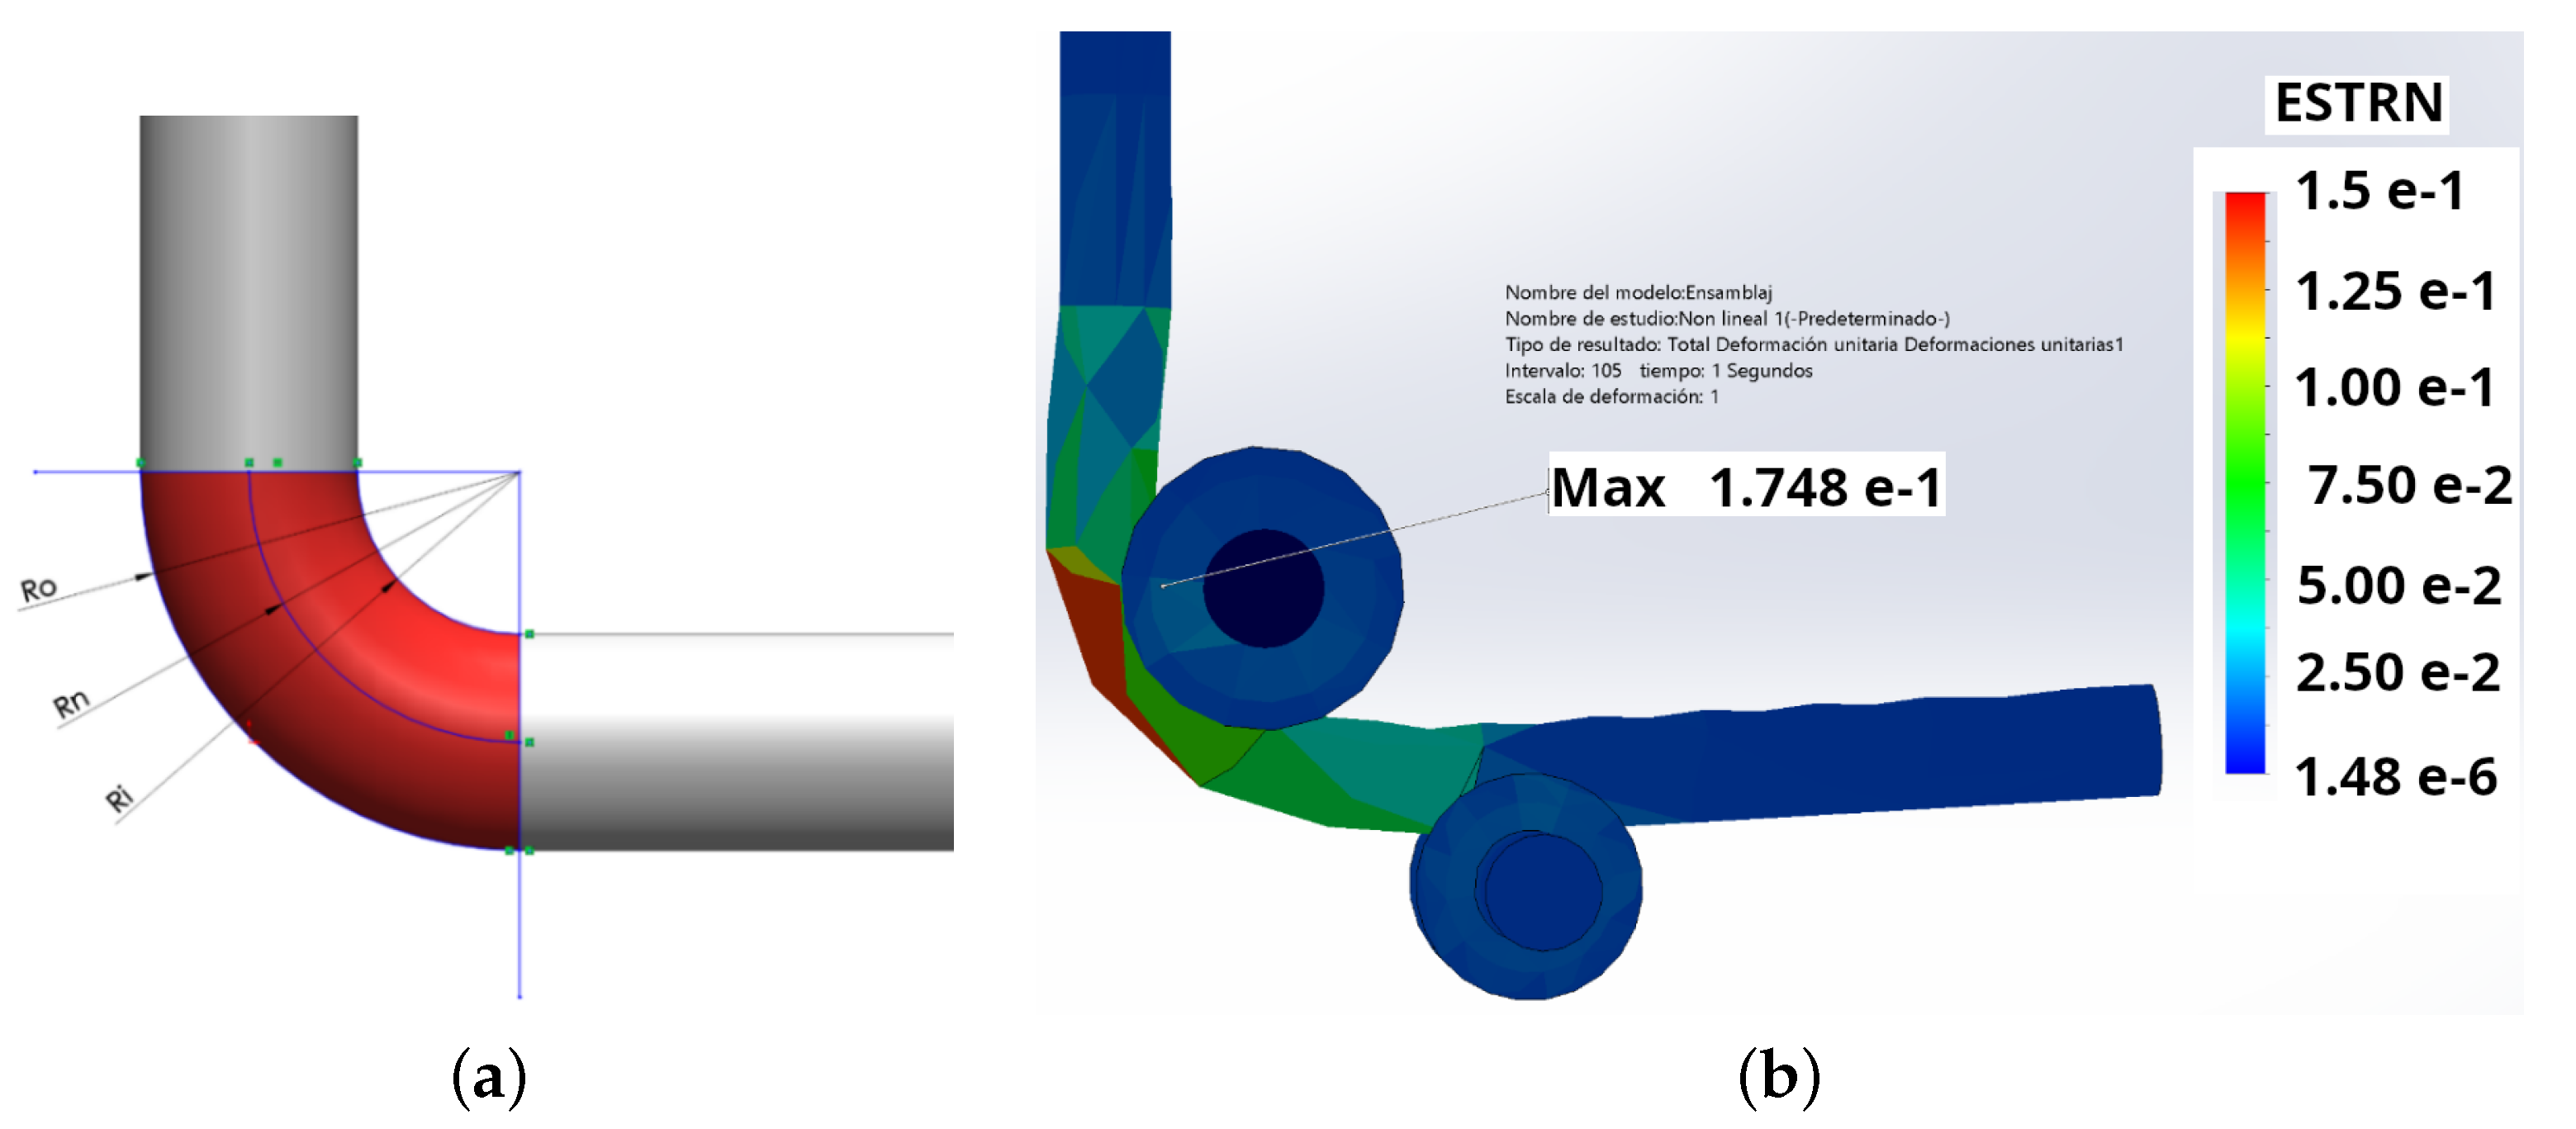
The simulation has remained consistent with the Euler–Bernoulli theory and has validated the assumptions; however, to explain why the behavior was different from what was expected, there are additional considerations that the simulator takes into account. The main difference is understood as follows.
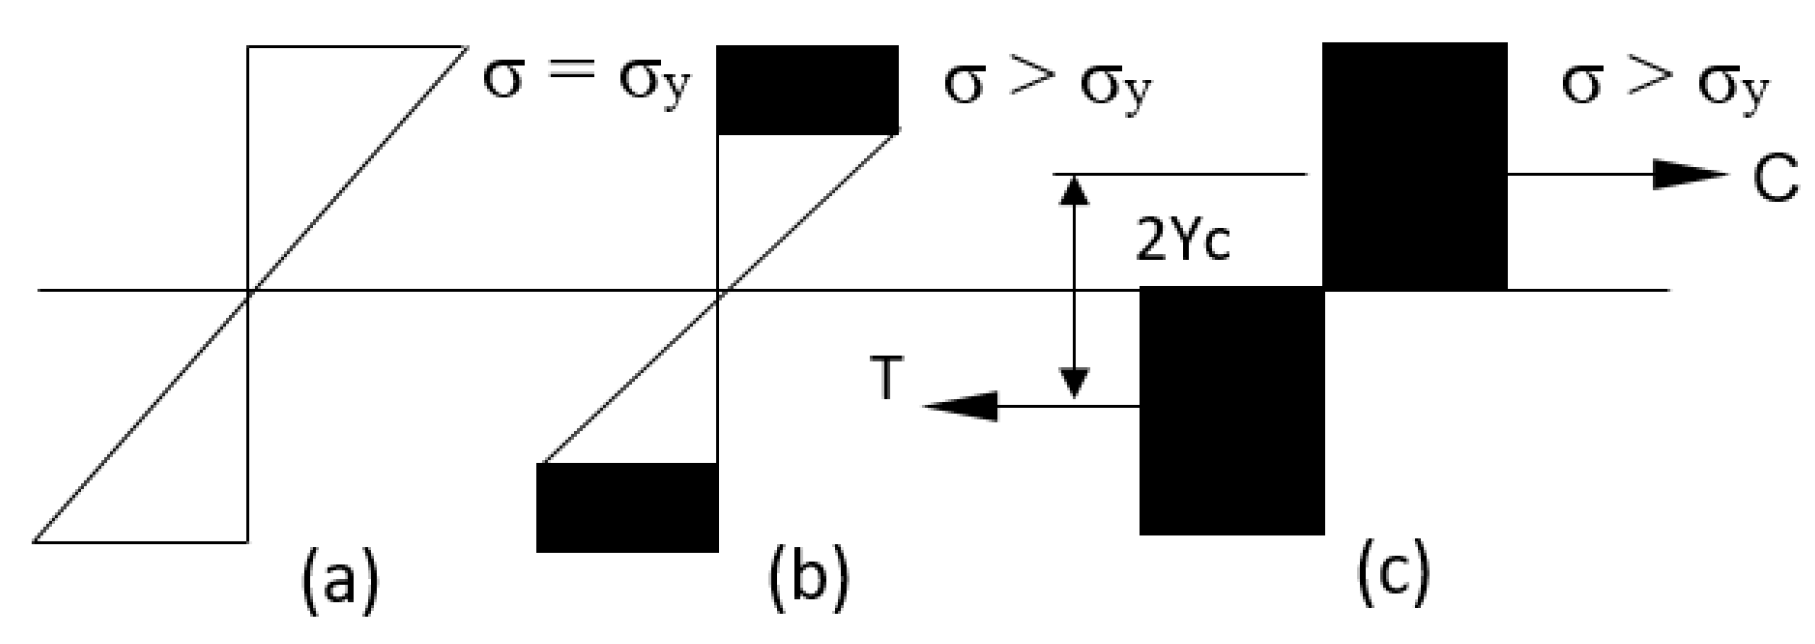
The simulator resolves by considering the change in the geometry of the part. As the deformations change at the mesh nodes, the stresses are distributed throughout the material. This can be better understood by considering Hooke’s law, which states: “The unit elongation experienced by an elastic material is directly proportional to the force applied to it”. Therefore, as the stresses are distributed by the solver, the deformations are also distributed along a larger fiber
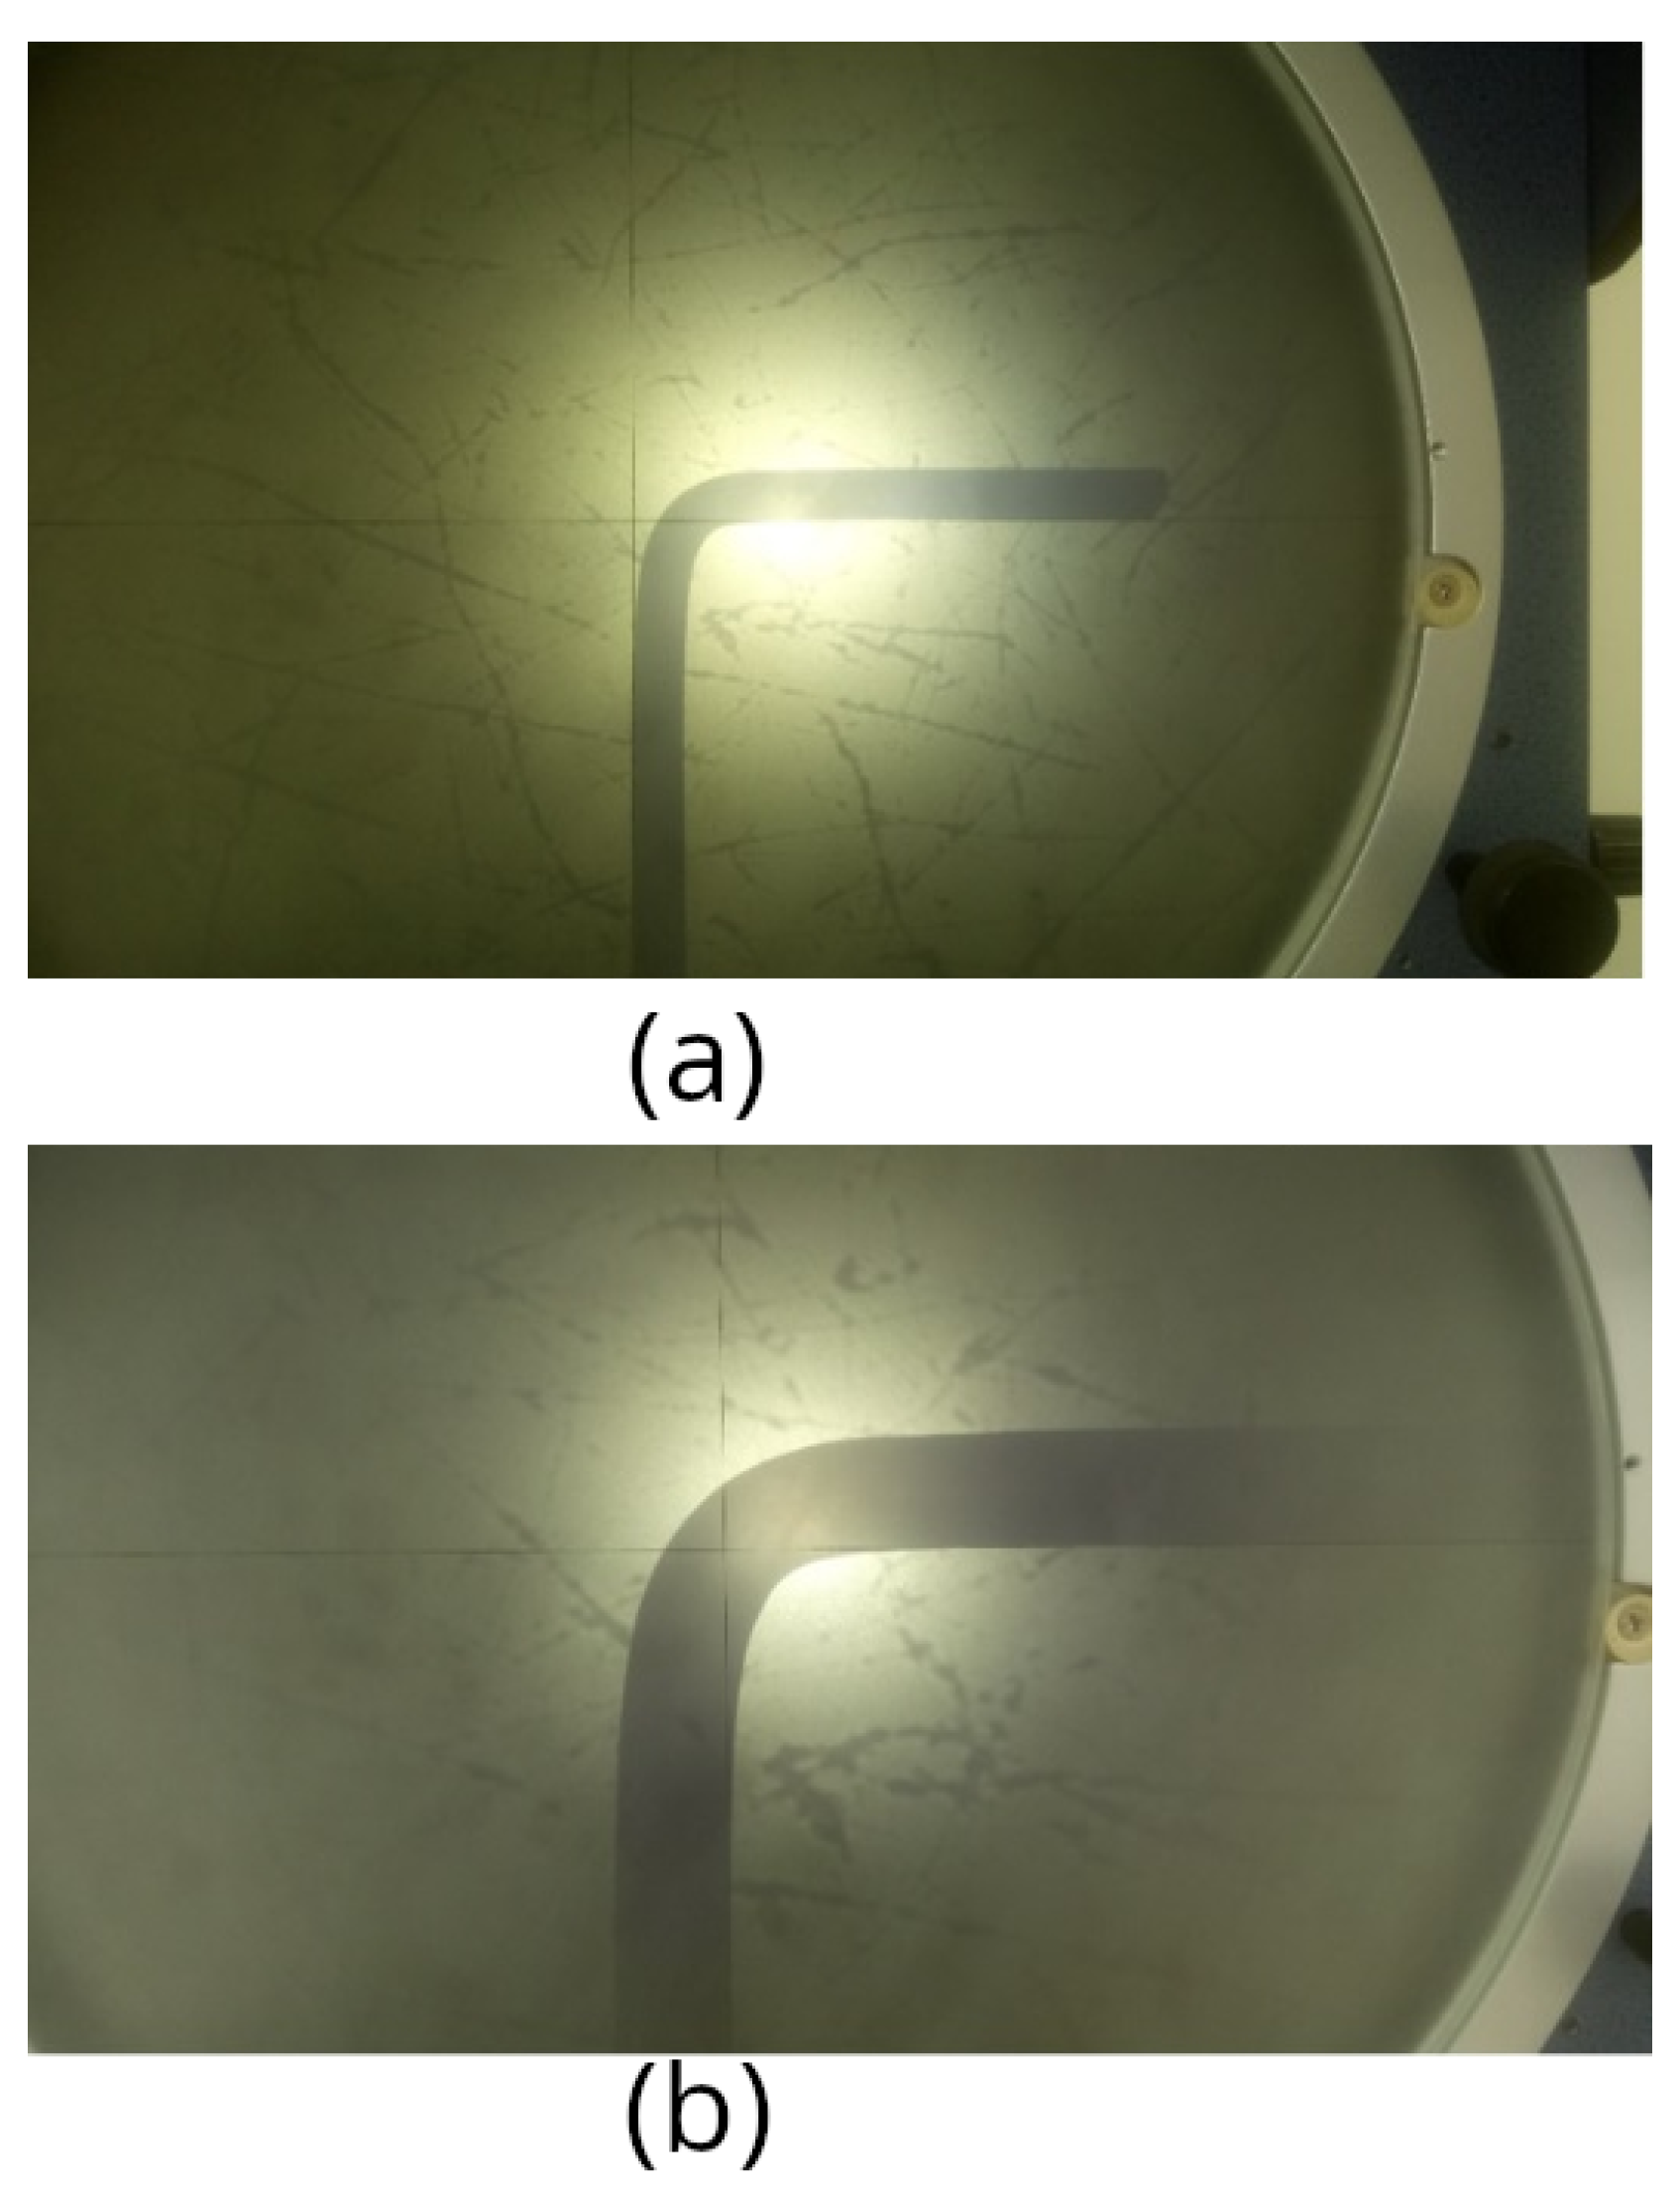
, which does not only encompass the perimeter of the radius at the theoretical corner as would be assumed by the Euler–Bernoulli beam-bending theory (see
Figure 28a), but extends further by gradually distributing the stresses and deformations. While the Euler–Bernoulli theory models reality quite acceptably, there are factors that software can extend to achieve an even greater abstraction.
From the computer simulation, the unit strain is less than calculated because the stress has been proportionally distributed along a fiber
that extends beyond the 90° considered in the bend, as seen in
Figure 28b, where it can be visually perceived that the ends of the wire are not perpendicular to each other, as assumed in theory.
Figure 29 presents the simulated von Mises stress distributions during the bending process. The strain field was prioritized for optimization as it directly correlates with the formability and geometric accuracy of the bent wire. The von Mises stress was computed, and its values remained within safe limits (between yield strength, 288 MPa, and ultimate tensile stress value, 842.35 MPa).
The results of the simulation present a scenario with behavior that is beneficial for the purpose of this application. This means that, because the stress has been distributed over a longer fiber , it is possible to perform the bend with an even smaller radius , while ensuring that stricture will not occur.
6. Conclusions
This study analyzed the straight-bending process of SUS304 stainless steel wire, a material commonly employed in manufacturing torsion springs. Through mathematical modeling, a clear and safe operational range was defined for the minimum bending radius, establishing a quantitatively recommended radius of 1.73 mm and a theoretical minimum of 1.25 mm for a 1 mm diameter wire. As validation, both experiment and simulation confirmed these findings, where simulation defined the maximum plastic strain values of 17.48%, significantly below the theoretical critical deformation limit of 40%, thus ensuring structural integrity.
The primary contribution of this research, compared to previous studies, lies in accurately identifying and quantifying the phenomenon of gradual stress and strain redistribution during the bending process. While earlier works generally assumed simplified linear stress distributions, this investigation demonstrated, both experimentally and numerically, that strain distributes over a broader region, allowing smaller bending radii without compromising material quality.
Nevertheless, some limitations were identified, particularly regarding the inherent variability in SUS304 steel’s mechanical properties due to slight differences in chemical composition and prior processing between production batches. Such variability could partially affect the precise repeatability of the recommended minimum radius. Consequently, future studies should conduct a more detailed sensitivity analysis to account for these variations.
To establish the FEA model and conduct the simulation, a bilinear elastoplastic material model was used in combination with a free mesh approach. As future work, it is recommended to refine the mesh in the region of critical deformation. According to the software used in this study, such mesh refinement can be achieved by subdividing the model into smaller volumes near the bending region.
From an industrial perspective, the results have immediate practical applications in sectors such as the automotive industry, appliance manufacturing, and machinery, where dimensional precision and fatigue resistance in wire components and springs are critical. Implementing these criteria will reduce the operational costs associated with rejections due to bending defects and significantly improve the durability and functional reliability of the manufactured components.


 ,
, 


