Article

Resistance Analysis of a Plastic Container Obtained with Additive Manufacturing Using Finite Elements

by
Luis M. López-López
1,*,
Geovanny Maldonado
1,
Cesar Paltán-Zhingre
1,†,
Jimmy Brito
1,†,
Julio Loja-Quezada
2 and
Marco Amaya-Pinos
2
1
Grupo de Investigación en Nuevos Materiales y Procesos de Transformación GIMAT, Universidad Politécnica Salesiana, Cuenca 010150, Ecuador
2
Grupo de Investigación y Desarrollo en Simulación, Optimización y Toma de Decisiones GID-STD, Universidad Politécnica Salesiana, Loja 110103, Ecuador
*
Author to whom correspondence should be addressed.
These authors contributed equally to this work.
J. Manuf. Mater. Process. 2025, 9(6), 204; https://doi.org/10.3390/jmmp9060204
Submission received: 4 April 2025 / Revised: 5 June 2025 / Accepted: 9 June 2025 / Published: 18 June 2025

Abstract

Traditional manufacturing processes yield plastic containers in large batches, even for minimal production runs, resulting in elevated production costs. Three-dimensional printing has emerged as a viable alternative for very low production volumes, offering properties comparable to traditional methods at significantly reduced costs. To assess the tensile strength, specimens printed with identical geometric parameters to the 3D-printed containers were tested according to ASTM D638 standards, enabling the determination of the stress–strain curve behavior. A compression test was conducted on containers obtained from both manufacturing processes to establish their respective resistance and deformation characteristics. The results revealed a 67% difference in resistance, indicating greater rigidity in the 3D-printed container, and a higher deformation in the blow-molded container, reaching up to 4 mm in height without fracture. Similarly, impact resistance was analyzed using finite element analysis with Ls-Dyna software, showing deformation differences of 0.91% and stress differences of 2.15%. Therefore, 3D printing presents itself as a compelling alternative for the fabrication of plastic containers in small production runs.

1. Introduction

The mechanical resistance of plastic containers is directly related to the manufacturing process employed and the type of polymer used in their fabrication [1,2]. For industries, the fixed production costs of injection molding and blow molding correlate directly with the number of containers produced, decreasing as the production volume increases and enhancing profits [1,3,4,5]. Additive manufacturing, or 3D printing, presents itself as an alternative process for obtaining containers in very low production volumes, which can be applied in maintenance for the replacement of certain specific elements, offering resistance properties comparable to those achieved through traditional methods, but at more affordable costs by not requiring blow molds [6,7,8]. Three-dimensional printing, based on fused filament fabrication (FFF), continues to generate significant interest worldwide due to its ease of developing structures from computational designs of all kinds, opening up its own technical fields and generating countless applications, including the creation of physical models tailored to product functionality and consumer needs [9,10,11]. For the 3D printing process, understanding the physical and chemical properties and characteristics of the material to be used is essential. Each material has specific conditions based on the application and required mechanical properties [12,13,14,15]. Therefore, this research develops a comparative analysis of the compressive and tensile mechanical properties using destructive testing, as well as impact properties through simulation, between a container obtained by a traditional blow molding process and one obtained by 3D printing. Compression tests were performed according to ISO 604 standards [16], and tensile tests according toASTM D638 standards [17].
Analysis through simulation using the finite element method (FEM) allows for the prediction of various physical aspects of an element or system subjected to specific conditions expressed in a mathematical equation that models the behavior. For instance, studies conducted by Almonti [18] successfully determined the thermal properties of a metal matrix composite coated via copper and graphene electrodeposition using the finite element method. Similarly, Majko [19] performed a simulation optimizing the shape of a specimen with an appropriate fiber arrangement to achieve greater resistance. Within this context, the present research conducted an evaluation of the impact resistance of containers obtained through 3D printing and blow molding using the finite element method (FEM).

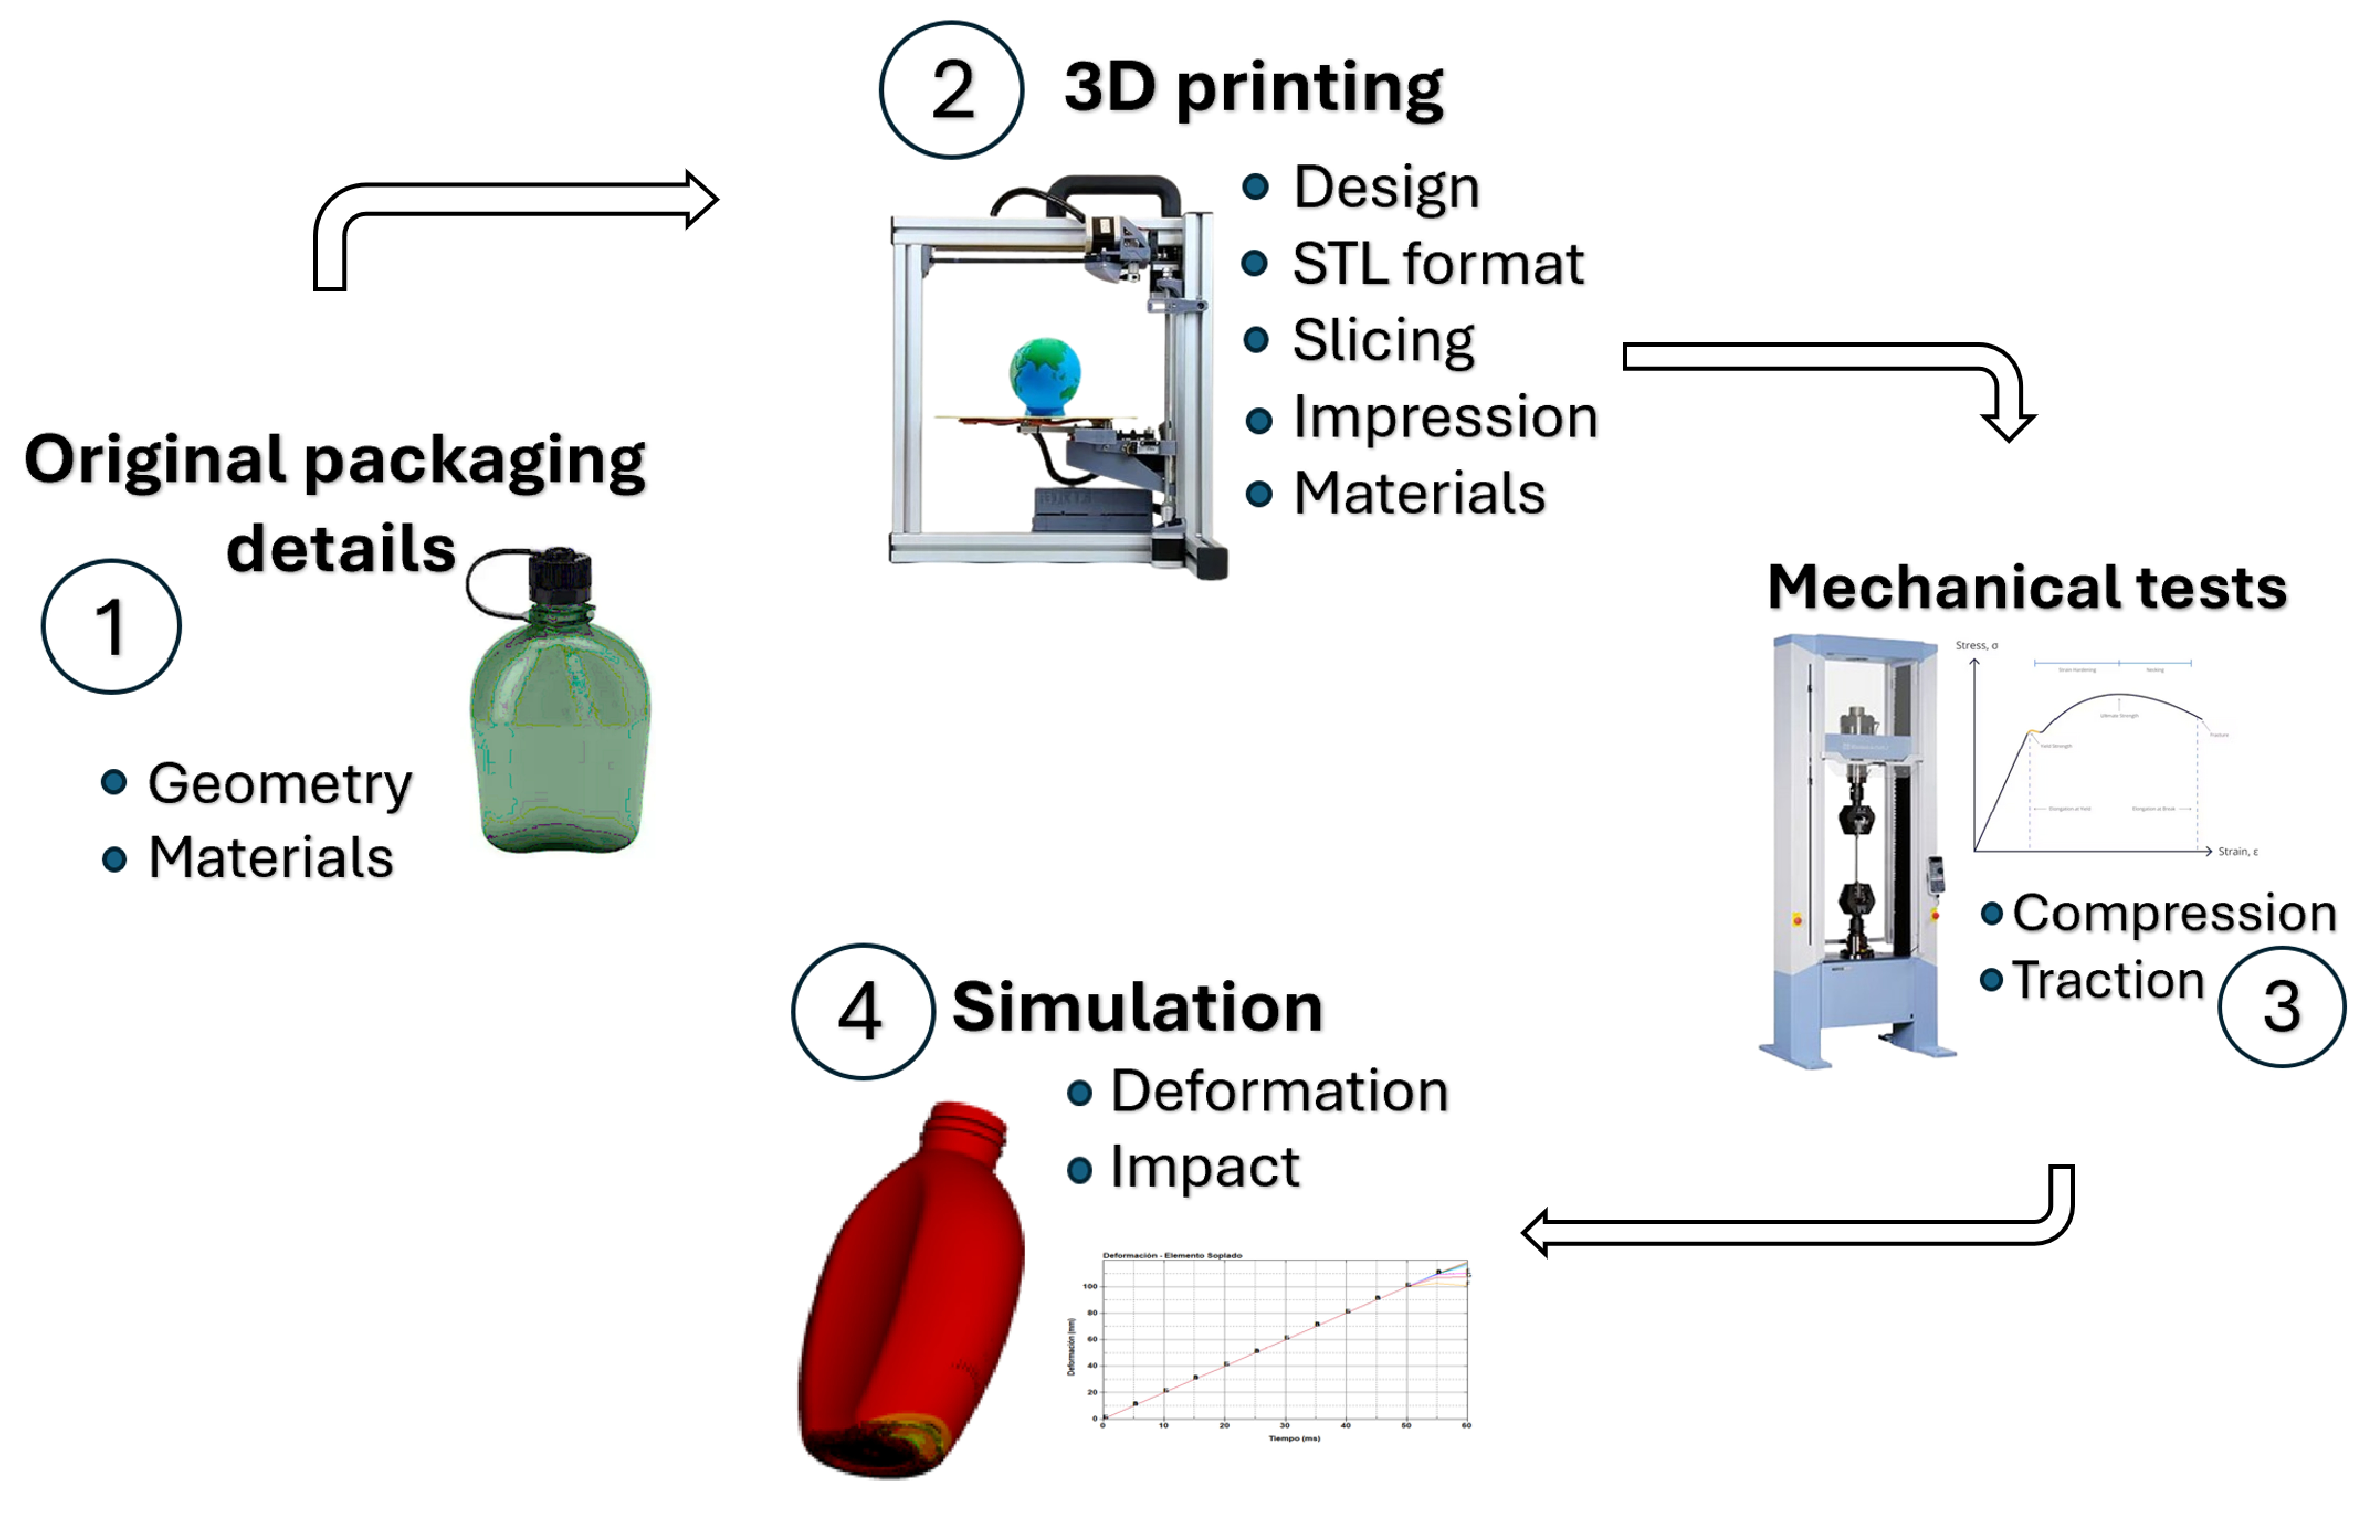
2. Materials and Methods
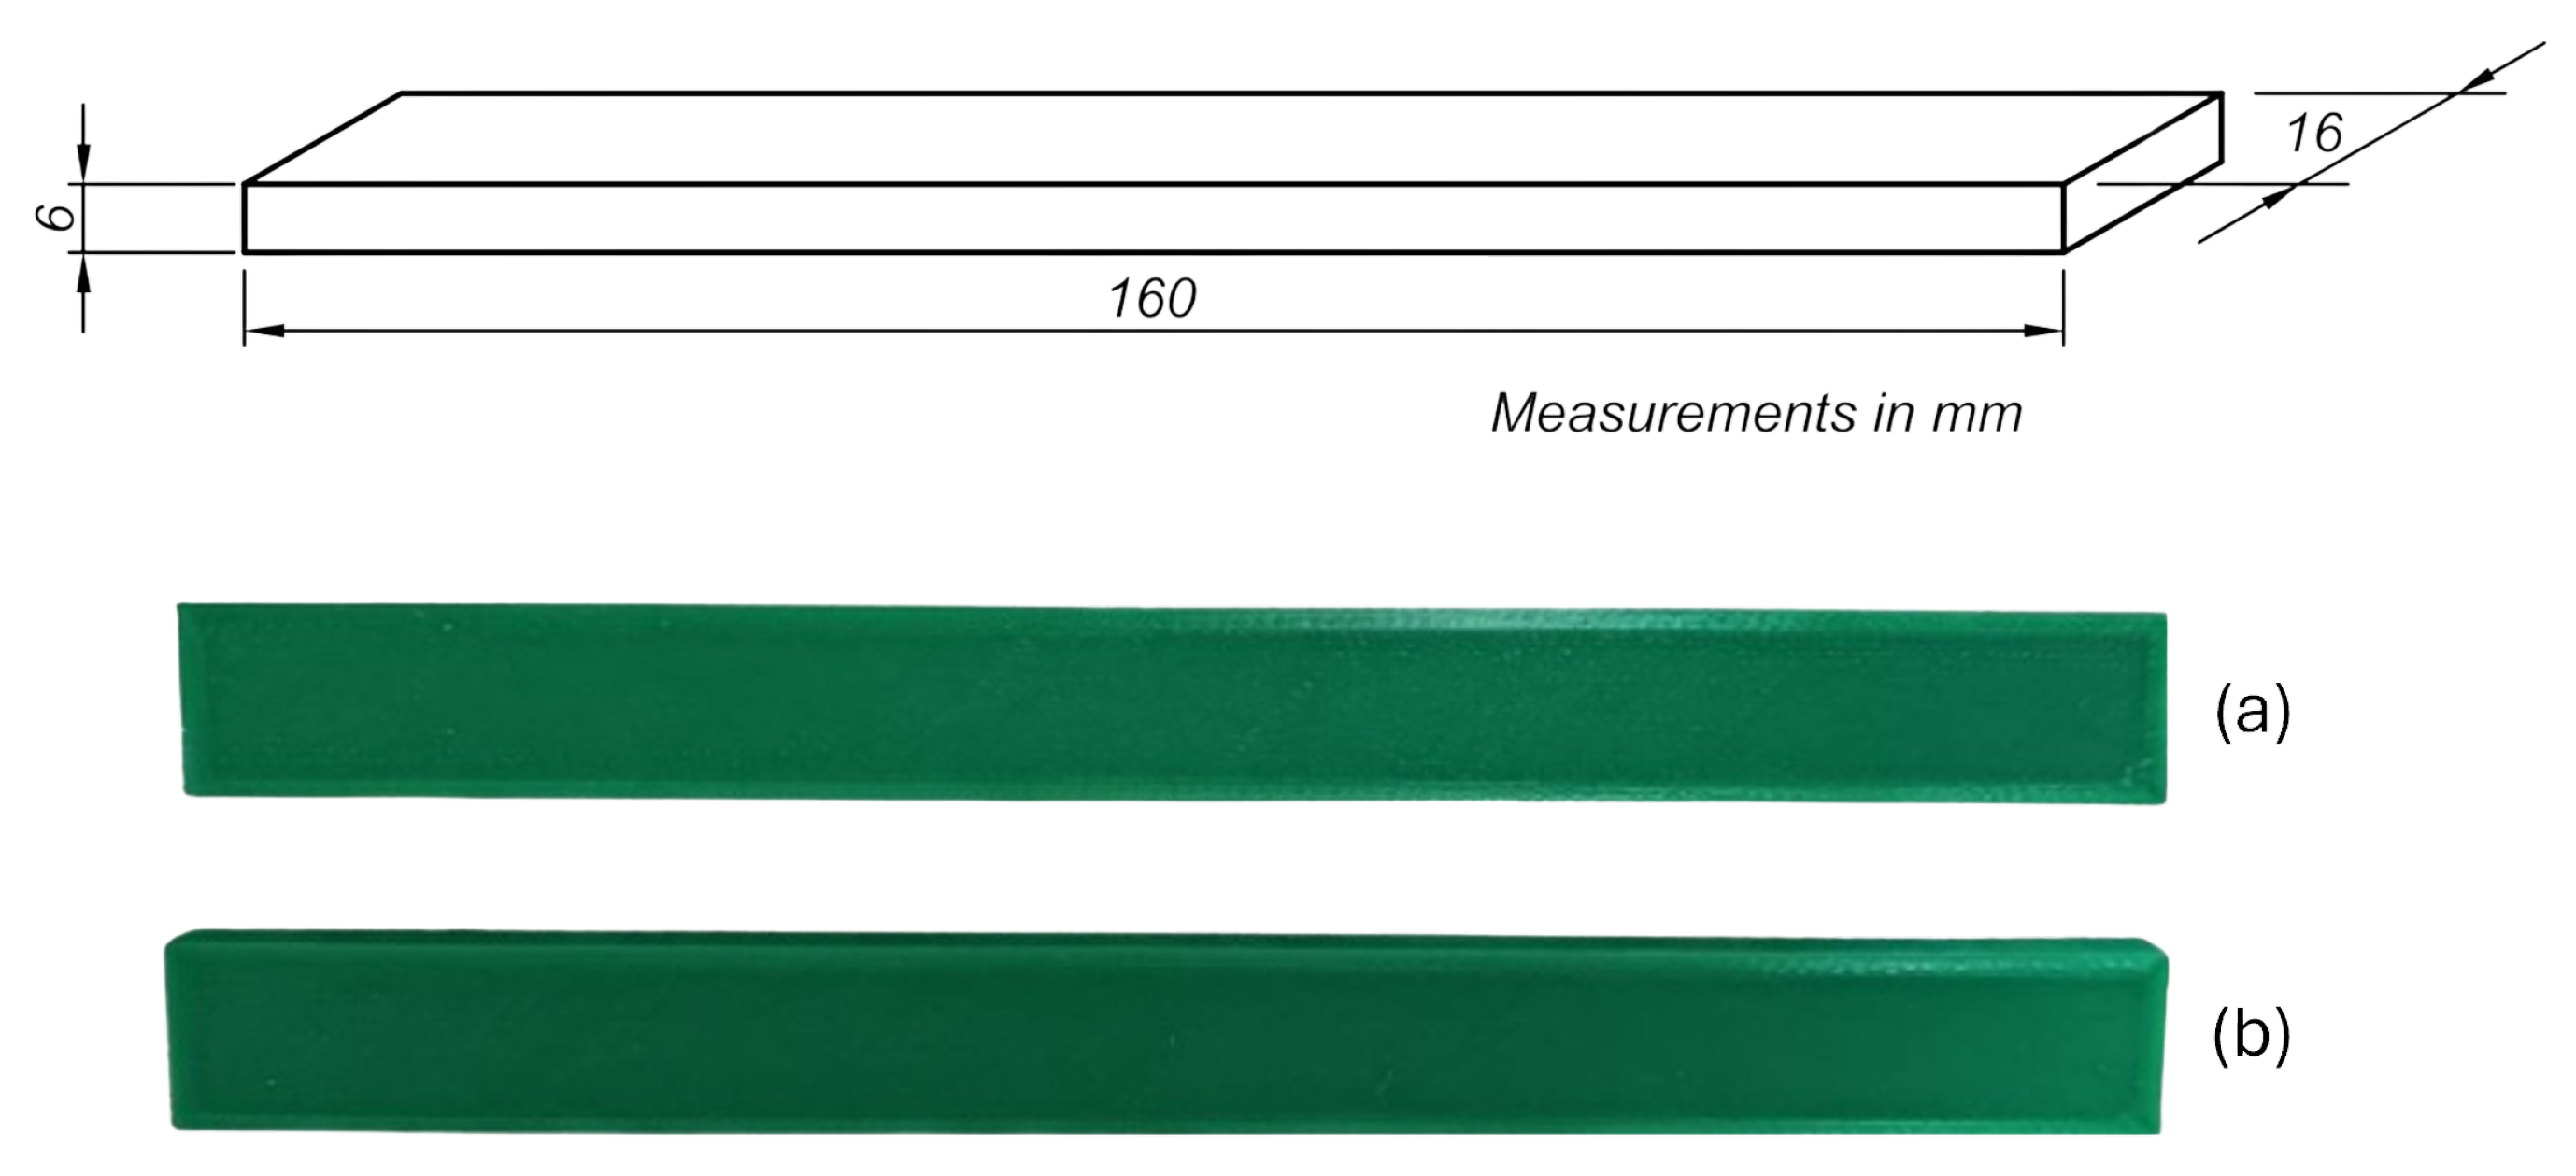
This research employs a quantitative approach, focusing on the numerical data associated with the fabrication of a container using additive manufacturing. This involves various equipment configuration parameters, as well as the evaluation of the container’s quality based on its mechanical characteristics. Furthermore, applied research was conducted on the durability of the containers by simulating free-fall impact, with the aim of providing an experimental scope by manufacturing a container with 3D printing in a laboratory setting and verifying the similarity of its properties to the original container. Figure 1 illustrates the process developed in this research, from data acquisition for container modeling to impact resistance simulation.

2.1. Materials

The material utilized for the container’s fabrication was a thermoplastic biopolymer in filament form, commonly known as polylactic acid (PLA), which is biodegradable under controlled environmental conditions of temperature, humidity, and in the presence of microorganisms. Its general mechanical properties are presented in Table 1. Supply diameters are indefinite, meaning they are available in various dimensions and a wide array of colors, depending on the supplier.
The material was supplied by the commercial vendor Maker Group, and Table 2 presents the general characteristics required for the fabrication of the container to be evaluated.
For the fabrication of the plastic container, an Ultimaker S5 3D printer was utilized. This printer is equipped with Fused Deposition Modeling (FDM) technology for 3D printing, enabling the creation of volumetric parts or elements from computer-aided designs, including 2D drawings or figures, as well as geometries obtained from 3D scanners. For this research, the container was designed to match the original geometry, and reinforcements with rounded edges were incorporated, aiming to minimize thickness variations to prevent the generation of internal stresses and alterations in the printing process that could affect the surface finish quality.
Figure 2 illustrates the reinforcements incorporated into the interior to enhance the container’s resistance to the various external stresses it encounters during use.

2.2. Method

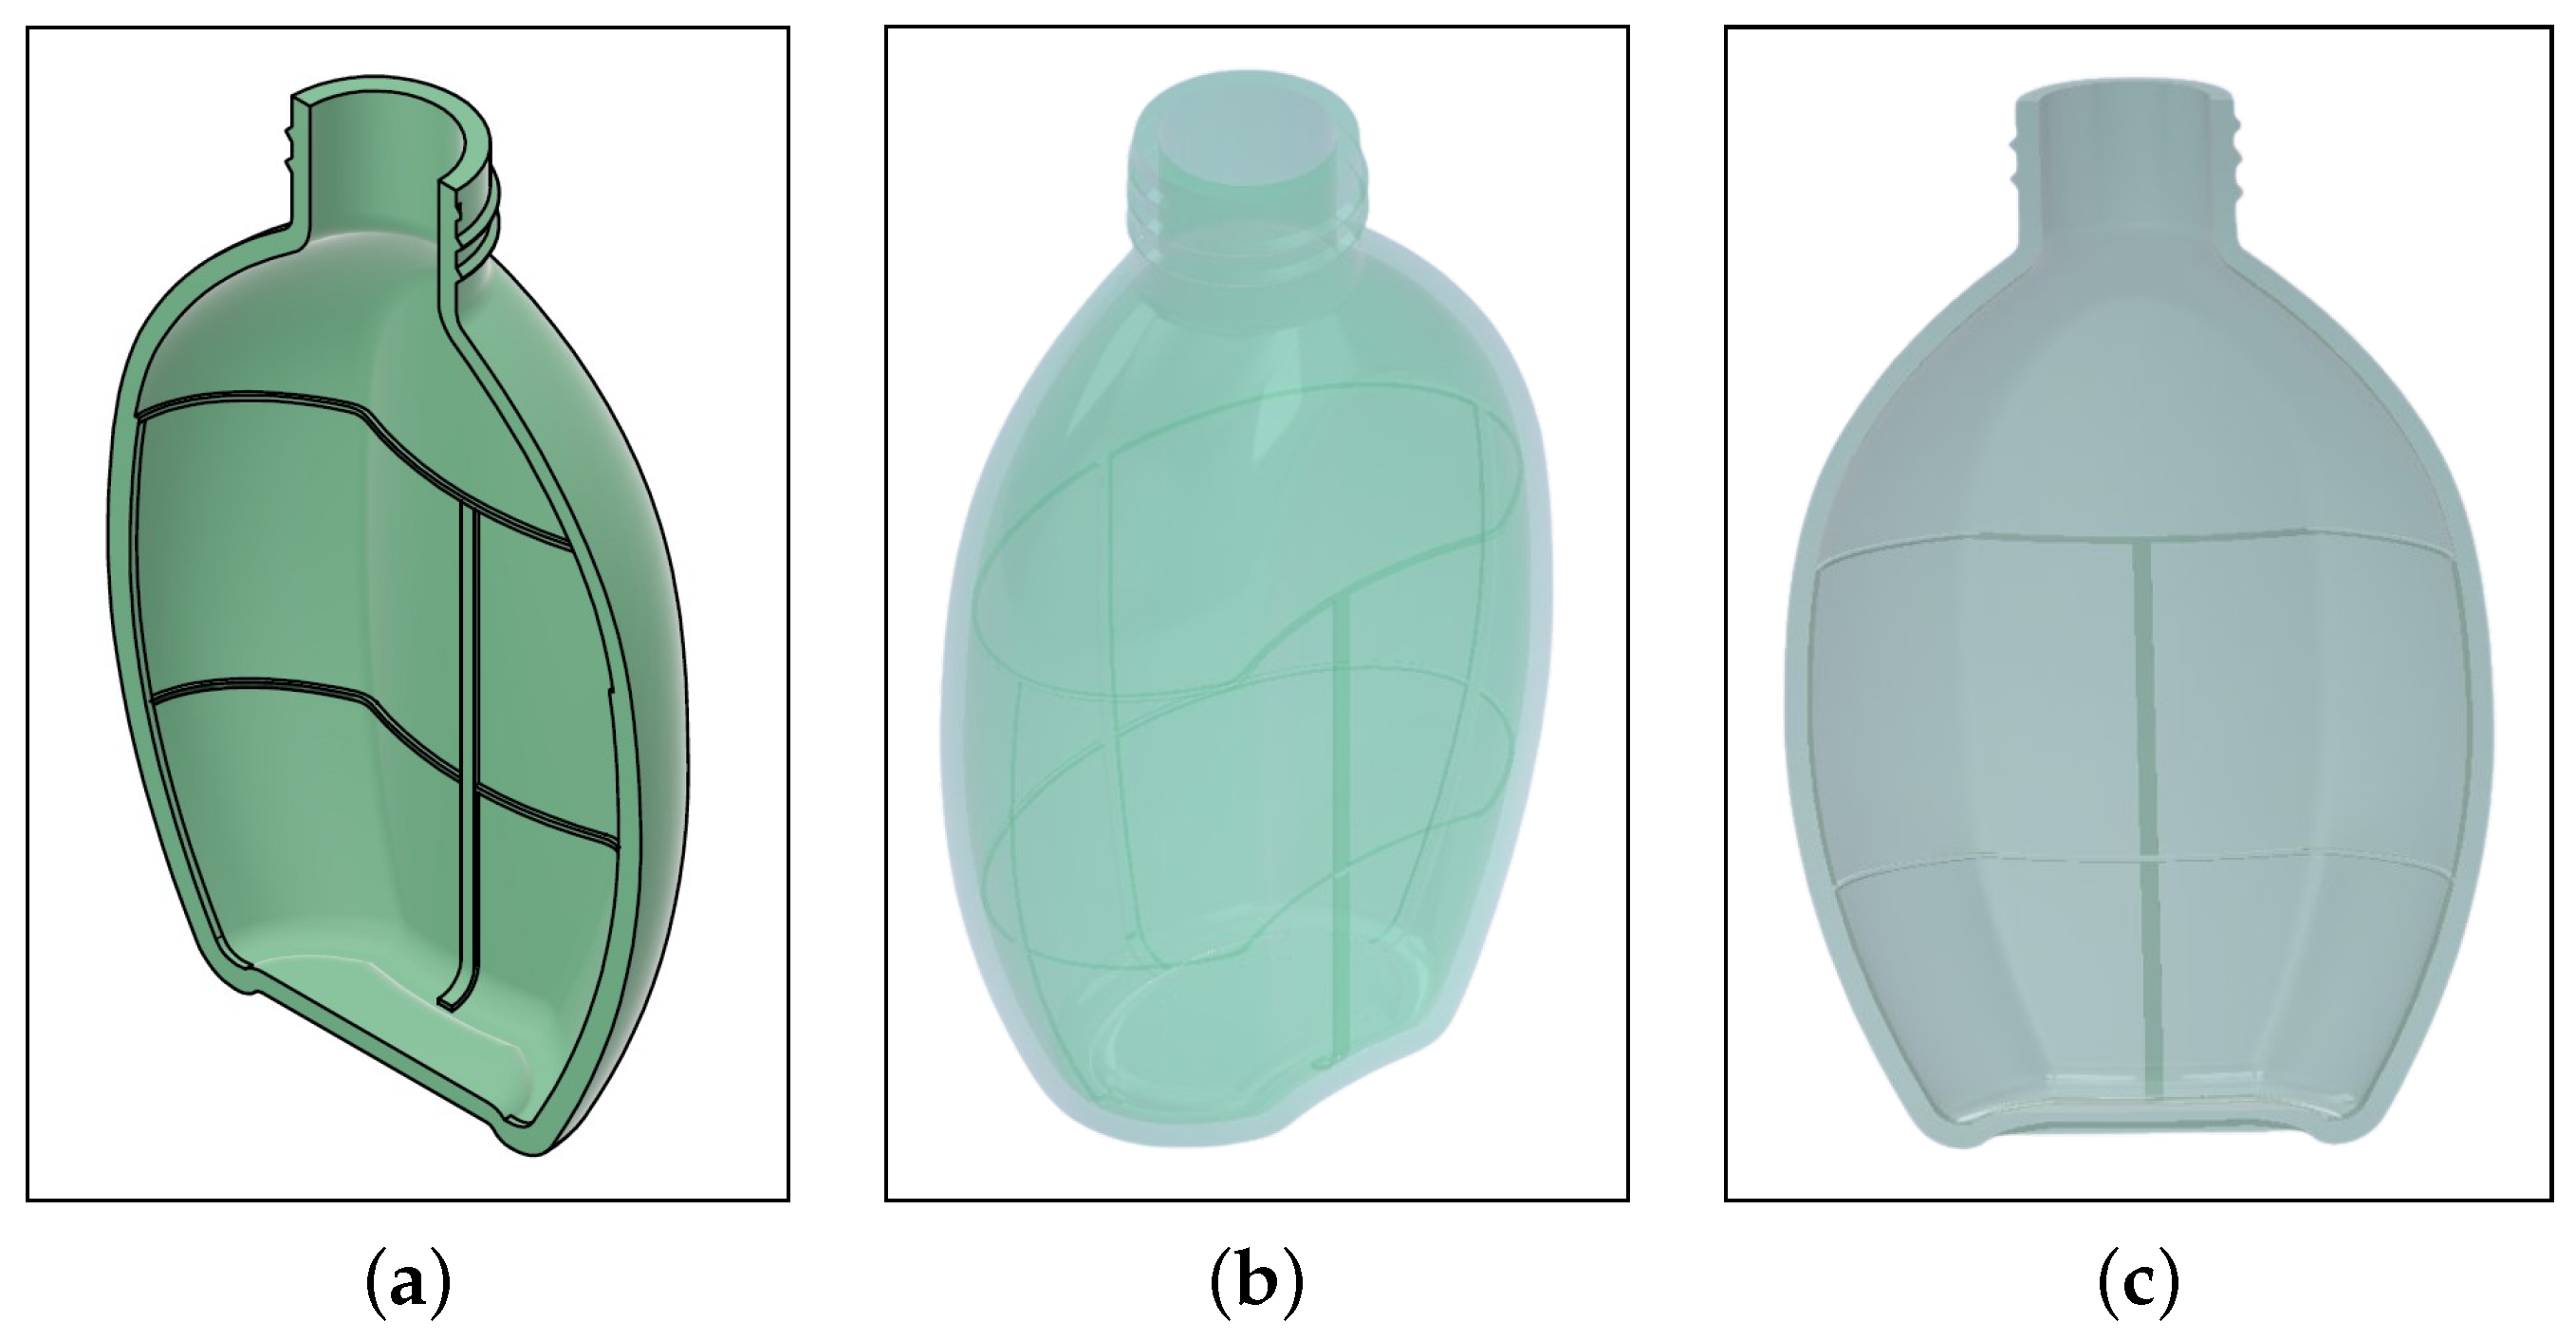
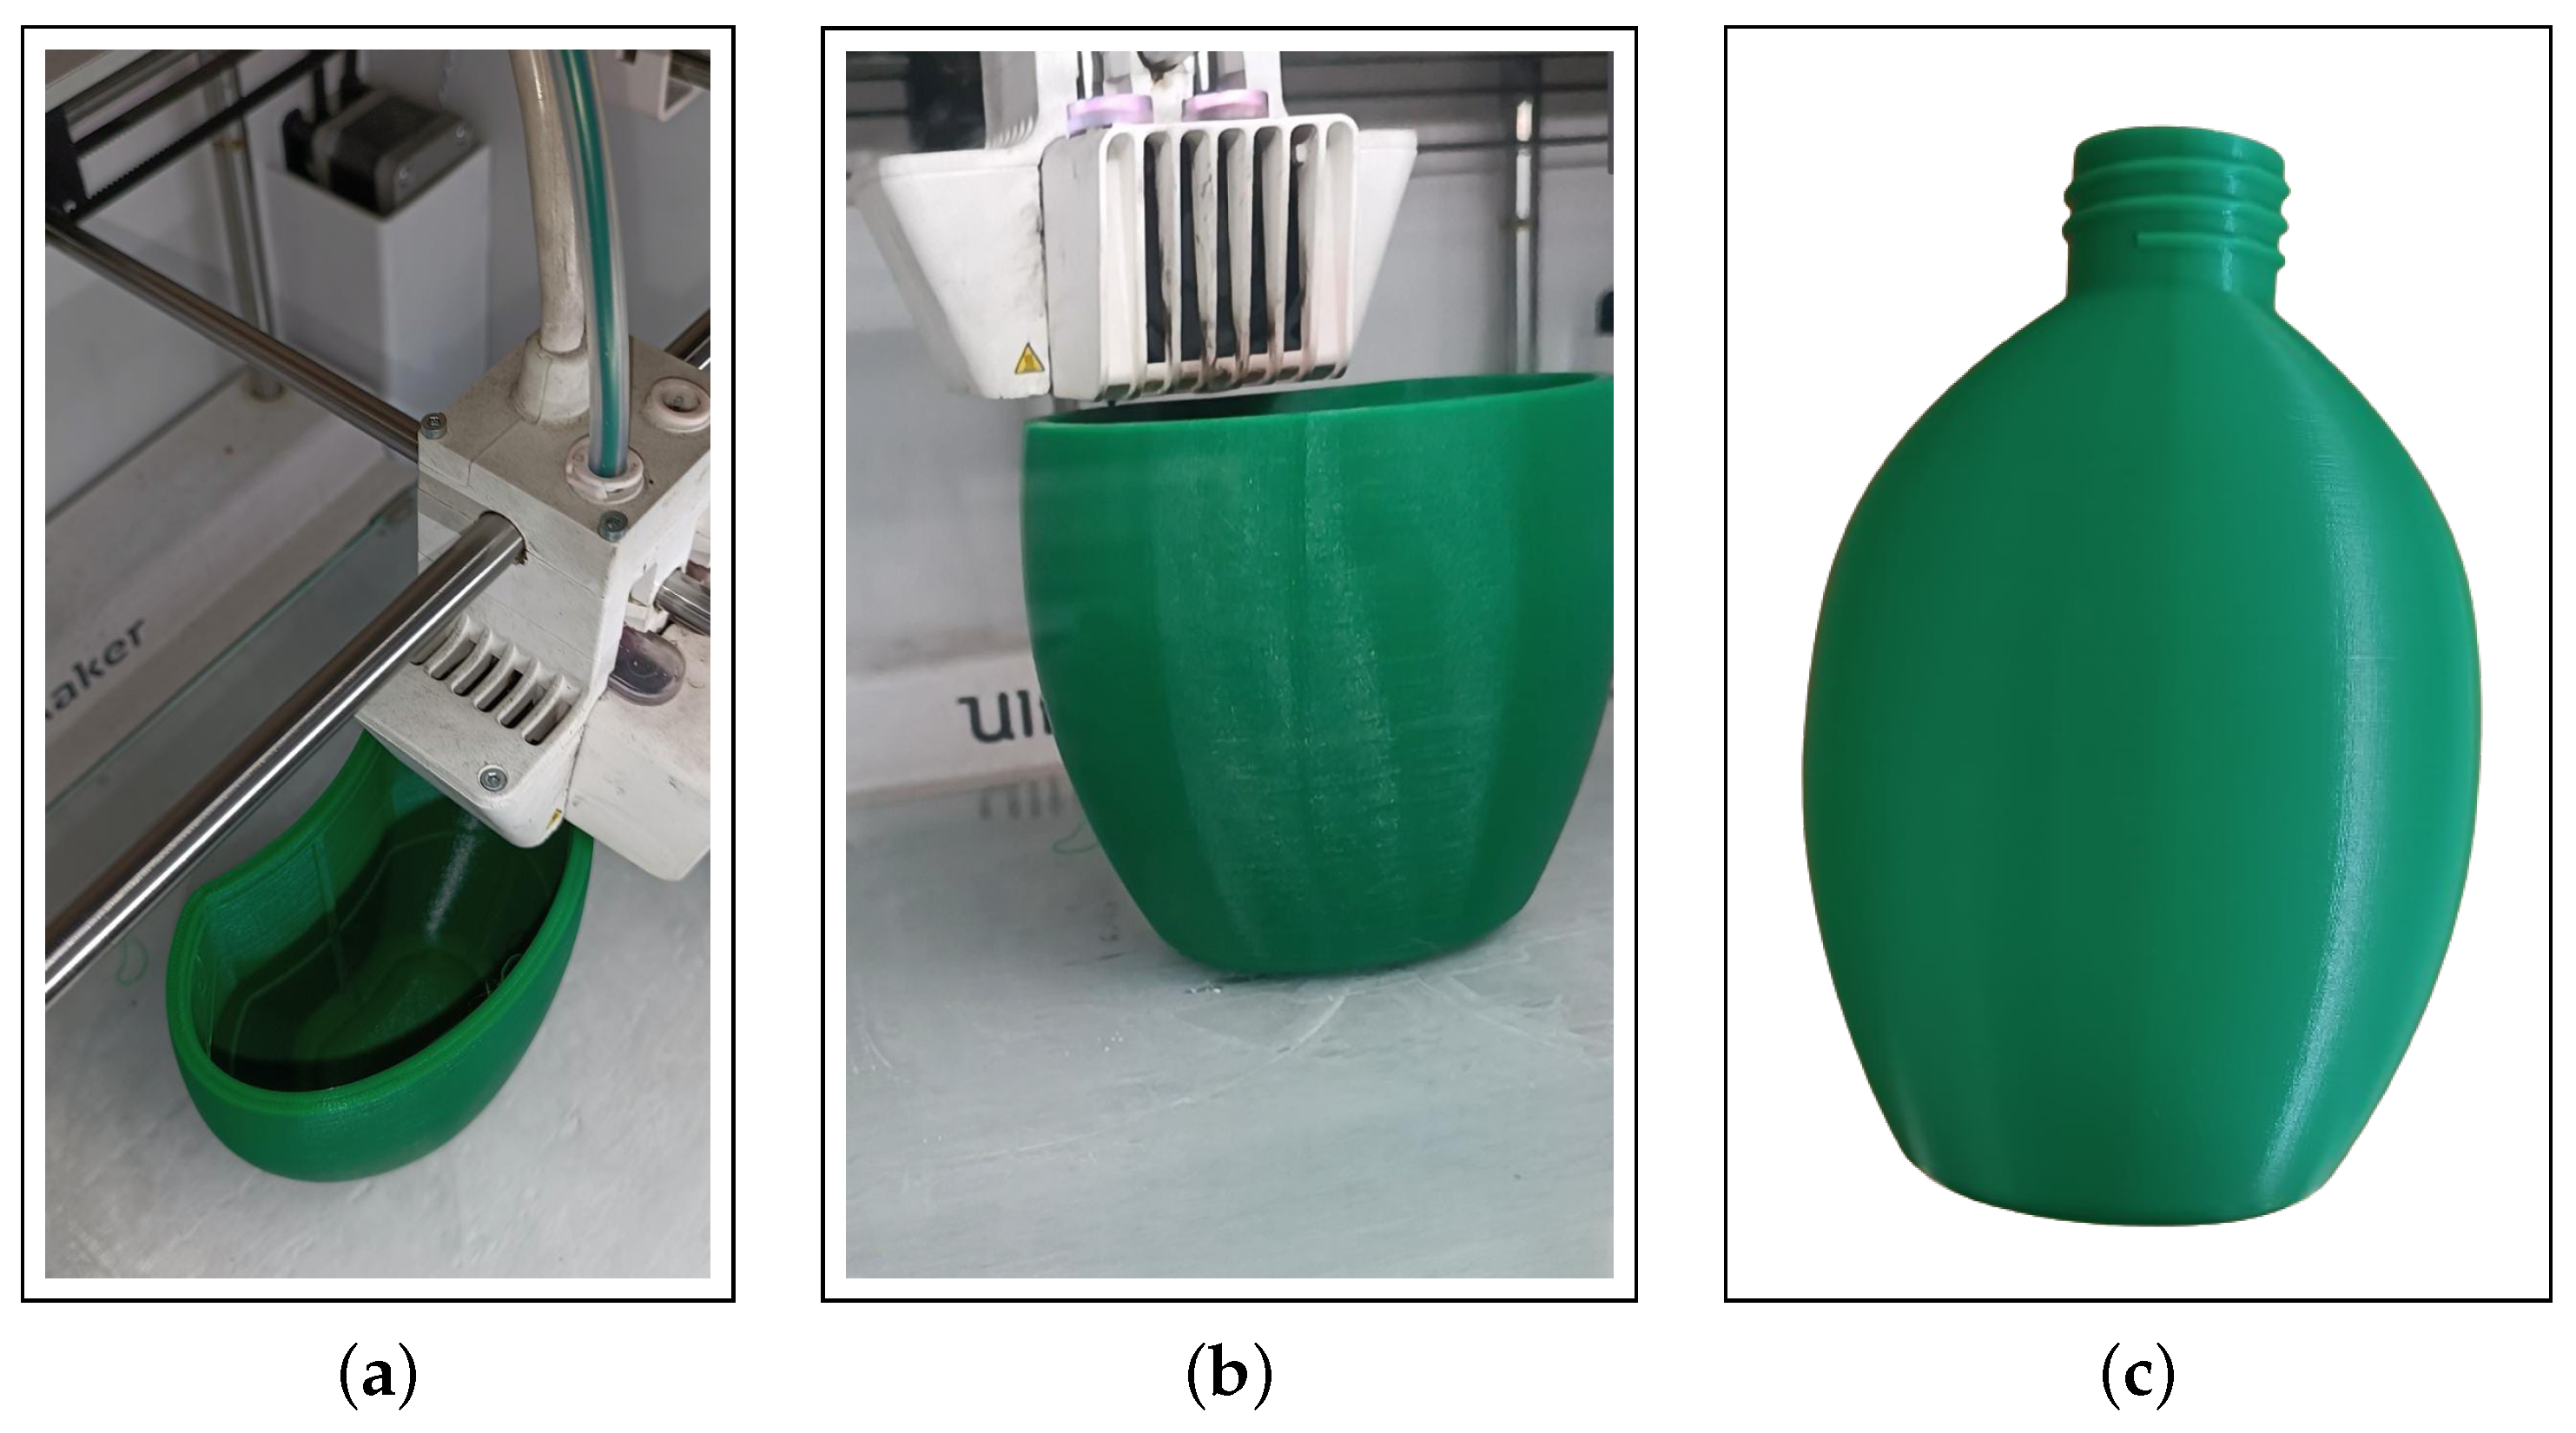
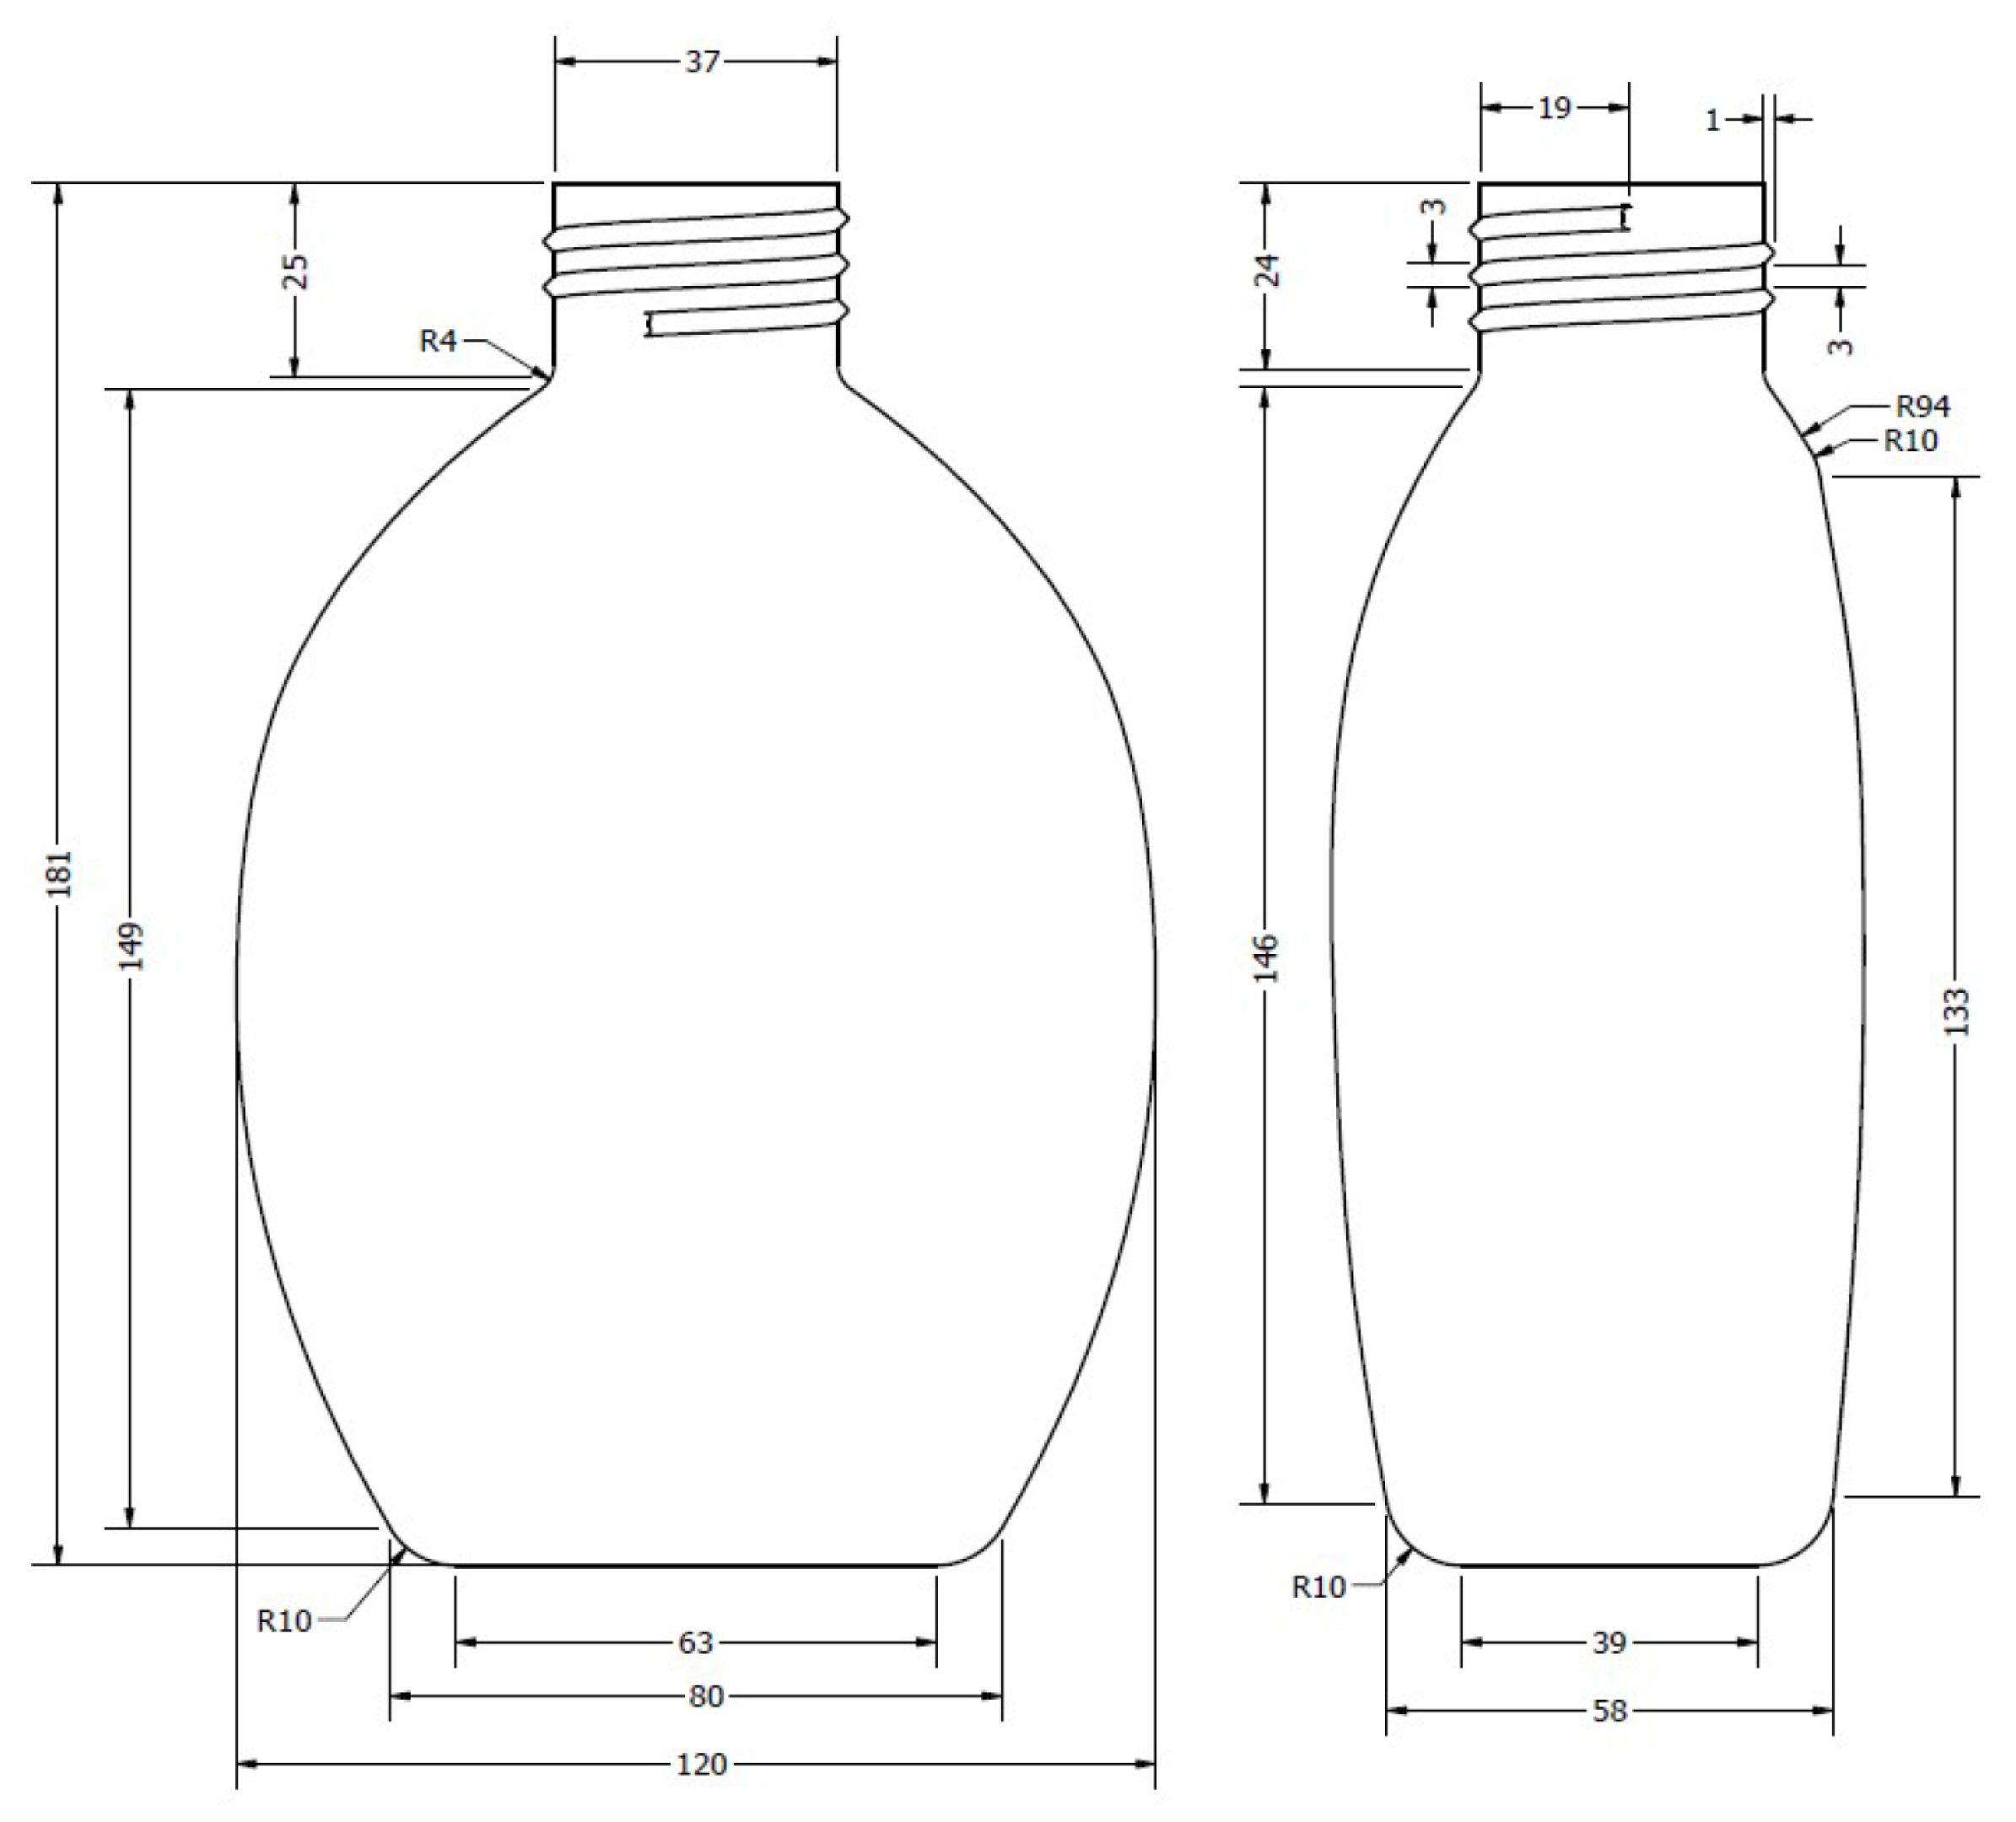
2.2.1. Three-Dimensional Printing

For printing, the parameters configured in the printer are presented in Table 2, considering that they are related to the printing material.
Subsequently, Table 3 presents the printing configuration to achieve an adequate surface quality, ensuring that roughness does not negatively impact the aesthetic appearance and functionality of the container.
Figure 3 illustrates the printing stages of the container, starting from the bottom or base, which features a concave shape. This design provides enhanced solidity and resistance to the body, thereby reducing the likelihood of ruptures in case of impacts from falls or pressure exerted by the liquid within the container, especially considering it is subjected to extreme conditions.
The container has a total length of 181 mm with a cross-section of 120 mm × 58 mm and a thread with a diameter of 37 mm, as shown in Figure 4.

2.2.2. Stress Analysis of the Printed Material

The tensile strength of the printed material was evaluated according to ASTM D638, “Standard Test Method for Tensile Properties of Plastics”, where Table 4 presents the configuration on the AGS-X series universal testing machine, Shimadzu, Tokyo, Japan.
In Figure 5, the printed specimens used in the tensile test are shown; the results obtained were used to configure the impact resistance simulation of the printed container.
For the test, a constant speed of 3 mm/min with a 20 kN load cell was used. Figure 6 shows the specimen mounting in the grips and the initial length mark.

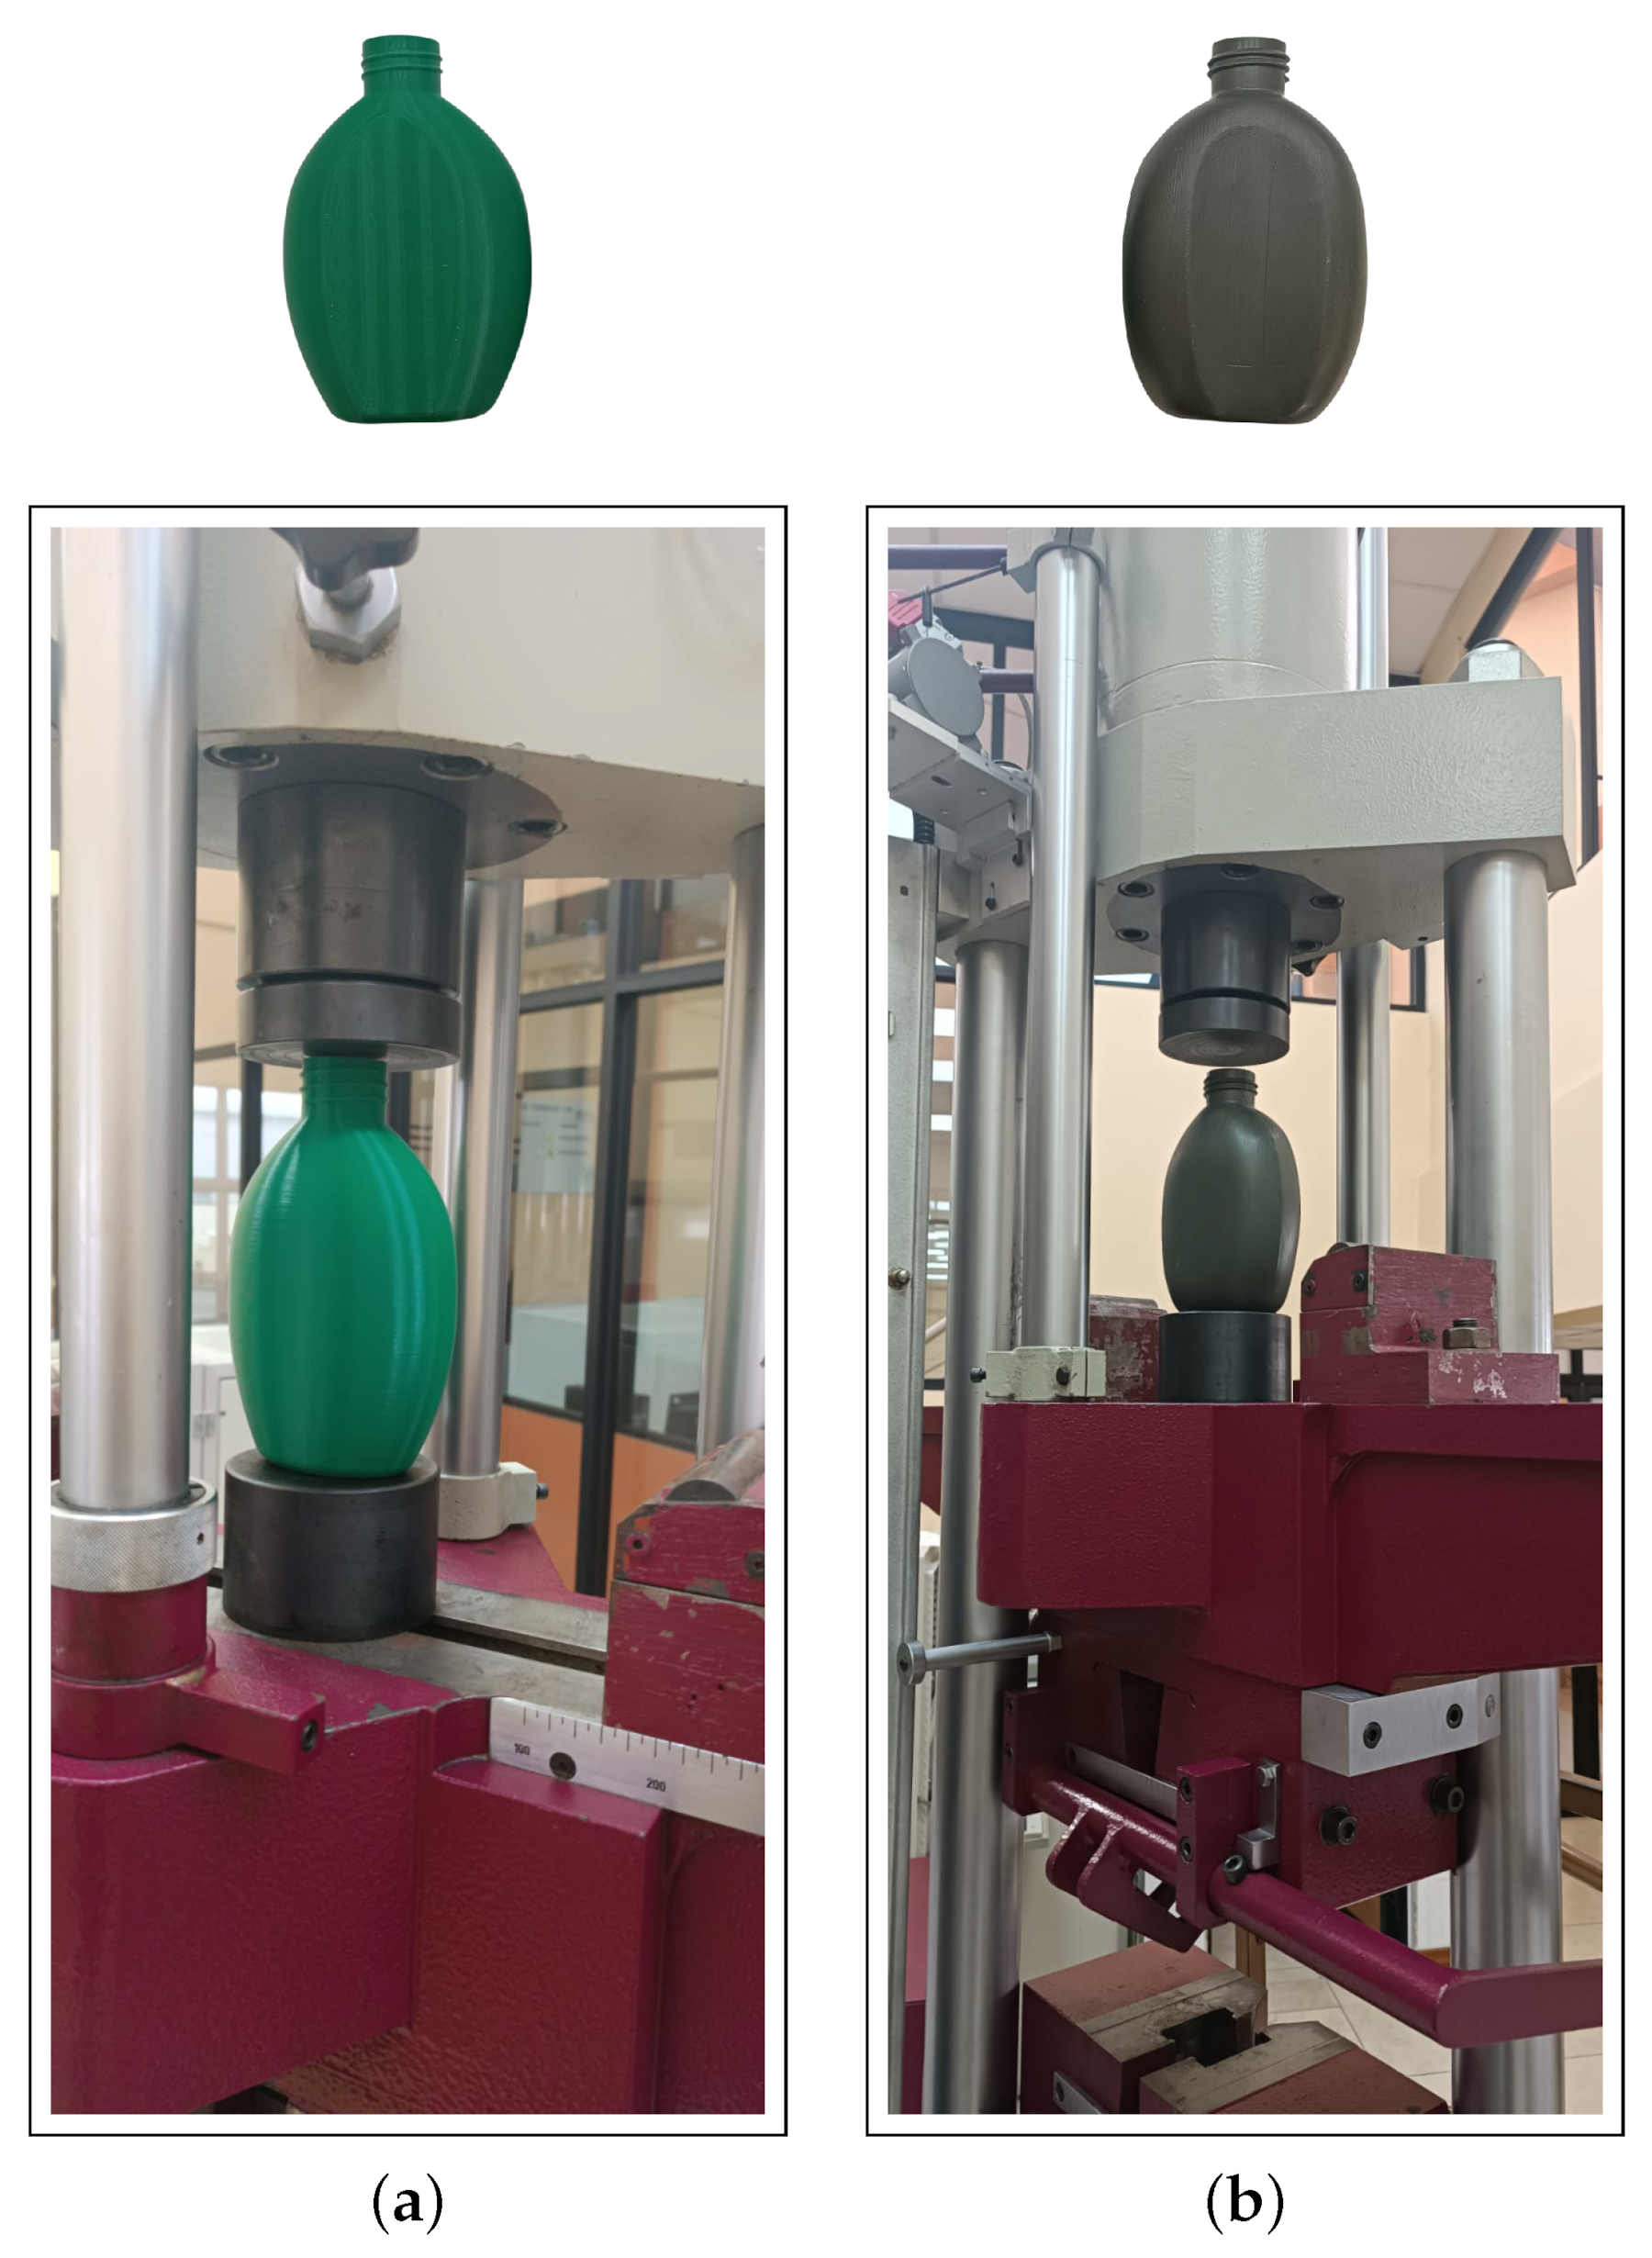
2.2.3. Compression Analysis of Printed and Original Containers

There are various tests that can be performed on a container, but there is no specific standard for a particular product or bottle. Some organizations, such as the Plastic Bottle Institute (PBI), propose certain tests for different types of containers to ensure their functionality. In most cases, specific tests are conducted and adapted to the numerous existing formats. Among the various tests, those that help control the physical–mechanical properties stand out, especially those that can guarantee the minimum mechanical resistances a container should possess, whether for packaging, transport, or storage. In general, some of the most common tests performed on containers are as follows:
  • Compression resistance;
  • Free-fall impact resistance.
In this context, a comparative analysis of compression resistance was performed between the original container manufactured through a blow molding process and the one obtained through 3D printing on a Metro Com Engineering universal testing machine, with a constant speed of 3 mm/min and the configuration presented in Table 5.
In Figure 7, the setup of the machine for the compression test of the two containers with the same configuration is shown.

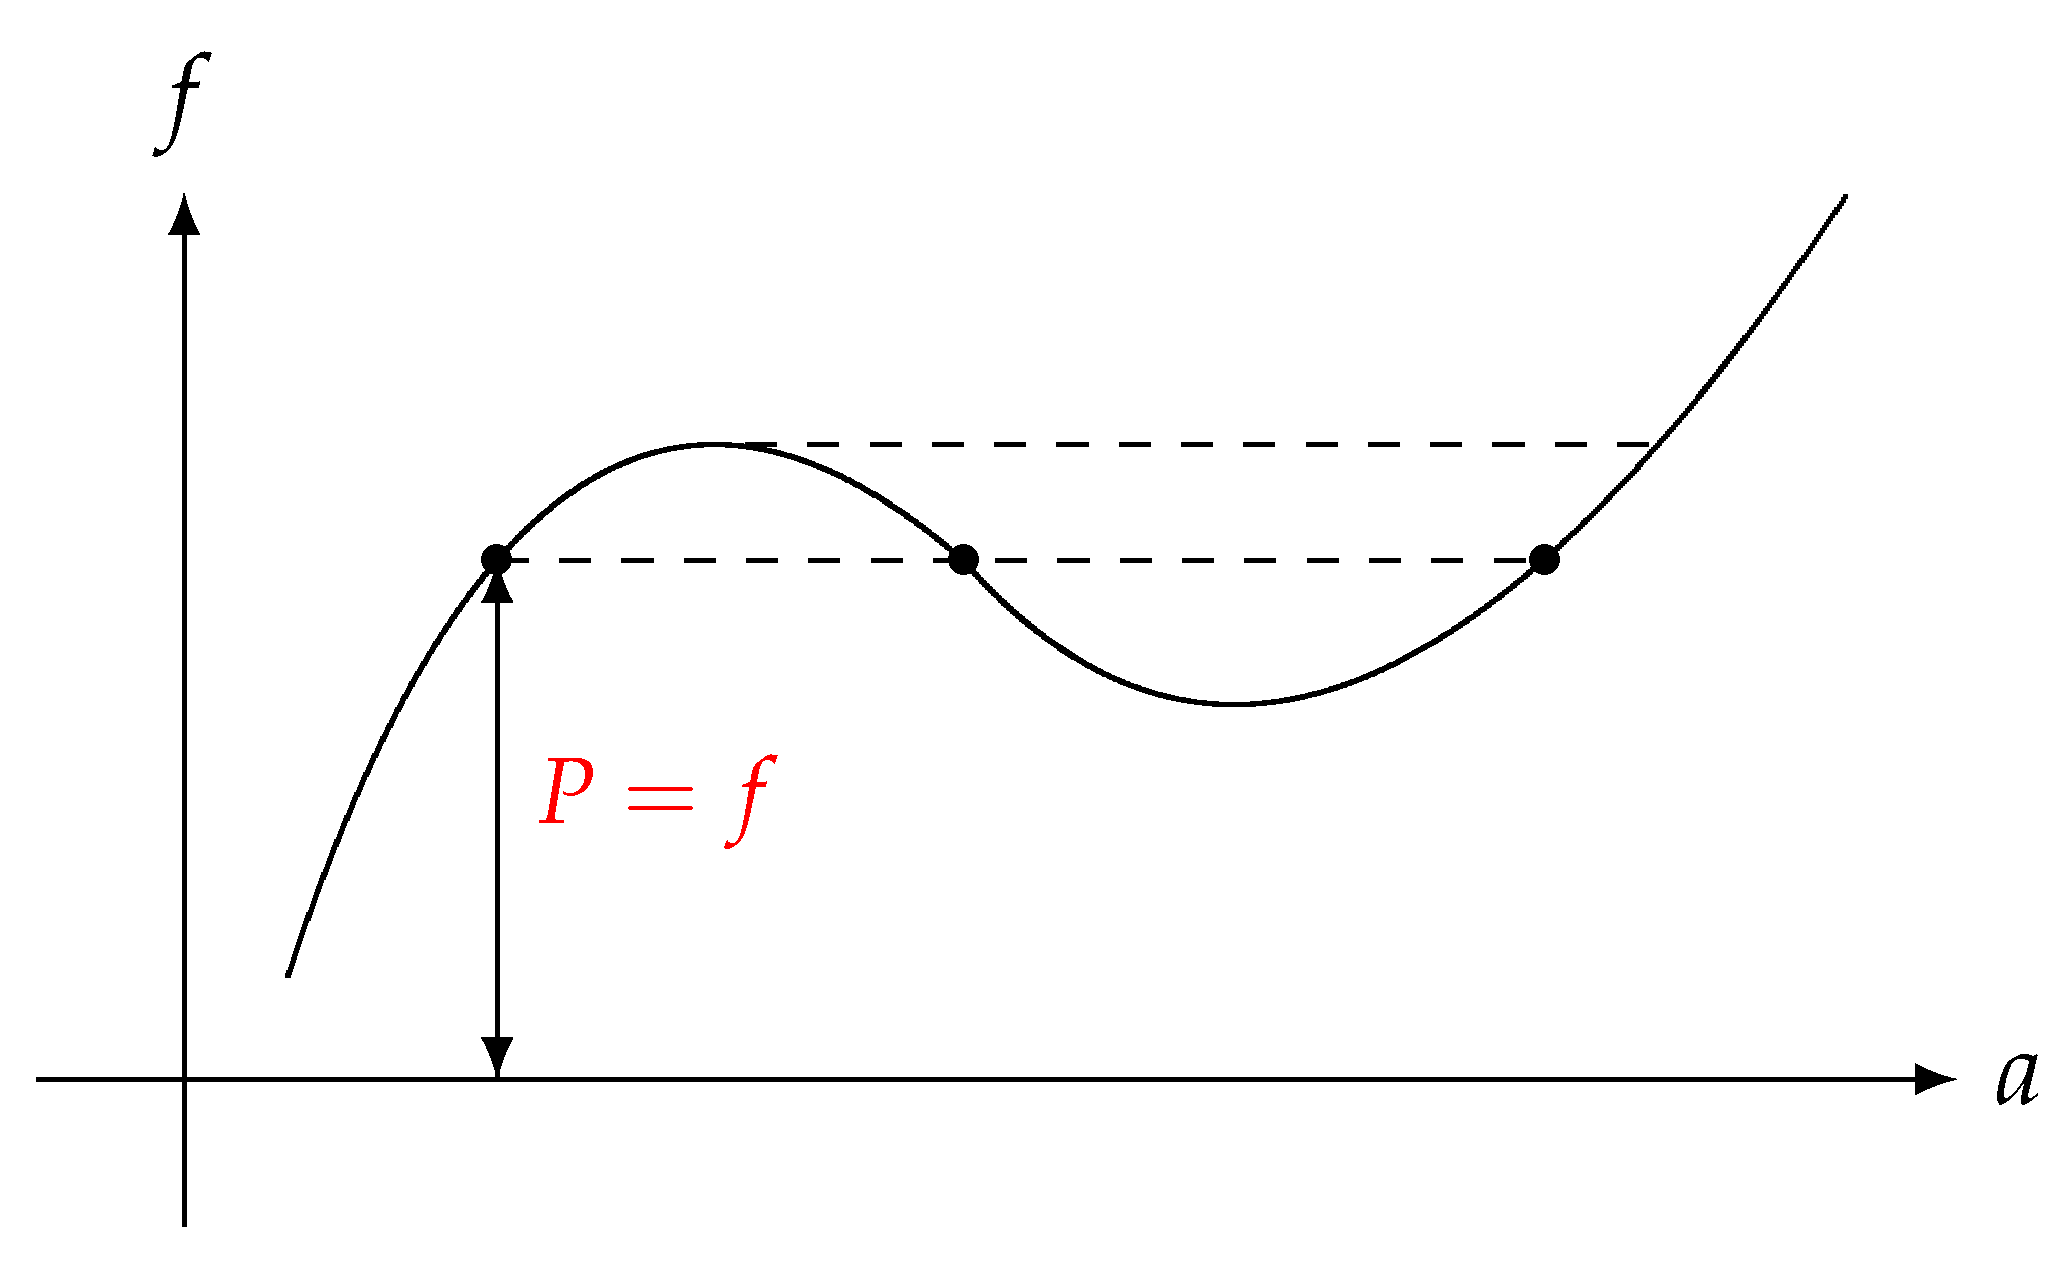
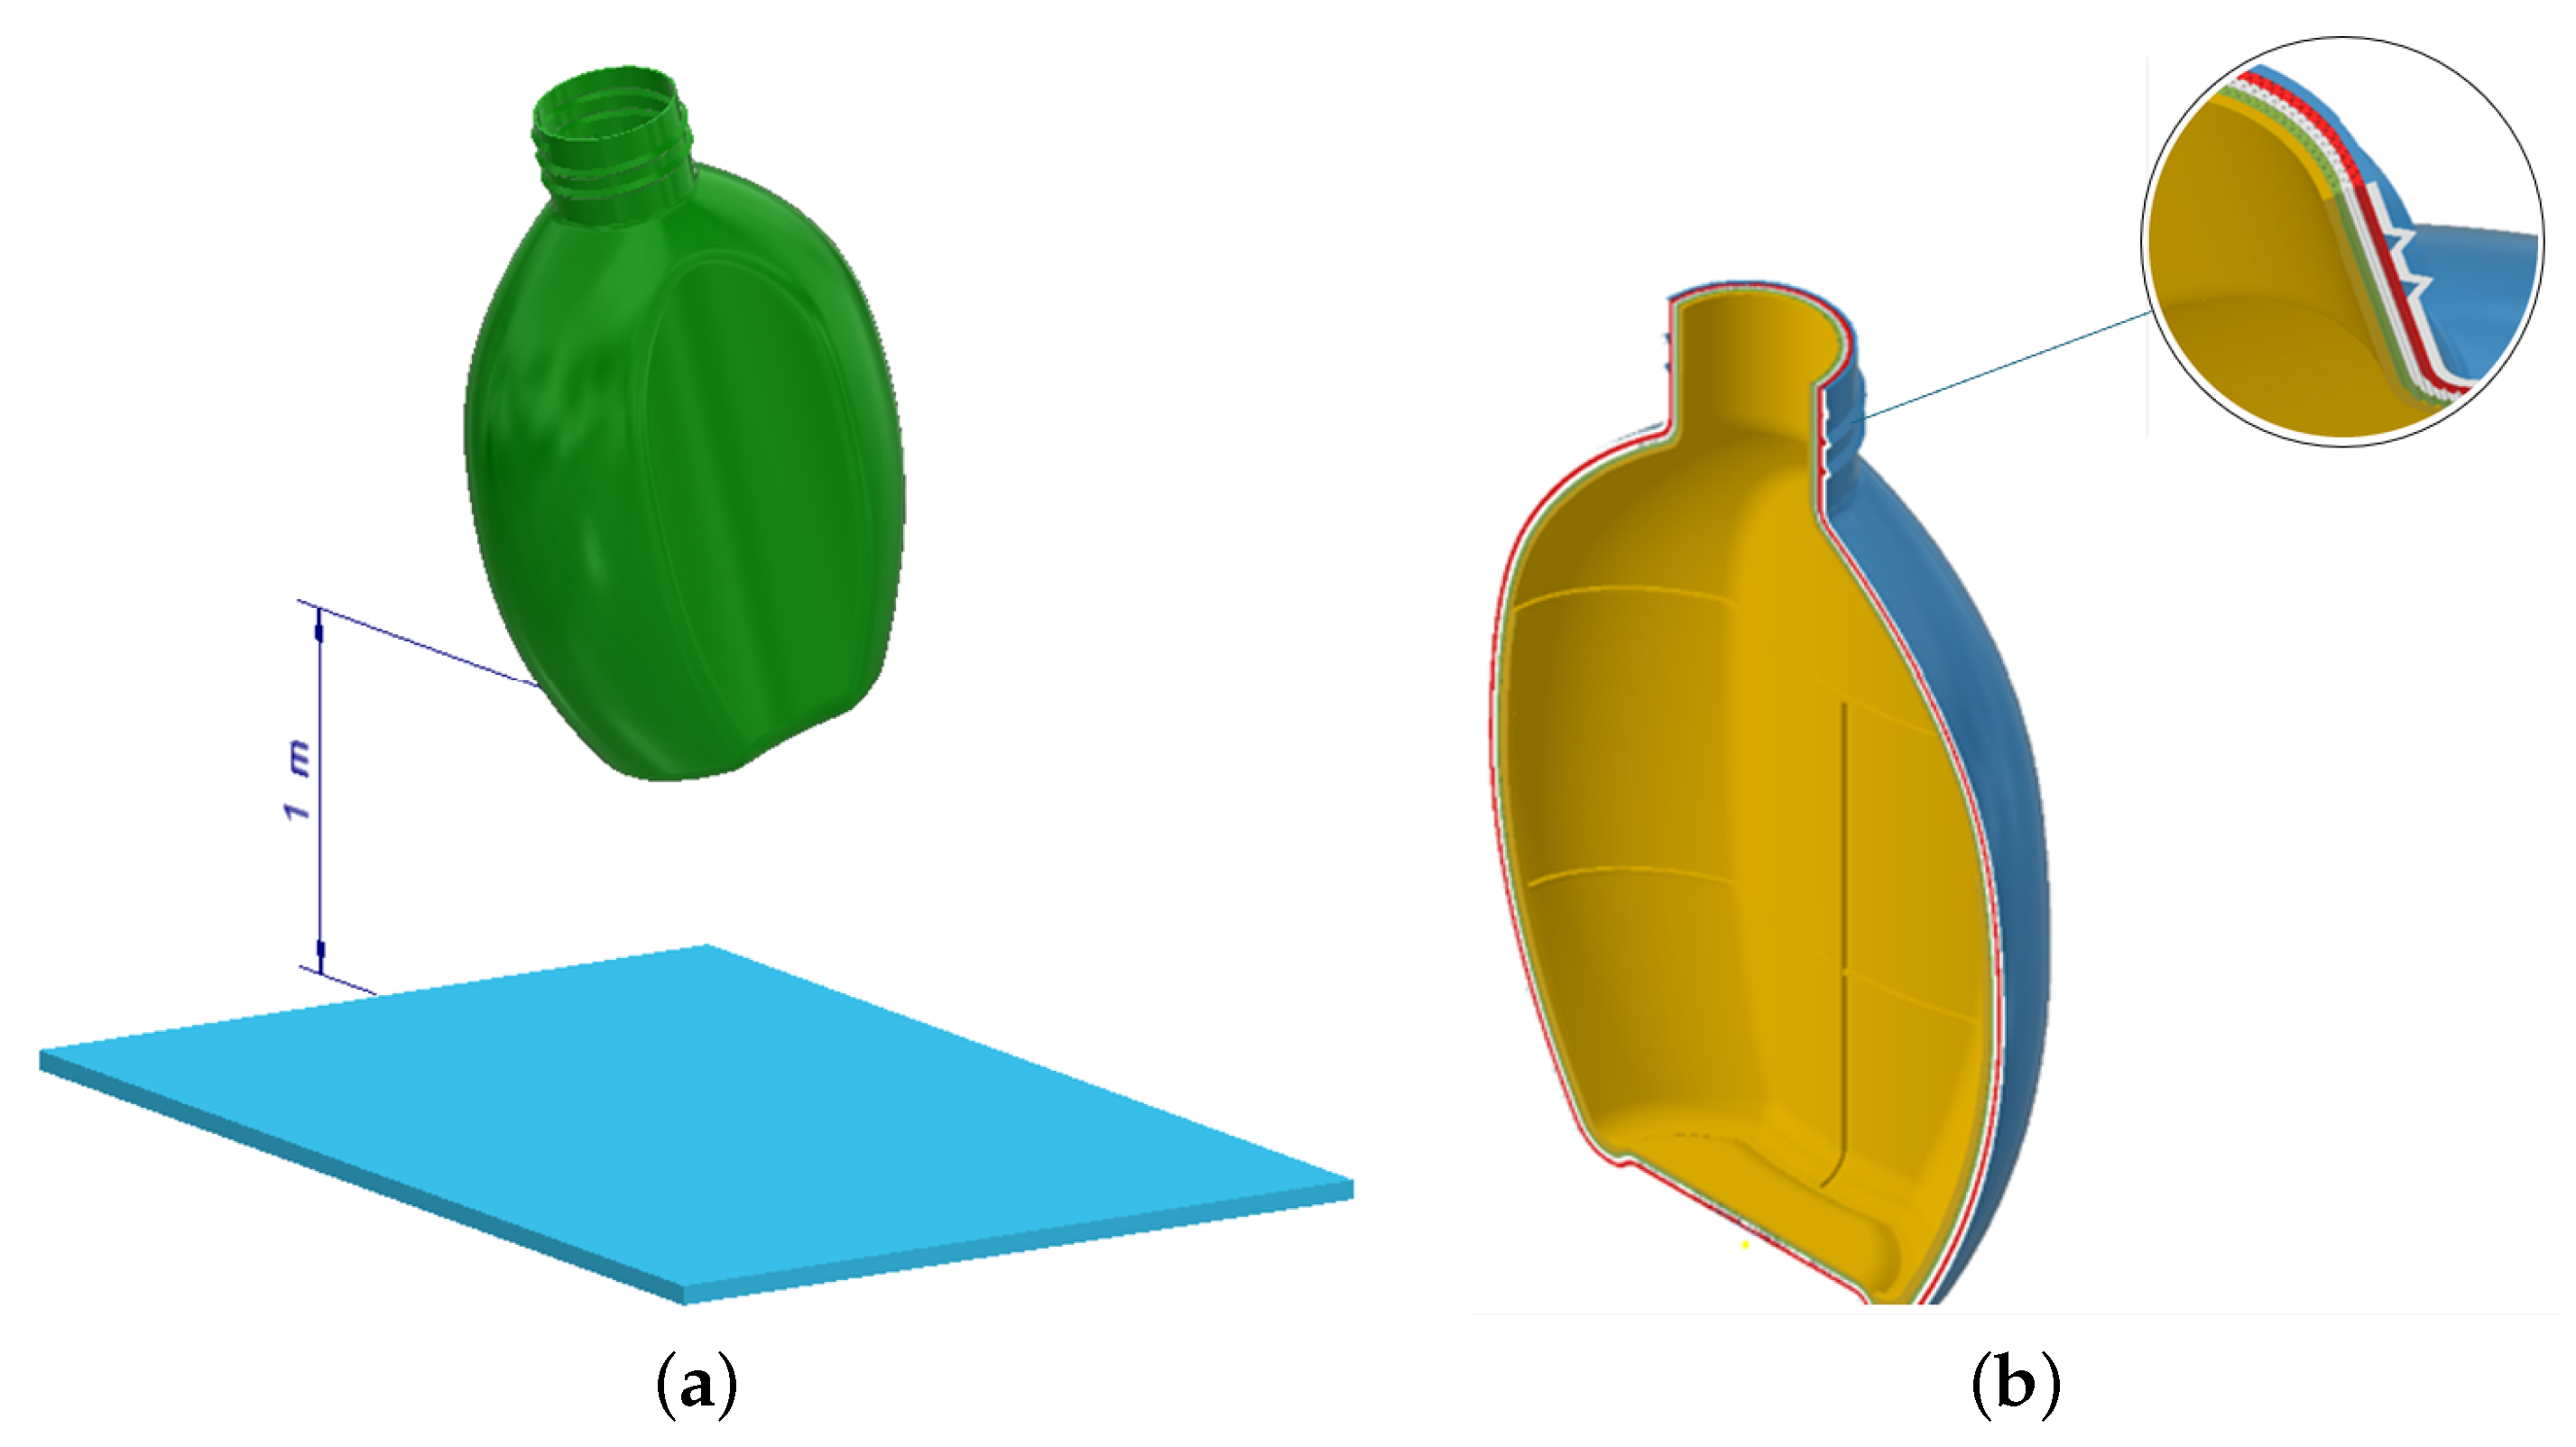
2.3. Finite Element Impact Analysis

For the analysis of impact tests between different bodies, which is governed by a set of algebraic equations, a finite element analysis was used. This provided the possibility to model the physical phenomenon of impact between a free-falling container and the floor. According to Zienkiewicz [21] in solid mechanics, where characteristics such as plasticity, creep, and deformation, among others are analyzed, there is no unique solution. Instead, it depends on the many non-linear situations present. The problem is always posed as a function of the discretization parameter a, as indicated in Equation (1), which solves equations at a local level through iterative methods that use simple elements in rapid dynamics problems proposed by Gauss–Seidel. Moreover, the method is not unconditionally convergent.
ψ n + 1 ψ ( a n + 1 ) = P ( a n + 1 ) f = 0
Zienkiewicz [21] begins with a (quasi) equilibrium consideration and proposes Equation (2):
a = a n , ψ n = 0 , f = f n
Due to the particularity of the study, there are changes in the force functions f to f n , resulting in Equation (3):
f n + 1 = f n + Δ f n
There are also changes in the discretization parameter, where the determination of the change Δ a n is defined by Equation (4):
a n + 1 = a n + Δ a n
It is considered that the increments of Δ f n are very small in the case of a plastic container falling due to the negligible acceleration at a short height. Furthermore, they can take negative values according to the increment of a, as observed in Figure 8.
In non-linear problems and in the case of mild non-linearity, solutions are obtained in a single increment of f with Equation (5):
Δ f n = f n + 1
Similarly, Zienkiewicz [21] states that the general equations naturally arise in materials governed by inelastic constitutive laws, where the stress σ depends on the strain in a complex manner, with the displacement direction as an unknown, as indicated in Equation (6):
μ μ ^ = N a
The internal force vector P of Equation (1) is defined by Equation (7), which relates the stress σ to the nodal or global displacements a that define the function B T :
P = Ω B T σ d Ω
Meanwhile, the internal force vector is defined by f in Equation (5), where
  • a i : Nodal or global displacements;
  • σ : Stress (column vector);
  • Ω : Domain;
  • B: Strain function;
  • μ : Displacement vector;
  • μ ^ : Approximation of μ ;
  • f: Nodal/external element force;
  • P: Internal force vector.
To verify the behavior and resistance of the elements under study, an impact analysis was proposed using the finite element method with the LS-DYNA R11.1.0 software. For this purpose, a free fall of the empty elements was simulated from a height of 1 m at a 15° angle relative to the floor, aiming for the impact to occur on the lower edge of the container, as shown in Figure 9a. For the computational study, three-dimensional modeling was performed using a solid element with layers representing the internal structure according to the 3D printing process, along with the details and shapes of the container, as depicted in Figure 9b.
For the simulation impact analysis of the container obtained through the blow molding manufacturing process, a three-dimensional model was considered, utilizing a single solid element type. The parameters input into the software are presented in Table 6, noting that the unit system was selected initially for data entry.
The boundary conditions established included gravity, an initial velocity of zero for free fall, and consideration of the contact between the container and the ground over a simulation duration of 60 ms. Furthermore, controls for artificial damping were activated within the software to mitigate numerical oscillations and better simulate impact compression effects. This also enhances the treatment of penetrations in surface contact areas, ensures the tracking of energy balances, and controls hourglass distortion.

3. Results

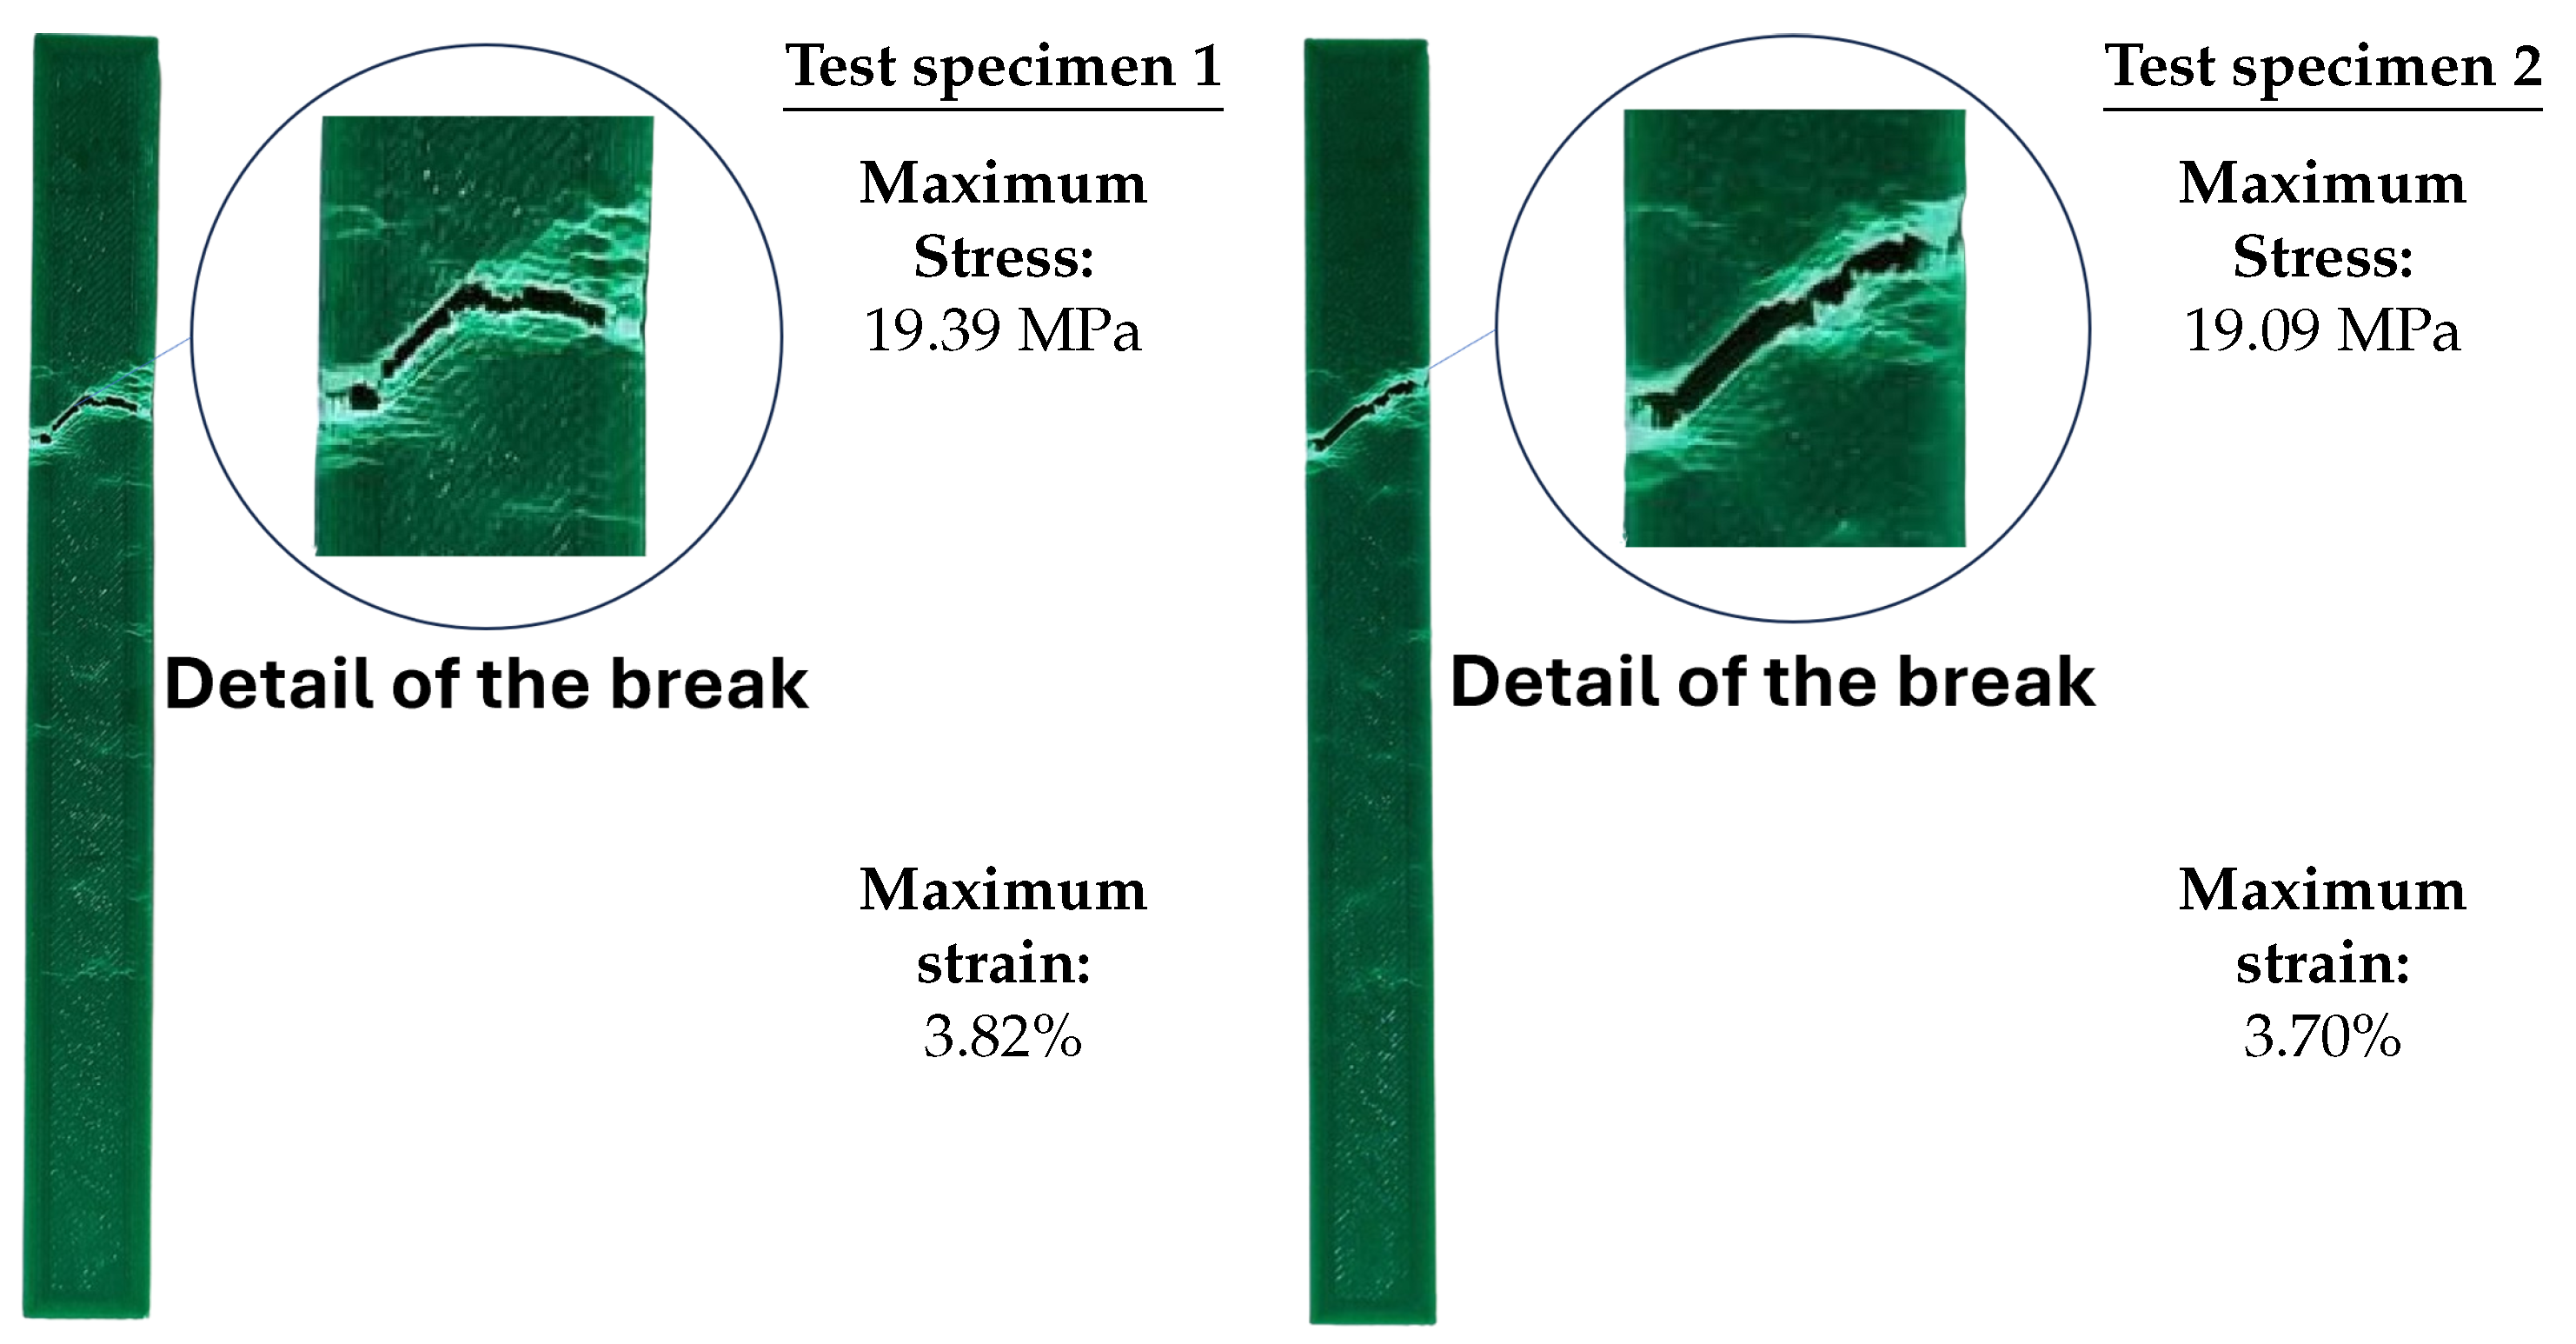
3.1. Evaluation of Tensile Stress of Printed Specimens

The results obtained from the tensile test are presented in Figure 10, where the average maximum tensile stress of the specimens produced by 3D printing with the same configuration as the container is 19.24 MPa, and the average maximum deformation corresponds to 3.76%. To simulate the impact resistance of a plastic using the finite element method (FEM), it is crucial to obtain precise tensile test data. Key parameters used include the modulus of elasticity (Young’s modulus = 2346.5 MPa), which describes the material’s stiffness and its ability to resist elastic deformation, and the yield strength (49.5 MPa), which defines the onset of plastic deformation in the material and is crucial for simulating the material’s non-linear behavior.
Figure 11 illustrates the stress–strain behavior of the PLA specimens, revealing that they withstand a comparable load up to an approximate displacement of 2.5 mm. However, the fracture mode differs significantly and is directly attributed to the 3D printing manufacturing process.

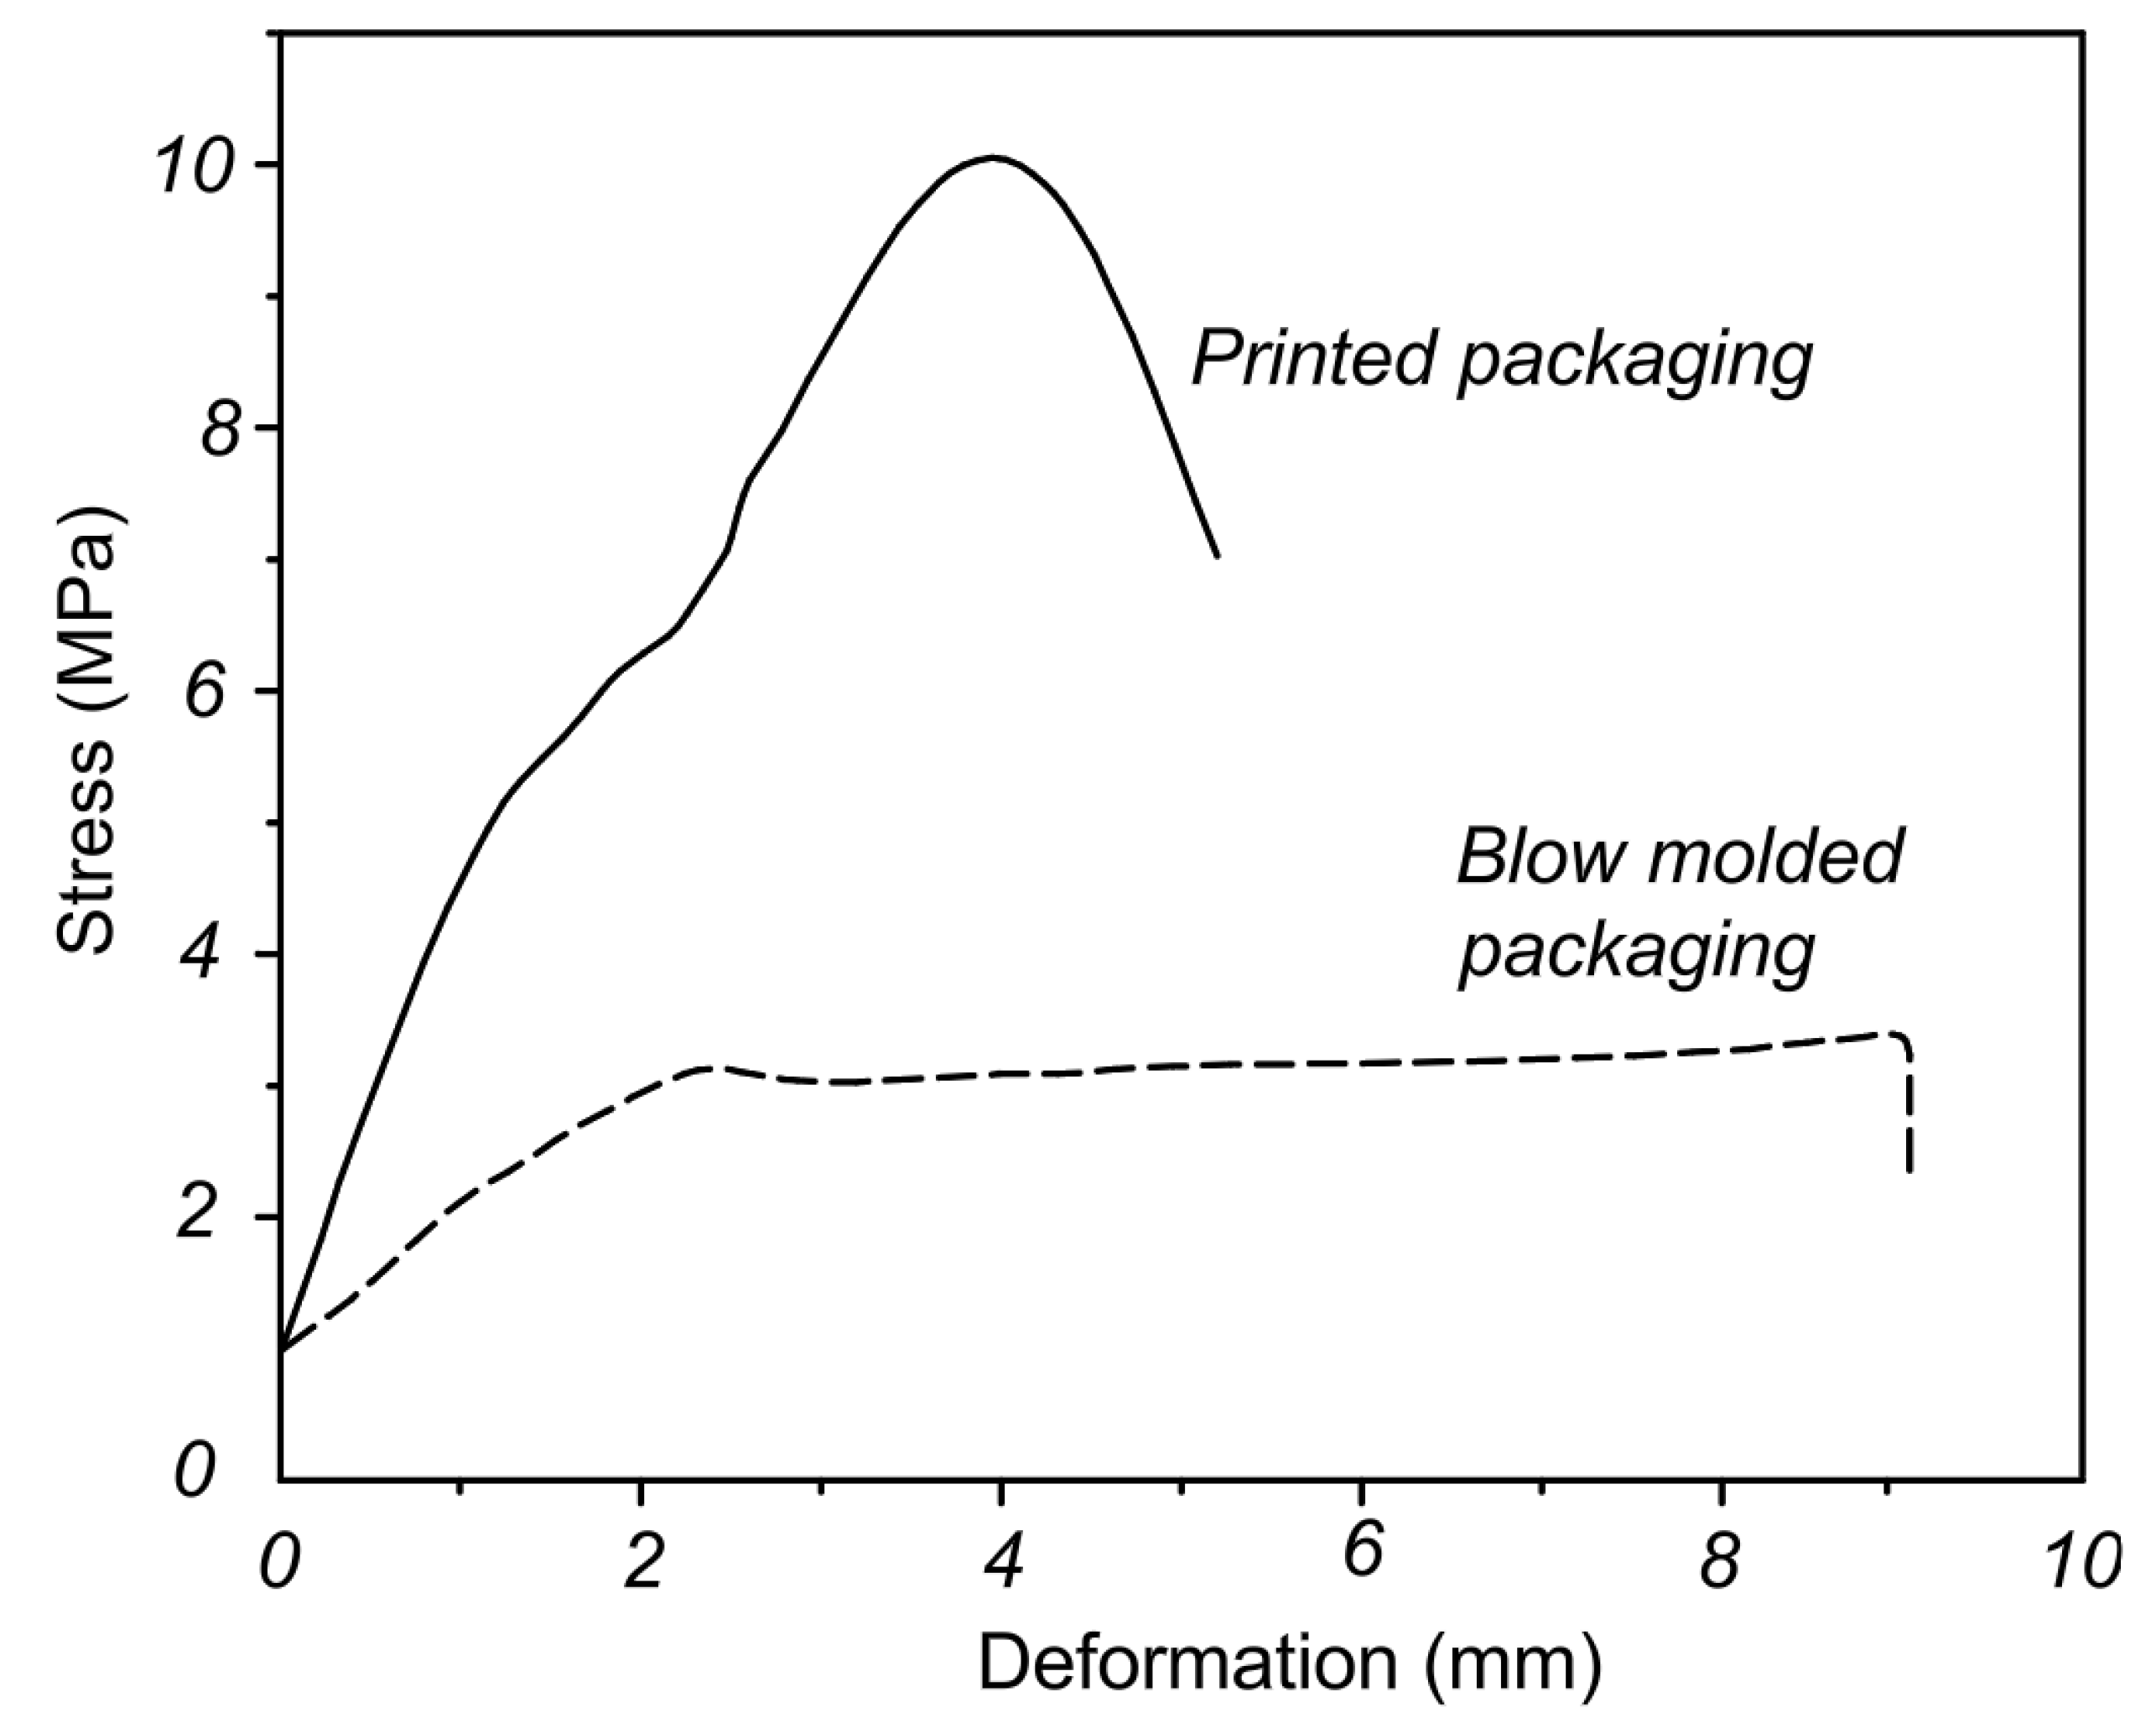
3.2. Compression Evaluation

The compression tests revealed physical changes in the containers due to the applied load on each body. Table 7 presents the test conditions and the resulting values for container height and thread diameter from a single compression test conducted on both the printed and blow-molded containers.
Figure 12 illustrates the stress–strain curves obtained from compression tests performed on the containers manufactured via the two distinct processes. Notably, the container produced through printing exhibits superior strength compared to the original container fabricated using the blow molding extrusion process. This enhanced resistance is further evidenced by its greater rigidity, demonstrated by a lesser degree of deformation under increased tensile stress.
The deformation in the 3D-printed container is evident at the base of the thread, as can be seen in Figure 13a, due to the modification of the curvature radius and container section, and the presence of reinforcements in the body, which leads to collapse at the base of the joint between the base and the body. In the blow-molded container, the deformation is distributed throughout its body due to its constant thickness and lack of reinforcements from its manufacturing process.

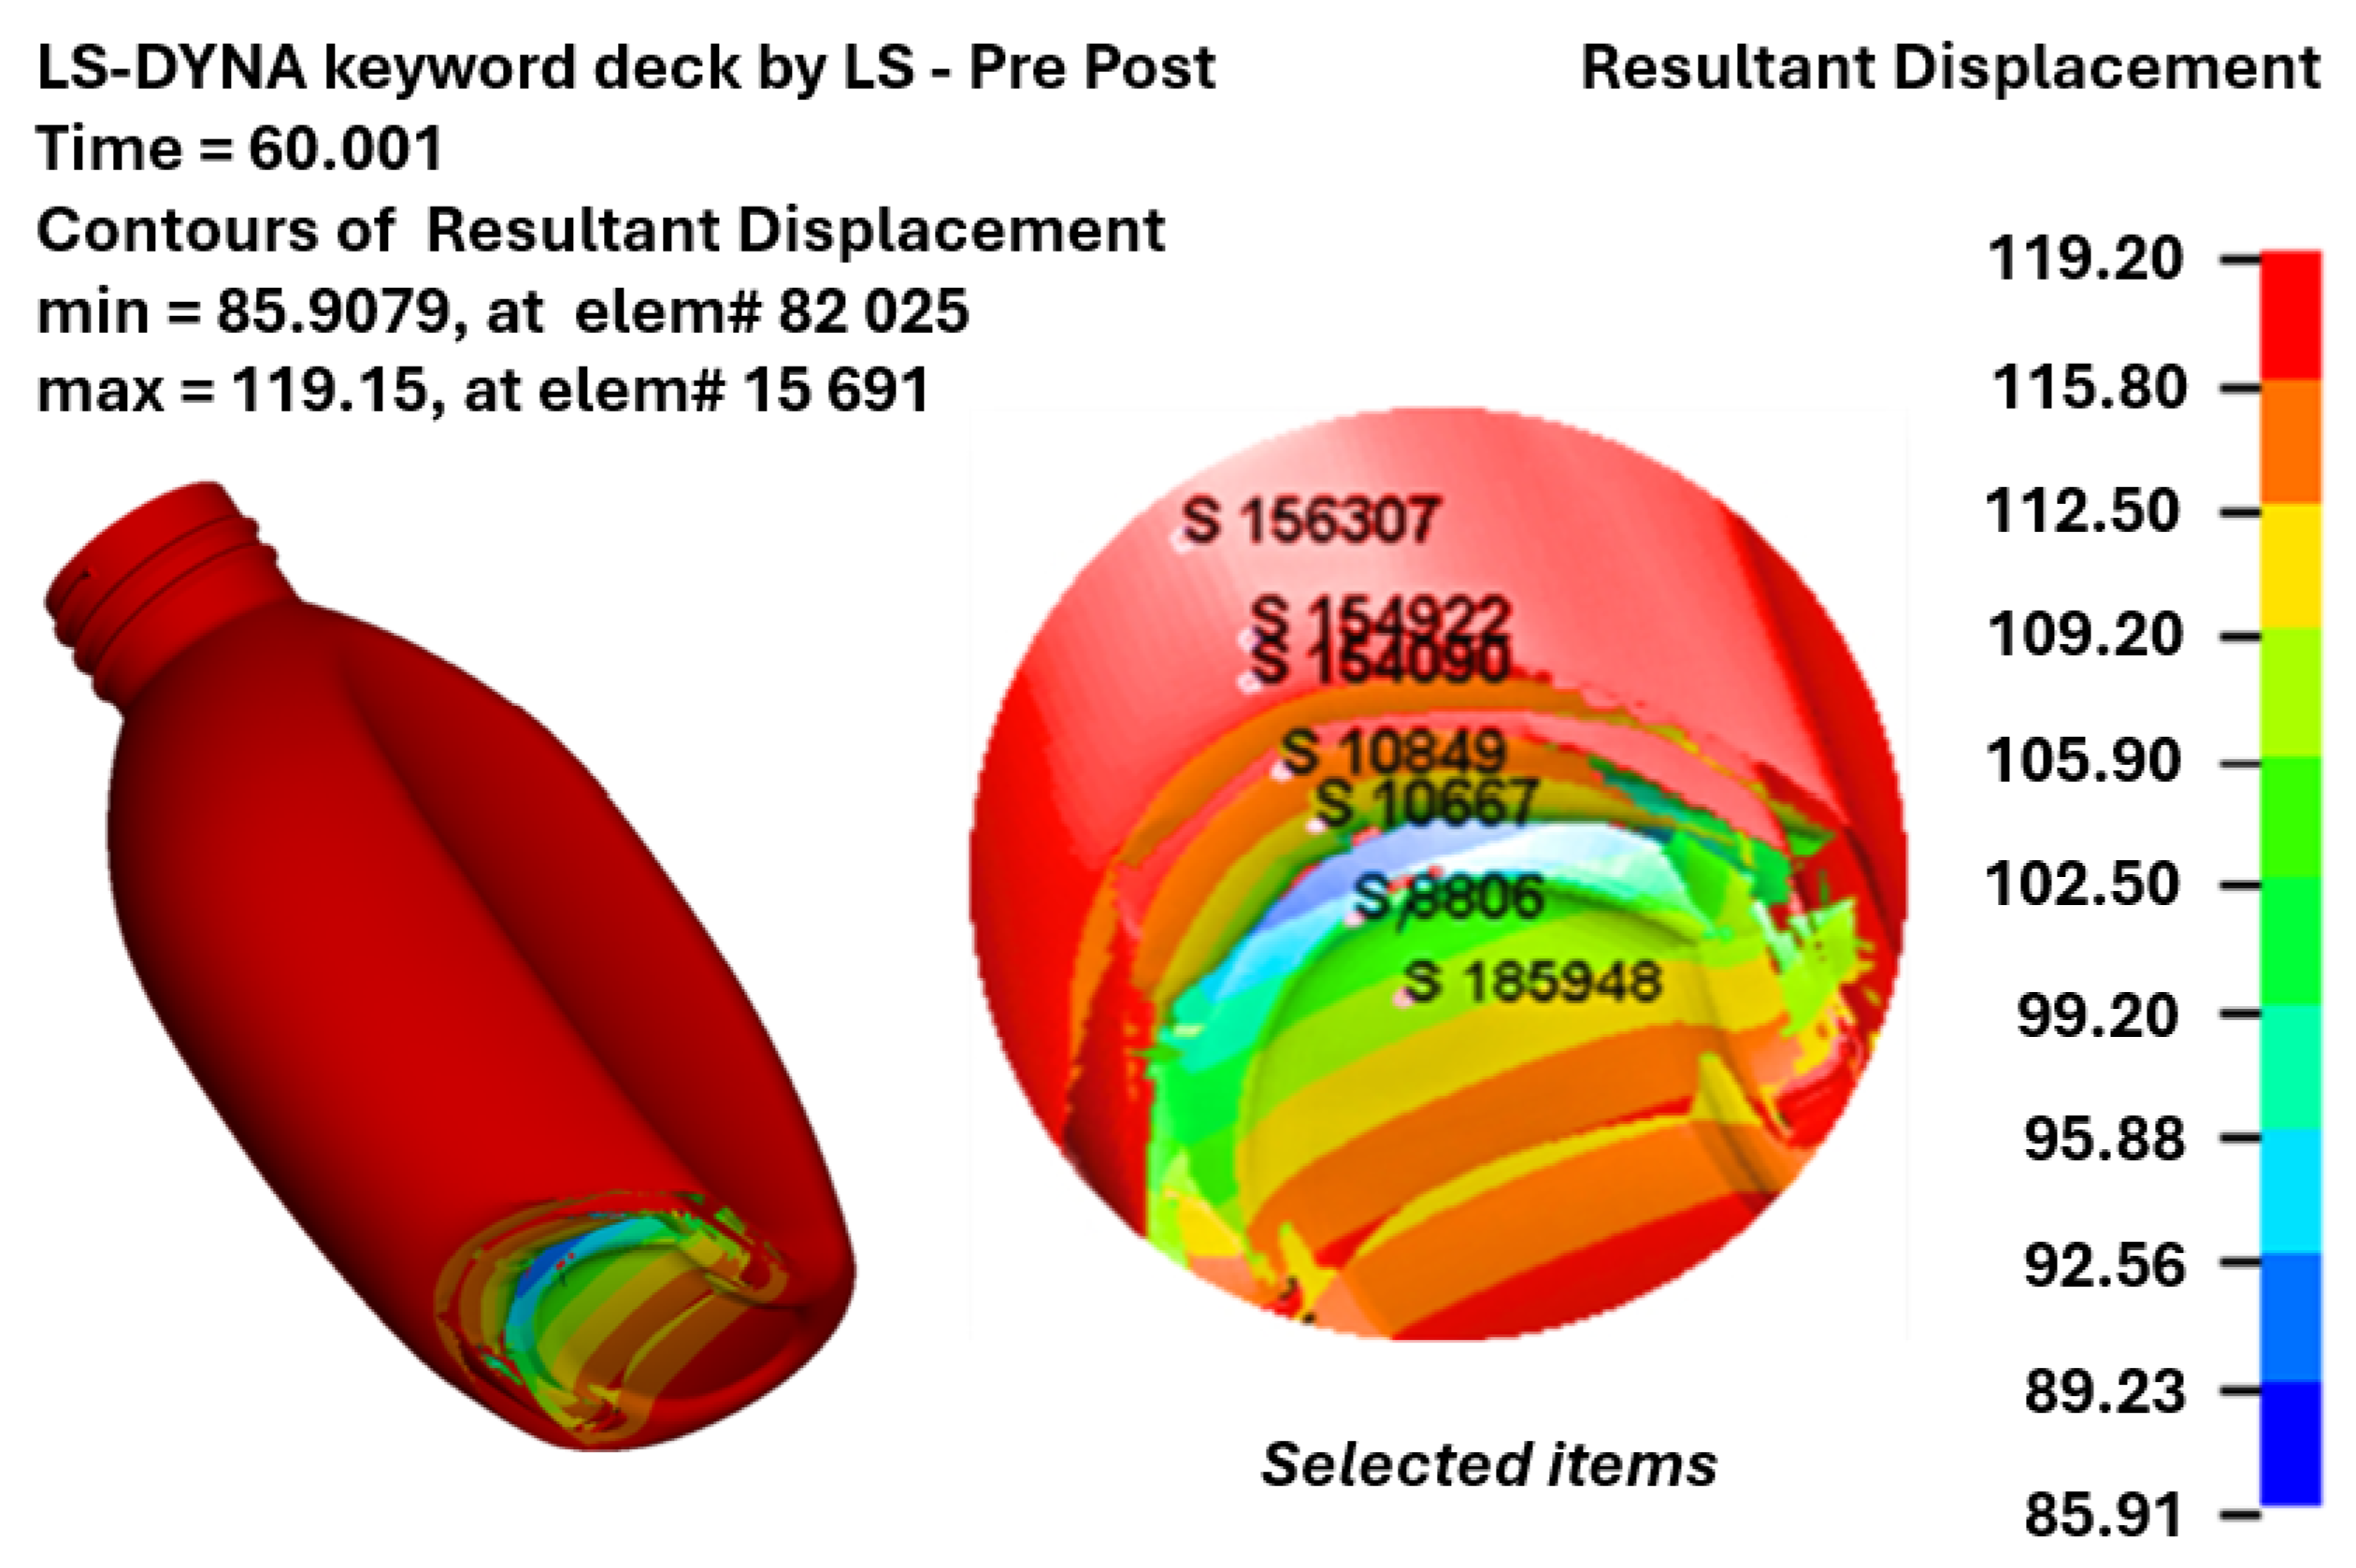
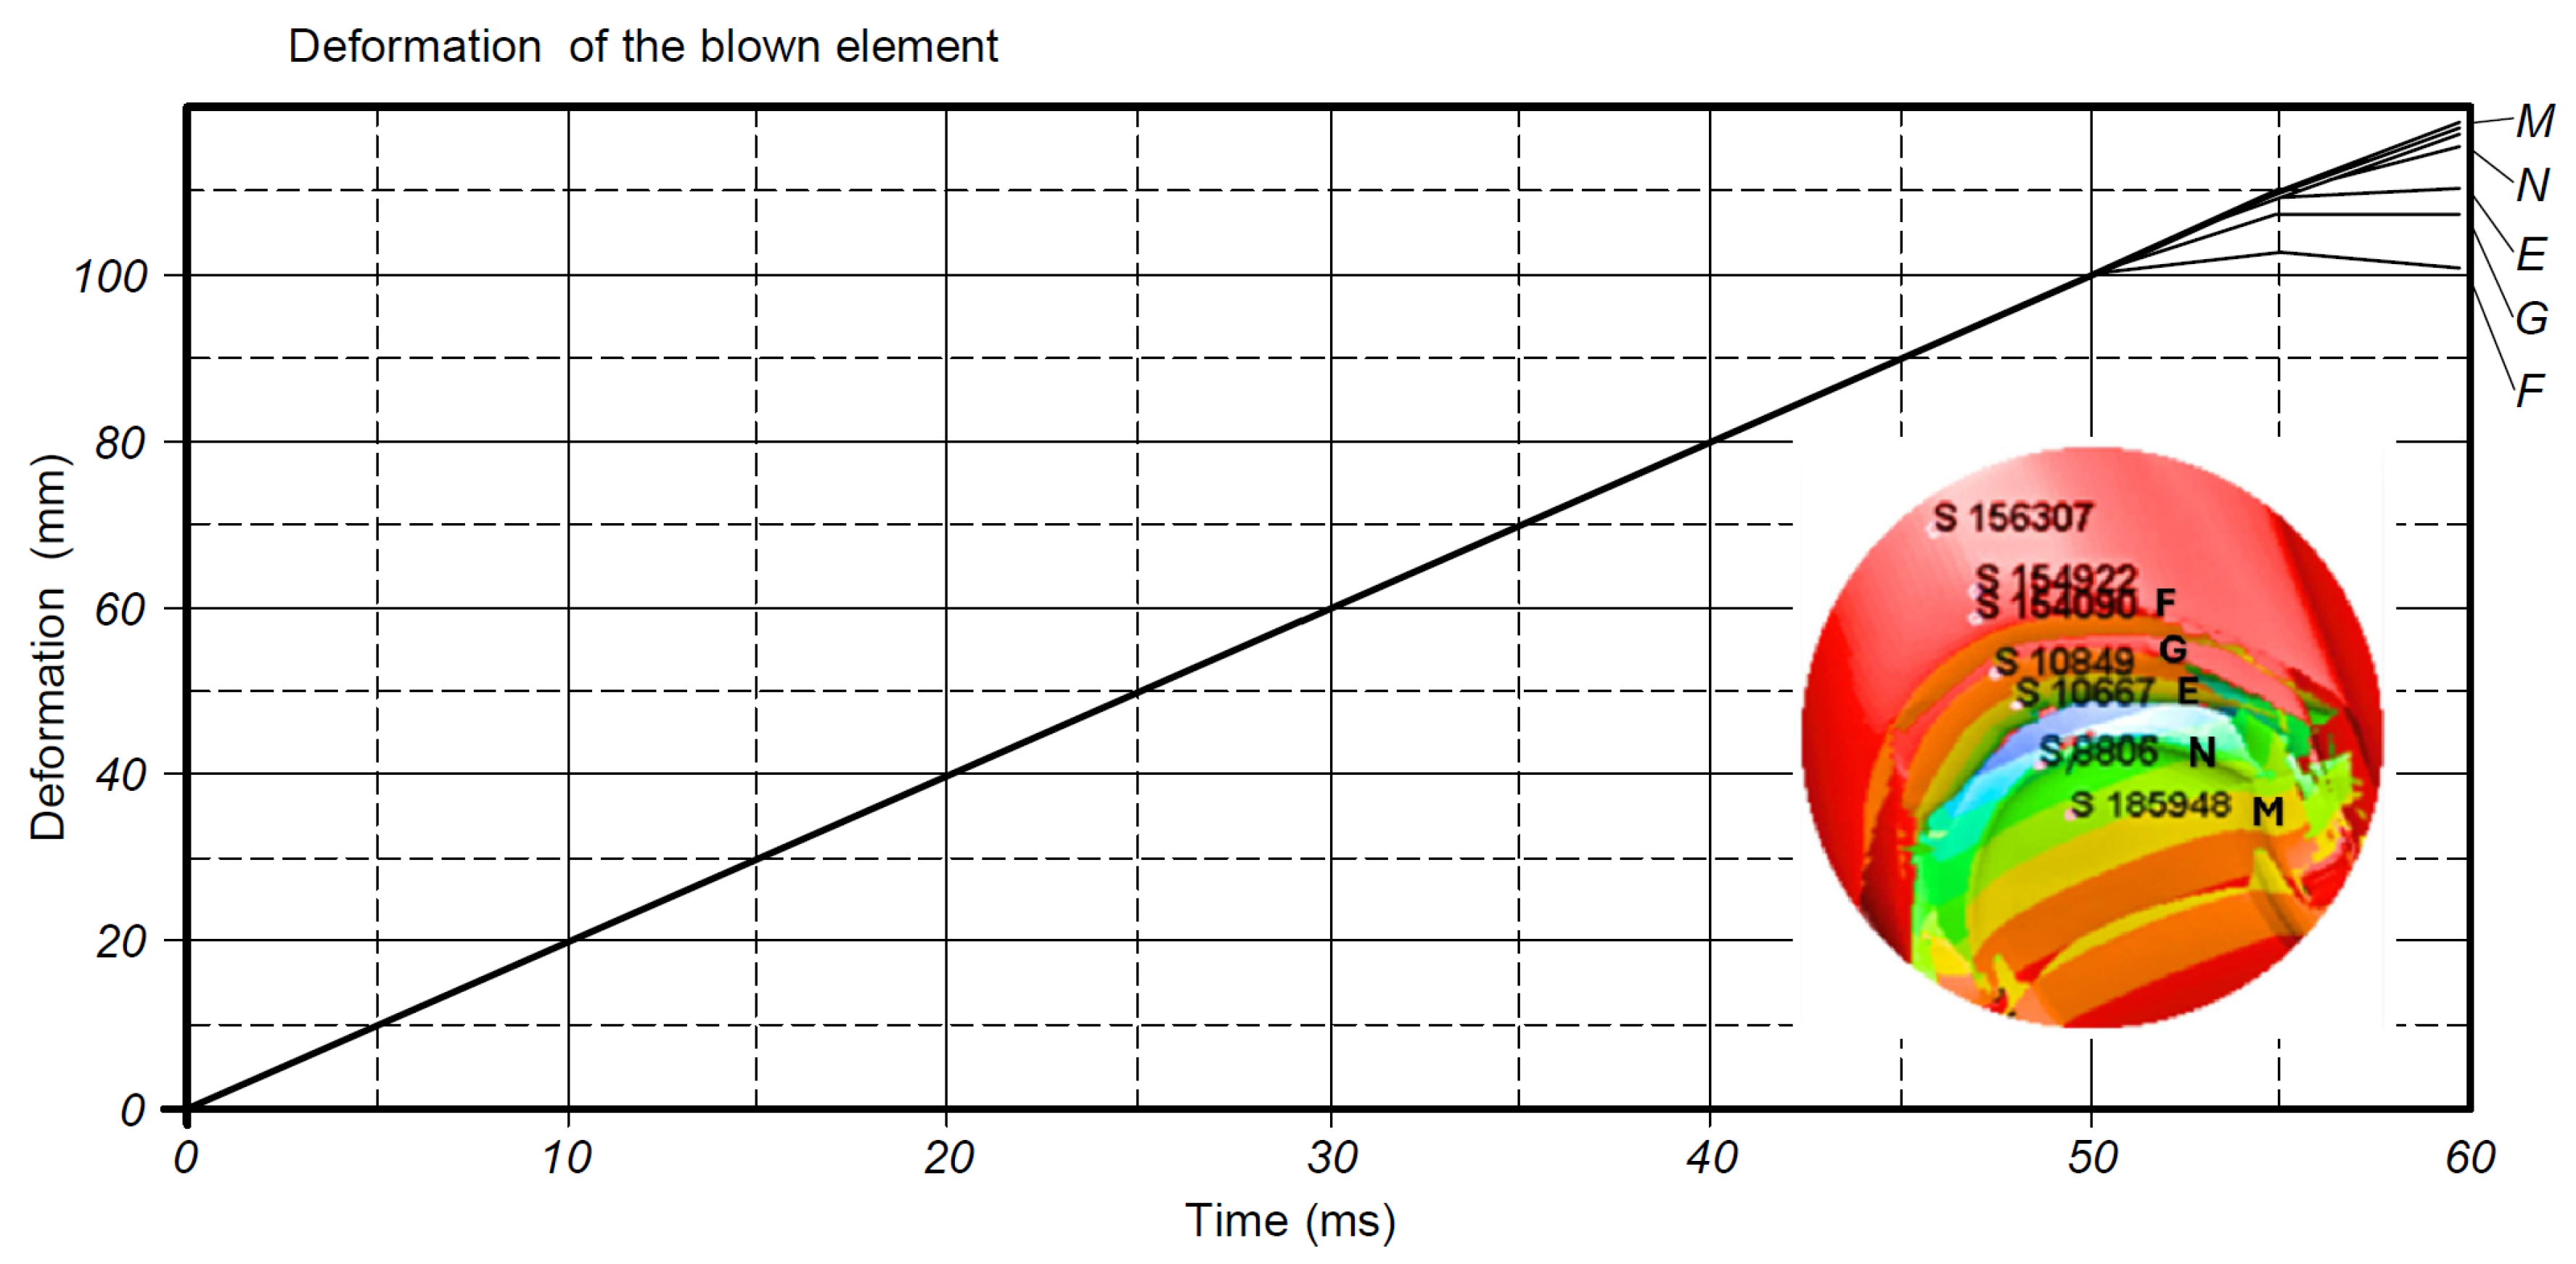
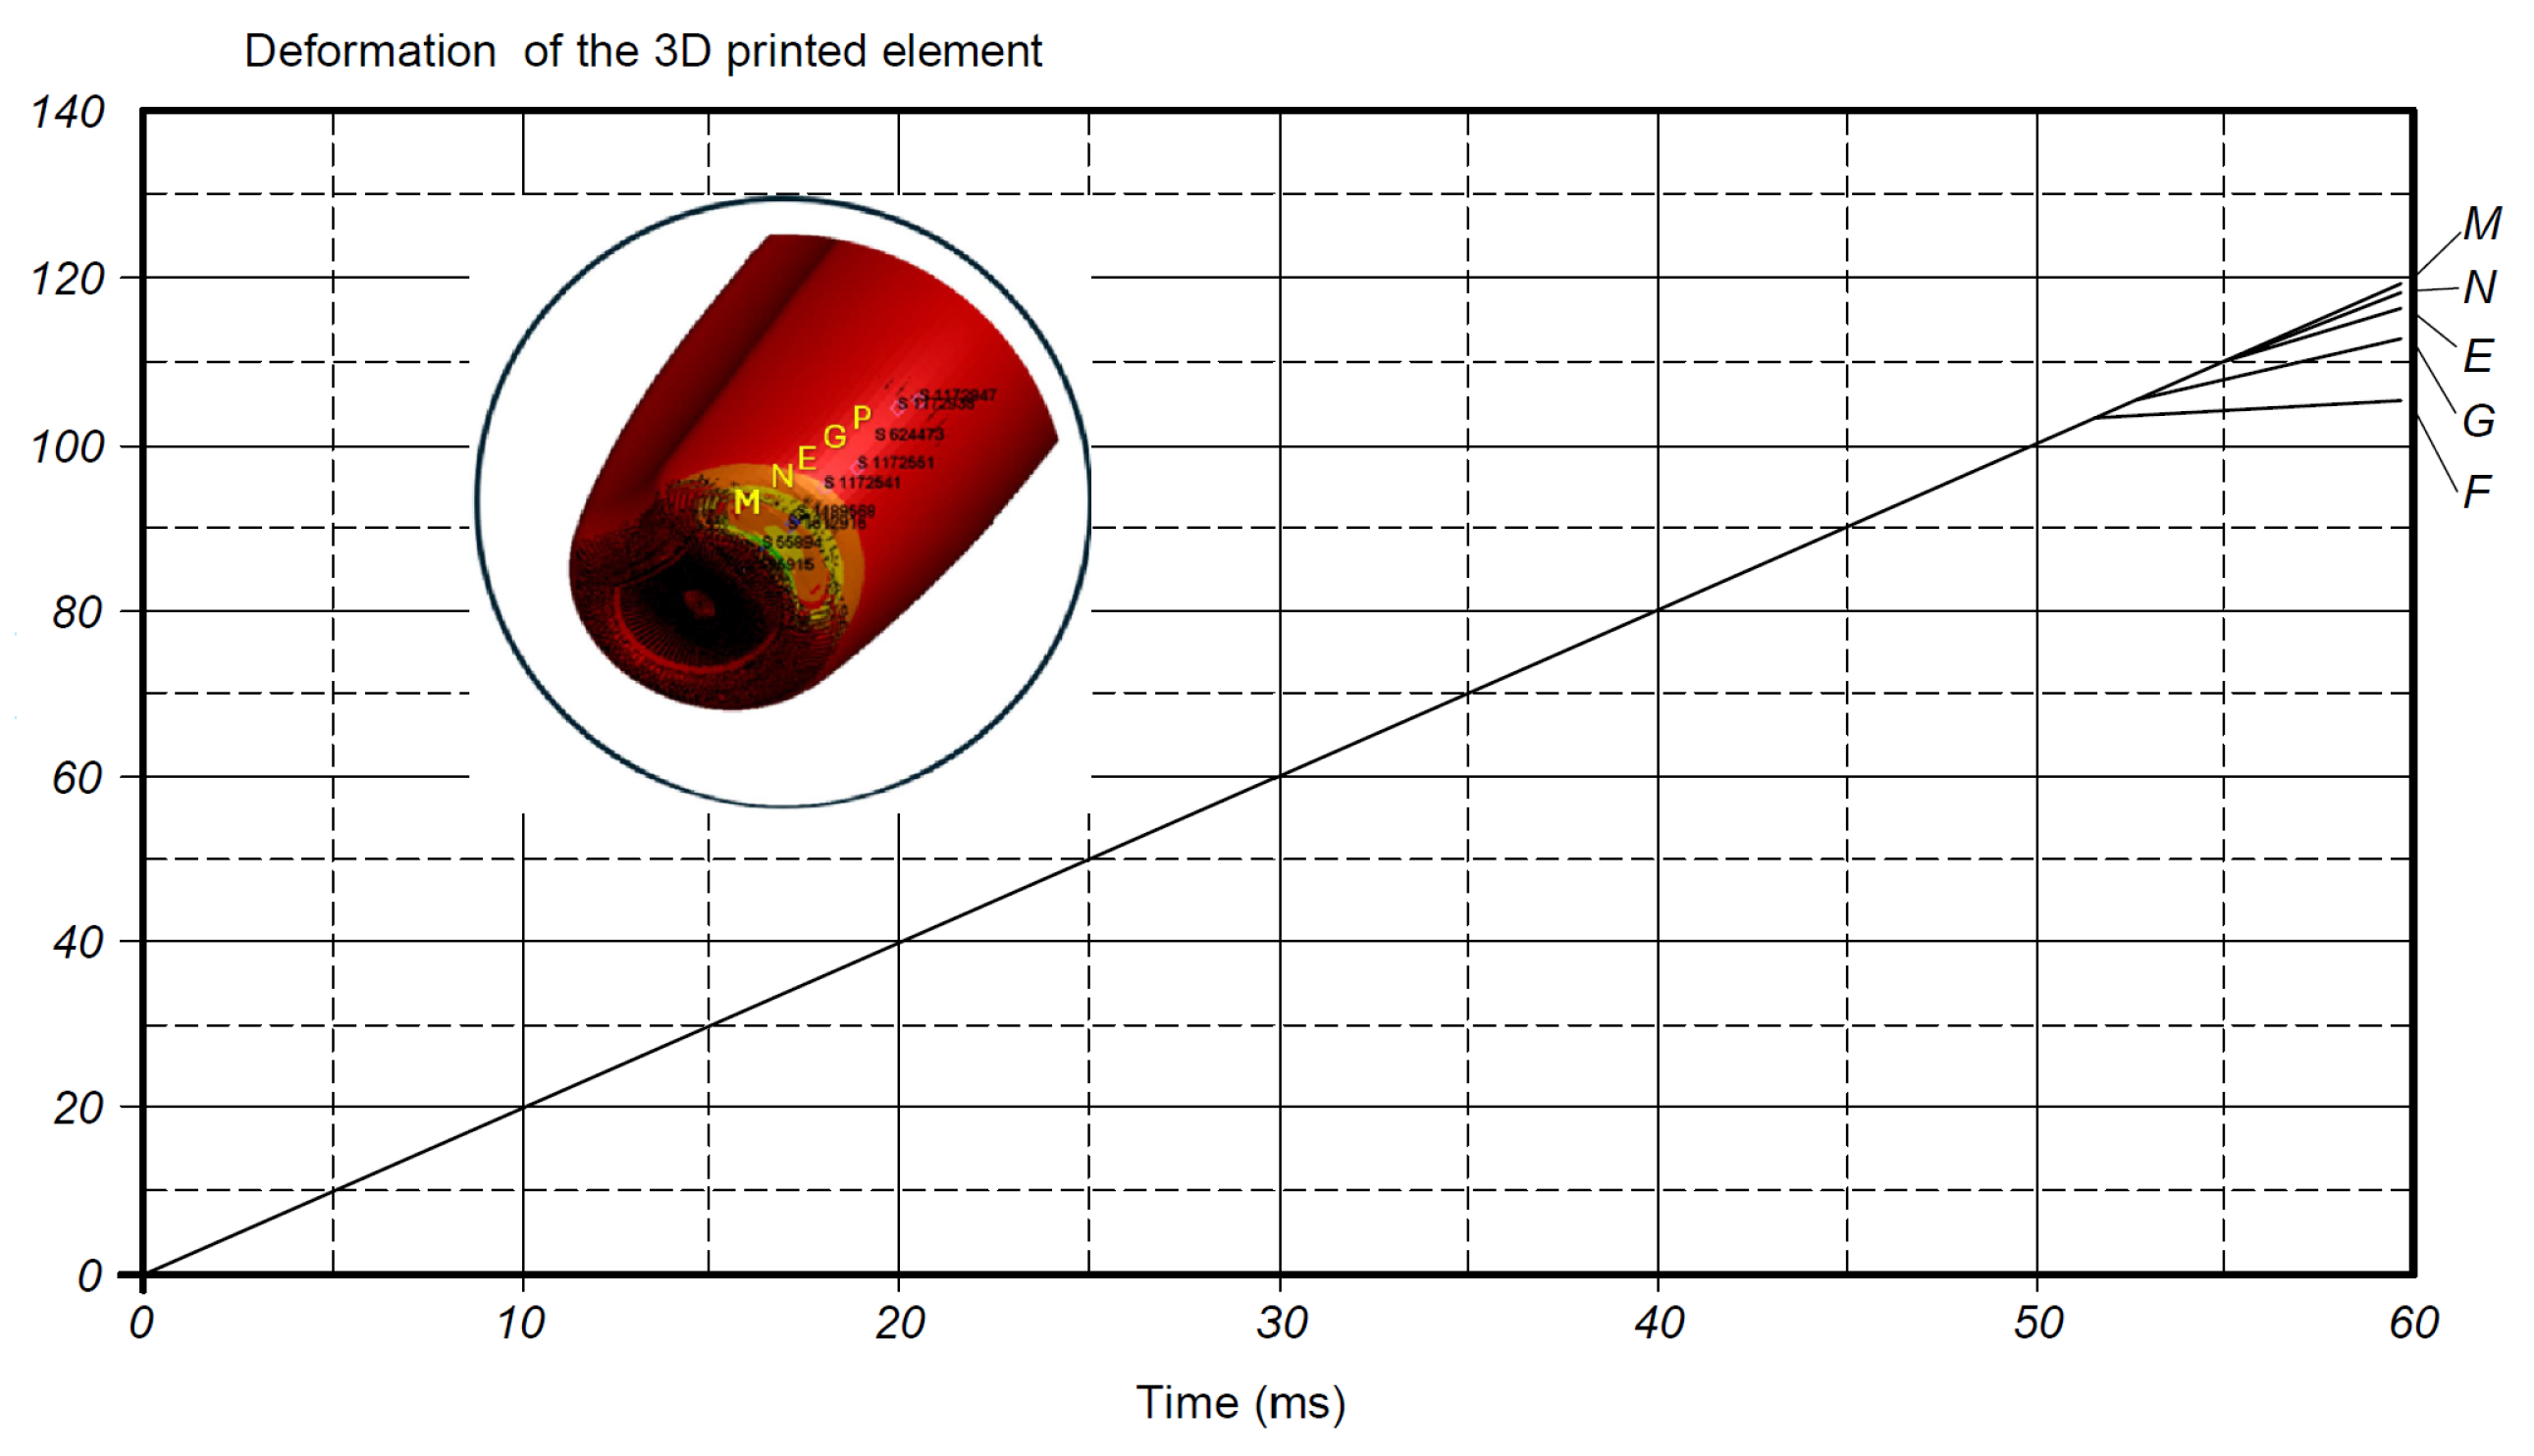
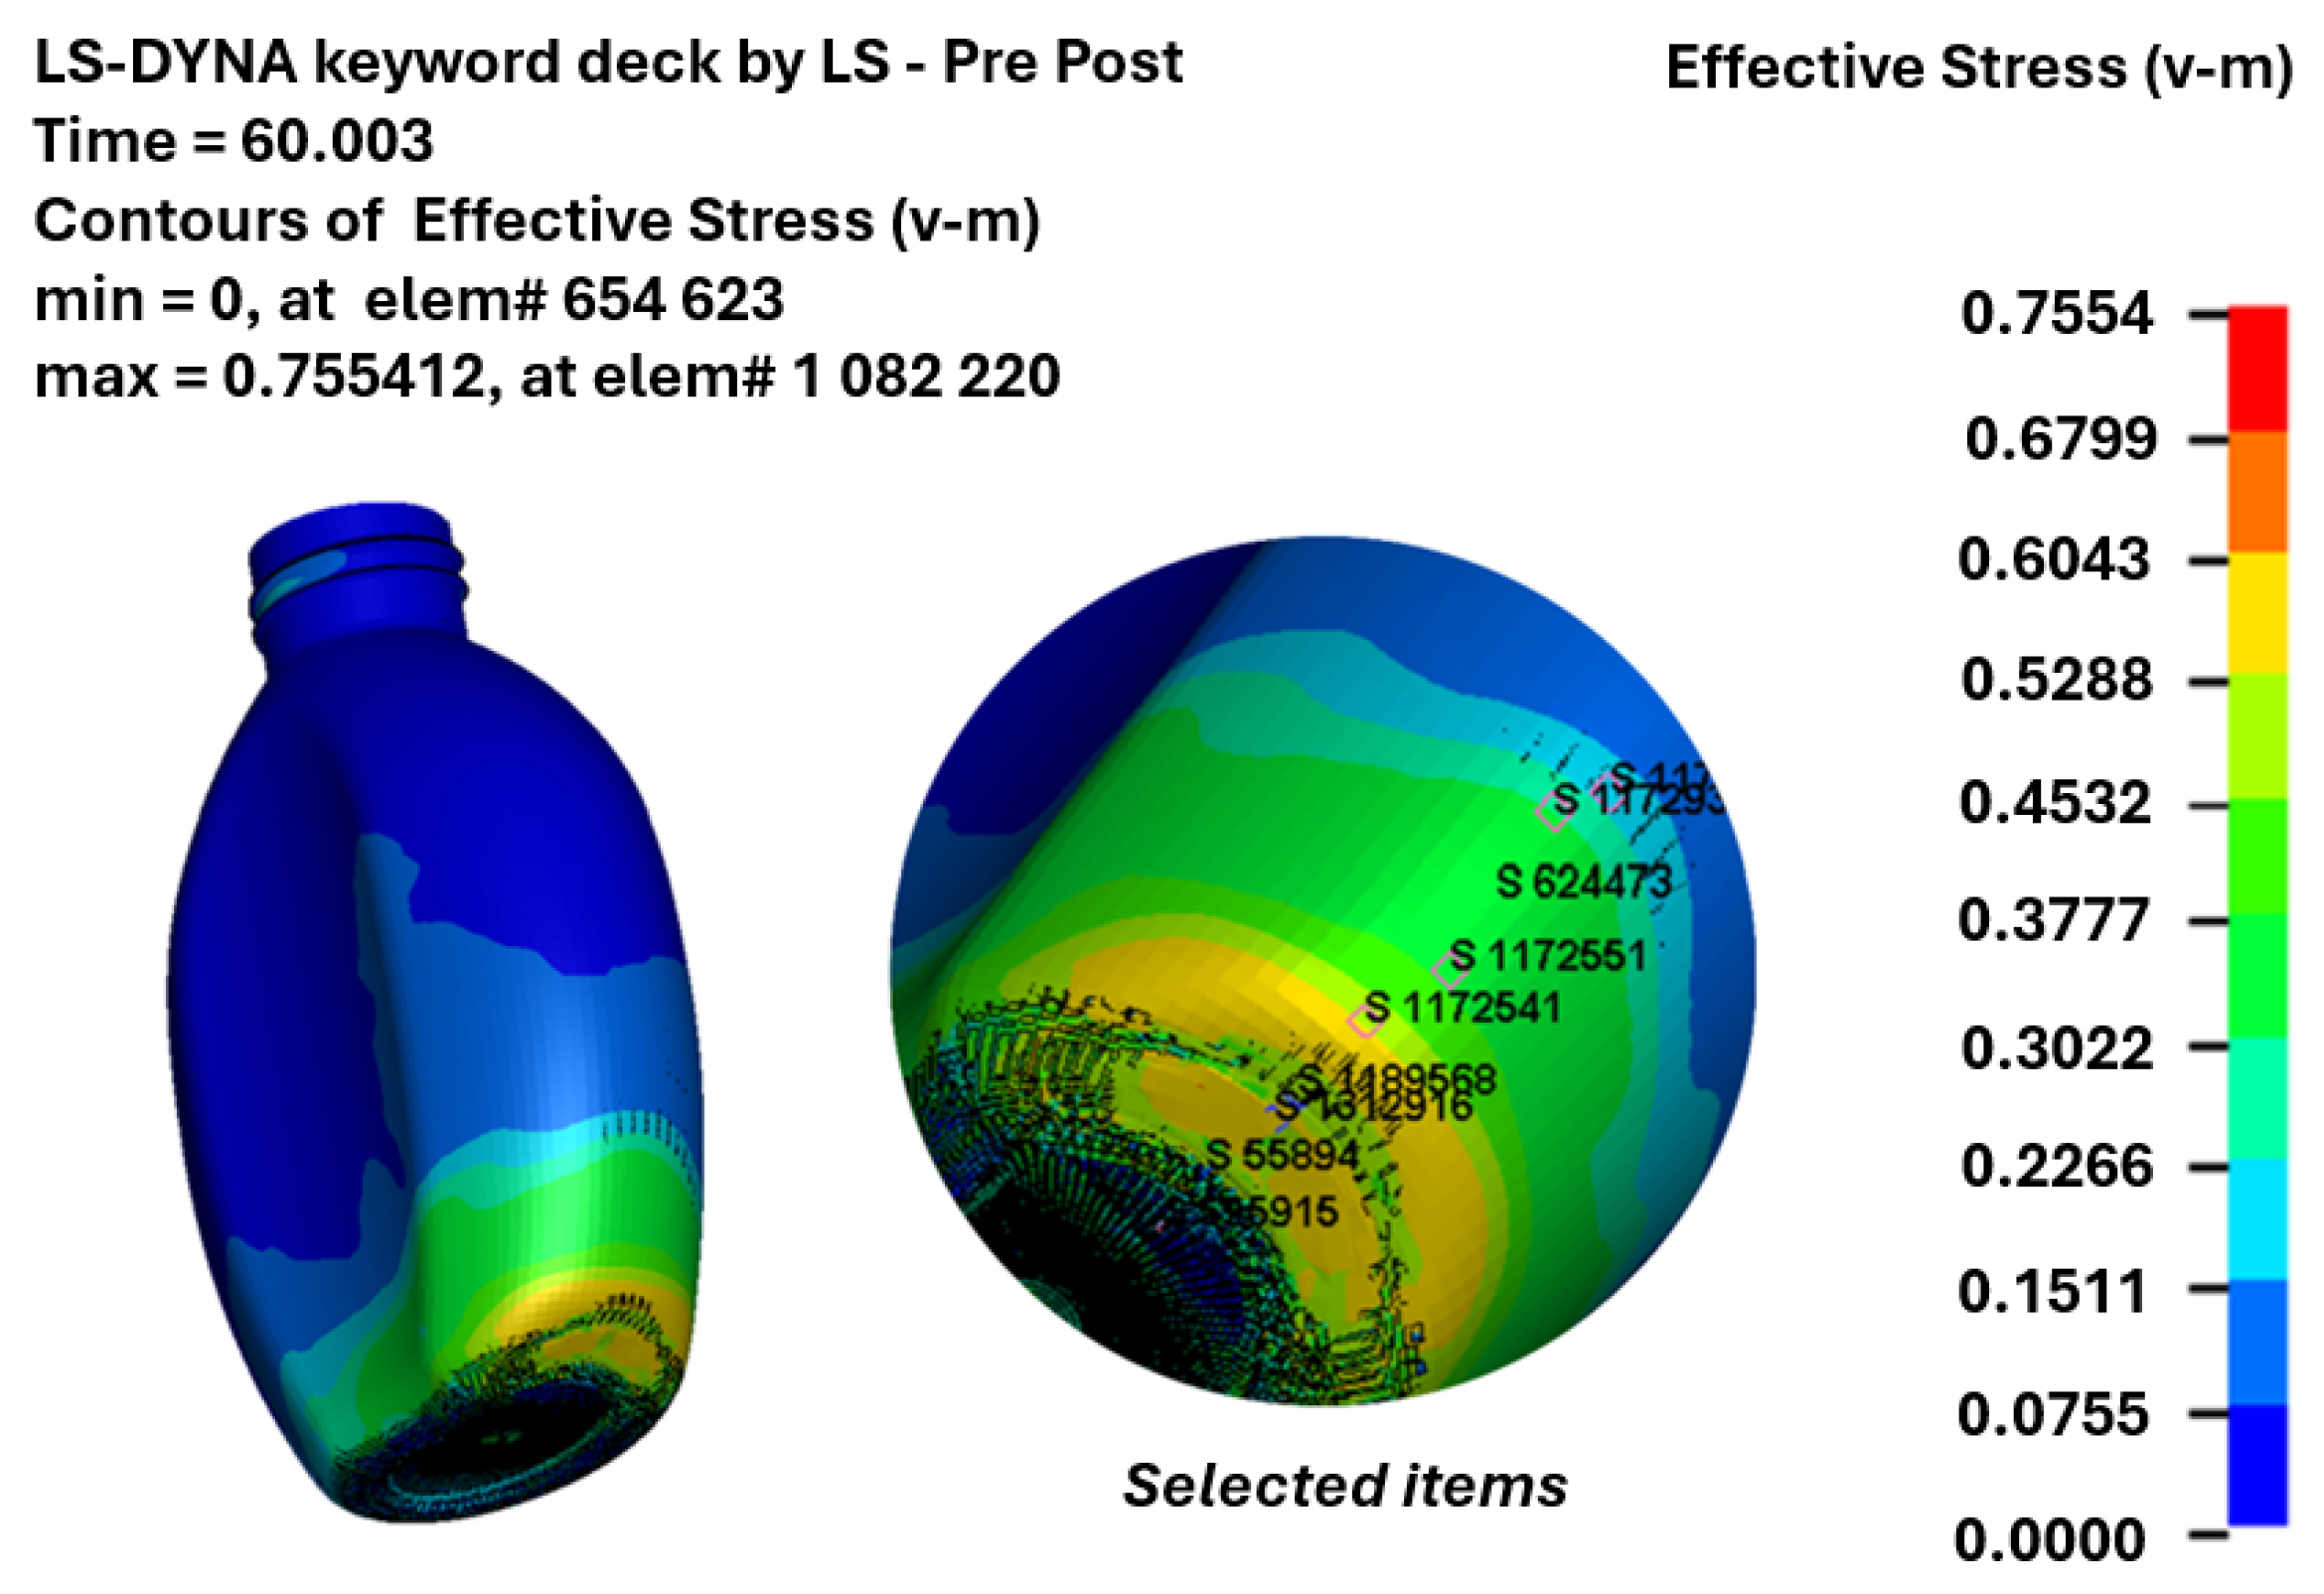
3.3. Impact Resistance Evaluation

For the finite element impact resistance evaluation, the mesh quality was established, where Figure 14 presents an average Jacobian value of 0.8, obtained between a minimum value of 0.6 and a maximum of 1, with a percentage of invalid elements of 0.00447%.
The impact results obtained through simulation of the container manufactured by the blow molding process are observed in Figure 15, which shows the points where measurements were taken to determine the deformation behavior under the applied impact.
Each letter M, N, E, G, and F represents a finite element, specifically denoted by the letter S in the impact zone. Figure 16 shows the deformation trend as a function of time, reaching an approximate maximum value of 119.20 mm at 60 ms.
The stress values generated by the impact on the blow-molded container are observed in Figure 17, along with the selected elements for measurement, yielding maximum values of 0.7391 MPa. The effective stresses are presented from 45 ms after the container’s free-fall release, as observed in Figure 18 in the finite elements analyzed within the impact zone.
In Figure 19, the deformation values in the 3D-printed container under impact generated by free fall are observed, along with the elements where measurements were taken and the results were obtained.
The deformation behavior of the 3D-printed container as a function of time is observed in Figure 20, reaching an approximate deformation of 120.3 mm.
The 3D-printed container exhibits a maximum stress of 0.7554 MPa as a result of the generated impact. The elements where the measurement was performed and the behavior are observed in Figure 21 and Figure 22, respectively.
Table 8 presents the deformation and stress values of the containers, where it can be observed that the percentage difference between the deformation values is 0.91% and the stress values is 2.15%, corresponding to 1.1 mm in displacement and 0.01986 MPa in stress.
Figure 23 and Figure 24 illustrate the internal energy values obtained during the impact test. The blow-molded container exhibits a value of 4 × 10³ N·mm, while the 3D-printed container shows a value of 1.05 × 10³ N·mm. Thus, the 3D-printed container demonstrates lower energy absorption during impact.
The internal energy results obtained from the impact were analyzed over a 60 s period following the initiation of the container’s free fall.

4. Discussion

Research such as that conducted by Fadiji [22] and Hammou [23] indicates that finite element analysis of container structures is a technique employed by designers to validate mechanical resistance outcomes against potential physical phenomena that could compromise the container’s integrity. It is widely utilized as an alternative to various experimental tests, which can be time-consuming and often incur significant costs. According to the results obtained, the container manufactured through the blow molding process exhibits similar impact resistance properties in free-fall tests when compared to the 3D-printed container. However, these values are acceptable considering that 3D printing presents a viable alternative for very low-volume production, where the traditional blow molding process is prohibitively expensive.
The stress and strain levels obtained from the simulations suggest similar values, given that the analysis remains within the elastic zone. However, the impact analysis operates within the elastoplastic zone. Here, the blow-molded bottle will exhibit greater energy absorption due to its solid structure of cross-linked polymer chains, which are characteristic of its manufacturing process. In contrast, the printed bottle was produced via fused filament deposition with a triangular cross-section, imparting greater stiffness to the printed body and resulting in lower energy absorption when subjected to impact simulation.

5. Conclusions

We conclude this study with the following points:
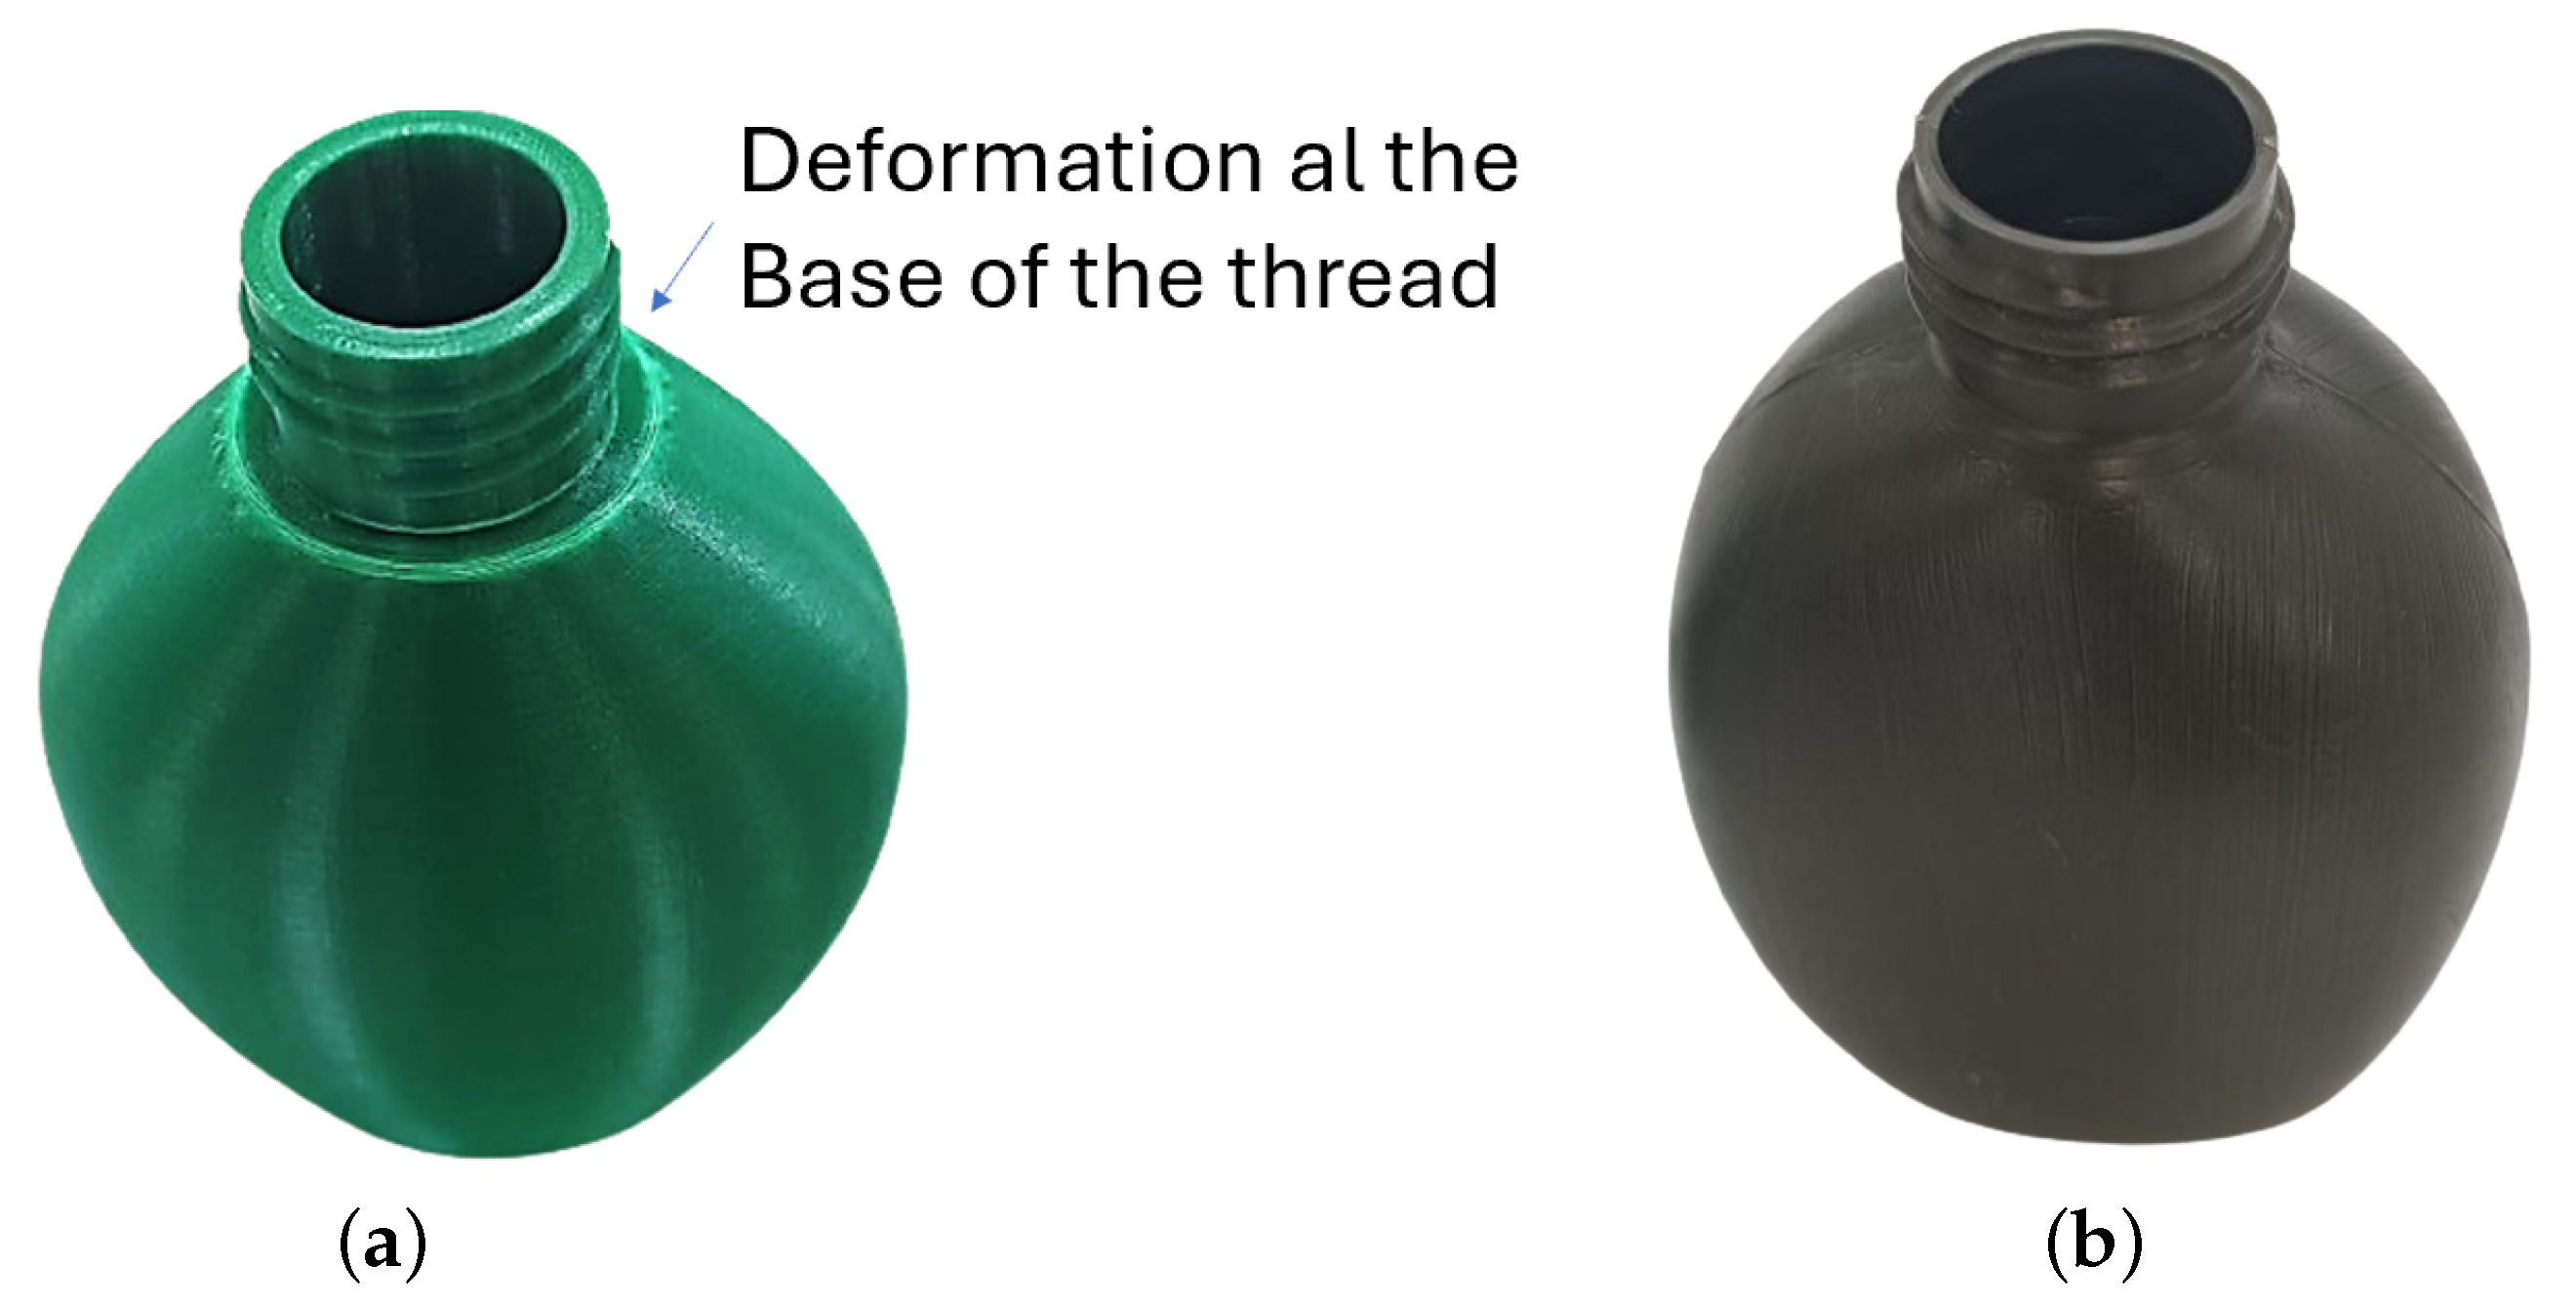
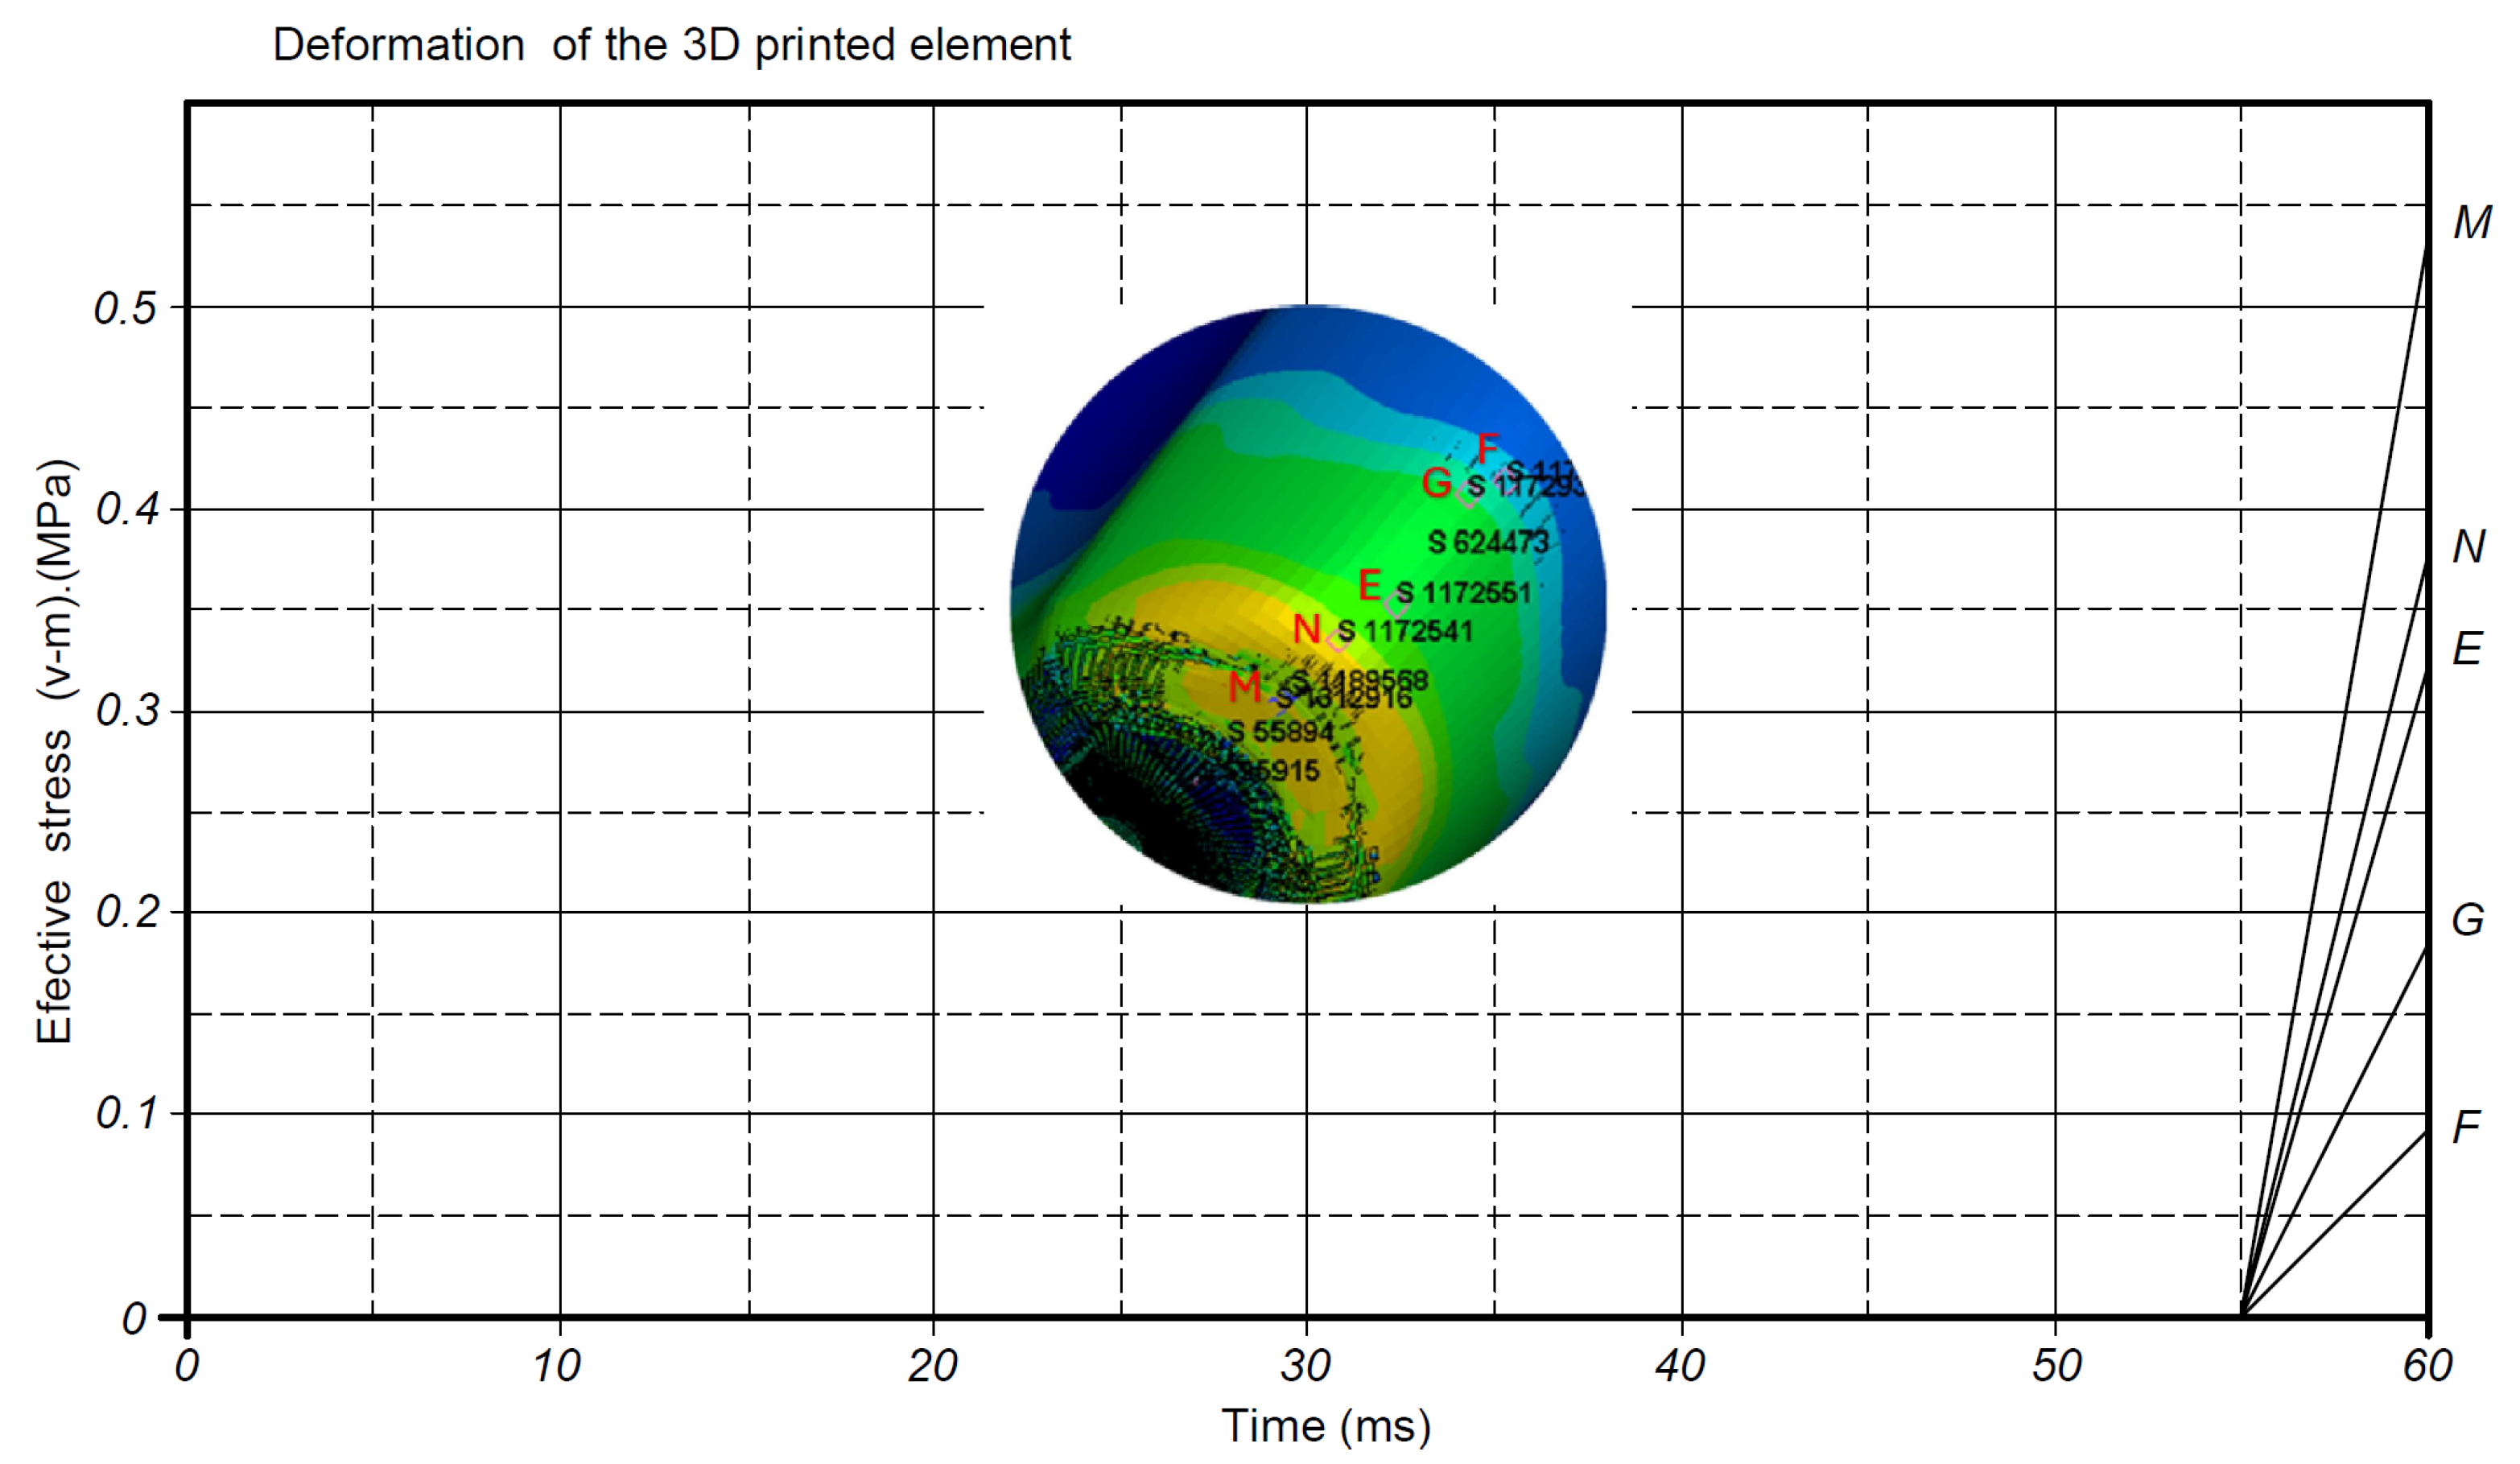
  • By analyzing the results obtained from the finite element compression and impact resistance tests conducted on two containers manufactured using two different techniques, namely blow molding and 3D printing, it is concluded that the 3D-printed container withstands a load of 10.497 kN—more than double the resistance of the blow-molded container. Furthermore, the additively manufactured container exhibits greater rigidity, evidenced by an approximate deformation of 4 mm caused by the applied force before fracture occurs at the thread base.
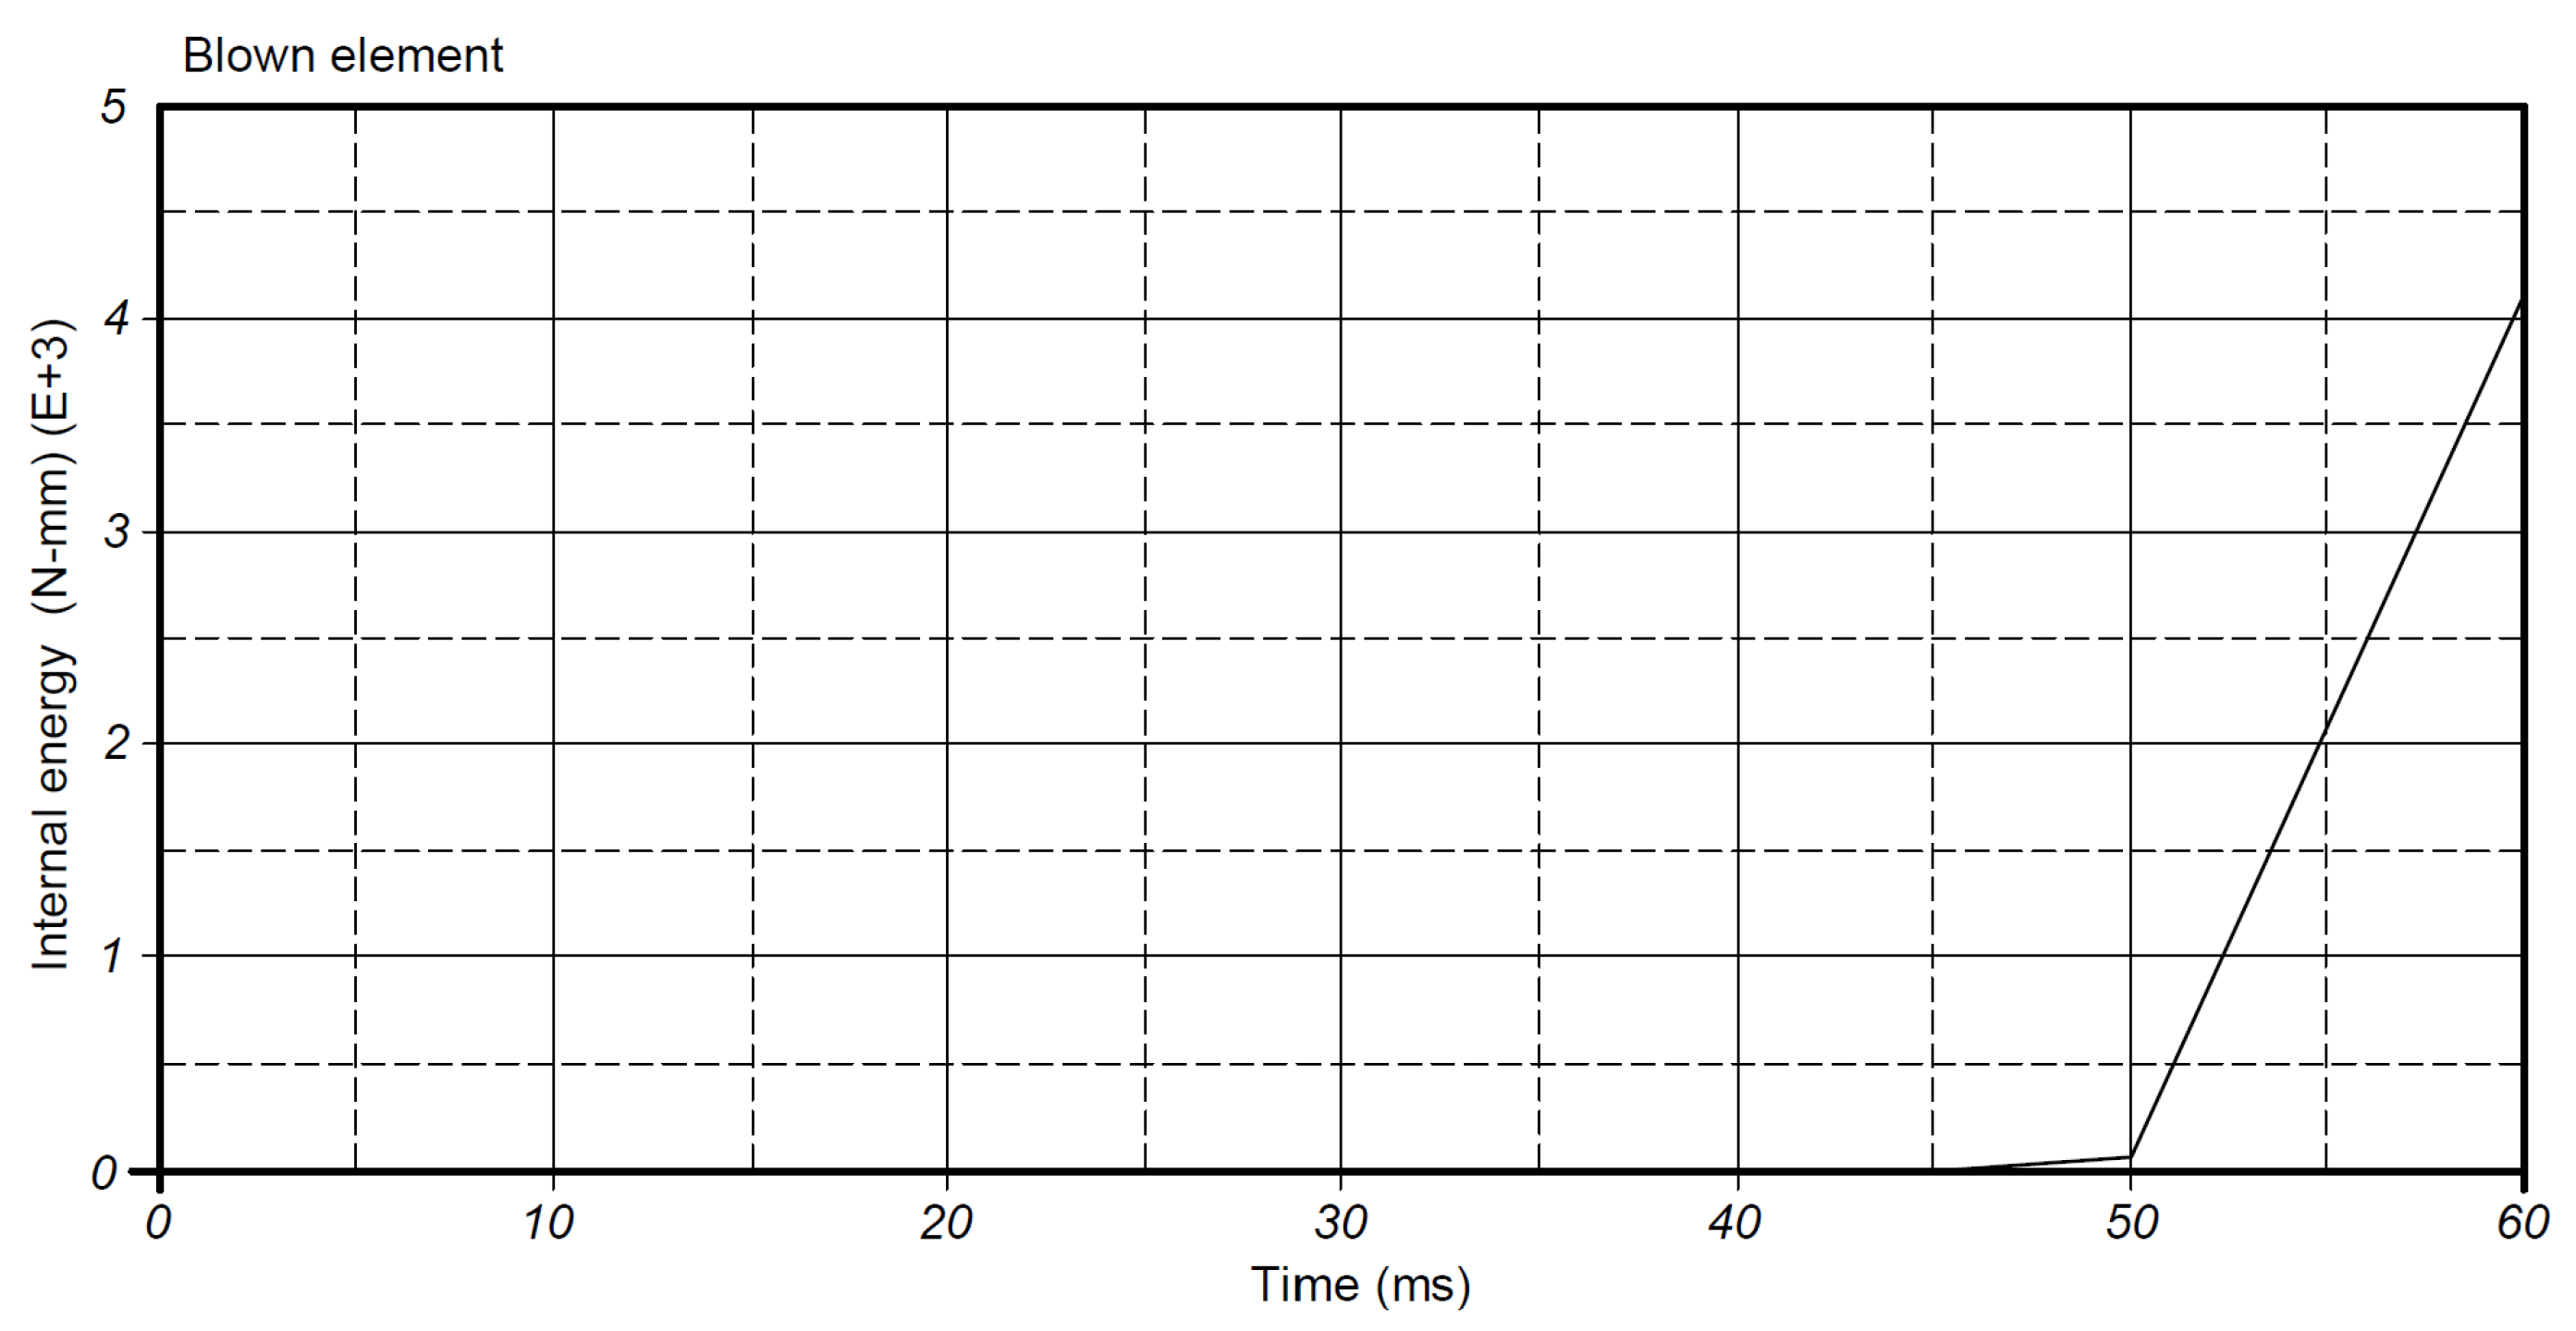
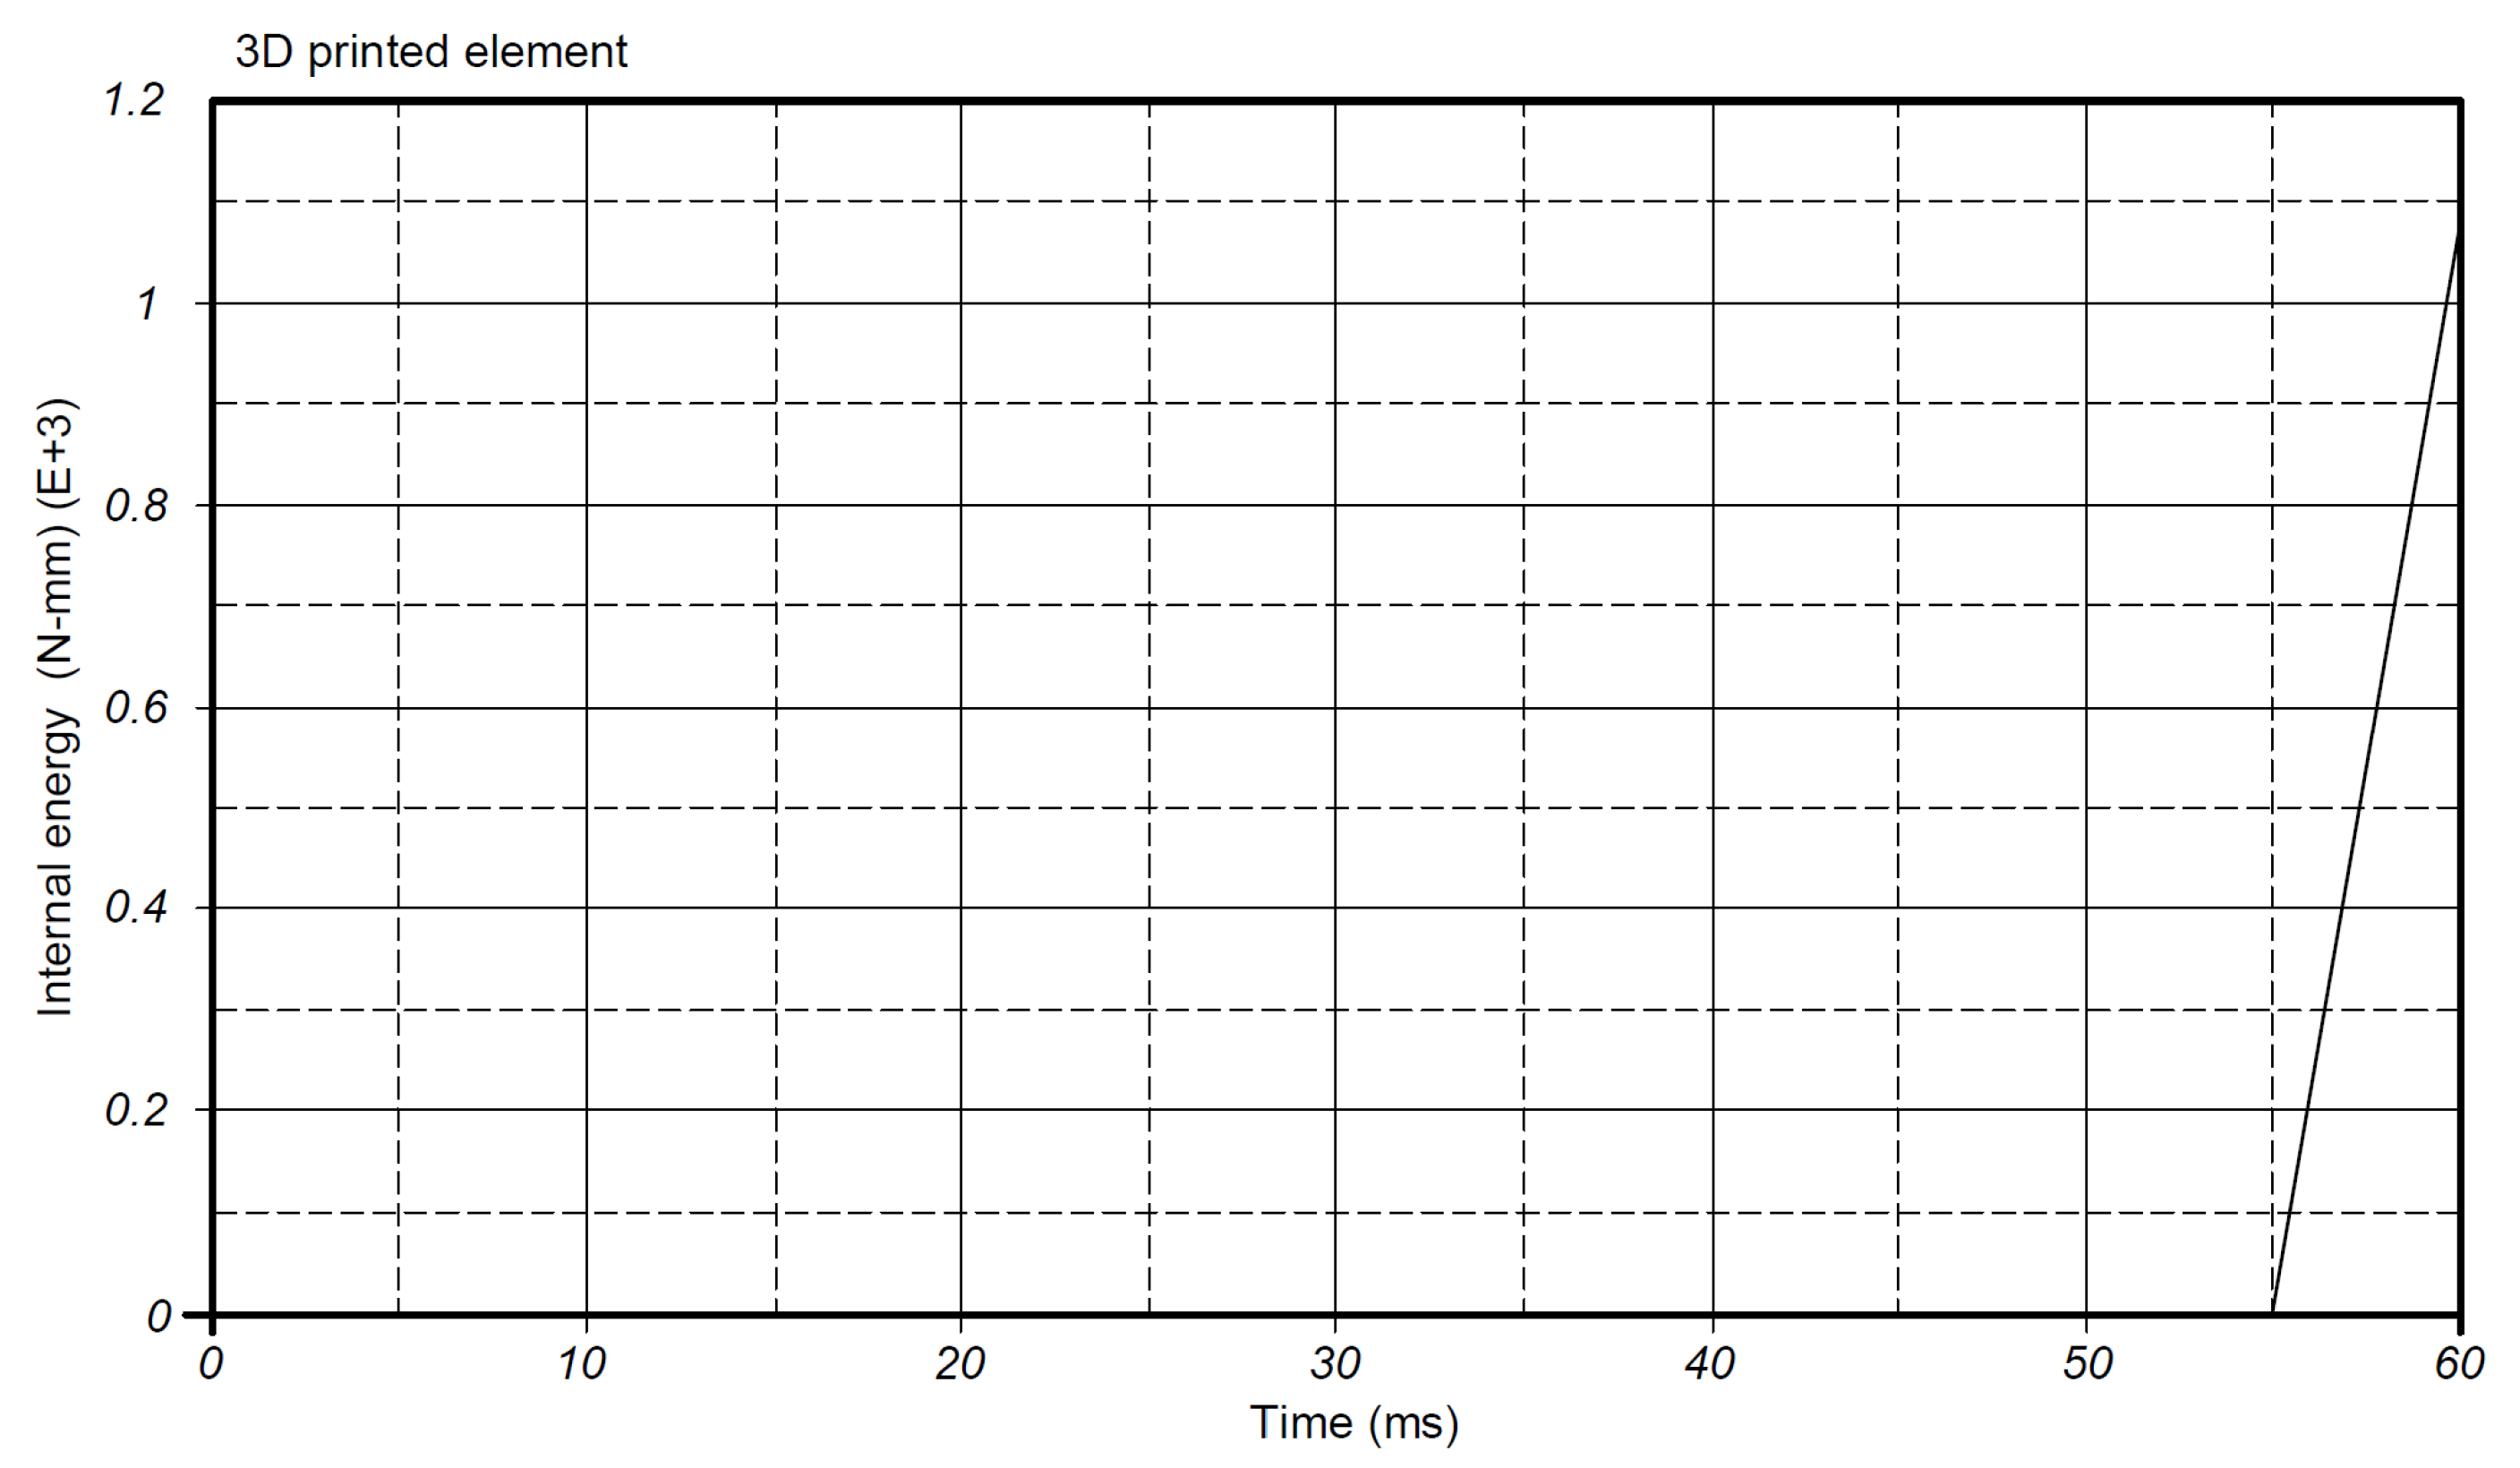
  • The impact resistance results obtained from the finite element analysis of the container drop tests indicate minor variations between the two containers: 0.91% in deformation and 2.15% in stress. The 3D-printed object exhibits greater rigidity, as reflected in the deformations and stresses observed. Consequently, the internal energy absorption value of the blow-molded container, at 4 × 10³ N·mm, suggests higher elasticity in its structure, leading to greater deformation. It is noted that the finite element analysis did not incorporate more complex loading conditions and failure modes, which could potentially yield a more profound understanding of the structural integrity of the 3D-printed containers.
  • Future research directions entail broader comparative analyses of various materials and 3D printing techniques against traditional manufacturing processes, optimizing printing parameters, and subjecting the containers to long-term durability testing under the environmental phenomena to which they are exposed. Consideration should also be given to exploring container design adaptations for specific applications, evaluating how design modifications impact performance and functionality.

Author Contributions

L.M.L.-L.: Conceptualization, objective formulation, formal analysis, and writing. G.M.: Methodology and formal analysis. C.P.-Z.: Software. J.B.: Software. J.L.-Q.: Writing and data curation. M.A.-P.: Resources and formal analysis. All authors have read and agreed to the published version of the manuscript.

Funding

This research was funded by Universidad Politécnica Salesiana and the APC was funded by Universidad Politécnica Salesiana.

Data Availability Statement

Data is contained within the article.

Conflicts of Interest

The authors declare no conflicts of interest.

References

  1. Groover, M. Polymers. In Fundamentals of Modern Manufacturing: Materials, Processes, and Systems; John Wiley & Sons Publishing House: Hoboken, NJ, USA, 2010; pp. 185–186. [Google Scholar]
  2. Marsh, K.; Bugusu, B. Food packaging—Roles, materials, and environmental issues. J. Food Sci. 2007, 72, 39–55. [Google Scholar] [CrossRef] [PubMed]
  3. Turng, L. Special and emerging injection molding processes. J. Inject. Molding Technol. 2001, 5, 160–179. [Google Scholar]
  4. Swift, K.; Booker, J. Manufacturig Process Selection, 4th ed.; Butterworth-Heinemann: Oxford, UK, 2003; pp. 175–179. [Google Scholar]
  5. Altan, T.; Lilly, B.; Yen, Y. Manufacturing of dies and molds. CiRP Ann. 2001, 50, 404–422. [Google Scholar] [CrossRef]
  6. Hgo, T.; Kashani, A.; Imbalzano, G.; Nguyen, T.; Hui, D. Additive manufacturing (3D printing): A review of materials, methods, applications and challenges. Compos. Part B Eng. 2001, 143, 172–196. [Google Scholar]
  7. Kafle, A.; Luis, E.; Silwal, R.; Pan, H.; Shrestha, P.; Bastola, A. 3D/4D Printing of polymers: Fused deposition modelling (FDM), selective laser sintering (SLS), and stereolithography (SLA). Polymers 2021, 13, 3101. [Google Scholar] [CrossRef] [PubMed]
  8. Chadha, U.; Aarye, V.; Naman, P.; Tiwari, A.; Shanker, S.; Selvaraj, S. Performance evaluation of 3D printing technologies: A review, recent advances, current challenges, and future directions. Prog. Addit. Manuf. 2022, 7, 853–886. [Google Scholar] [CrossRef]
  9. Fu, Y.; Downey, A.; Yuan, L.; Pratt, A.; Balogun, Y. In situ monitoring for fused filament fabrication process: A review. Addit. Manuf. 2021, 38, 101749. [Google Scholar] [CrossRef]
  10. Gao, W.; Zhang, Y.; Ramanujan, D.; Ramani, K.; Chen, Y.; Williams, C.; Wang, C.; Shin, Y.; Zhang, S.; Zavattieri, P. The status, challenges, and future of additive manufacturing in engineering. Comput.-Aided Des. 2015, 69, 65–89. [Google Scholar] [CrossRef]
  11. Hager, I.; Golonka, A.; Putanowicz, R. 3D printing of buildings and building components as the future of sustainable construction? Procedia Eng. 2016, 151, 292–299. [Google Scholar] [CrossRef]
  12. Iftekar, S.; Aabid, A.; Amir, A.; Baig, M. Advancements and Limitations in 3D Printing Materials and Technologies: A Critical Review. Polymers 2023, 15, 2519. [Google Scholar] [CrossRef]
  13. Anketa, J.; Ikshita, C.; Ishika, W.; Ankush, R.; Mir, I. 3D printing—A review of processes, materials and applications in industry 4.0. Sustain. Oper. Comput. 2022, 3, 33–42. [Google Scholar]
  14. Bouzaglou, O.; Golan, O.; Lachman, N. Process Design and Parameters Interaction in Material Extrusion 3D Printing: A Review. Polymers 2023, 15, 2280. [Google Scholar] [CrossRef] [PubMed]
  15. Tierra, P.; Arroba, S.; Safla, E.; Jaramillo, J. Simulación matemótica de pruebas de impacto entre diferentes materiales, por medio de software para análisis no lineales. Dominio Cienc. 2020, 6, 1171–1193. [Google Scholar]
  16. ISO 604:2022; Plastics—Determination of Compressive Properties. International Organization for Standardization (ISO): Geneva, Switzerland, 2022. Available online: https://www.mts.com/la/applications/materials/test-standard/iso/iso-604 (accessed on 5 February 2025).
  17. ASTM D638-19; Standard Test Method for Tensile Properties of Plastics. ASTM International: West Conshohocken, PA, USA, 2019. Available online: https://store.accuristech.com/ (accessed on 5 February 2025).
  18. Almonti, D.; Baiocco, G.; Salvi, D.; Ucciardello, N. Innovative approach for enhancing thermal diffusivity in metal matrix composites using graphene electrodeposition and multi-coating. Int. J. Adv. Manuf. Technol. 2024, 135, 1633–1646. [Google Scholar] [CrossRef]
  19. Majko, J.; Saga, M.; Vasko, M.; Handrik, M.; Barnik, F.; Dorciak, F. FEM analysis of long-fibre composite structures created by 3D printing. Transp. Res. Procedia 2019, 40, 792–799. [Google Scholar] [CrossRef]
  20. ISO 527-2:2012; Plastics—Determination of Tensile Properties. International Organization for Standardization (ISO): Geneva, Switzerland, 2012; Available online: https://www.nen.nl/en/nen-en-iso-527-2-2012-en-169105; https://standards.iteh.ai/catalog/standards/cen/f4cb13ef-3b69-40ec-8ff7-4d0f7412fdf1/en-iso-527-2-2012; https://www.une.org/encuentra-tu-norma/busca-tu-norma/norma?c=N0050308; https://www.intertekinform.com/en-au/standards/iso-527-2-2012-580795_saig_iso_iso_1329412/. (accessed on 5 February 2025).
  21. Zienkiewicz, O.; Taylor, R. El Método de los Elementos Finitos, 4th ed.; McGraw-Hill: Madrid, Spain, 2010; pp. 333–360. [Google Scholar]
  22. Fadiji, T.; Cotzee, C.; Berry, T.; Ambaw, A.; Opara, U. The efficacy of finite element analysis (FEA) as a design tool for food packaging: A review. Biosyst. Eng. 2018, 174, 20–40. [Google Scholar] [CrossRef]
  23. Hammou, A.; Duong, P.; Berry, T.; Abbes, B.; Makhlouf, M.; Guo, Y. Finite-element simulation with a homogenization model andexperimental study of free drop tests of corrugated cardboard packaging. Mech. Ind. 2012, 13, 175–184. [Google Scholar] [CrossRef]
Figure 1. Data acquisition process.
Jmmp 09 00204 g001
Figure 2. (a) Mid-body reinforcements. (b) Lateral transparency reinforcements. (c) Frontal transparency reinforcements.
Jmmp 09 00204 g002
Figure 3. (a) Container bottom printing; (b) body printing; and (c) printed container model.
Jmmp 09 00204 g003
Figure 4. Container dimensions in mm.
Jmmp 09 00204 g004
Figure 5. (a) and (b) specimens for tensile testing according to ASTM D638.
Jmmp 09 00204 g005
Figure 6. (a) Load cell and grip assembly. (b) Specimen mounting. (c) Details of the marked initial length.
Jmmp 09 00204 g006
Figure 7. (a) Printed container. (b) Original container.
Jmmp 09 00204 g007
Figure 8. Possibility of multiple solutions.
Jmmp 09 00204 g008
Figure 9. (a) Container position for free fall. (b) Layered solid modeling according to the 3D printing process.
Jmmp 09 00204 g009
Figure 10. Tensile test results of PLA specimens obtained through additive manufacturing.
Jmmp 09 00204 g010
Figure 11. Stress–strain curve of 3D-printed specimens subjected to tensile stress.
Jmmp 09 00204 g011
Figure 12. Stress–strain curve of containers subjected to compression.
Jmmp 09 00204 g012
Figure 13. (a) Deformation at the thread base of the 3D-printed container. (b) Deformation throughout the body of the blow-molded container.
Jmmp 09 00204 g013
Figure 14. Jacobian value for mesh quality.
Jmmp 09 00204 g014
Figure 15. Impact deformation of the blow-molded container.
Jmmp 09 00204 g015
Figure 16. Deformation behavior of the blow-molded container.
Jmmp 09 00204 g016
Figure 17. Stresses generated in the blow-molded container.
Jmmp 09 00204 g017
Figure 18. Stress behavior in the blow-molded container.
Jmmp 09 00204 g018
Figure 19. Impact deformation of the 3D-printed container.
Jmmp 09 00204 g019
Figure 20. Deformation behavior of the 3D-printed container.
Jmmp 09 00204 g020
Figure 21. Stresses induced in the printed packaging.
Jmmp 09 00204 g021
Figure 22. Stress behavior of the 3D-printed container.
Jmmp 09 00204 g022
Figure 23. Internal energy behavior of blow-molded packaging.
Jmmp 09 00204 g023
Figure 24. Internal energy behavior of printed packaging.
Jmmp 09 00204 g024
Table 1. Mechanical and physical properties of standard PLA.
Mechanical Properties3D Printing
ValueISO 527 Estandard Test [20]
Tensile modulus of elasticity2346.5 MPa1 mm/min
Tensile yield strength49.5 MPa50 mm/min
Tensile strength at break45.6 MPa50 mm/min
Elongation at break5.20%50 mm/min
Flexural strength103.0 MPa178
Flexural modulus3150.0 MPa178
Shrinkage2–5%
Table 2. Printer operation parameters.
DescriptionValue
MaterialPLA PRO
ColorGreen
Filament diameter3 mm
Spool1 kg
Printing speed24 mm3/s
Nozzle temperature215 °C
Nozzle diameter0.4 mm
Nozzle height from base0.2 mm
Bed temperature60 °C
Wall thickness4 mm
Table 3. Printing configuration parameters.
DescriptionConfiguration
Number of outer walls6
Number of inner walls6
Infill patternTriangular
Layer height0.15 mm
Infill density100%
Table 4. Tensile test setup.
LoadMaterialSpecimen
Number
Speed
(V)
Initial
Length (l0)
20 kNPLA13 mm/min56.32 mm
23 mm/min56.07 mm
Table 5. Compression test setup.
Load
Cell
Working
Load
Correction
Factor
Disc Diameter
InternalExternal
200 kN20 kN195 mm100 mm
Table 6. Initial parameters.
Container Produced by 3D Printing (PLA)
Density7.83 × 10−6 kg/mm3
Young’s modulus2346.5 MPa
Elastic limit49.5 MPa
Container produced by blow molding (HDPE)
Density9.50 × 10−7 kg/mm3
Young’s modulus1200 MPa
Elastic limit26.0 MPa
Table 7. Compression test results.
ContainerLoadContainer HeightTread Diameter
BeforeAfterBeforeAfter
Printed 110.497 kN181 mm175 mm37 mm37.15 mm
Blow molded 23.449 kN182 mm178 mm36 mm36.52 mm
1 Three-dimensional-printed container with 3 mm wall thickness and wall reinforcements. 2 Blow-molded container with 3 mm wall thickness.
Table 8. Deformation and stress results obtained by finite element analysis.
DescriptionCONTAINER
Blow-MoldedPrinted
Measured Element Deformation (mm)≈101–118≈116–120
Maximum Deformation (mm)119.2120.3
Measured Stresses (MPa)≈0.37–0.57≈0.1–0.54
Maximum Stresses (MPa)0.73910.7554
Disclaimer/Publisher’s Note: The statements, opinions and data contained in all publications are solely those of the individual author(s) and contributor(s) and not of MDPI and/or the editor(s). MDPI and/or the editor(s) disclaim responsibility for any injury to people or property resulting from any ideas, methods, instructions or products referred to in the content.

