
Modeling of Feedstock Formability to Optimize Mold Design and Prevent Possible Defects During Metal Injection Molding

Abstract
1. Introduction
2. Literature Review
3. Objects and Methods
3.1. Objects of Research
3.2. Research Methods
4. Results and Discussion
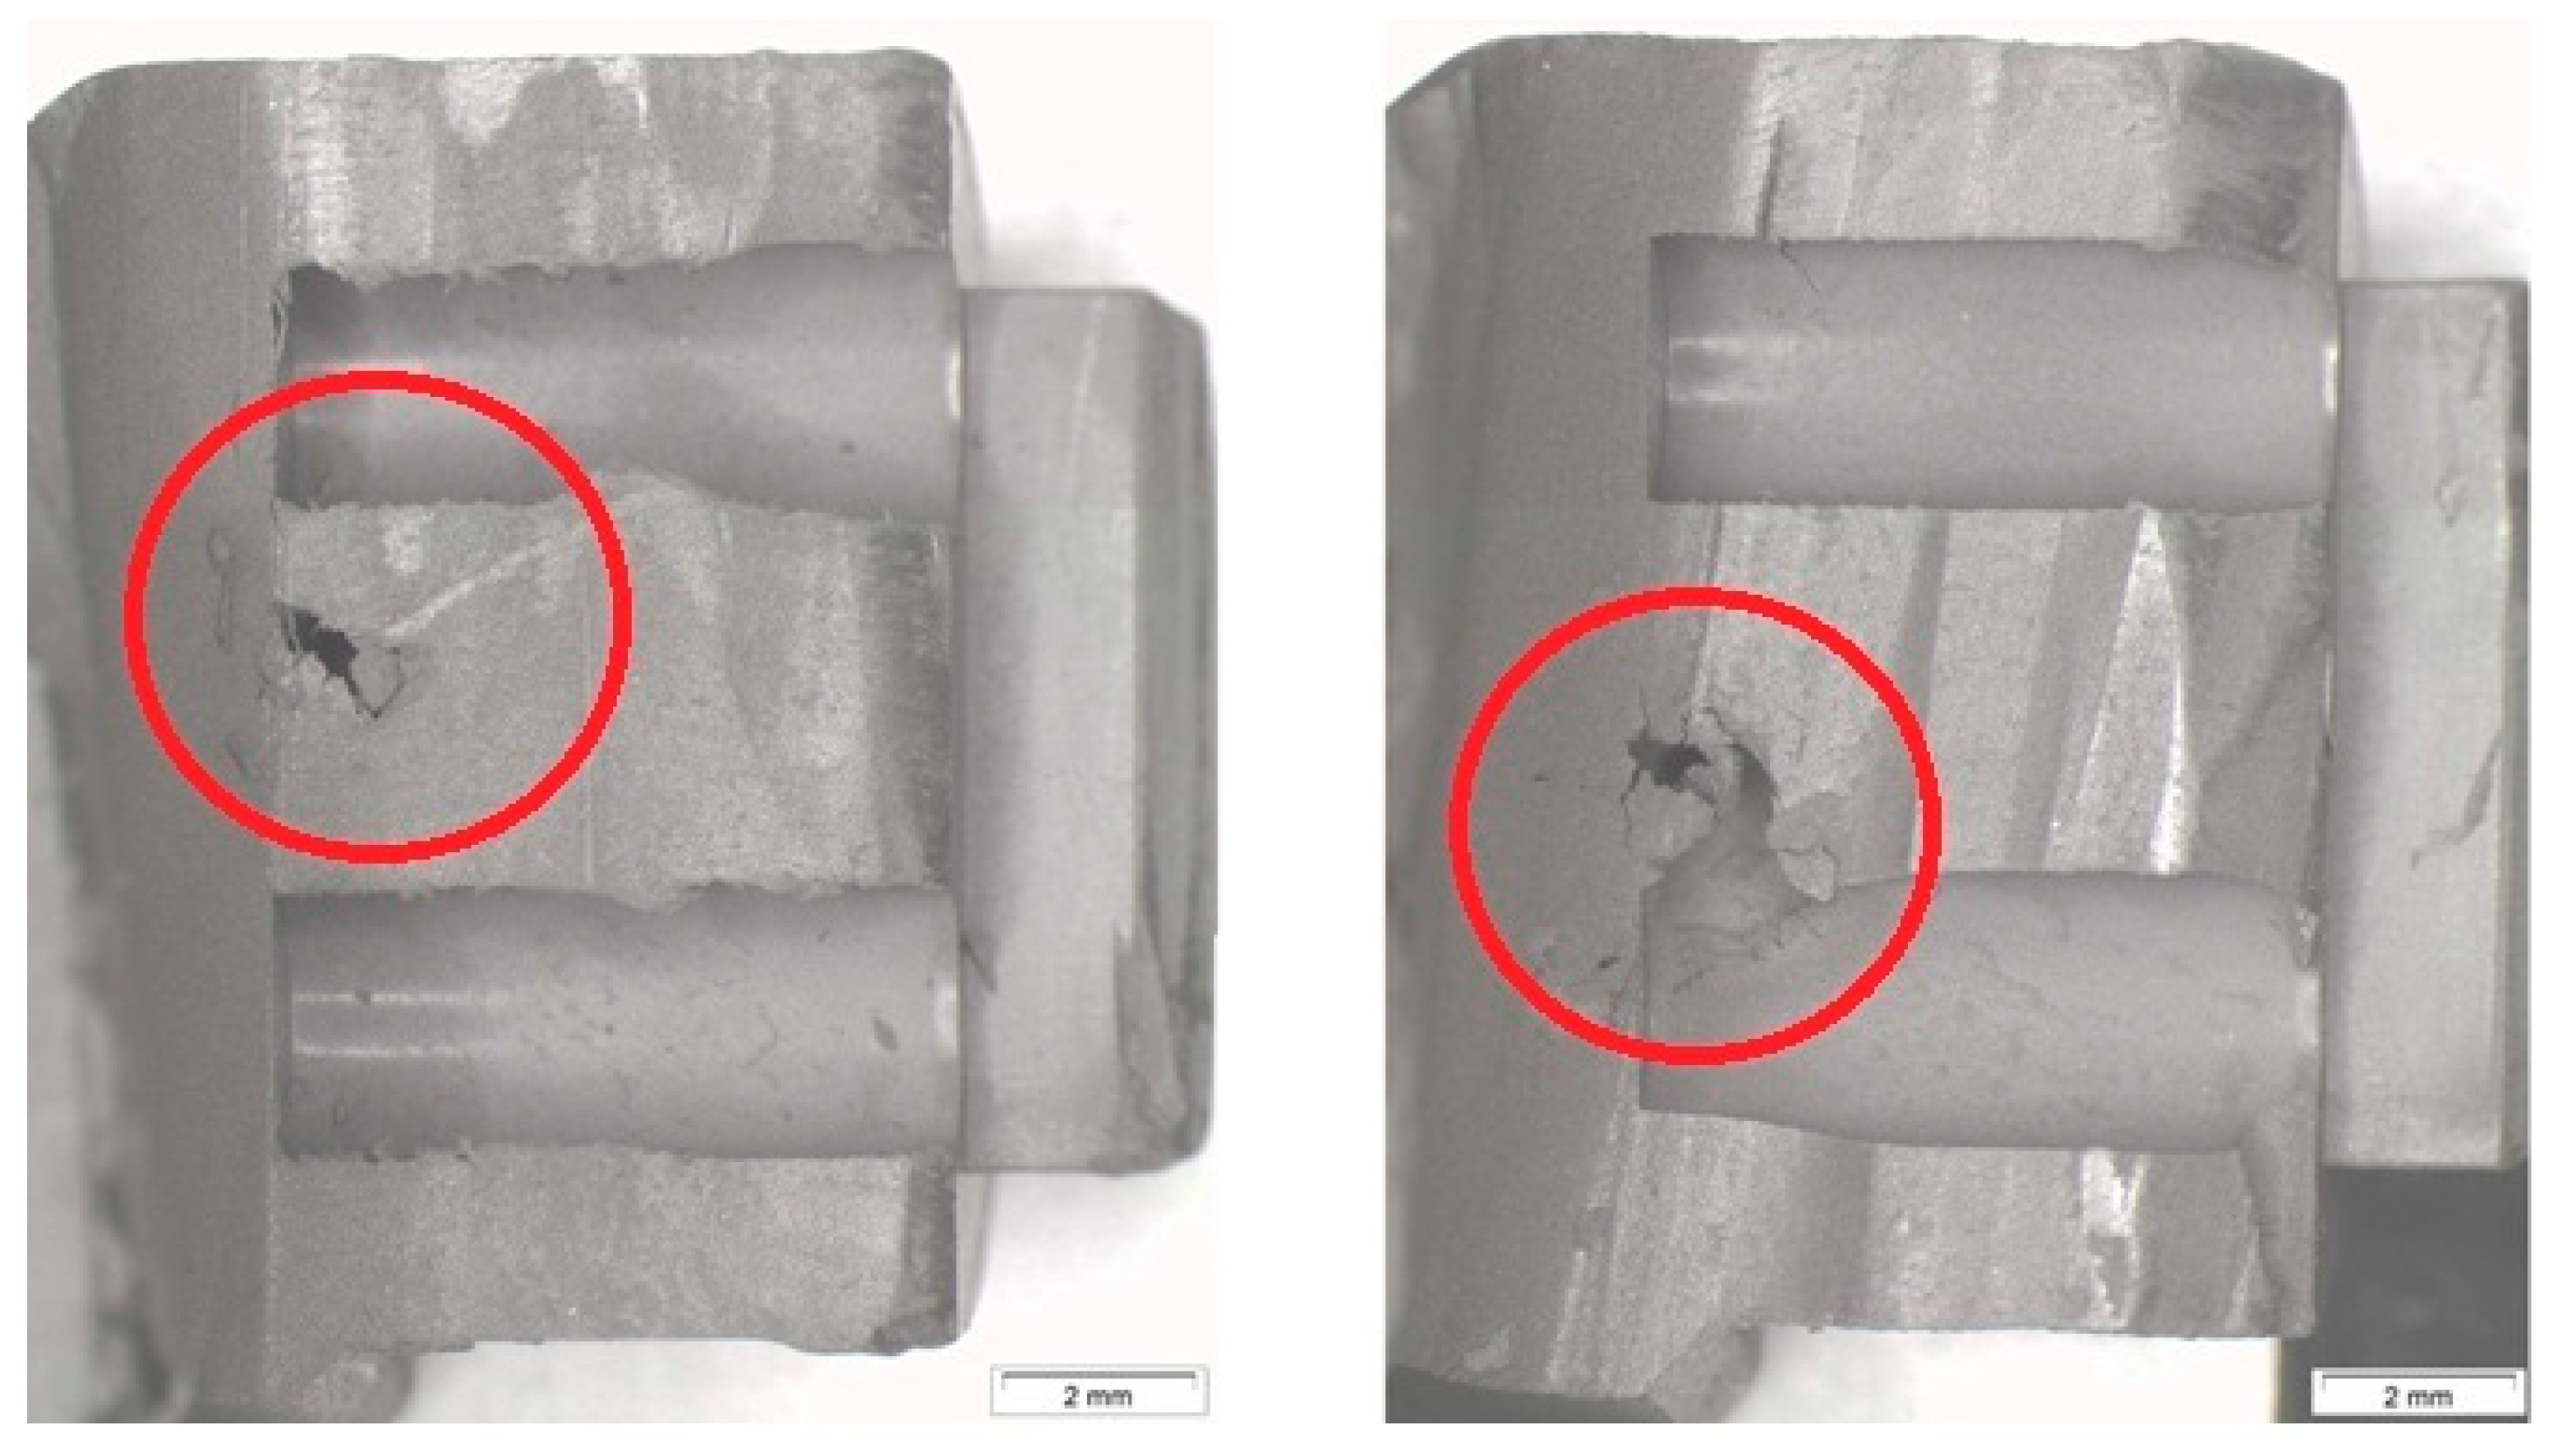
4.1. Analyzing the Causes of Defects by Varying Process Parameters
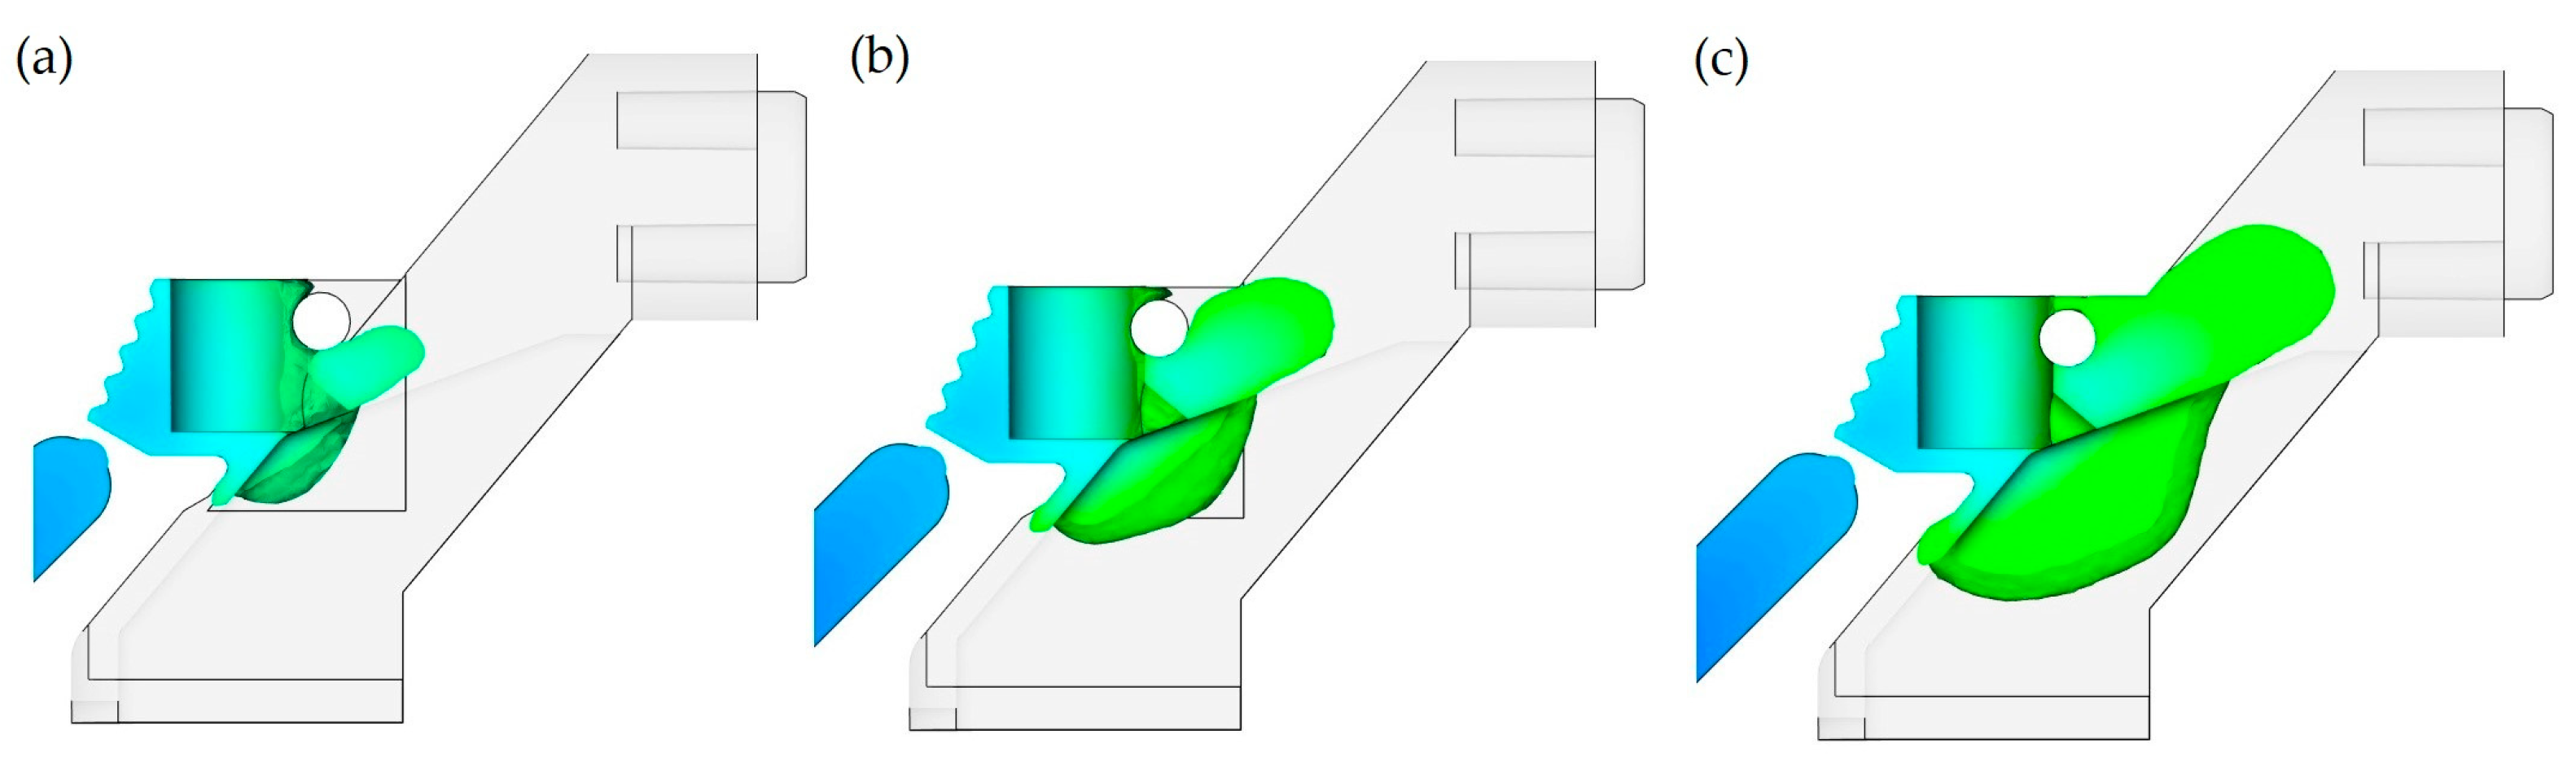
4.2. Simulation Modeling and Analysis of Casting Processes in the Initial Mold
4.3. Optimization of Mold Design
4.4. Analysis and Discussion of the Results Obtained with the Optimized Mold
5. Conclusions
Author Contributions
Funding
Data Availability Statement
Acknowledgments
Conflicts of Interest
Abbreviations
| ASMI | Autodesk Simulation Moldflow Insight |
| FEM | Finite element model |
| IMM | Injection molding machine |
| MIM | Metal injection molding |
| PIM | Powder injection molding |
Appendix A
Appendix A.1

| Process Stage | Injection | Feed | |||
|---|---|---|---|---|---|
| Parameter | 1st step | 2nd step | 1 s, acceleration | 1 s | 0.1 s |
| Injection speed, cm3/s | 40 | 25 | 15 | 15 | 15 |
| Pressure, MPa | 150 | 220 | 50 | 30 | 10 |
Appendix A.2
| Injection Speed, cm3/s | Injection Volume, cm3 | Pressure Mode P–t, MPa–s | Temperature, °C (K) |
|---|---|---|---|
| Changing the prepress mode | |||
| 40 | 16 | 120–1 50–1 30–1 10–0.1 | 160 (433.15) |
| 40 | 16 | 120–1 120–2 50–1 10–0.1 | 160 (433.15) |
| 40 | 16 | 150–1 120–2 50–1 10–0.1 | 160 (433.15) |
| 40 | 16 | 150–1 150–2 50–1 10–0.1 | 160 (433.15) |
| 40 | 16 | 180–1 150–2 50–1 10–0.1 | 160 (433.15) |
| 40 | 16 | 180–1 180–2 50–1 10–0.1 | 160 (433.15) |
| Change in injection speed | |||
| 10 | 16 | 150–1 150–1 50–1 10–0.1 | 170 (443.15) |
| 15 | 16 | 150–1 150–1 50–1 10–0.1 | 170 (443.15) |
| 20 | 16 | 150–1 150–1 50–1 10–0.1 | 170 (443.15) |
| 25 | 16 | 150–1 150–1 50–1 10–0.1 | 170 (443.15) |
| 30 | 16 | 150–1 150–1 50–1 10–0.1 | 170 (443.15) |
| Change in injection speed and temperature | |||
| 30 | 16 | 150–1 150–1 50–1 10–0.1 | 180 (453.15) |
| Change in melt temperature | |||
| 40 | 16 | 150–1 150–1 50–1 10–0.1 | 170 (443.15) |
| 40 | 16 | 150–1 150–1 50–1 10–0.1 | 175 (448.15) |
Appendix B


References
- Semenov, A.B.; Kutsbakh, A.A.; Muranov, A.N.; Semenov, B.I. Metallurgy of Thixotropic Materials: The Experience of Organizing the Processing of Structural Materials in Engineering Thixo and MIM Methods. IOP Conf. Ser. Mater. Sci. Eng. 2019, 683, 012056. [Google Scholar] [CrossRef]
- Ivanchenko, S.E. Generalized Method for Normalizing the Degree of Thixotropy/Rheopexy to Evaluate the Structure of Powder Suspensions. Powder Metall. Met. Ceram. 2023, 62, 123–132. [Google Scholar] [CrossRef]
- O’Donnel, R. Advanced thixotropic metallurgy, a revolution in casting technology. Die Cast. Eng. 2005, 49, 50–54. [Google Scholar]
- Lehmhus, D. Advances in Metal Casting Technology: A Review of State of the Art, Challenges and Trends—Part II: Technologies New and Revived. Metals 2024, 14, 334. [Google Scholar] [CrossRef]
- Gonzlez-Gutirrez, J.; Beulke, G.; Emri, I. Powder Injection Molding of Metal and Ceramic Parts. In Some Critical Issues for Injection Molding; IntechOpen: London, UK, 2012. [Google Scholar]
- Zhao, T.; Ei, B.; Wang, X.; Qi, G.; Lowe, H. Research Progress on Optimization Methods of Powder Injection Molding Process Parameters. Adv. Transdiscipl. Eng. 2022, 22, 257–262. [Google Scholar] [CrossRef]
- Heaney, D.F. Designing for Metal Injection Molding (MIM). In Handbook of Metal Injection Molding; Woodhead Publishing Ltd.: Cambridge, UK, 2012; pp. 29–49. [Google Scholar] [CrossRef]
- Altaf, K.; Qayyum, J.A.; Rani, A.M.A.; Ahmad, F.; Megat-Yusoff, P.S.M.; Baharom, M.; Aziz, A.R.A.; Jahanzaib, M.; German, R.M. Performance Analysis of Enhanced 3D Printed Polymer Molds for Metal Injection Molding Process. Metals 2018, 8, 433. [Google Scholar] [CrossRef]
- Baum, M.; Anders, D.; Reinicke, T. Enhancing Injection Molding Simulation Accuracy: A Comparative Evaluation of Rheological Model Performance. Appl. Sci. 2024, 14, 8468. [Google Scholar] [CrossRef]
- Stolin, A.M.; Khokhlov, A.V. Nonlinear Model of Shear Flow of Thixotropic Viscoelastoplastic Continua Taking into Account the Evolution of the Structure and Its Analysis. Mosc. Univ. Mech. Bull. 2022, 77, 127–135. [Google Scholar] [CrossRef]
- Mityukov, A.; Govorov, V.; Malkin, A.; Kulichikhin, V. Rheology of Highly Concentrated Suspensions with a Bimodal Size Distribution of Solid Particles for Powder Injection Molding. Polymers 2021, 13, 2709. [Google Scholar] [CrossRef]
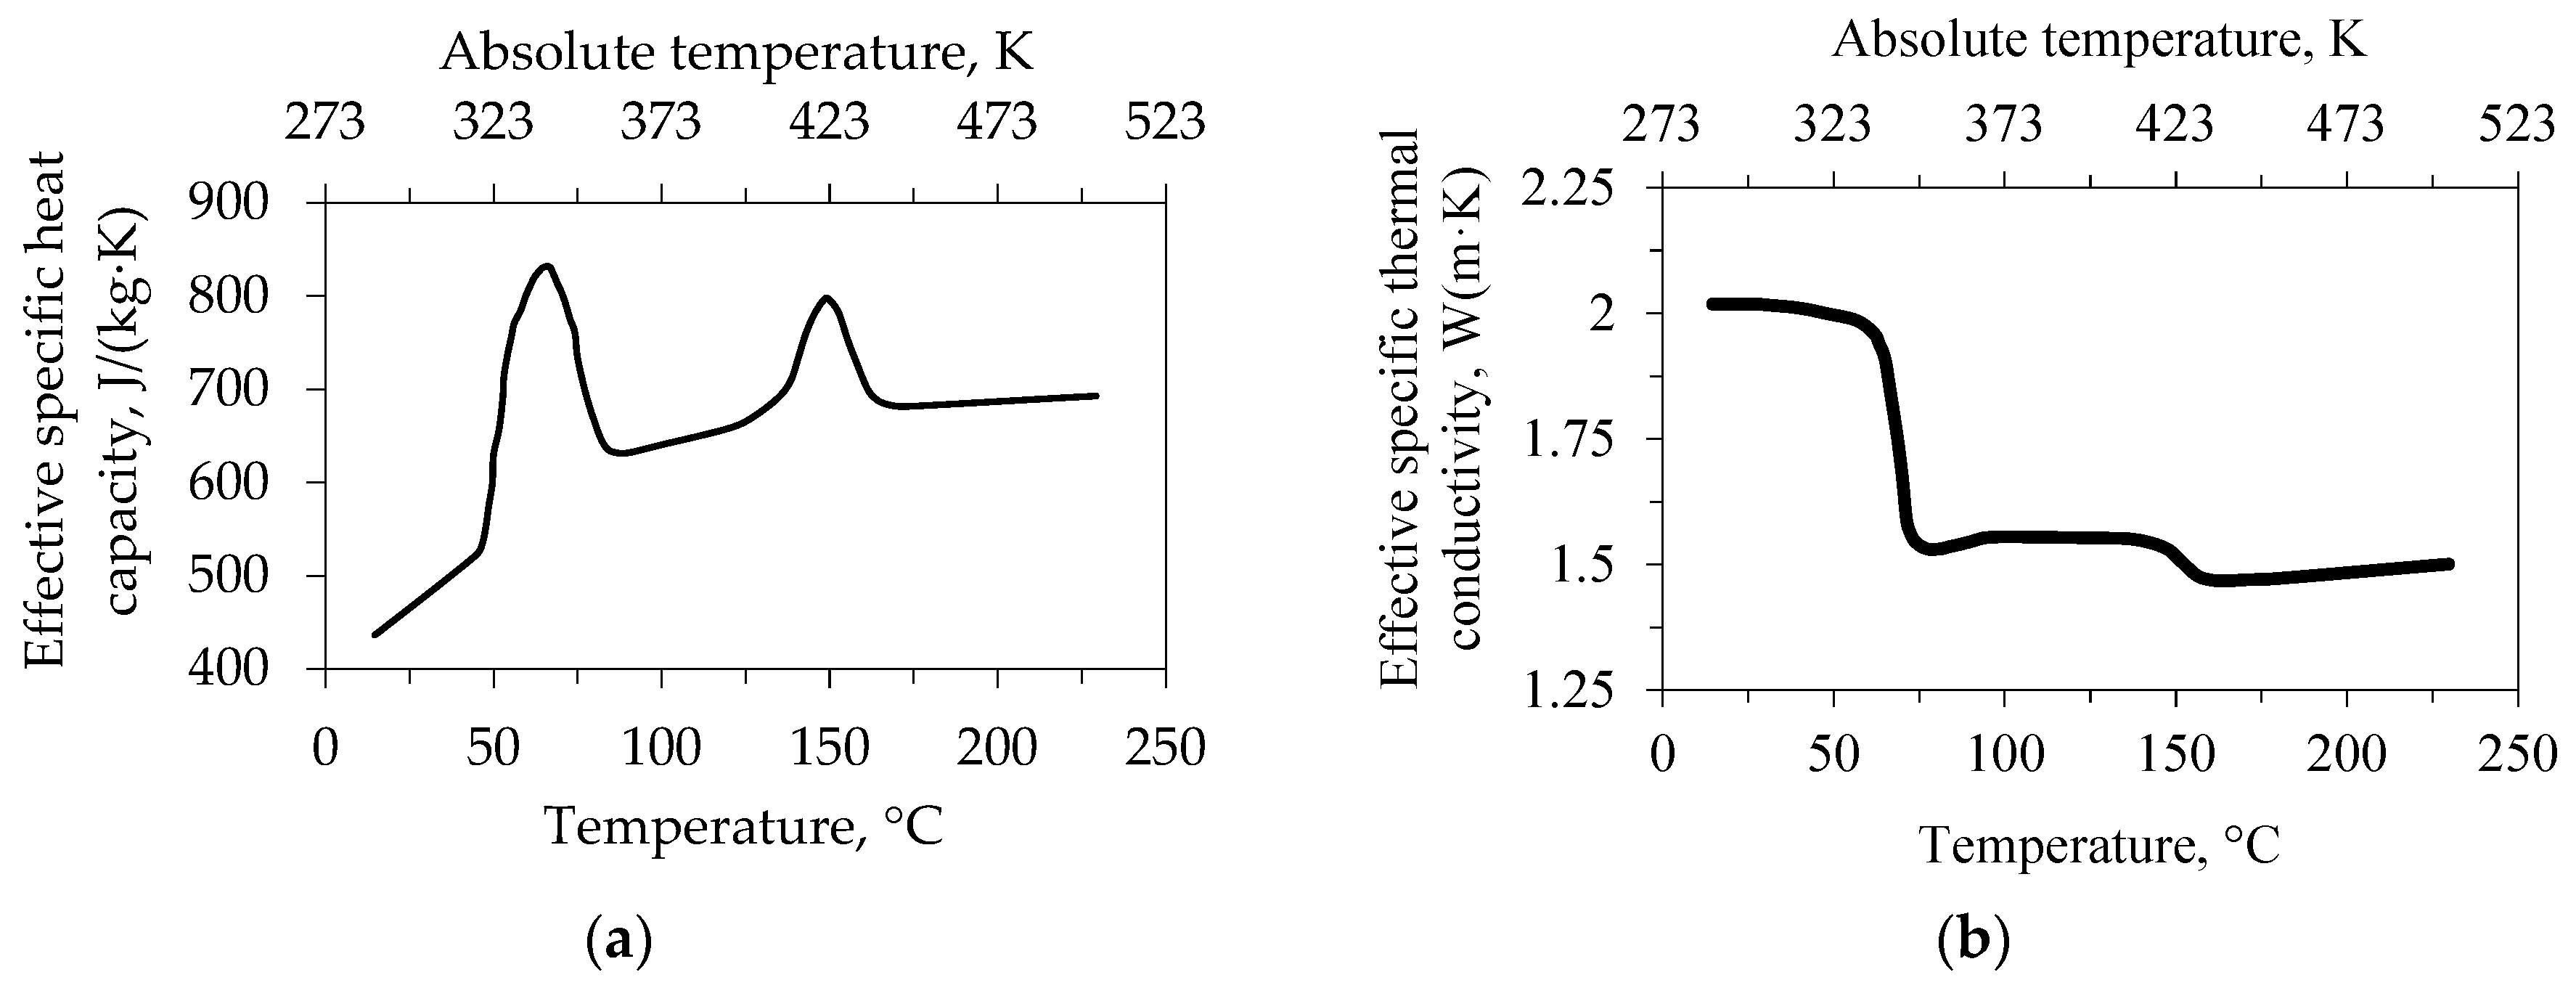
- Muranov, A.N.; Kocharov, M.A.; Mikhailov, M.S. Comparison of Thermophysical Properties of PIM Feedstocks with Polyoxymethylene and Wax-Polyolefin Binders. Civ. Eng. J. 2024, 10, 1788–1805. [Google Scholar] [CrossRef]
- Kowalski, L.; Duszczyk, J.; Katgerman, L. Thermal Conductivity of Metal Powder-Polymer Feedstock for Powder Injection Moulding. J. Mater. Sci. 1999, 34, 1–5. [Google Scholar] [CrossRef]
- Kate, K.H.; Enneti, R.K.; Onbattuvelli, V.P.; Atre, S.V. Feedstock Properties and Injection Molding Simulations of Bimodal Mixtures of Nanoscale and Microscale Aluminum Nitride. Ceram. Int. 2013, 39, 6887–6897. [Google Scholar] [CrossRef]
- Wang, J. Some Critical Issues for Injection Molding; IntechOpen: London, UK, 2012. [Google Scholar] [CrossRef]
- Muranov, A.N.; Semenov, A.B.; Kutsbakh, A.A.; Semenov, B.I. Specific Volume and Features of Compaction in Molding of Powder–Polymer Mixtures with Wax–Polypropylene Binder. Polym. Sci. Ser. D 2020, 13, 228–234. [Google Scholar] [CrossRef]
- Kate, K.H.; Onbattuvelli, V.P.; Enneti, R.K.; Lee, S.W.; Park, S.-J.; Atre, S.V. Measurements of Powder–Polymer Mixture Properties and Their Use in Powder Injection Molding Simulations for Aluminum Nitride. JOM 2012, 64, 1048–1058. [Google Scholar] [CrossRef]
- Baum, M.; Anders, D.; Reinicke, T. Approaches for Numerical Modeling and Simulation of the Filling Phase in Injection Molding: A Review. Polymers 2023, 15, 4220. [Google Scholar] [CrossRef]
- Qayyum, J.A.; Altaf, K.; Rani, A.M.A.; Ahmad, F.; Qadir, H.A.; Amin, W. Metal Injection Molding Process Parameters as a Function of Filling Performance of 3D Printed Polymer Mold. MATEC Web Conf. 2018, 225, 06004. [Google Scholar] [CrossRef]
- Nayak, C.V.; Patel, G.C.M.; Ramesh, M.R.; Desai, V.; Samanta, S.K. Analysis and Optimization of Metal Injection Moulding Process. In Materials Forming, Machining and Tribology; Springer: Cham, Switzerland, 2019; pp. 41–74. [Google Scholar] [CrossRef]
- Teferi, F.T.; Tsegaw, A.A. Metal Injection Molding (MIM) Process and Potential Remedies for Its Defects: A Review. In Advances of Science and Technology; Springer: Cham, Switzerland, 2022; pp. 309–325. [Google Scholar] [CrossRef]
- Sanetrnik, D.; Hausnerova, B.; Ponizil, P.; Novak, M.; Monkova, K. Flow-Induced Defects during Metal Injection Molding: Role of Powder Morphology. Phys. Fluids 2024, 36, 83334. [Google Scholar] [CrossRef]
- Gelin, J.C.; Barriere, T.; Song, J. Processing Defects and Resulting Mechanical Properties after Metal Injection Molding. J. Eng. Mater. Technol. 2009, 132, 11017. [Google Scholar] [CrossRef]
- Akishev, K.; Aryngazin, K.; Tleulessov, A.; Bulyga, L.; Stanevich, V. The use of simulation modeling in calculating the productivity of the technological system for the production of building products with fillers from man-made waste. NEWS Natl. Acad. Sci. Repub. Kazakhstan 2024, 4, 22–32. [Google Scholar] [CrossRef]
- Nor, N.H.M.; Muhamad, N.; Ismail, M.H.; Jamaludin, K.R.; Ahmad, S.; Ibrahim, M.H.I. Flow Behaviour to Determine the Defects of Green Part in Metal Injection Molding. Int. J. Mech. Mater. Eng. 2009, 4, 70–75. [Google Scholar]
- Samanta, S.K.; Chattopadhyay, H.; Godkhindi, M.M. Modelling the Powder Binder Separation in Injection Stage of PIM. Prog. Comput. Fluid Dyn. Int. J. 2011, 11, 292. [Google Scholar] [CrossRef]
- Hwang, K.S. Common Defects in Metal Injection Molding (MIM). In Handbook of Metal Injection Molding; Woodhead Publishing Ltd.: Cambridge, UK, 2012; pp. 235–253. [Google Scholar] [CrossRef]
- Genbach, A.A.; Bondartsev, D.Y.; Beloev, H. Study of the Heat Transfer Ability of a Capillary-Porous Cooling System in Heat Power Installations. J. Eng. Sci. Technol. Rev. 2020, 143–144. [Google Scholar]
- Gim, J.; Turng, L.-S. A Review of Current Advancements in High Surface Quality Injection Molding: Measurement, Influencing Factors, Prediction, and Control. Polym. Test. 2022, 115, 107718. [Google Scholar] [CrossRef]
- Zhou, X.; Zhang, Y.; Mao, T.; Zhou, H. Monitoring and Dynamic Control of Quality Stability for Injection Molding Process. J. Mater. Process. Technol. 2017, 249, 358–366. [Google Scholar] [CrossRef]
- Lyashenko, V.; Matarneh, R.; Sotnik, S. Defects of Casting Plastic Products: Causes, Recurrence, Synthesis and Ways of Elimination. Int. J. Mod. Eng. Res. 2018, 8, 1–11. [Google Scholar]
- Nasiri, S.; Khosravani, M.R. Faults and Failures Prediction in Injection Molding Process. Int. J. Adv. Manuf. Technol. 2019, 103, 2469–2484. [Google Scholar] [CrossRef]
- Yussupov, K.; Aben, E.; Akhmetkanov, D.; Abenk, K.; Yussupova, S. Investigation of the Solid Oxidizer Effect on the Metal Geotechnology Efficiency. Min. Miner. Depos. 2023, 17, 12–17. [Google Scholar] [CrossRef]
- Hua, S. Experimental and Numerical Investigation of Jetting Phenomenon in Injection Molding. J. Braz. Soc. Mech. Sci. Eng. 2020, 42, 193. [Google Scholar] [CrossRef]
- Ilinca, F.; Hétu, J.; Derdouri, A.; Stevenson, J. Metal Injection Molding: 3D Modeling of Nonisothermal Filling. Polym. Eng. Sci. 2002, 42, 760–770. [Google Scholar] [CrossRef]
- Dvorak, P.; Barriere, T.; Gelin, J.C. Jetting in Metal Injection Moulding of 316L Stainless Steel. Powder Metall. 2005, 48, 254–260. [Google Scholar] [CrossRef]
- Tsaoulidis, D.; Angeli, P. Effect of Channel Size on Liquid-liquid Plug Flow in Small Channels. AIChE J. 2015, 62, 315–324. [Google Scholar] [CrossRef]
- Malkin, A.Y.; Kulichikhin, V.G. Shear Thickening and Dynamic Glass Transition of Concentrated Suspensions. State of the Problem. Colloid J. 2016, 78, 1–8. [Google Scholar] [CrossRef]
- Liu, H.; Fu, K.; Cui, X.; Zhu, H.; Yang, B. Shear Thickening Fluid and Its Application in Impact Protection: A Review. Polymers 2023, 15, 2238. [Google Scholar] [CrossRef] [PubMed]
- Bociaga, E.; Skoneczny, W. Characteristics of Injection Molded Parts with the Areas of Weld Lines. Polimery 2020, 65, 337–345. [Google Scholar] [CrossRef]
- Li, X.-J.; Zuo, Z.-M.; Mi, H.-Y.; Dong, B.-B.; Antwi-Afari, M.-F.; Liu, C.-T.; Shen, C.-Y. A Review of Research Progress on the Minimization of Weld Lines in Injection Molding. Int. J. Adv. Manuf. Technol. 2024, 132, 5179–5210. [Google Scholar] [CrossRef]
- Dzulkipli, A.A.; Azuddin, M. Study of the Effects of Injection Molding Parameter on Weld Line Formation. Procedia Eng. 2017, 184, 663–672. [Google Scholar] [CrossRef]
- Knöpfle, C.; Maetzig, M.; Walcher, H. The influence of process parameters on the quality of Metal Injection Moulded parts. Powder Inject. Mould. Int. 2017, 11, 75–80. Available online: https://issuu.com/inovar-communications/docs/pim_international_march_2017_sp?e=32443561/58319649 (accessed on 14 May 2025).
- Coleman, A.J.; Murray, K.; Kearns, M.; Tingskog, T.A.; Sanford, B.; Gonzalez, E. Effect of particle size distribution on processing and properties of metal injection moulded 4140 and 4340. Adv. Powder Metall. Part. Mater. 2011, 47, 1–12. [Google Scholar]
- Ahn, S.; Chung, S.T.; Atre, S.V.; Park, S.J.; German, R.M. Integrated Filling, Packing and Cooling CAE Analysis of Powder Injection Moulding Parts. Powder Metall. 2008, 51, 318–326. [Google Scholar] [CrossRef]
- Semenov, A.B.; Kutsbakh, A.A.; Muranov, A.N.; Semenov, B.I. Development of a Technique to Simulate the Injection Molding of Metallic-Powder-Filled Polymers. Russ. Metall. (Met.) 2019, 2019, 1351–1356. [Google Scholar] [CrossRef]
- Thomas, Y.; Baril, E.; Ilinca, F.; Hetu, J.F. Development of titanium dental implant by MIM: Experiments and simulation. Adv. Powder Metall. Part. Mater. 2009, 4, 81–93. [Google Scholar]
- Shoemaker, J. Moldflow Design Guide: A Resource for Plastics Engineers; Moldflow Corporation: San Rafael, CA, USA, 2006. [Google Scholar]
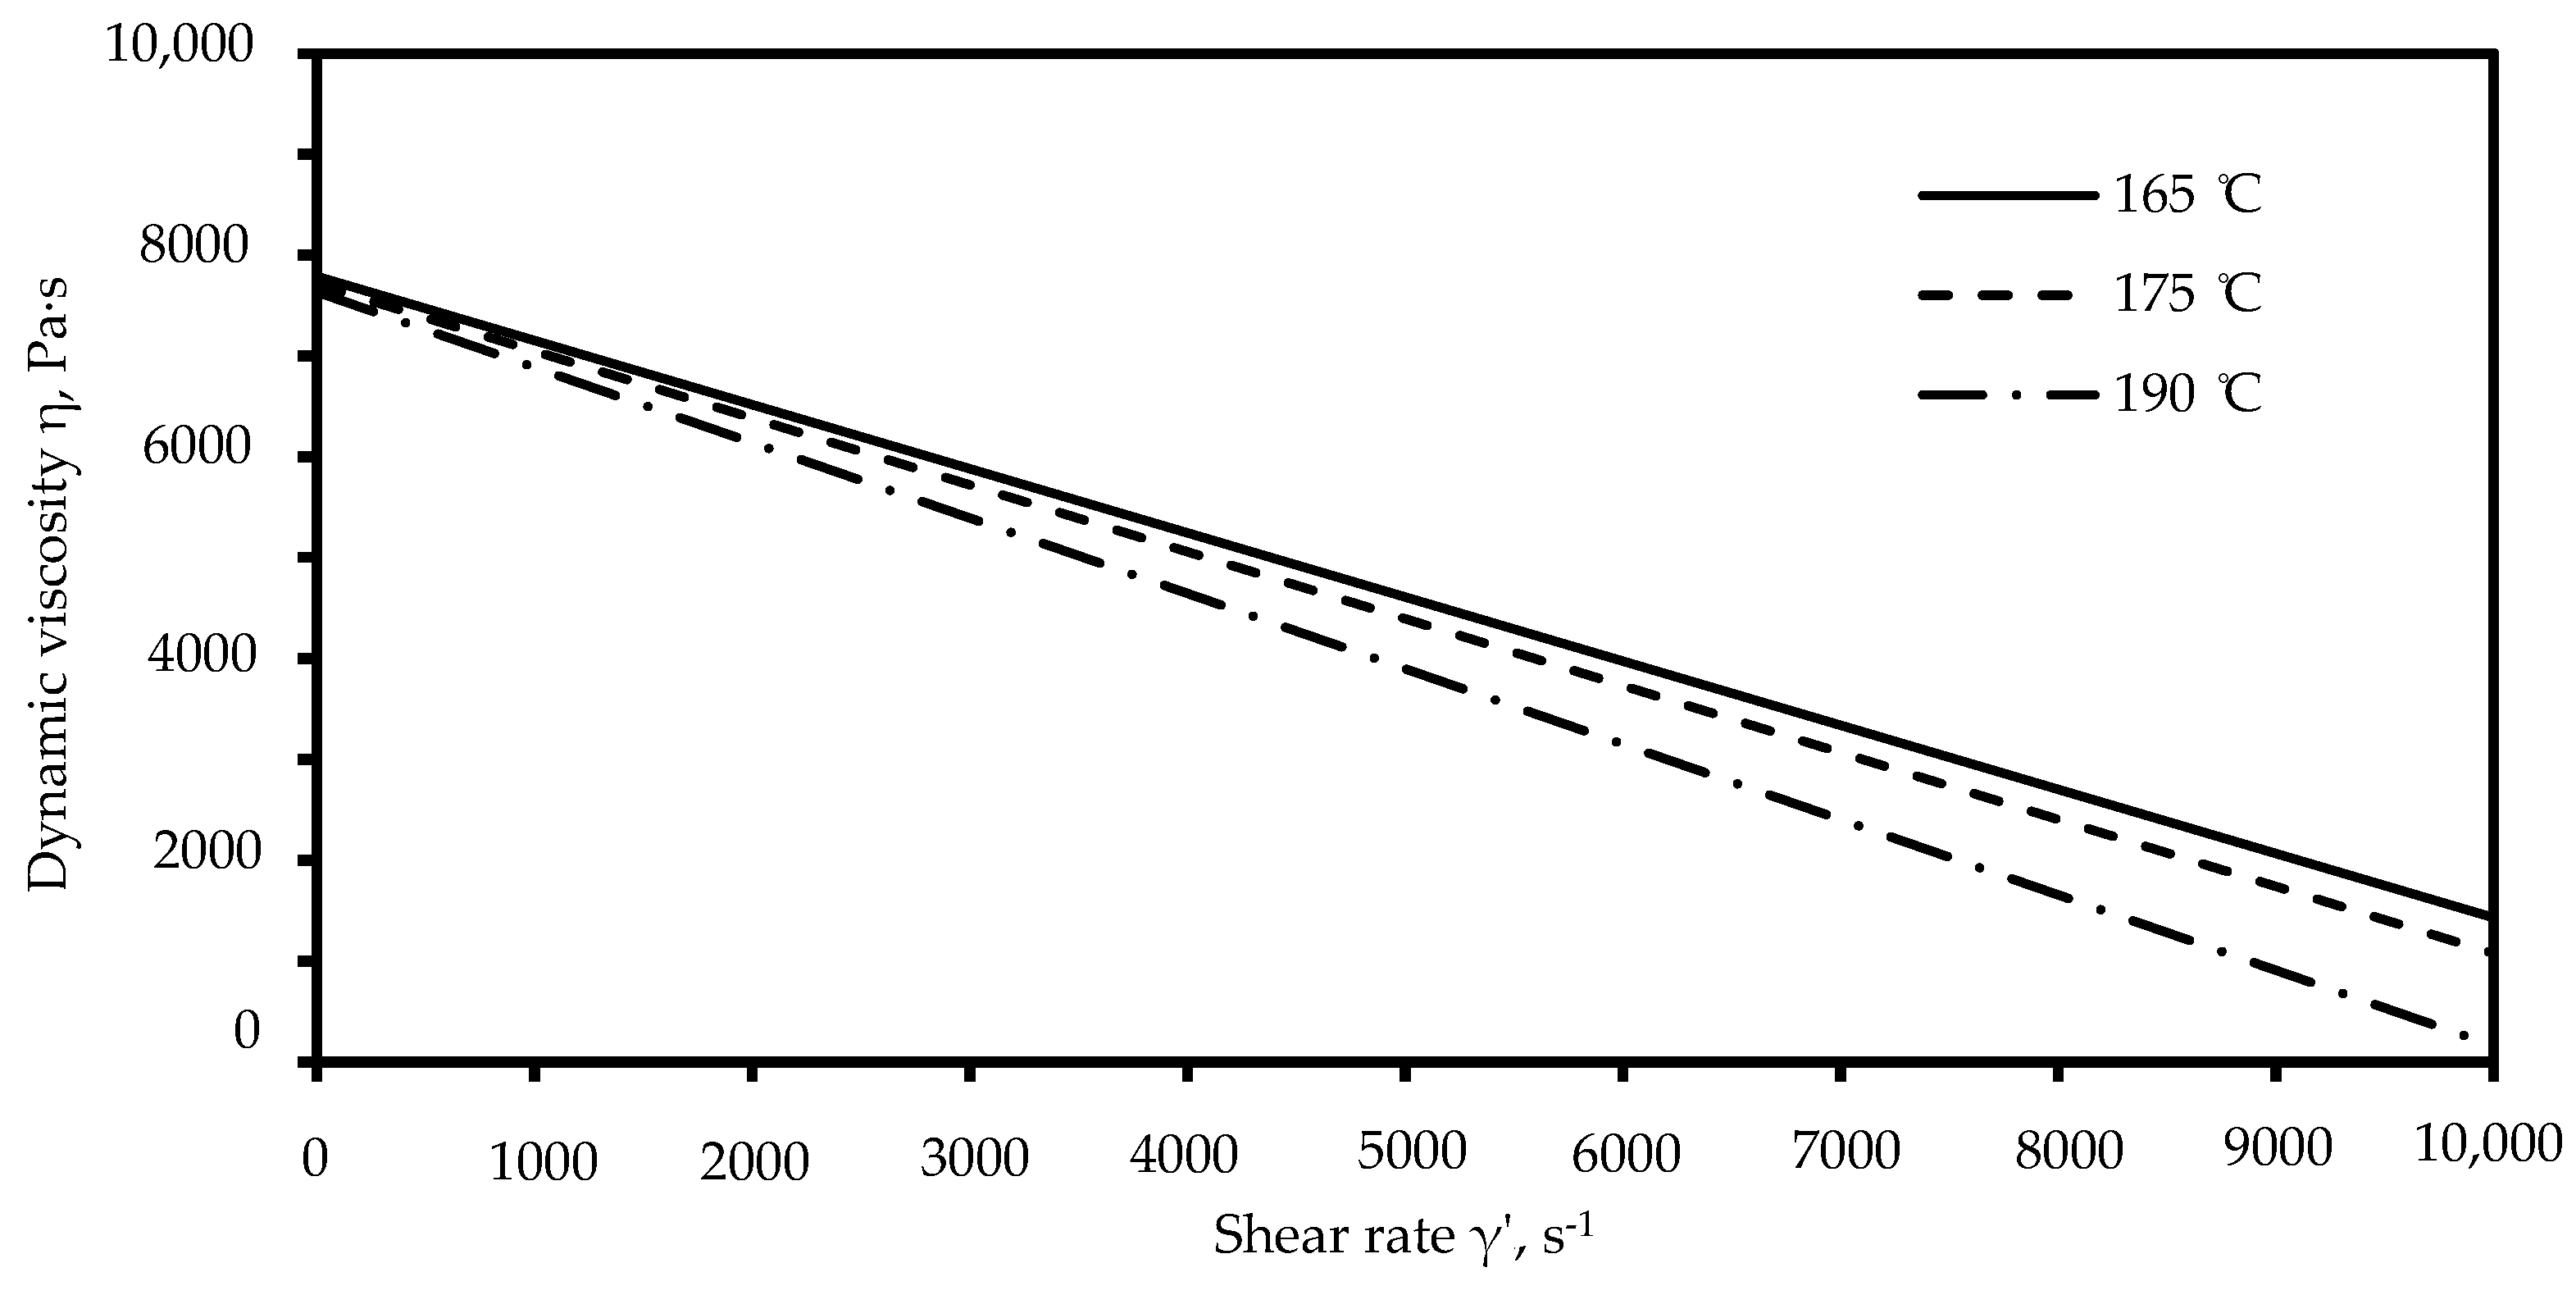
- Kutsbakh, A.A.; Muranov, A.N.; Semenov, A.B.; Semenov, B.I. The Rheological Behavior of Powder–Polymer Blends and Model Description of Feedstock Viscosity for Numerical Simulation of the Injection Molding Process. Polym. Sci. Ser. D 2022, 15, 701–708. [Google Scholar] [CrossRef]
- Kazmer, D.O. Injection Mold Design Engineering; Carl Hanser Verlag GmbH & Co.: Munich, Germany, 2022. [Google Scholar] [CrossRef]
- Párizs, R.D.; Török, D.; Ageyeva, T.; Kovács, J.G. Machine Learning in Injection Molding: An Industry 4.0 Method of Quality Prediction. Sensors 2022, 22, 2704. [Google Scholar] [CrossRef] [PubMed]
- Mehta, E.S.; Padhi, S.N. Quality and Defect Prediction in Plastic Injection Molding Using Machine Learning Algorithms Based Gating Systems and Its Mathematical Models. Int. J. Recent Innov. Trends Comput. Commun. 2023, 11, 216–230. [Google Scholar] [CrossRef]


| Type of Defect | Possible Causes | Possible Solutions |
|---|---|---|
| Flash | Excessively high molding pressure, poor flatness of the molding split line, excessively large ventilation channel | Use larger tonnage machines, correct mold design, use lower injection rate and molding pressure, optimize switch point |
| Sticking in the injection mold | Excessively high molding pressure, specifics of the thermal shrinkage, early ejection, irrational mold design, and/or poor mold quality | Use lower injection rates, molding/holding pressures, and mold temperatures; increase cooling time; increase mold slopes; change pusher areas and locations; change binder composition |
| Caverns | Thermal shrinkage, low density | Increase molding/holding pressure and injection rate, reduce mold temperature, increase feeder area, add ventilation ducts, reduce rate while passing through thick sections |
| Voids | Captured gas, absorbed moisture | Increase holding pressure, reduce injection rate, increase mold temperature, increase feeder area, move feeder to thicker sections |
| Burn marks | Superheated binder | Reduce injection rate and feedstock temperatures, increase feeder area, change feeder location |
| Weld line | Supercooled feedstock | Increase injection rate and mold and feedstock temperature, increase feeder area, add ventilation ducts or overflow ducts near the weld line location, relocate feeder, change part design to avoid flow partition |
| Flow marks | Cold feedstock in the matrix | Increase injection rate and mold and feedstock temperatures, increase feeder area, change feeder location |
| Technological Parameter | Values | |
|---|---|---|
| Used by the Manufacturer | Experimental | |
| Pre-pressing pressure, MPa | Not more than 120 | 120, 150, 180 |
| Injection rate, cm3/s | 40 | 10…40 with an interval of 5 cm3/s |
| Melt temperature, °C (K) | 160 (333.15) | 160, 170, 180 (333.15, 343.15, 353.15) |
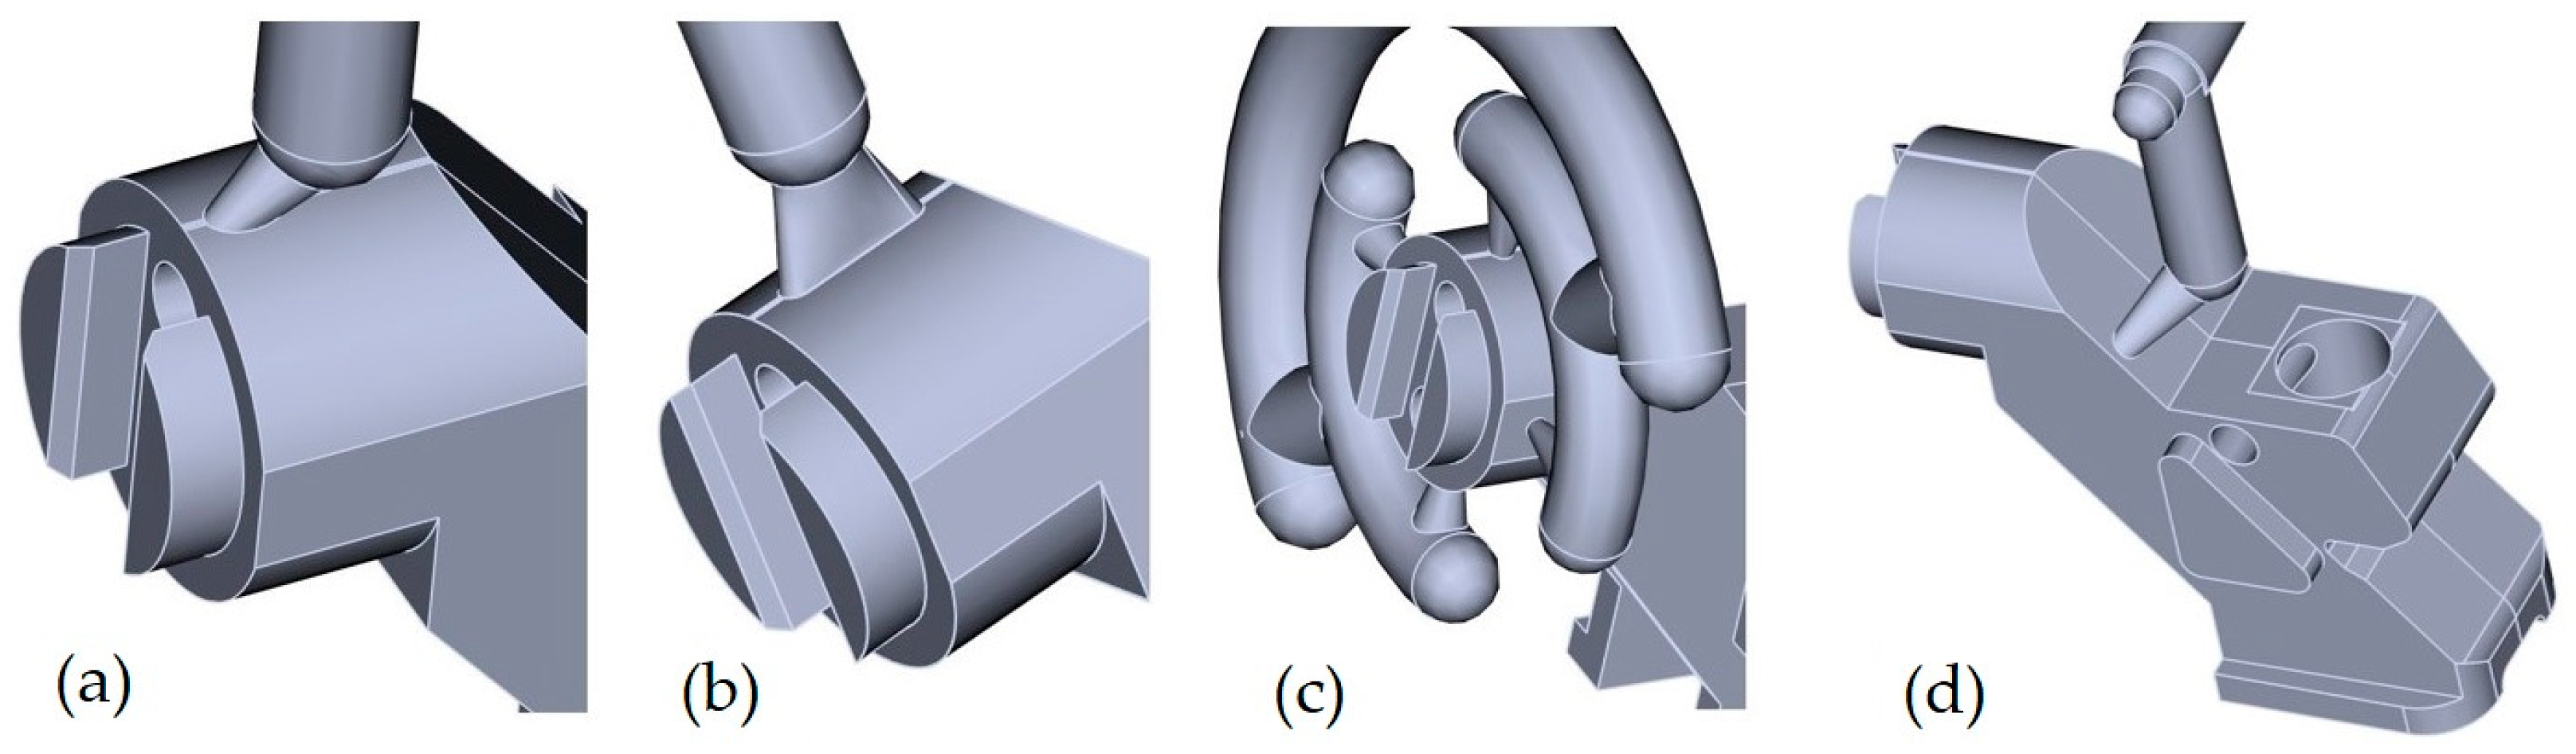
| No. | Type of Feeder | Description of Feeder | Result of Analysis |
|---|---|---|---|
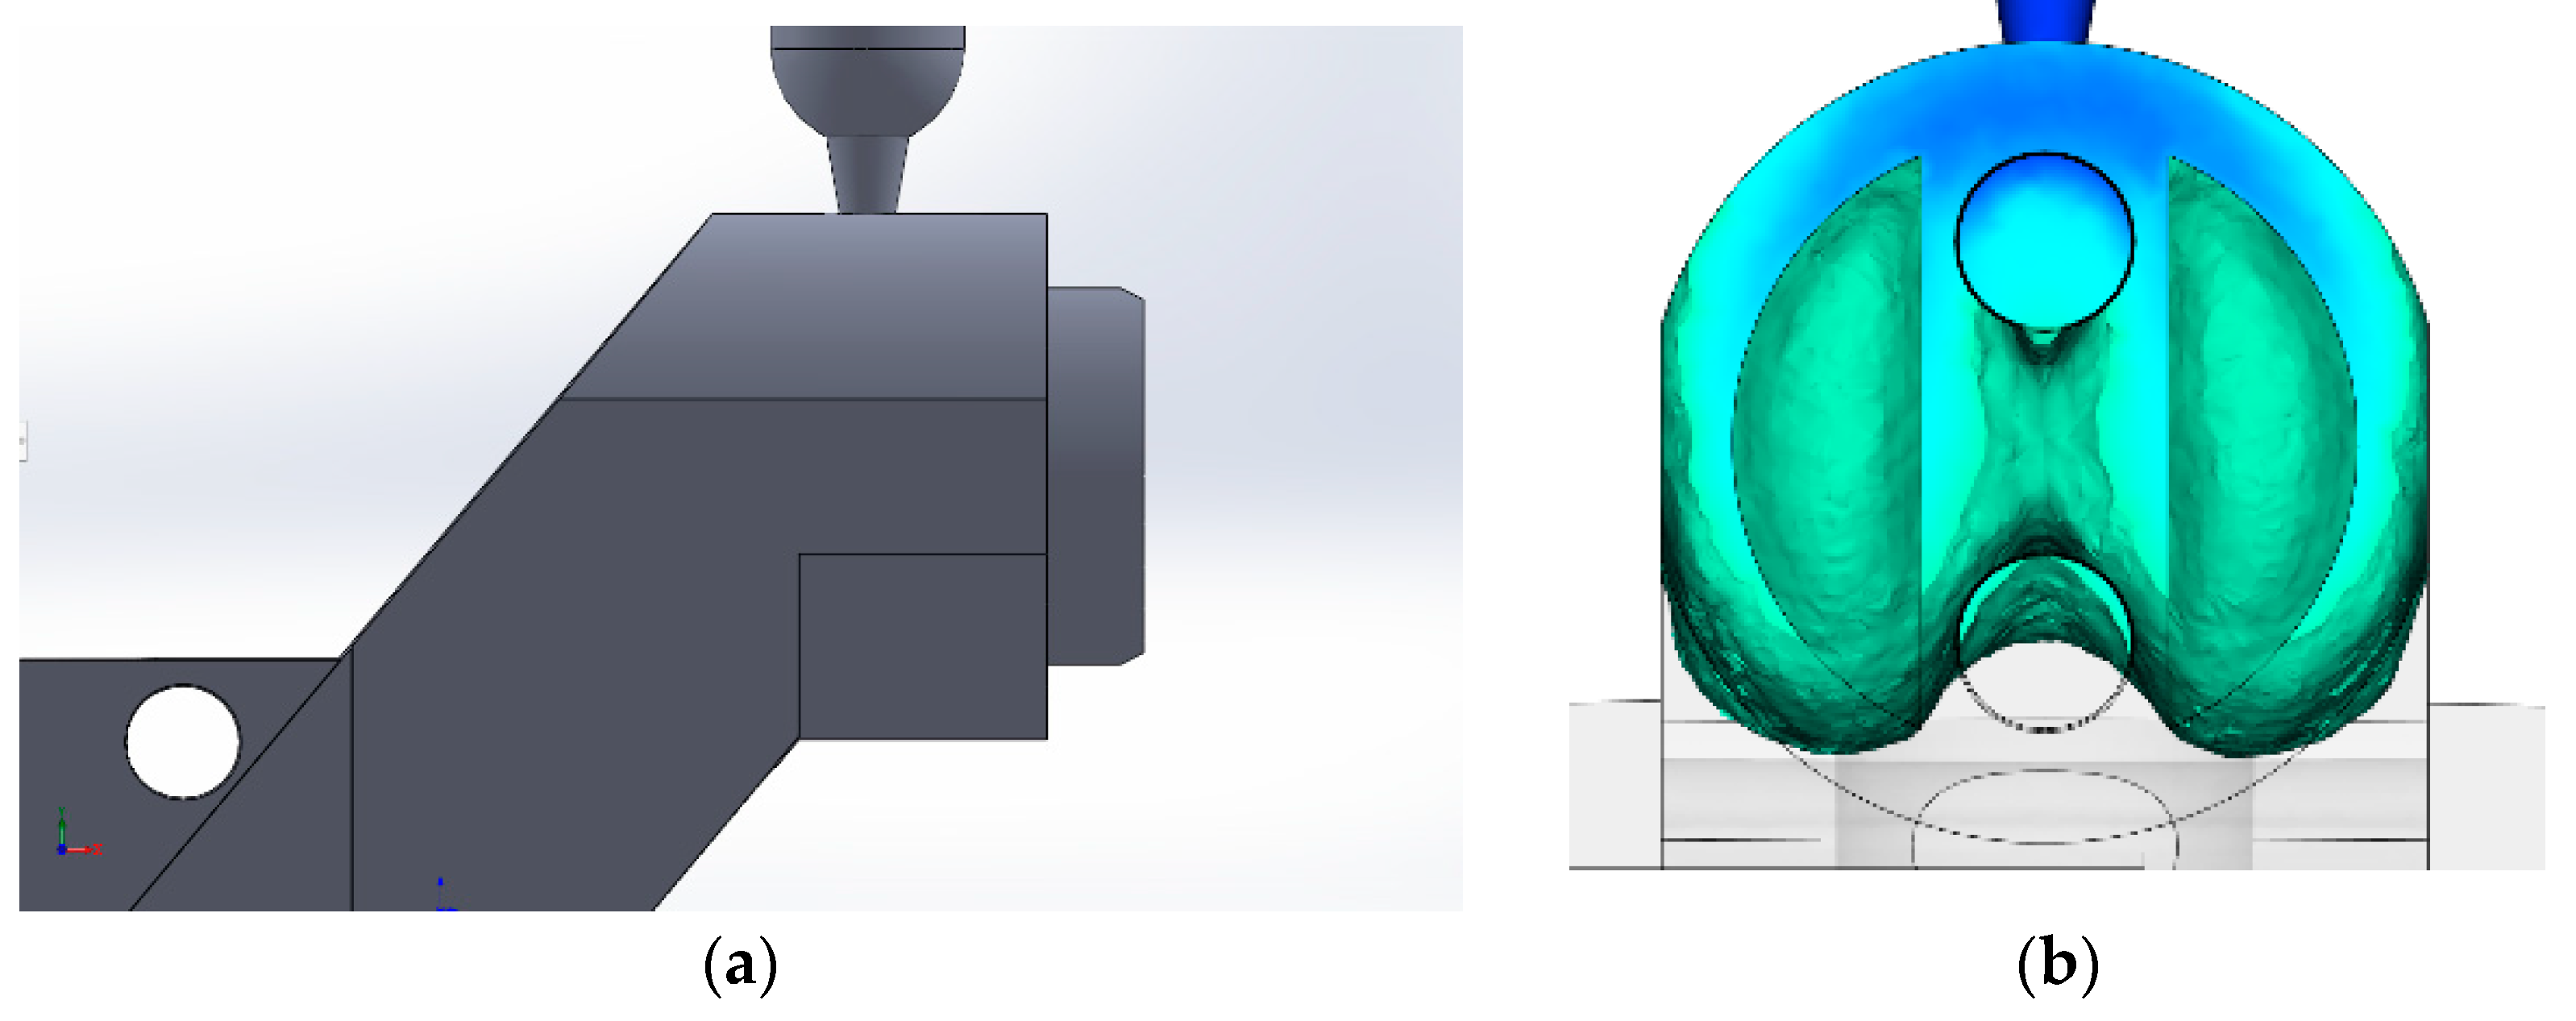
| 1 | Right point feeder (Figure A1) | Truncated right cone, inlet sprue diameter 1.3 mm, located in the massive part of the casting | Unsatisfactory. Potential gas trapping between the rods. |
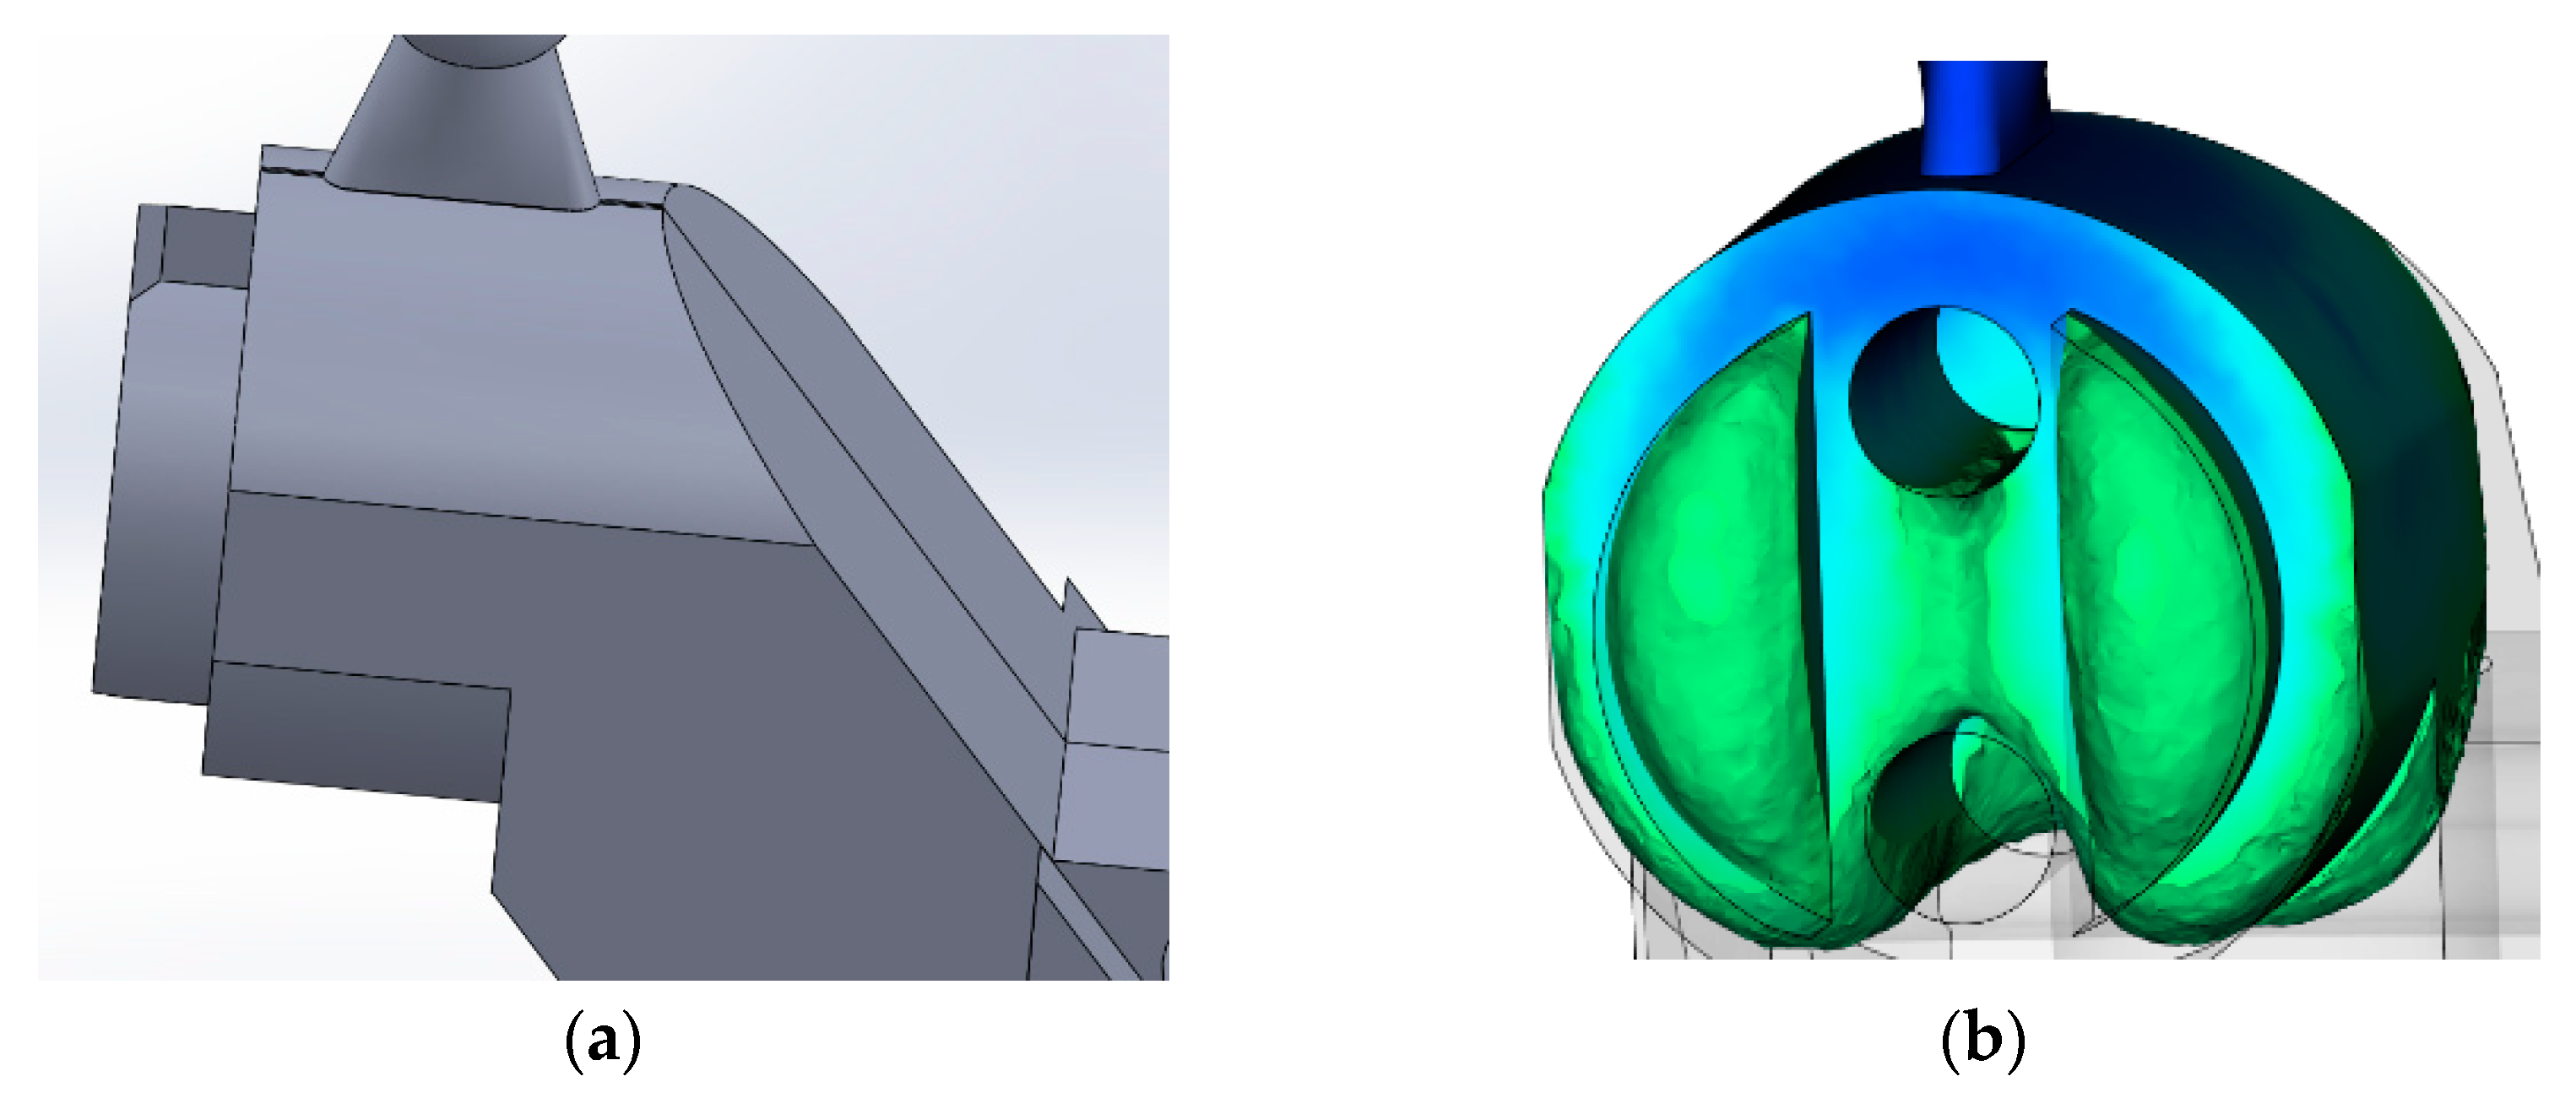
| 2 | Inclined point feeder (Figure A2) | Truncated inclined cone, inlet sprue diameter 1.3 mm, angle of inclination with horizontal plane 30°, melt flow is directed into the casting wall | Unsatisfactory. Potential gas trapping between the rods. |
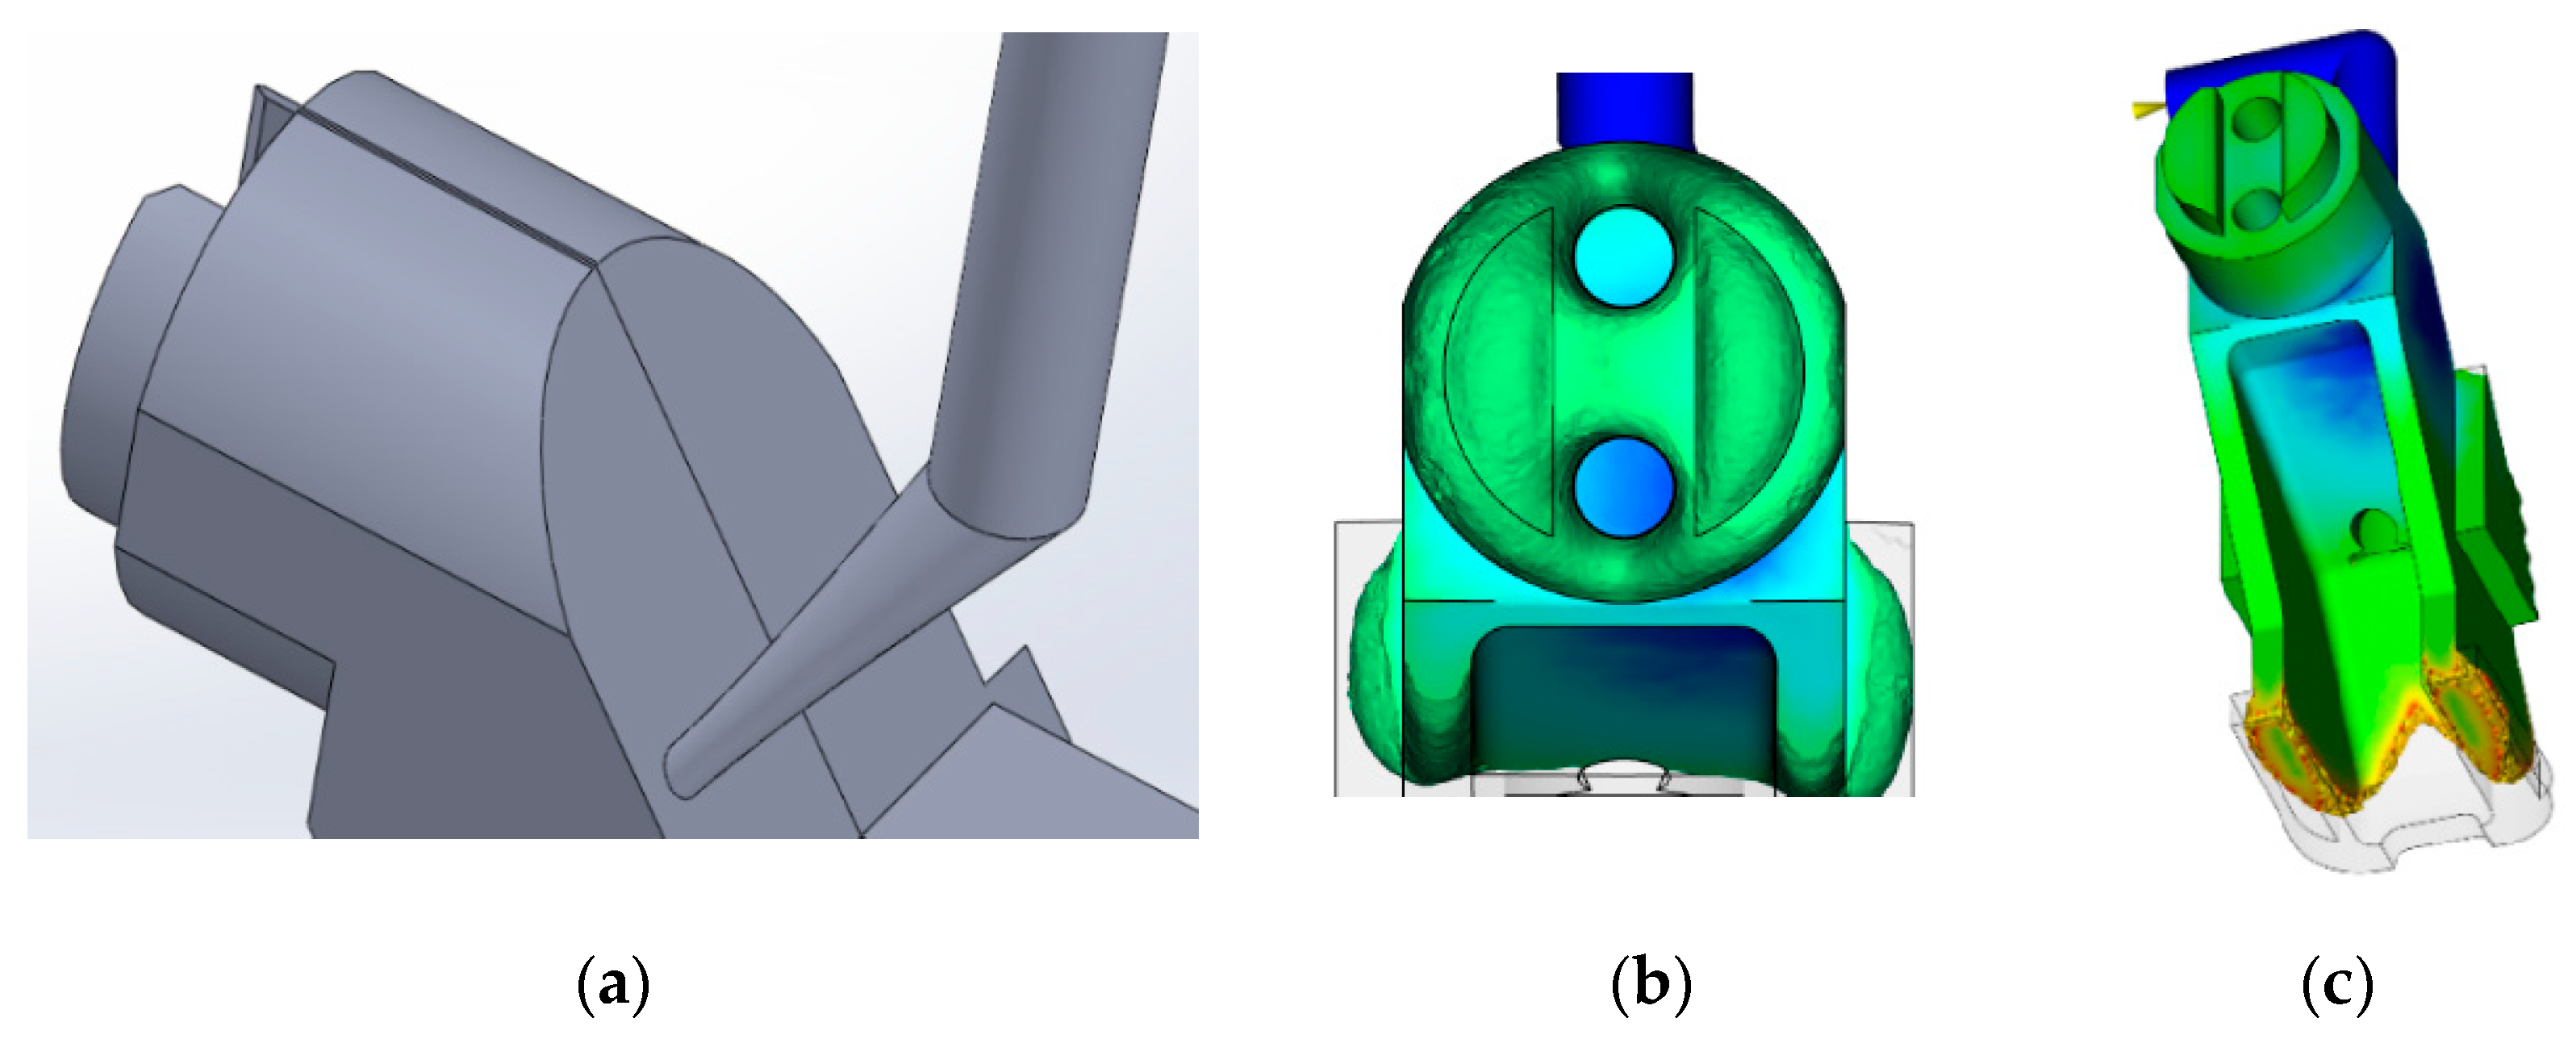
| 3 | Slot feeder (Figure A3) | The cross-section is an equilateral trapezoid, the contact area with the casting is 6.7 mm2 | Unsatisfactory. Potential gas trapping between the rods. |
| 4 | Tunnel feeder (Figure A4) | Truncated right cone, inlet sprue diameter 1.3 mm, melt flow is directed to the side wall | Unsatisfactory. Short molding. The character of the rod streamline is satisfactory. |
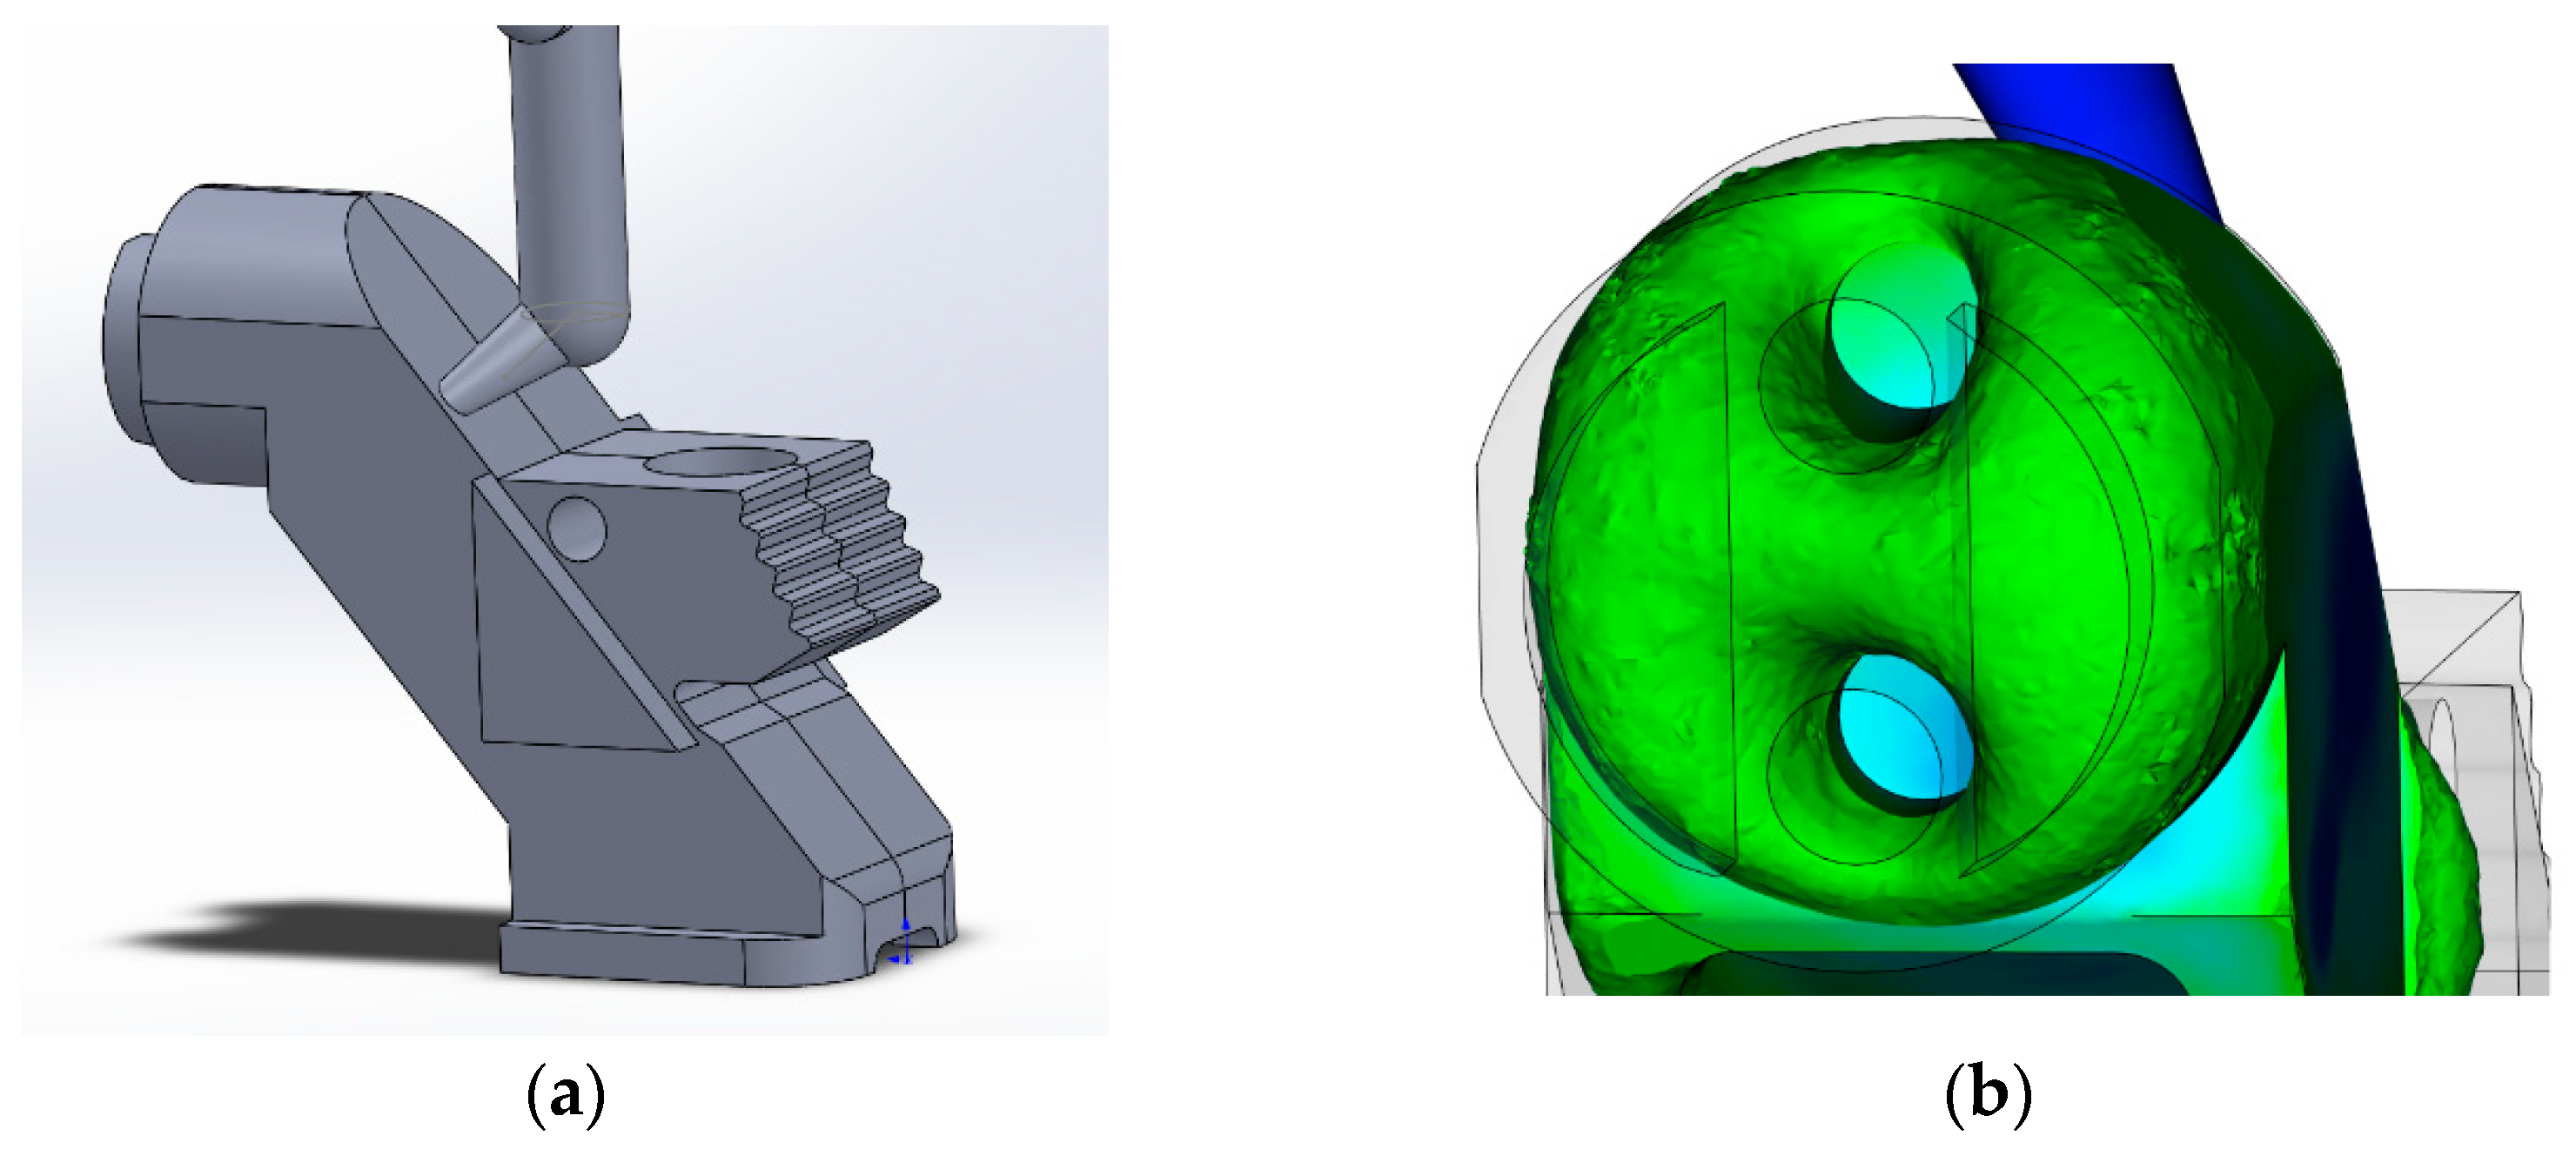
| 5 | Tunnel feeder with increased inlet sprue diameter (Figure A5) | Truncated right cone, inlet sprue diameter 2 mm, melt flow is directed to the side wall | The nature of the filling is satisfactory. |
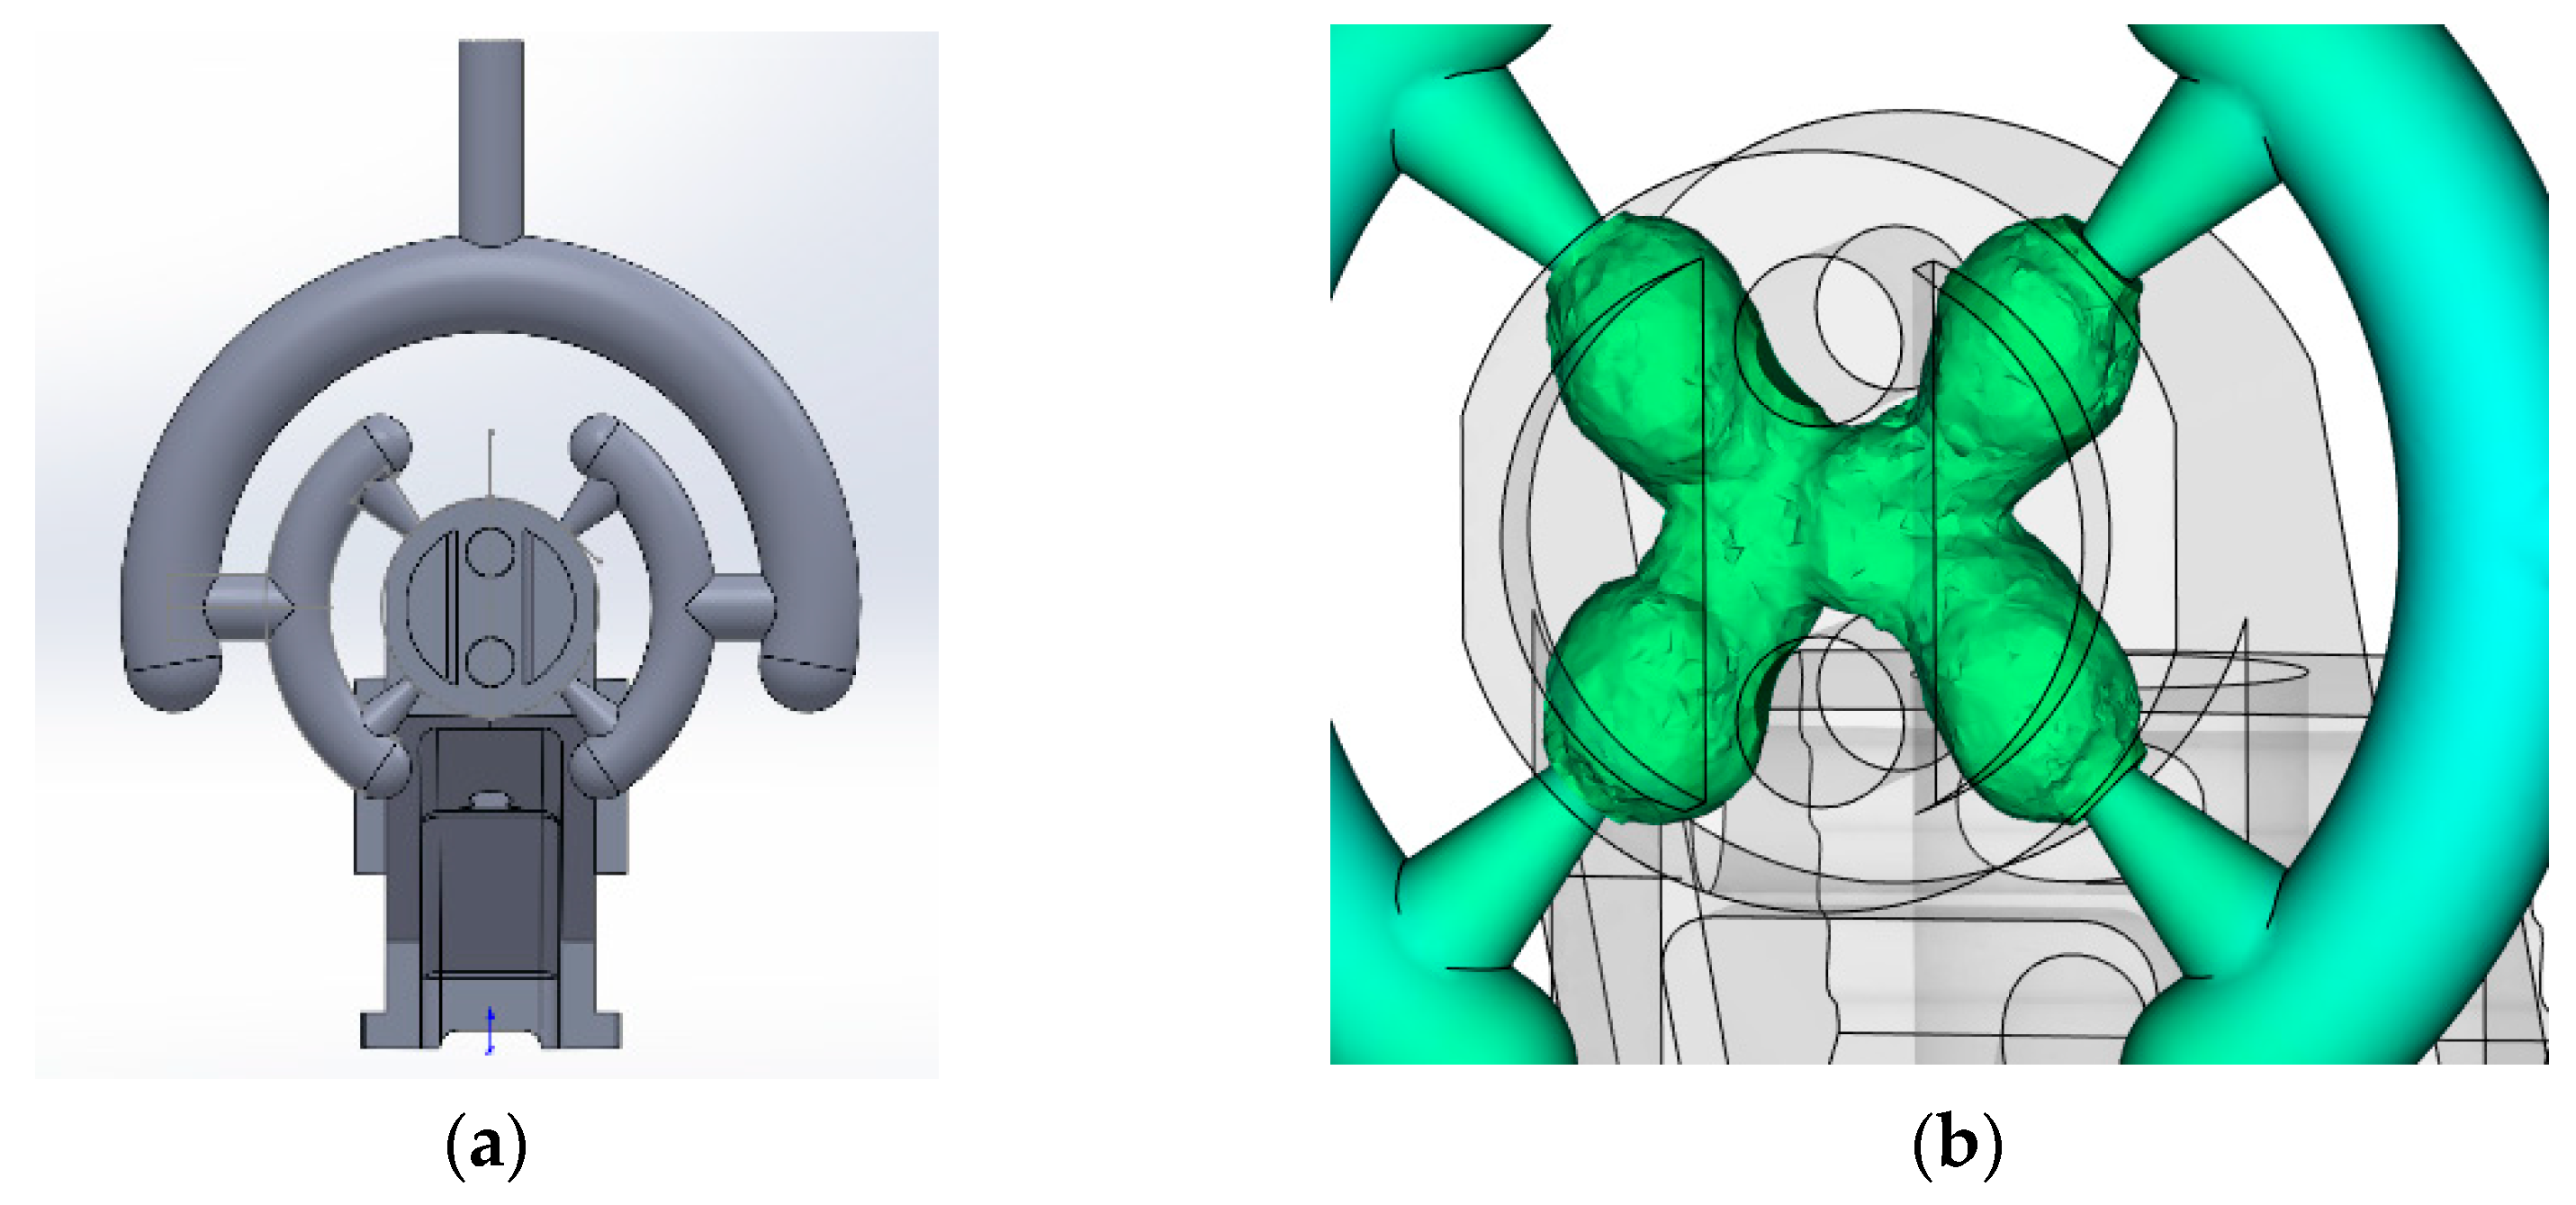
| 6 | Circular point feeder, the first variant (Figure A6) | Four straight-point inlet sprues located at angles of 0 ° and 90° from the symmetry plane, inlet sprue diameter is 1.3 mm | Unsatisfactory. Potential gas trapping between the rods. |
| 7 | Circular point feeder, the second variant (Figure A7) | Four straight-point inlet sprues located at an angle of 45° from the symmetry plane, inlet sprue diameter is 1.3 mm | Unsatisfactory. Jet filling character. |
Disclaimer/Publisher’s Note: The statements, opinions and data contained in all publications are solely those of the individual author(s) and contributor(s) and not of MDPI and/or the editor(s). MDPI and/or the editor(s) disclaim responsibility for any injury to people or property resulting from any ideas, methods, instructions or products referred to in the content. |
© 2025 by the authors. Licensee MDPI, Basel, Switzerland. This article is an open access article distributed under the terms and conditions of the Creative Commons Attribution (CC BY) license (https://creativecommons.org/licenses/by/4.0/).
Share and Cite
Kutsbakh, A.; Muranov, A.; Pervushin, A.; Semenov, A. Modeling of Feedstock Formability to Optimize Mold Design and Prevent Possible Defects During Metal Injection Molding. J. Manuf. Mater. Process. 2025, 9, 203. https://doi.org/10.3390/jmmp9060203
Kutsbakh A, Muranov A, Pervushin A, Semenov A. Modeling of Feedstock Formability to Optimize Mold Design and Prevent Possible Defects During Metal Injection Molding. Journal of Manufacturing and Materials Processing. 2025; 9(6):203. https://doi.org/10.3390/jmmp9060203
Chicago/Turabian StyleKutsbakh, Anatoly, Alexander Muranov, Alexey Pervushin, and Alexey Semenov. 2025. "Modeling of Feedstock Formability to Optimize Mold Design and Prevent Possible Defects During Metal Injection Molding" Journal of Manufacturing and Materials Processing 9, no. 6: 203. https://doi.org/10.3390/jmmp9060203
APA StyleKutsbakh, A., Muranov, A., Pervushin, A., & Semenov, A. (2025). Modeling of Feedstock Formability to Optimize Mold Design and Prevent Possible Defects During Metal Injection Molding. Journal of Manufacturing and Materials Processing, 9(6), 203. https://doi.org/10.3390/jmmp9060203