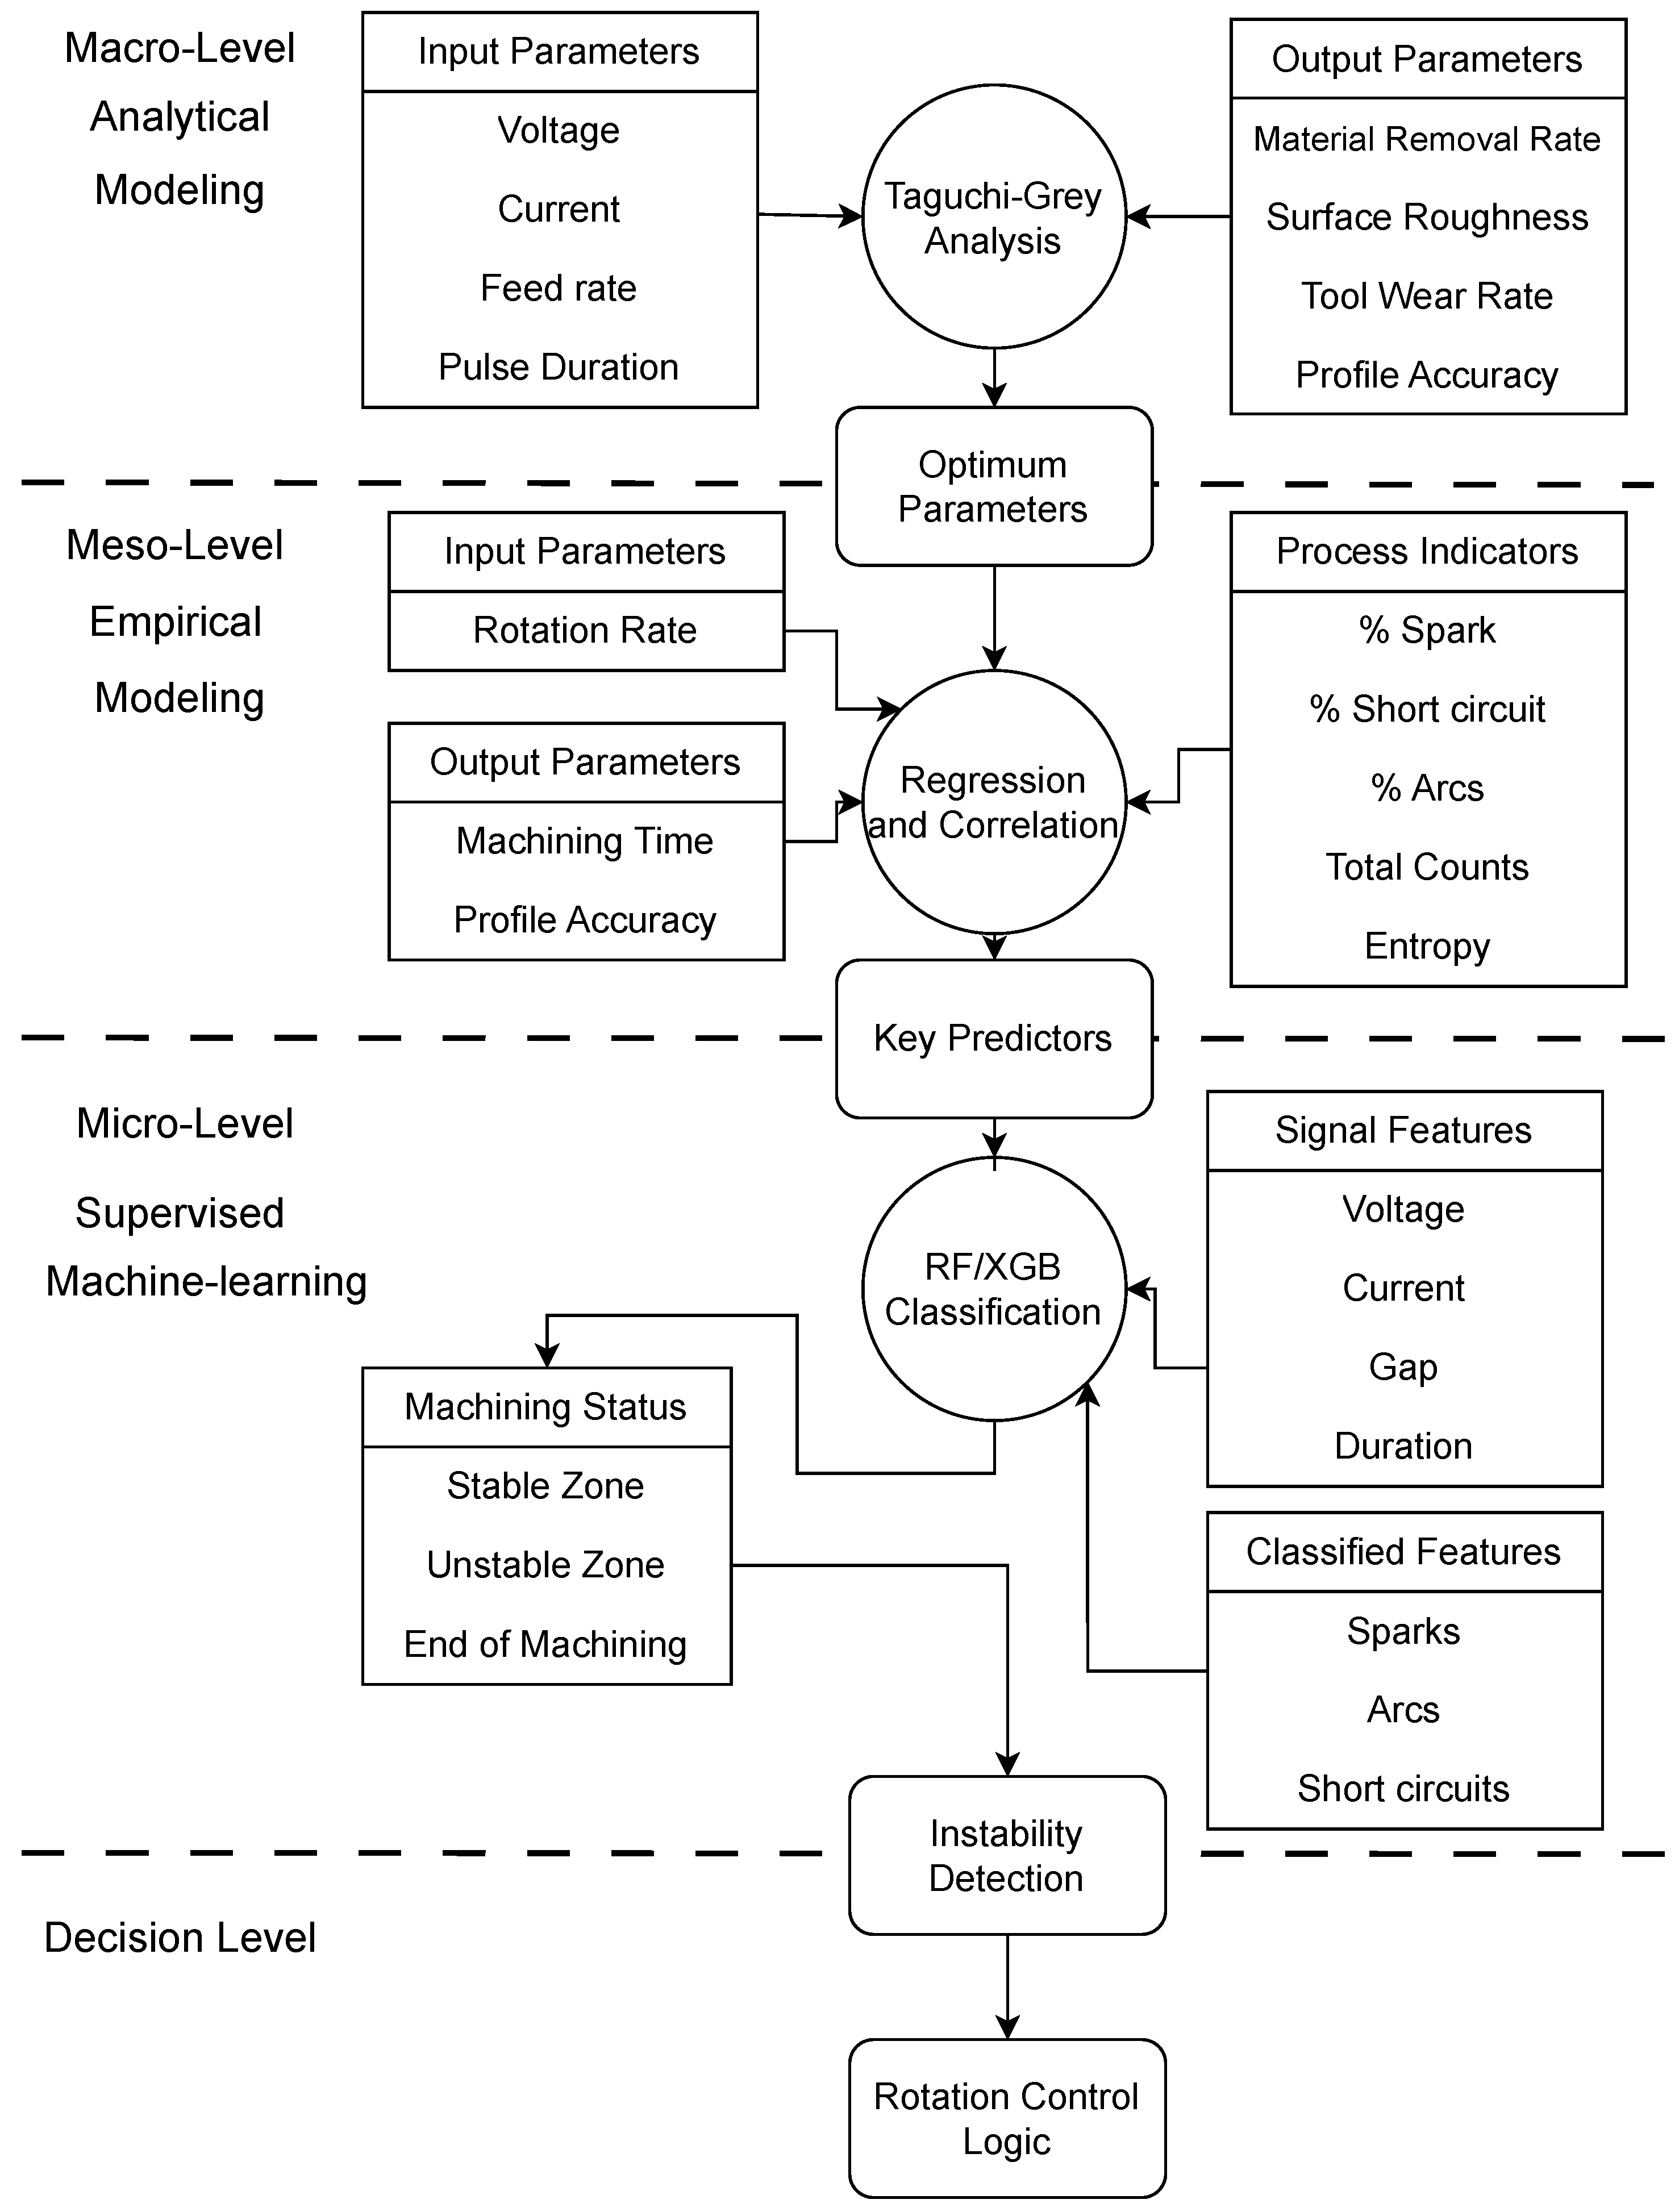
3.1. Parameter Optimization Using Taguchi–Grey and Regression Models
The summary of performance metrics and corresponding Grey relational grades (GRG) for each experimental condition is shown in
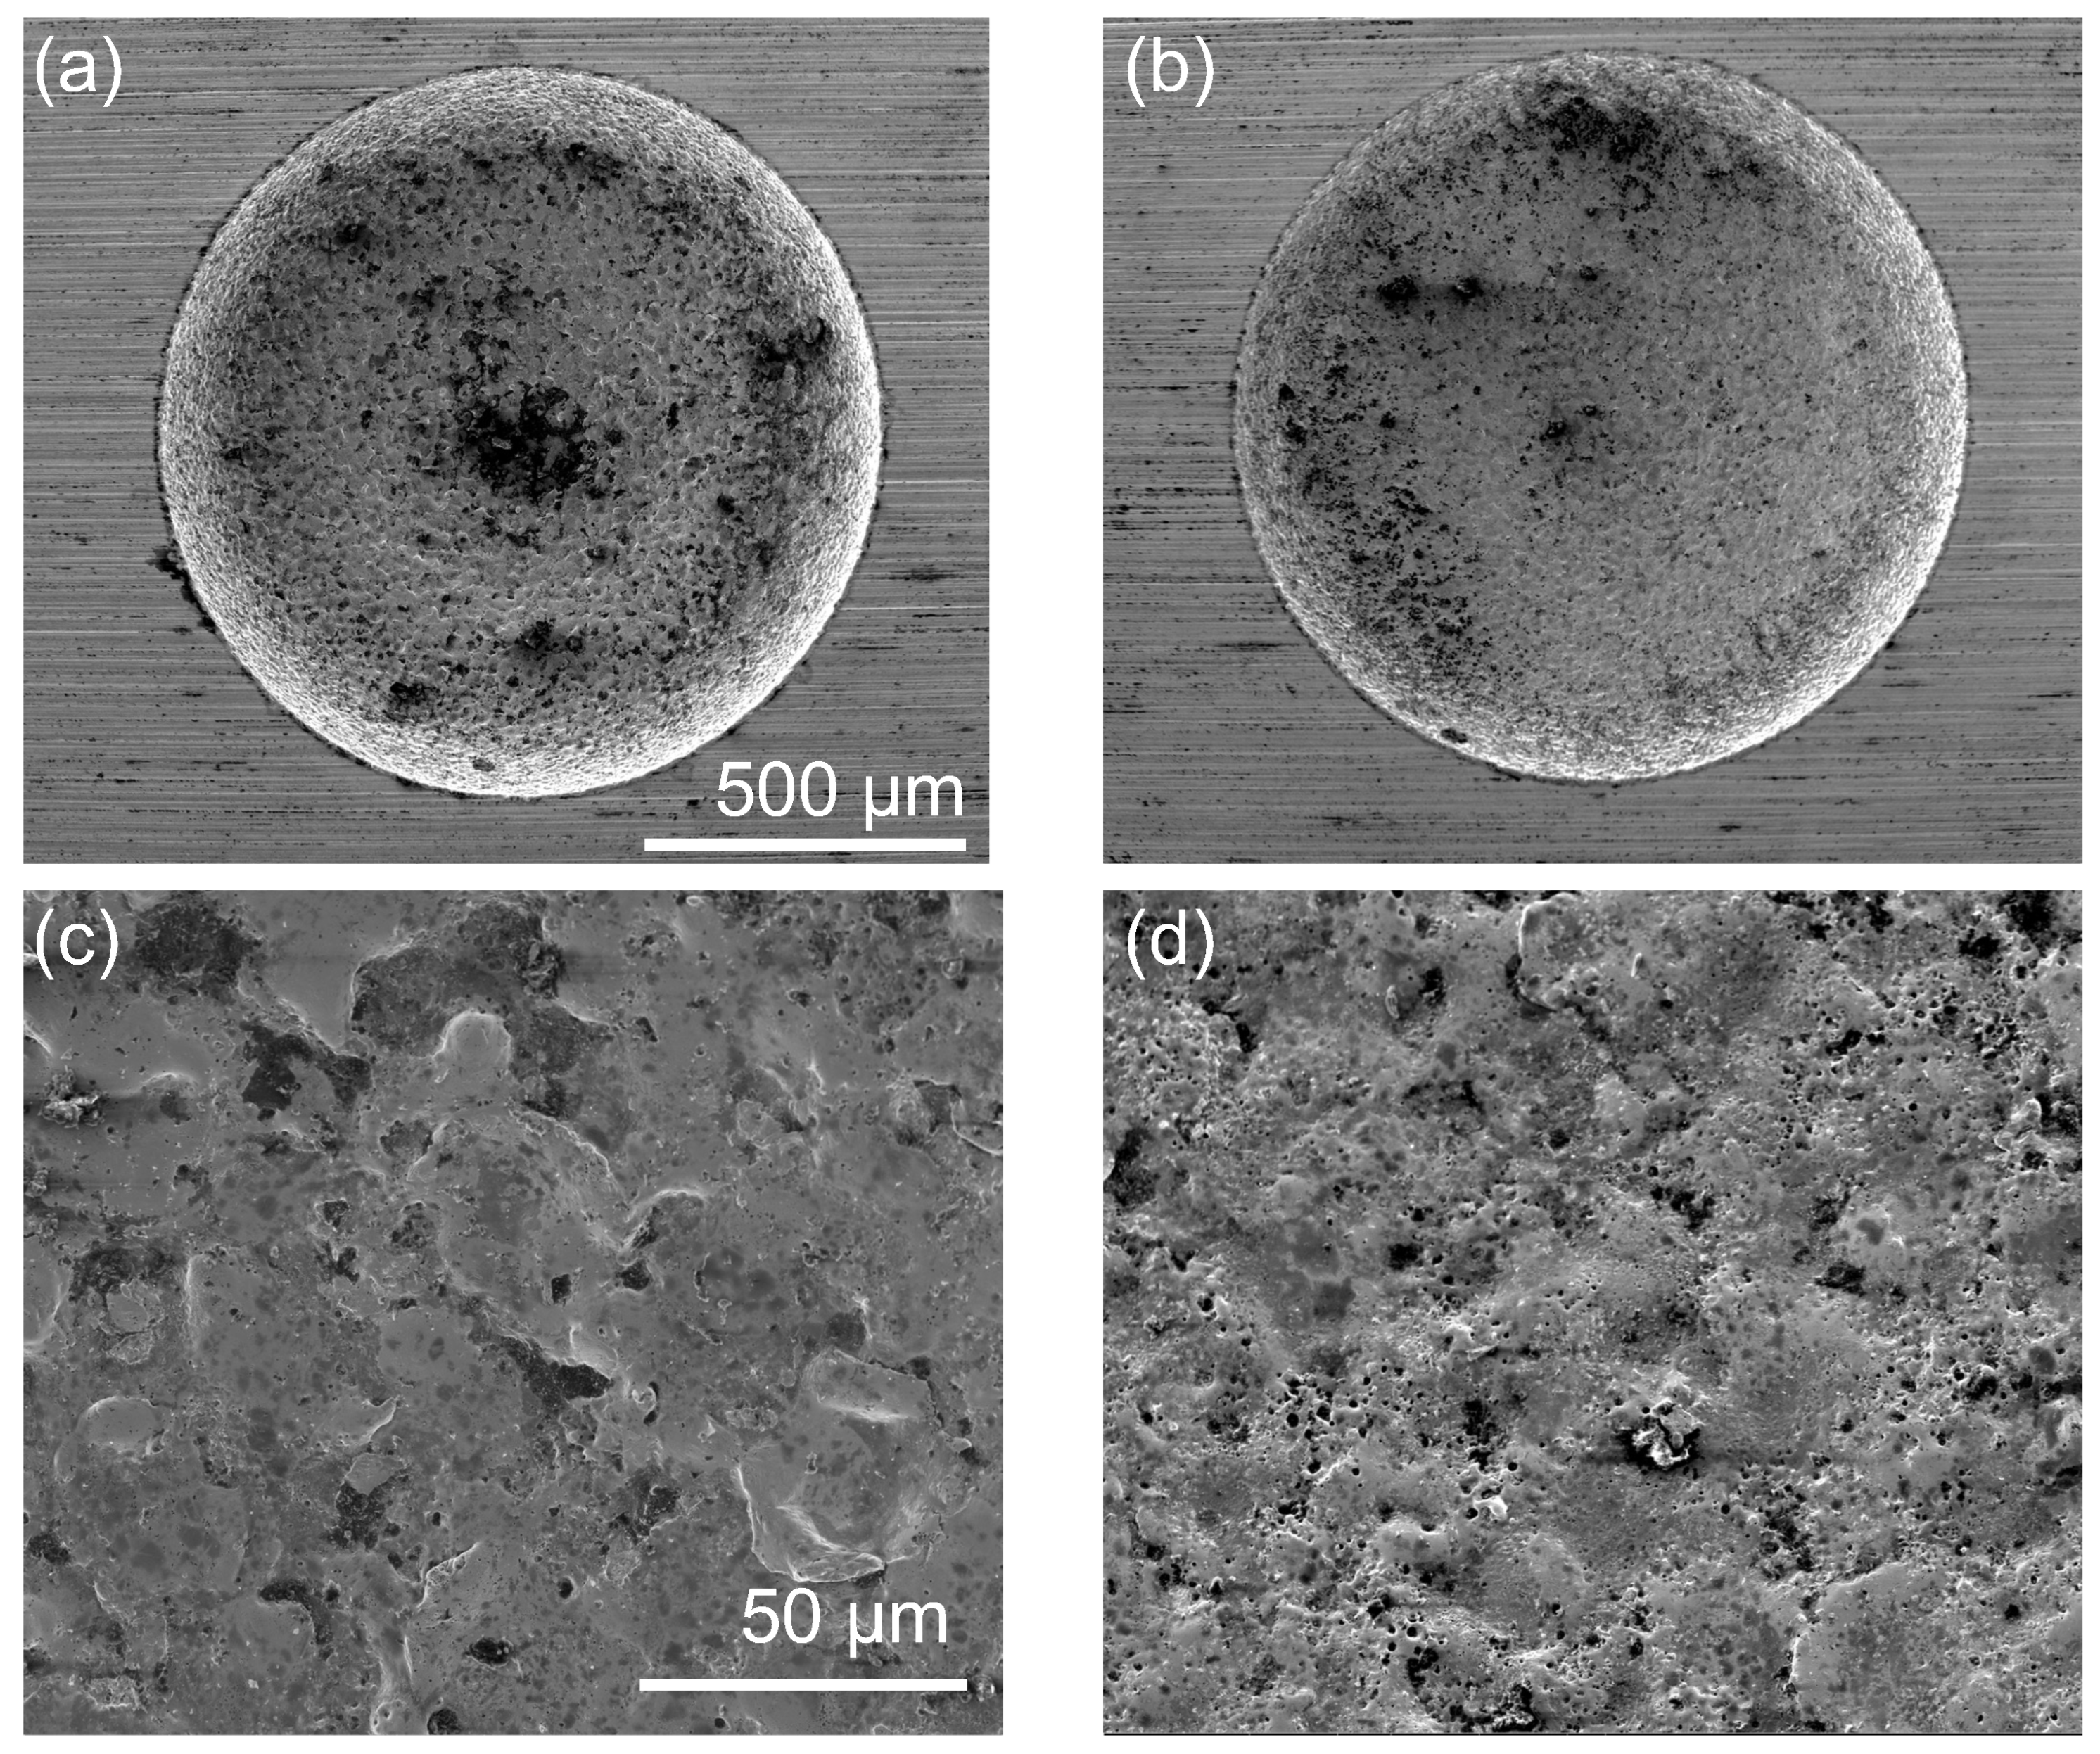
Table 4. Experiments 7 and 8 exhibited the highest GRG values. Subsequent SEM-based surface inspections, as seen in
Figure 7, revealed minimal surface defects such as micro-cracks in these samples, validating the selection. Experiment 7 was ultimately chosen for rotation rate evaluation experiments. The table for data normalization and Grey relational coefficients is shown in
Table A1.
Based on the methodologies described in
Section 2.2.3, linear regression models were evaluated using
and MAPE as shown in
Table 5. Only MRR and Sa achieved the target thresholds of
> 0.85 and MAPE < 20% and were considered suitable for interpretation. The MRR showed strong dependence on peak current and pulse-on duration (Equation (
9)). For Sa, as seen in Equation (
10), lower voltage, shorter pulse durations, and higher feed rates were found to be favorable for achieving better surface quality. These findings align with prior studies on the semi-finish EDM of hard materials [
35,
36,
37].
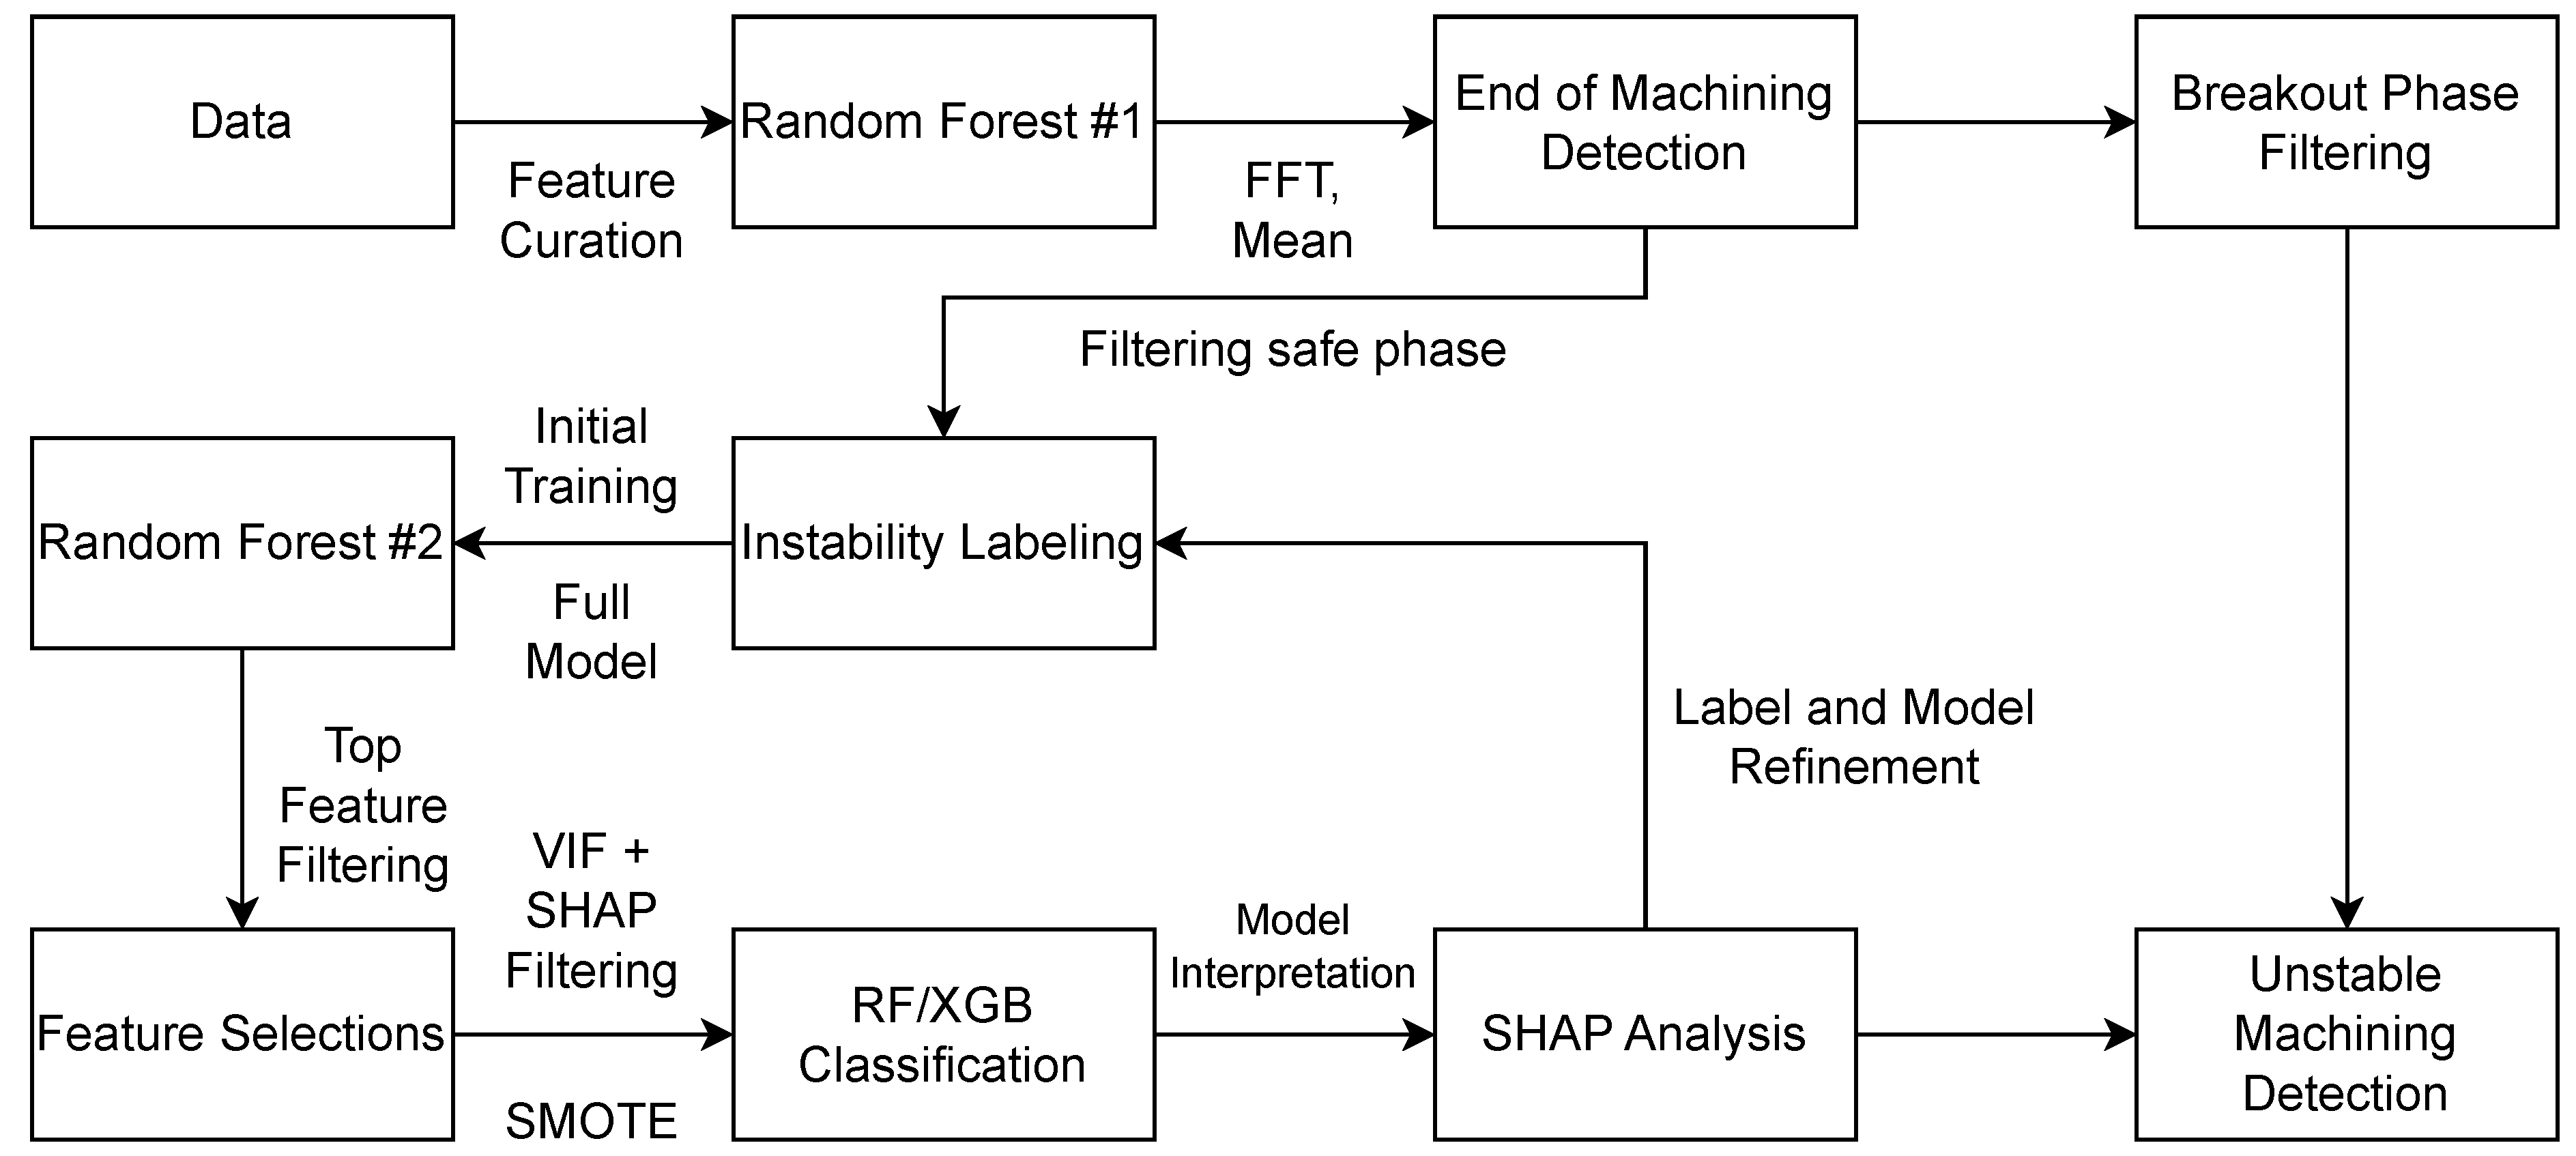
3.2. Exploratory Modeling and Feature Selection for Bad Condition Labeling
To evaluate machining performance across different rotation rates, an evaluation study was conducted, summarized in
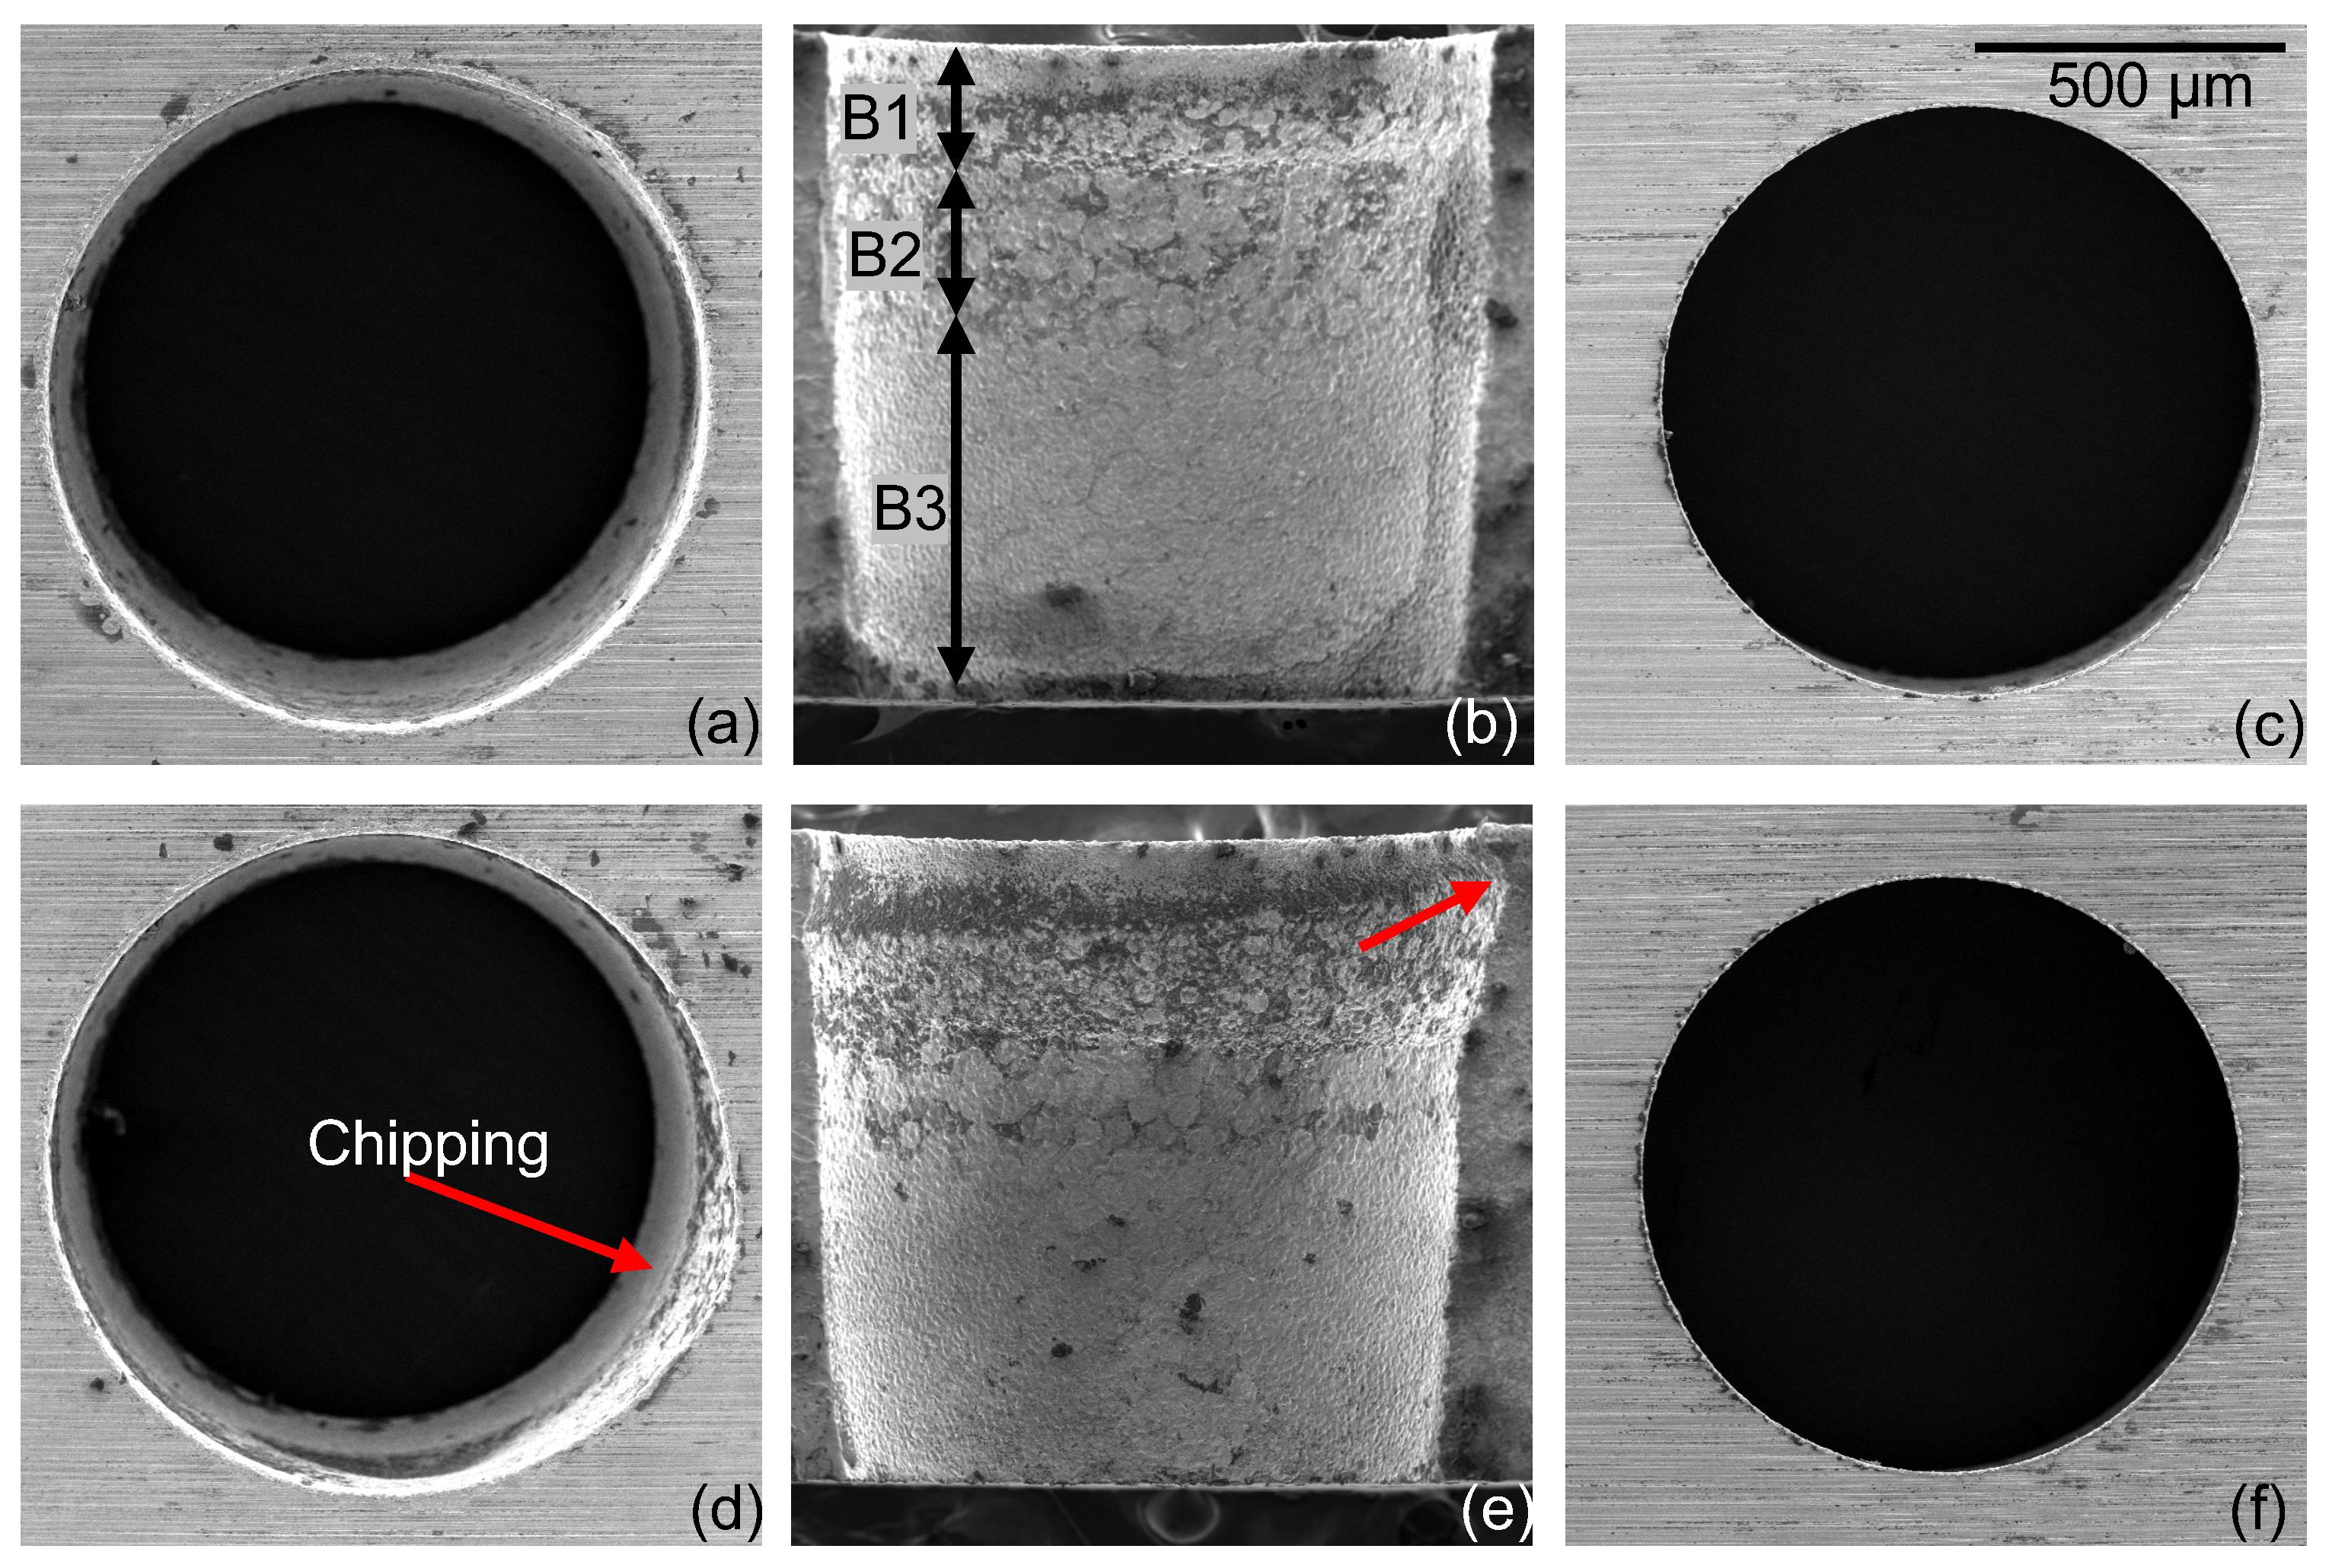
Table 6. Since the material removal rate for through-holes is directly influenced by both top and bottom diameters, machining time (Mach.Time) was considered as an independent metric. Additionally, as illustrated in
Figure 8d,e, inlet chipping was observed for some conditions, prompting the inclusion of roundness metrics (Top Rou, Bot Rou). Three distinct temporal surfaces (B1, B2, B3) were observed in the hole cross-sections (
Figure 8b,e), and were therefore excluded from quantitative analysis. Equal weights were assigned to the machining time, diameter, and roundness in the Grey relational grade (GRG) computation.
From the results, the best performance was observed at 1000 and 9000 RPM, which emerged as potential optima. Normalized data and Grey relation coefficients for these conditions are shown in
Table A2.
To explore empirical modeling, linear and non-linear regression models were applied using the rotation rate as a sole input variable as seen in
Table 7. However, most models yielded negative
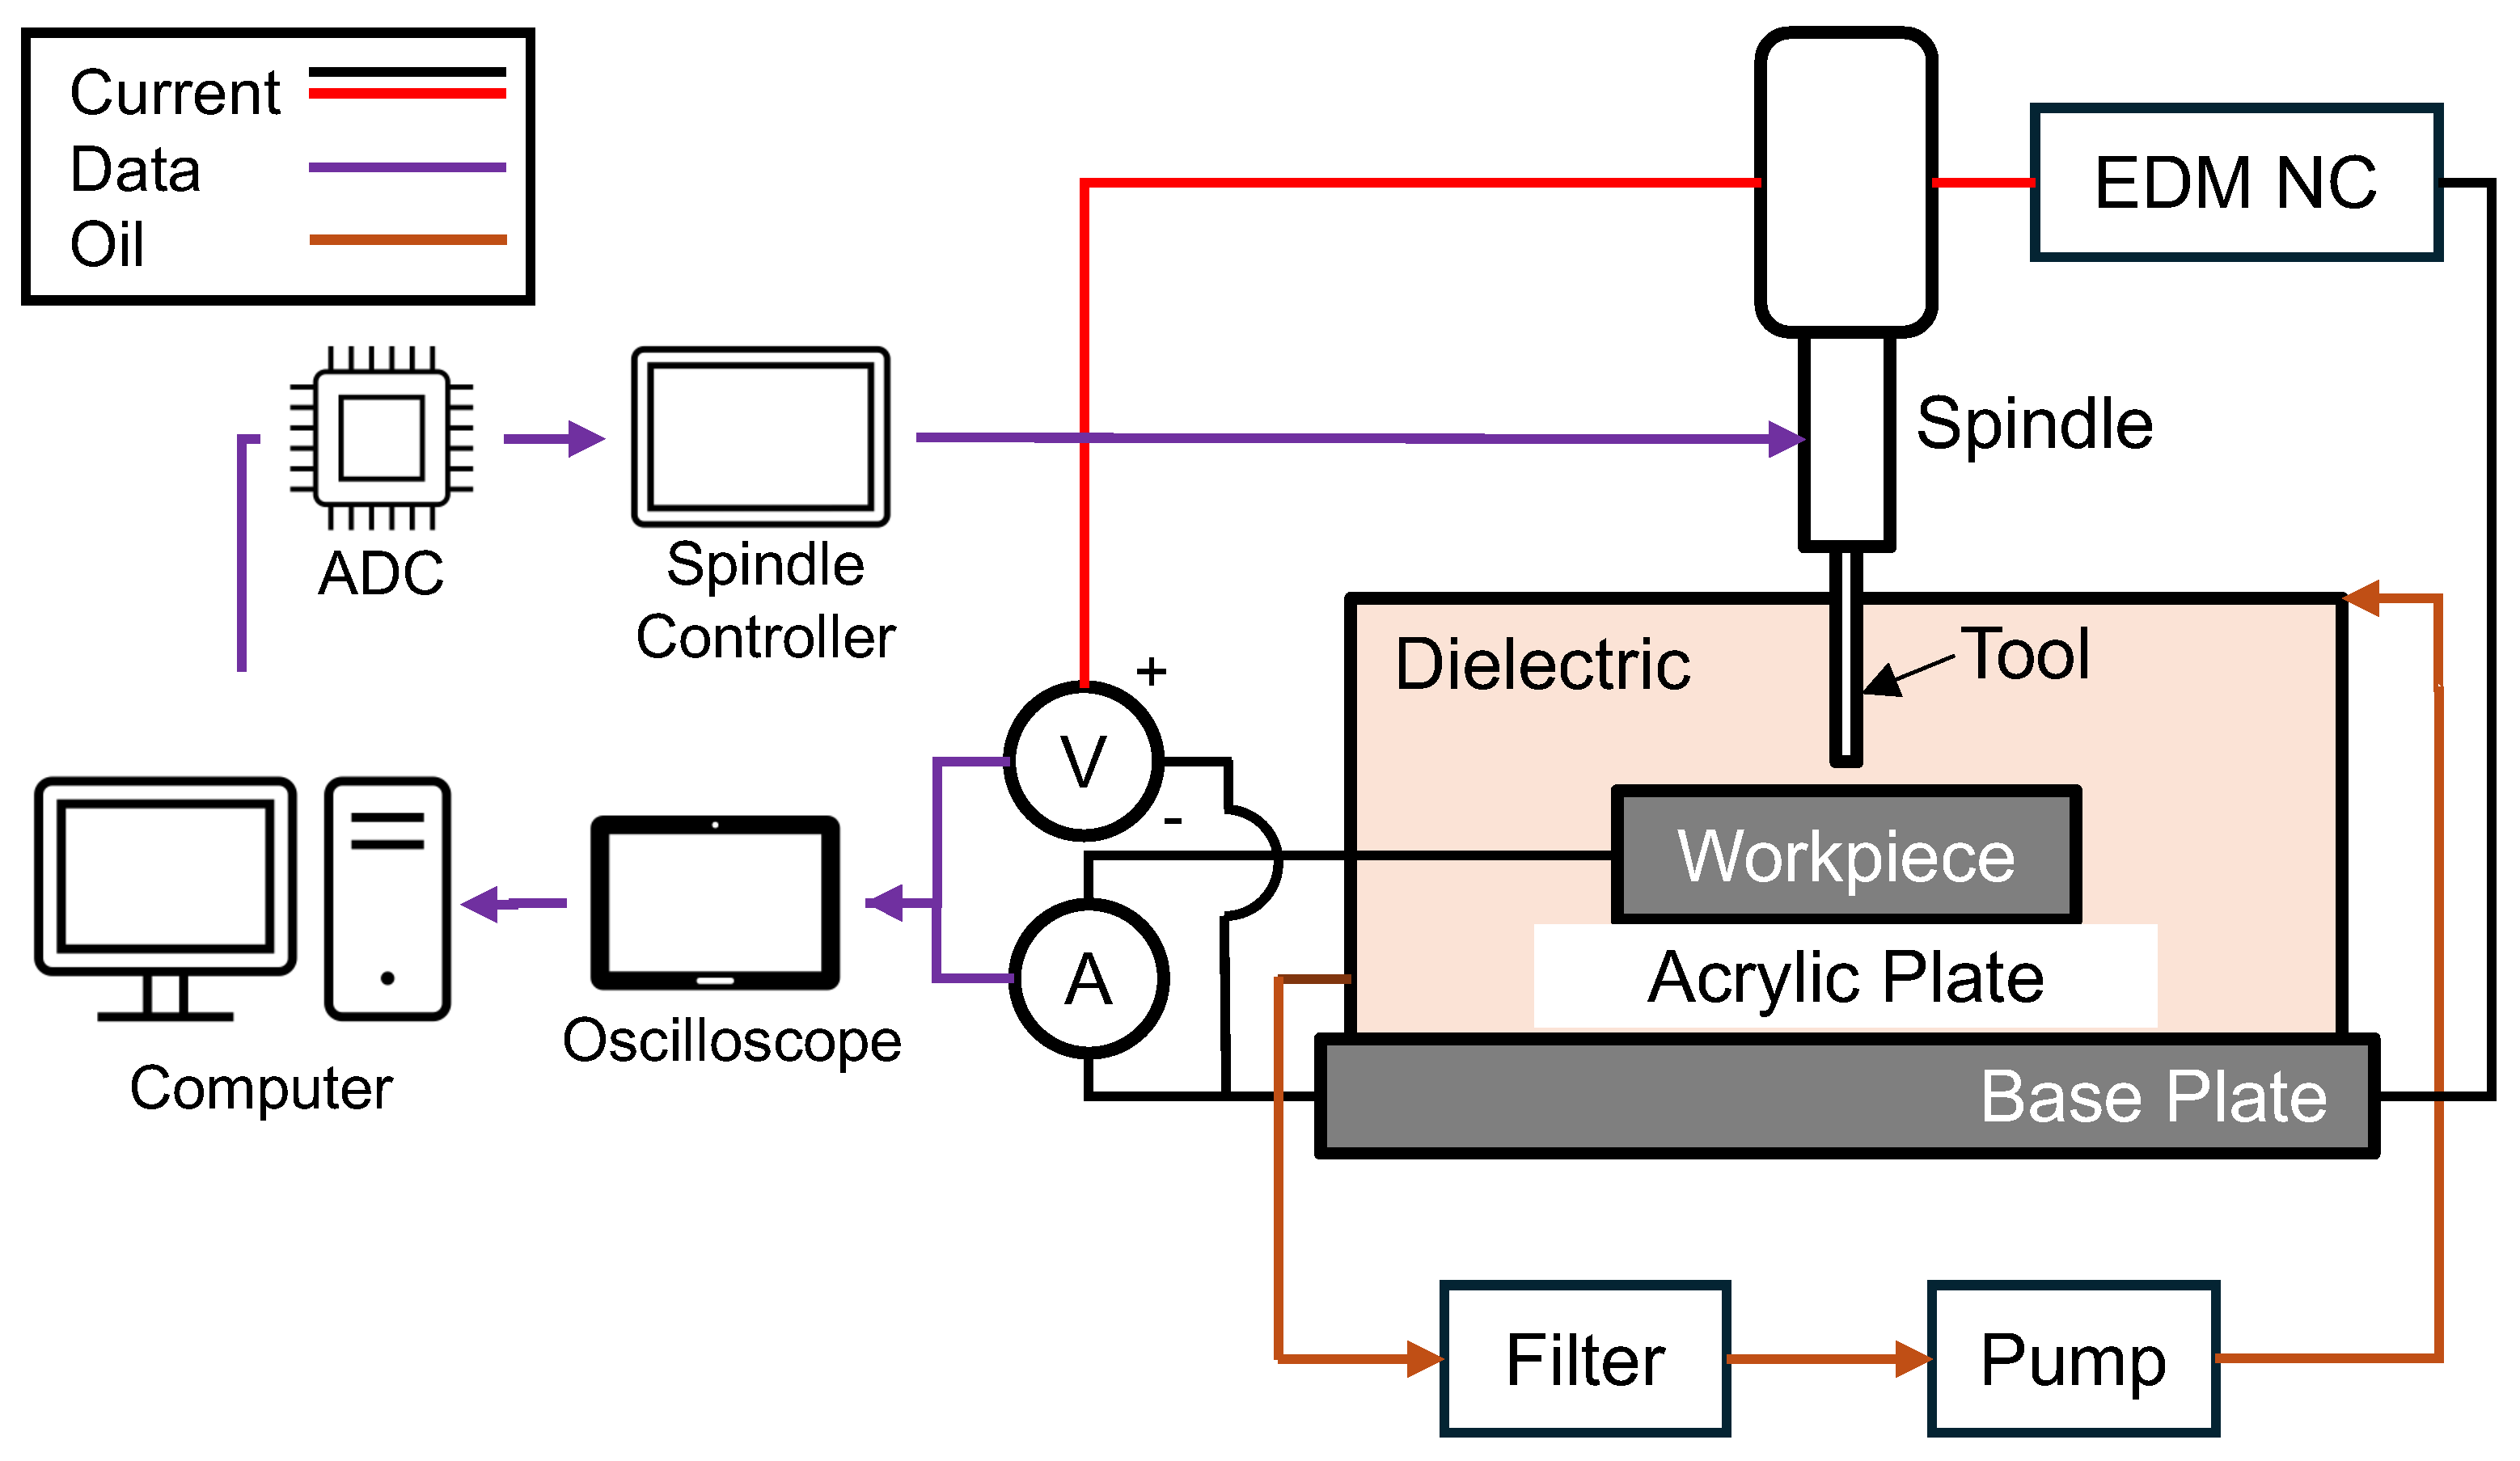
scores, indicating they performed worse than simple mean-based prediction. This suggests either insufficient data points or a non-monotonic (i.e., non-consistently increasing or decreasing) relationship between rotation rate and output metrics. We then explored whether including on-machine measurements could improve model performance by incorporating two feature sets: Z1 (raw electrical signals) and Z2 (discharge classifications), as described in
Section 2.1.2.
Despite these enhancements, regression models (especially linear ones) still performed poorly. For example, the linear model trained on raw signal features produced an implausibly negative (e.g., −748 for bottom roundness), indicating poor model generalization and potential issues with input scaling or multicollinearity. While ensemble models (e.g., Random Forests) achieved marginal improvements (e.g., = 0.69 for machining time), the overall prediction remained weak.
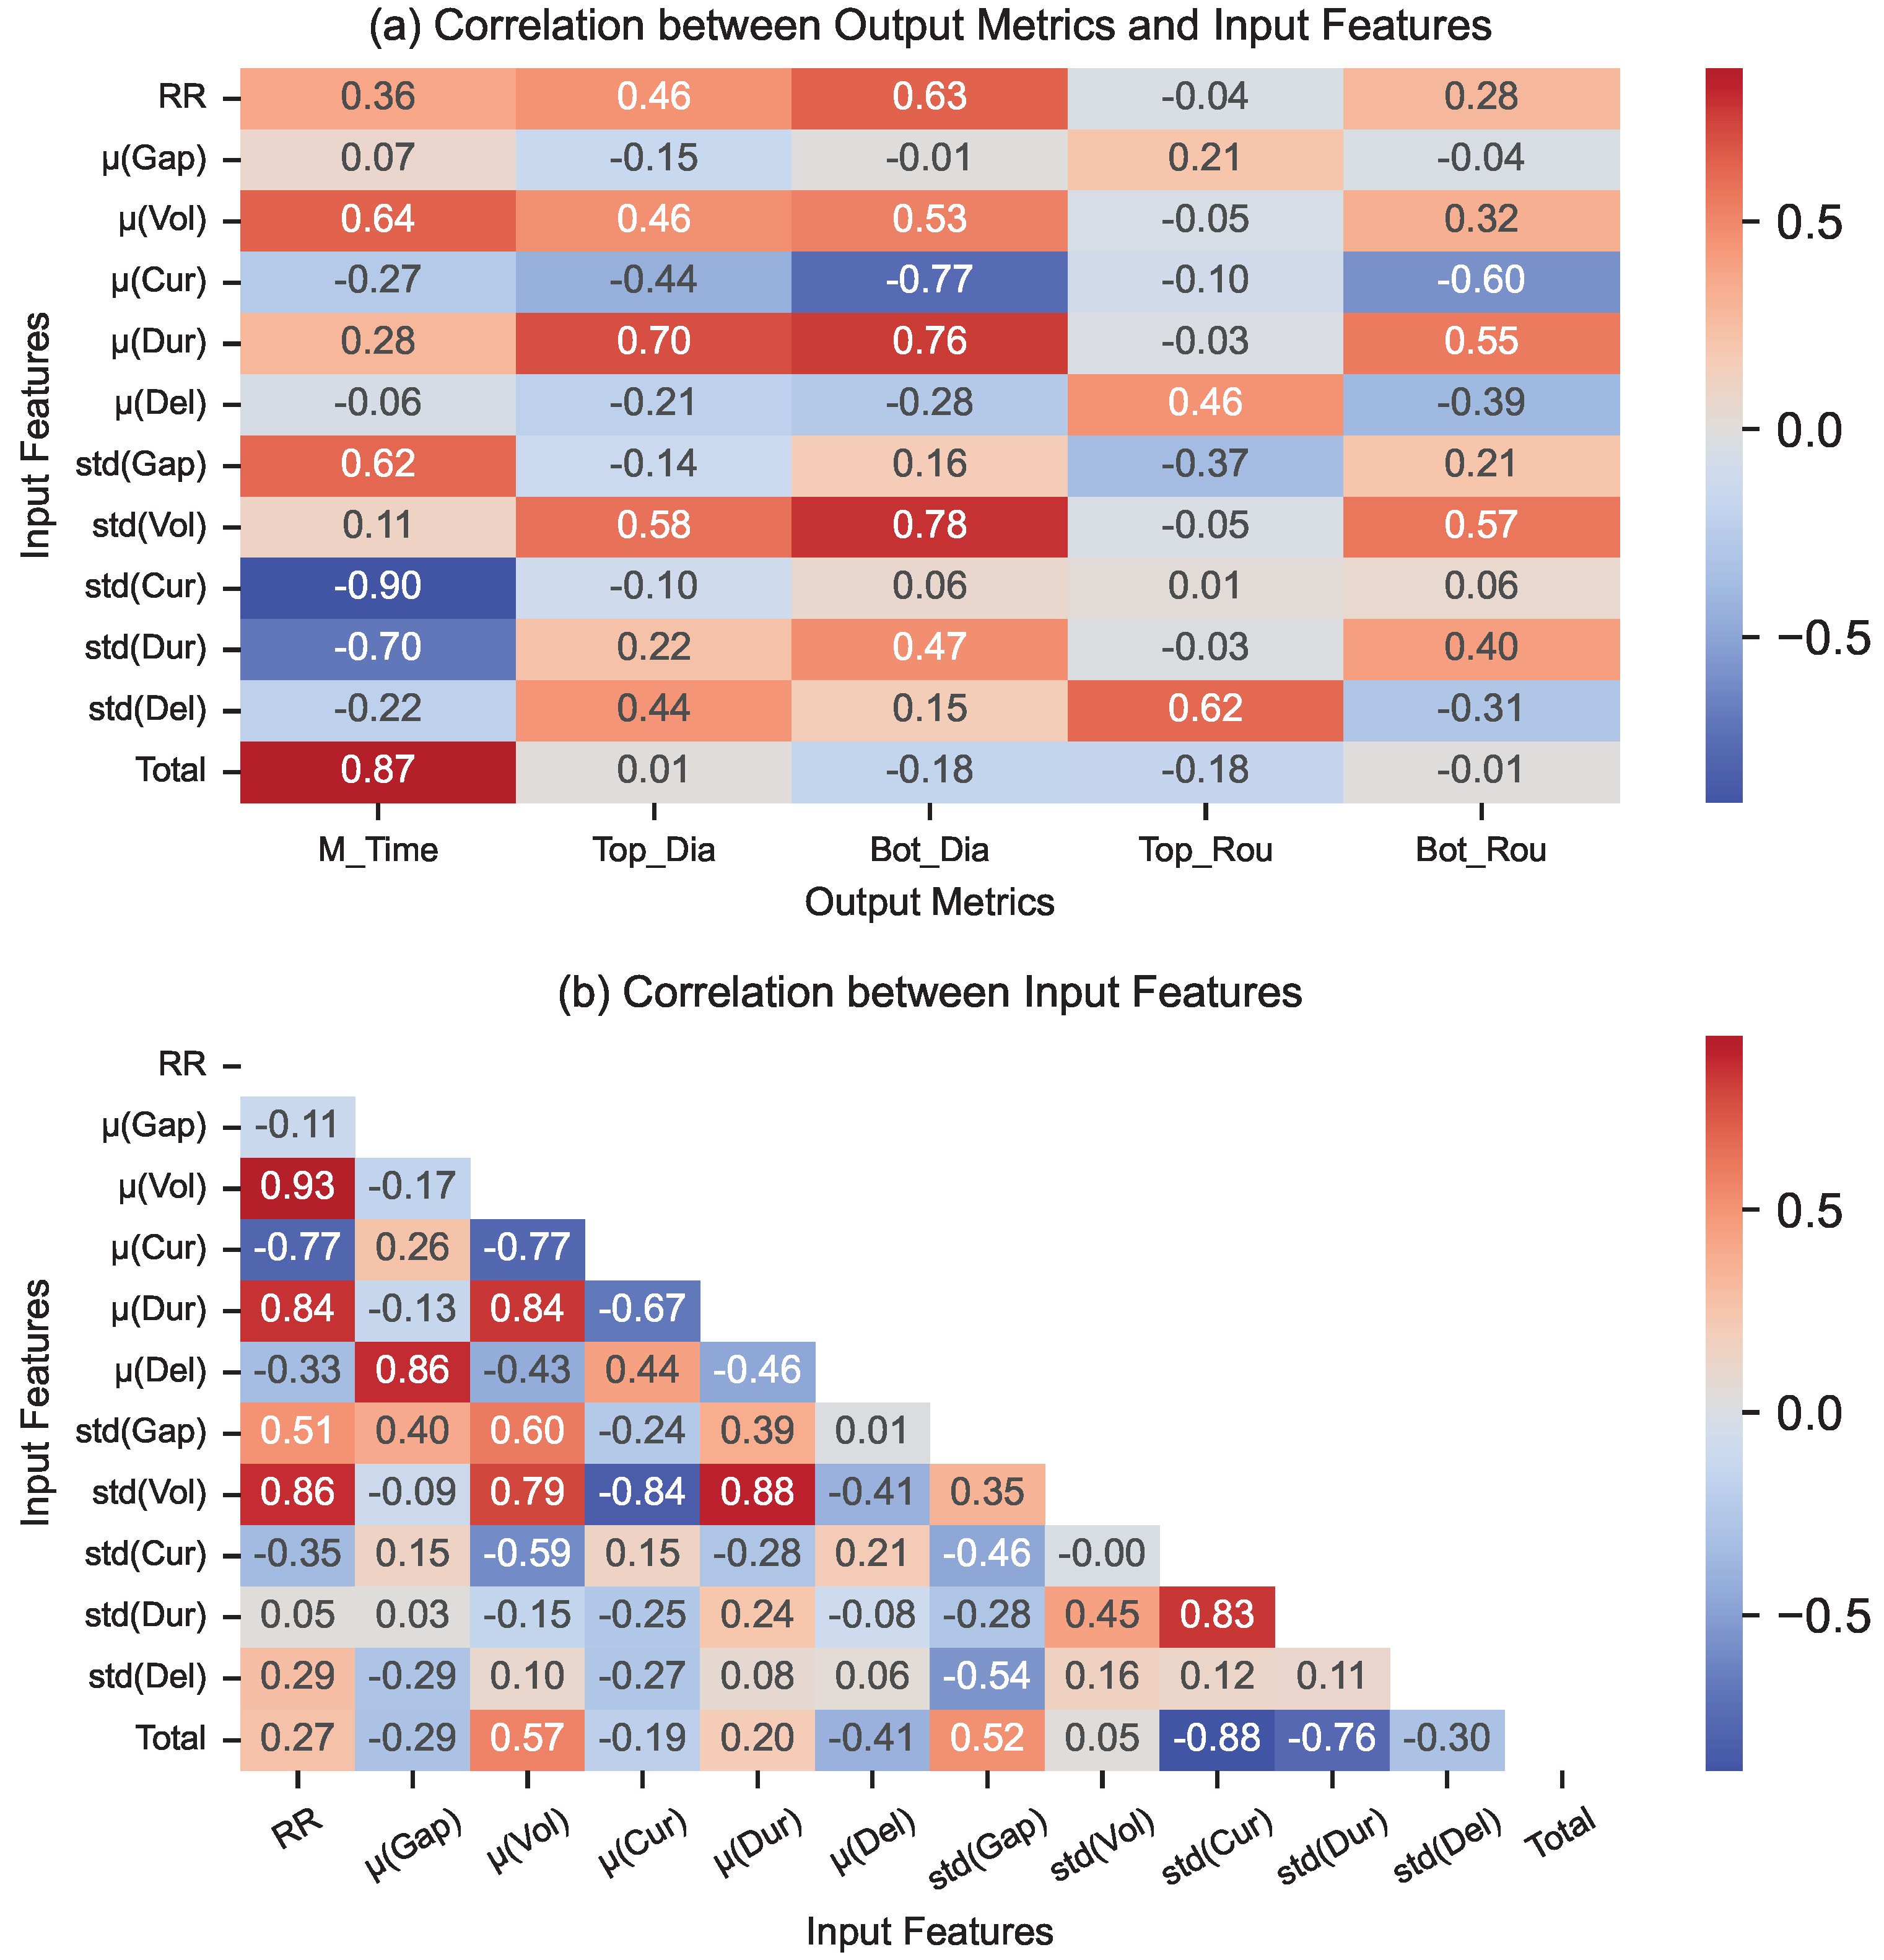
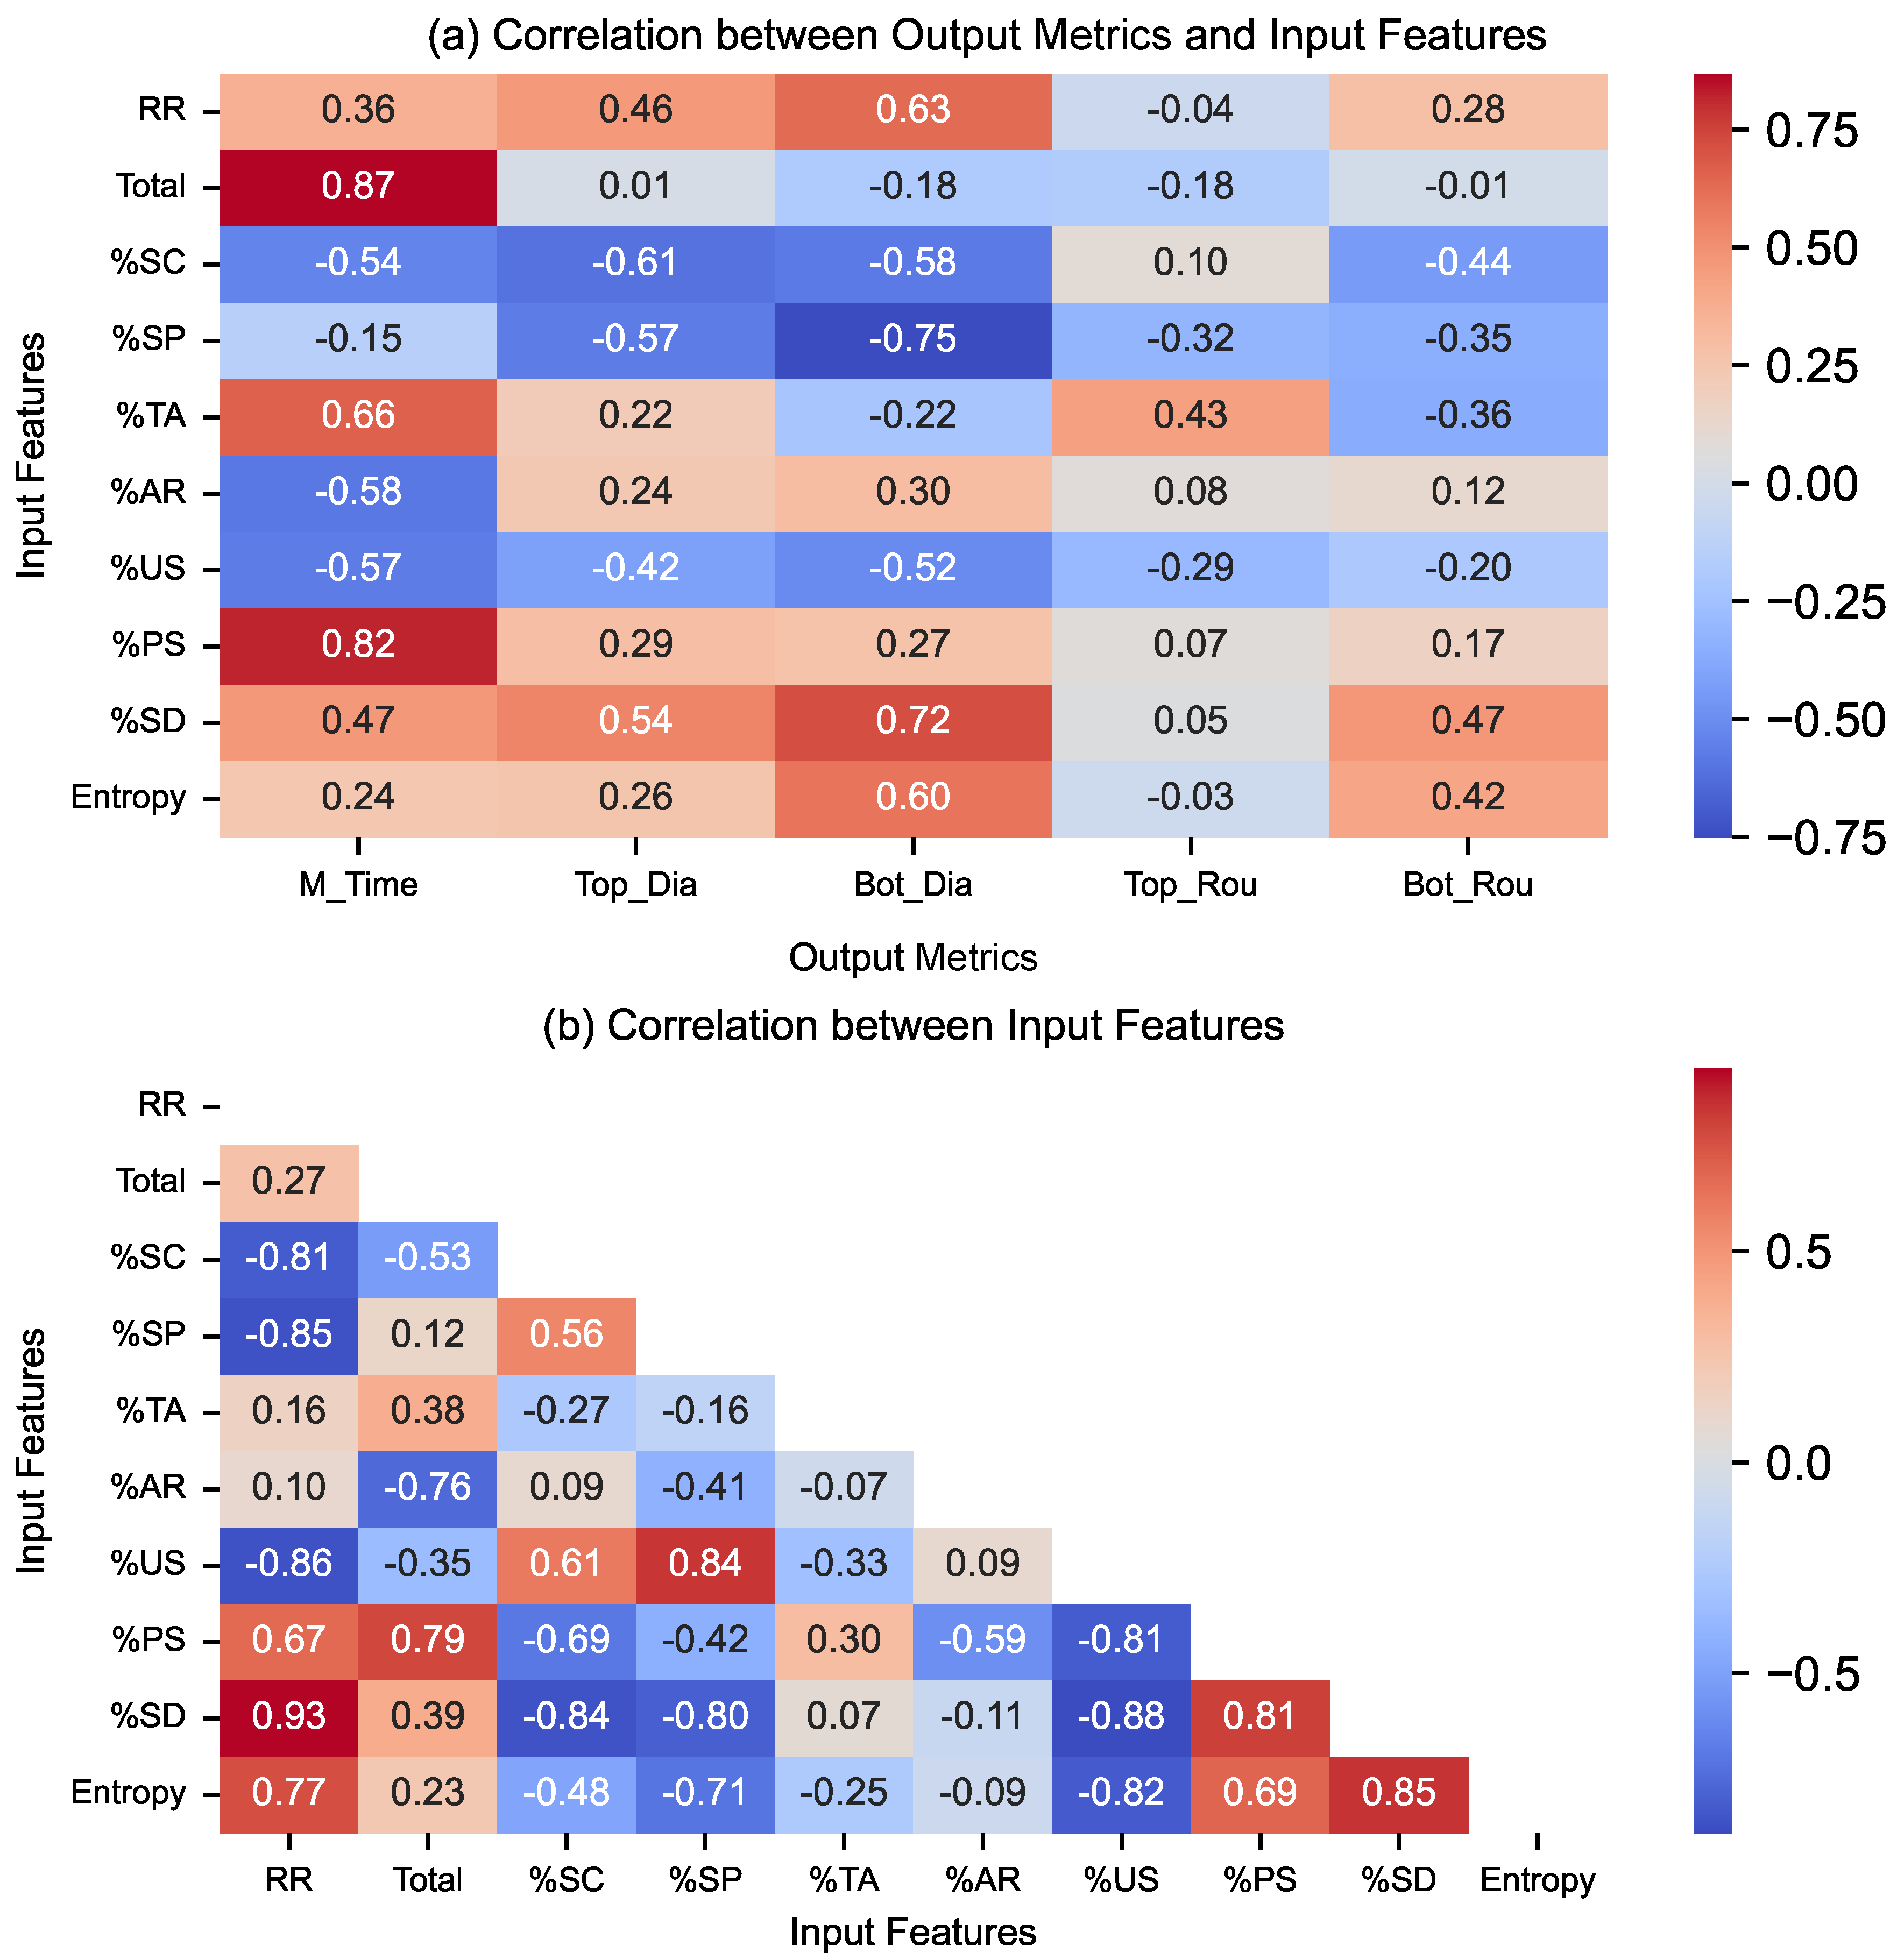
Due to these limitations, the focus shifted from regression modeling to correlation-based analysis. Pearson correlation coefficients were computed both between input features and output metrics (
), and among input features themselves (
), along with the rotation rate [RR] for classified data as visualized in
Figure 9. A correlation threshold of
was used to denote strong associations.
The findings revealed several key relationships between discharge types and machining outcomes. An increase in weak partial sparks and transient arcs was significantly correlated with longer machining times, suggesting inefficiencies in energy transfer. A higher count of secondary discharges, likely resulting from poor flushing, was associated with enlarged top and bottom diameters, leading to pronounced overcuts. In contrast, clean sparks consistently aligned with improved machining efficiency and reduced top and bottom diameters thereby reducing overcuts, reaffirming their role as desirable discharges.
Interestingly, short circuits also showed negative correlation with overcut (top and bottom diameters). This counterintuitive trend is interpreted as a secondary effect arising from increased clean spark frequency and the suppression of secondary discharges. Despite these insights, extensive multicollinearity among the features substantially weakened the explanatory power of regression-based models.
An important physical insight emerged: increasing the rotation rate tends to raise the frequency of partial sparks and secondary discharges, likely due to increased fluid shear disrupting discharge channels. At the same time, increasing rotation helps break down short circuits more rapidly. In summary, the increased rotation rate increases chaos or entropy within the discharge gap as seen in
Figure 9b. These inferences were further supported by correlations derived from raw signal features (
Figure A2).
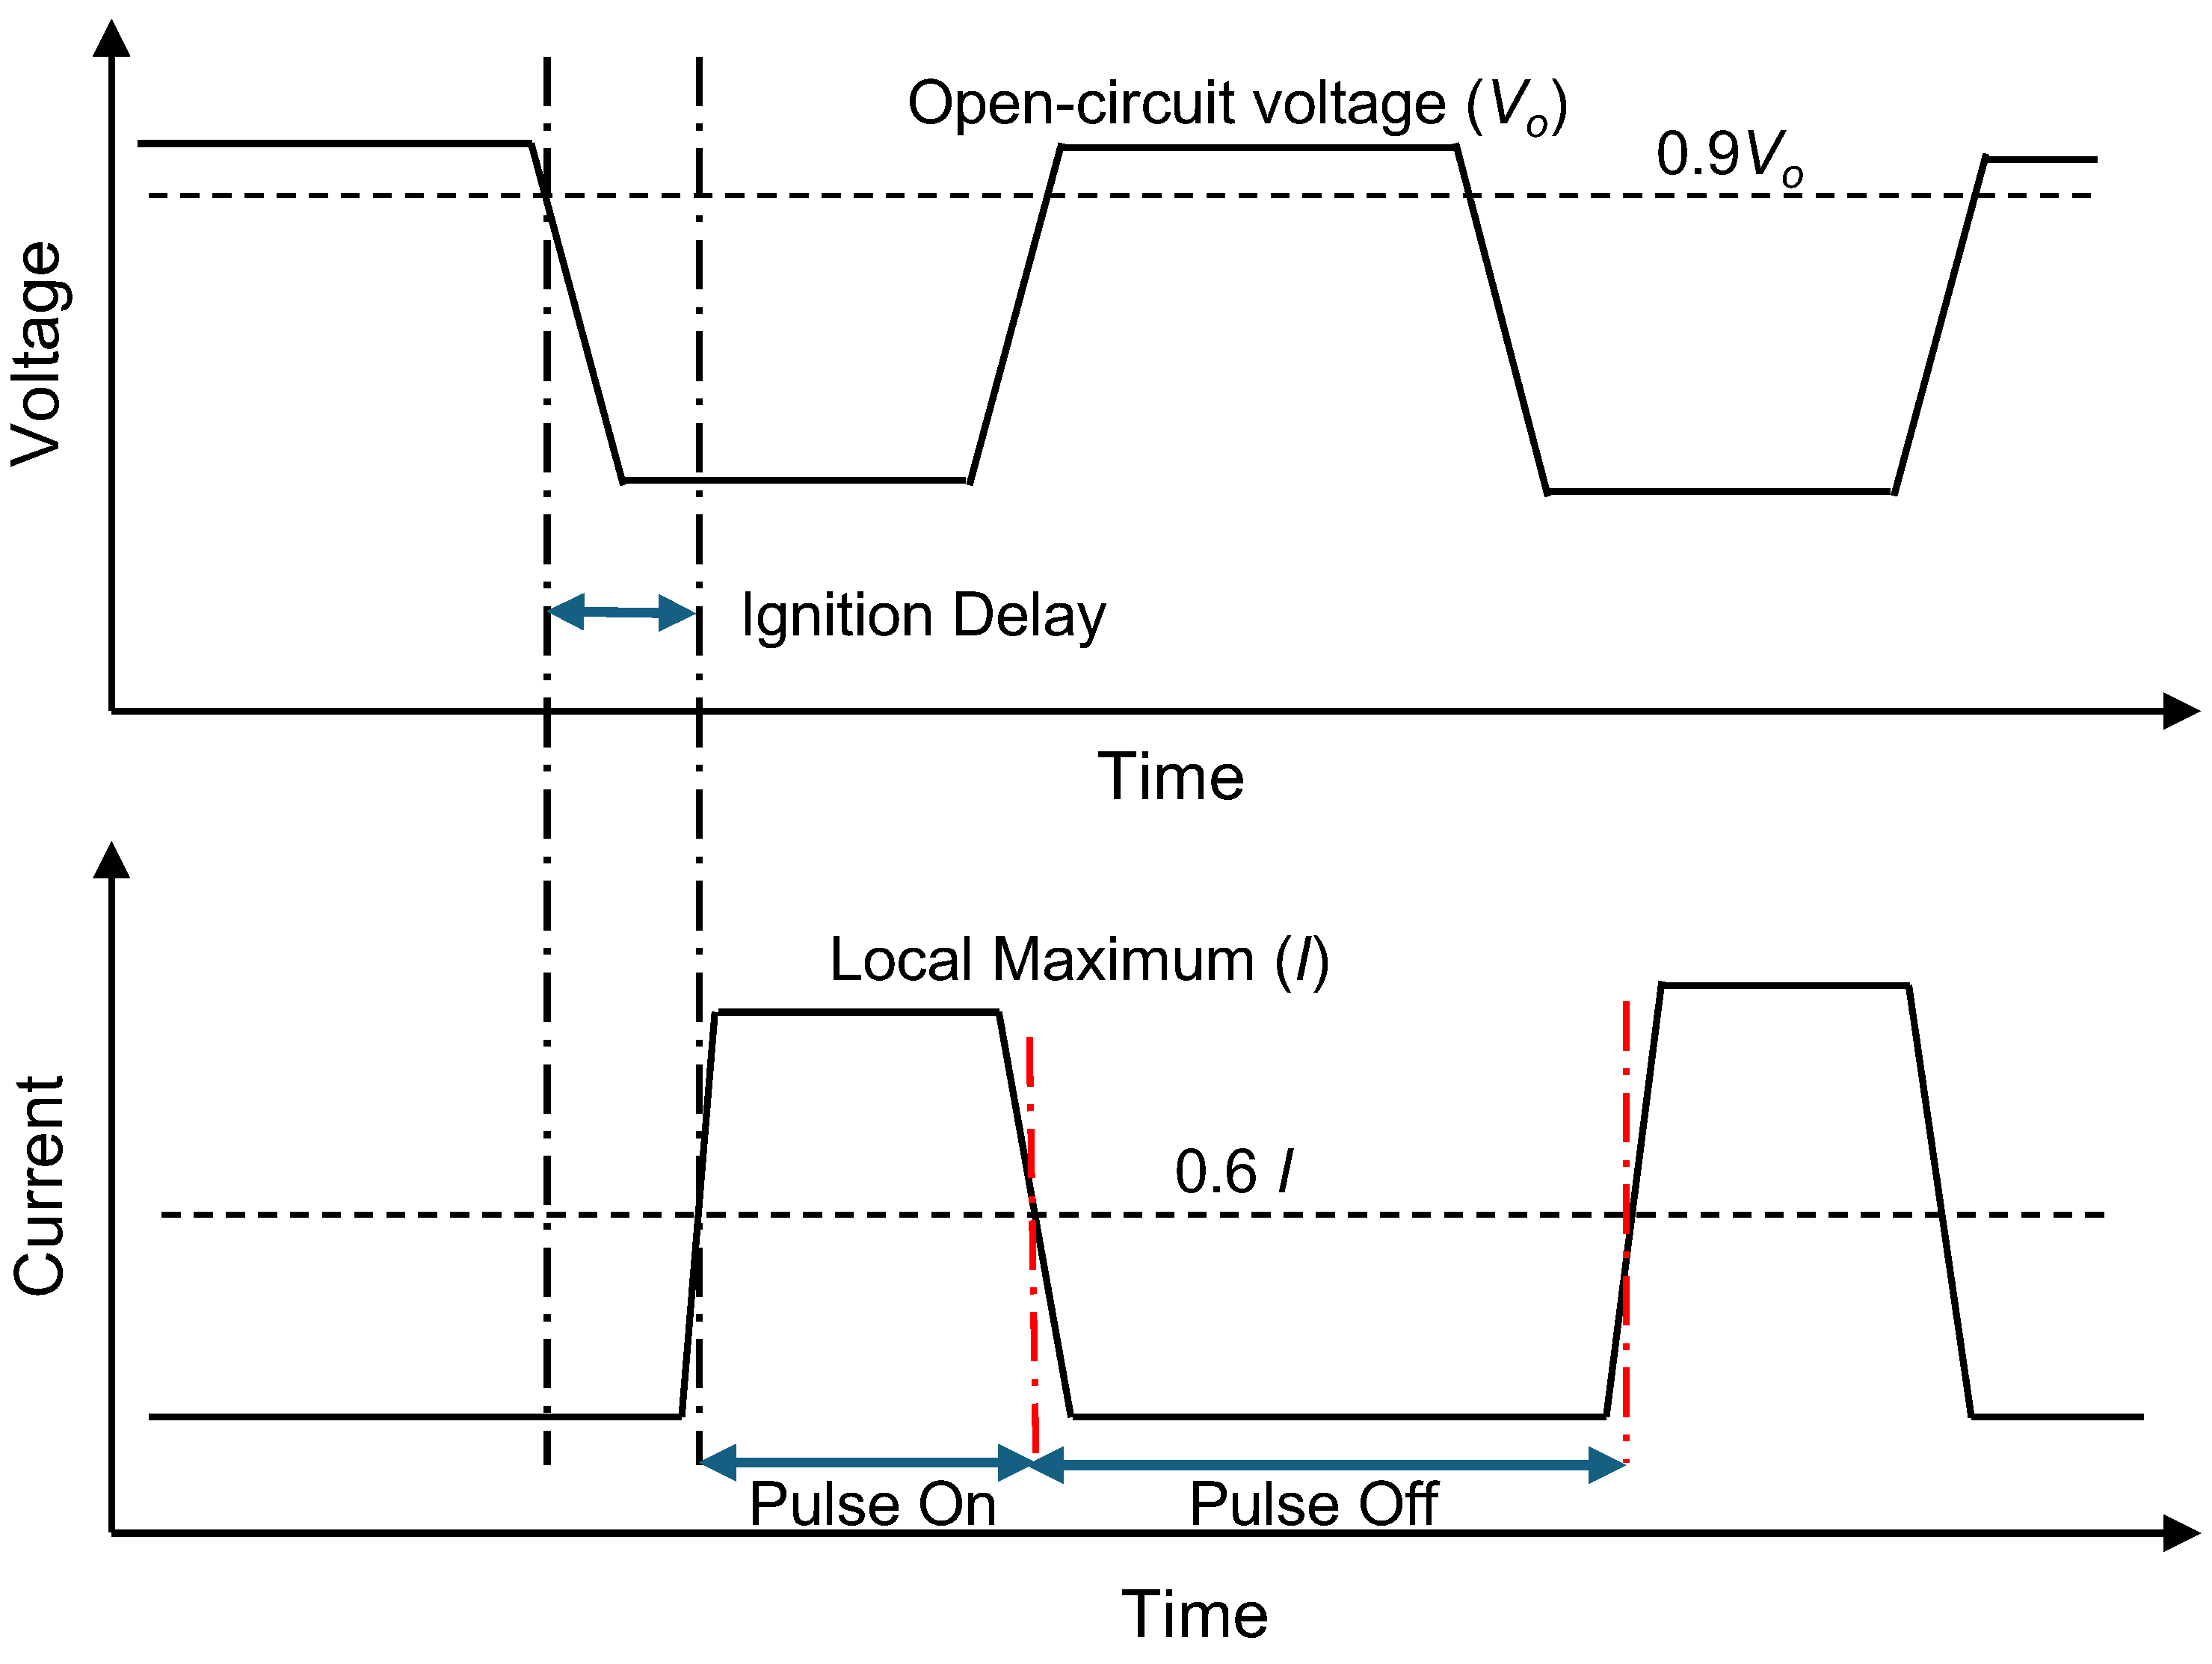
These results underscore the value of time-resolved discharge pattern analysis over aggregate statistics when evaluating the influence of rotation. To reduce feature dimensionality and address multicollinearity among discharge categories, we propose condensing discharge types into two interpretable classification schemes: one based on the discharge timing (henceforth on discharge timing)-derived features (
Table 8) and the other based on the impact of the discharge event (
Table 9).
This categorization is used in the next stage of our machine learning framework to reduce feature complexity while preserving physical interpretability.
3.3. Supervised Classification Using Machine Learning
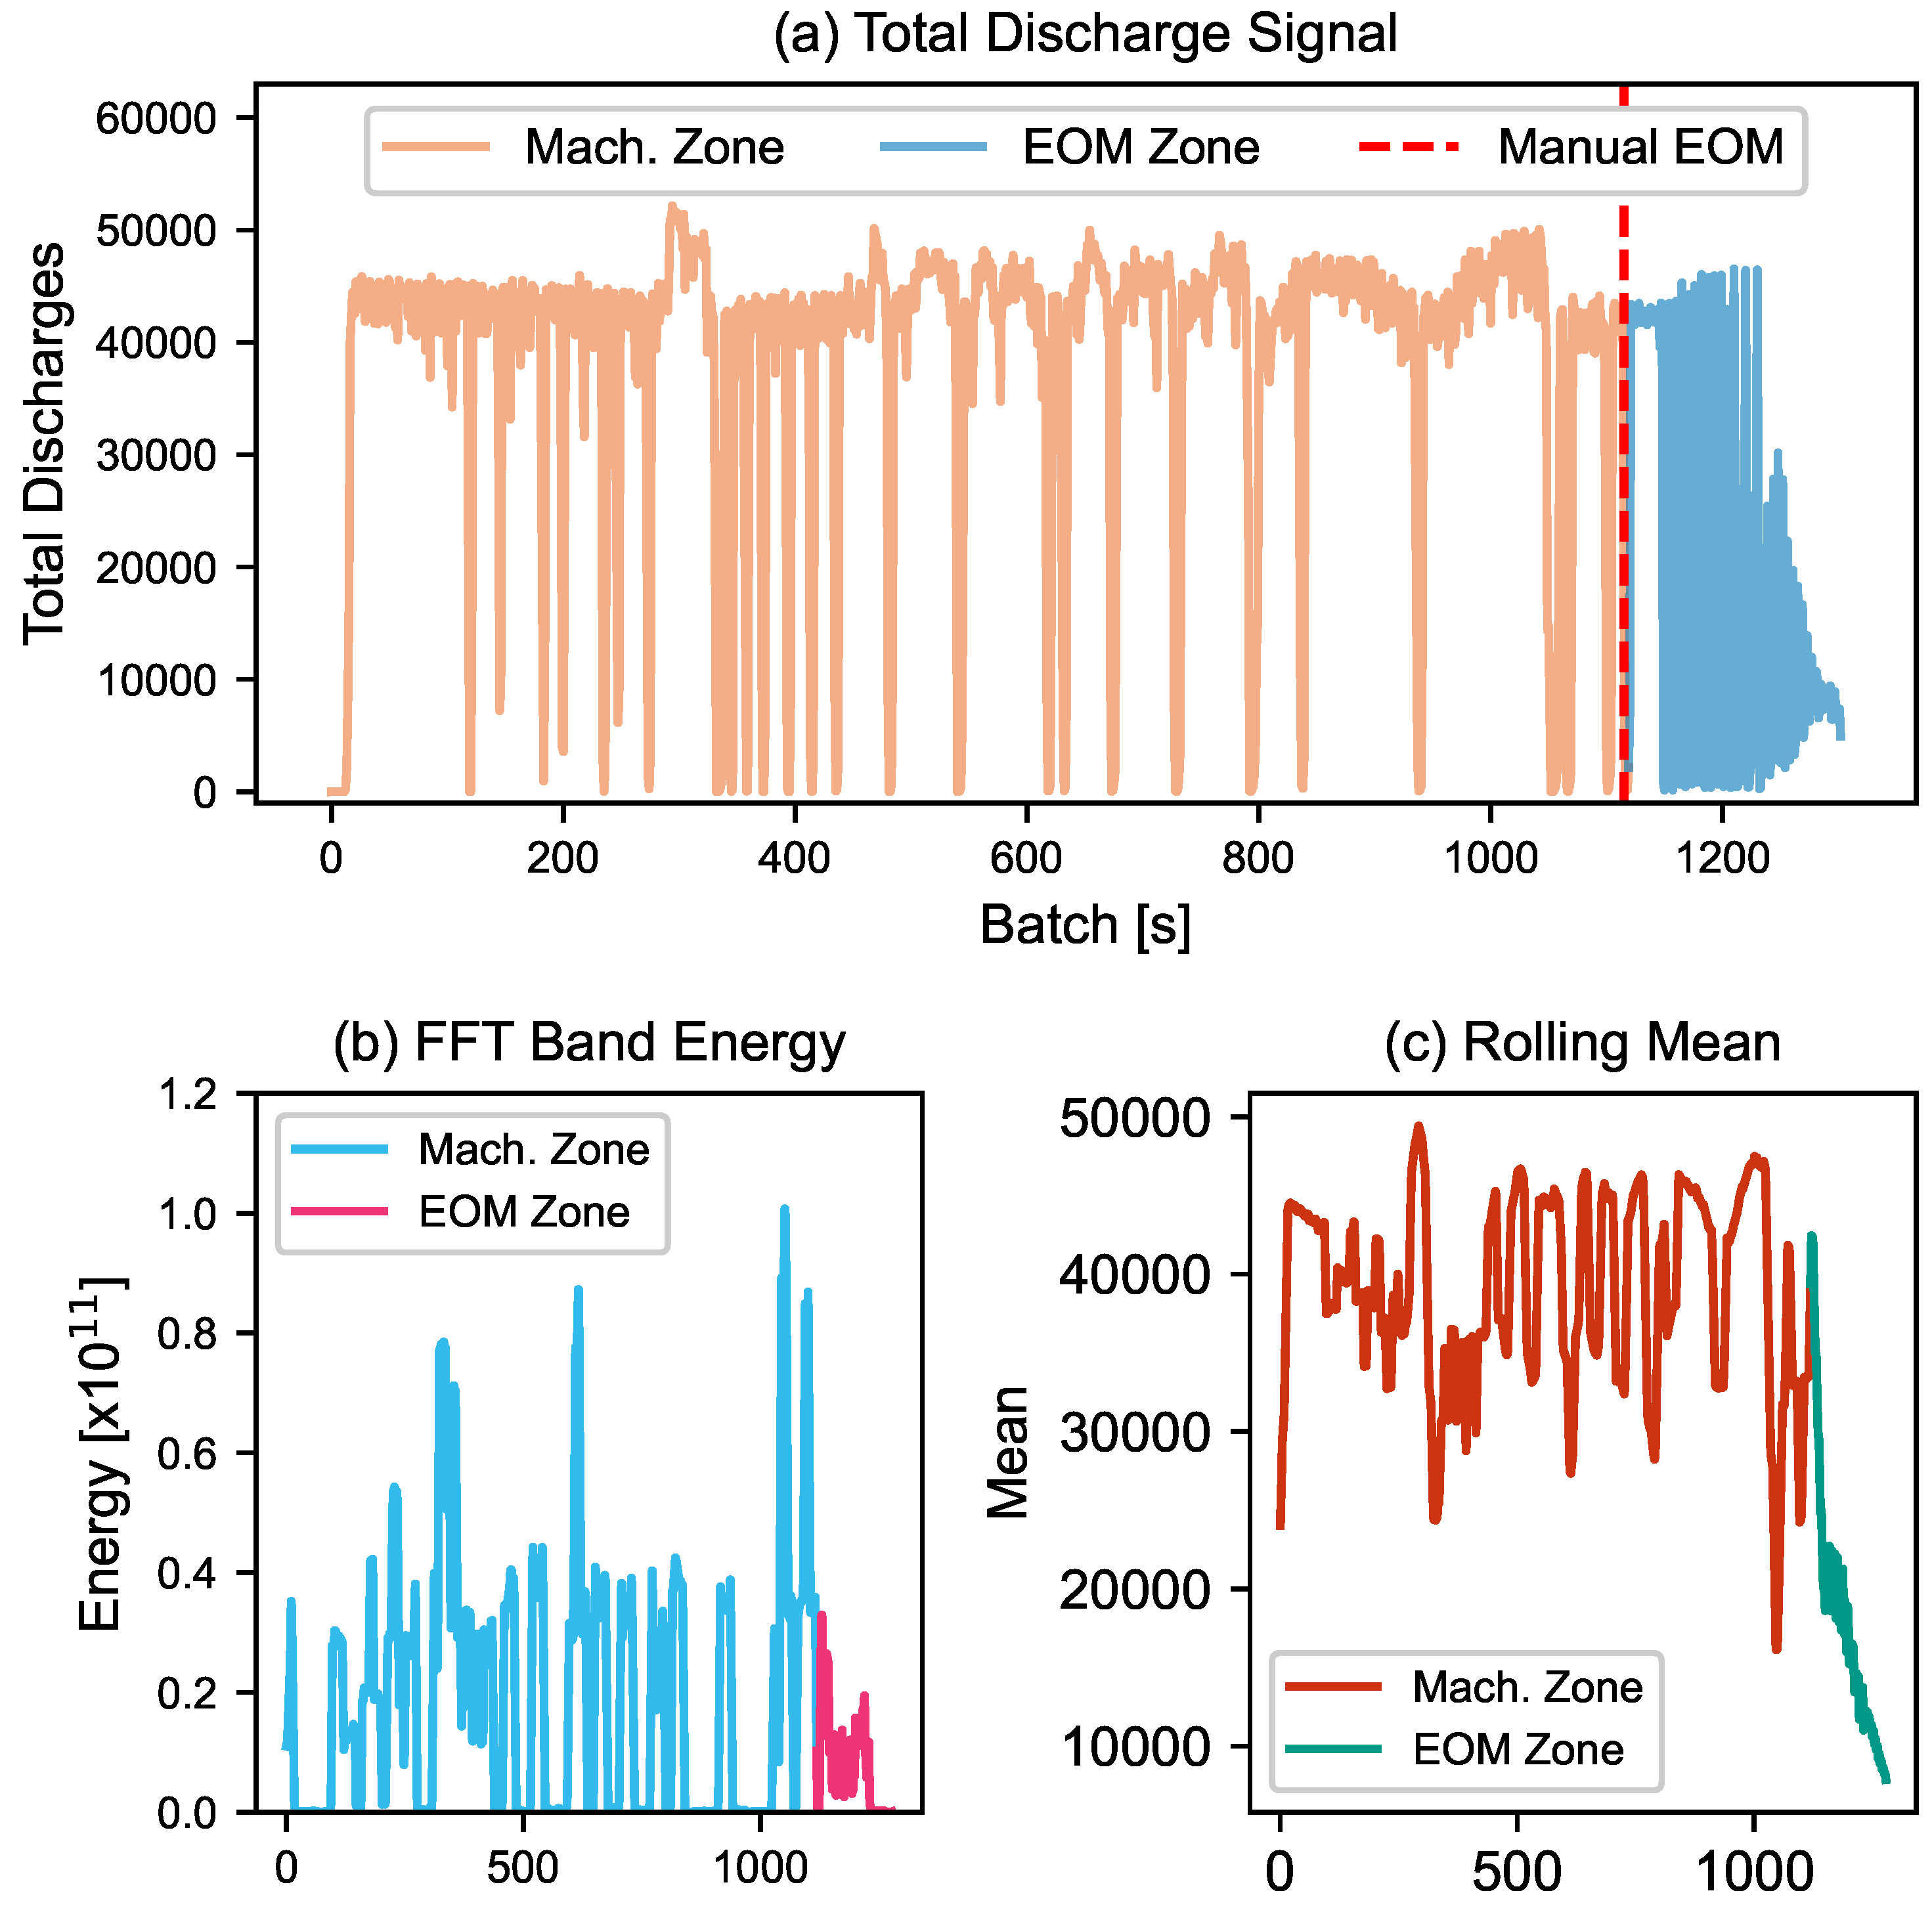
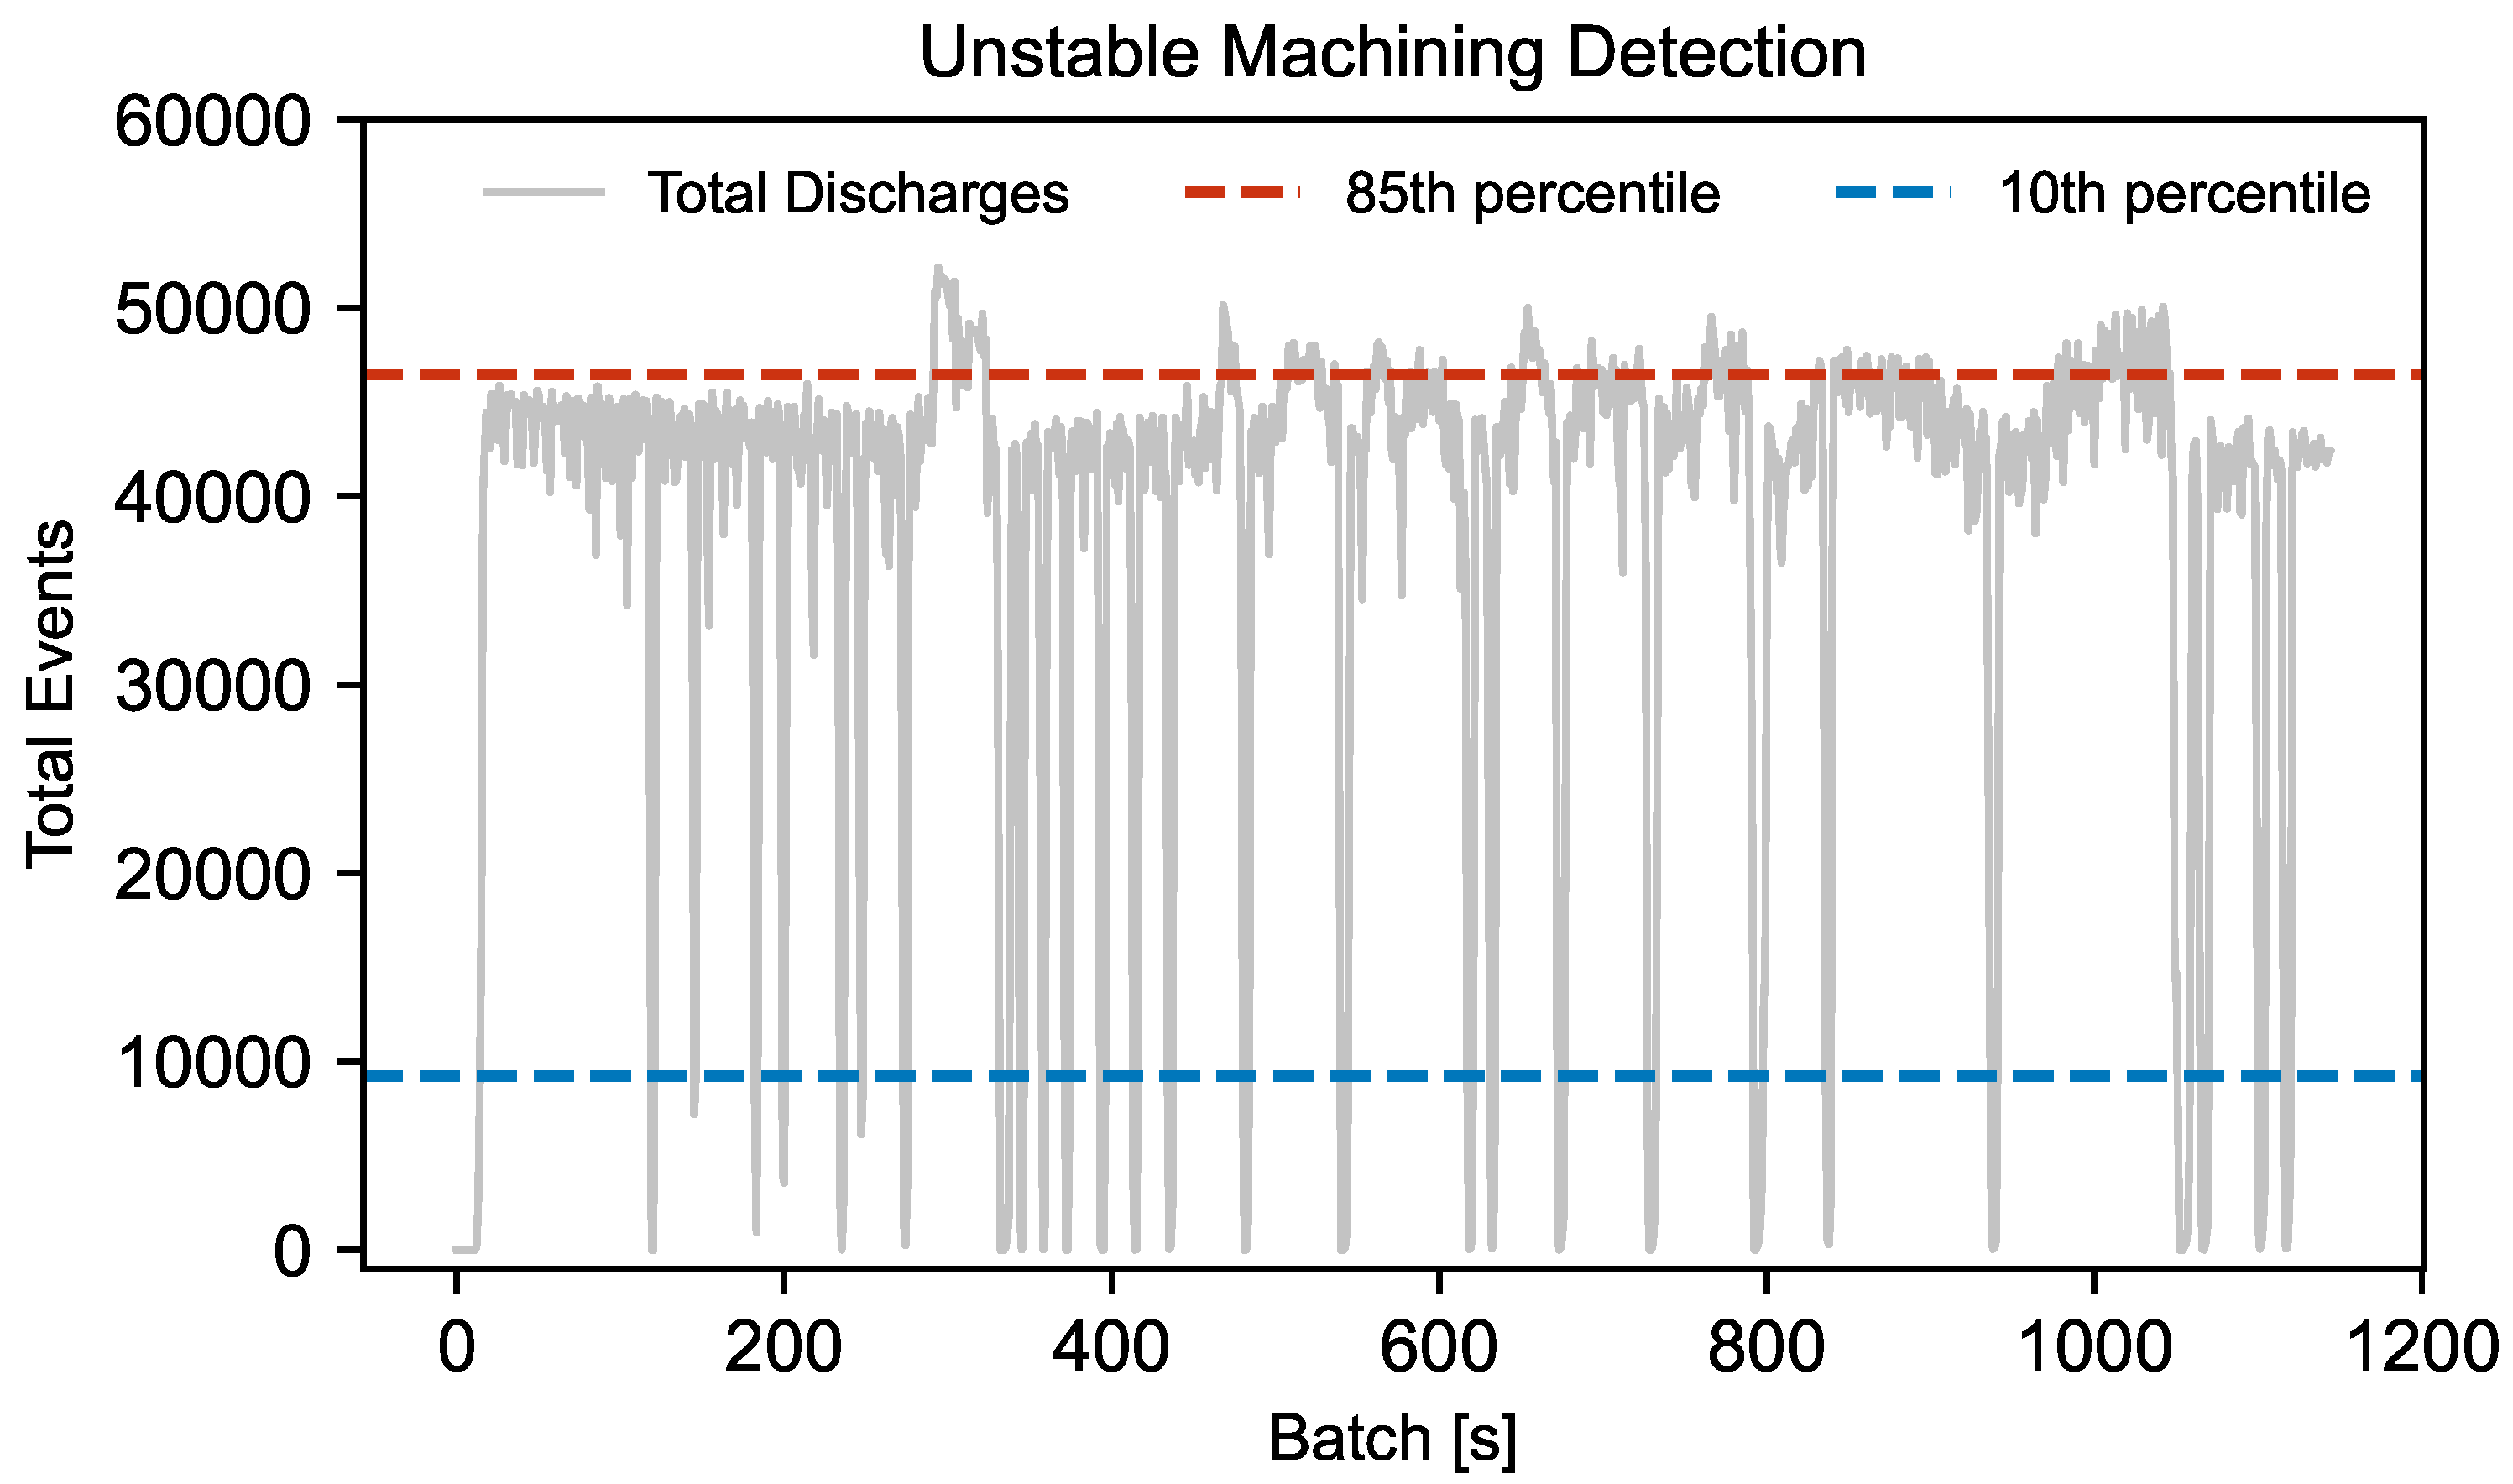
The End-of-Machining (EOM) detection model achieved an overall accuracy of 98%, with a precision of 0.85 and recall of 0.89 for detecting the EOM class. The confusion matrix in
Table 10 shows that only 22 batches were misclassified as EOM before the actual onset, while the majority of false positives occurred after the true EOM point as seen in
Figure 10 (Predicted EOM Phase), indicating the model’s conservative behavior. To avoid premature deactivation in a proposed dynamic control system, a post-EOM misclassification tolerance of 10 batches was adopted. While early false positives could impact control decisions, post-EOM misclassifications are acceptable since control would already be disengaged after detection. This conservative buffer ensures safe and robust labeling in anticipation of future deployment.
The model metrics and global temporal characteristics for the machine learning models in the segmented machining zone are summarized in
Table 11 and
Figure 11, respectively.
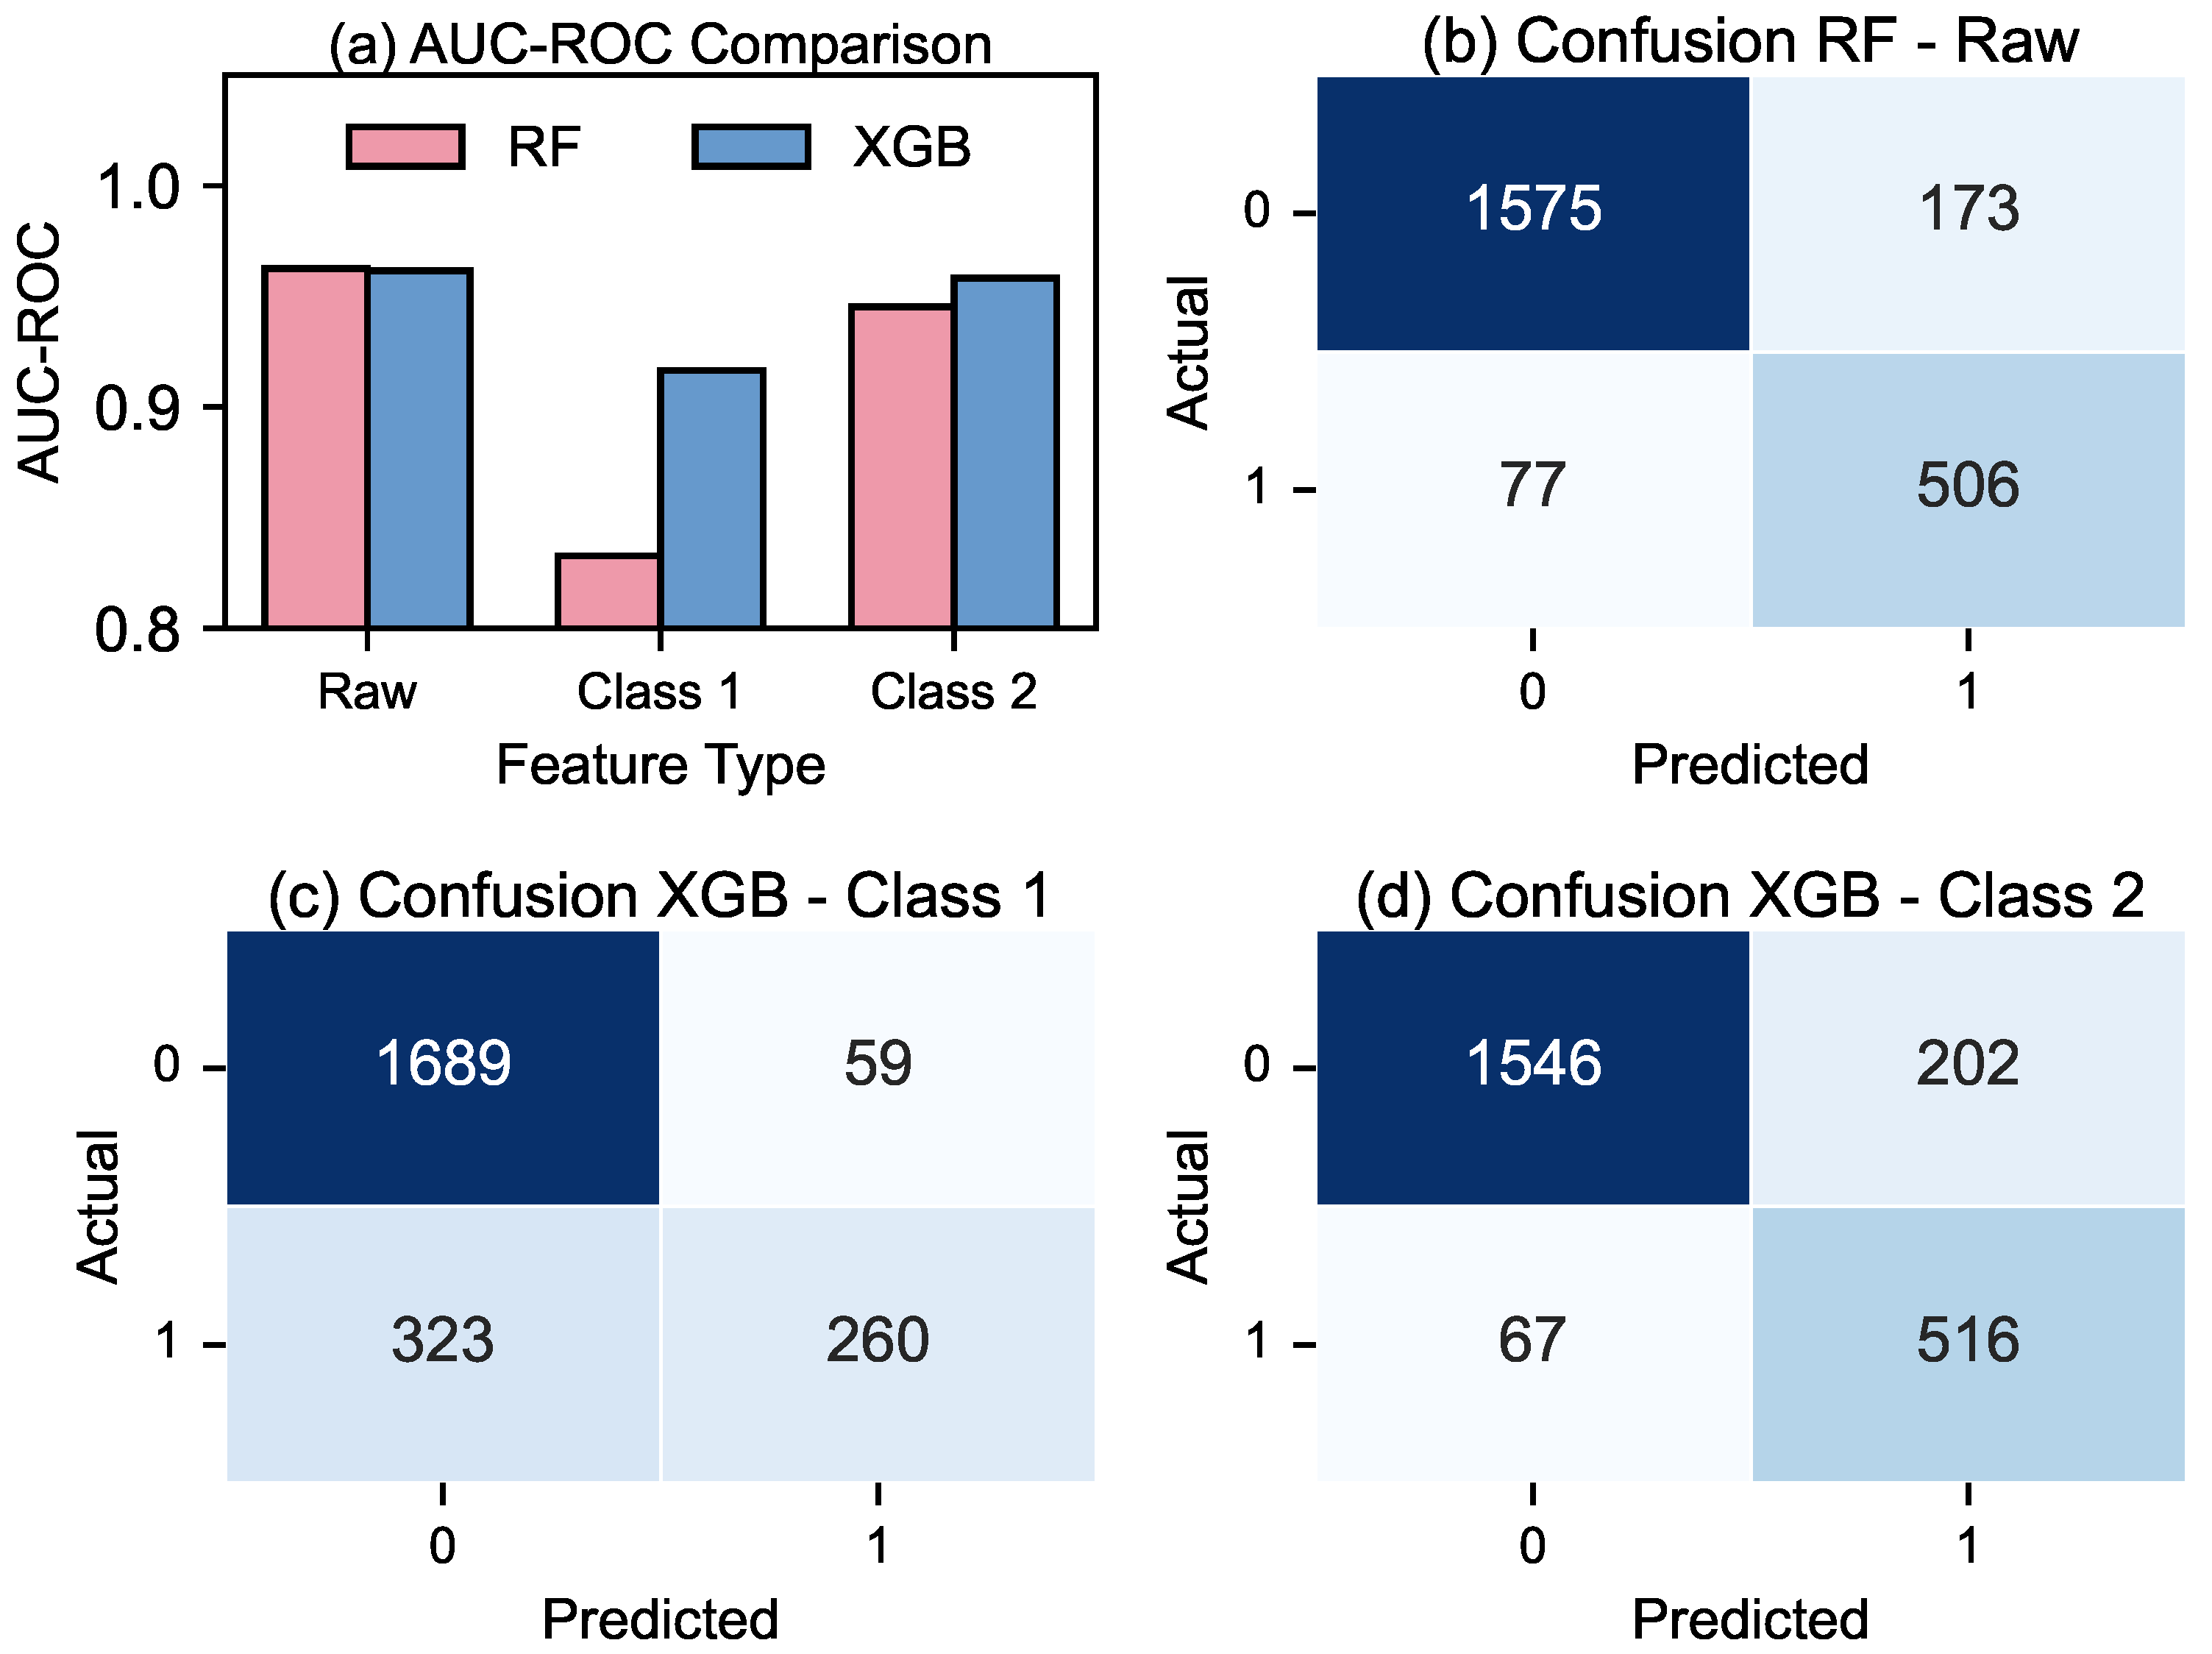
In general, the Extreme Gradient Boosting (XGB) classifier outperformed the Random Forest (RF) classifier in terms of both accuracy, the proportion of correctly predicted batches, and F1-score, which balances precision and recall, making it particularly useful under class imbalance. As shown in
Figure 11a, most models achieved high confidence levels (ROC-AUC > 0.9), indicating that small changes in the probability threshold are unlikely to significantly affect classification outcomes.
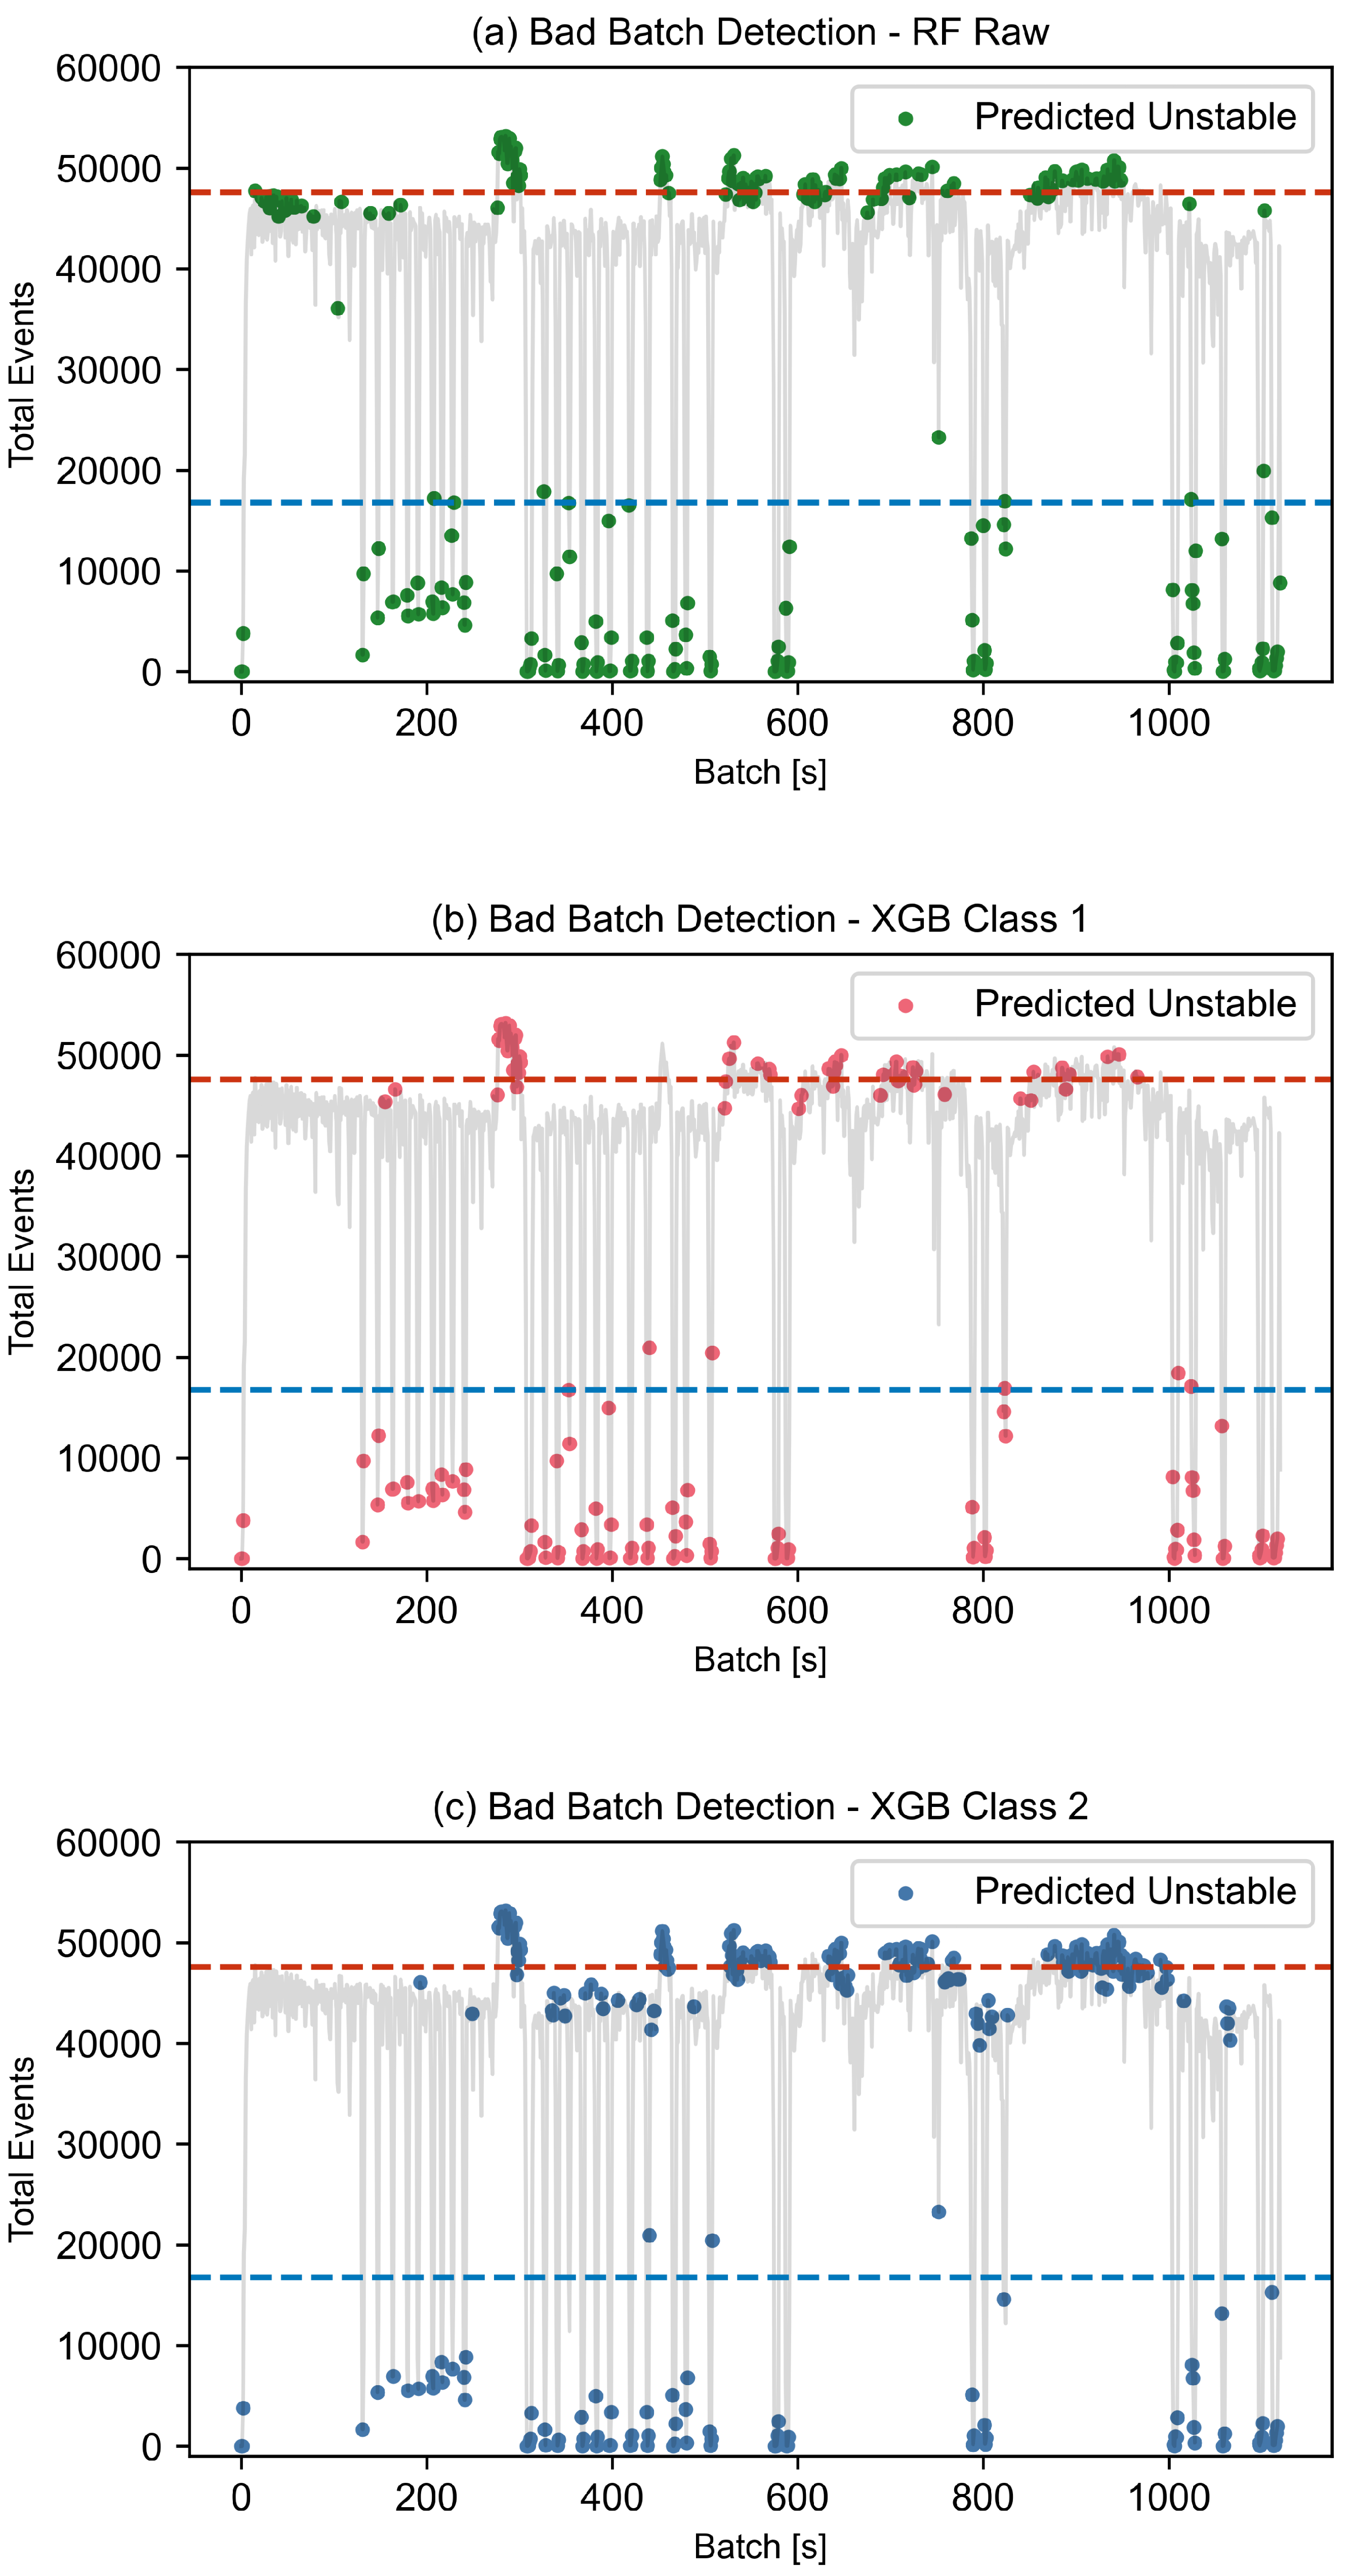
Additional insights are drawn from the confusion matrices in
Figure 11b–d and the batch-level prediction overlays in
Figure 12a–c. The model trained on raw electrical signal features exhibits a more sensitive prediction behavior, flagging a larger number of unstable batches, including those with subtle variations in discharge characteristics. This is particularly evident during the early machining periods (
Figure 12a). In contrast, models based on discharge timing or impact features (Class 1) produce more conservative predictions, mainly identifying the most severe instances of instability but fail to capture sustained over-machining. Meanwhile, the model using discharge impact based features (Class 2) offers a more balanced prediction across different instability patterns.
This comparison highlights a key trade-off. Raw signal-based models are highly sensitive and computationally efficient due to minimal preprocessing but are also more prone to noise and false positives. Classification-based models, built on features like discharge timing or impact, offer greater physical interpretability and targeted detection, albeit with increased computational effort. For real-time monitoring, the RF model with raw features may be better suited for early anomaly detection. However, for corrective interventions, the discharge classification-based models provide more robust and interpretable predictions.
Given that this study aims to enable adaptive control of tool rotation, the model based on discharge impact features (Class 2) is recommended. While it achieves only moderate accuracy, its consistently high recall ensures the dependable detection of potentially unstable conditions, critical for preventive control, even if it occasionally sacrifices precision.
Additionally, we analyzed the model’s prediction methodology by examining the SHAP values of the five most important features as shown in
Figure 13. In the plot, the dot color represents the actual feature value, while the SHAP value indicates the (unitless) magnitude and direction of that feature’s contribution toward predicting instability. In this study, both under-machining and over-machining conditions were collectively labeled as unstable machining. This broad classification can introduce non-monotonic behavior in the relationships between features and predicted outcomes.
Such non-monotonicity was evident in the top raw signal feature, gap mean (
Figure 13a), where both low values could correspond to either stable or unstable conditions depending on contextual factors. In contrast, stable machining zones were generally associated with higher current levels. The short delay pulses (D3), despite exhibiting the high feature importance, likely due to its dominance in discharge counts (
Figure A1), did not show a strong association with stable machining, as seen in
Figure 13, also demonstrating a non-monotonic trend. Meanwhile, category E3, comprising ‘almost spark’ discharges such as Transient Arcs (TAs), Partial Sparks (PSs), and Unstable Sparks (USs), showed a consistently strong association with stable machining, as seen in
Figure 13b,c. These observations underscore the importance of discharge type grouping in determining model interpretability and efficiency, and also highlight the potential multicollinearity between discharge categories.
Moreover, while the correlation analysis shows only a weak positive relationship between short circuits and sparks in
Figure 9b, the SHAP summary from the classification model reveals a strong opposing effect; stable machining is associated with a higher occurrence of sparks and a lower presence of short circuits (D1, E1 and D4, E4).
Overall, although clear monotonic trends were not consistently observed, the SHAP analysis provided valuable insights into the model’s internal decision making and the relative importance of individual features in identifying machining instability.
3.4. Correction Strategy Exploration
Based on the prediction model derived above, unstable machining zones were re-predicted for different tool rotation rates.
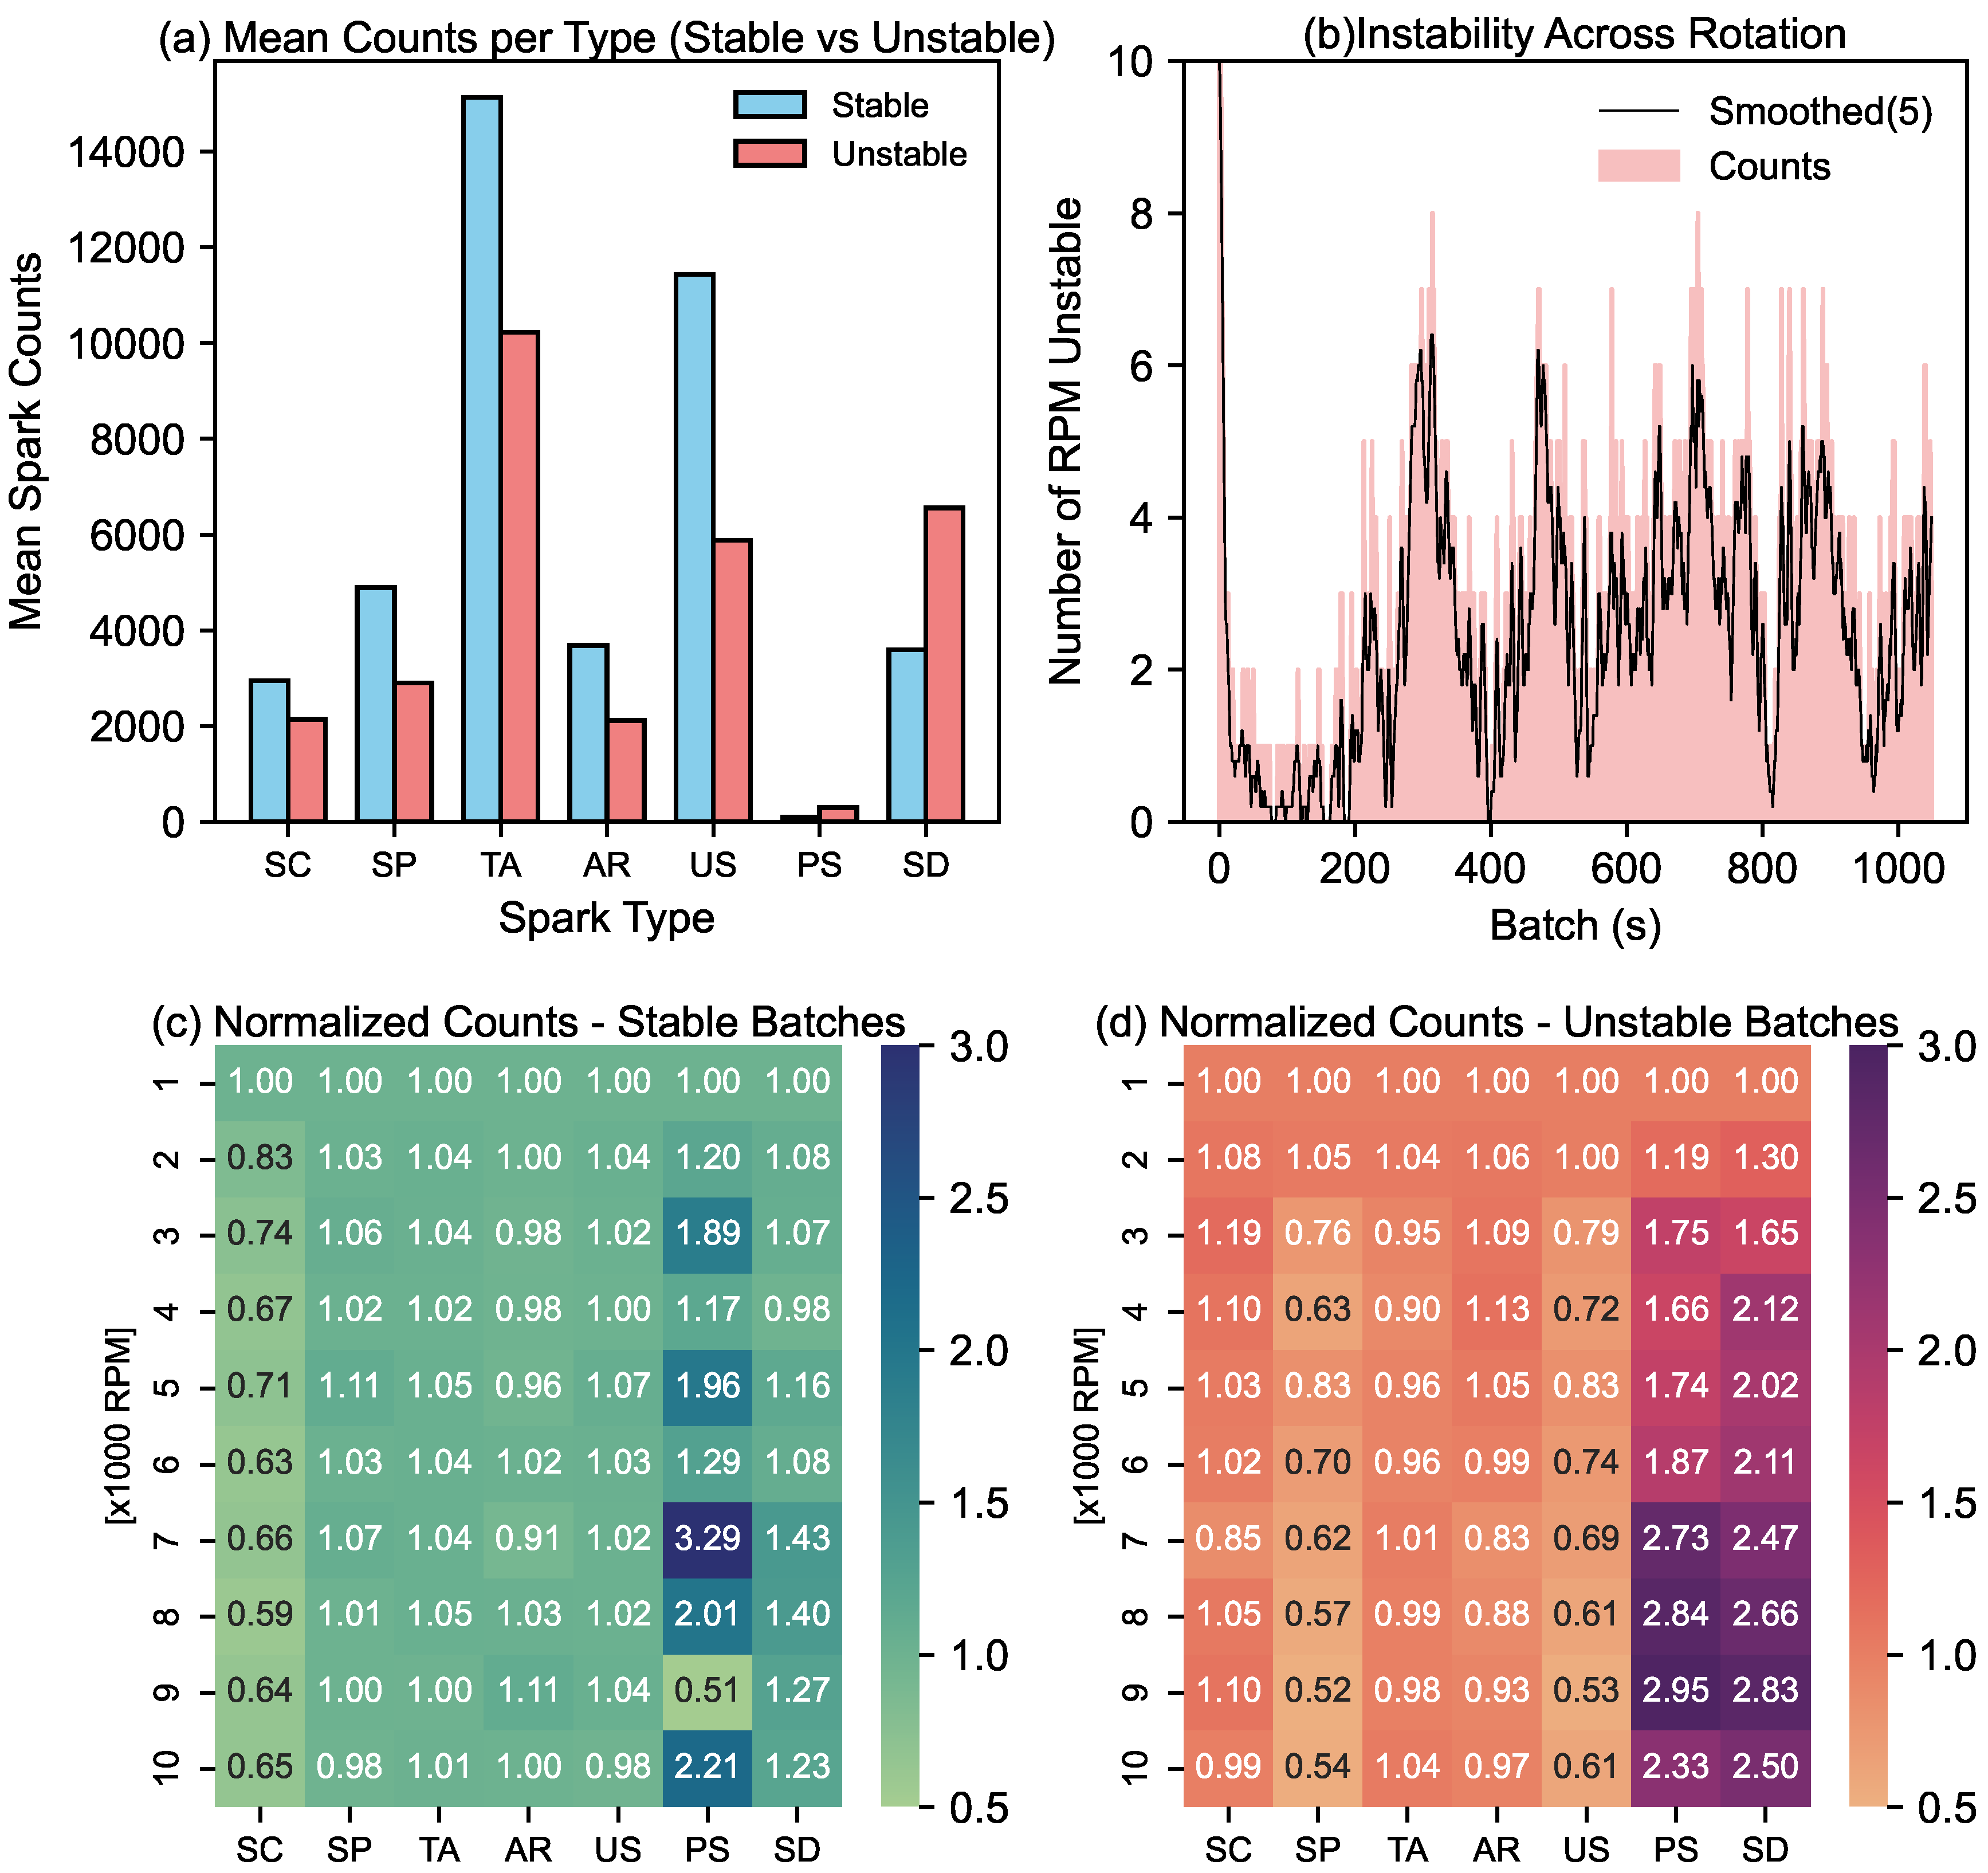
Figure 14a shows the aggregate count of discharges for each spark type in stable and unstable machining phases. It was observed that during instability, there was a significant drop in the total number of discharges. However, there was a noticeable increase in secondary discharges, which are likely responsible for over-machining.
To better understand the role of rotation, the counts of different spark types for each rotation rate were normalized with respect to the 1000 RPM baseline. As shown in
Figure 14c,d, transient arcs and arcs remain relatively constant (within 10% variation) across all rotation rates, indicating that long duration discharges are not significantly influenced by rotation. Two key observations emerged: First, increasing rotation rate was found to reduce short circuits by up to 40% during stable machining, while it remained unchanged during unstable machining. Contrarily, while clean spark counts decreased significantly during instability at higher rotation rates (more than 45%), they remained unaffected during stable phases. Furthermore, secondary discharges increased at higher rotation rates under both stable and unstable conditions, likely due to fluid shear that disrupted the discharge channels.
These contrasting behaviors help reconcile the earlier discrepancy between correlation and SHAP-based analysis: while short circuits and sparks showed a weak positive correlation overall, their opposing trends across stable and unstable phases at different rotation rates led to compensating effects in the aggregate data.
From these findings, we infer that during stable machining, increasing the rotation rate can suppress short circuits, whereas during unstable machining, a higher rotation rate may transform effective clean sparks into secondary discharges.
This insight forms the basis for a dynamic rotation control strategy: increase rotation rate during stable phases to improve flushing efficiency, and decrease it upon detecting instability to preserve spark effectiveness. Moreover,
Figure 14b reveals that temporal evolution of instability occurs across all rotation rates, suggesting time-dependent patterns in machining behavior. Such trends are difficult to capture using static models like Random Forests and XGBoost. Future work could employ sequence-based models, such as recurrent neural networks (RNNs), to learn and predict these evolving patterns, potentially enabling earlier and more adaptive control.
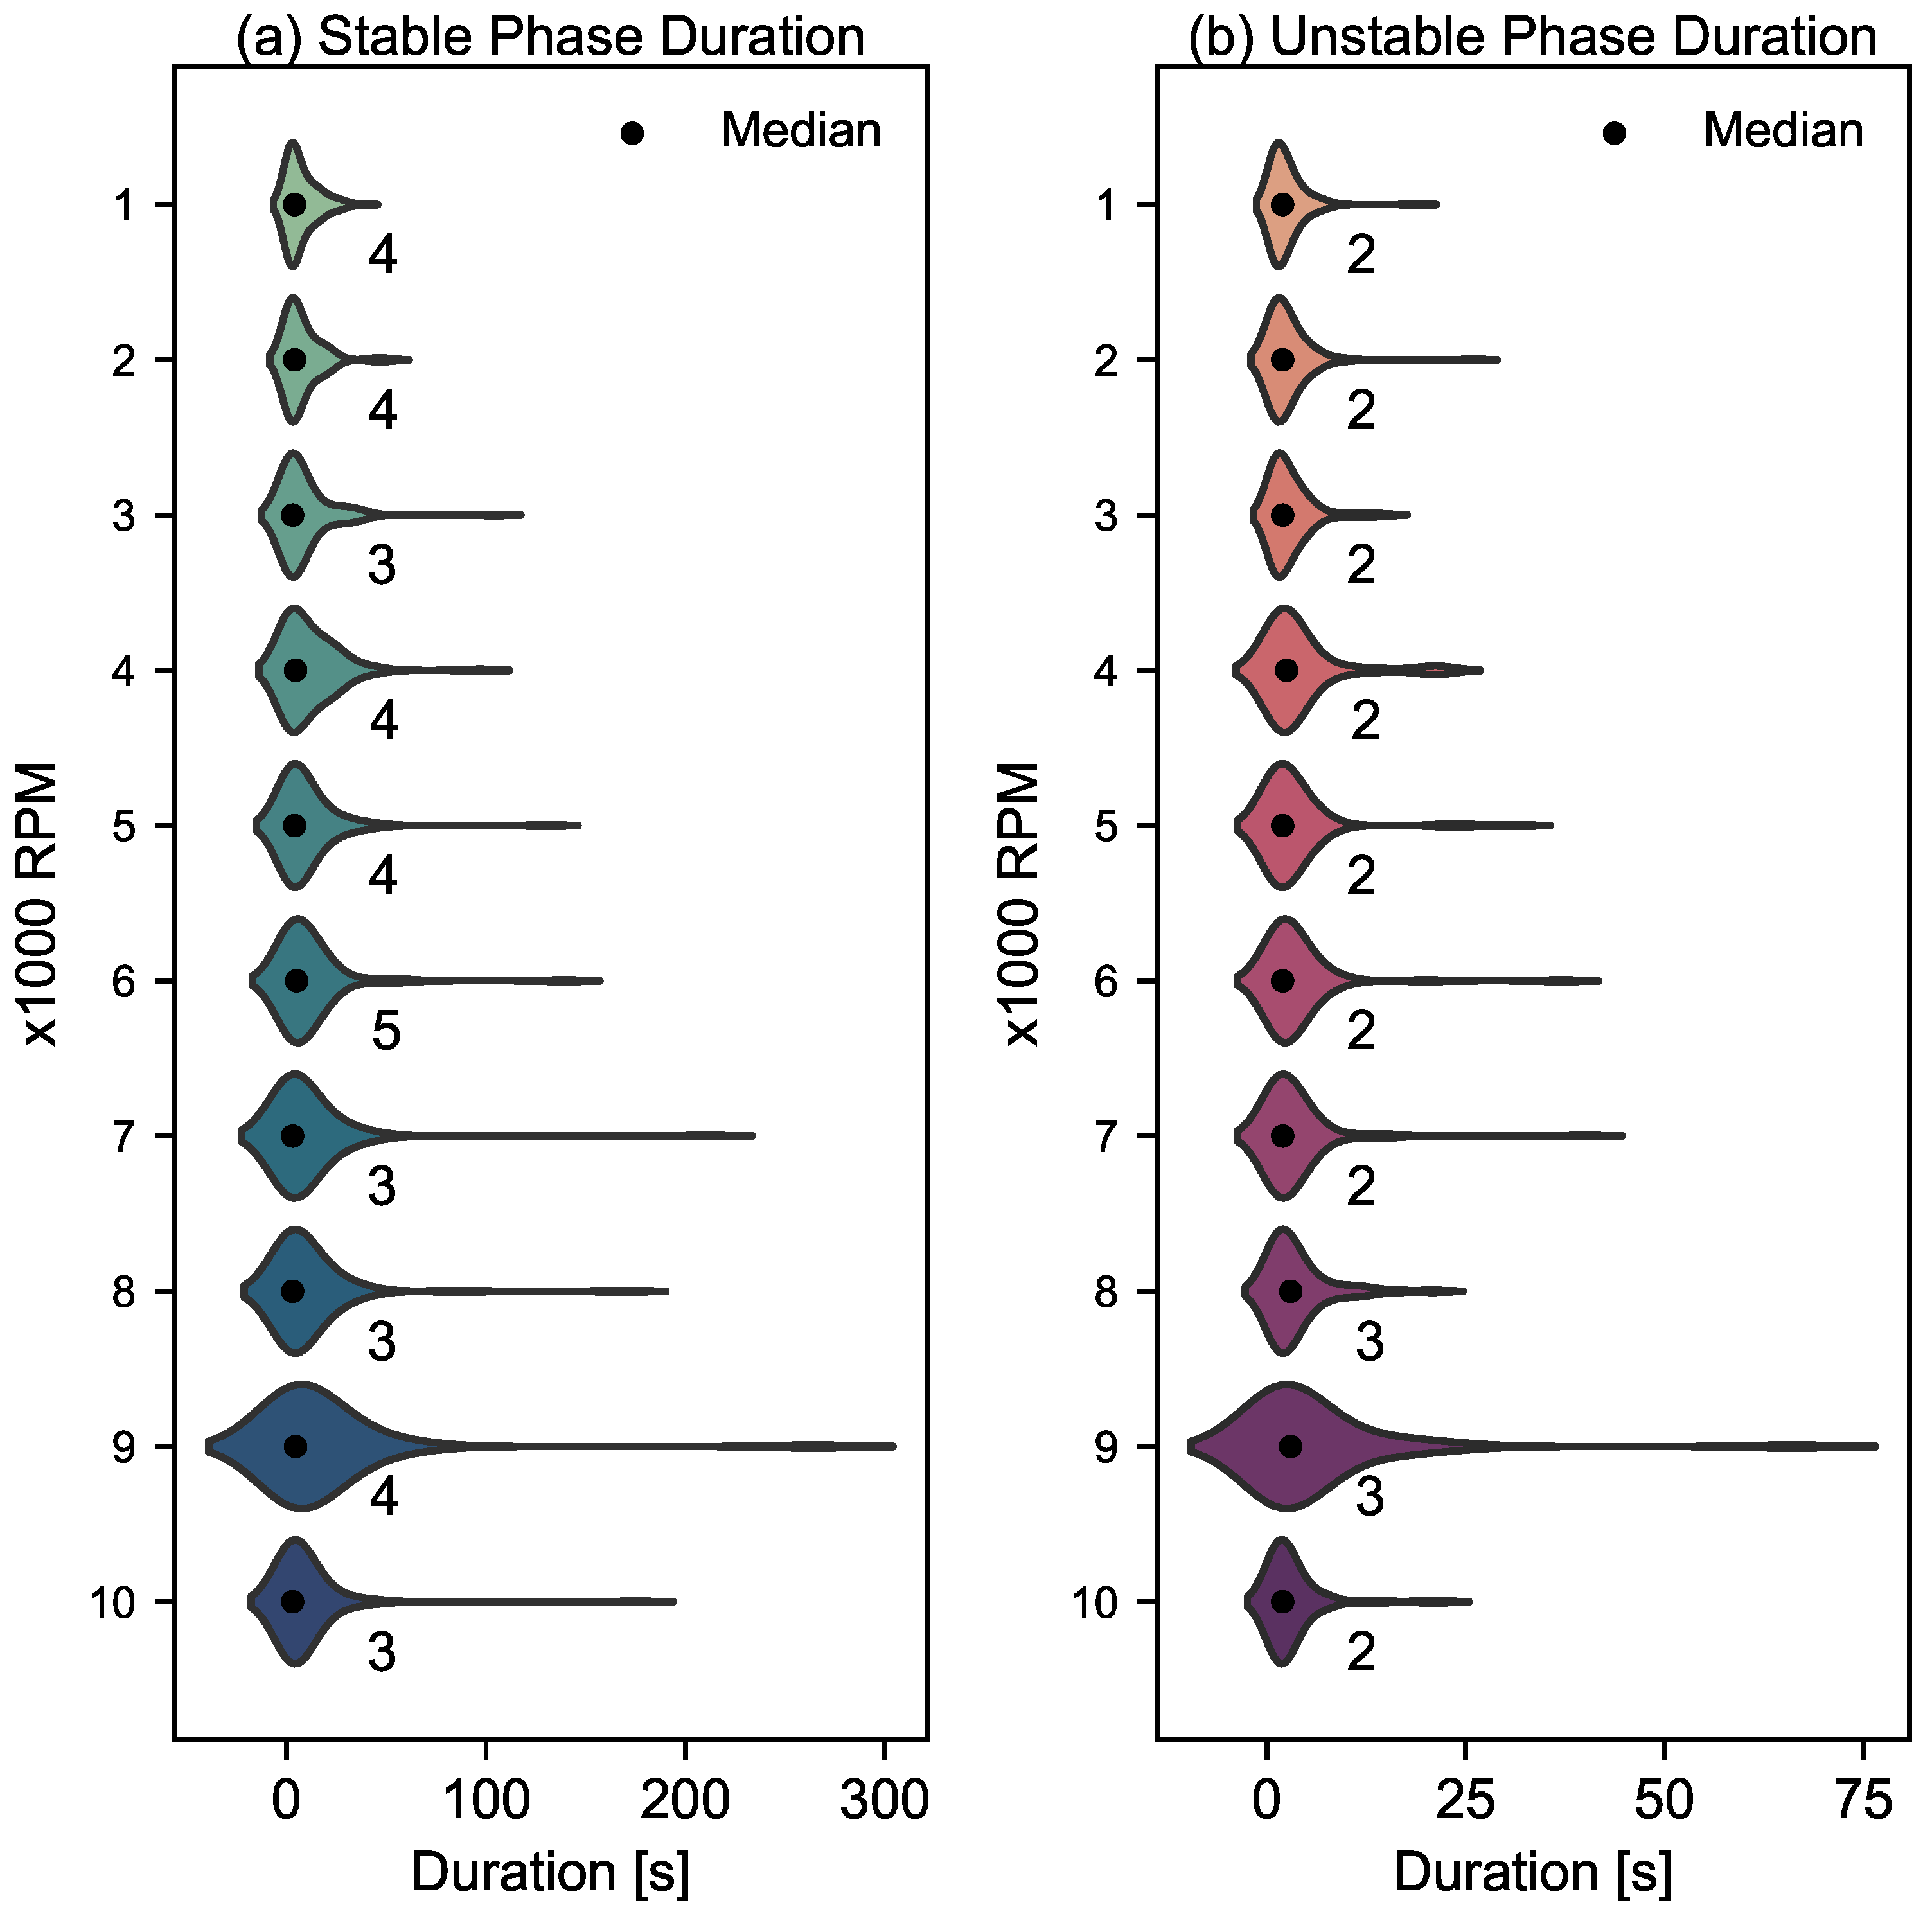
Violin plots in
Figure 15 show that higher rotation rates are associated with longer tailed distributions in both stable and unstable phase durations. This suggests that once a particular phase is established at a higher rotation rate, it tends to persist for a longer duration. In contrast, lower rotation rates exhibit more compact distributions, indicative of shorter lived phases. This observation highlights the potential of rotation rate as a means to modulate machining phase stability.
Based on these two analyses, we propose a simple framework for real-time control. During machining, if stable conditions persist, increase the rotation incrementally every 4 s (the median duration of stable phases). If instability persists beyond 2 s, decrease the rotation rate sharply to achieve a more stable machining condition.
However, this study also recognizes certain limitations. The proposed control strategy is based on a limited number of observed rotation transitions and should be regarded as preliminary. Moreover, the predictive modeling employed in this work operates on a batch size of 1 s, which is comparable to the proposed control adjustment timescale of 2 s. This temporal proximity may limit the responsiveness of the current model in capturing finer grained transitions. To overcome this, future investigations should explore time-sequence modeling approaches, such as recurrent neural networks (RNNs), which can identify evolving patterns at subsecond resolutions. These models may enable the earlier detection of instability onset and better accommodate time delays introduced by data acquisition, feature computation, prediction, and spindle actuation delays. Additionally, since this study focused exclusively on ultrafine-grained tungsten carbide, the applicability of the proposed models and control strategies to other electrode or workpiece materials remains to be validated.


