
Predicting the Relative Density of Stainless Steel and Aluminum Alloys Manufactured by L-PBF Using Machine Learning

 , , ,
, , ,
Abstract
1. Introduction
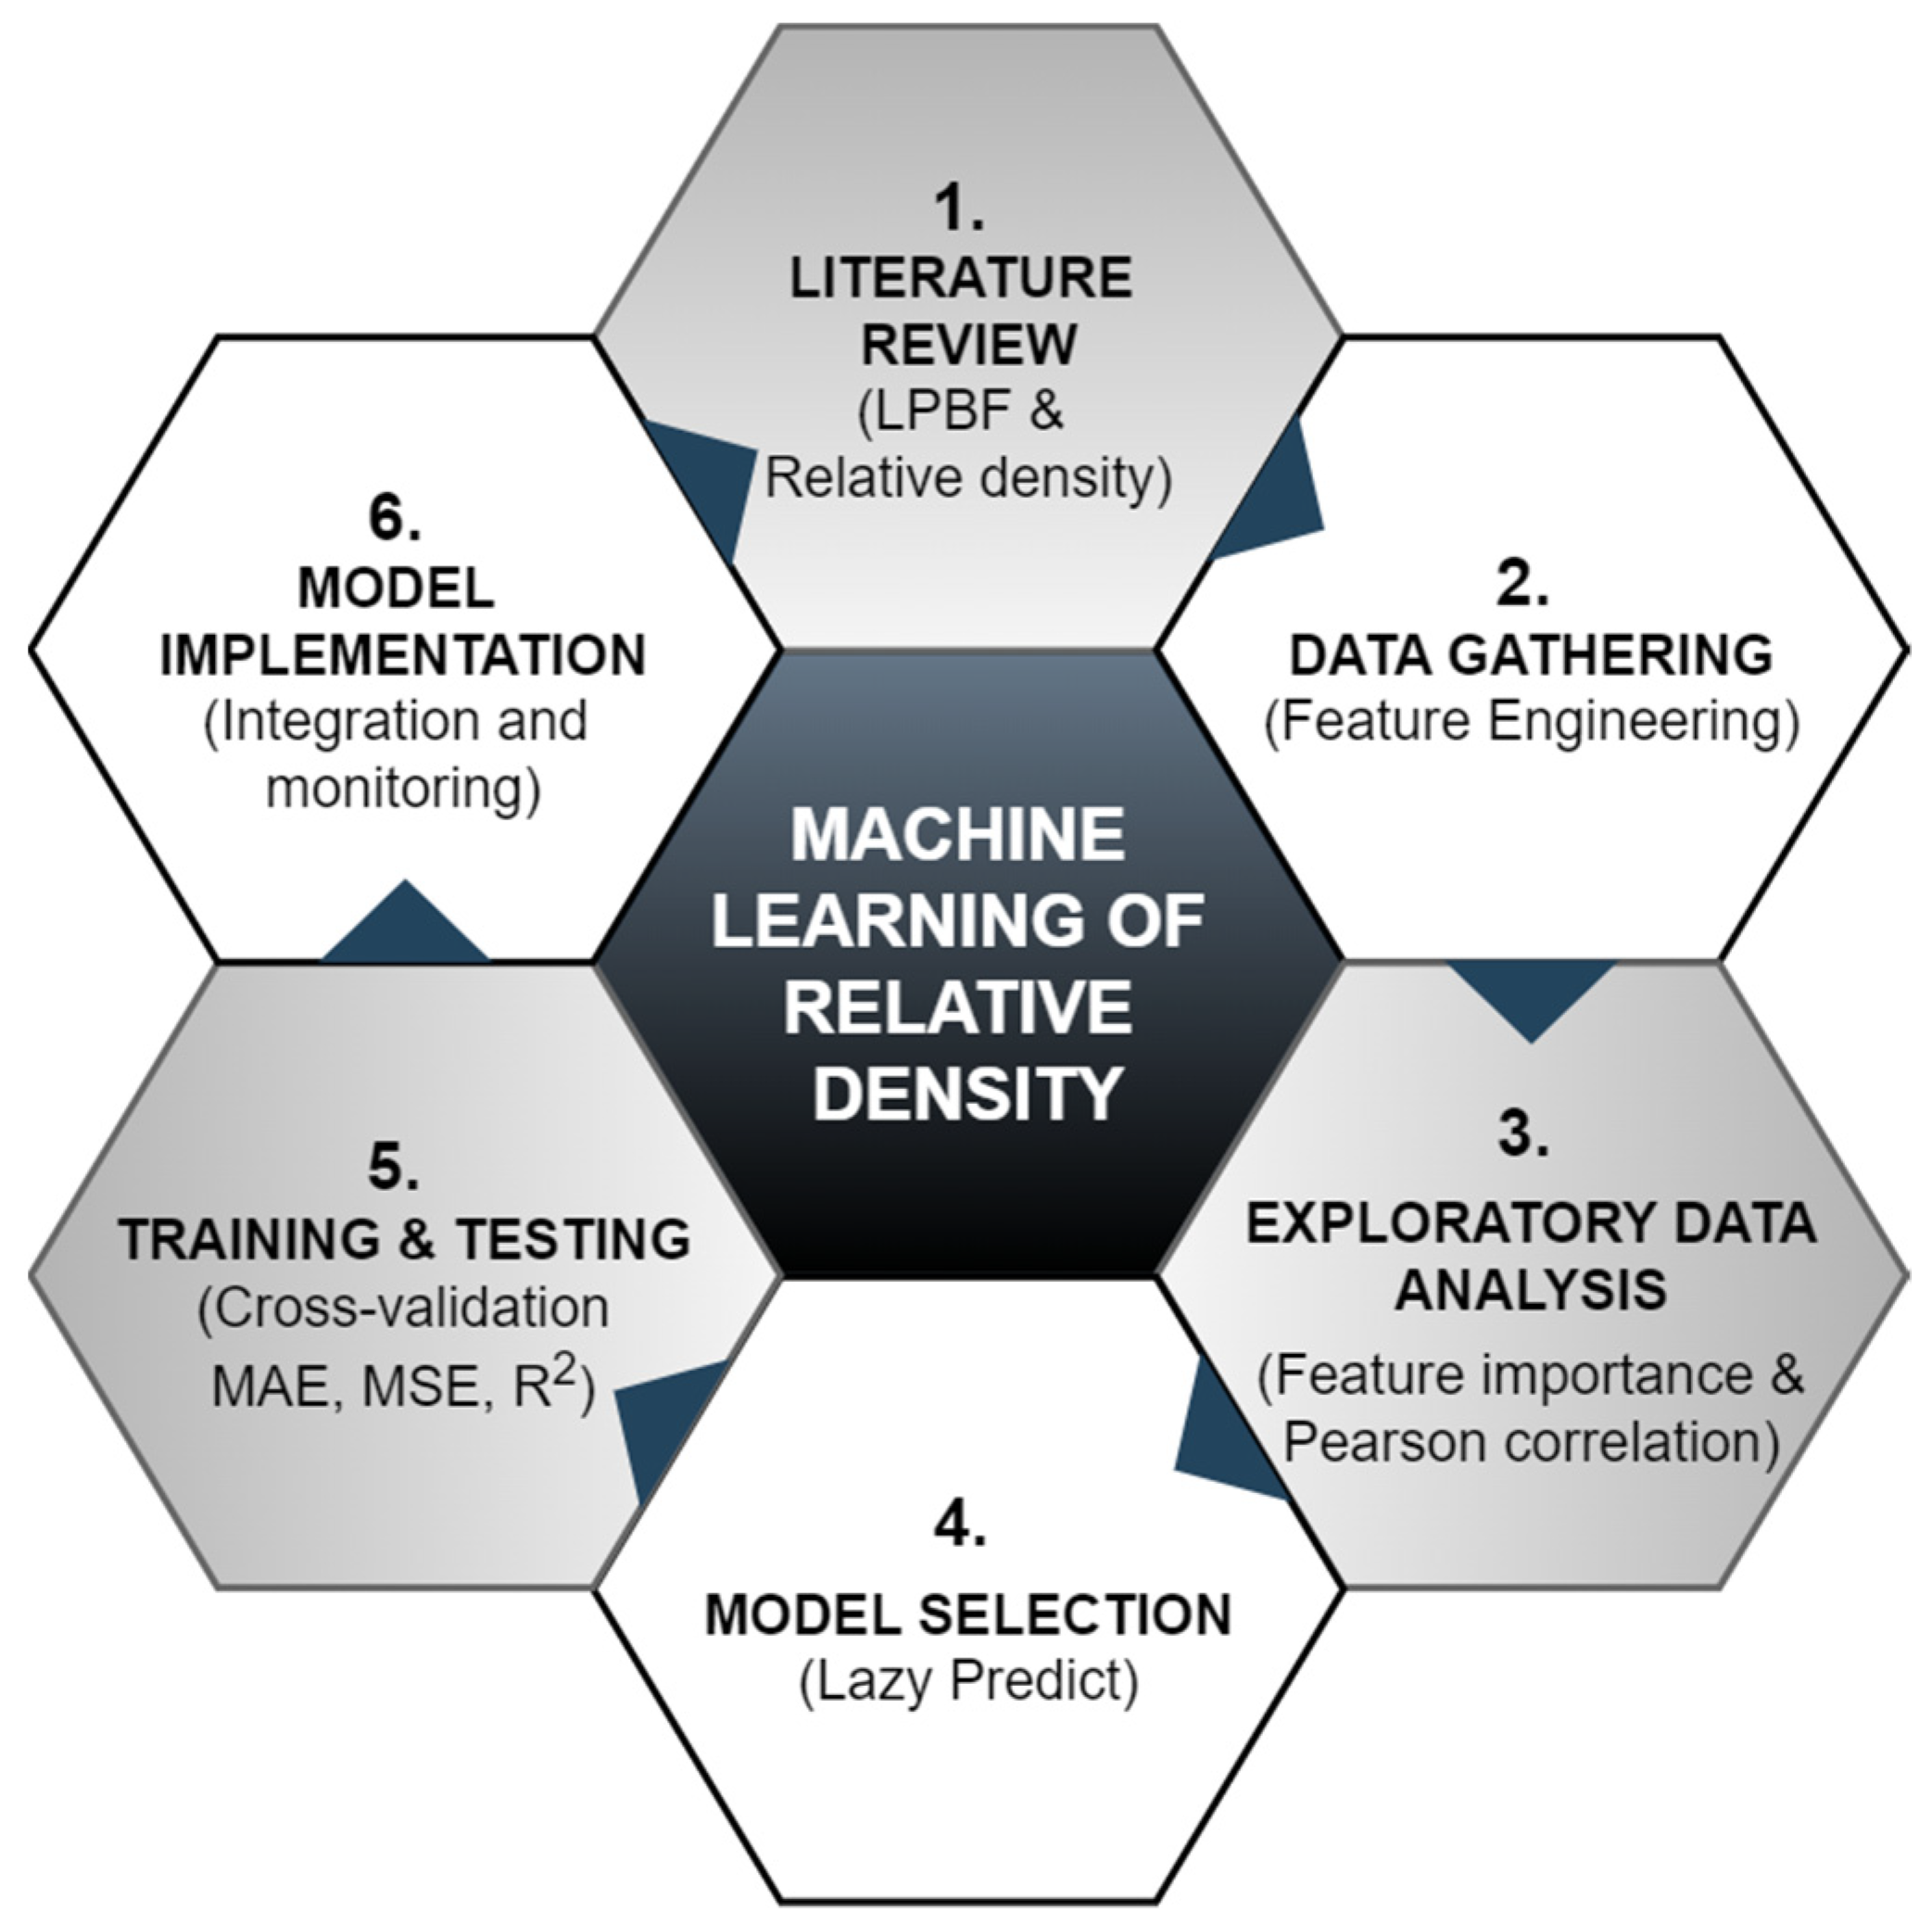
2. Materials and Methods
2.1. Materials Properties
2.2. Additive Manufacturing
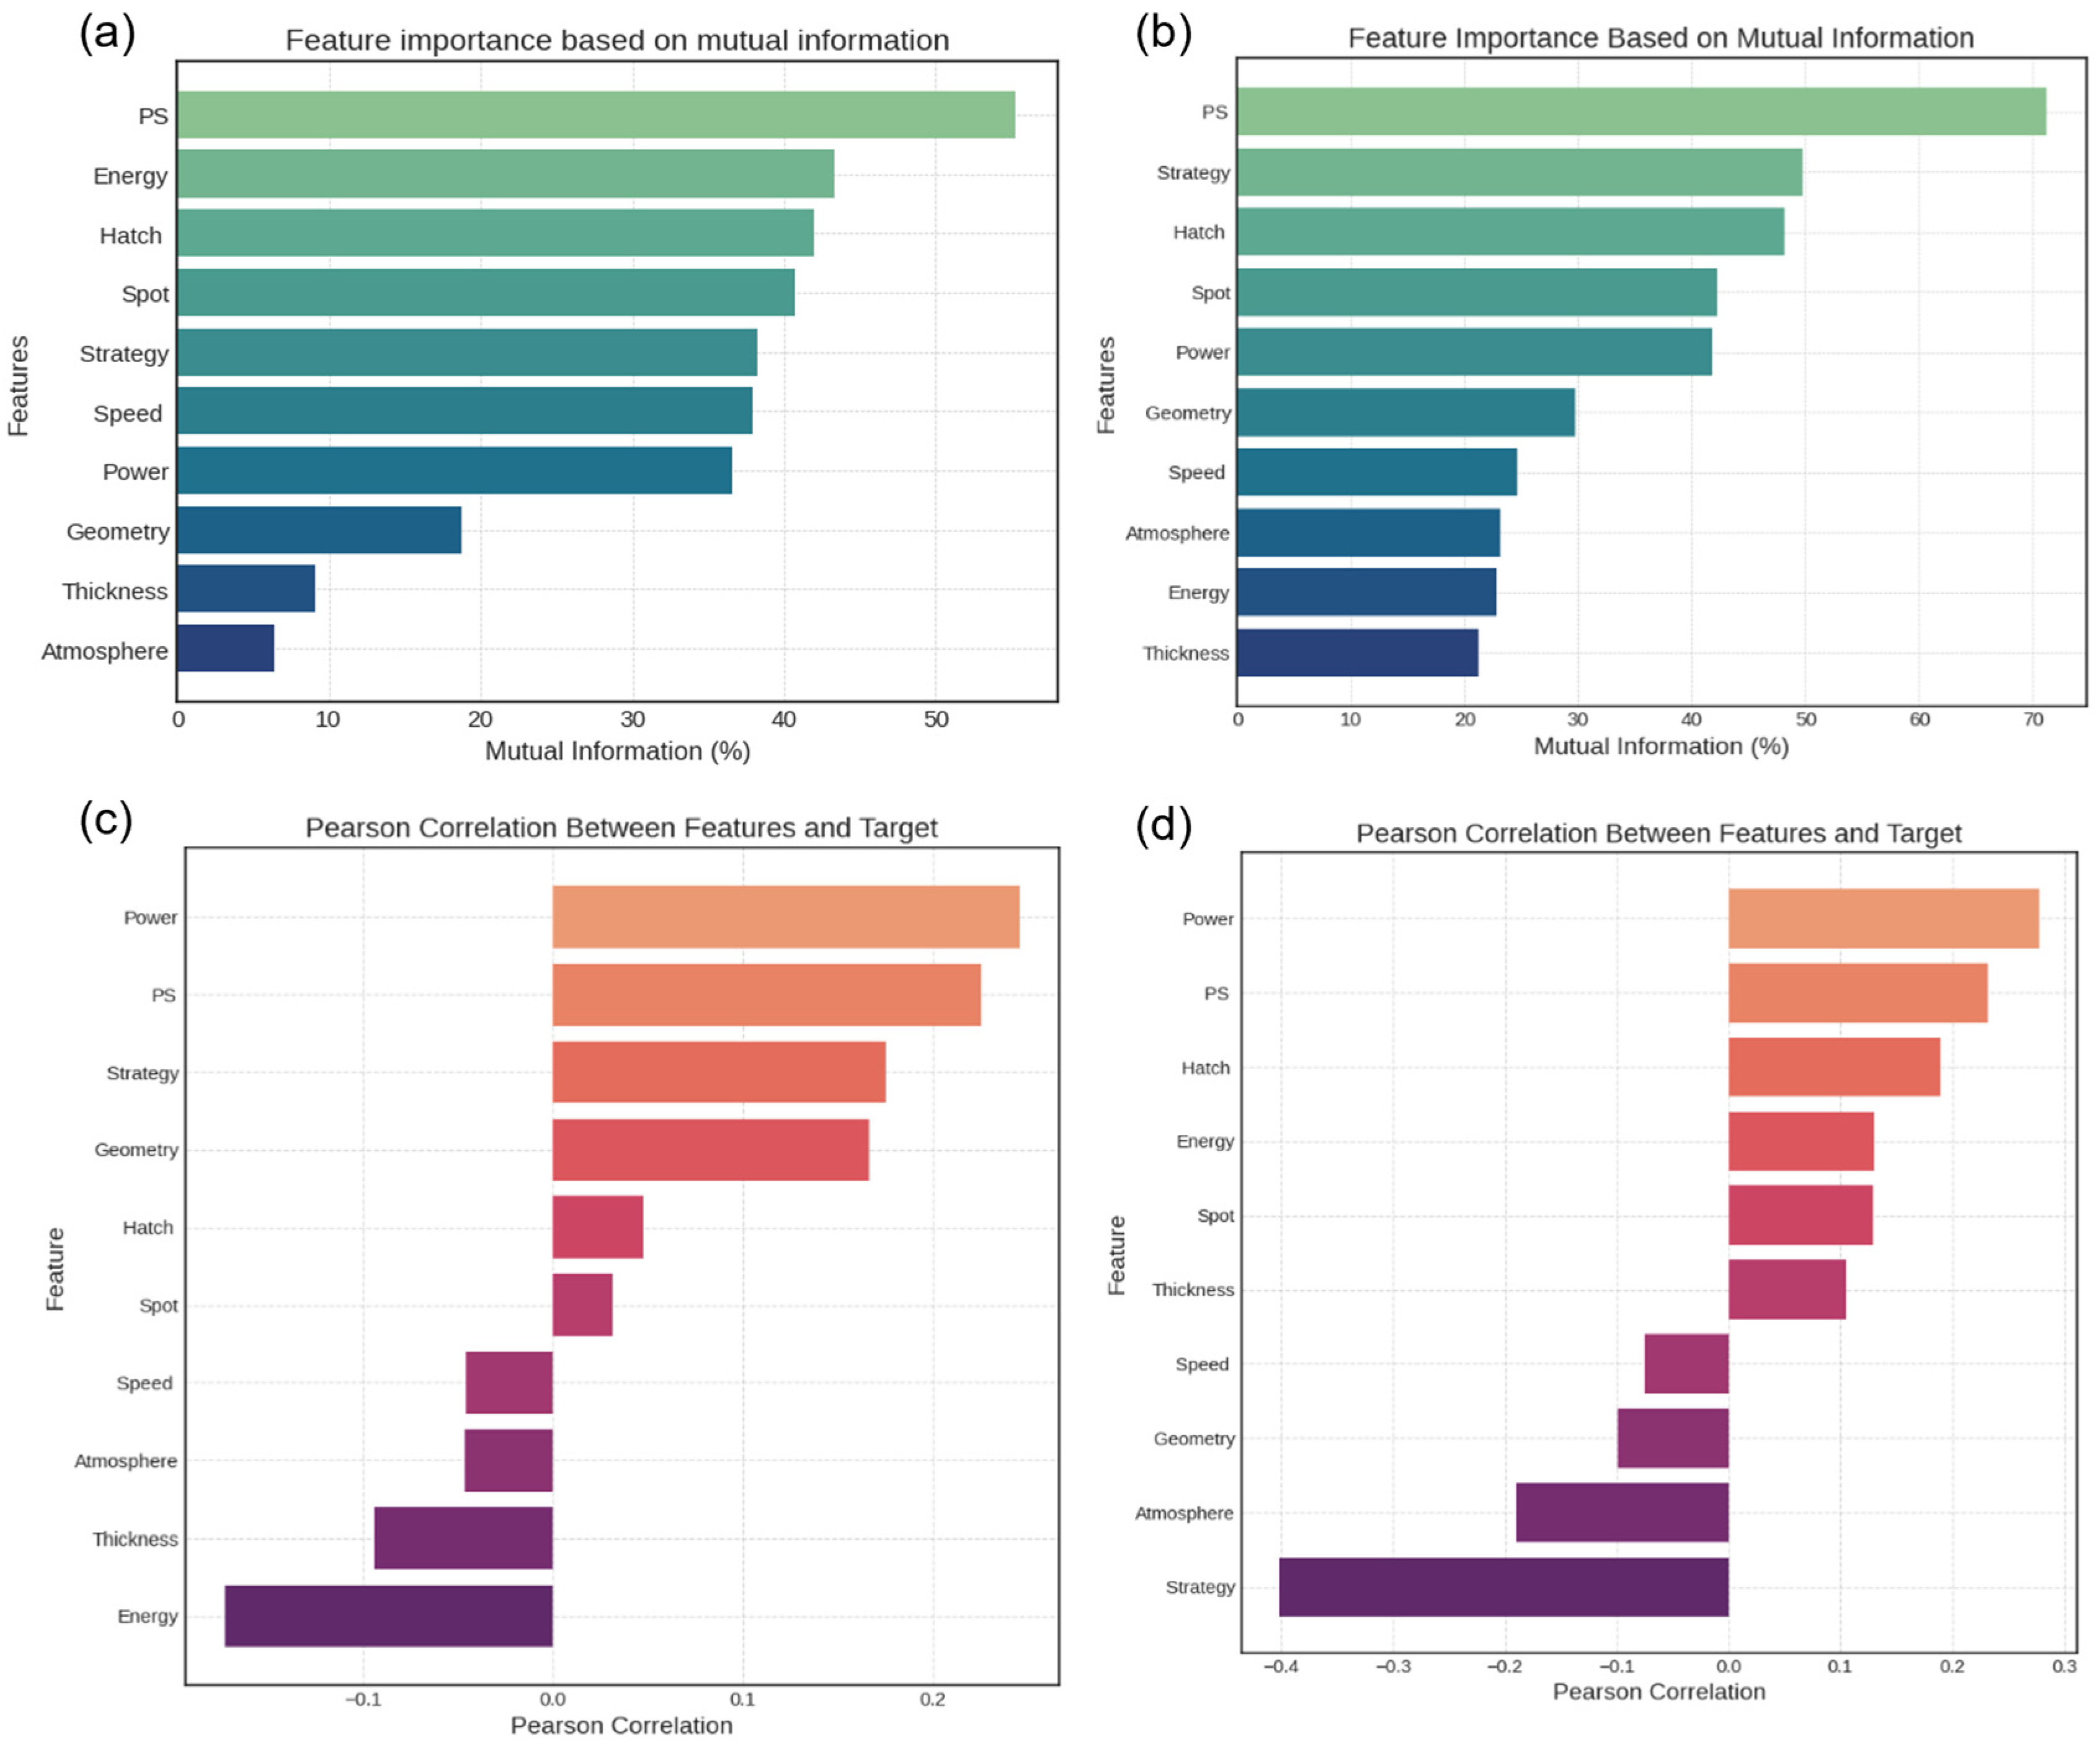
2.3. Exploratory Data Analysis
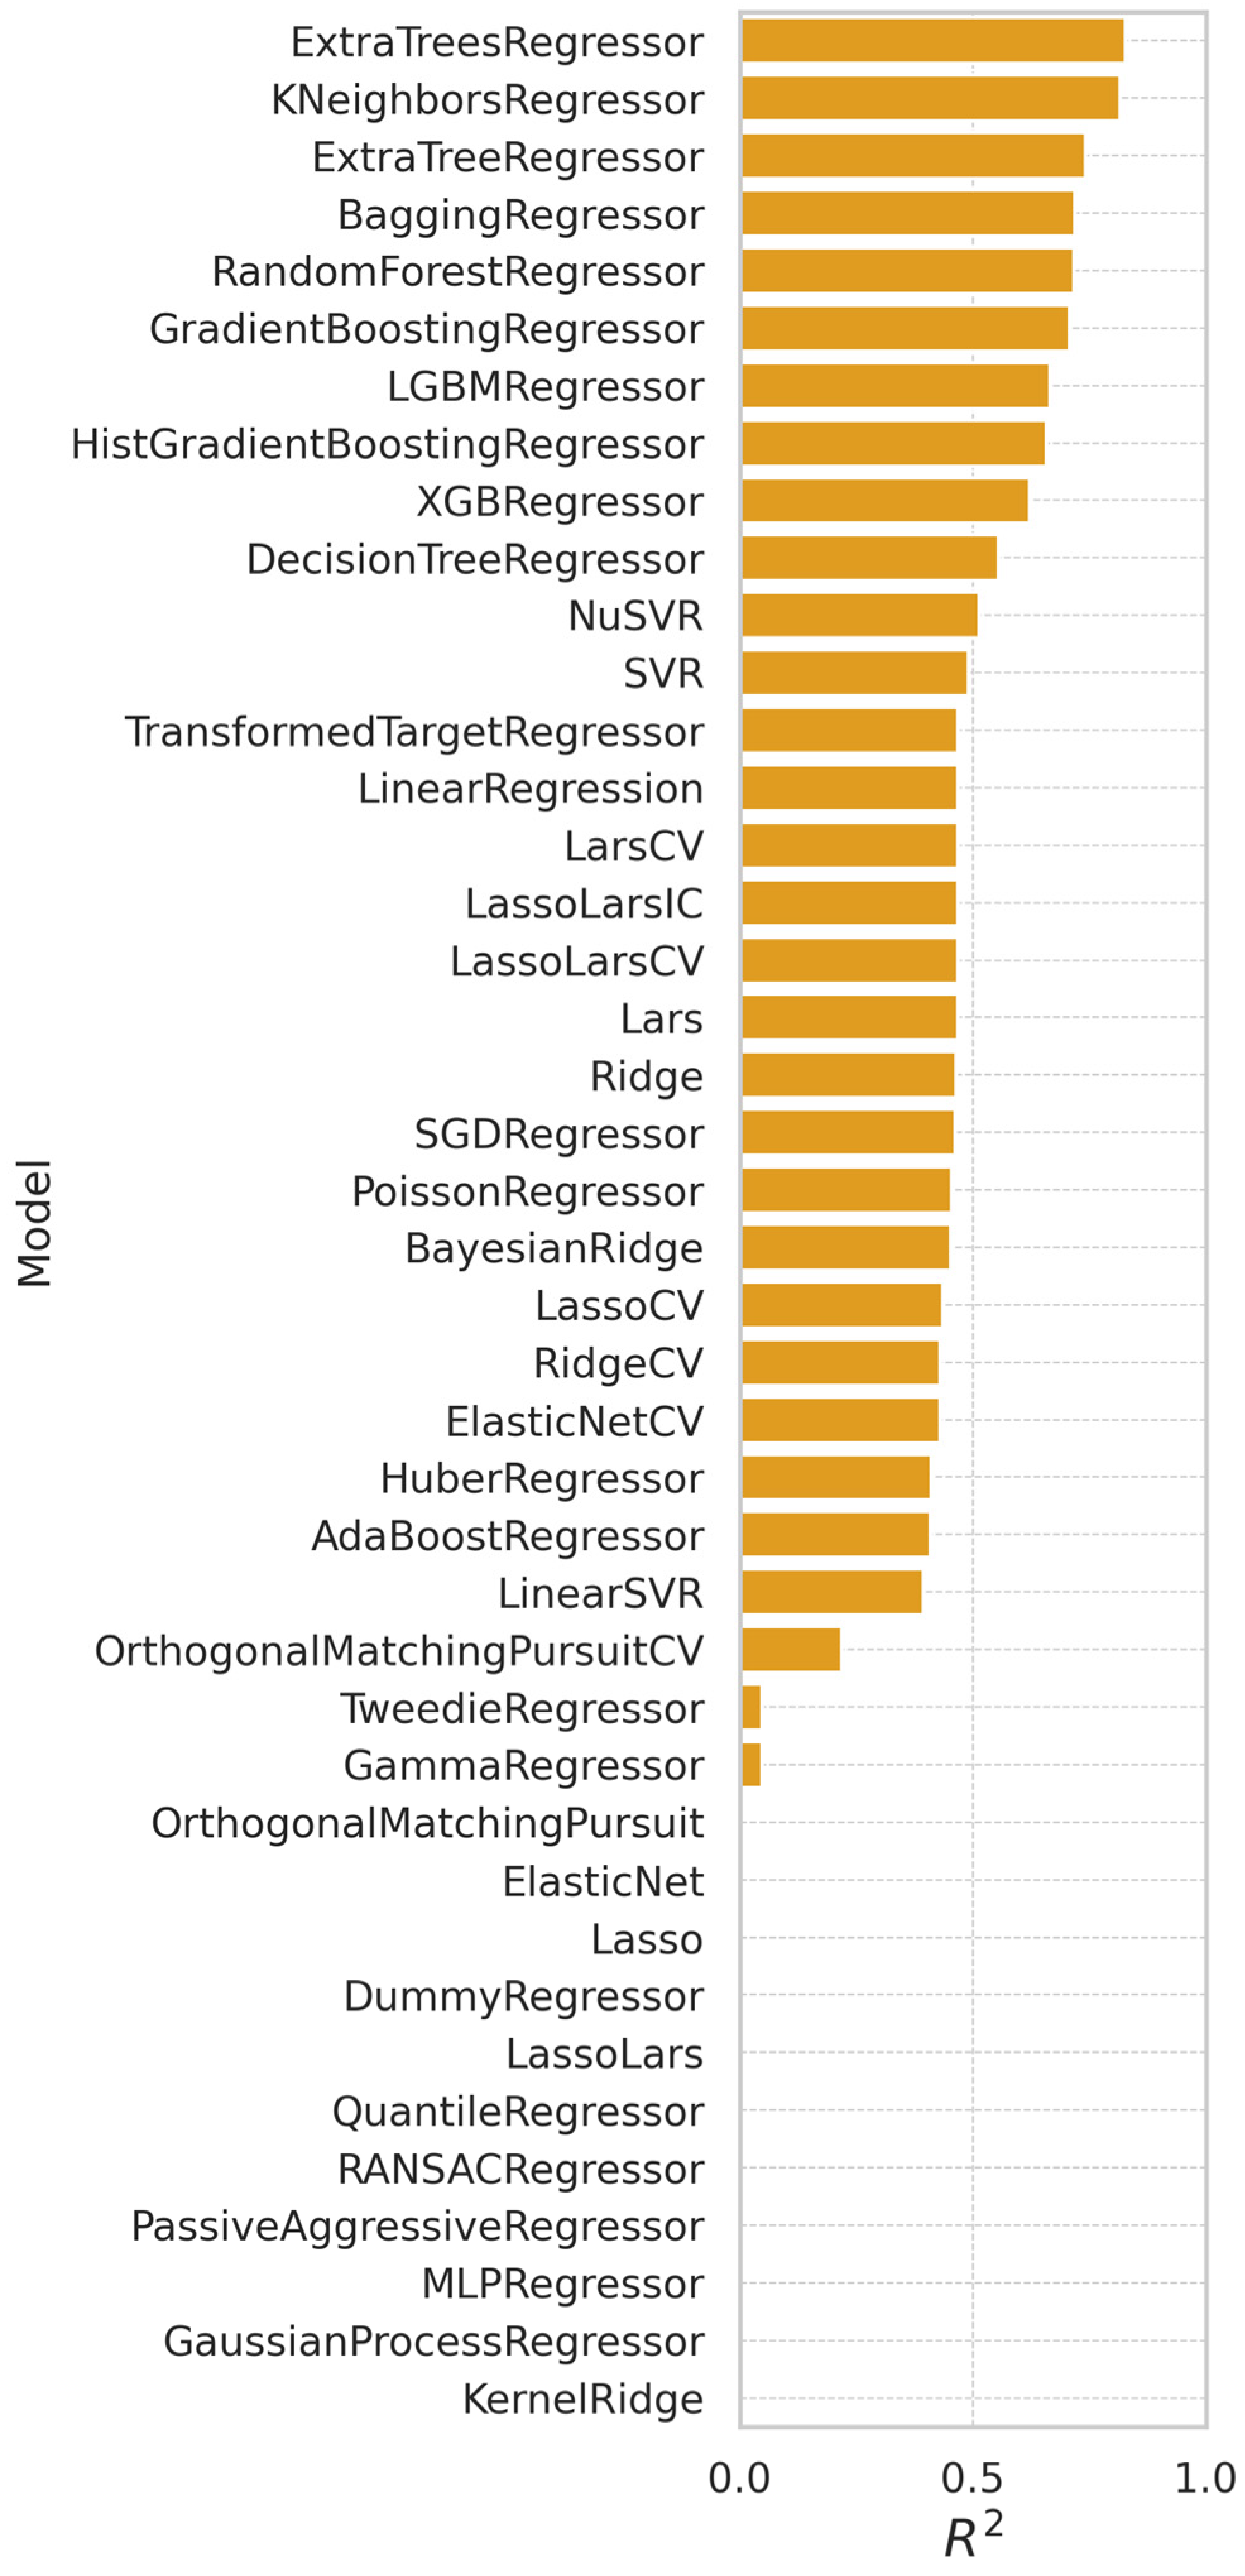
2.4. Machine Learning
3. Results and Discussion
3.1. Aluminum Alloy Al-Si10-Mg Relative Density Prediction
3.2. Stainless Steel 316L Relative Density Prediction
3.3. Global Relative Density Prediction
4. Conclusions
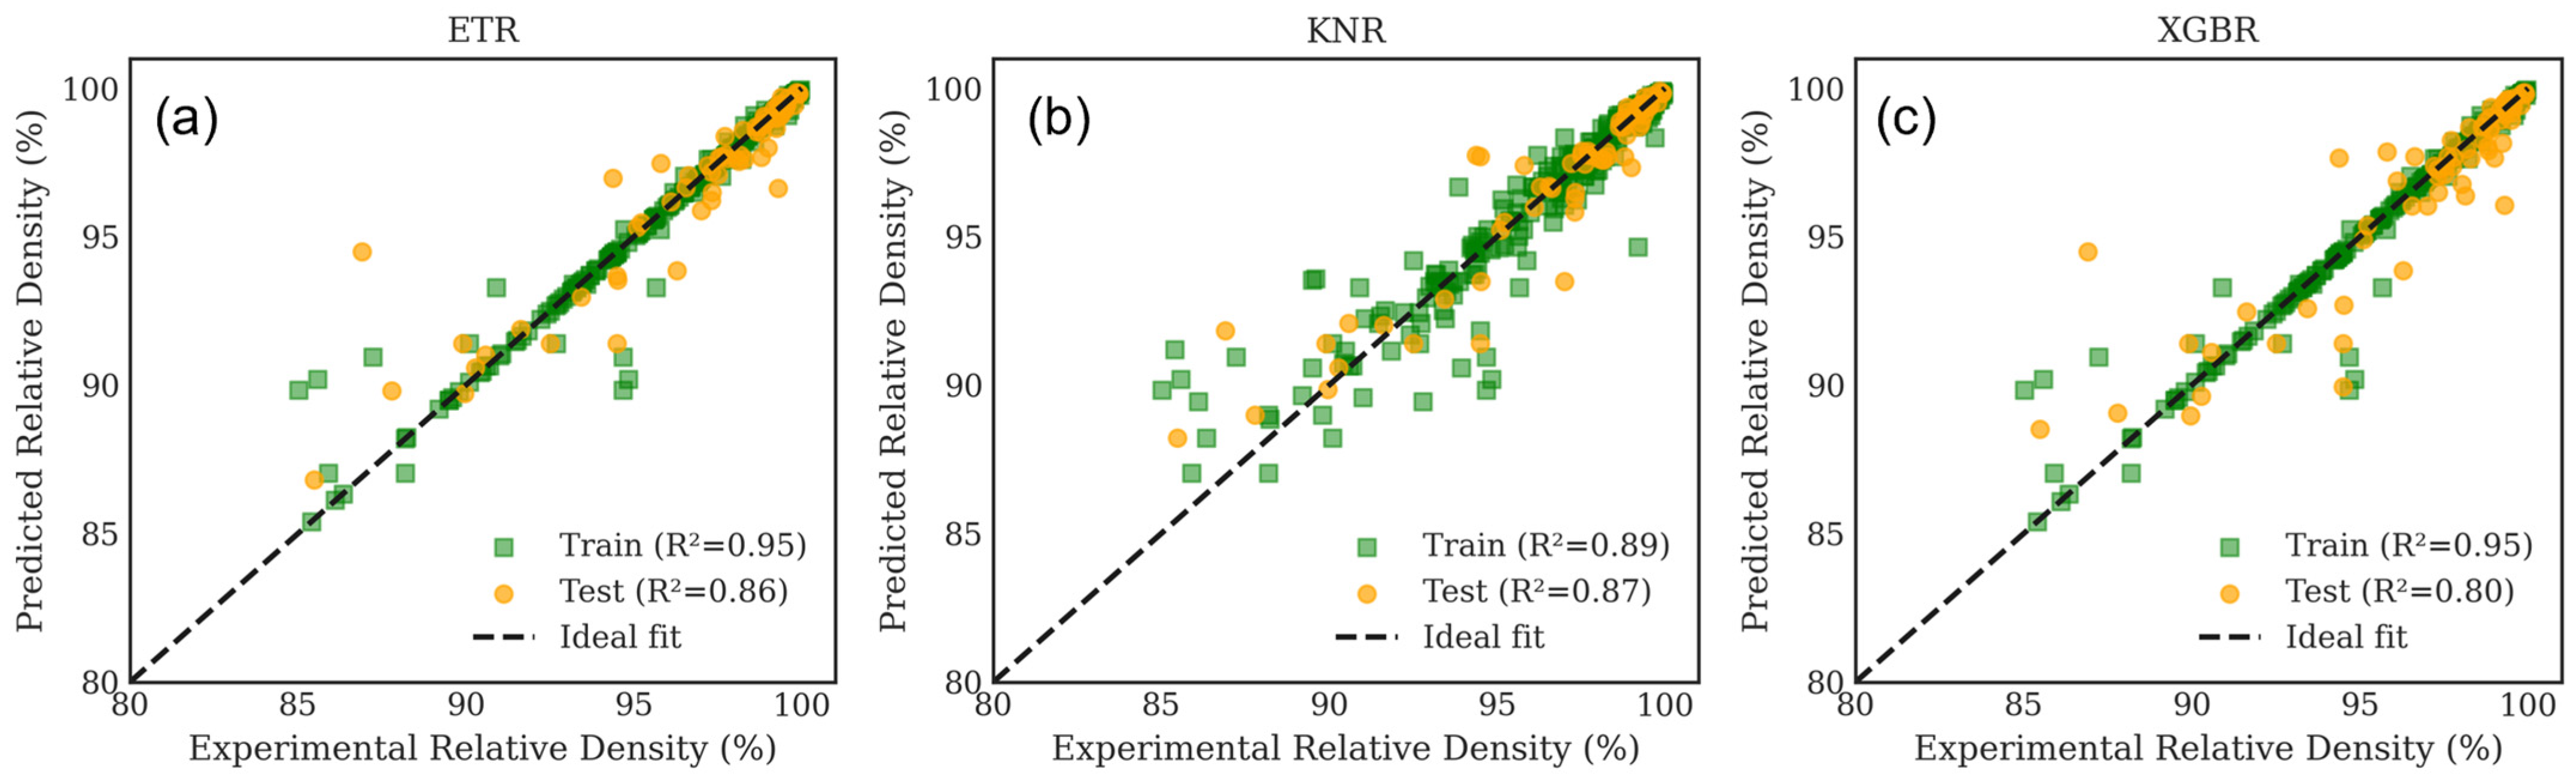
- The dataset generated for aluminum alloy and stainless steel presents a wide range of processing parameters, combining different brands and models of L-PBF machines. The ML models generated captured the inherent variability of each machine, achieving fairly accurate R2 values. For Al-Si10-Mg, an R2 of 0.95 was obtained for the training dataset and an R2 of 0.86 for the testing dataset. For the 316L SS, accurate results were also obtained, with an R2 of 0.95 for training and 0.83 for testing.
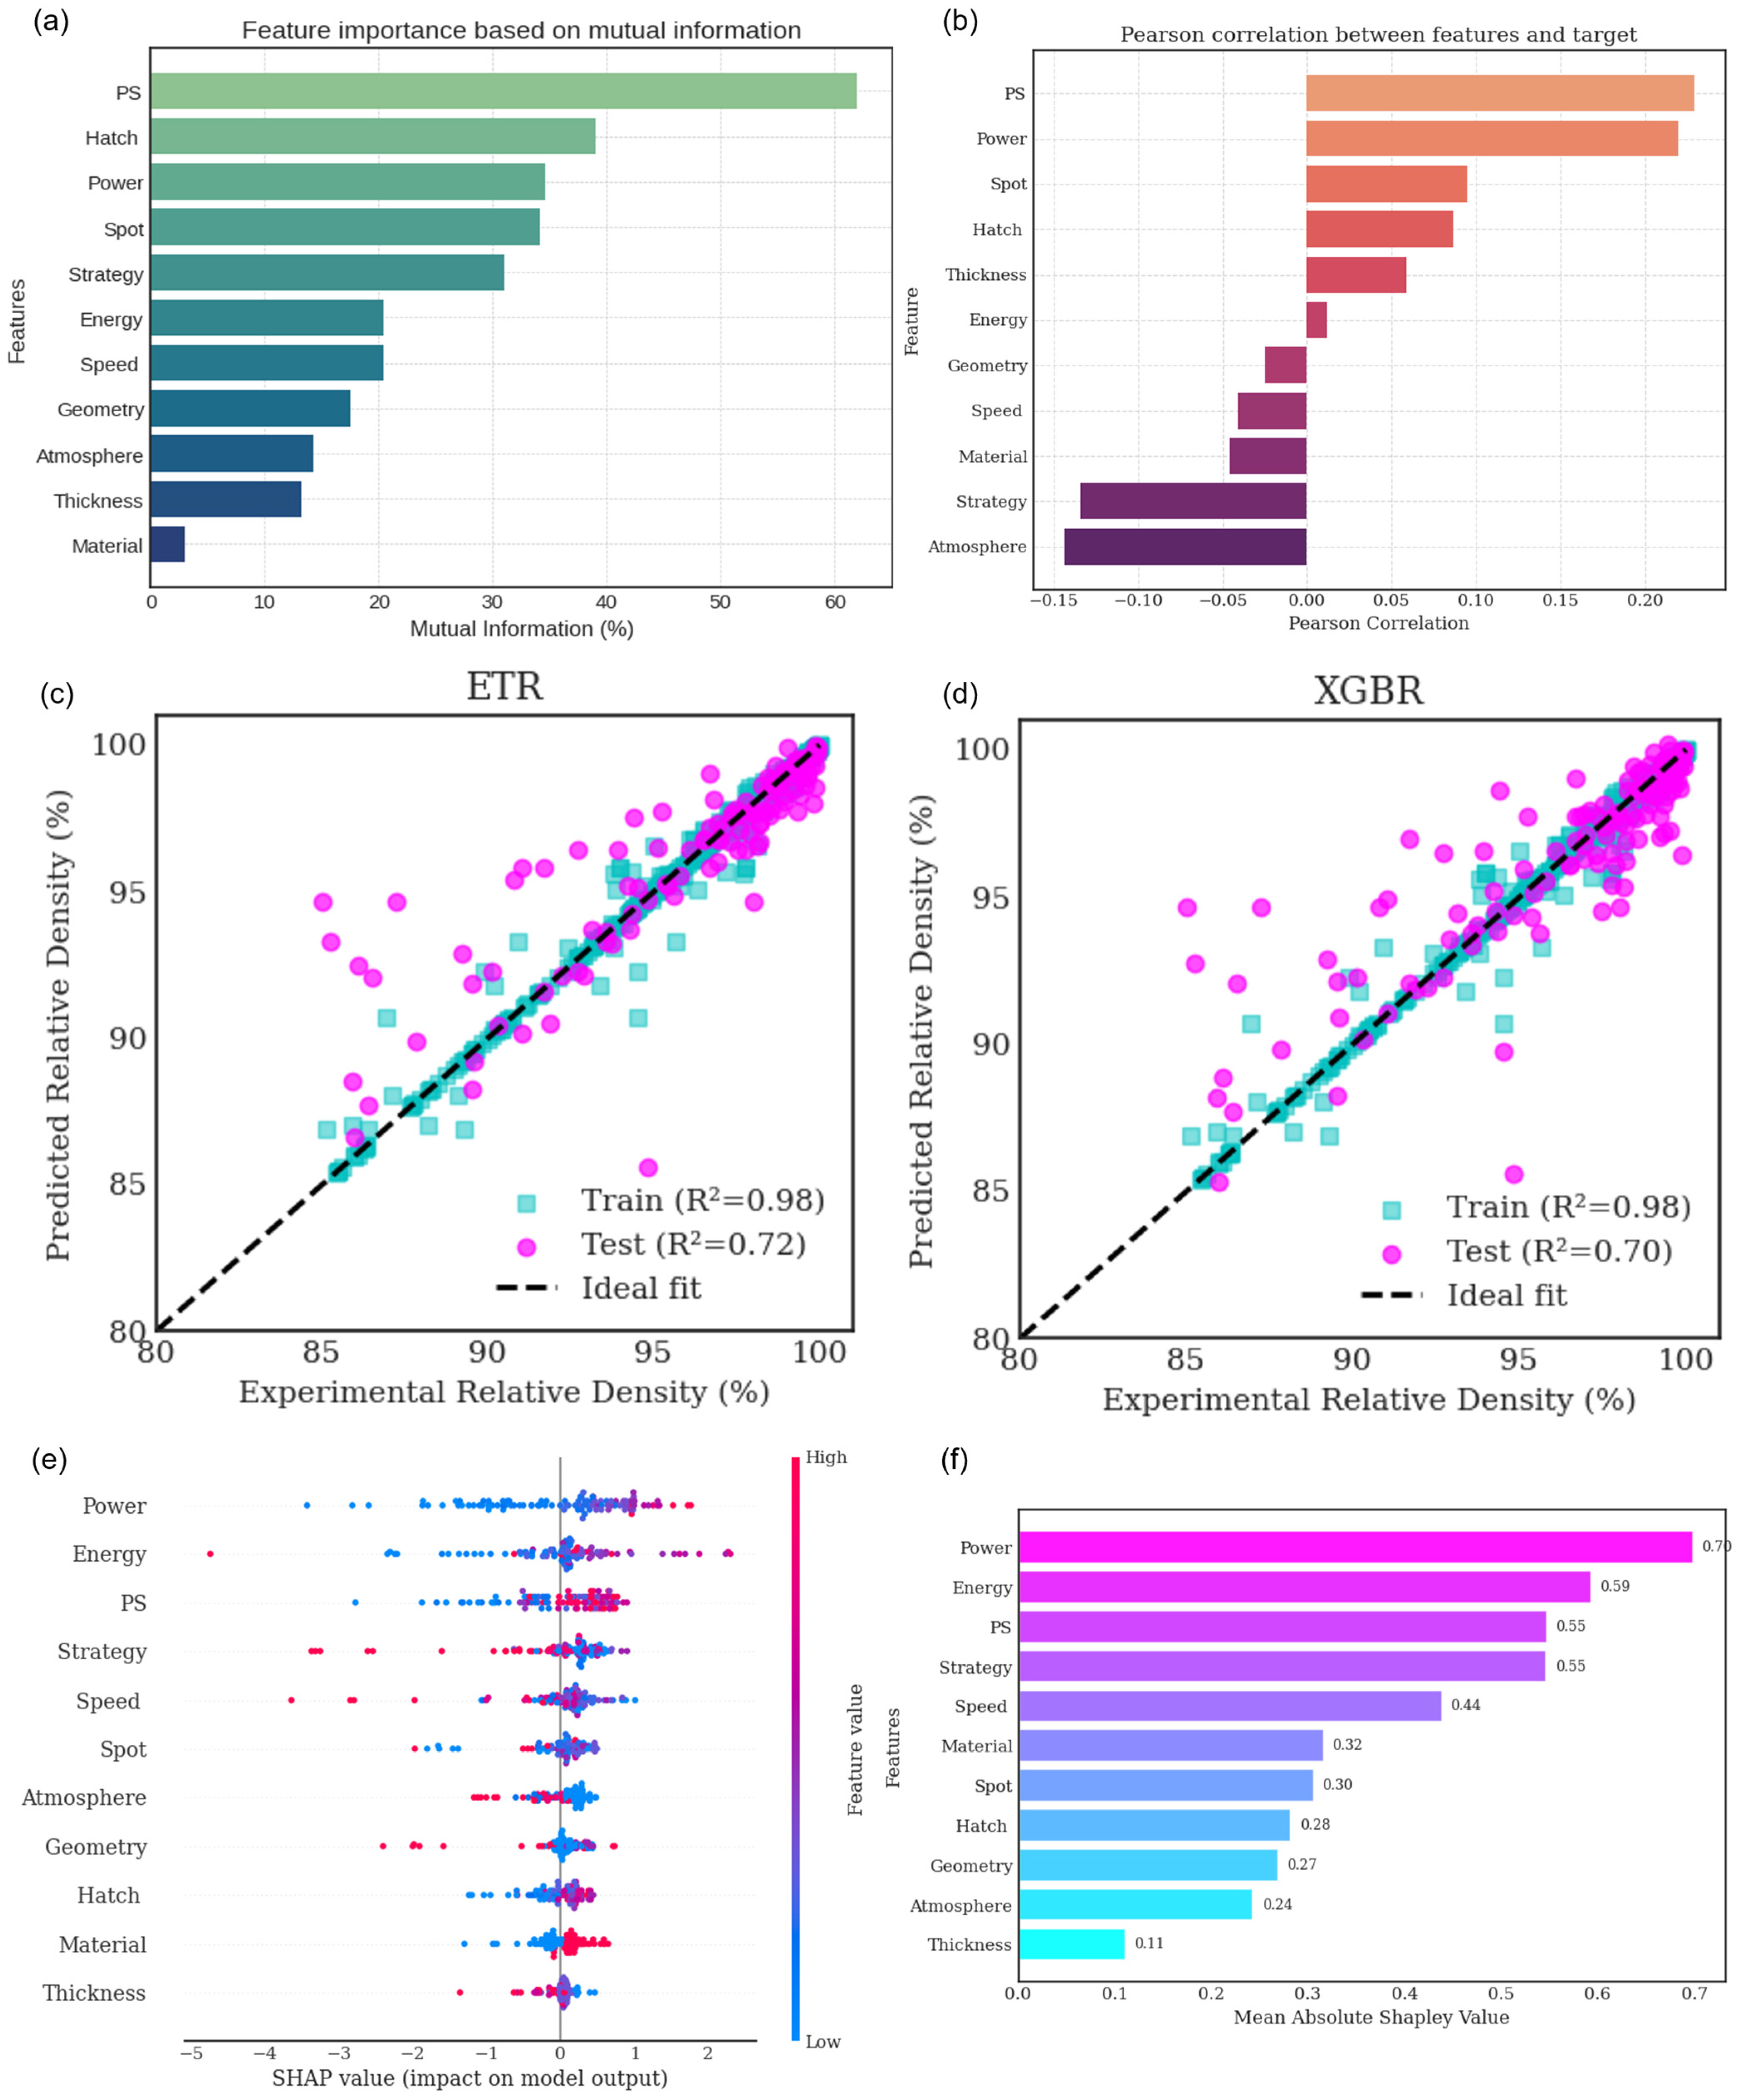
- Combining the datasets resulted in a more robust database; however, the variability of the processing parameters increased as the energy density required to process each material was different. The predictions obtained a better accuracy for the training dataset (R2 = 0.98), but it was reduced to 0.72 for the test dataset.
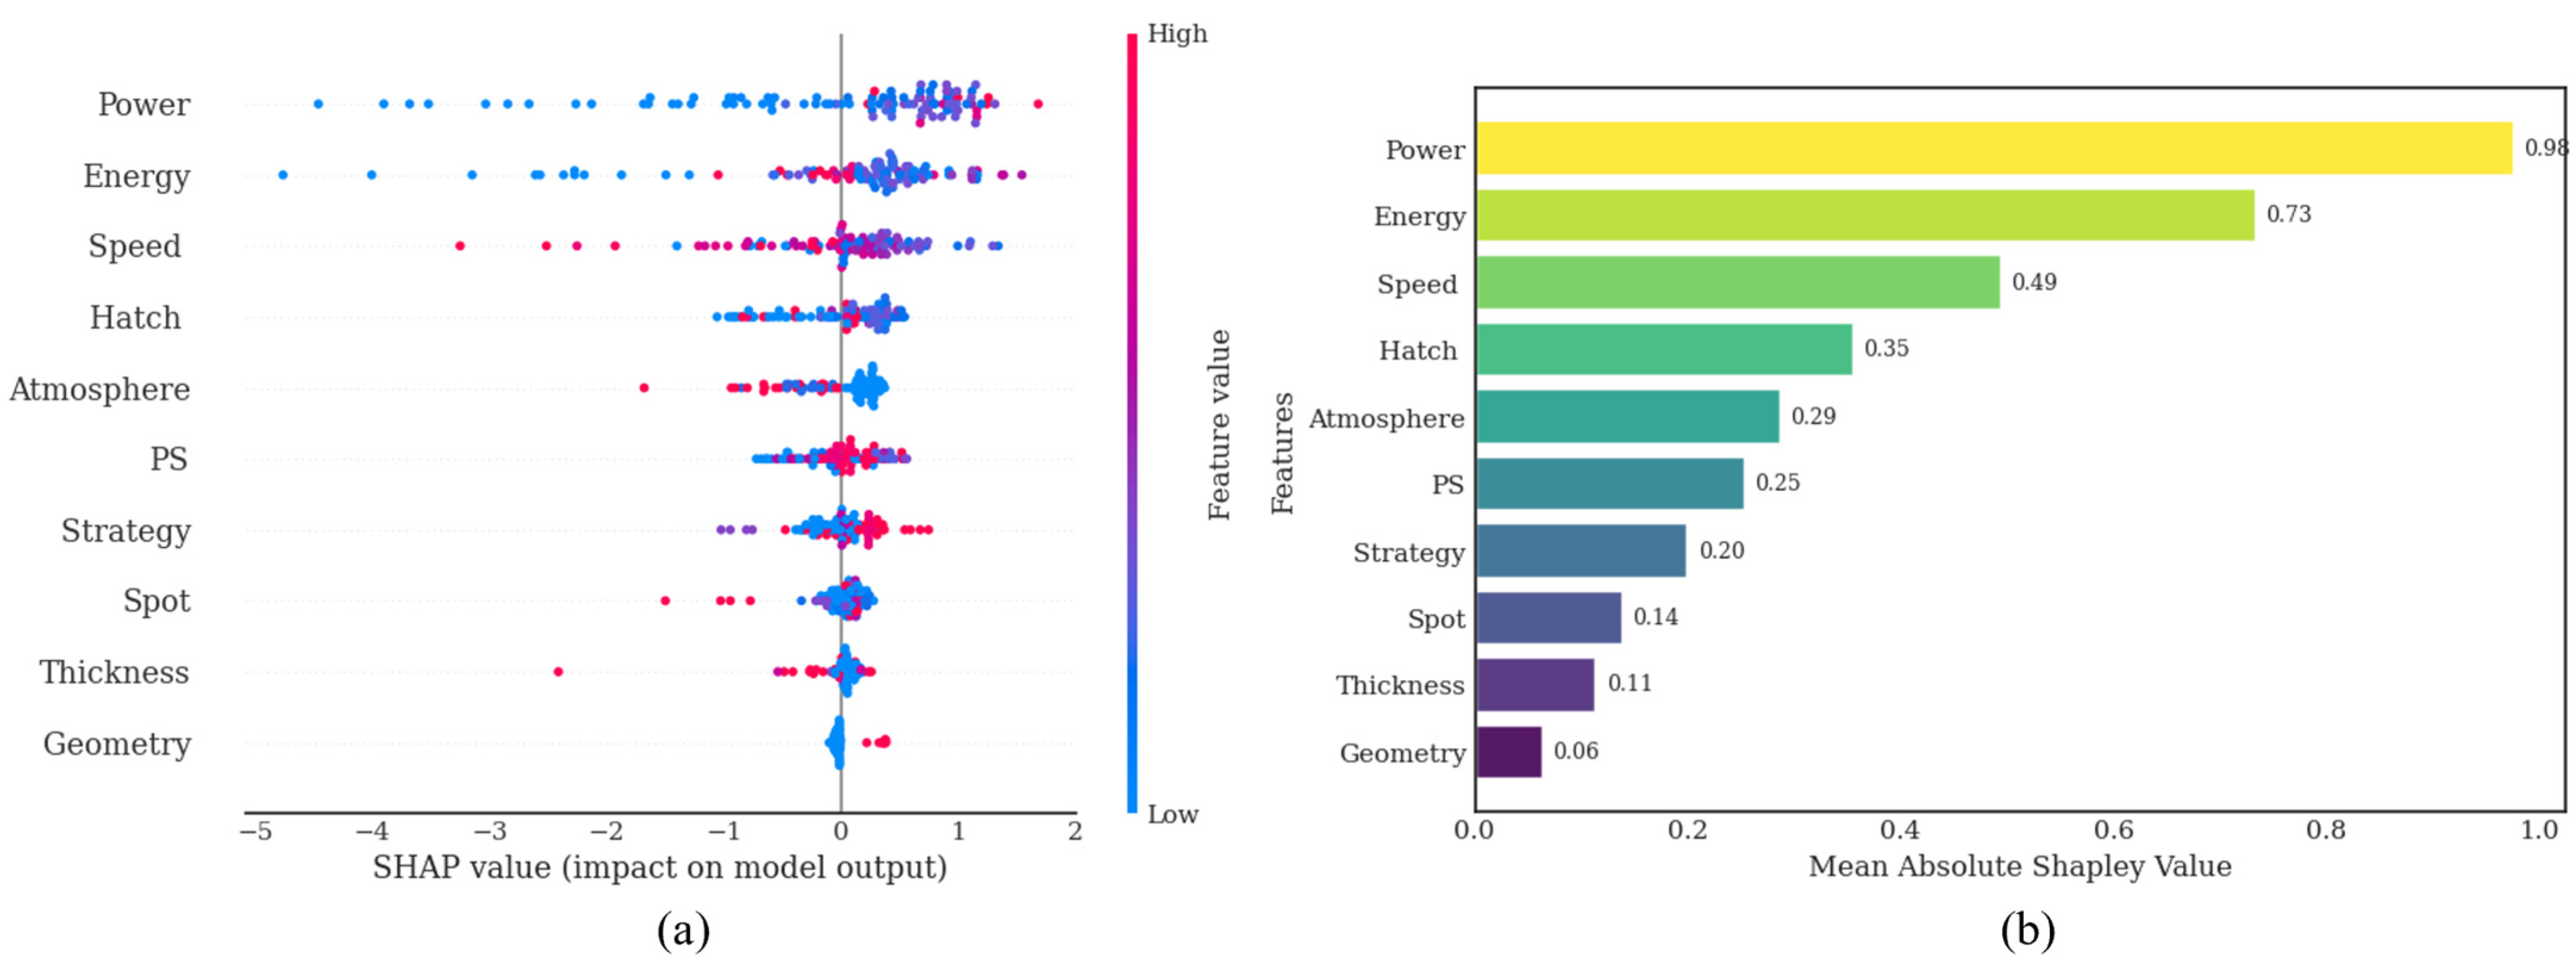
- The results of the SHAP values indicated that laser power and energy density are the parameters that have the greatest impact on the predictability of the relative density of Al-Si10-Mg and SS 316L materials processed by L-PBF. Energy density is proposed as a key estimator for evaluating the relative density of materials processed by L-PBF.
Author Contributions
Funding
Data Availability Statement
Acknowledgments
Conflicts of Interest
References
- Mansoura, A.; Omidi, N.; Barka, N.; Karganroudi, S.S.; Dehghan, S. Selective laser melting of stainless steels: A review of process, microstructure and properties. Met. Mater. Int. 2024, 30, 2343–2371. [Google Scholar] [CrossRef]
- Yan, Q.; Song, B.; Shi, Y. Comparative study of performance comparison of AlSi10Mg alloy prepared by selective laser melting and casting. J. Mater. Sci. Technol. 2020, 41, 199–208. [Google Scholar] [CrossRef]
- La Fe-Perdomo, I.; Ramos-Grez, J.A.; Beruvides, G.; Mujica, R.A. Selective laser melting: Lessons from medical devices industry and other applications. Rapid Prototyp. J. 2021, 27, 1801–1830. [Google Scholar] [CrossRef]
- Gong, G.; Ye, J.; Chi, Y.; Zhao, Z.; Wang, Z.; Xia, G.; Du, X.; Tian, H.; Yu, H.; Chen, C. Research status of laser additive manufacturing for metal: A review. J. Mater. Res. Technol. 2021, 15, 855–884. [Google Scholar] [CrossRef]
- Chowdhury, S.; Yadaiah, N.; Prakash, C.; Ramakrishna, S.; Dixit, S.; Gupta, L.R.; Buddhi, D. Laser powder bed fusion: A state-of-the-art review of the technology, materials, properties & defects, and numerical modelling. J. Mater. Res. Technol. 2022, 20, 2109–2172. [Google Scholar] [CrossRef]
- Ryan, K.R.; Down, M.P.; Banks, C.E. Future of additive manufacturing: Overview of 4D and 3D printed smart and advanced materials and their applications. Chem. Eng. J. 2021, 403, 126162. [Google Scholar] [CrossRef]
- Haghdadi, N.; Laleh, M.; Moyle, M.; Primig, S. Additive manufacturing of steels: A review of achievements and challenges. J. Mater. Sci. 2021, 56, 64–107. [Google Scholar] [CrossRef]
- Yin, Y.; Tan, Q.; Bermingham, M.; Mo, N.; Zhang, J.; Zhang, M.-X. Laser additive manufacturing of steels. Int. Mater. Rev. 2022, 67, 487–573. [Google Scholar] [CrossRef]
- Wei, C.; Li, L. Recent progress and scientific challenges in multi-material additive manufacturing via laser-based powder bed fusion. Virtual Phys. Prototyp. 2021, 16, 347–371. [Google Scholar] [CrossRef]
- Blakey-Milner, B.; Gradl, P.; Snedden, G.; Brooks, M.; Pitot, J.; Lopez, E.; Leary, M.; Berto, F.; du Plessis, A. Metal additive manufacturing in aerospace: A review. Mater. Des. 2021, 209, 110008. [Google Scholar] [CrossRef]
- Ali, M.H.; Sabyrov, N.; Shehab, E. Powder bed fusion—Laser melting (PBF—LM) process: Latest review of materials, process parameter optimization, application, and up-to-date innovative technologies. Prog. Addit. Manuf. 2022, 7, 1395–1422. [Google Scholar] [CrossRef]
- Ramirez-Cedillo, E.; Uddin, M.J.; Sandoval-Robles, J.A.; Mirshams, R.A.; Ruiz-Huerta, L.; Rodriguez, C.A.; Siller, H.R. Process planning of L-PBF of AISI 316L for improving surface quality and relating part integrity with microstructural characteristics. Surf. Coatings Technol. 2020, 396, 125956. [Google Scholar] [CrossRef]
- Liu, B.; Fang, G.; Lei, L.; Yan, X. Predicting the porosity defects in selective laser melting (SLM) by molten pool geometry. Int. J. Mech. Sci. 2022, 228, 107478. [Google Scholar] [CrossRef]
- Wang, S.; Shi, Y.; Cheng, W.; Fan, K.; Wang, Q.; Li, Y.; Li, Q.; Sun, H. Multi-objective optimization of additive manufacturing process parameters of nitinol alloys for elastocaloric cooling. Eng. Appl. Artif. Intell. 2025, 154, 111012. [Google Scholar] [CrossRef]
- Heddar, M.I.E.; Mehdi, B.; Matougui, N.; Tahan, S.A.; Jahazi, M. Adaptable multi-objective optimization framework: Application to metal additive manufacturing. Int. J. Adv. Manuf. Technol. 2024, 132, 1897–1914. [Google Scholar] [CrossRef]
- La Fé-Perdomo, I.; Ramos-Grez, J.A.; Jeria, I.; Guerra, C.; Barrionuevo, G.O. Comparative analysis and experimental validation of statistical and machine learning-based regressors for modeling the surface roughness and mechanical properties of 316L stainless steel specimens produced by selective laser melting. J. Manuf. Process. 2022, 80, 666–682. [Google Scholar] [CrossRef]
- Akbari, P.; Zamani, M.; Mostafaei, A. Machine learning prediction of mechanical properties in metal additive manufacturing. Addit. Manuf. 2024, 91, 104320. [Google Scholar] [CrossRef]
- Barrionuevo, G.O.; Ramos-Grez, J.A.; Walczak, M.; Betancourt, C.A. Comparative evaluation of supervised machine learning algorithms in the prediction of the relative density of 316L stainless steel fabricated by selective laser melting. Int. J. Adv. Manuf. Technol. 2021, 113, 419–433. [Google Scholar] [CrossRef]
- Toprak, C.B.; Dogruer, C.U. Optimal process parameter determination in selective laser melting via machine learning-guided sequential quadratic programing. Proc. Inst. Mech. Eng. Part C J. Mech. Eng. Sci. 2024, 239, 807–820. [Google Scholar] [CrossRef]
- Cao, Y.; Chen, C.; Xu, S.; Zhao, R.; Guo, K.; Hu, T.; Liao, H.; Wang, J.; Ren, Z. Machine learning assisted prediction and optimization of mechanical properties for laser powder bed fusion of Ti6Al4V alloy. Addit. Manuf. 2024, 91, 104341. [Google Scholar] [CrossRef]
- Sharma, S.; Joshi, S.S.; Pantawane, M.V.; Radhakrishnan, M.; Mazumder, S.; Dahotre, N.B. Multiphysics multi-scale computational framework for linking process–structure–property relationships in metal additive manufacturing: A critical review. Int. Mater. Rev. 2023, 68, 943–1009. [Google Scholar] [CrossRef]
- Kats, D.; Wang, Z.; Gan, Z.; Liu, W.K.; Wagner, G.J.; Lian, Y. A physics-informed machine learning method for predicting grain structure characteristics in directed energy deposition. Comput. Mater. Sci. 2022, 202, 110958. [Google Scholar] [CrossRef]
- Rane, N.L.; Paramesha, M.; Rane, J.; Kaya, O. Emerging trends and future research opportunities in artificial intelligence, machine learning, and deep learning. Artif. Intell. Ind. Soc. 2024, 5, 2–96. [Google Scholar]
- Rane, N.L.; Mallick, S.K.; Kaya, O.; Rane, J. Tools and frameworks for machine learning and deep learning: A review. In Applied Machine Learning and Deep Learning: Architectures and Techniques; Deep Science Publishing: San Francisco, CA, USA, 2024; pp. 80–95. [Google Scholar]
- Yasmin, A.; Butt, W.H.; Daud, A. Ensemble effort estimation with metaheuristic hyperparameters and weight optimization for achieving accuracy. PLoS ONE 2024, 19, e0300296. [Google Scholar] [CrossRef]
- Rokach, O.S.L. Ensemble learning: A survey. Wiley Interdiscip. Rev. Data Min. Knowl. Discov. 2018, 8, e1249. [Google Scholar] [CrossRef]
- Patil, D.; Rane, N.L.; Desai, P.; Rane, J. Machine learning and deep learning: Methods, techniques, applications, challenges, and future research opportunities. In Trustworthy Artificial Intelligence in Industry and Society; Deep Science Publishing: San Francisco, CA, USA, 2024; pp. 28–81. [Google Scholar]
- Pandala, S.R. Lazy Predict. PyPI. 2020. Available online: https://pypi.org/project/lazypredict (accessed on 14 April 2025).
- Tan, Z.; Pang, B.; Oliveira, J.; Chen, L.; Bu, X.; Wang, Z.; Cong, B.; Zeng, Z. Effect of S-curve laser power for power distribution control on laser oscillating welding of 5A06 aluminum alloy. Opt. Laser Technol. 2022, 149, 107909. [Google Scholar] [CrossRef]
- Chen, W.; Yin, G.; Feng, Z.; Liao, X. Effect of powder feedstock on microstructure and mechanical properties of the 316L stainless steel fabricated by selective laser melting. Metals 2018, 8, 729. [Google Scholar] [CrossRef]
- Di, Y.Y.; Liu, W.Y.; Xiao, D. Theoretical and experimental study on surface roughness of 316L stainless steel metal parts obtained through selective laser melting. Rapid Prototyp. J. 2016, 22, 706–716. [Google Scholar] [CrossRef]
- Deng, Y.; Mao, Z.; Yang, N.; Niu, X.; Lu, X. Collaborative optimization of density and surface roughness of 316L stainless steel in selective laser melting. Materials 2020, 13, 1601. [Google Scholar] [CrossRef]
- Röttger, A.; Geenen, K.; Windmann, M.; Binner, F.; Theisen, W. Comparison of microstructure and mechanical properties of 316L austenitic steel processed by selective laser melting with hot-isostatic pressed and cast material. Mater. Sci. Eng. A 2016, 678, 365–376. [Google Scholar] [CrossRef]
- Cacace, S.; Pagani, L.; Colosimo, B.M.; Semeraro, Q. The effect of energy density and porosity structure on tensile properties of 316L stainless steel produced by laser powder bed fusion. Prog. Addit. Manuf. 2022, 7, 1053–1070. [Google Scholar] [CrossRef]
- Larimian, T.; Kannan, M.; Grzesiak, D.; AlMangour, B.; Borkar, T. Effect of energy density and scanning strategy on densification, microstructure and mechanical properties of 316L stainless steel processed via selective laser melting. Mater. Sci. Eng. A 2020, 770, 138455. [Google Scholar] [CrossRef]
- Heiden, M.J.; Jensen, S.C.; Koepke, J.R.; Saiz, D.J.; Dickens, S.M.; Jared, B.H. Process and feedstock driven microstructure for laser powder bed fusion of 316L stainless steel. Materialia 2022, 21, 101356. [Google Scholar] [CrossRef]
- Vallejo, N.D.; Lucas, C.; Ayers, N.; Graydon, K.; Hyer, H.; Sohn, Y. Process Optimization and Microstructure Analysis to Understand Laser Powder Bed Fusion of 316L Stainless Steel. Metals 2021, 11, 832. [Google Scholar] [CrossRef]
- Huang, M.; Zhang, Z.; Chen, P. Effect of selective laser melting process parameters on microstructure and mechanical properties of 316L stainless steel helical micro-diameter spring. Int. J. Adv. Manuf. Technol. 2019, 2154, 2117–2131. [Google Scholar] [CrossRef]
- Sun, Y.; Moroz, A.; Alrbaey, K. Sliding Wear Characteristics and Corrosion Behaviour of Selective Laser Melted 316L Stainless Steel. J. Mater. Eng. Perform. 2014, 23, 518–526. [Google Scholar] [CrossRef]
- Lin, K.; Gu, D.; Xi, L.; Yuan, L.; Niu, S.; Lv, P.; Ge, Q. Selective laser melting processing of 316L stainless steel: Effect of microstructural differences along building direction on corrosion behavior. Int. J. Adv. Manuf. Technol. 2019, 104, 2669–2679. [Google Scholar] [CrossRef]
- Sun, J.; Shen, L.; Wang, W.; Liu, Z.; Chen, H.; Duan, J. Study of Microstructure and Properties of 316L with Selective Laser Melting Based on Multivariate Interaction Influence. Adv. Mater. Sci. Eng. 2020, 2020, 1–15. [Google Scholar] [CrossRef]
- Salman, O.; Brenne, F.; Niendorf, T.; Eckert, J.; Prashanth, K.; He, T.; Scudino, S. Impact of the scanning strategy on the mechanical behavior of 316L steel synthesized by selective laser melting. J. Manuf. Process. 2019, 45, 255–261. [Google Scholar] [CrossRef]
- Zhang, Z.; Chu, B.; Wang, L.; Lu, Z. Comprehensive effects of placement orientation and scanning angle on mechanical properties and behavior of 316L stainless steel based on the selective laser melting process. J. Alloys Compd. 2019, 791, 166–175. [Google Scholar] [CrossRef]
- Parikh, Y.; Kuttolamadom, M. Property-Graded Stainless Steel 316L by Selective Laser Melting: Characterization & Design. J. Manuf. Sci. Eng. 2023, 145, 061008. [Google Scholar] [CrossRef]
- Barrionuevo, G.O.; Ramos-Grez, J.A.; Sánchez-Sánchez, X.; Zapata-Hidalgo, D.; Mullo, J.L.; Puma-Araujo, S.D. Influence of the Processing Parameters on the Microstructure and Mechanical Properties of 316L Stainless Steel Fabricated by Laser Powder Bed Fusion. J. Manuf. Mater. Process. 2024, 8, 35. [Google Scholar] [CrossRef]
- Barrionuevo, G.O.; La Fé-Perdomo, L.; Ramos-Grez, J.A.; Walczak, M.; Mendez, P.F. Microstructural differences and mechanical performance of stainless steel 316L conventionally processed versus a selective laser melted. Prog. Addit. Manuf. 2025, 10, 2663–2673. [Google Scholar] [CrossRef]
- Liverani, E.; Lutey, A.H.A.; Ascari, A.; Fortunato, A. The effects of hot isostatic pressing (HIP) and solubilization heat treatment on the density, mechanical properties, and microstructure of austenitic stainless steel parts produced by selective laser melting (SLM). Int. J. Adv. Manuf. Technol. 2020, 107, 109–122. [Google Scholar] [CrossRef]
- Teng, X.; Zhang, G.; Liang, J.; Li, H.; Liu, Q.; Cui, Y.; Cui, T.; Jiang, L. Parameter optimization and microhardness experiment of AlSi10Mg alloy prepared by selective laser melting. Mater. Res. Express 2019, 6, 086592. [Google Scholar] [CrossRef]
- Read, N.; Wang, W.; Essa, K.; Attallah, M.M. Selective laser melting of AlSi10Mg alloy: Process optimisation and mechanical properties development. Mater. Des. 2015, 65, 417–424. [Google Scholar] [CrossRef]
- Chua, C.K.; Tian, X.; Yu, W.; Sing, S.L. Effects of re-melting strategies on densification behavior and mechanical properties of selective laser melted AlSi10Mg parts. In Proceedings of the 3rd International Conference on Progress in Additive Manufacturing (Pro-AM 2018), Singapore, 14–17 May 2018. [Google Scholar] [CrossRef]
- Hirata, T.; Kimura, T.; Nakamoto, T. Effects of hot isostatic pressing and internal porosity on the performance of selective laser melted AlSi10Mg alloys. Mater. Sci. Eng. A 2020, 772, 138713. [Google Scholar] [CrossRef]
- Liu, B.; Li, B.-Q.; Li, Z. Selective laser remelting of an additive layer manufacturing process on AlSi10Mg. Results Phys. 2019, 12, 982–988. [Google Scholar] [CrossRef]
- Amir, B.; Gale, Y.; Sadot, A.; Samuha, S.; Sadot, O. Study on the effects of manufacturing parameters on the dynamic properties of AlSi10Mg under dynamic loads using Taguchi procedure. Mater. Des. 2022, 223, 111125. [Google Scholar] [CrossRef]
- Wischeropp, T.M.; Tarhini, H.; Emmelmann, C. Influence of laser beam profile on the selective laser melting process of AlSi10Mg. J. Laser Appl. 2020, 32, 022059. [Google Scholar] [CrossRef]
- Chen, Z.; Wei, Z.; Wei, P.; Chen, S.; Lu, B.; Du, J.; Li, J.; Zhang, S. Experimental Research on Selective Laser Melting AlSi10Mg Alloys: Process, Densification and Performance. J. Mater. Eng. Perform. 2017, 26, 5897–5905. [Google Scholar] [CrossRef]
- Majeed, A.; Zhang, Y.; Lv, J.; Peng, T.; Atta, Z.; Ahmed, A. Investigation of T4 and T6 heat treatment influences on relative density and porosity of AlSi10Mg alloy components manufactured by SLM. Comput. Ind. Eng. 2020, 139, 106194. [Google Scholar] [CrossRef]
- Bai, S.; Perevoshchikova, N.; Sha, Y.; Wu, X. The Effects of Selective Laser Melting Process Parameters on Relative Density of the AlSi10Mg Parts and Suitable Procedures of the Archimedes Method. Appl. Sci. 2019, 9, 583. [Google Scholar] [CrossRef]
- Praneeth, J.; Venkatesh, S.; Krishna, L.S. Process parameters influence on mechanical properties of AlSi10Mg by SLM. Mater. Today Proc. 2023; in press. [Google Scholar] [CrossRef]
- Zhou, H.; Song, C.; Yang, Y.; Wang, D.; Liu, Z.; Xiao, Y.; Wang, M.; Yu, J.; Huang, K.; Deng, Z.; et al. Effect of axial static magnetic field on microstructure evolution, performance, and melt pool signals of AlSi10Mg fabricated by laser powder bed fusion. Opt. Laser Technol. 2023, 163, 109316. [Google Scholar] [CrossRef]
- Kempen, K.; Thijs, L.; Van Humbeeck, J.; Kruth, J.P. Processing AlSi10Mg by selective laser melting: Parameter optimisation and material characterisation. Mater. Sci. Technol. 2015, 31, 917–923. [Google Scholar] [CrossRef]
- Hyer, H.; Zhou, L.; Park, S.; Gottsfritz, G.; Benson, G.; Tolentino, B.; McWilliams, B.; Cho, K.; Sohn, Y. Understanding the Laser Powder Bed Fusion of AlSi10Mg Alloy. Metallogr. Microstruct. Anal. 2020, 9, 484–502. [Google Scholar] [CrossRef]
- Pan, W.; Ye, Z.; Zhang, Y.; Liu, Y.; Liang, B.; Zhai, Z. Research on Microstructure and Properties of AlSi10Mg Fabricated by Selective Laser Melting. Materials 2022, 15, 2528. [Google Scholar] [CrossRef]
- Wang, L.; Sun, J.; Yu, X.; Shi, Y.; Zhu, X.; Cheng, L.; Liang, H.; Yan, B.; Guo, L. Enhancement in mechanical properties of selectively laser-melted AlSi10Mg aluminum alloys by T6-like heat treatment. Mater. Sci. Eng. A 2018, 734, 299–310. [Google Scholar] [CrossRef]
- Aboulkhair, N.T.; Everitt, N.M.; Ashcroft, I.; Tuck, C. Reducing porosity in AlSi10Mg parts processed by selective laser melting. Addit. Manuf. 2014, 1–4, 77–86. [Google Scholar] [CrossRef]
- Varoquaux, G.; Buitinck, L.; Louppe, G.; Grisel, O.; Pedregosa, F.; Mueller, A. Scikit-learn: Machine Learning in Python. J. Mach. Learn. Res. 2011, 19, 29–33. [Google Scholar] [CrossRef]
- Chen, T.; Guestrin, C. XGBoost: A scalable tree boosting system. In Proceedings of the 22nd ACM SIGKDD International Conference on Knowledge Discovery and Data Mining, San Francisco, CA, USA, 13–17 August 2016; pp. 785–794. [Google Scholar] [CrossRef]
- Lundberg, S.M.; Lee, S.I. A unified approach to interpreting model predictions. In Proceedings of the 31st Conference on Neural Information Processing Systems (NIPS 2017), Long Beach, CA, USA, 4–9 December 2017; pp. 4766–4775. [Google Scholar]
- Paszke, A.; Gross, S.; Massa, F.; Lerer, A.; Bradbury, J.; Chanan, G.; Killeen, T.; Lin, Z.; Gimelshein, N.; Antiga, L.; et al. PyTorch: An imperative style, high-performance deep learning library. In Proceedings of the 33rd International Conference on Neural Information Processing Systems, Vancouver, BC, Canada, 8–14 December 2019; pp. 8026–8037. [Google Scholar]
- Mathew, J.; Griffin, J.; Alamaniotis, M.; Kanarachos, S.; Fitzpatrick, M.E. Prediction of welding residual stresses using machine learning: Comparison between neural networks and neuro-fuzzy systems. Appl. Soft Comput. J. 2018, 70, 131–146. [Google Scholar] [CrossRef]
- Barrionuevo, G.O.; Ramos-Grez, J.; Walczak, M.; La Fé-Perdomo, I. Numerical analysis of the effect of processing parameters on the microstructure of stainless steel 316L manufactured by laser-based powder bed fusion. Mater. Today Proc. 2021, 59, 93–100. [Google Scholar] [CrossRef]
- Barrionuevo, G.O.; La Fé-Perdomo, I.; Ramos-Grez, J.A. Laser powder bed fusion dataset for relative density prediction of commercial metallic alloys. Sci. Data 2025, 12, 375. [Google Scholar] [CrossRef] [PubMed]


| Material | Elements (wt%) | |||||||
|---|---|---|---|---|---|---|---|---|
| SS 316L | Fe | Cr | Ni | Mo | Mn | Si | P | S |
| Bal. | 16.5–18 | 10–13 | 0.22 | 0–2 | 0–1 | <0.045 | <0.03 | |
| Al-Si10-Mg | Al | Si | Mg | Cu | Ni | Fe | Mn | Ti |
| Bal. | 10 | 0.4 | 0.25 | 0.05 | 0.25 | 0.1 | 0.15 | |
| Material | P (W) | v (mm/s) | l (µm) | h (µm) | References |
|---|---|---|---|---|---|
| SS 316L | 70–350 | 50–3000 | 20–400 | 20–150 | [12,14,16,28,29,30,31,32,33,34,35,36,37,38,39,40,41,42,43,44,45] |
| Al-Si10-Mg | 100–700 | 100–8000 | 20–90 | 30–400 | [2,46,47,48,49,50,51,52,53,54,55,56,57,58,59,60,61,62,63,64] |
| Model | Adjusted R2 | R2 | RMSE | Time Taken [s] |
|---|---|---|---|---|
| ExtraTreesRegressor | 0.83 | 0.85 | 1.29 | 0.12 |
| KNeighborsRegressor | 0.82 | 0.84 | 1.33 | 0.01 |
| ExtraTreeRegressor | 0.74 | 0.78 | 1.58 | 0.01 |
| BaggingRegressor | 0.72 | 0.76 | 1.65 | 0.03 |
| RandomForestRegressor | 0.72 | 0.76 | 1.65 | 0.21 |
| Model | Adjusted R2 | R2 | RMSE | Time Taken [s] |
|---|---|---|---|---|
| BaggingRegressor | 0.84 | 0.86 | 1.39 | 0.03 |
| GradientBoostingRegressor | 0.80 | 0.83 | 1.53 | 0.17 |
| RandomForestRegressor | 0.80 | 0.83 | 1.55 | 0.28 |
| ExtraTreesRegressor | 0.78 | 0.81 | 1.63 | 0.11 |
| LGBMRegressor | 0.74 | 0.78 | 1.75 | 0.11 |
Disclaimer/Publisher’s Note: The statements, opinions and data contained in all publications are solely those of the individual author(s) and contributor(s) and not of MDPI and/or the editor(s). MDPI and/or the editor(s) disclaim responsibility for any injury to people or property resulting from any ideas, methods, instructions or products referred to in the content. |
© 2025 by the authors. Licensee MDPI, Basel, Switzerland. This article is an open access article distributed under the terms and conditions of the Creative Commons Attribution (CC BY) license (https://creativecommons.org/licenses/by/4.0/).
Share and Cite
Mullo, J.L.; La Fé-Perdomo, I.; Ramos-Grez, J.; Moreira Romero, Á.F.; Ramírez-Albán, A.; Yarad-Jácome, M.; Barrionuevo, G.O. Predicting the Relative Density of Stainless Steel and Aluminum Alloys Manufactured by L-PBF Using Machine Learning. J. Manuf. Mater. Process. 2025, 9, 185. https://doi.org/10.3390/jmmp9060185
Mullo JL, La Fé-Perdomo I, Ramos-Grez J, Moreira Romero ÁF, Ramírez-Albán A, Yarad-Jácome M, Barrionuevo GO. Predicting the Relative Density of Stainless Steel and Aluminum Alloys Manufactured by L-PBF Using Machine Learning. Journal of Manufacturing and Materials Processing. 2025; 9(6):185. https://doi.org/10.3390/jmmp9060185
Chicago/Turabian StyleMullo, José Luis, Iván La Fé-Perdomo, Jorge Ramos-Grez, Ángel F. Moreira Romero, Alejandra Ramírez-Albán, Mélany Yarad-Jácome, and Germán Omar Barrionuevo. 2025. "Predicting the Relative Density of Stainless Steel and Aluminum Alloys Manufactured by L-PBF Using Machine Learning" Journal of Manufacturing and Materials Processing 9, no. 6: 185. https://doi.org/10.3390/jmmp9060185
APA StyleMullo, J. L., La Fé-Perdomo, I., Ramos-Grez, J., Moreira Romero, Á. F., Ramírez-Albán, A., Yarad-Jácome, M., & Barrionuevo, G. O. (2025). Predicting the Relative Density of Stainless Steel and Aluminum Alloys Manufactured by L-PBF Using Machine Learning. Journal of Manufacturing and Materials Processing, 9(6), 185. https://doi.org/10.3390/jmmp9060185