Article

The Influence of Extrusion Geometry and Ratio on Extrudate Mechanical Properties for a 6005A Alloy Containing Either Sc and Zr or Cr and Mn Dispersoid Formers

1
Department of Materials Science and Engineering, Michigan Technological University, Houghton, MI 49931, USA
2
Sunrise Energy Metals, 10 Queen Street, Melbourne, VIC 3000, Australia
*
Author to whom correspondence should be addressed.
J. Manuf. Mater. Process. 2025, 9(5), 168; https://doi.org/10.3390/jmmp9050168
Submission received: 14 April 2025 / Revised: 12 May 2025 / Accepted: 20 May 2025 / Published: 21 May 2025

Abstract

There is a demand for a 6005A series extrusion alloy with improved strength that maintains good extrudability. Replacing Mn and Cr dispersoid formers with Sc and Zr is expected to increase the room temperature mechanical properties while not affecting extrudability. Al3X dispersoids with a Sc core surrounded by a Zr shell are stable at higher temperatures and enhance recrystallization resistance and precipitation strengthening. However, there is little information on how the Sc and Zr additions affect the properties of an extrudate as a function of extrusion geometry and ratio. A 6005A series alloy with Cr and Mn additions is compared to an alloy with Sc and Zr additions with rod and flat cross-sections at extrusion ratios of 25 and 92. The results show that Sc and Zr additions increased yield strength and ultimate tensile strength while maintaining ductility compared to Cr and Mn additions. Rod shapes performed significantly better than flat shapes, but there was no significant effect of extrusion ratio.

1. Introduction

In automotive manufacturing, 6xxx series aluminum extrusions are used for structural components given their high extrusion speeds, high specific strength, and good impact performance [1]. These properties are due to the combination of finely dispersed β″-Mg5Si6 precipitates and a fine fibrous microstructure [2]. The 6xxx series alloys are typically modified with Mn and Cr to form dispersoids, which can maintain a fibrous texture and limit peripheral coarse grain (PCG) layer formation [3]. However, Mn and Cr additions negatively impact the hot deformation performance, reducing extrusion speed [4]. Considering these factors, alloys target a low dispersoid concentration to minimize the impact on extrudability while minimizing PCG thickness. There is significant interest in developing a 6005A extrusion alloy that maintains extrudability with reduced PCG thickness and improved mechanical and impact performance.
Developing new alloys for extrusion is difficult given the complex hot-deformation process that influences the texture and PCG structure, which, in turn, affects the mechanical properties [5]. The texture formed during extrusion depends on several factors, such as the die design, alloy, and extrusion conditions [6,7]. Die geometries vary depending on the extrusion profile, but, in general, profiles are combinations of round and rectangular shapes [8]. For rectangles, the primary deformation at the center is plane strain, while, at the surface, the material experiences simple shear. In contrast, a rod will have primarily axisymmetric stretching at the center and simple shear at the edge [9]. The deformation mode influences texture development and PCG layer growth due to material flow and strain distribution [10,11]. Considering these effects, evaluation of a new dispersoid type should assess the effects of die geometry and extrusion ratio.
To improve the recrystallization resistance without impacting the extrusion performance of a 6005A alloy, new dispersoid forming elements will be assessed vs. the baseline with Mn and Cr. Recent research into the additions of Sc and Zr to 7xxx series alloys showed that low concentrations (0.02–0.05 wt%) can significantly reduce the PCG thickness [12]. For the 6xxx series alloys, Babaniaris et al. showed that the flow stress of Sc- and Zr-containing alloys was comparable to the flow stress of alloys with similar concentrations of Mn and Cr [13]. Babaniaris et al. also showed that, through a multi-step heat treatment, an Al3Sc-Zr core–shell structure could be produced that improves the dispersoids’ resistance to coarsening, making them stable at a high temperature [14]. Therefore, additions of Sc and Zr may enhance recrystallization resistance without impacting extrudability. Currently, the benefits of Sc and Zr additions are not evident in 6xxx series alloys due to the dispersoids’ complex precipitation sequence and deleterious v-phase formation [15,16]. However, adding another stage to the multi-stage heat treatment was found to produce an Al3Sc-Zr core–shell precipitate in the 6xxx series alloys while also minimizing v-phase formation [17].
An alloy with improved recrystallization resistance would be beneficial to extrusion companies. Control of the microstructure by modifying texture and PCG thickness has been shown to improve the mechanical properties and bend performance of extrusion alloys [18,19]. Some of the methods for controlling the microstructure in extrusions are by varying the dispersoid concentration, extrusion speed, and temperature [20]. Therefore, when optimizing the extrusion process, the extrusion speed and temperature must be limited to maintain the desired microstructure. Using Sc and Zr as new dispersoid additions could make it viable to extrude at faster speeds while maintaining similar microstructure and mechanical properties. This is because of the enhanced recrystallization provided by the Al3Sc-Zr dispersoids, which formed upon two-step homogenization [12].
To further understand the effect of Sc and Zr additions to a 6005A alloy, a multi-stage heat treatment will be used to produce dispersoids in the as-cast billet prior to extrusion. The effects of the dispersoids will be characterized by a design of experiment using two extrusion profiles and two extrusion ratios. The two geometries will be a round and a flat sheet. The two extrusion ratios (ER) will be around 25 and 92, which will allow the analysis of three types of deformation: axisymmetric stretching, plane strain deformation, and simple shear deformation. Mechanical properties will be measured in the peak-aged condition, and the microstructure will be assessed to determine extruded texture and PCG thickness.

2. Methods

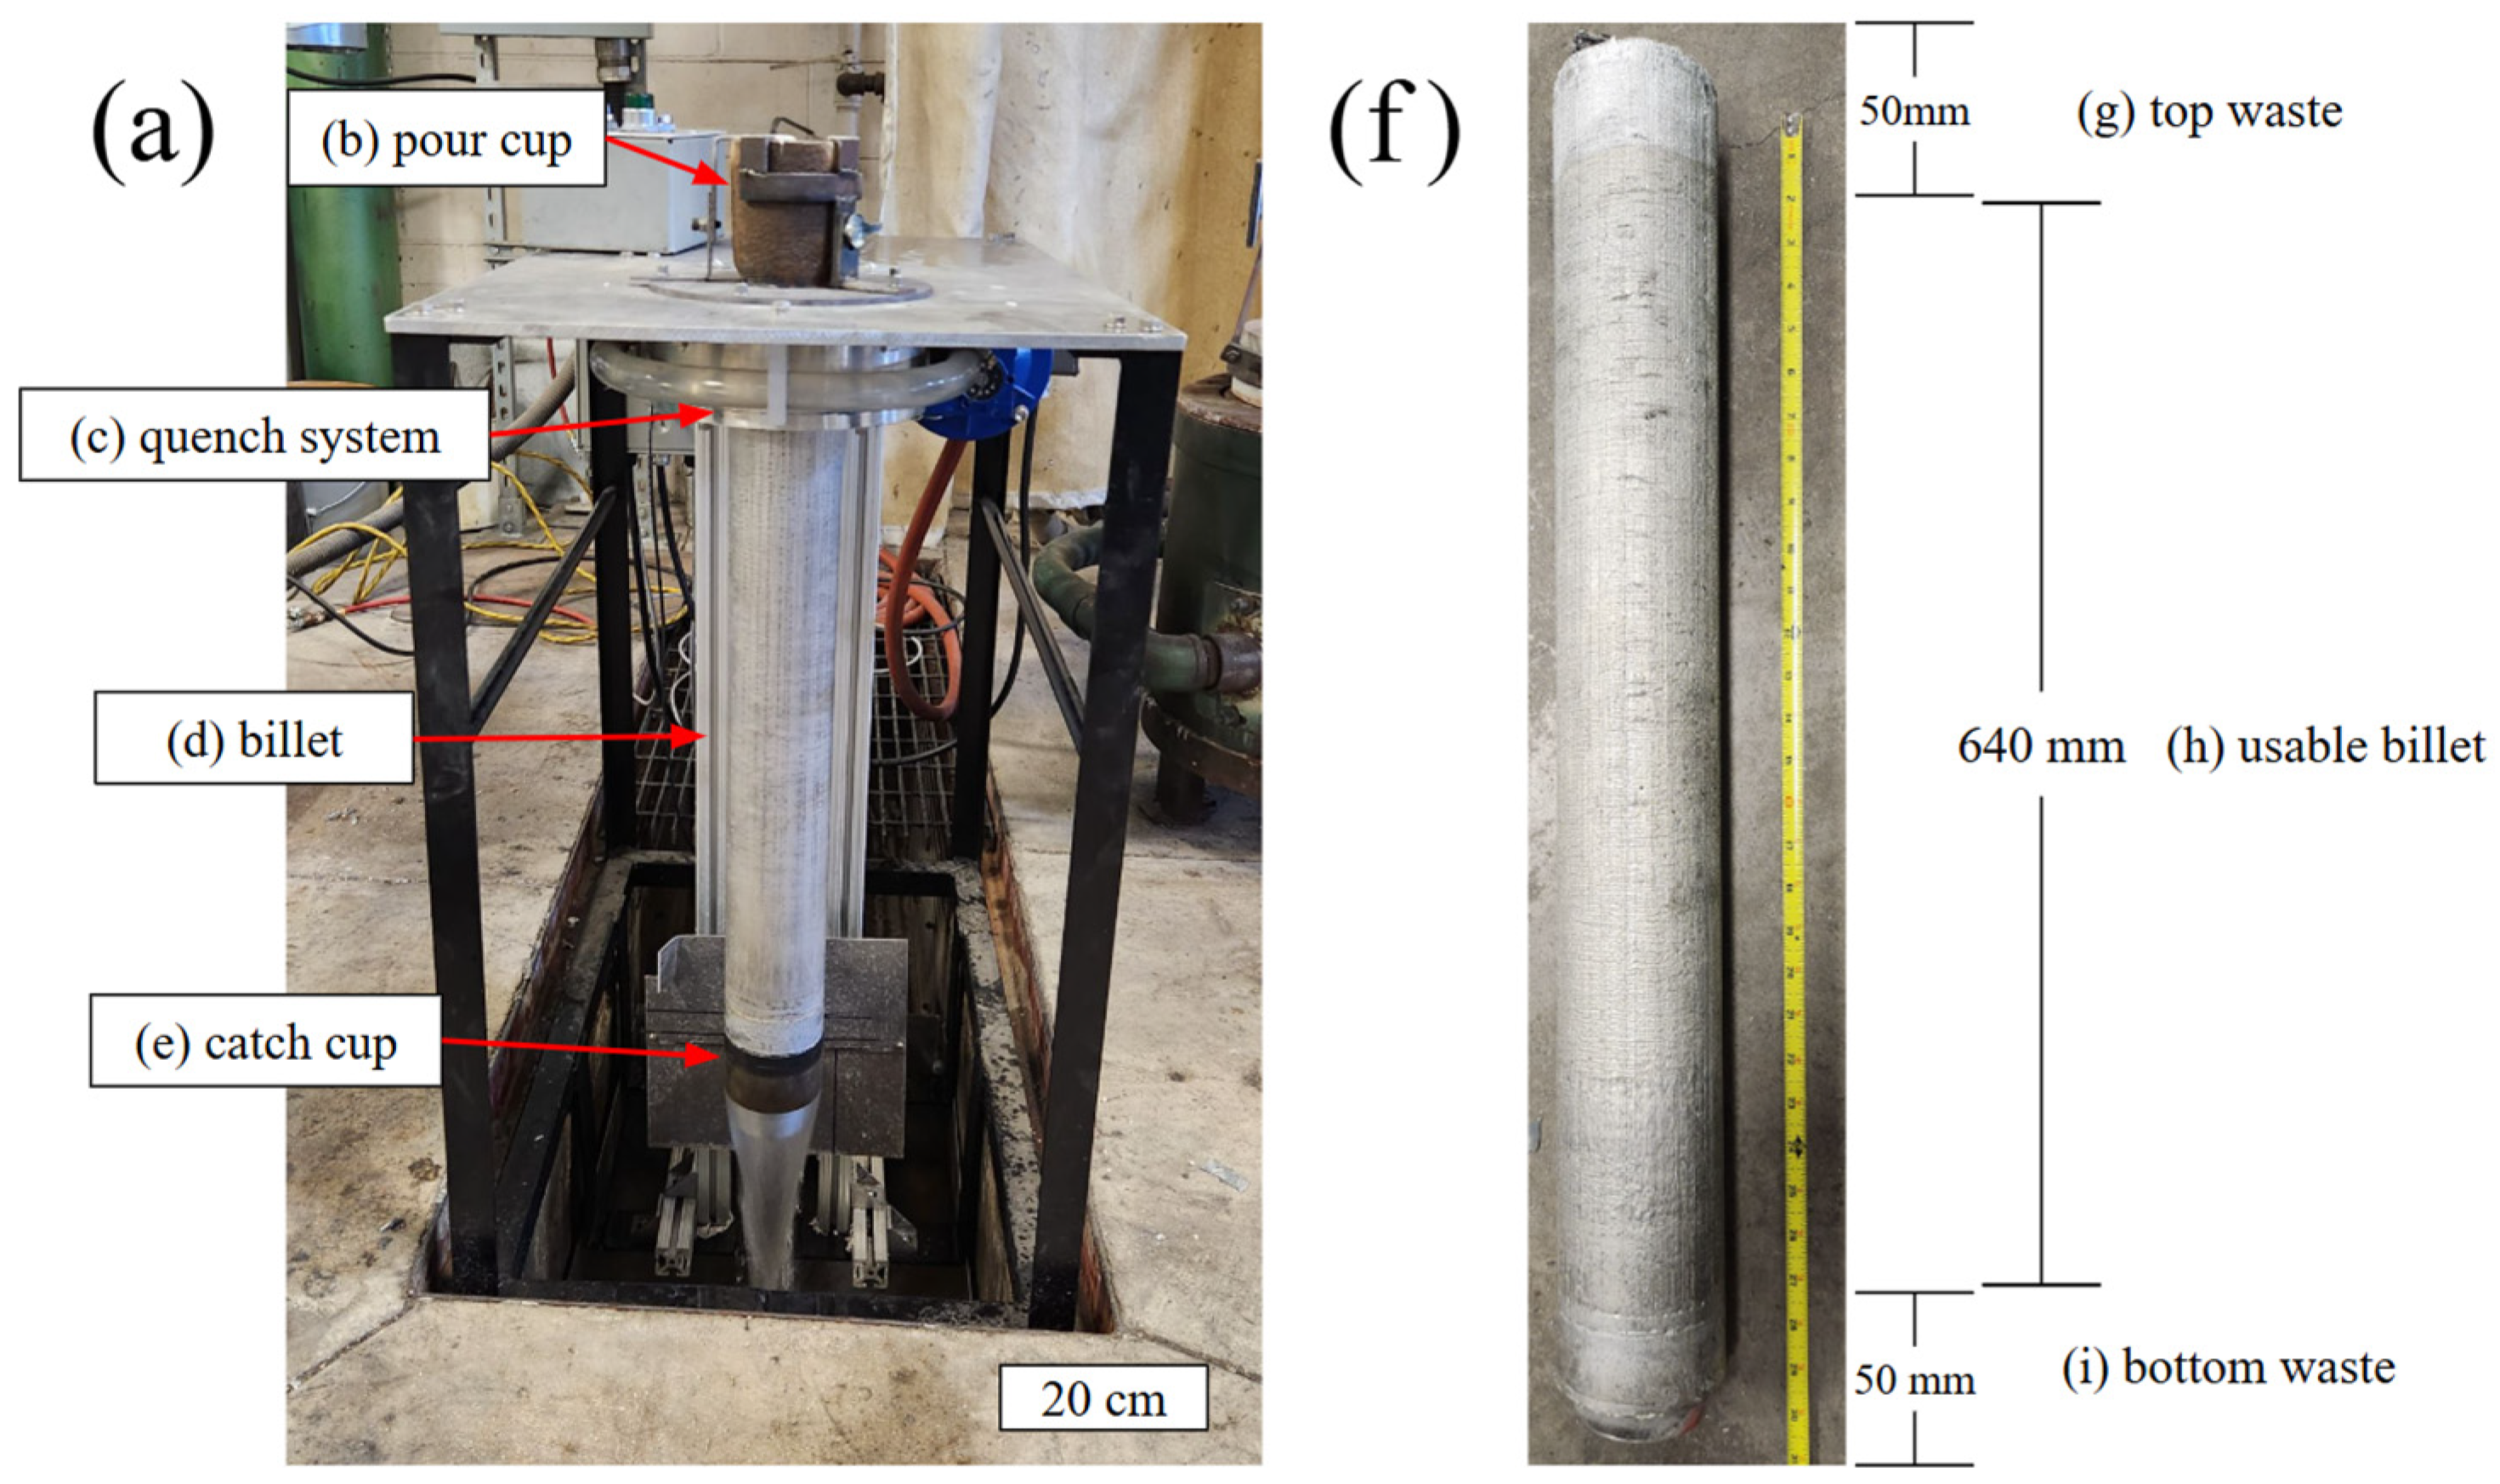
2.1. Casting and Homogenization

Ingot materials were melted at Michigan Technological University in a McElvan resistance furnace using a graphite crucible charged with high-purity Al (99.9%) and Mg (99.9%) with master alloys of Al-20 wt% Cu, Al-25 wt% Mn, Al-36 wt% Si, Al-30 wt% Fe, Al-5 wt% Cr, Al-5 wt% Zr, and Al-2 wt% Sc. Before casting, the melt was degassed with argon for fifteen minutes after adding a TiB rod, Al-5 wt% Ti and 1 wt% B, used for grain refinement. Casting was performed at a superheat of 100 °C above the equilibrium liquidus using a direct chill (DC)-casting system with a graphite slip ring that produced an ingot 90 mm in diameter at a rate of 100 mm/min to a final length of 740 mm (Figure 1). The DC-casting quench system had water nozzles directed at the ingot with a water temperature of 25 °C and a flow rate of 30 L/min. The target compositions had similar Mg and Si compositions as the 6005A alloy system (Table 1) [21]. Four extrusion billets were cut from the ingot, each having a nominal length of 140 mm. Chemical analysis of the cast material was performed with a Bruker Q4 Tasman optical emission spectrometer with two type standards: 6061 and a Sc- and Zr-containing low Mg and Si alloy. Four measurements per alloy were averaged, and the 95% standard deviation of the mean was reported (Table 1).
After casting, the 6005A alloy billets were homogenized using a standard treatment of 520 °C for 8 h. The 6005+ alloy billets were homogen-aged [17], which is a seven-step process starting with aging at 190 °C for 12 h, followed by aging at 300 °C for 10 h, and aging at 400 °C for 10 h (Figure 2).

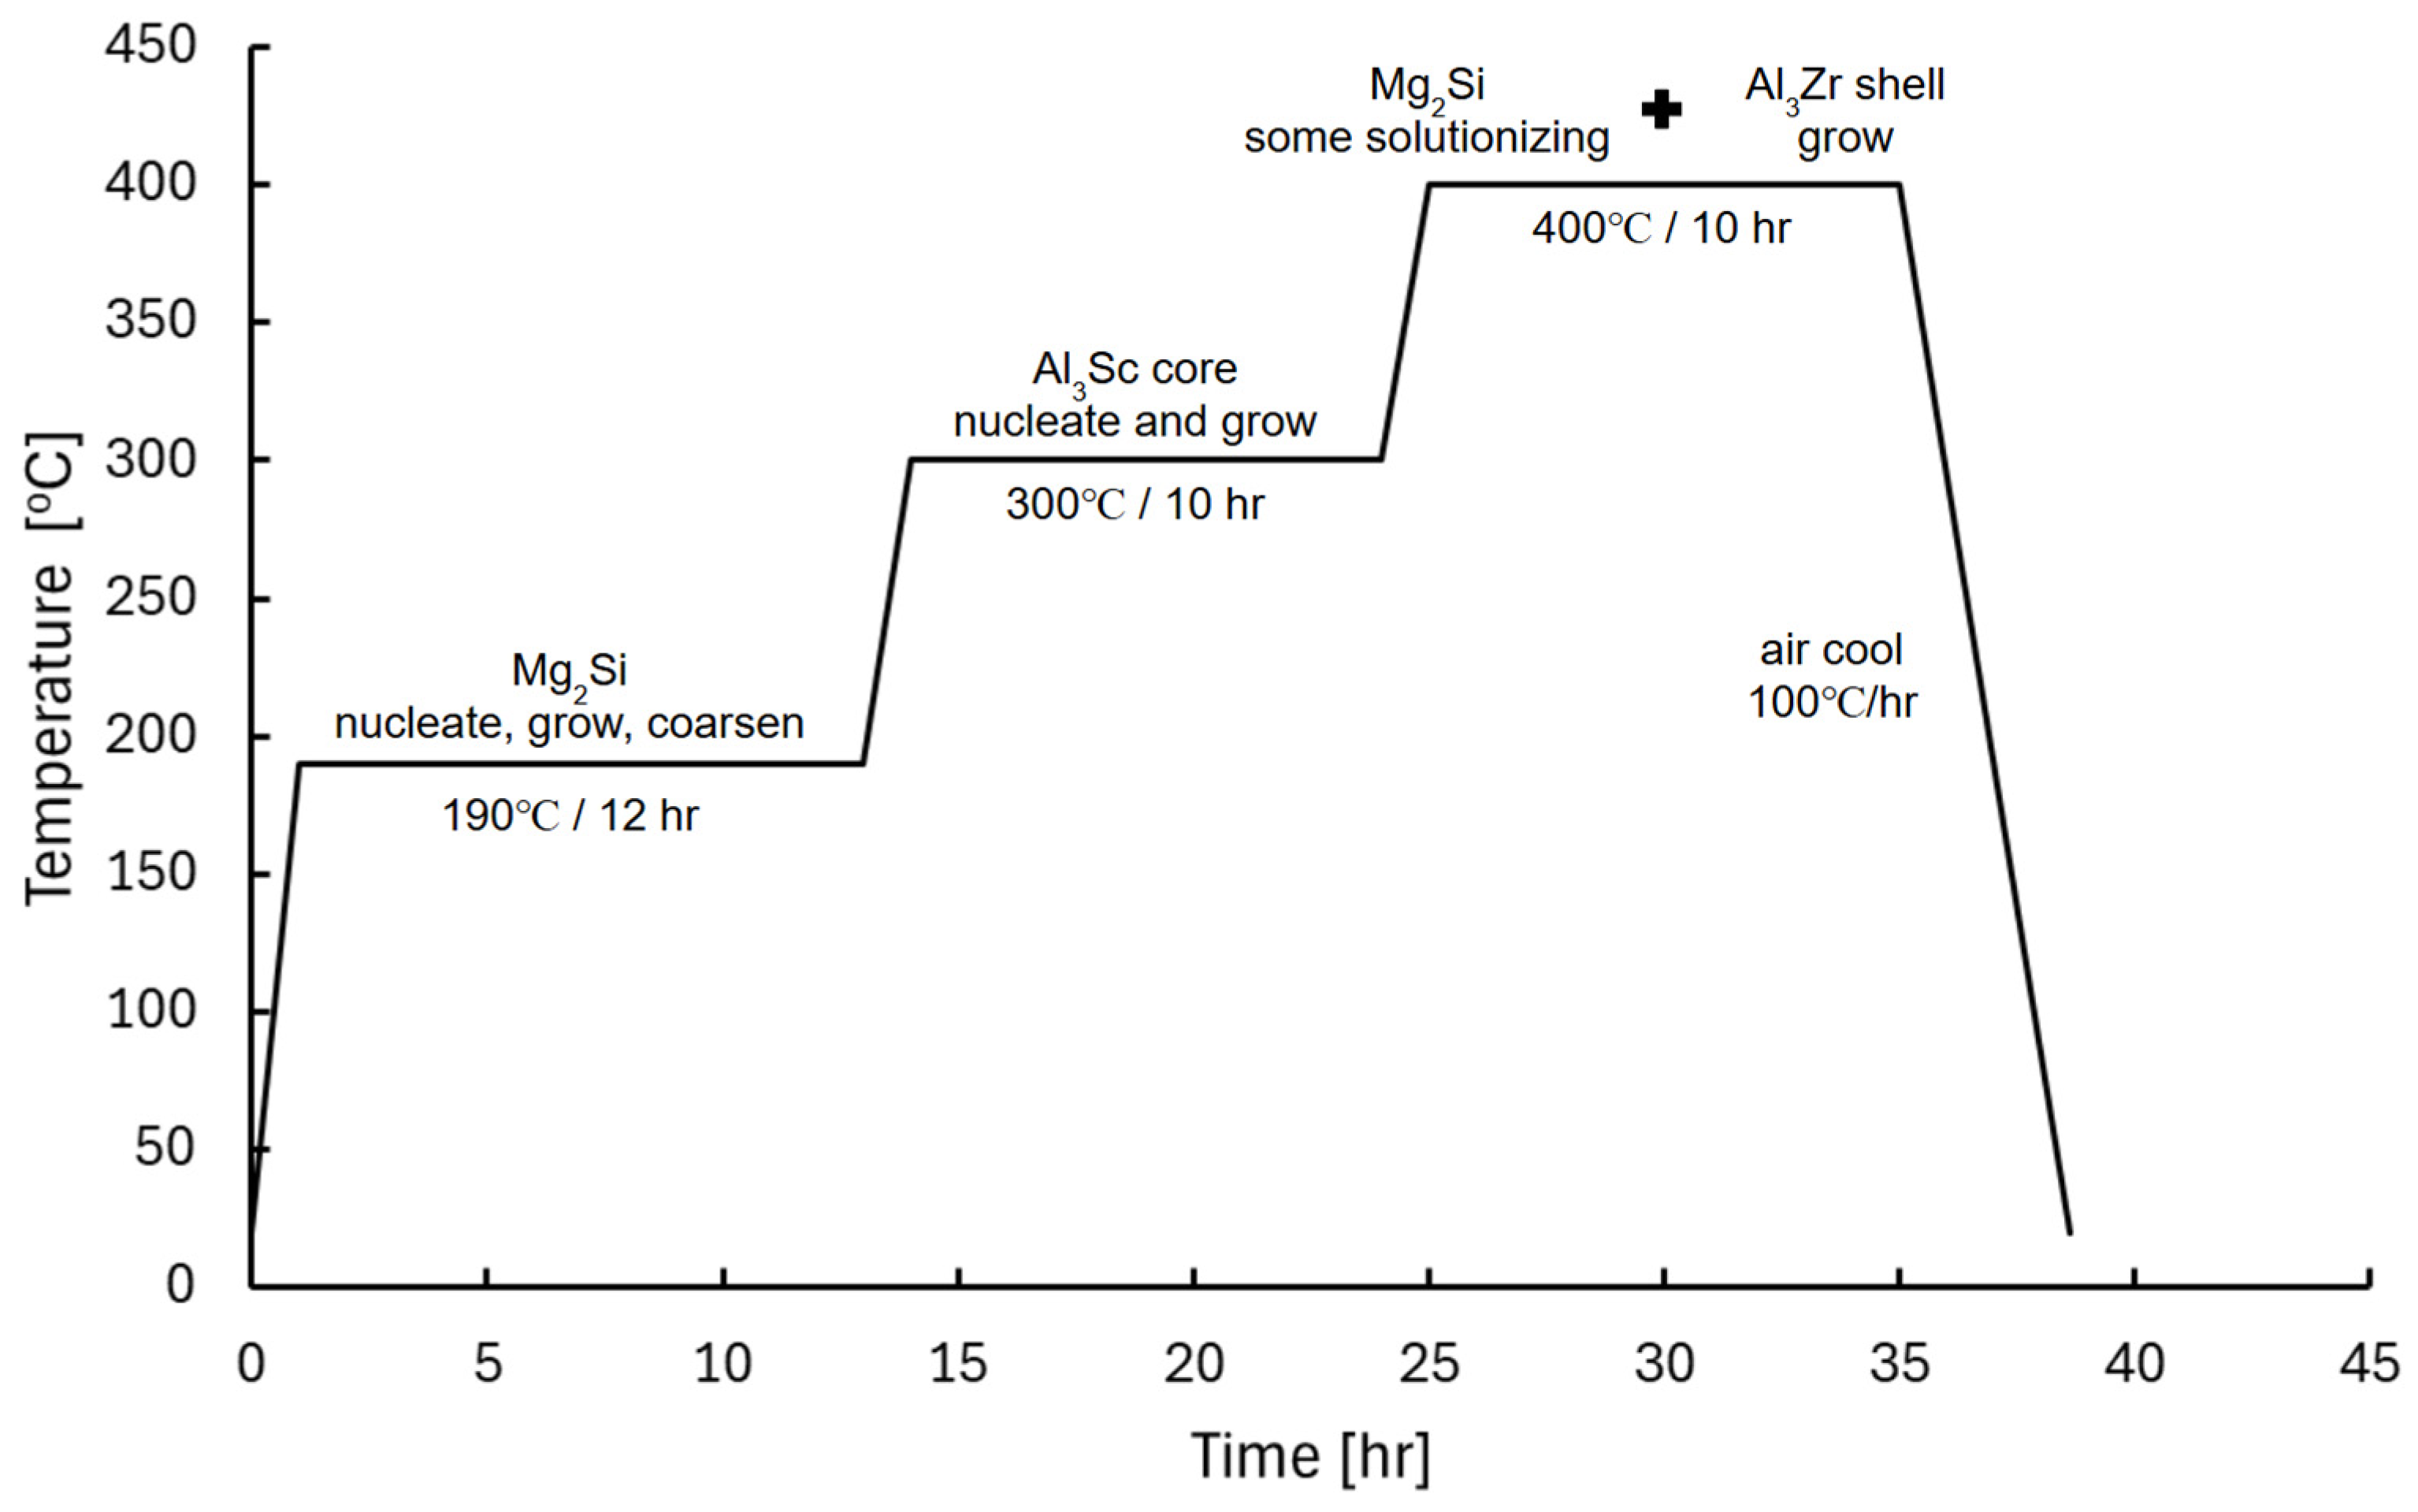
2.2. Extrusion and Heat Treatment

Extrusion was performed on a Breda 550 extrusion press with a container diameter of 94 mm. Four dies were chosen to assess the geometry and extrusion ratio variations (Table 2). Before extrusion, the dies and container were preheated to 450 °C. One hour before extrusion, the billets were placed in a convection oven preheated to 500 °C. Extrusion was performed at a ram speed of 50 mm/min for the high extrusion ratios and 125 mm/min for the low extrusion ratios. During the extrusion process, a 20% butt length was subsequently removed during die changes. After extrusion, the profiles were air cooled on a runout table (no press quench).
The extrusion profiles were cut to 50 cm lengths and heat-treated to simulate the use of a quench tank after extrusion. A convection furnace was preheated to 520 °C, and samples were placed in the furnace and monitored with an internal thermocouple. Once the samples reached an internal temperature of 520 °C ± 5 °C, they were held for 30 min and then quenched directly into room-temperature water. An Instron 4206 universal tensile frame was used to stretch all profiles to 2%, followed by aging at 175 °C for 8 h.

2.3. Mechanical Testing

Given the different extrusion profiles, four tensile specimen geometries were prepared parallel to the extrusion direction. All specimens were manufactured per ASTM-E8 for flat and round specimens. Flat samples were made to specifications for 57.2 mm gauge section lengths, and rod samples were made to two specifications: 57.2 mm gauge lengths for the low ER and 31.8 mm for the high ER. Mechanical testing was performed on an Instron 4206 universal testing frame with MTS TestSuites TW Elite software version 4.5.2.423. A 50.8 mm Epsilon extensometer was used to measure strain for the 12.7 mm diameter gauge samples and flat samples. Due to the smaller size of the 6.4 mm diameter gauge, a 25.4 mm Epsilon extensometer was used. A 22 kN Futek load cell is used for the flat samples and 6.4 mm diameter samples, while a 110 kN load cell is required for the 12.7 mm diameter gauge samples. Tests were performed at an initial strain rate of 8 × 10⁻⁴ s−1 until the samples failed. The data were exported from the TW Elite software and analyzed using MATLAB version R2022b 9.13.0.2698988 to quantify the yield strength, ultimate tensile strength, and ductility.

2.4. Metallographic Sample Preparation

Samples were prepared looking at the transverse direction after final heat treatment (Figure 3). For anodizing, copper wires were attached to the samples prior to epoxy mounting, grinding, and polishing (Table 3). After polishing, anodizing was performed using Barkes reagent at 20 V for 1.5 min. Samples were imaged under polarized light. For statistical analysis, four samples were prepared per extrusion and alloy condition, and three images were analyzed per sample to quantify the PCG thickness. Four measurements were taken per image and averaged to form the mean, minimum, and maximum PCG depth.

2.5. Electron Backscattered Difraction (EBSD)

The extruded sheet and rod were sectioned transversely to the extrusion direction for analysis via EBSD (Figure 3). The sample surface preparation was performed on a JEOL IB-19500CP cross-sectional polisher with a rotational stage with two polisher settings. The first is rough milling using an accelerating voltage of 5 kV and argon flow of 8 × 10⁻³ Pa for 8 h, followed by a finishing polish using an accelerating voltage of 4 kV and argon flow of 10 × 10−3 Pa for 2 h. Analysis was performed on the Apereo 2 FESEM (Thermo Fisher Scientific, Waltham, MA, USA) using the Symmetry 3S EBSD detector (Table 4) with AZtec version 6.1 for mapping and AZtecCrystal version 3.1 for analysis (Oxford Instruments Abingdon, UK).
A MATLAB add-in, MTEX [22], was utilized to measure the volume fraction of cube, copper, goss, brass, and S texture, looking at the extrusion direction. The volume function in MTEX was used to estimate the characteristic orientation fractions at a 15° cutoff angle (Table 5), although some brass, copper, and S textures may overlap. To obtain a mean value for the texture, five images were taken at the center of the samples, each having an area of 0.75 mm2, as images any larger had significant fractions of zero solutions. Texture volume fractions below 0.1% were not reported.

2.6. Transmision Electron Microscopy (TEM)

For TEM sample preparation, 3 mm diameter disks were cut using electric discharge machining from the transverse direction of the extruded profiles and ground to 100 μm thick using 800 grit paper and water lubrication (Figure 3). Once ground, samples were electropolished at 120 mA to 180 mA in a 33% nitric acid and methanol solution cooled to −20 °C to −40 °C to produce foils with a final thickness between 150 nm and 50 nm. Once polished, the samples were imaged on an FEI 200 kV Titan Themis STEM on a <100> zone axis to quantify dispersoid size and distribution. About 50 dispersoids were measured per alloy. Imaging was also performed in STEM mode for collection of bright field (BF) and high-angle annular dark field (HAADF) images. Maps for energy dispersive spectroscopy (EDS) images were collected using a selected area mapping mode with drift correction selected. Elements that were imaged include Mn, Cr, Fe, and Si for 6005A alloys, and Sc, Zr, Mn, and Fe for 6005+ alloys.

3. Results

3.1. Mechanical Properties

To analyze the raw data, a design of experiments (DOE) analysis was performed using MINITAB to show trends given alloying, shape, and extrusion ratio (Figure 4 and Figure 5, Table A1). The trends show that for all shapes and extrusion ratios, the 6005+ has increased strength and slightly reduced ductility compared to 6005A. Rod shapes have increased yield strength, UTS, and ductility for all alloys. While low extrusion ratio shapes have increased yield strength, UTS, and no change in ductility compared to the high extrusion ratio. Other notable results are that the 6005+ alloy showed a consistent yield strength and UTS, given the changes to the extrusion ratio, while 6005A had a decreased yield strength and UTS, given an increase in the extrusion ratio for the rod samples.

3.2. Anodizing Results
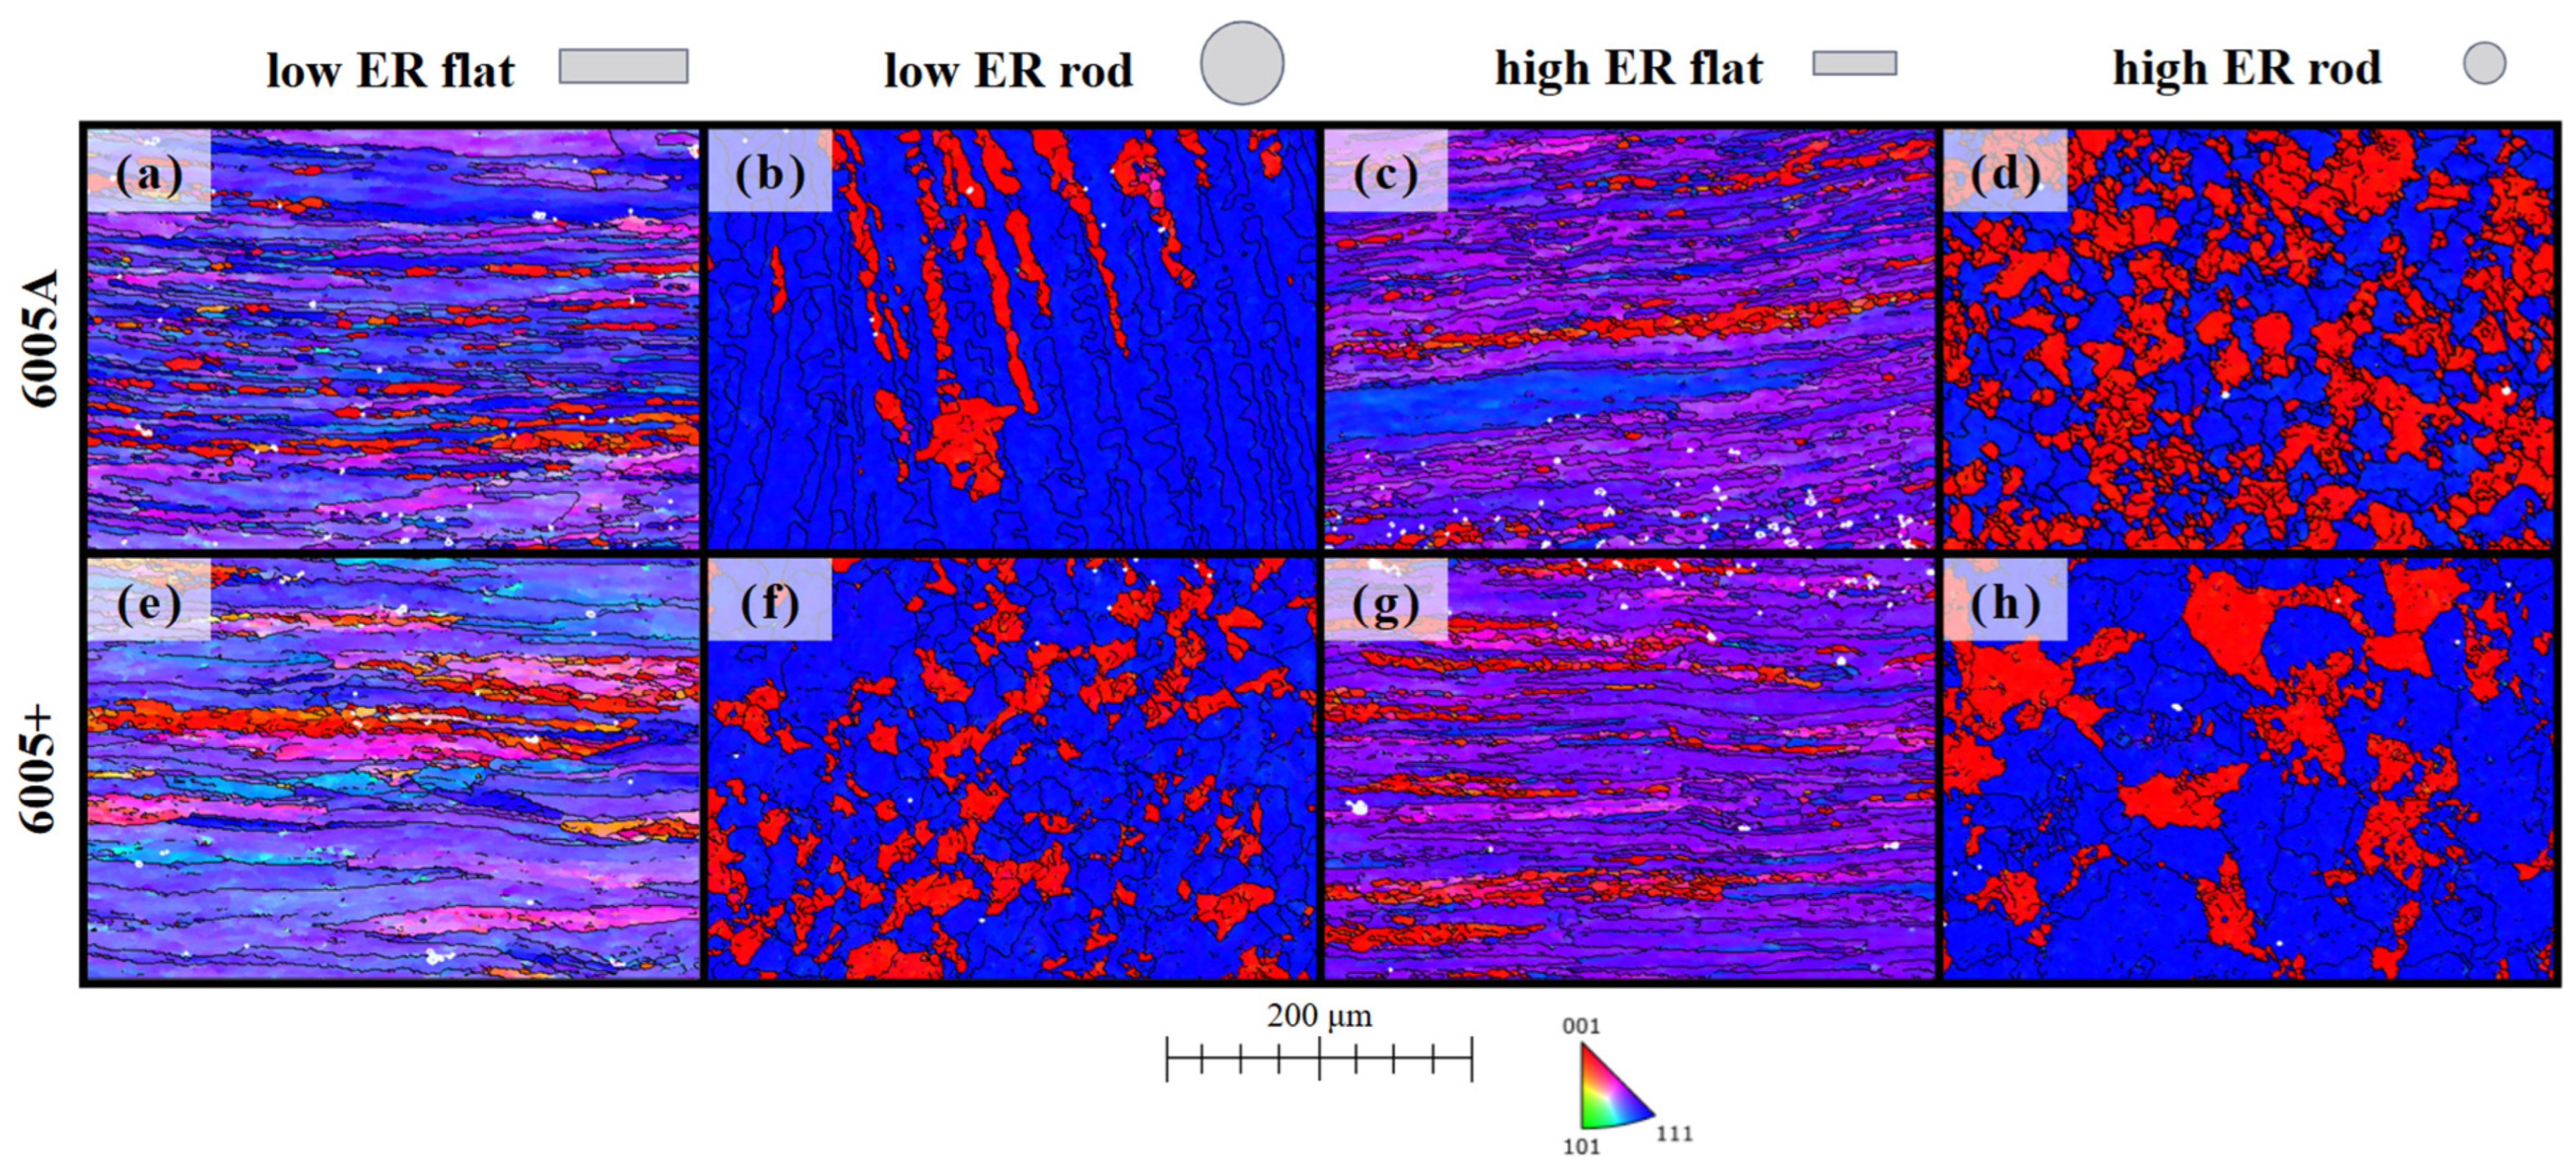
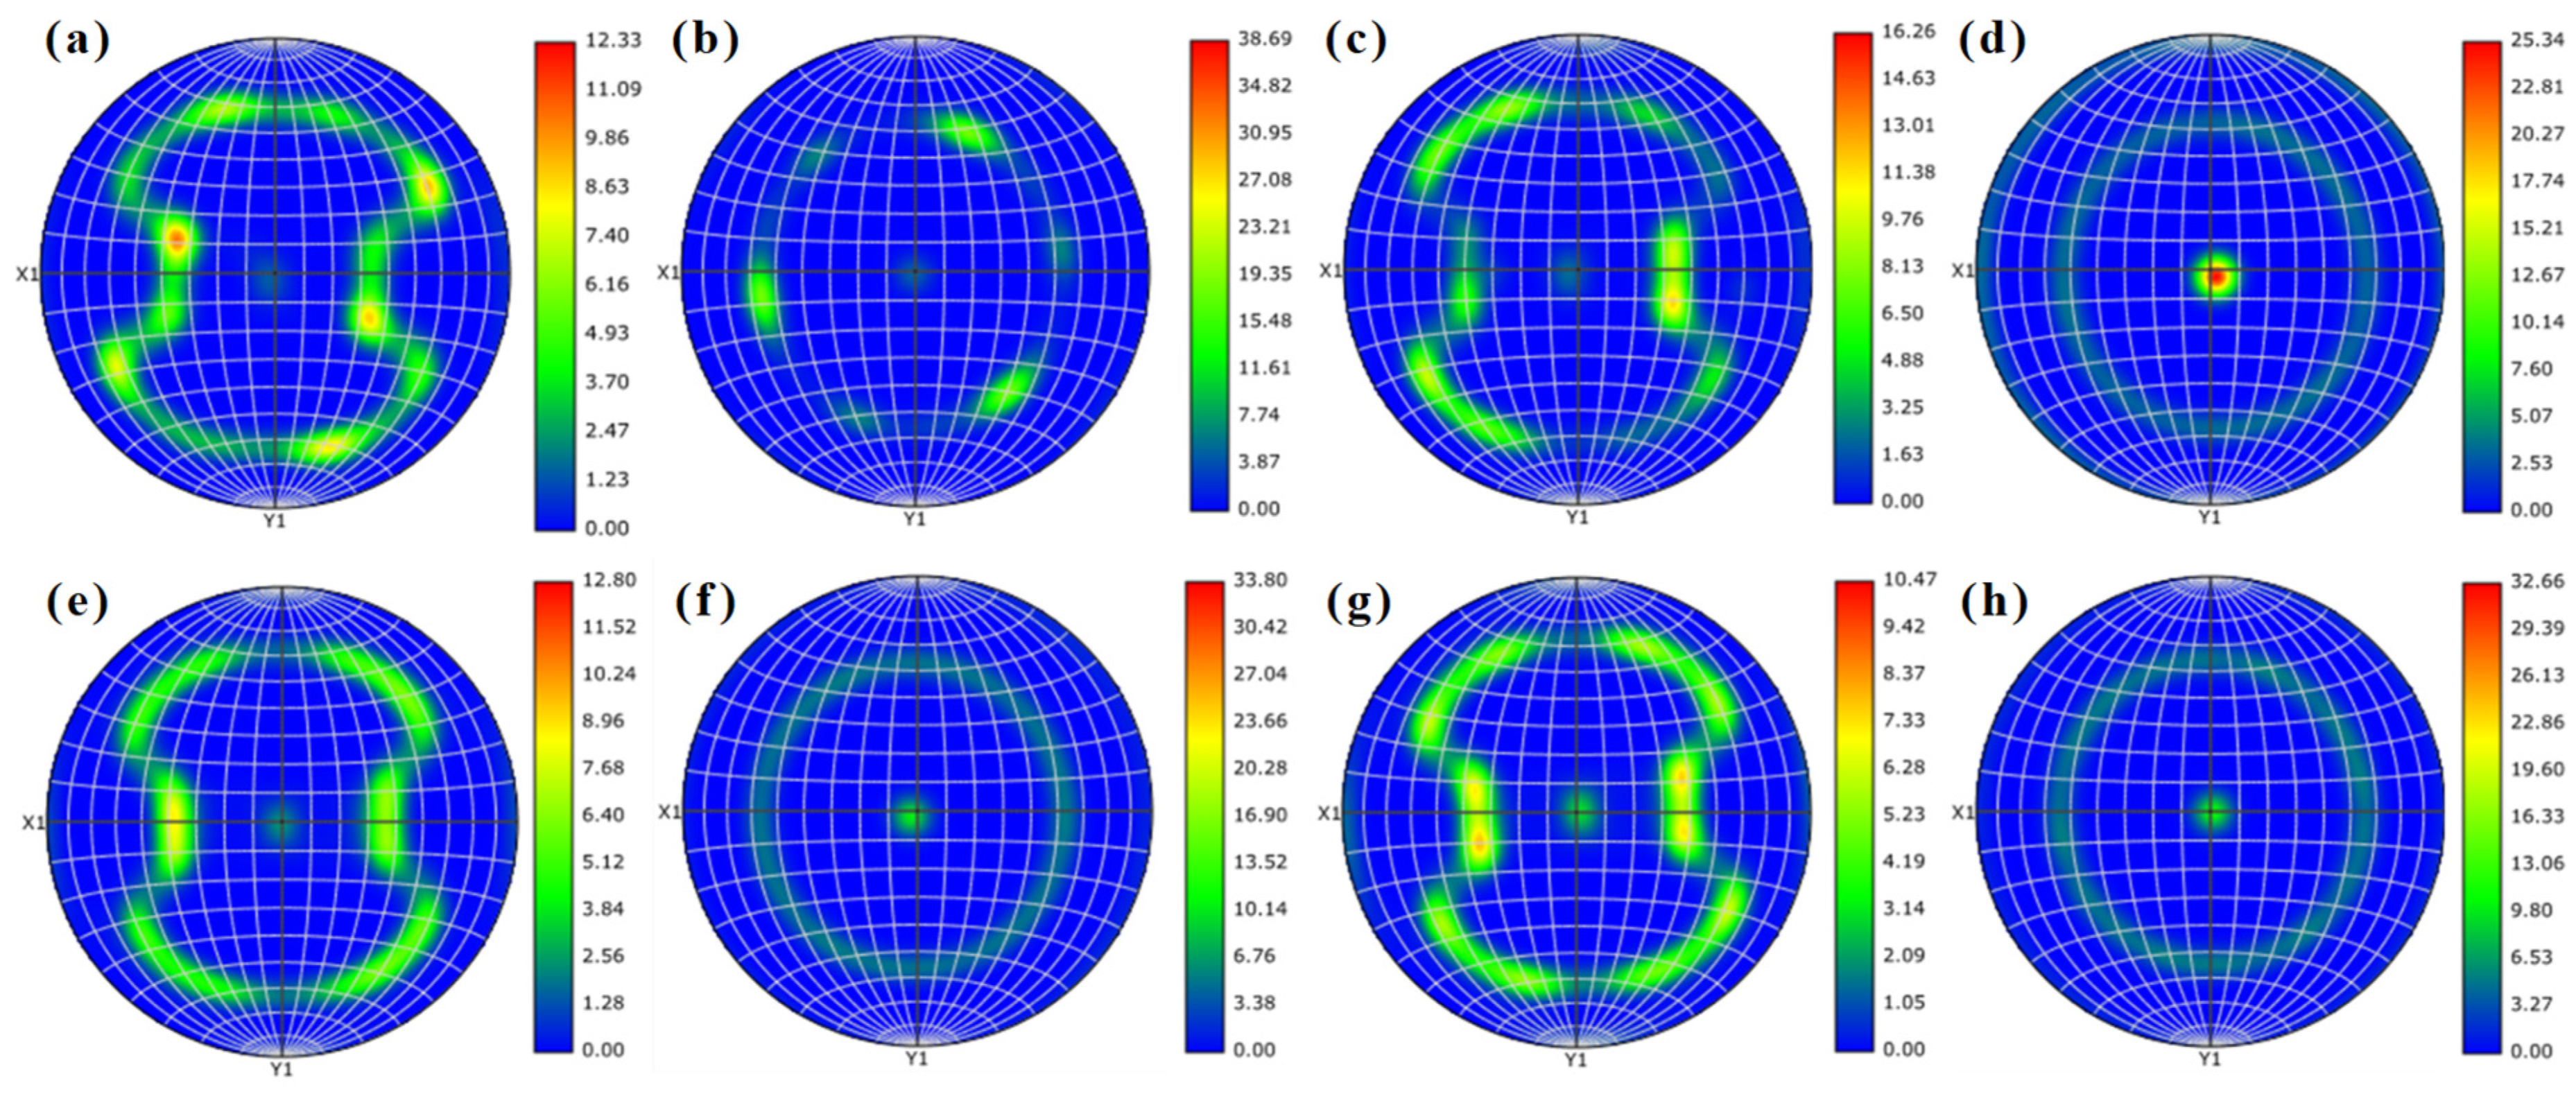
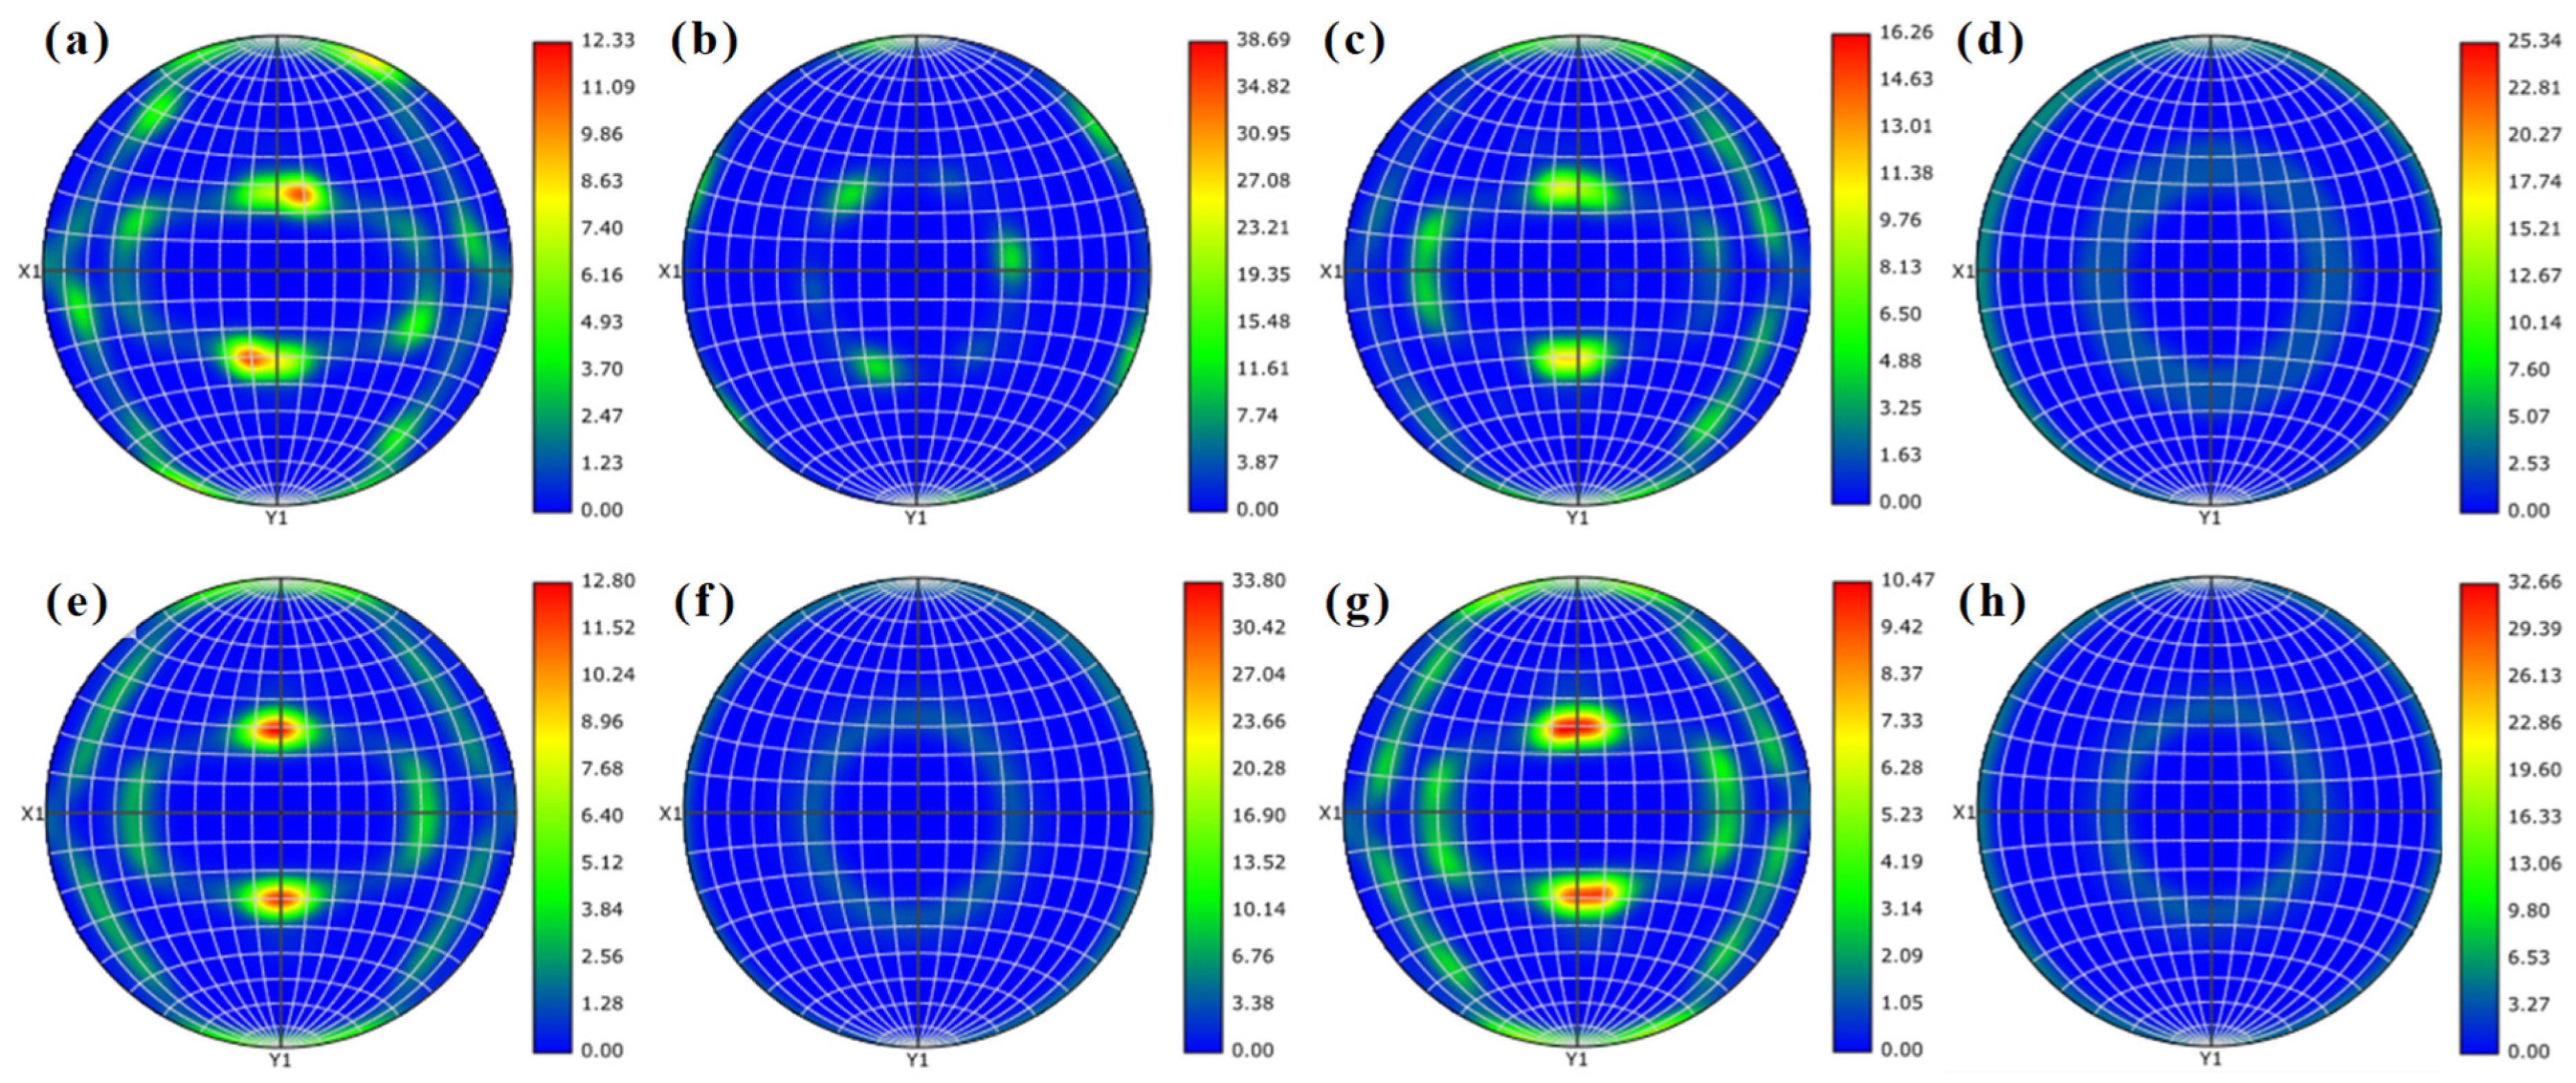
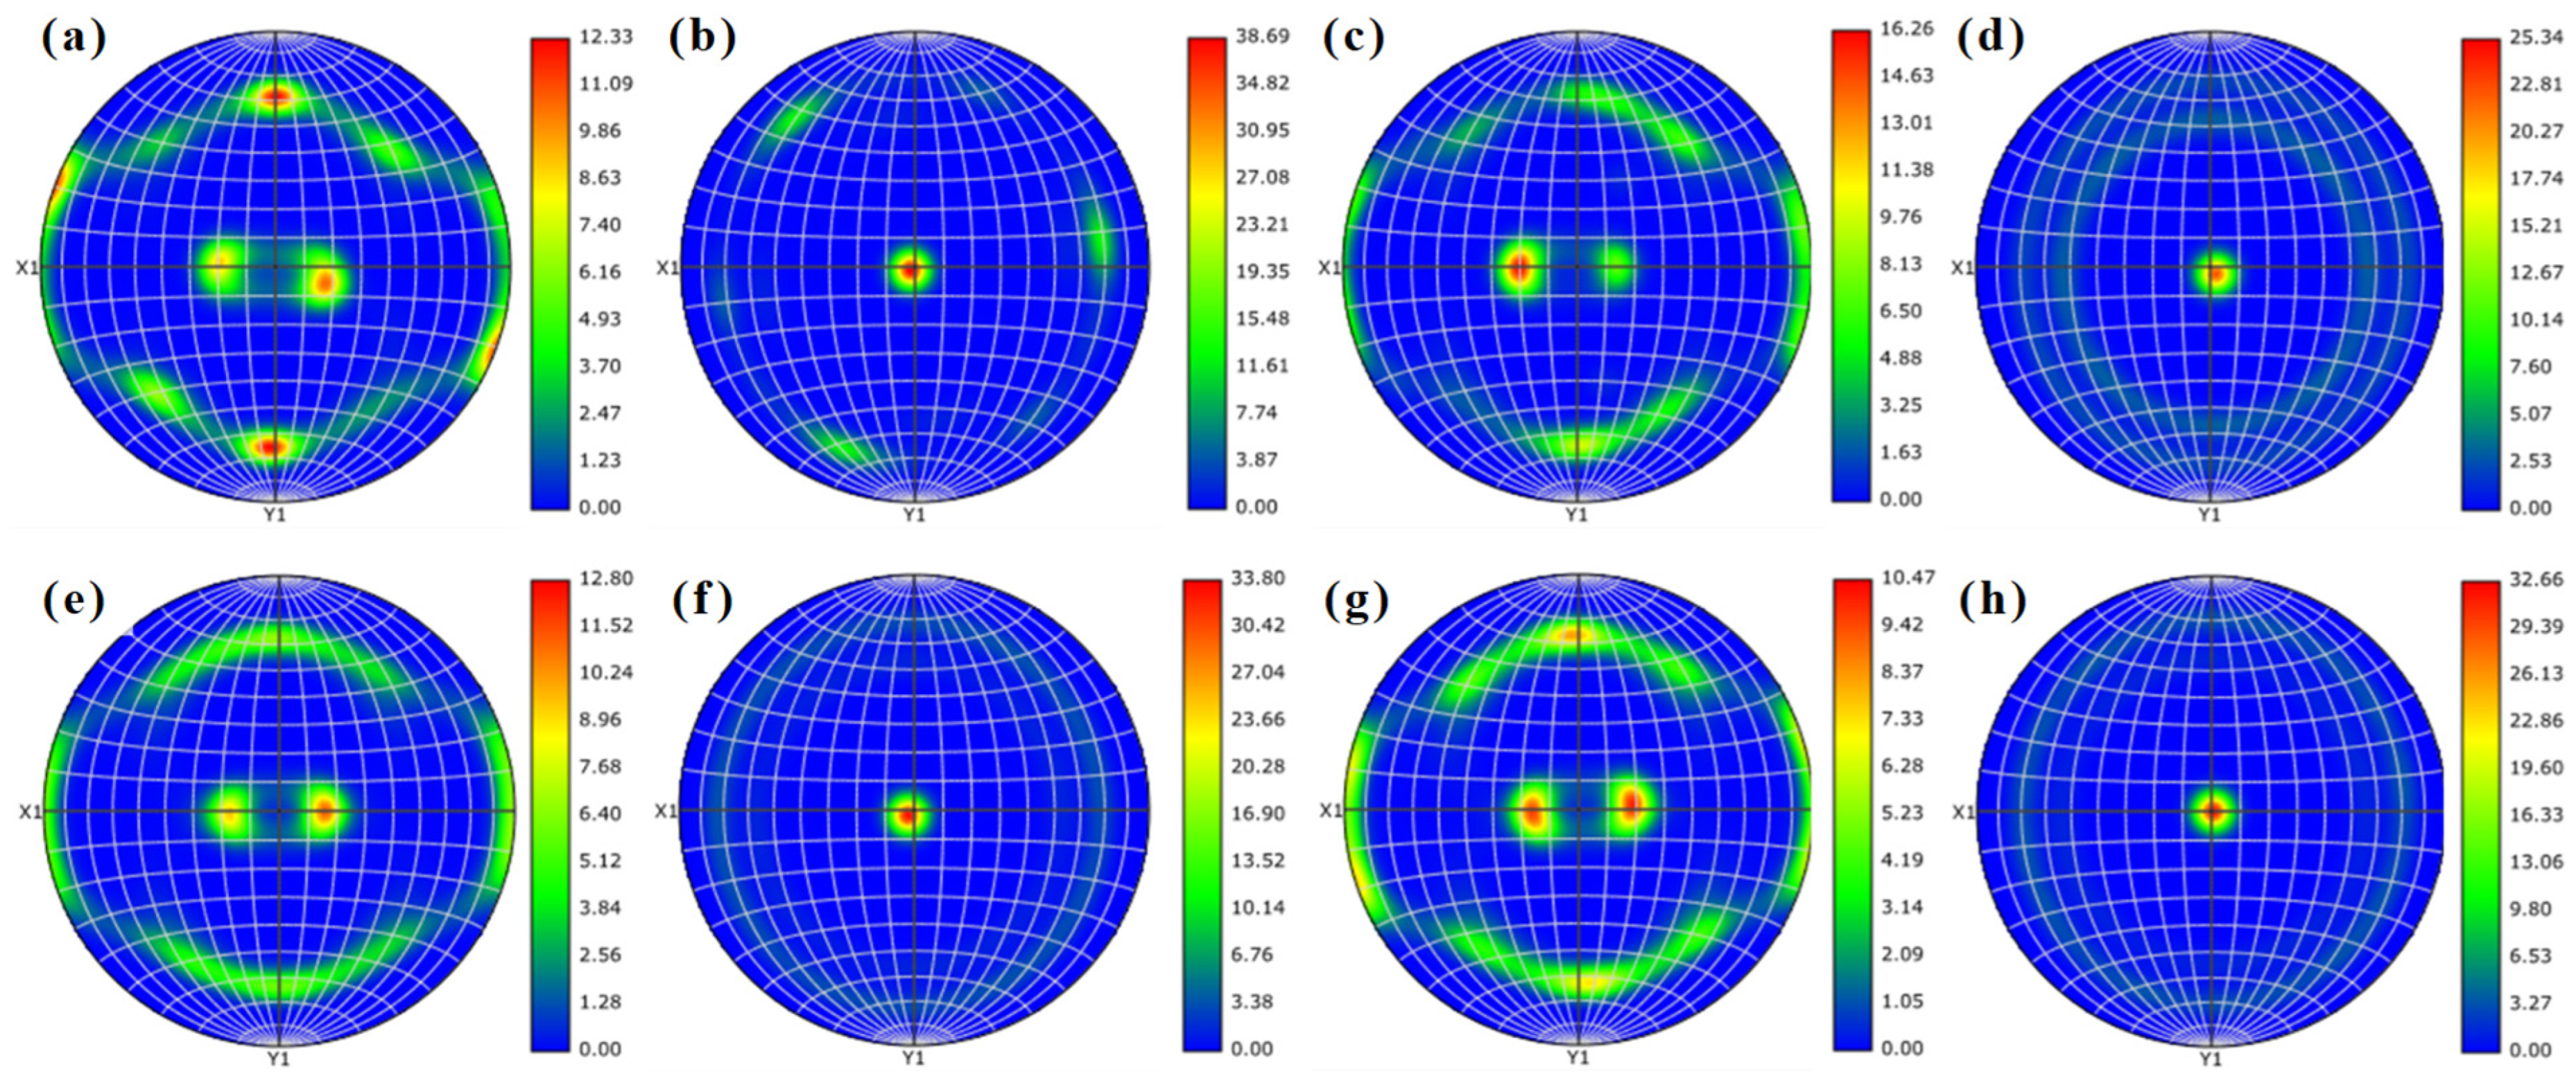
The PCG thickness is the largest for the 6005A alloy for all shapes and ER (Figure 6 and Figure 7). For both alloys, rod shapes and high ER increased PCG layer thickness. The sample with the greatest PCG thickness was the high ER rod made with the 6005A alloy, while the smallest PCG layer thickness was the low ER flat made of 6005+. In general, the PCG thickness for 6005A varies significantly, which was confirmed by analysis of variance (Figure 7). A DOE analysis was performed on the effects of PCG thickness given the changing shape and extrusion ratio (Figure 8). The results show that PCG thickness is reduced with Sc and Zr dispersoids, flat profiles, and low extrusion ratios. It should also be noted that the 6005+ alloy has consistent PCG thickness, given changes to shape and extrusion ratio.

3.3. EBSD Results

There is a unique dual fiber texture that forms during the extrusion of a rod, as shown in the IPF Z maps in the 6005A and 6005+ alloys for the high and low extrusion ratios (Figure 9). This dual fiber texture consists primarily of <100> and <111> texture, while, for the sheet, the texture is primarily a mix between the <100> and <111> orientations but not directly oriented toward the <100> or <111> directions. Pole figure maps from various orientations were used to confirm the dual fiber nature of the rod using the {100} (Figure 10), {110} (Figure 11), and {111} (Figure 12) graphs. The {100} and {111} pole figure maps show that the matrix is directly oriented in the <100> and <111> directions for the rod shapes, while flat shapes have a variety of orientations between the <100> and <111> orientations. There appear to be no significant changes in pole figures with ER.
The subgrain structure is also affected by profile shape (Figure 13). When extruding a flat shape, there appears to be stretching in the left and right direction of the image, which would be along the width of the sheet. Stretching is not seen in the rod shapes where subgrains appear to be unstretched due to uniform deformation in all directions.
Texture analysis showed that both alloys had significant fractions of cube, copper, and S texture (Figure 14, Table A3). Other components with less than 0.1% volume percent were eliminated from the analysis. The shape did affect the type of texture that formed; flat shapes had less cube texture and more copper and S texture than rod shapes for both alloys. The extrusion ratio did not affect the formation of copper or S texture; however, it was found that higher extrusion ratios resulted in more cube texture.
The texture effects for cube, copper, and brass were also analyzed using DOE methods (Figure 15). The results show that the cube texture is reduced with the addition of Sc and Zr, flat shapes, and low extrusion ratios. Copper texture is increased with Sc and Zr additions, flat shapes, and a low extrusion ratio. For the S texture, the fraction is increased with flat shapes but is unaffected by the Sc and Zr additions and extrusion ratio. Notably, the 6005+ alloy showed to have no significant changes in texture given the extrusion ratio change for flat shapes.

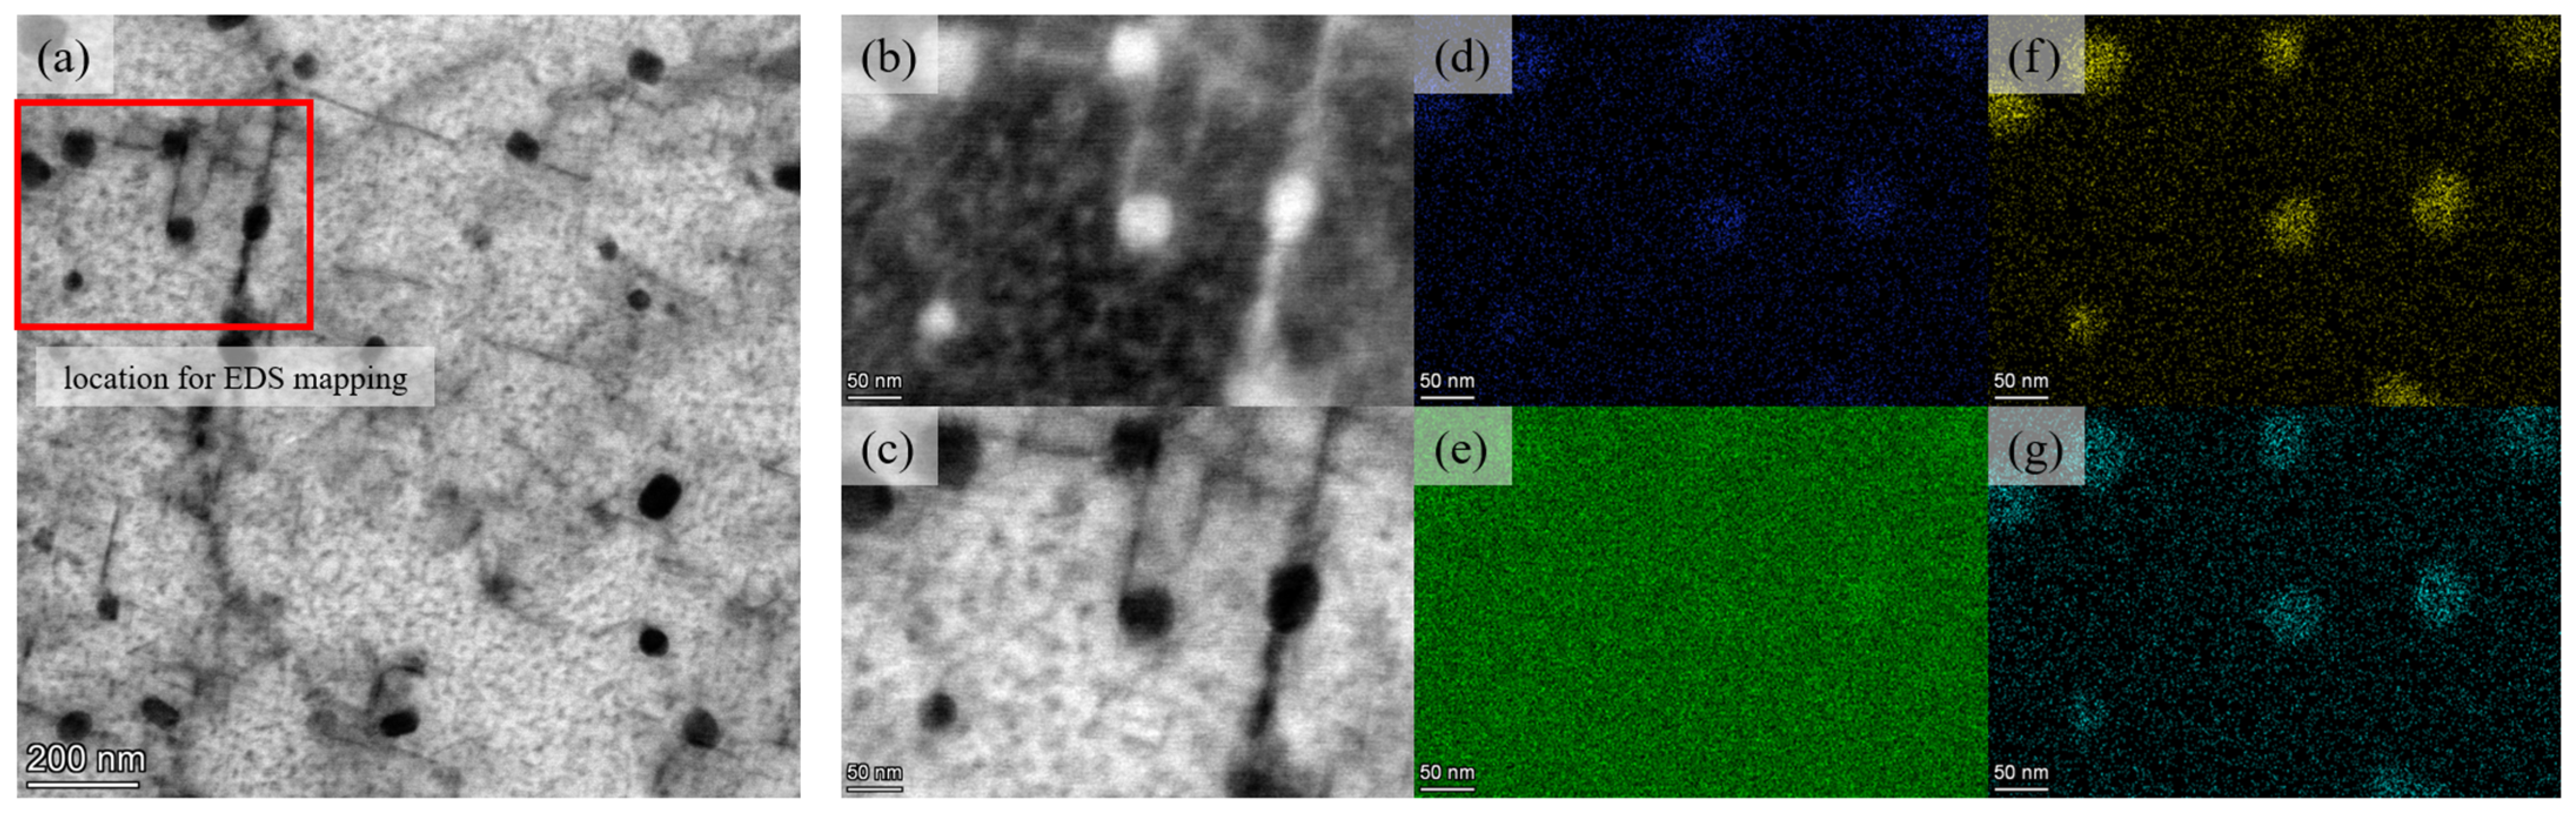
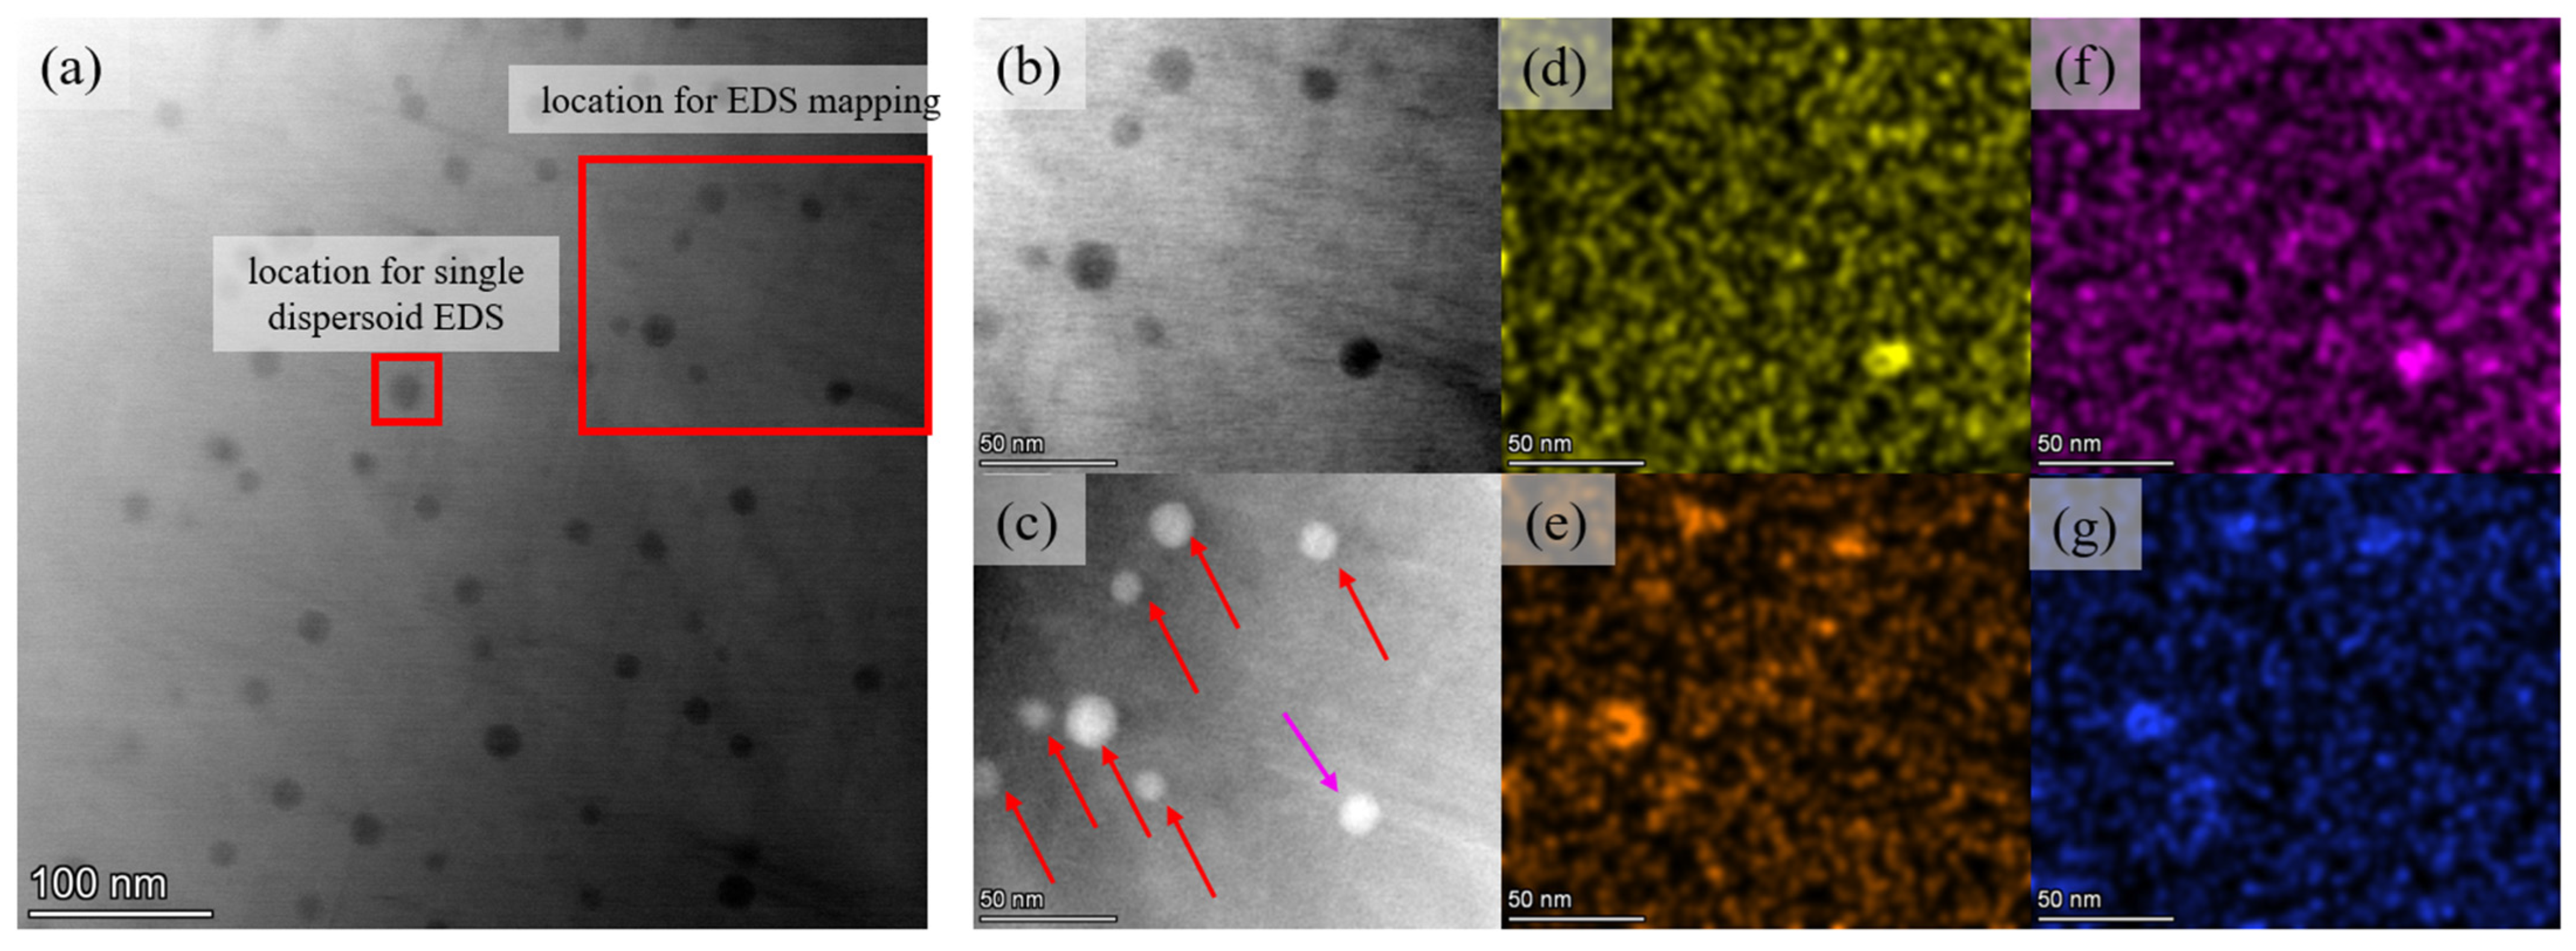
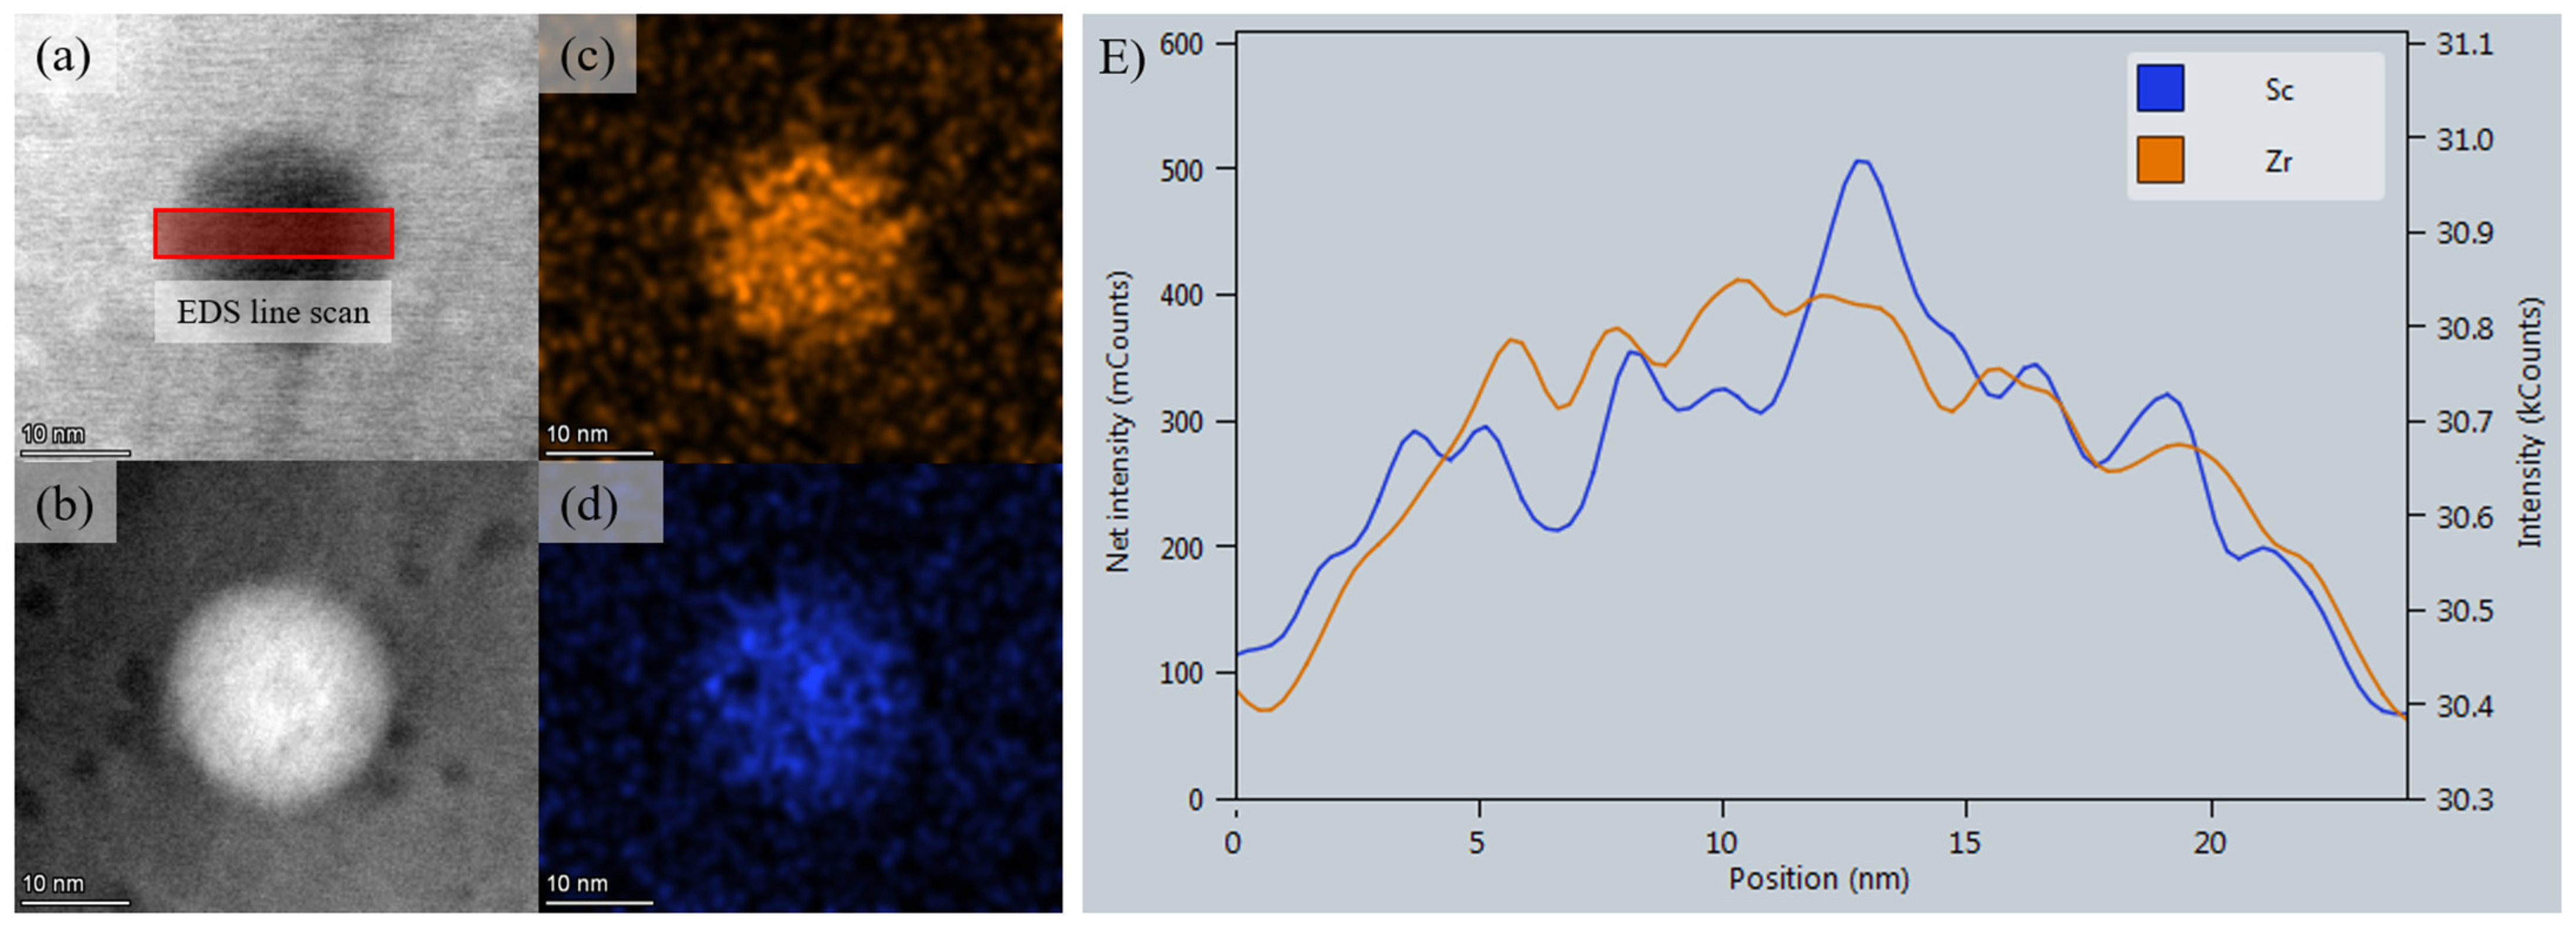
3.4. Dispersoid Analysis Results

Transmission electron microscopy (TEM) was performed to image the dispersoids present in the microstructure after extrusion and heat treatment for the 6005A low flat sample (Figure 16) and the 6005+ high ER rod sample (Figure 17). Energy dispersive spectroscopy (EDS) mapping of the 6005A alloy identified dispersoids that contained Cr, Mn, and Fe, typical of the 6xxx series alloy system. EDS mapping of the 6005+ identified dispersoids, which had Sc and Zr or Mn and Fe. In the 6005+ alloy, the majority of dispersoids contained Sc and Zr; however, it is important to note that the 0.05 wt% concentration of Mn that was added to the 6005+ alloy produced some dispersoids. To see if the core–shell structure formed for the Al3Sc-Zr dispersoids, EDS mapping of a single dispersoid was performed (Figure 18). The results show that the dispersoid in fact contains both Sc and Zr, but no conclusive evidence was presented that the core–shell structure was formed during the homagen-age heat treatment. An EDS line scan of the structure should show a dip in Zr at the center and a spike in Zr at the edges; however, the line scans showed that both Sc and Zr had similar net intensities throughout the scan. These results, therefore, cannot confirm that the core–shell was formed; however, they do show that Sc and Zr were indeed at the dispersoid and that the dispersoids were stable during the higher temperature extrusion and heat treatments.
Several images were also taken to measure the size of dispersoids for both alloys. The Al3Sc-Zr dispersoids have a mean diameter of 16 nm ± 3 nm compared to the Mn and Cr containing dispersoids with a mean diameter of 53 nm ± 16 nm. Due to the difficulty in measuring the number density of dispersoids, Thermo-Calc precipitation simulations were performed to estimate the density of Mn and Cr containing dispersoids for the 6005A alloy and Sc and Zr containing dispersoids in the 6005+ alloy. Calculations were performed using Thermo-Calc 2022b version 2022.2.101125-437, using the TCAL8: Alloys v8.1 and MOBAL7: Al-Alloys Mobility v7.0. The compositions of the dispersoids can vary within the alloy; so, to predict the dispersoid volume fraction, single-axis equilibrium simulations were performed at the homogenization temperature for each alloy. The 6005A alloy had stable ALFEMN3 precipitates formed, and 6005+ had stable AL3X precipitates. The simulations predicted the volume fraction of ALFEMN3 to be 0.0038 and AL3X to be 0.0037.

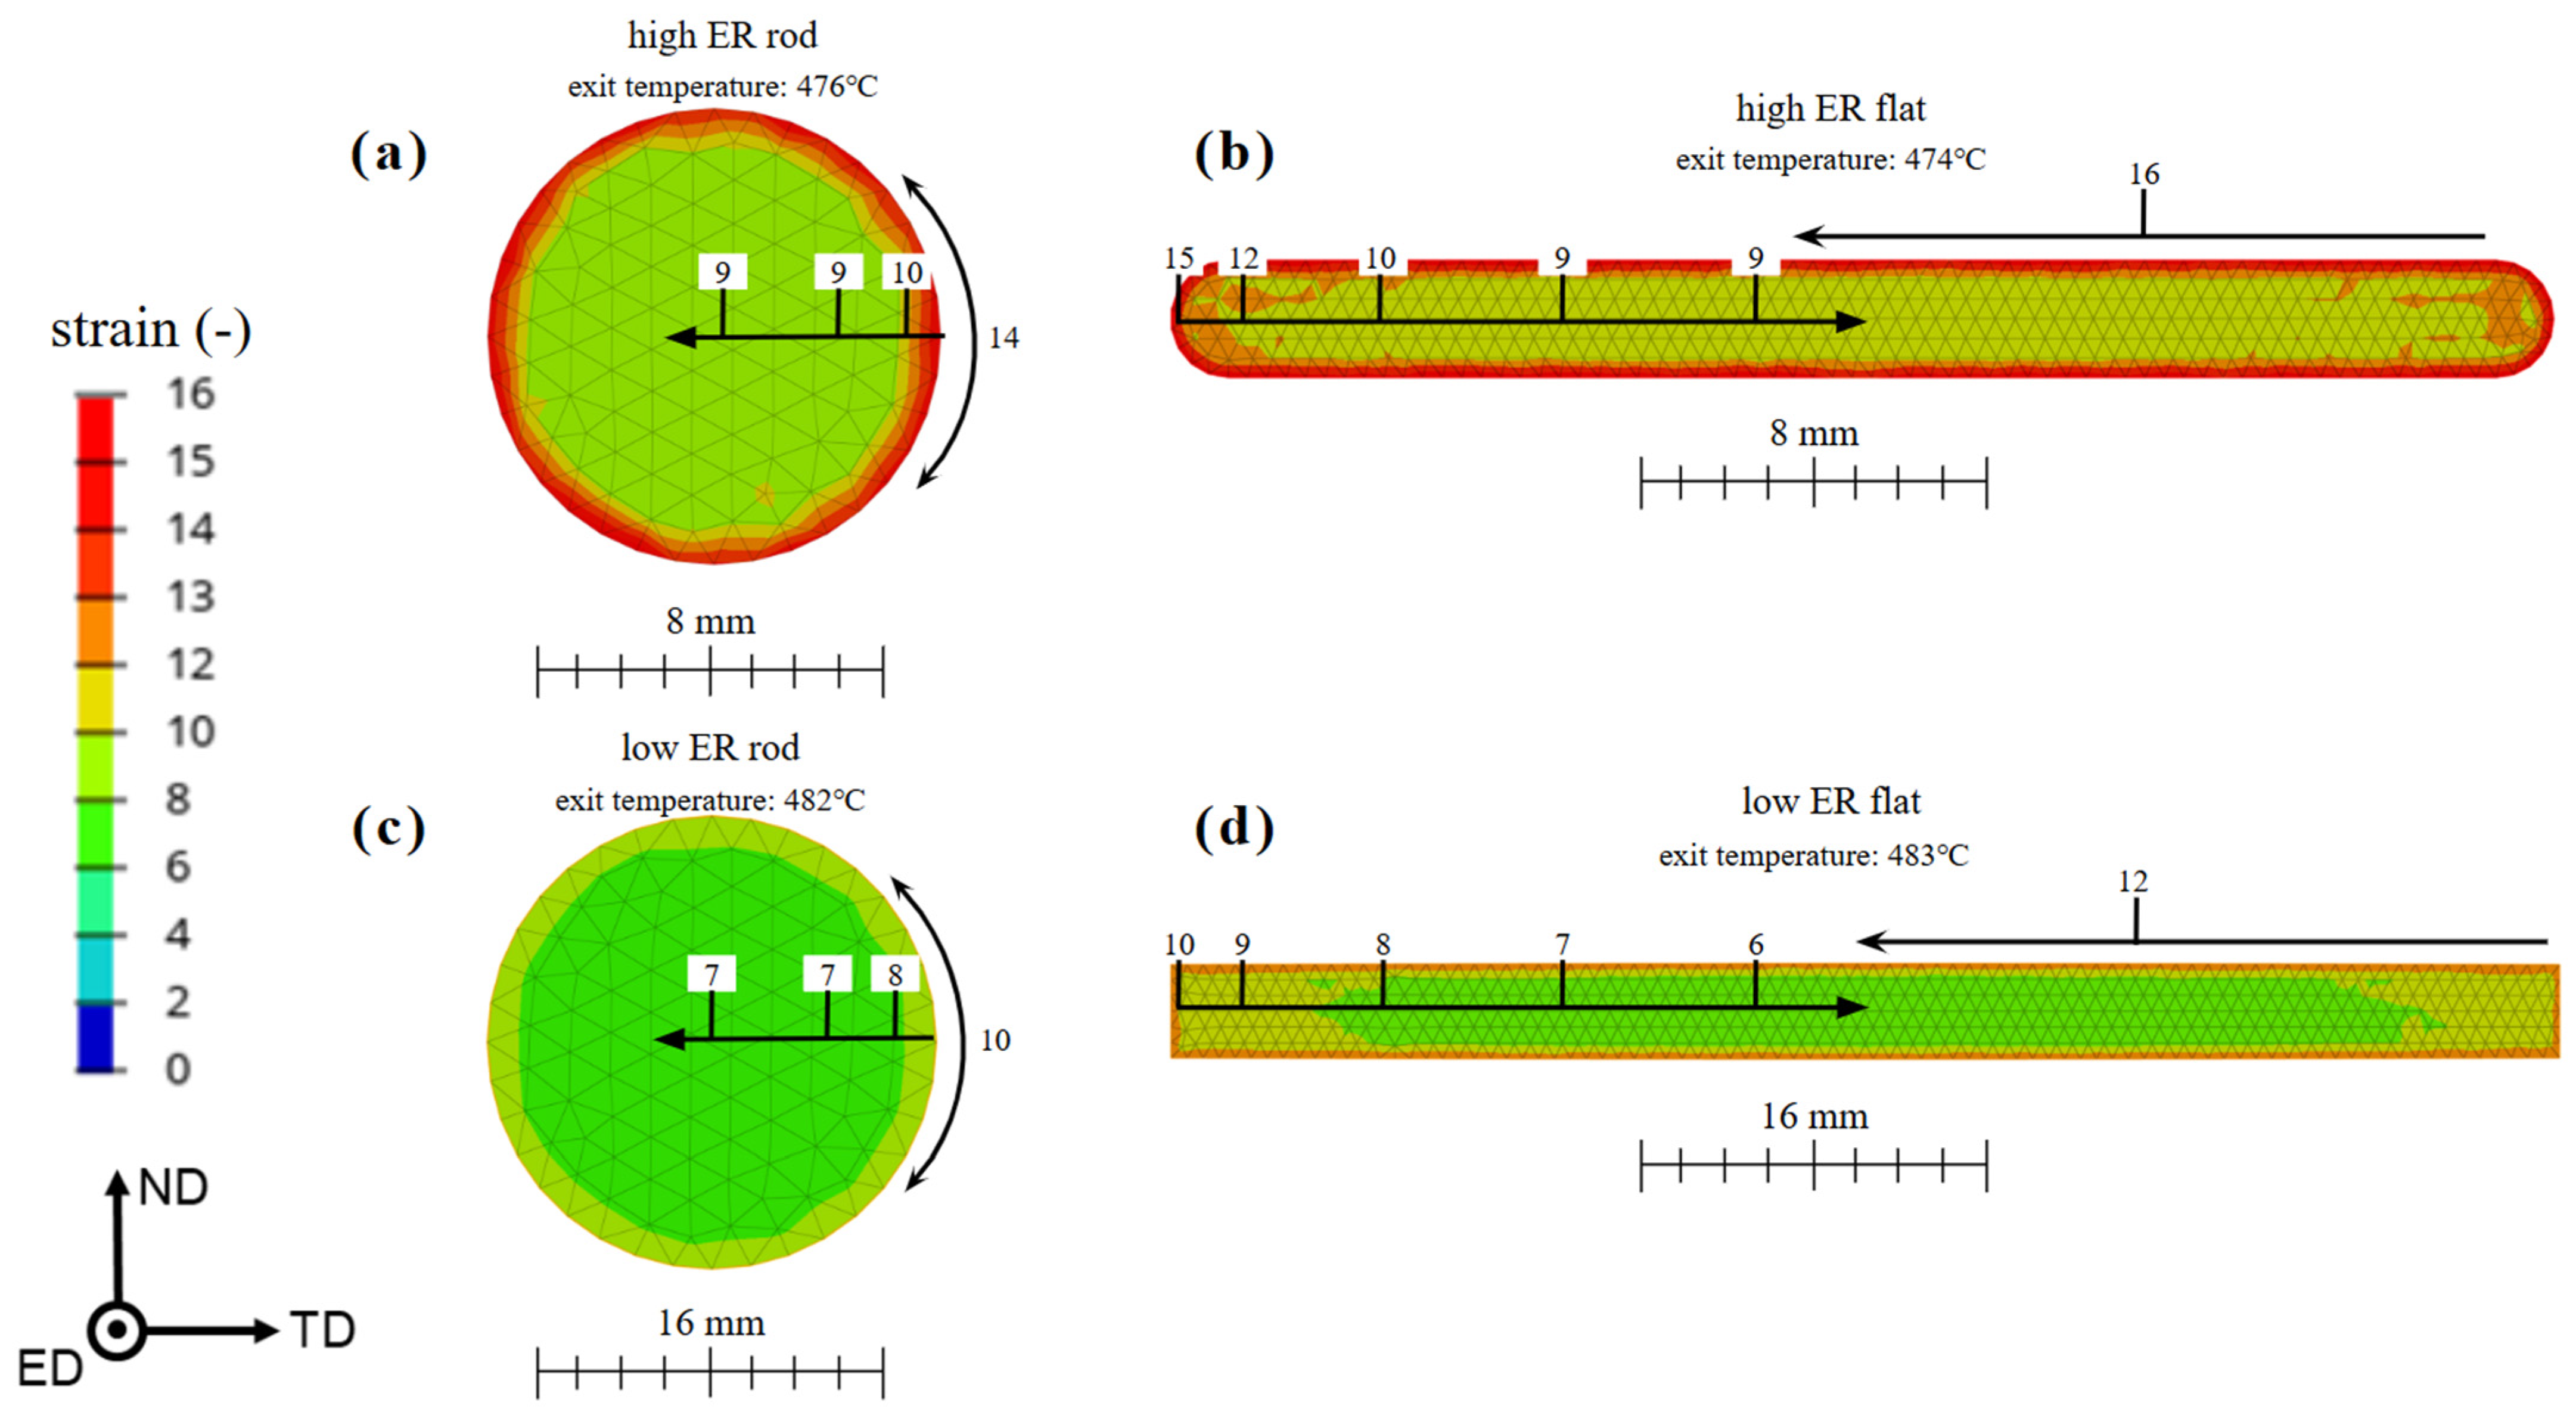
3.5. Extrusion Simulations and Results

Extrusion simulations were performed using Inspire Extrude 2022.7281 by Altair, which includes making the mesh and setting the extrusion boundary conditions. To solve extrusion simulations, the Altair manufacturing extrusion solver for 2022 was used. To set up extrusion simulations, the four unique profile shapes were imported as stp files and meshed. The boundary conditions for the extrusion system were set to have a stick-type friction for contacts between the billet/container and the billet/die. For the interface of the profile/baring, a visco plastic friction model was used. For heat transfer between the billet/die and billet/container, a convection heat transfer was set using a coefficient of 528 W/(m·°K). For the strain calculations, a Galerkin finite element method was used. Similar preheat temperatures were chosen with the container and die set to 450 °C and the billet temperature set to 500 °C to start. The billet material was selected to be 6105 alloy using the inverse hyperbolic sine model with values measured by Sheppard et al. [24]. The billet size was set to 90 mm with a container diameter set to 95 mm. For extrusion speeds, the high ER shapes used a slower extrusion speed of 12 mm/min, and the low ER used a speed of 50 mm/min. Cross sections were taken from the final stage of the extrusion simulations, 20 mm from the bearing entrance, and the theoretical deformation strain and exit temperatures were analyzed. Given that the material model did not match the alloys used in this study, it should be noted that there could be minor differences. However, it is believed that the most influential parameters in the strain and exit temperature results are die shape and starting boundary conditions.
The results of the analysis show that, in general, flat shapes and high extrusion ratios resulted in higher strains in the overall surface (Figure 19). The higher ER shapes were also shown to have higher strains than the low ER shapes, which is expected due to the significant increase in the reduction ratios. In comparison to the PCG results, both shapes showed significant increases in strain in regions that corresponded with a thicker PCG. Also, regions of higher strain, such as the high ER shapes, were found to have a thicker PCG as well. However, despite having higher strain in the surface of the sheet for both extrusion ratios, the rod shapes have a thicker PCG layer for both alloys (Figure 7). In terms of exit temperature, the low extrusion ratio shapes had higher exit temperatures than the high ER shapes. The change in temperature is primarily because of the faster extrusion speed used at the low ER shapes. A faster speed was chosen for the low ER shapes so that both profiles would have similar exit speeds. However, due to the faster speed, the billet was frictionally heated more during extrusion, causing a rise in the exit temperature. This, however, did not seem to impact the physical extrusion as the low ER shapes since they still had lower PCG thickness than the high ER shapes. This suggests that strain is more effective at growing the PCG than exit temperature, but it should not be disconnected from the PCG analysis.
Other features that can be compared to physically measured results are changes in texture. One texture component of interest is the <100> “cube” texture that is often related to enhanced ductility. In rod shapes, and particularly the high ER rod shapes, there is a significant increase in the <100> “cube” texture (Figure 14). A change in extrusion ratio simulates more strain, as seen between the low and high ER rod shapes. This change also showed a significant increase in the <100> “cube texture”. This suggests that higher strains promote the formation of <100> “cube” texture. However, this was not true in 6005+ alloys, which contained the Sc and Zr dispersoids, suggesting that they inhibited the formation of <100> “cube” texture in high-strain regions. A change in shape also resulted in significant changes in the texture components present. The reason for the texture changes was not conclusive in this series of simulations because it is believed that the texture change due to shape is a product of the material flow path, which was not looked at here.

4. Discussion

4.1. The Link Between PCG, Alloying, and Extrusion Conditions

Different microstructures were generated with the extrusion of two unique alloys, shapes, and extrusion ratios. In terms of the PCG thickness, the 6005+ alloy significantly reduced the thickness compared to 6005A. The reduction in 6005+ PCG thickness is caused by improved static recrystallization resistance, as the PCG layer is formed directly after the extrusion but before quenching [25]. The deformation in the PCG region is mainly simple shear, which is also characteristic of abnormal grain growth and significantly high strain. Adding dispersoid-forming elements, such as Mn and Cr, helps improve the static recrystallization resistance and reduce PCG growth [26]. This effect is due to increased Zener pinning, which slows grain boundary mobility. Zener pinning is increased in the 6005+ alloy due to the decreased diameter of Al3Sc-Zr dispersoids (Figure 16). This effect was also shown in 7xxx series alloys, where increasing concentrations of Sc and Zr reduced PCG thickness [12].
Changing the profile shape and extrusion ratio also influenced the PCG size. Since the PCG forms during static recrystallization, and static recrystallization can be promoted by increasing the local strain, the driving force for recrystallization increases. Given these assumptions, the increase in PCG size for high extrusion ratios is believed to be caused by increased strain, as shown by the extrusion simulations (Figure 17). However, rod shapes showed to have thicker PCG than flat shapes. This could be because the high-strain region extends longer into the extrusion. However, due to the coarse size of the mesh, it was difficult to confirm this behavior. In general, rod shapes and high extrusion ratios have the highest PCG thickness and cube texture fractions, suggesting both microstructure features preferentially form in areas of high strain localization. Therefore, due to the enhanced recrystallization resistance, Sc and Zr dispersoids can be used in applications where recrystallization is promoted, such as high-speed and temperature extrusion forming, effectively minimizing the amount of recrystallized microstructure formed.

4.2. Why Texture and Shape Influence the Mechanical Properties

Extrusion of rod shapes resulted in the highest strength, ductility, and the formation of a dual fiber texture compared to flat shapes, which had lower strength and a plain strain texture. The dual fiber texture of rod samples was easily distinguishable in IPF Z maps (Figure 9) and in the {100} (Figure 10) and {111} (Figure 12) pole figure maps. Enhancements in strength and ductility for rod samples are due to the orientation of the (111) slip plane in the <111> and <100> directions. Favoring the <111> texture is known to increase tensile strength due to the favorable orientation of the (111) plane away from applied shear stresses, thus increasing the force required for slip [27]. Compared to the <100> “cube” texture, which orientates the (111) plane more favorably for slip and increases ductility [28]. A combination of these textures not only increases strength but also ductility due to the mechanism of plastic deformation. The formation of the dual fiber texture is due to axisymmetric deformation compared to texture in flat shapes, which is formed via plane strain, preventing the formation of the dual fiber texture [9]. Therefore, showing that rod shapes have increased strength because of the change in deformation mechanism caused by varying the die shape.
The texture of rod and flat shapes is influenced by the extrusion ratio and alloy type. For rod shapes in both alloys, there is a notable increase in <100> “cube” texture given higher extrusion ratios. The changes are driven by increased stored strain in the surface and interior due to the greater size reduction. The <100> “cube” texture fraction is affected by the recrystallization conditions, and, therefore, enhanced recrystallization resistance should inhibit cube texture formation. However, when comparing 6005A and 6005+, there is a significant decrease in cube texture between high ER rod samples, but there are inconsistent results for the other conditions. The mixed findings on <100> “cube” texture growth suggest that die shape and extrusion ratio are more influential on texture development than modifying the recrystallization resistance by adding Al3Sc-Zr dispersoids. Therefore, to have enhanced mechanical properties, die design can be manipulated to favor specific texture components such as the <111> and <100> textures in rod samples to increase tensile strength and ductility. However, the extrusion of rod shapes is impractical for industrial applications where much more complex geometries are chosen. Therefore, tensile property testing should not be performed on rod extrusion but instead should be performed on the shape to be manufactured, or a close surrogate shape, such as a flat sheet, which is formed via similar deformation mechanisms.
Besides texture effects, tensile sample geometry can also play an important role in the final mechanical properties. As can be seen in the sample schematics (Table 3), the rod samples have the exterior layer, which is primarily PCG, removed for the gauge section, while flat samples do not. The inclusion of the PCG layer in the flat samples may reduce the mechanical properties as grains are larger and non-fibrous, like the center of the extrusion. Testing these effects was not performed in this work, but should be considered in any future experiments.

4.3. The Role of the Sc and Zr Additions

The replacement of Mn and Cr with Sc and Zr was shown to beneficially impact the recrystallization performance in terms of the PCG layer thickness, where, for every shape and ER, 6005+ had lower PCG thicknesses. However, in terms of texture development, there was no consistent trend in the reduction of the <100> “cube” texture, which grows via static recrystallization. Given these minor changes in the microstructure, there was still a significant increase in the YS and UTS for 6005+ alloys. Given the nanoscale size of the Al3Sc-Zr dispersoids, there can be some increase in the Orowan strengthening of the extrusion, but the increase is minimized as the primary strengthener in the 6xxx series of alloys is β″-Mg5Si6, which is smaller and has a much higher density than the Al3Sc-Zr dispersoids. Therefore, Orowan strengthening contributions are low, with contributions primarily affecting precipitate spacing, which is important to increasing Orowan strengthening. These findings suggest that the primary increase in strength is a reduction in recrystallization and a small increase in Orowan strengthening. Given the benefits identified with Sc and Zr additions, it is possible that 6005+ alloys can be used for hotter, faster extrusion. This is because hotter, faster extrusion is related to increased recrystallization, which the 6005+ alloy has shown to inhibit.

5. Conclusions

Two extrusion alloys with different dispersoid types were assessed with round and rectangular extrusion profiles at two extrusion ratios to quantify the effects on the mechanical properties and microstructure. Replacement of Mn and Cr with Sc and Zr improves the mechanical properties and reduces the PCG thickness while having minimal effect on the extruded texture for all shapes and extrusion ratios. The best mechanical properties were observed in rod shapes, which can develop a unique dual-fiber texture.
Compared to the baseline 6005A alloy, the following are true:
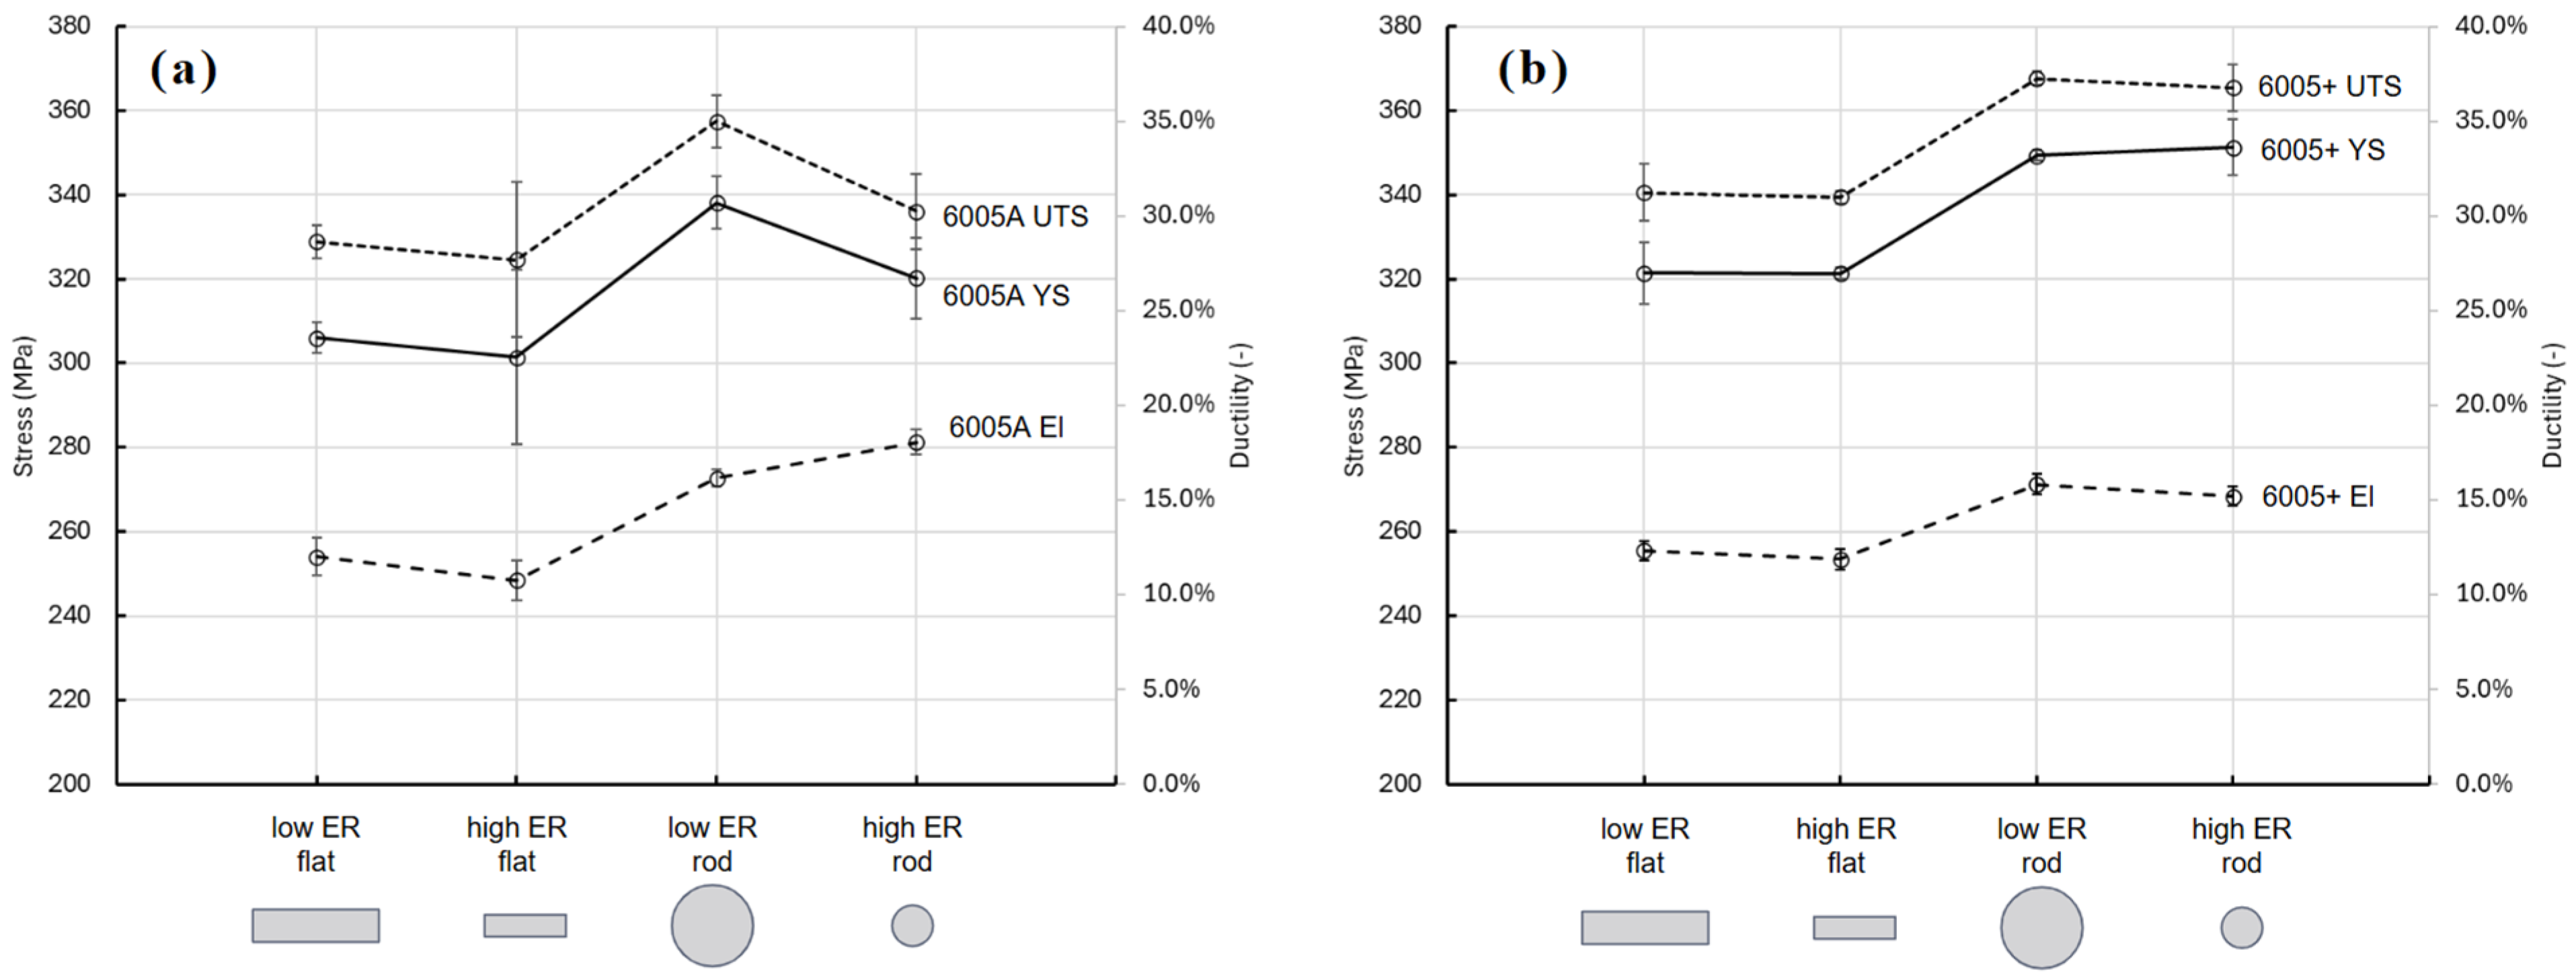
  • The 6005+ alloy with Sc-Zr dispersoids had increased yield strength and UTS for all shapes and extrusion ratios while generally maintaining ductility.
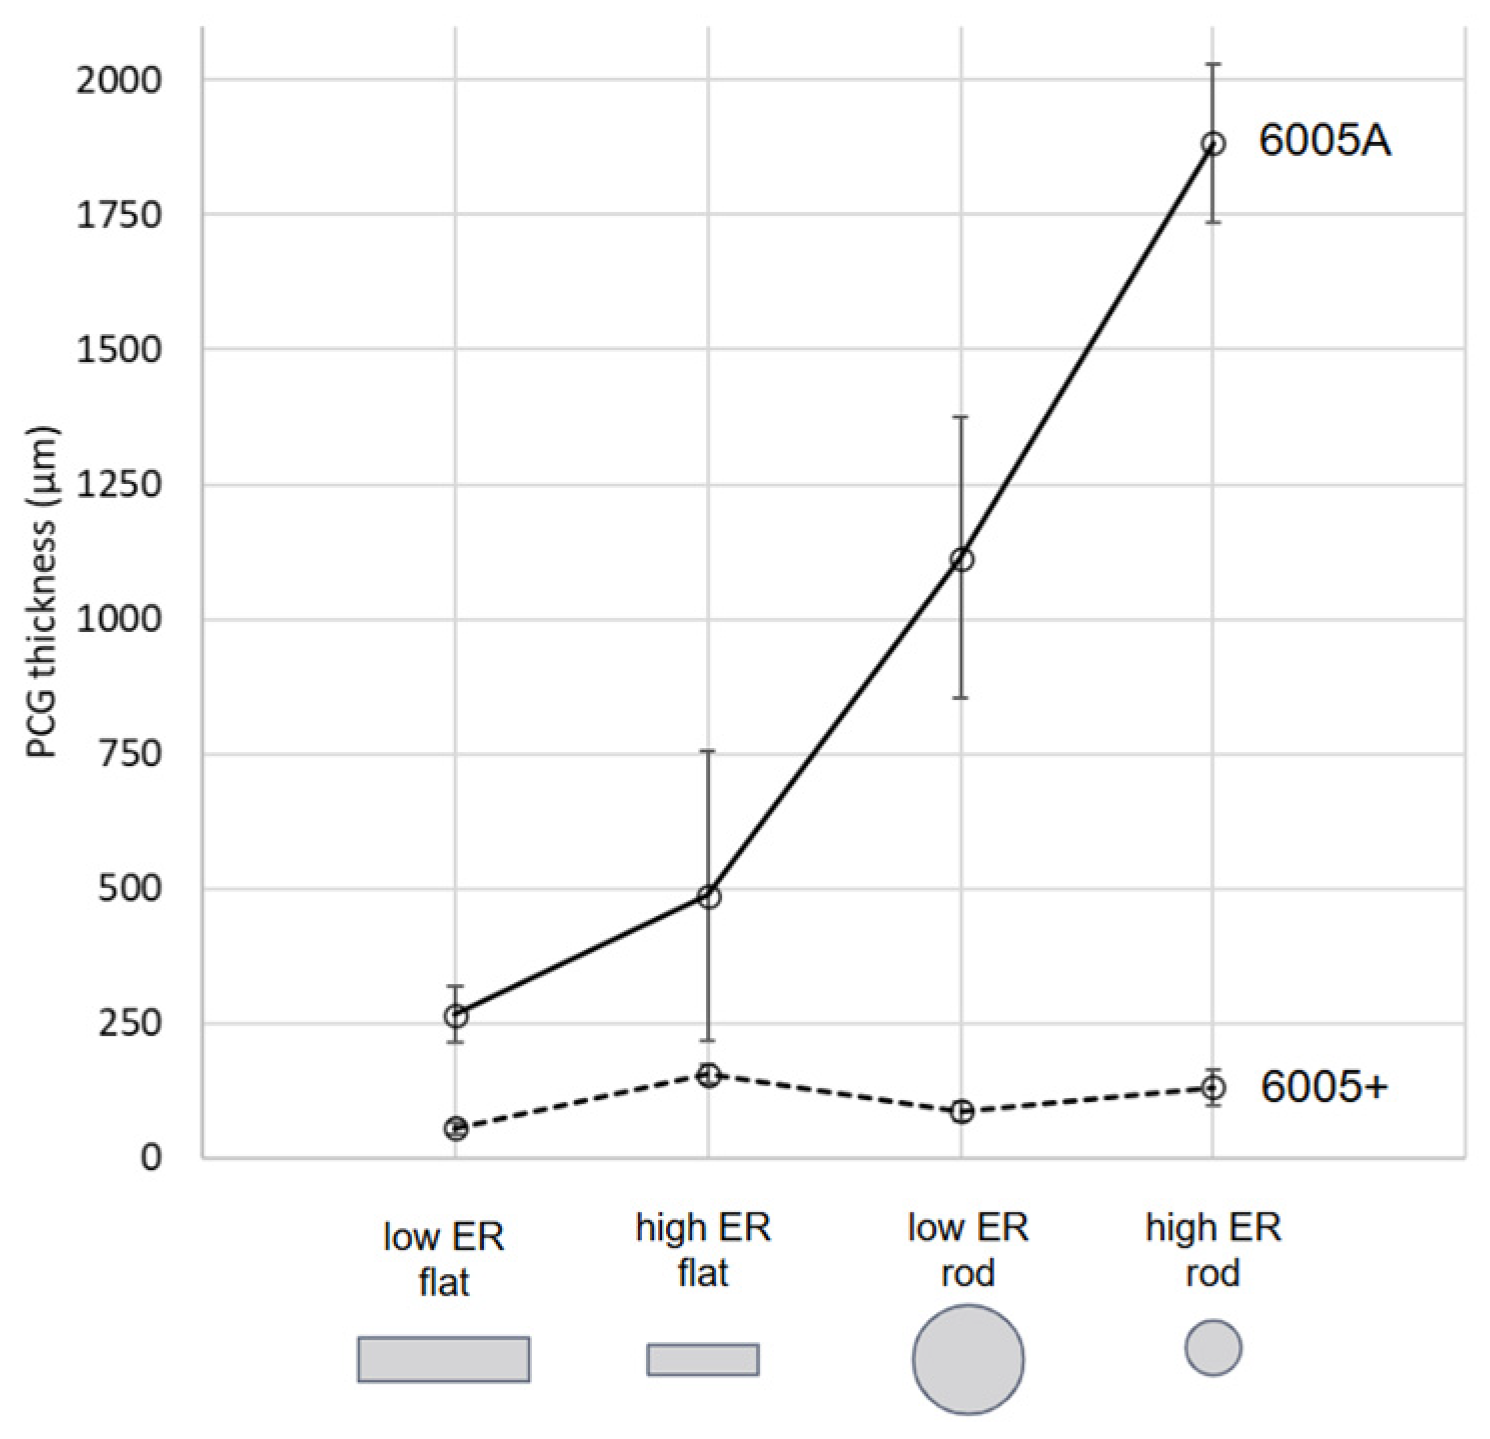
  • The 6005+ alloy has lower PCG thickness for all shapes and extrusion ratios.
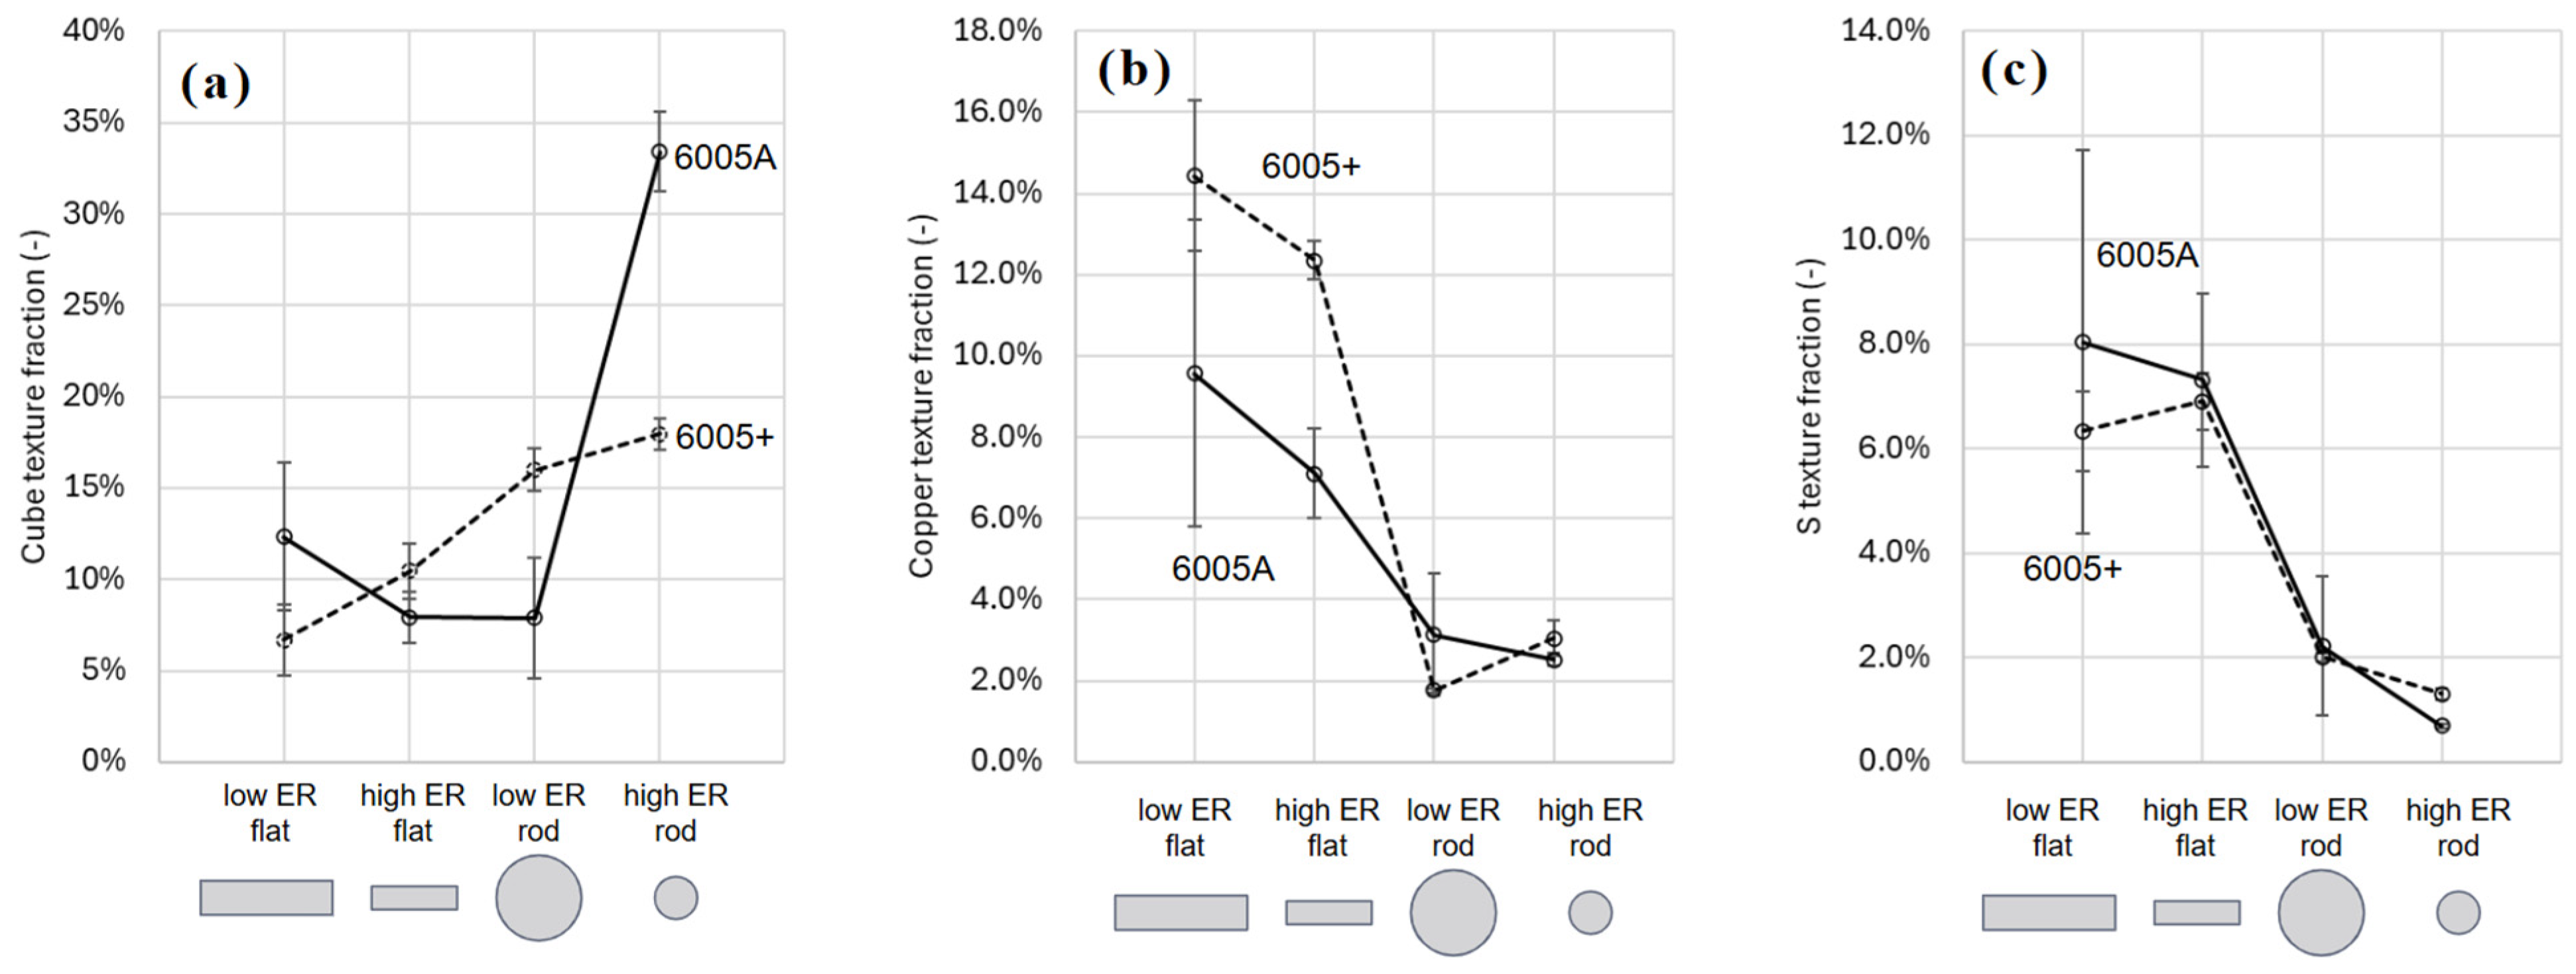
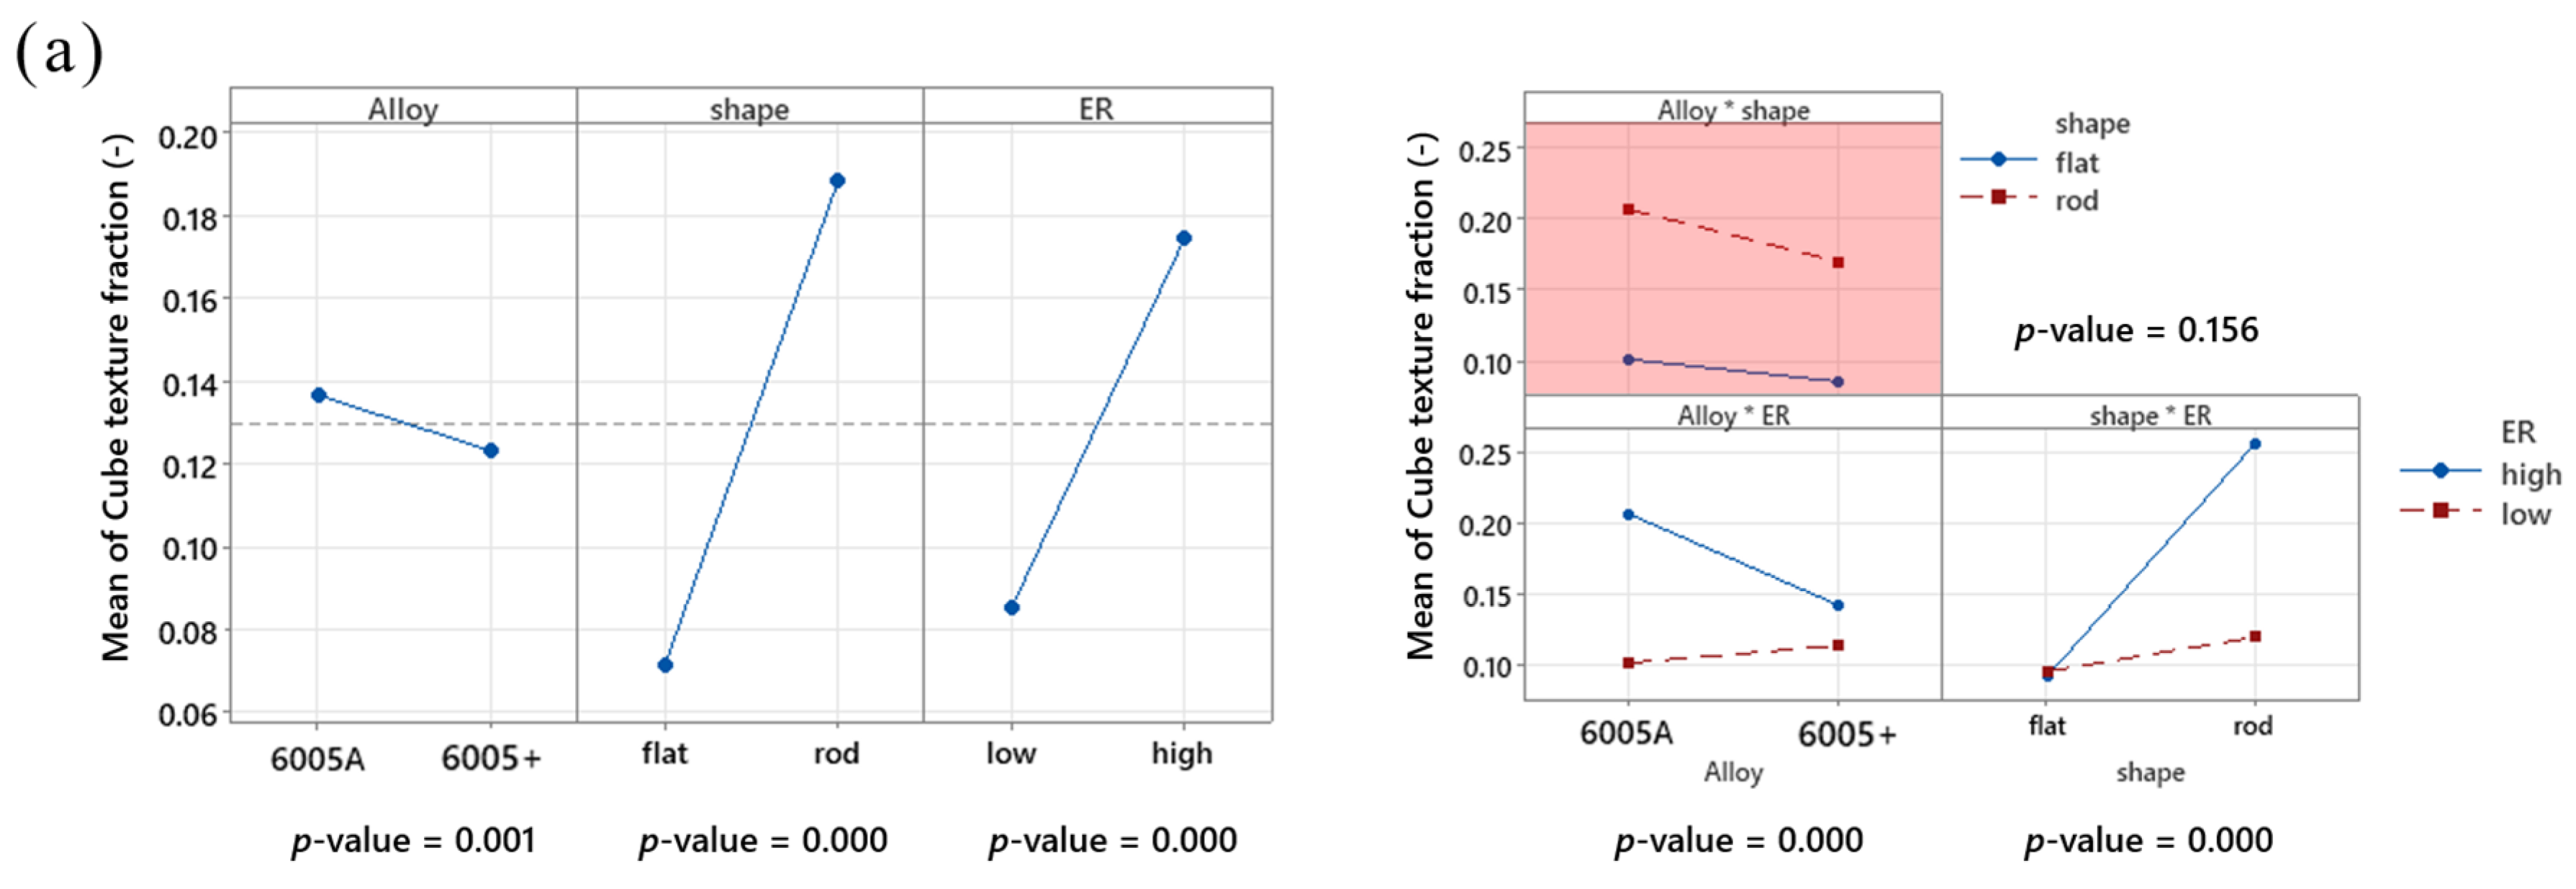
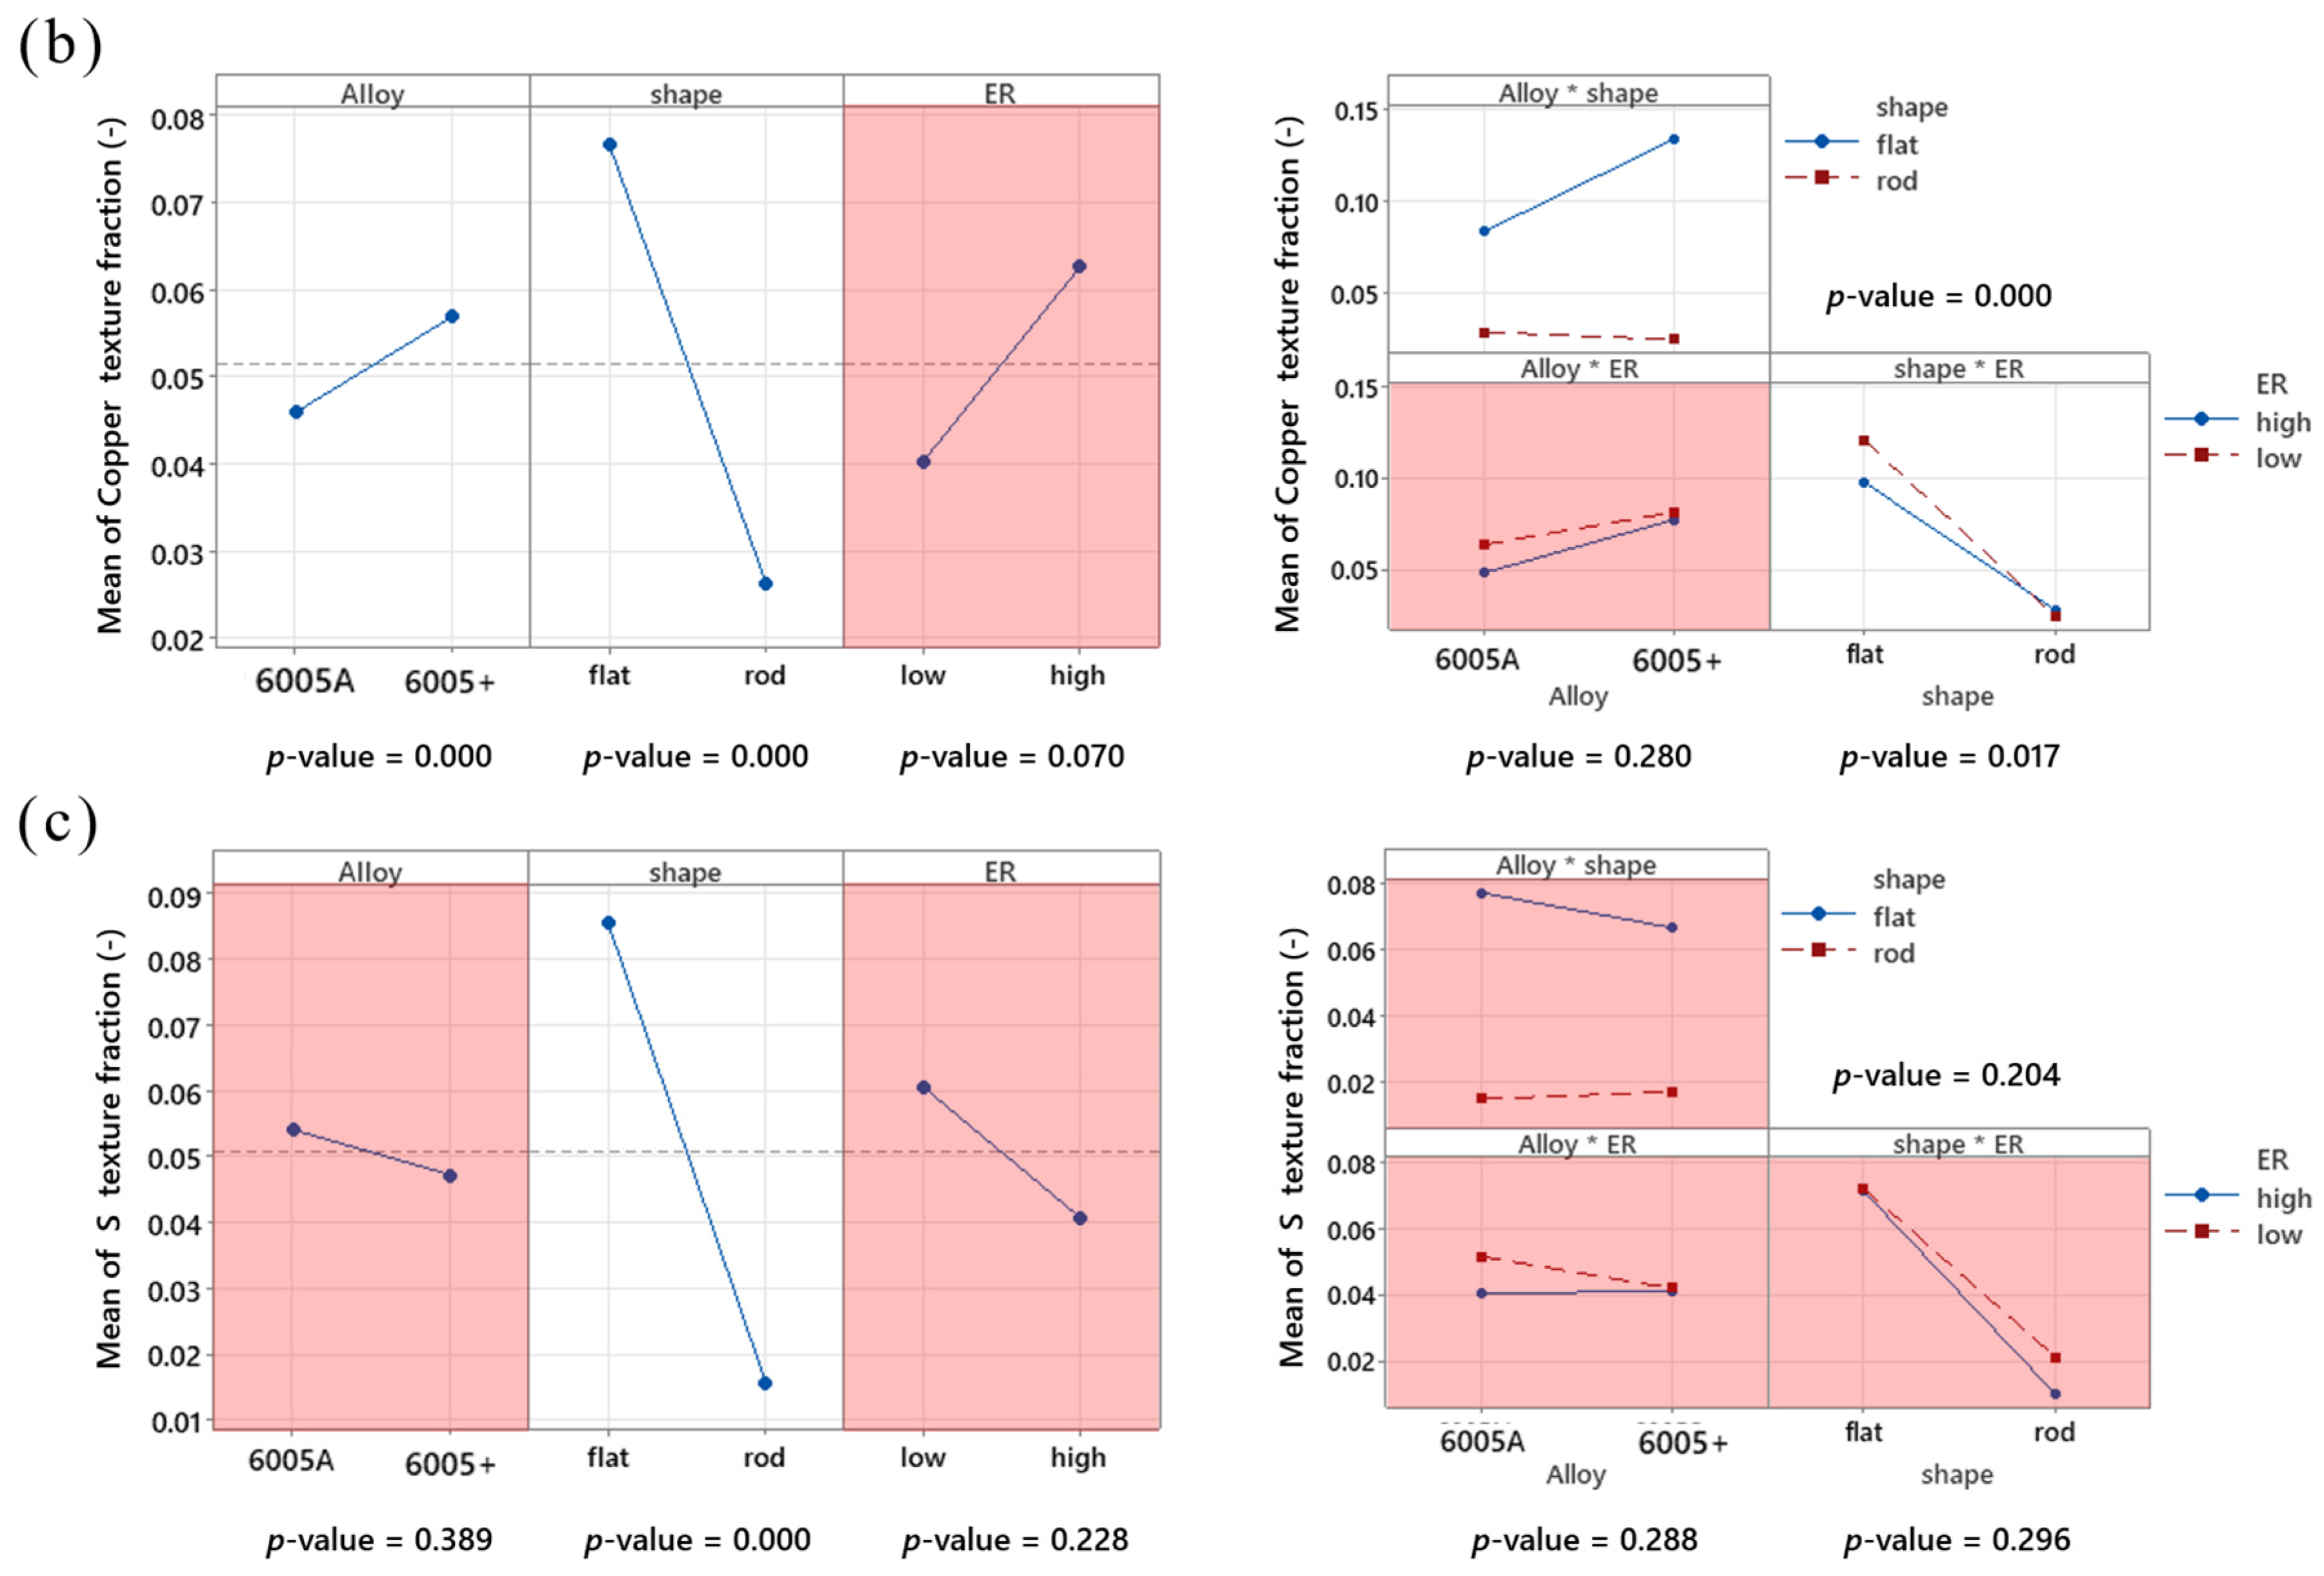
  • The 6005+ alloy had a decrease in the amount of cube texture and an increase in the fraction of copper texture; S texture fractions were unchanged.
Comparing Shape and extrusion ratio, the following are true:
  • Rod shapes had the highest yield strength, UTS, and ductility.
  • Low extrusion ratio improved the yield strength and UTS with no effect on ductility.
  • Rod shapes and high extrusion ratios increase the PCG thickness.
  • Rod shapes formed a characteristic dual fiber texture.
  • Flat shapes favored the copper and S textures.
  • High extrusion ratios promoted cube texture with no effect on copper or S texture formation.

Author Contributions

Conceptualization, E.H., P.S. and T.L.; Methodology, E.H. and T.W.; Software, E.H.; Formal analysis, E.H.; Investigation, E.H. and P.S.; Data curation, E.H.; Writing—original draft, E.H.; Writing—review & editing, P.S., T.W. and T.L.; Funding acquisition, P.S. and T.L. All authors have read and agreed to the published version of the manuscript.

Funding

Funding was provided by Sunrise Energy Metals, Melbourne, VIC 3000, Australia.

Data Availability Statement

The original contributions presented in this study are included in the article. Further inquiries can be directed to the corresponding author.

Acknowledgments

The electron microscopy research was performed at the Applied Chemical and Morphological Analysis Laboratory at Michigan Technological University. The Electron Microscopy facility is supported by NSF MRI 1429232.

Conflicts of Interest

The authors declare no conflicts of interest.

Abbreviations

The following abbreviations are used in this manuscript:
PCGperipheral coarse grain
DC-castingdirect chill casting
ERextrusion ratio
DOEdesign of experiment
TEMtransmission electron microscopy
EDSenergy dispersive spectroscopy
EBSDelectron backscattered diffraction
HAADFhigh-angle annular dark field
BFbright field

Appendix A. Summary Data

Table A1. Mechanical test data.
AlloyProfile NameYield Strength (MPa)UTS (MPa)Ductility (%)
6005Alow ER flat306 ± 4329 ± 412.0% ± 1.0%
6005Alow ER rod338 ± 6357 ± 616.2% ± 0.4%
6005Ahigh ER flat301 ± 21325 ± 1810.8% ± 1.1%
6005Ahigh ER rod320 ± 10336 ± 918.1% ± 0.7%
6005+low ER flat321 ± 7340 ± 712.3% ± 0.5%
6005+low ER rod349 ± 1368 ± 215.8% ± 0.6%
6005+high ER flat321 ± 1339 ± 211.9% ± 0.6%
6005+high ER rod351 ± 7365 ± 515.2% ± 0.5%
Table A2. PCG thickness (μm).
AlloyProfile NamePCG Thickness Minimum PCG Thickness Maximum PCG Thickness
6005Alow ER flat270 ± 50165344
6005Alow ER rod1100 ± 2601511521
6005Ahigh ER flat490 ± 2701691047
6005Ahigh ER rod1890 ± 15015112143
6005+low ER flat56 ± 123488
6005+low ER rod87 ± 1854131
6005+high ER flat155 ± 18119206
6005+high ER rod131 ± 3473199
Table A3. Results of texture analysis in volume percent.
AlloyShapeCubeCopperS
6005Alow ER flat12% ± 4%10% ± 4%8.0% ± 3.7%
6005Alow ER rod8% ± 3%3% ± 1%2.2% ± 1.3%
6005Ahigh ER flat8% ± 1%7% ± 1%7.3% ± 1.7%
6005Ahigh ER rod33% ± 2%2.5% ± 0.2%0.70% ± 0.05%
6005+low ER flat7% ± 2%14% ± 2%6.3% ± 0.8%
6005+low ER rod16% ± 1%1.8% ± 0.1%2.0% ± 0.1%
6005+high ER flat10% ± 2%12.4% ± 0.4%6.9% ± 0.5%
6005+high ER rod18% ± 1%3.0% ± 0.4%1.3% ± 0.1%

References

  1. Dubey, R.; Jayaganthan, R.; Ruan, D.; Gupta, N.; Jones, N.; Velmurugan, R. Energy absorption and dynamic behaviour of 6xxx series aluminium alloys: A review. Int. J. Impact Eng. 2023, 172, 104397. [Google Scholar] [CrossRef]
  2. Parson, N.; Fourmann, J.; Beland, J.-F. Aluminum Extrusions for Automotive Crash Applications. In Proceedings of the WCXTM 17: SAE World Congress Experience, Detroit, MI, USA, 4–6 April 2017; p. 2017-01–1272. [Google Scholar] [CrossRef]
  3. Nick, P. Control of Grain Structure in Al-Mg-Si Extrusions; Aluminum Extruders Council: Wauconda, IL, USA, 2004. [Google Scholar]
  4. Wang, X.; Qin, J.; Nagaumi, H.; Wu, R.; Li, Q. The Effect of α -Al(MnCr)Si Dispersoids on Activation Energy and Workability of Al-Mg-Si-Cu Alloys during Hot Deformation. Adv. Mater. Sci. Eng. 2020, 2020, 1–12. [Google Scholar] [CrossRef]
  5. Chen, J.; Poole, W.J.; Parson, N.C. The effect of through thickness texture variation on the anisotropic mechanical response of an extruded Al-Mn-Fe-Si alloy. Mater. Sci. Eng. A 2018, 730, 24–35. [Google Scholar] [CrossRef]
  6. Li, Y.; Zhao, G.; Sun, L.; Zhang, B.; Zhao, X. Texture evolution induced by extrusion parameters and its effect on strengthening-toughening mechanisms of Al-Mg-Si-Cu-Mn alloys. Mater. Sci. Eng. A 2024, 916, 147377. [Google Scholar] [CrossRef]
  7. Mahmoodkhani, Y.; Chen, J.; Wells, M.A.; Poole, W.J.; Parson, N.C. The Effect of Die Bearing Geometry on Surface Recrystallization During Extrusion of an Al-Mg-Si-Mn Alloy. Metall. Mater. Trans. A 2019, 50, 5324–5335. [Google Scholar] [CrossRef]
  8. Claves, S. Characterization and Analysis of the Localized Deformation of 6xxx Aluminum Alloy Extrudates. Ph.D. Thesis, Lehigh University, Bethlehem, PA, USA, 2002. Available online: https://preserve.lib.lehigh.edu/ (accessed on 4 March 2025).
  9. Chen, J. A Study on the Texture and Microstructure Development in Extruded AA3003 Alloys and the Relevant Mechanical Behaviour; University of British Columbia: Kelowna, BC, Canada, 2018. [Google Scholar]
  10. Solomon, N.; Solomon, I. Effect of die shape on the metal flow pattern during direct extrusion process. Rev. Metal. 2010, 46, 396–404. [Google Scholar] [CrossRef]
  11. Parson, N.; Maltais, A.; Jowett, C. The Influence of Die Bearing Geometry on Surface Recrystallisation of 6xxx Extrusions; Aluminum Extruders Council: Wauconda, IL, USA, 2004. [Google Scholar]
  12. Schmidt, K. Effect of Sc on Recrystalization Resistance of AA7050. Ph.D. Thesis, Houghton, MI, USA, 2023. Available online: https://digitalcommons.mtu.edu/etdr/1453 (accessed on 12 August 2024).
  13. Babaniaris, S.; Ramajayam, M.; Jiang, L.; Varma, R.; Langan, T.; Dorin, T. Effect of Al3(Sc,Zr) dispersoids on the hot deformation behaviour of 6xxx-series alloys: A physically based constitutive model. Mater. Sci. Eng. A 2020, 793, 139873. [Google Scholar] [CrossRef]
  14. Babaniaris, S.; Ramajayam, M.; Jiang, L.; Langan, T.; Dorin, T. Developing an Optimized Homogenization Process for Sc and Zr Containing Al-Mg-Si Alloys. In Light Metals 2019; Chesonis, C., Ed.; Springer International Publishing: Cham, Switzerland, 2019; pp. 1445–1453. [Google Scholar] [CrossRef]
  15. Rometsch, P.; Fourmann, J. Potential for Using Scandium in Extrusion Alloys. In ET ’24 Proceedings; Aluminum Extruders Council: Wauconda, IL, USA, 2024. [Google Scholar]
  16. Dumbre, J.; Kairy, S.K.; Anber, E.; Langan, T.; Taheri, M.L.; Dorin, T.; Birbilis, N. Understanding the formation of (Al,Si)3Sc and V-phase (AlSc2Si2) in Al-Si-Sc alloys via ex situ heat treatments and in situ transmission electron microscopy studies. J. Alloys Compd. 2021, 861, 158511. [Google Scholar] [CrossRef]
  17. Shomali, A.; Langan, T.; Wood, T.; Sanders, P. Sc-Containing Al–Si–Mg (6xxx) Alloys for Automotive Extrusions. In Light Metals 2024; Wagstaff, S., Ed.; Springer International Publishing: Cham, Switzerland, 2024; pp. 1111–1119. Available online: https://link.springer.com/chapter/10.1007/978-3-031-50308-5_140 (accessed on 5 March 2025).
  18. Esterl, F.; Nienaber, M.; Bohlen, J.; Ben Khalifa, N. Connecting texture development to die design in extruded flat products. J. Manuf. Process. 2025, 134, 891–903. [Google Scholar] [CrossRef]
  19. Goik, P.; Schiffl, A.; Höppel, H.W.; Göken, M. The Role of Through-Thickness Variation of Texture and Grain Size on Bending Ductility of Al–Mg–Si Profiles. In Light Metals 2023; Broek, S., Ed.; Springer International Publishing: Cham, Switzerland, 2023; pp. 568–577. [Google Scholar] [CrossRef]
  20. Goik, P.; Schiffl, A.; Höppel, H.W. Formation of Peripheral Coarse Grain in Thin-Walled Al–Mg–Si Extrusion Profiles. Metall. Mater. Trans. A 2023, 54, 3940–3956. [Google Scholar] [CrossRef]
  21. Aluminum Association. International Alloy Designations and Chemical Composition Limits for Wrought Aluminum and Wrought Aluminum Alloys; Aluminum Association: Arlington, VA, USA, 2018. [Google Scholar]
  22. Mainprice, D.; Bachmann, F.; Hielscher, R.; Schaeben, H. Descriptive tools for the analysis of texture projects with large datasets using MTEX: Strength, symmetry and components. Geol. Soc. Lond. Spec. Publ. 2015, 409, 251–271. [Google Scholar] [CrossRef]
  23. Humphreys, J. Texture Analysis: Macrotexture, Microtexture and Orientation Mapping. J. Microsc. 2001, 203, 231–232. [Google Scholar] [CrossRef]
  24. Sheppard, T. Constitutive Equation for use in Prediction of Flow Stress During the Extrusion of Al Alloys. Mater. Sci. Technol. 1997, 13, 203–209. [Google Scholar] [CrossRef]
  25. Van Geertruyden, W.H.; Browne, H.M.; Misiolek, W.Z.; Wang, P.T. Evolution of surface recrystallization during indirect extrusion of 6xxx aluminum alloys. Metall. Mater. Trans. A 2005, 36, 1049–1056. [Google Scholar] [CrossRef]
  26. Van Geertruyden, W.H.; Misiolek, W.Z.; Wang, P.T. Surface grain structure development during indirect extrusion of 6xxx aluminum alloys. J. Mater. Sci. 2005, 40, 3861–3863. [Google Scholar] [CrossRef]
  27. Harsha, K.; Cullity, B.D. Effect of initial orientation on deformation texture and tensile and torsional properties of copper and aluminum wires. Trans. Metall. Soc. AIME 1962, 224, 1189–1194. [Google Scholar]
  28. Zhang, Q.; Xu, X.; Wang, Y. Effect of Mg/Si Ratio on the Bendability and Anisotropic Bend Behavior of Extruded 6000-Series Al Alloy. Materials 2023, 16, 3599. [Google Scholar] [CrossRef] [PubMed]
Figure 1. (a) DC-casting system used to cast the billets, including (b) pour cup, (c) quench system, (d) cast billet, and (e) catch cup. (f) The cast extrusion ingot with section plan (g) top waste section, (h) test billet, and (i) bottom waste section.
Jmmp 09 00168 g001
Figure 2. Description of the homogen-age heat treatment used on the 6005+ alloy and how the microstructure should theoretically evolve.
Jmmp 09 00168 g002
Figure 3. Locations where anodizing, EBSD, and TEM foil samples were taken from in the rod or sheet extrusions.
Jmmp 09 00168 g003
Figure 4. Summary of the YS, UTS, and ductility for the (a) 6005A alloy and (b) 6005+ alloy.
Jmmp 09 00168 g004
Figure 5. The main effect and interaction plot for the mechanical properties given the alloy, shape, and extrusion ratio (a) yield strength, (b) UTS, and (c) ductility.
Jmmp 09 00168 g005
Figure 6. PCG region revealed by anodizing for the 6005A alloy (a) low ER flat, (b) low ER rod, (c) high ER flat, (d) high ER rod, and the 6005+ alloy for the (e) low ER flat, (f) low ER rod, (g) high ER flat, and (h) high ER rod.
Jmmp 09 00168 g006
Figure 7. Summary of PCG thickness for 6005A and 6005+ given the change in shape and ER.
Jmmp 09 00168 g007
Figure 8. The main effects and interaction plot for PCG thickness given changes in alloy, shape, and ER.
Jmmp 09 00168 g008
Figure 9. IPF Z maps of 6005A alloy for (a) low ER flat, (b) low ER rod, (c) high ER flat, (d) high ER rod, and the 6005+ alloy for the (e) low ER flat, (f) low ER rod, (g) high ER flat, (h) high ER rod.
Jmmp 09 00168 g009
Figure 10. Pole figures of the {100} orientation for the 6005A alloy for (a) low ER flat, (b) low ER rod, (c) high ER flat, (d) high ER rod, and the 6005+ alloy for the (e) low ER flat, (f) low ER rod, (g) high ER flat, (h) high ER rod.
Jmmp 09 00168 g010
Figure 11. Pole figures of the {110} orientation for the 6005A alloy give the (a) low ER flat, (b) low ER rod, (c) high ER flat, (d) high ER rod, and the 6005+ alloy for the (e) low ER flat, (f) low ER rod, (g) high ER flat, (h) high ER rod.
Jmmp 09 00168 g011
Figure 12. Pole figures of the {111} orientation for the 6005A alloy give the (a) low ER flat, (b) low ER rod, (c) high ER flat, (d) high ER rod, and the 6005+ alloy for the (e) low ER flat, (f) low ER rod, (g) high ER flat, (h) high ER rod.
Jmmp 09 00168 g012
Figure 13. Band contrast maps showing the fine subgrain structure for the 6005A alloy forgive the (a) low ER flat, (b) low ER rod, (c) high ER flat, (d) high ER rod, and the 6005+ alloy for the (e) low ER flat, (f) low ER rod, (g) high ER flat, (h) high ER rod.
Jmmp 09 00168 g013
Figure 14. Results of texture analysis for 6005A and 6005+ (a) cube texture fraction, (b) copper texture fraction, and (c) S texture fraction.
Jmmp 09 00168 g014
Figure 15. The main effects and interaction plots given the effects of alloy, shape, and extrusion ratio for (a) cube texture, (b) copper texture, and (c) S texture.
Jmmp 09 00168 g015aJmmp 09 00168 g015b
Figure 16. TEM images from the low extrusion ratios flat in the ST direction for 6005A. (a) HAADF imaging highlighting the Mn and Cr containing dispersoids highlighted by the dark phase with a pill shaped morphology, (b) selected area HAADF image, (c) selected area BF image, (d) EDS map of Cr, (e) EDS map of Si, (f) EDS map of Mn, (g) EDS map of Fe.
Jmmp 09 00168 g016
Figure 17. TEM images from the high ER rod, looking at the ST directions for the 6005+ alloy. (a) HAADF imaging highlighting the Al3Sc-Zr dispersoids having a spherical morphology and dark color, (b) selected area HAADF image of eight dispersoid, (c) selected area BF image of eight dispersoids highlighted with the red arrows are the Sc and Zr containing dispersoids and the purple arrow identifies the Mn and Fe dispersoid, (d) EDS map of Mn, (e) EDS map of Zr, (f) EDS map of Fe, and (g) EDS map of Sc.
Jmmp 09 00168 g017
Figure 18. TEM image of the Al3Sc-Zr dispersoid from the high ER rod, looking in the ST direction for the 6005+ alloy, highlighting the Sc and Zr content of a single dispersoid to see if the core–shell structure was formed. (a) HAADF image, (b) BF image, (c) EDS map of Zr, (d) EDS map of Sc, and (E) EDS line scan from the selected area crossing the Al3Sc-Zr dispersoid.
Jmmp 09 00168 g018
Figure 19. Strain results for the (a) high ER rod, (b) high ER flat, (c) low ER rod, and (d) low ER flat. Labeled in the figure are a selection of strain values and the exit temperature.
Jmmp 09 00168 g019
Table 1. Target and cast composition in (wt%).
AlloySiMgCuMnCrZrScFeTi
Target 6005A0.550.550.30.20.1--0.2<0.01
Cast
6005A
0.57 ± 0.010.54 ± 0.02 0.28 ± 0.010.19 ± 0.0020.094 ± 0.002--0.24 ± 0.01 0.01 ± 0.001
Target
6005+
0.550.550.30.05-0.160.080.2<0.01
Cast
6005+
0.59 ± 0.020.48 ± 0.02 0.25 ± 0.020.047 ± 0.02-0.23 ± 0.020.090 ± 0.020.21 ± 0.02 0.01 ± 0.02
Table 2. Extrusion profiles, ratios, and extrusion speeds.
NameProfile DimensionsExtrusion RatioExtrusion Speed
low ER flat60 mm × 4 mm28125 mm/min
low ER rod19.05 mm Ø24125 mm/min
high ER flat30.5 mm × 2.5 mm9150 mm/min
high ER rod9.5 mm Ø9650 mm/min
Table 3. Mechanical polishing steps. Polishing consumables were from Allied High Tech Product, Inc.
StepAbrasiveLubricantTimeSpeedPressure
1600 gritwater3 min200 RPM20 N
2800 gritwater3 min200 RPM20 N
31200 gritwater5 min200 RPM20 N
41 μm diamond paste Kempadred lubricant5 min 150 RPM5 N
51 μm diamond paste Imperial Padred lubricant5 min150 RPM5 N
60.05 μm non-crystalizing colloidal silica Imperial Padnone5 min100 RPM5 N
7Imperial Padwater30 s100 RPM5 N
Table 4. Apreo 2 and AZtech EBSD settings.
Accelerating voltage20 kV
Spot size26 ns
Working distance12 mm to 15 mm
Tilt70°
Image resolution1024 pixels
Capture time35 s
Mapping resolution256 pixels
Table 5. Common textures in aluminum alloy extrusions [23].
NameMiller Indices
{hkl}<uvw>
Euler Angles
φ1 Φ φ2
Cube{001}<100>0°, 0°, 0°/90°
Copper (Cu){112}<111>90°, 30°, 45°
S{123}<634>59°, 34°, 65°
Brass(Bs){011}<211>35°, 45°, 0°/90°
Goss{011}<100>0°, 45°, 0°/90°
Disclaimer/Publisher’s Note: The statements, opinions and data contained in all publications are solely those of the individual author(s) and contributor(s) and not of MDPI and/or the editor(s). MDPI and/or the editor(s) disclaim responsibility for any injury to people or property resulting from any ideas, methods, instructions or products referred to in the content.

