2. Literature Review
One key factor to obtaining good-quality 3D printing is to assess the judicious printing parameters, such as laser speed, layer thickness, fusion temperature, and material type [
4,
5,
6,
7,
8,
9,
10,
11]. Incorrect choice parameters can lead to a number of problems, including micro-porosities [
12], unwanted distortions, deteriorated mechanical properties, anisotropy effects [
13], and reduced resistance to fatigue [
11,
12,
13,
14].
Several studies were conducted in order to establish a correlation between the machine parameters and the resulting effects. For instance, according to [
14], it is suggestable to have an energy density above 30 J/mm
3. The energy density,
E =
P/(
vHe), is a function of the laser power
P, the velocity of the scan
v, the layer thickness
e, and the hatch distance
H. In the aforementioned study, the porosity was measured as a relative density by using two different methods: Archimedes’ method and CT scanning. These showed that between 10 and 30 J/mm
3, the relative density can pass from 98% to 85% at the lower energy. In the study of [
15], a small part printed in AlSi10MG, utilizing typical process parameters and an energy density of 180 J/mm
3, determined that 85.22% of the defects had a diameter of 0.060 mm <
d < 0.11 mm, 29.16% had 0.09 mm <
d < 0.14 mm, and only 0.54% had 0.18 mm <
d < 0.23 mm, with the latter most likely being keyhole pores. The porosity of the material was found to be less than 1%. Despite the potential for microstructural properties to influence the mechanical properties in LPBF, they remain comparable to traditional methods such as forging or casting. Moreover, post-manufacturing treatments remain a possibility and offer advantages analogous to those observed for conventional methods, as assessed in [
4,
5,
16], while measurement techniques and their assessments are fundamental steps to determine with accuracy potential defects and accuracy of the manufactured object [
17,
18].
Recent advancements in the field have seen the emergence of neural networks as a useful tool, with the potential to combine process parameters in order to ascertain optimal conditions for achieving high-quality prints [
8,
9,
10]. In addition to microstructural changes and the parameters, there are some challenges inherent to the geometry itself that have yet to be fully addressed [
19,
20]. This work aims to enhance the existing body of knowledge and expertise in the field of AM design by leveraging topology optimization as a design method [
1,
2,
3,
4]. Topology optimization is a pivotal aspect of this work because it facilitates the definition of the geometry of the refrigeration block by optimizing the volume of a novel design incorporating a spiral embedded cooling pipe.
Topology optimization is a highly efficient method for decreasing the weight of a component. As with every optimization problem, it is important to establish the objective function and find its maximum by changing the geometry. Objectives may include the global stiffness, the minimum modal frequency, the maximum dissipation heat, the maximum flow within a hollow cylinder, or a combination of these factors [
21,
22]. The present study focuses on the search for the maximum stiffness (or minimum compliance) of the structure. Therefore, its aim is to determine the minimum volume that will have a maximum global stiffness. The primary variable under consideration is the volume and its function, while the change of material distribution is defined as a topology function and varies for different methods [
21,
22,
23,
24,
25,
26,
27,
28,
29].
AM is the technology that is most suited to the challenge of geometry that is obtained through topological optimization analyses. Traditional methods, such as casting, will be more complicated than the use of AM, which still faces challenges when it needs to be implemented. One of the main challenges is represented by the material quality and related possible defects, such as cracks, porosity, and a limited number of materials that can be used in AM [
9,
30,
31]. However, the adaptability to complex geometry is very suitable for different cases and is already well used in the industry to produce prototypes before going for large-scale productions. Sometimes, it can be used in conjunction with other conventional techniques, such as die casting, in order to produce the mold. Among the AM techniques for metal, the ones with powder beds are the most used, and SLM is one of the most reliable ones. To perform the 3D print with such a technique, it is essential to understand the parameters involved in the print, as they determine the final quality of the manufactured object [
4,
6,
7,
30]. ITACAe has developed software that is able to simulate the 3D printing process and determine the effectiveness of the parameters on the final distortions and, overall, the behaviors of the print in terms of temperature field, displacement field, and residual stresses. A study to validate such an application resulted in a good correlation between the analyses and the measured data [
19]. However, not only the manufacturing itself presents challenges but also the preparation of the geometry, which needs to be performed accurately in order to avoid problems in the following phases of the manufacturing process. In fact, it is necessary to define a feasibility check on the geometry to avoid features that will be difficult to print, such as low thickness, sharp edges, or supports difficult to remove. This phase of AM feasibility has to take into account the limits of the technology itself, together with the limits of the machine used; hence, their choice will directly influence the feasibility. It is also noteworthy that even in the case of additive manufacturing, there are several software dedicated to the simulation of the process. The most famous commercial software houses, such as Ansys, Abaqus Simulia, MSC Nastan, and Patran, have embedded suites dedicated to AM. However, there is also more specialized software, such as Genoa Alphastar. The latter is particularly interesting because it can relate the porosity properties, which result in an anisotropic behavior of the mechanical properties. Such differences can be evaluated by the analysis, providing a useful tool to simulate fused deposition modeling (FDM) technology.
Apart from topology optimization, another method to obtain a reduction in weight without losing performance is the generative design approach. Compared to the conventional FE method, this approach relies on artificial intelligence (AI) and machine learning (ML) algorithms [
10], and it uses a parametric optimization method. Some examples of generative design were also produced during this work to make a comparison with the current methods used. Additive manufacturing results in competitive technology, and, although the present work assessed a powder laser-based technology, other technologies can be used to explore how to further improve the approach or assess their efficacy, such as direct energy deposition, which is very suitable and efficient for repair purposes [
17,
32,
33]. Moreover, the choice of materials can be further explored, since AM is increasing the range of alloys that can be used [
30,
31,
34,
35,
36,
37].
3. Methodology
The technical feasibility that is part of this work aims to first demonstrate, as a proof of concept, the workflow of the topology optimization geometry created by dedicated software for topology optimization. Once the geometry is defined, and the DfAM is completed by evaluating the feasibility and potential defects on the geometry, the object can be printed. A subsequent phase consists of measuring the printed object and comparing these results with the nominal ones in order to understand the differences between them.
The original geometry is part of a robotic arm that is used to mix two liquid components, i.e., isocyanate and polyol, to produce a polyurethane foam for thermal covers and other applications. This study is a continuation of an innovative design [
20] of two parts of the assembly shown in
Figure 1, which are the mixer head and the refrigeration block.
Both components are presented, although more attention is dedicated to the latest work, which is the refrigeration block, also measured with X-ray computed tomography (CT). The latter will be improved not only in terms of weight but also on the refrigeration system itself, because it will contain new ducts for the refrigeration. The topology optimization is performed with software called CAESS ProTOp, V6.2 which was developed for topology optimization only.
Figure 2 shows the initial geometry that is used for the topology optimization of the refrigeration block with a mesh of tetrahedral elements, including the new spiral ducts. The topology optimization analysis is performed based on a gradient method, such as bidirectional evolutionary structural optimization, i.e., BESO, which effectively means to minimize the compliance, which is the objective function:
where
is the compliance tensor,
is the vector of the forces,
is the vector of displacements, and
is the stiffness tensor., Additional condition to the problem is the variation of the volume, which is obtainable by the following:
where
is a value that goes from 0 to 1 and
is the wanted volume at which to find the minimum compliance. Such a condition is reached after several steps, and, at each step, the compliance is calculated with an FE analysis, which includes the loading and boundary conditions of the problem.
Therefore, the FE should have the geometry loaded in its working conditions plus an additional load representing the surfaces that are not intended to be eliminated, such as the hole for the screws or other surfaces to maintain parts that are not loaded (i.e.,: definition of the design and non-design volumes). Once the FEM is ready, the optimization can be performed with ProTOp, and several attempts should be made in order to find out a geometry more suitable for the current study.
As described in the introduction, some surface irregularities occur due to the elimination of the elements, but there are some functions in the software, such as smoothing or surface optimization, that can correct some of the problems. However, such functions may not be enough to correct the geometry and make the object feasible for AM. One solution to this problem is to work on the design after the topology optimization, adding volume where necessary to avoid undesired effects, such as voids or hanging features. Another approach is to differentiate the FEM by applying different loading conditions, even if they are not actually loaded during service conditions. The last attempt is to use some of the ProTOp parameters to adjust the numerical quality and directly affect the topology optimization itself.
Although the use of different topology optimization methods or more sophisticated software could avoid some of the loops mentioned, the feasibility of AM is always suggested because there are some particular features that need to be checked before sending the geometry to the 3D machine. Some of these checks include minimum thicknesses, the orientation of the object in the machine, and supports that are created. For this phase, two software are particularly useful: Magics, which is used to check the minimum thickness, and AMTOP
®, V2.1 which can create the support for the 3D printer that best optimizes the manufacturing in terms of reduced material waste, printing time, and final quality of the object [
32]. The software AMTOP
® was implemented at ITACAe in collaboration with SIMTECH Simulation and technologies which developed the GUI.
Additionally, extra manufacturing is considered in the current approach: CNC machining to ensure that the required tolerances are respected, particularly in the inner cylinder, which is part of the non-volume design and is well suited for CNC machining. For this reason, the demonstrator to be printed will be a semi-working one; hence, final adjustments will be necessary, such as increasing the thickness in the areas where CNC will be performed.
After the object is manufactured, some measurements are performed to check the geometry obtained with the nominal and to find out the error encountered to evaluate how much the 3D printing process has affected the initial design. Moreover, to further assess the technology from the material and process parameters point of view, an evaluation of the porosity will be performed to verify the quality of the manufacturing.
A validation of the design will be performed via FE with static and thermal analyses. The latter will prove the efficiency of the new design also from the thermal point of view. The refrigeration block has a new refrigeration system, which has been topologically optimized, and a comparison of the temperature distribution and comparing the heat flows can demonstrate increased efficiency.
3.1. Topology Optimization for DfAM: Workflow Methodology
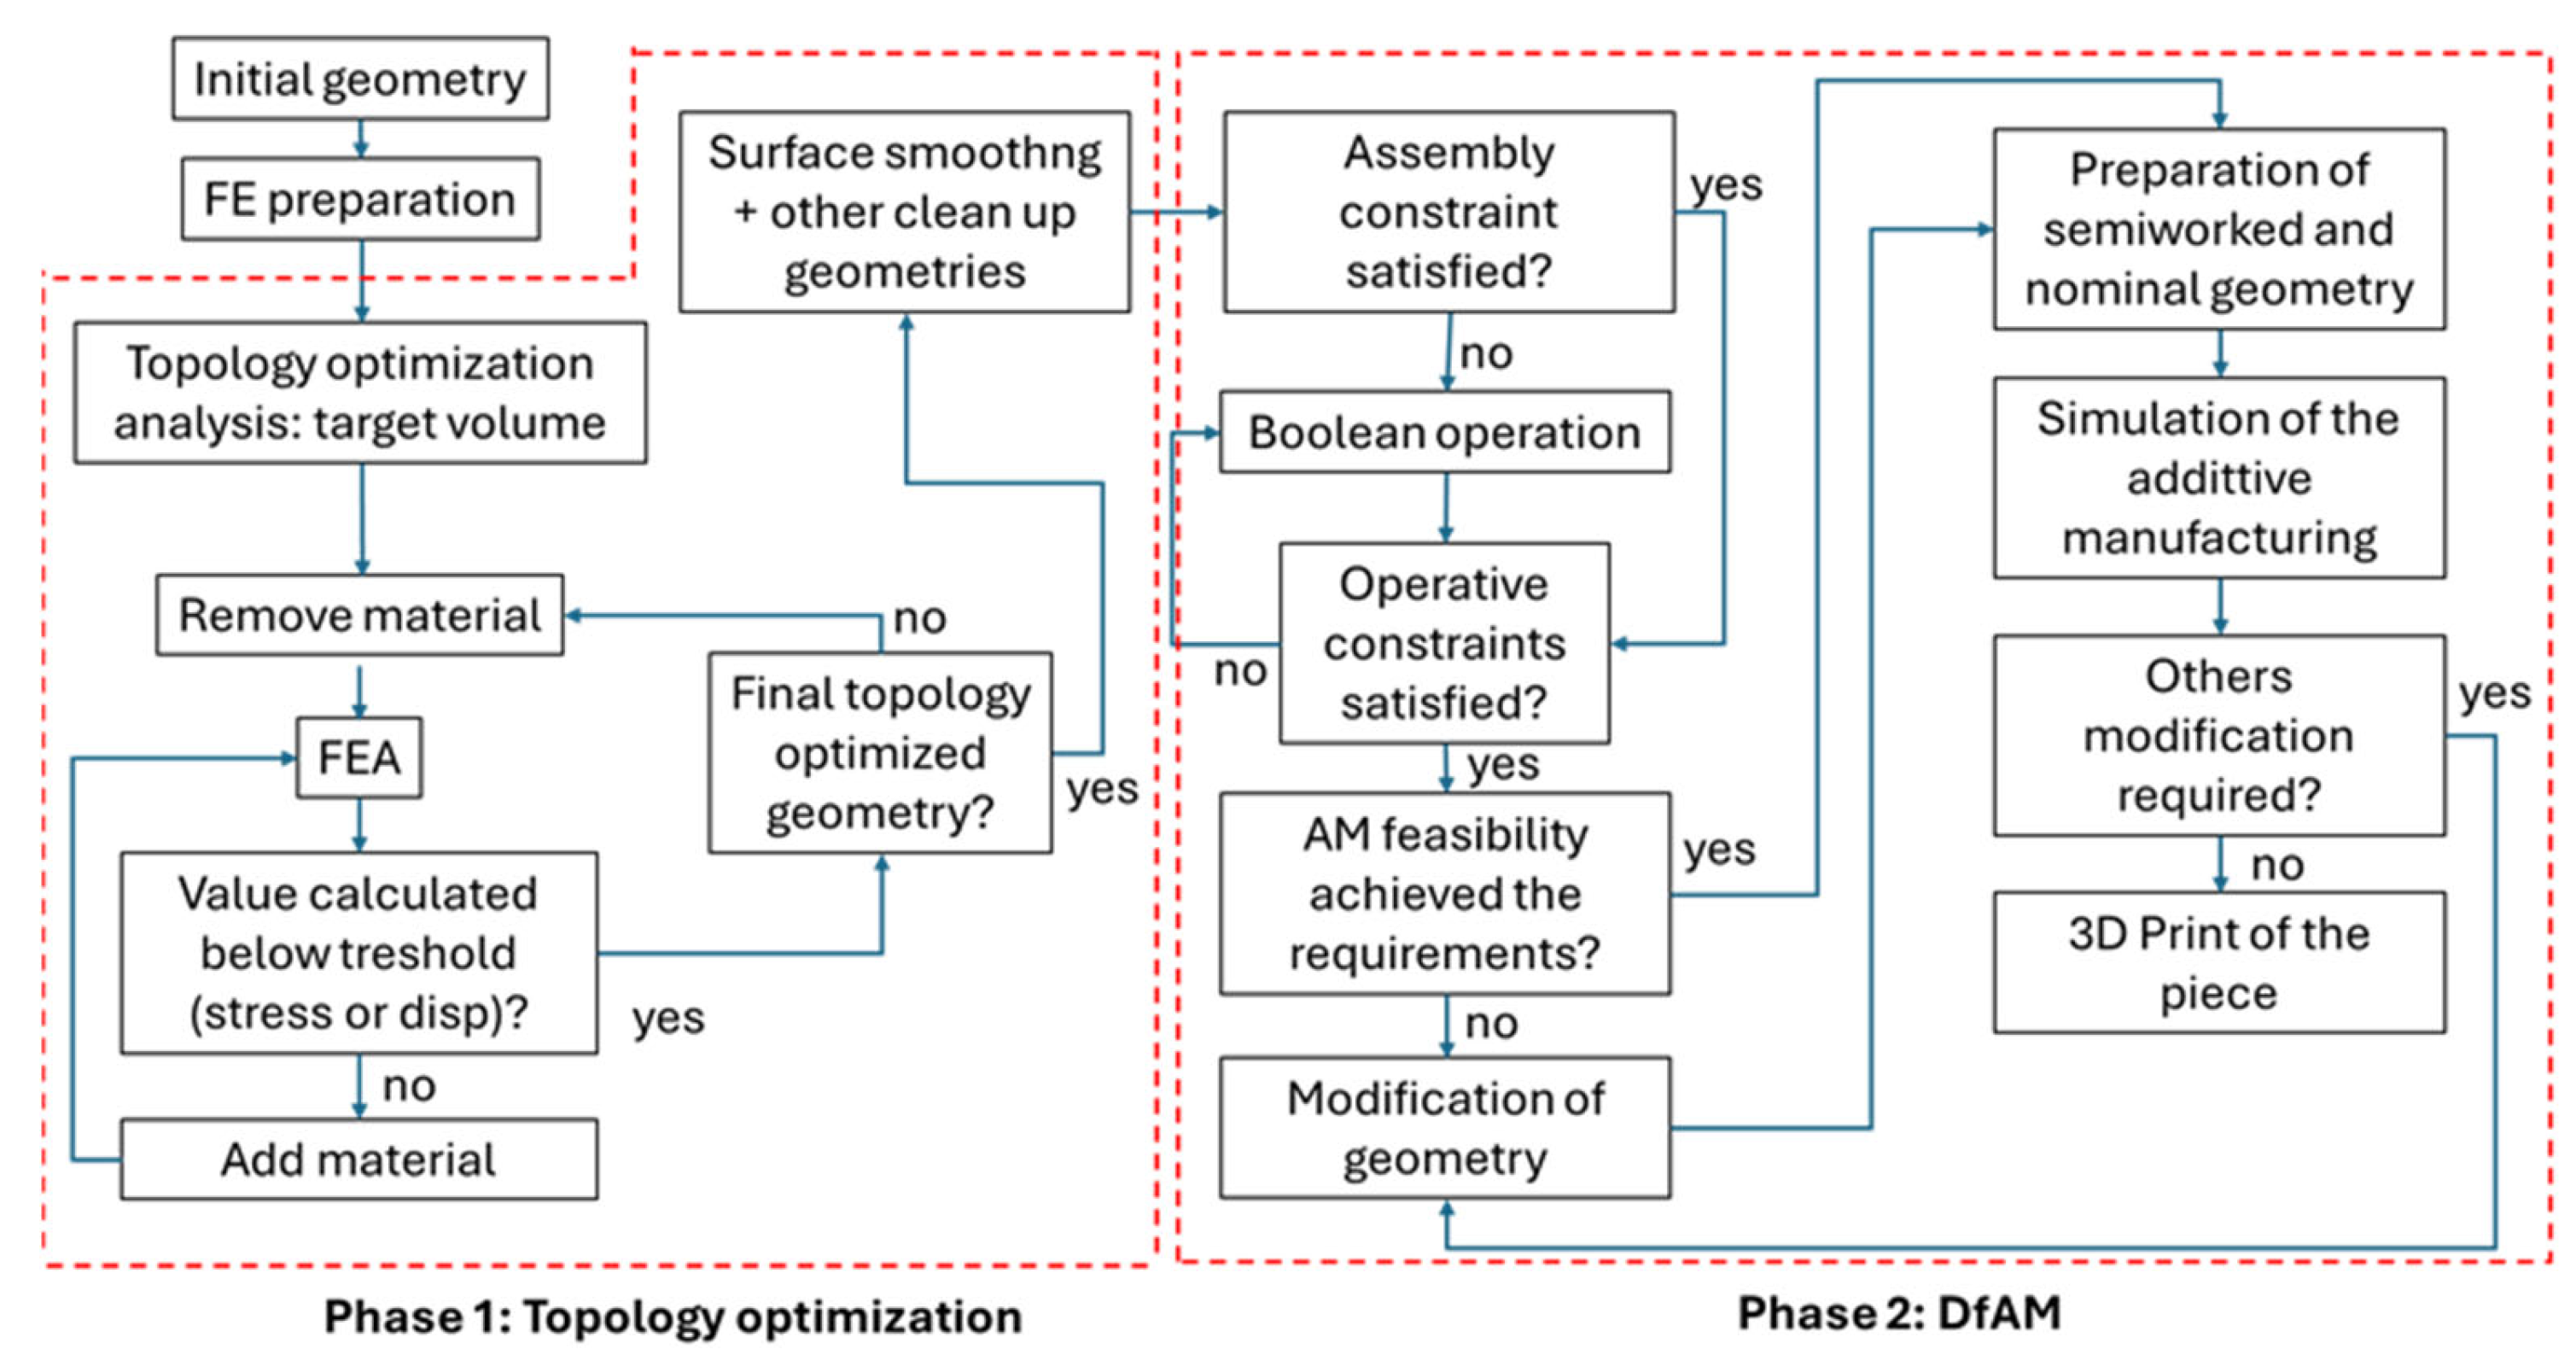
To make the best use of the topology optimization analysis for additive manufacturing during this study, a workflow has been defined in order to ensure that an efficient approach is followed and that the technology is compatible with the design obtained, as presented in
Figure 3. Therefore, two main phases are defined: (a) the design phase with the definition of the geometry for the topology optimization; (b) the DfAM phase, where the understanding of the technology, in this case the AM powder bed fusion, is required.
To obtain a geometry that can be used for AM and avoids the problems described above, three approaches can be summarized as follows:
Implementation of topology optimization algorithm.
Boolean operations on the topology-optimized geometry.
Modification of the FE model by changing the loads.
The first approach requires modifications to the mathematical equations that need to be implemented in software codes, but the predetermined software that is used to perform the topology optimization does not allow for the following of this route. The second approach was used in a previous work [
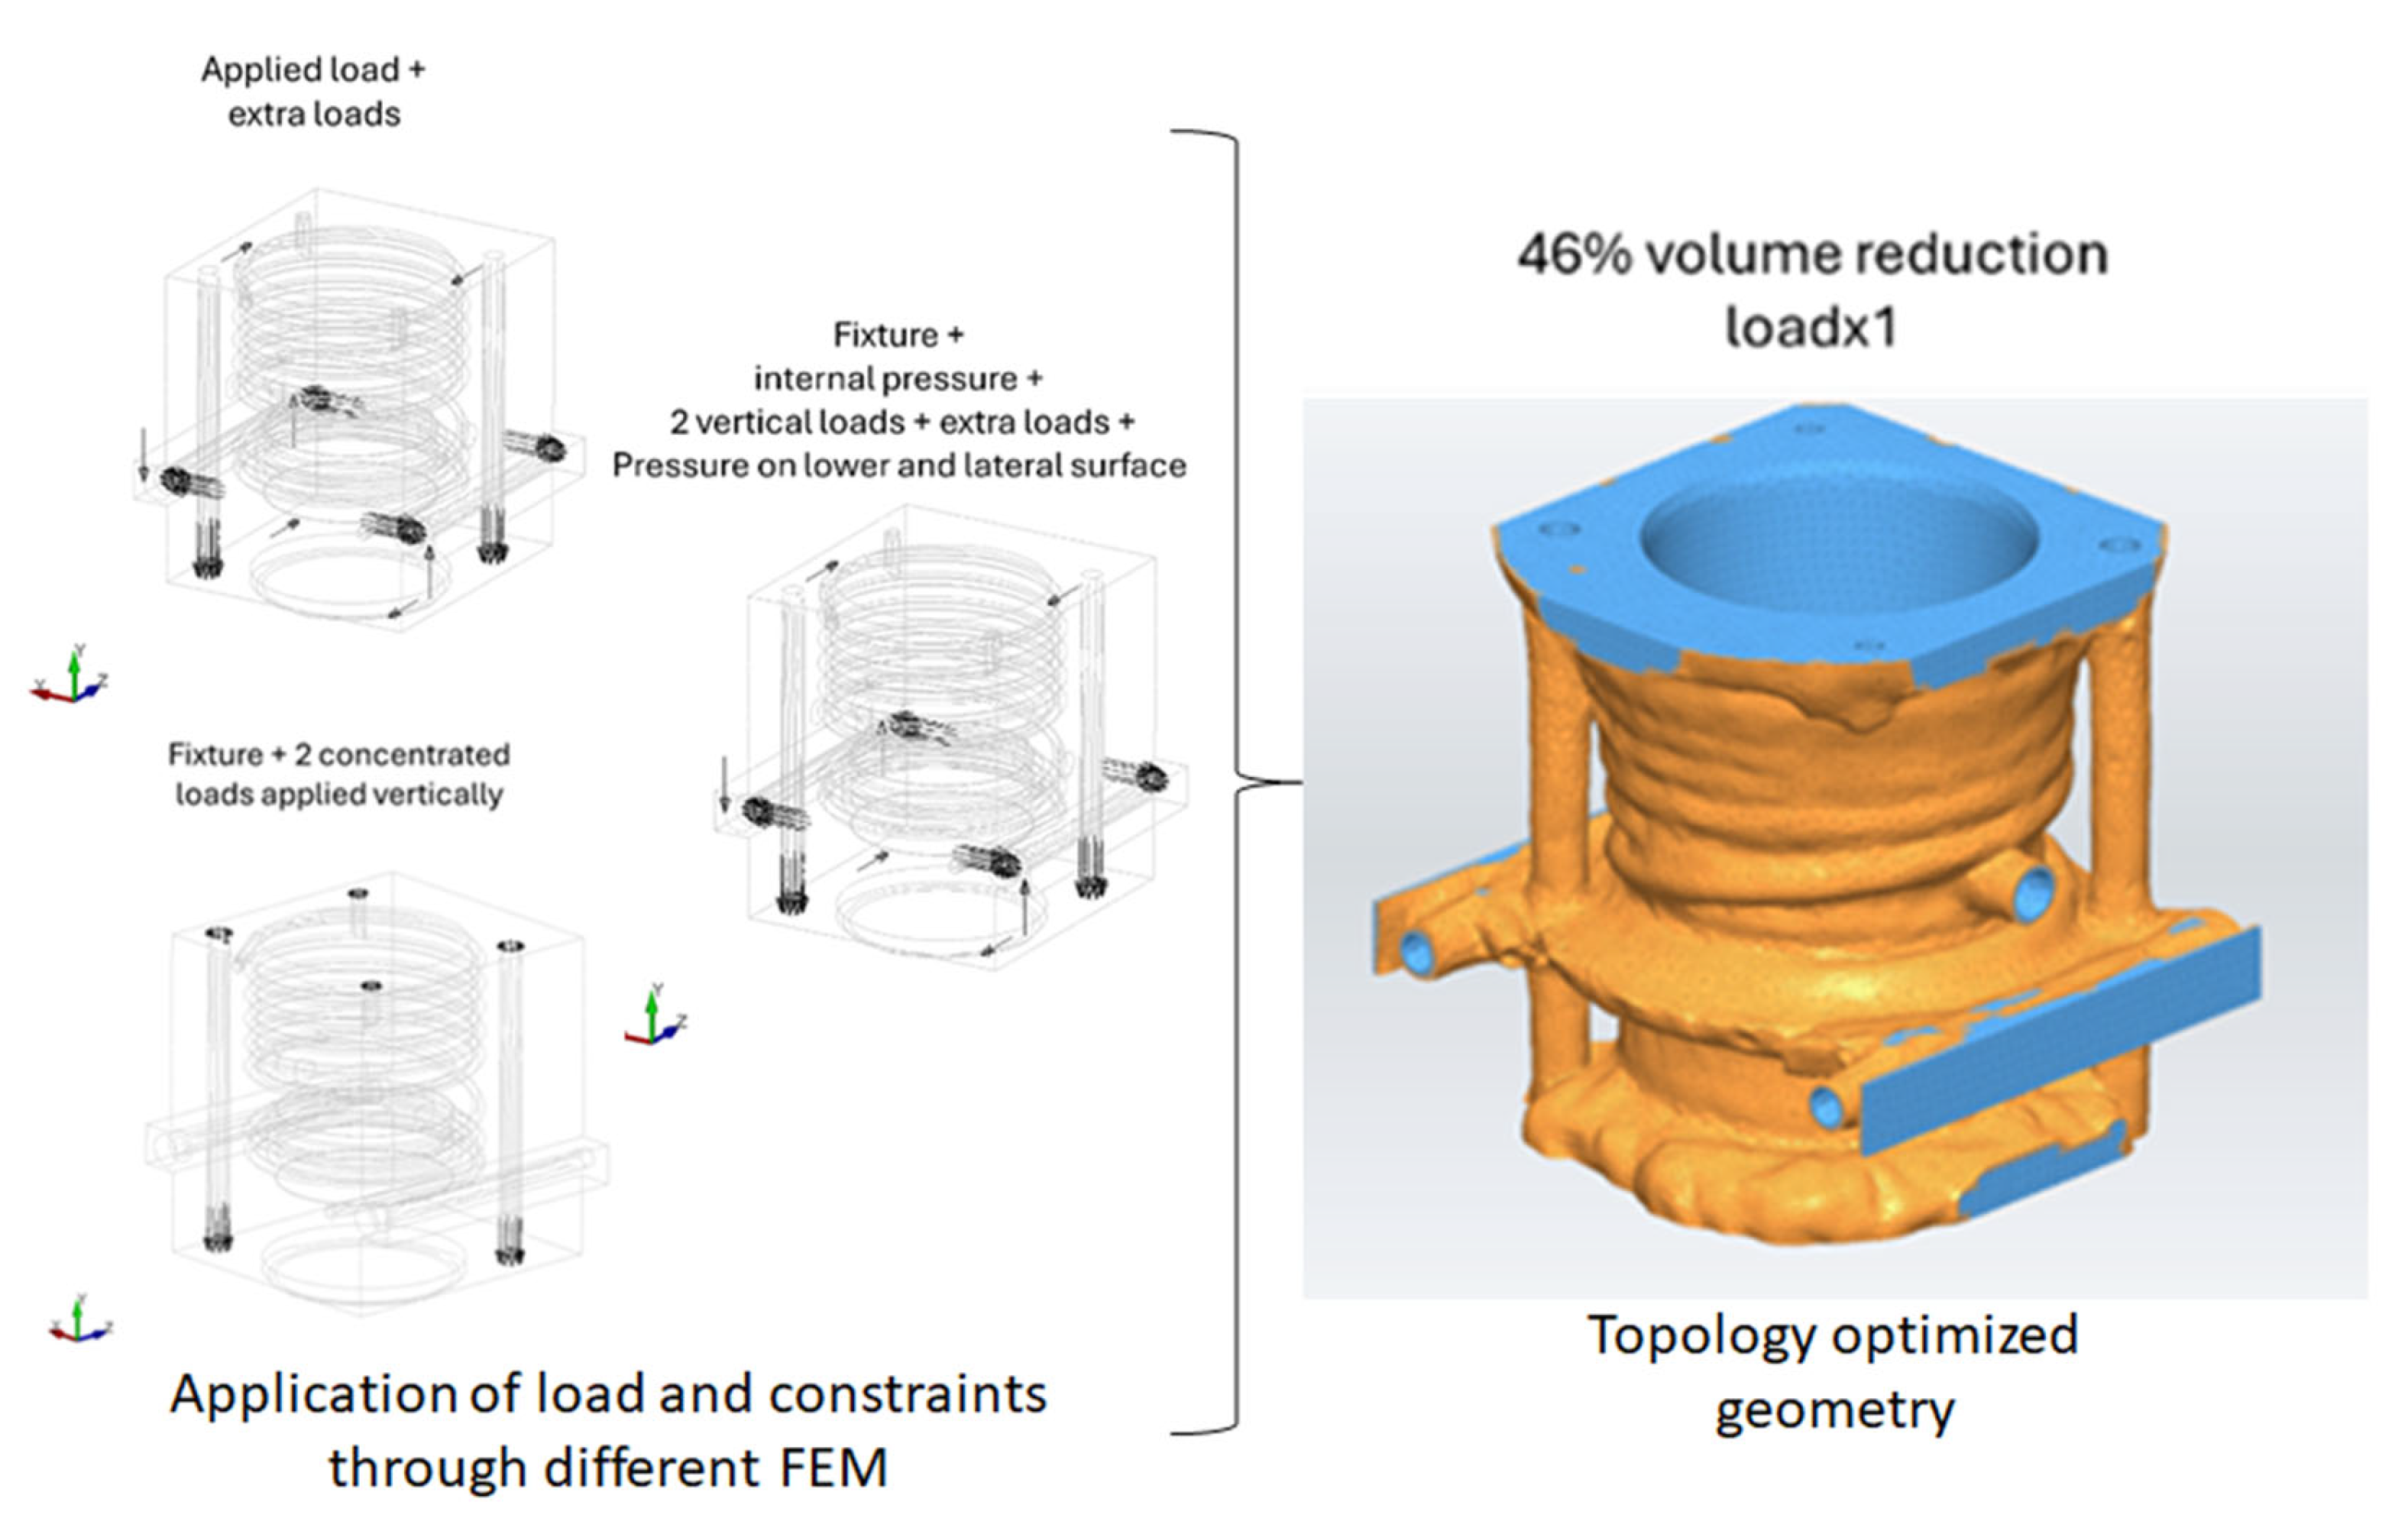
17], and it is in part used here; however, the greatest variety of volume distribution was found by using the third approach, which allowed for having different geometries. The FE models were tested with the application of different loads for each topology optimization study. The different loads were applied considering extra loads that are not strictly required by the current in-service conditions but loads that could occur when the part could be installed for other robotic arms. Therefore, different applications were explored to determine the optimized geometry that could be used.
The approach of defining different FE models for topology optimization was used here, and some of the problems initially encountered were solved (
Figure 4). The first FEM had only the original in-service conditions, where not only did the creation of internal voids appear, but also the lower part of the block presented a discontinuous surface, while the attachment on the side was disconnected from the rest of the block. To avoid such problems, a second FEM was prepared to increase some materials in the areas mentioned at the beginning, which partially helped, although the horizontal beams resulted in a discontinuous geometry. In the third model, additional pressure was added to fix discontinuous or thin features and to avoid the creation of internal voids. This last geometry ended up being the most suitable for the following phases.
3.2. Simulation of the Powder Bed Fusion with Selective Laser Melting
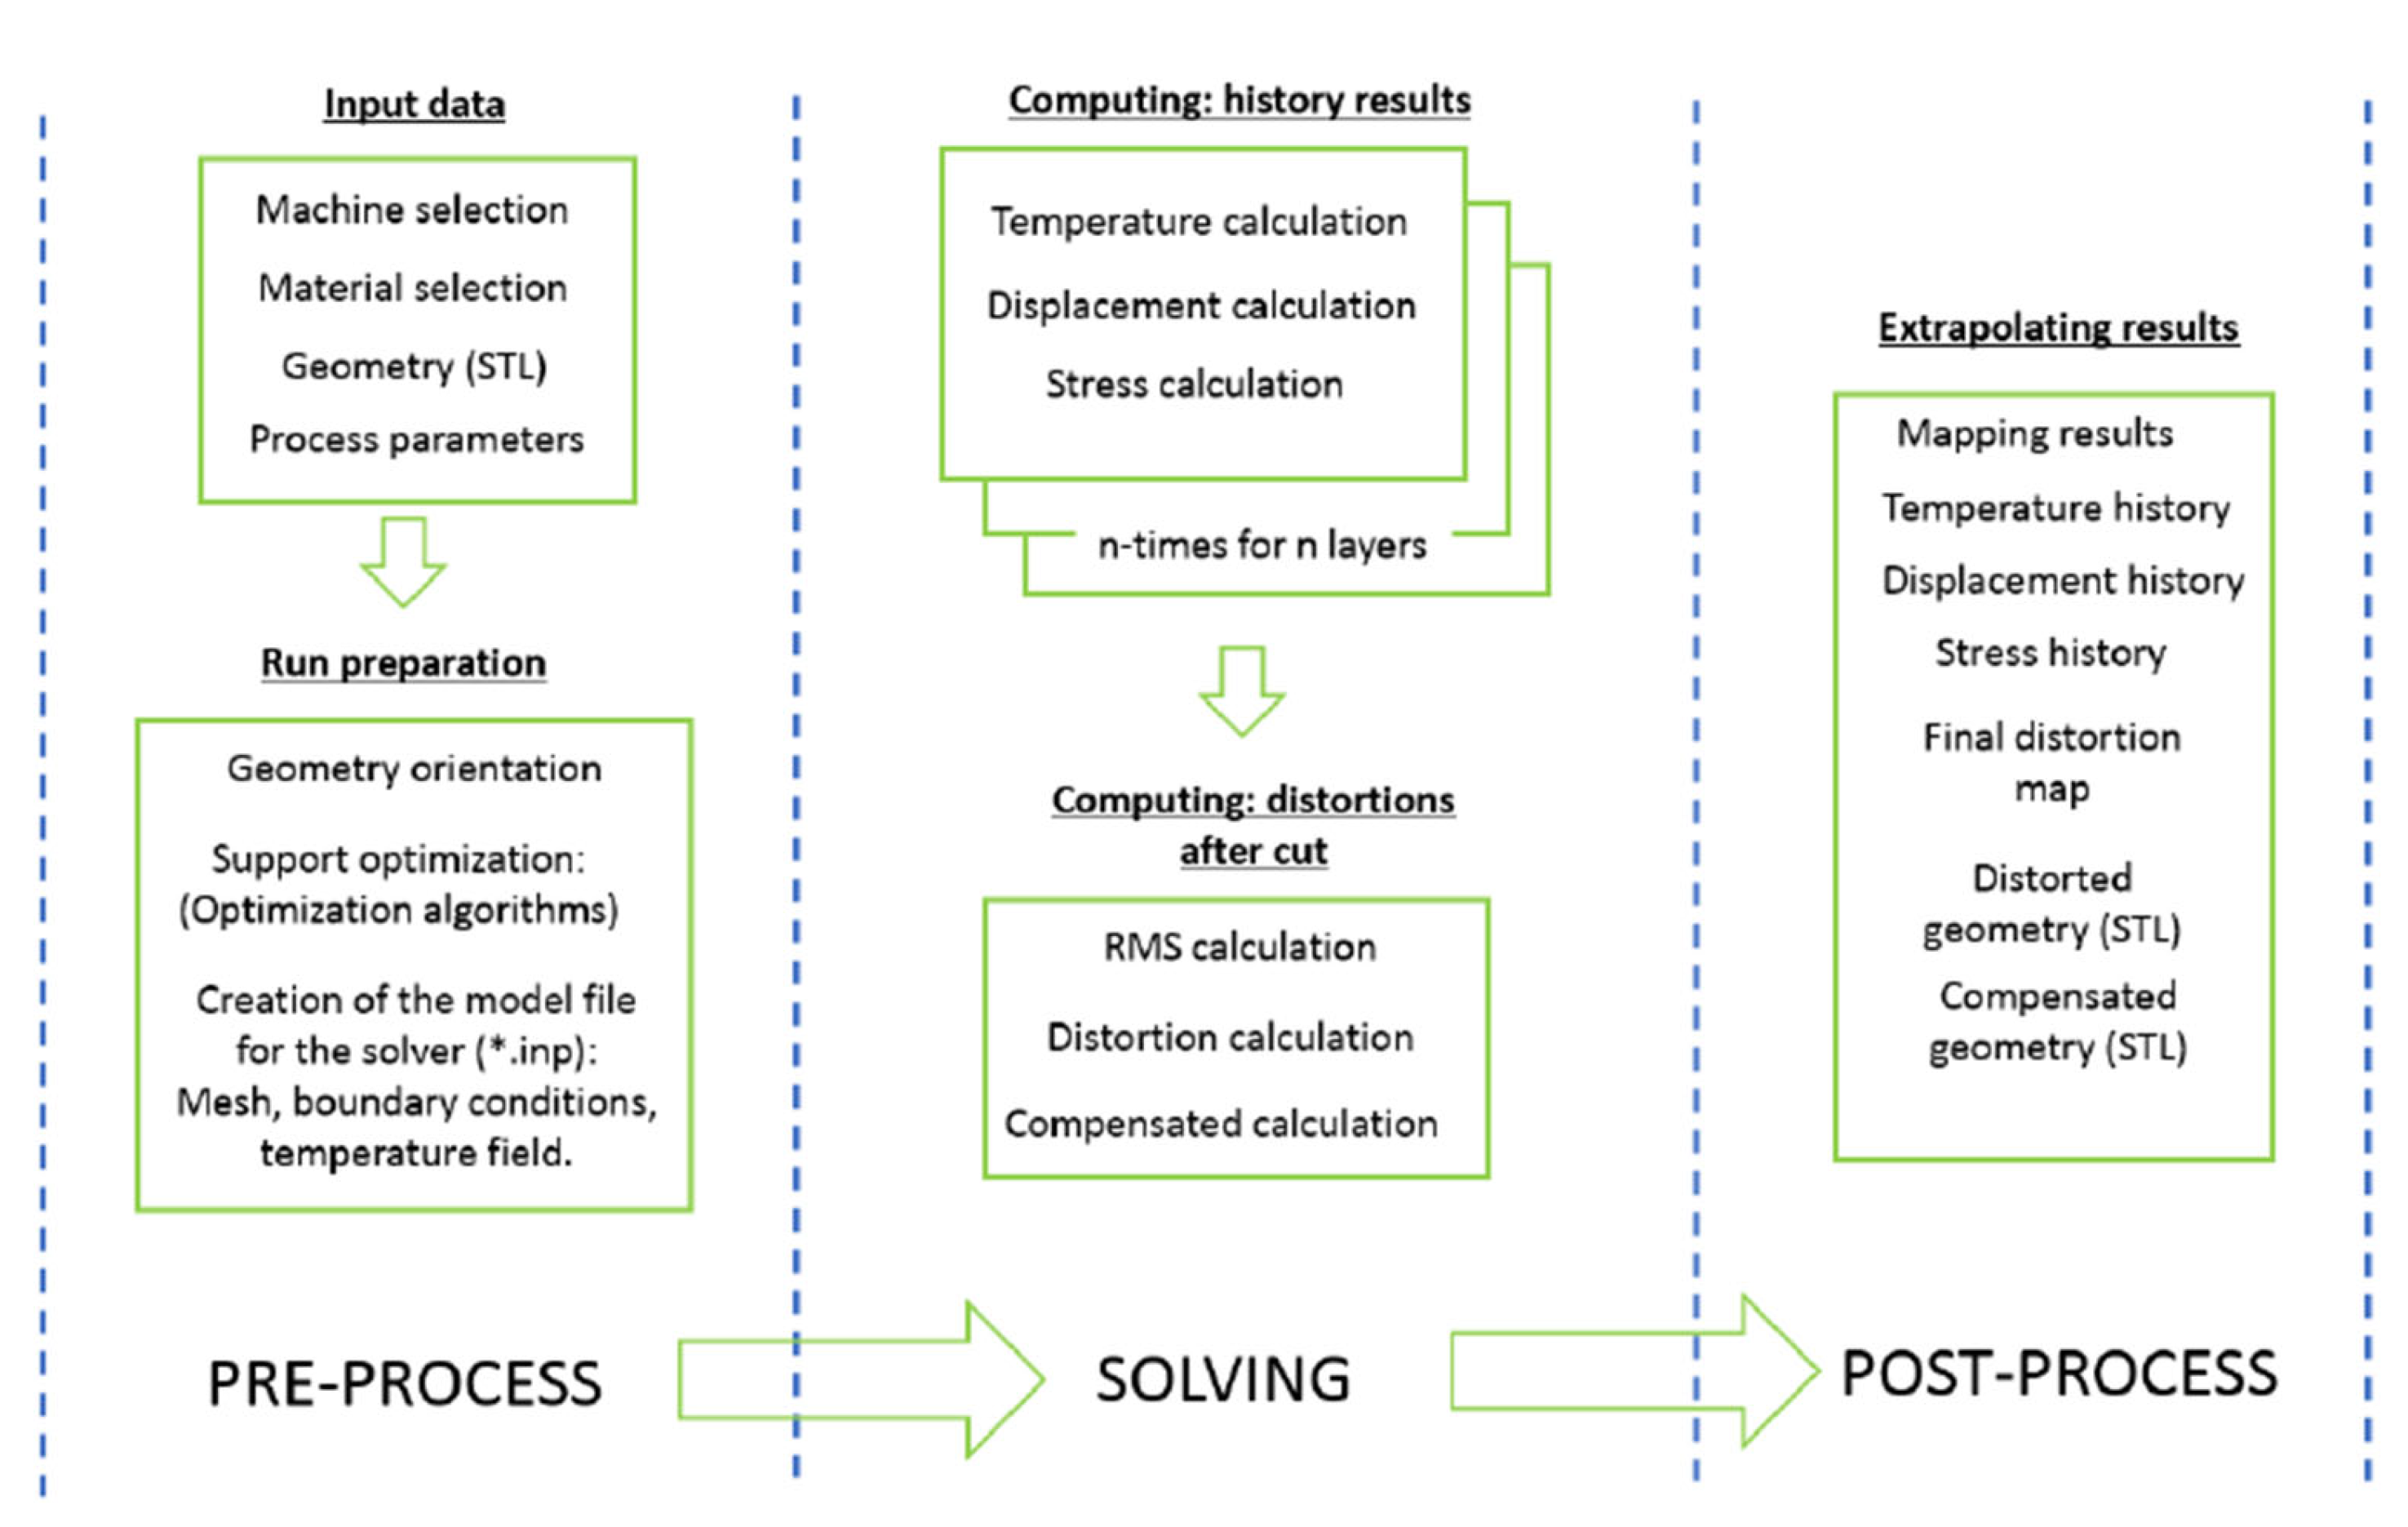
In order to understand the manufacturing of the refrigeration block, a simulation is carried out to find out the parameters that need to be used and the distortion expected from the AM. The methodology, as shown in
Figure 5, consists of a thermal analysis followed by a mechanical analysis at each layer. In effect, the approach is to approximate the actual geometry by voxelization.
For each loop corresponding to a voxelized layer, a thermal analysis is performed to calculate the distributed temperature, which is needed as a thermal load for the thermal expansion analysis. This allows for the determination of the deformation and the stresses, in addition to the temperature.
In addition to the physical parameters, there are also numerical parameters that need to be set up to have efficient computational effort in terms of time and quantify the data (i.e., dimensions of the actual result files). Worth mentioning are the numerical parameters LAYTHKSCALE and DIASCALE, which determine the dimension of the voxel, allowing for an affordable simulation. They define, respectively, the thickness of the voxel and its dimension in the planar dimension, factorizing the actual dimension of the element that would otherwise be very small, especially in the vertical dimension, where for PBF, a typical thickness layer is 30 μm, which is a dimension that is never used in FEM because of the computational cost. The AM process can be simulated with the software AMTOP
®, which can determine the distortions that are expected after printing, taking into account cooling and cutting the part from the plate and the supports. It is particularly useful for a feasibility of the print to find out if the chosen parameters can give criticalities such as defects, cracks, or other types of damage. The software is also capable of optimizing the support and orienting the part according to the support optimization chosen and importing customized supports. However, in the current assessment, there are only two configurations, and the respective analyses are performed not to optimize the support but to verify that there are no criticalities with the selected print parameters (
Table A1 in the
Appendix A). Such parameters are based on what can be found in the literature [
9,
10], while the chosen supports are conventional ones.
3.3. X-Ray Computed Tomography
X-ray computed tomography (XCT) is a non-destructive imaging modality that facilitates comprehensive internal characterization of components, even those with complex geometrical configurations. In the domain of additive manufacturing, XCT stands as the quintessential method for internal quality assessments, allowing for detailed visualization and analysis of structural integrity and material discontinuities within fabricated parts [
14,
38]. It involves a sequence of steps starting with the acquiring projections; these projections are then processed through a reconstruction procedure, followed by measurements and/or defect detection. Further details of the underlying principles are outlined in reference [
17,
18].
The XCT acquisitions were conducted on a robotic system consisting of a Viscom XT9225D micro-focus open X-ray tube, which can operate at a maximum voltage of 225 kV and a power of 320 W. The detector consists of a Perkin Elmer photodiode matrix with a CsI scintillator, featuring 2048 × 2048 pixels, each measuring 200 µm. As depicted in
Figure 6, the specimen is positioned between the X-ray source and the detector on a rotary stage, and projections are gathered throughout a complete 360° rotation. The source-to-object distance (SOD) is carefully chosen to ensure that the sample remains within the field of view of the X-ray cone. The specific parameters employed in the XCT process are detailed in
Table 1. A voxel-based volume is obtained from the reconstruction of the projections with a dedicated filtered-back projection algorithm. VGStudio Max 3.5 is used for the reconstruction and post-processing of the volumetric dataset.
4. Results and Discussions
Prior to the manufacturing phase, the topology optimization geometry is further assessed to determine the displacements and stresses expected during in-service conditions. Furthermore, the thermal analysis demonstrates the efficiency of the new design compared with the previous one, while a simulation of the 3D printing process allows for the determination of the best printing conditions. Finally, the manufactured parts are presented in this section, as well as the measurements performed for the refrigeration block.
4.1. Optimized Geometry and Manufacturing
The final design takes into account the previously discussed modifications of the original topology-optimized geometry, in addition to further manufacturing interventions, such as CNC milling. Therefore, two geometries evaluated will consider the extra material, the size of which depends on the tolerance and operational requirements.
4.1.1. Manufacturing of Mixer Head
The mixer head is modified according to the current design of the refrigeration block and has been adapted to have the two parts connected. The manufacturing of this head can be applied to the previous model, as well by applying extra machining work.
In this case, it was decided to have a layer of extra metal of 0.5 and 0.6 mm on some of the surfaces of the mixer head, as shown in
Figure 7. The V2 mixer head has changed the position of the holes connecting the head to the above refrigeration block because they have shifted to allocate the cooling spiral. As for the rest of the geometry, the previously evaluated topology optimization is deemed valid; hence, no further changes were brought.
4.1.2. Manufacturing of Refrigeration Block
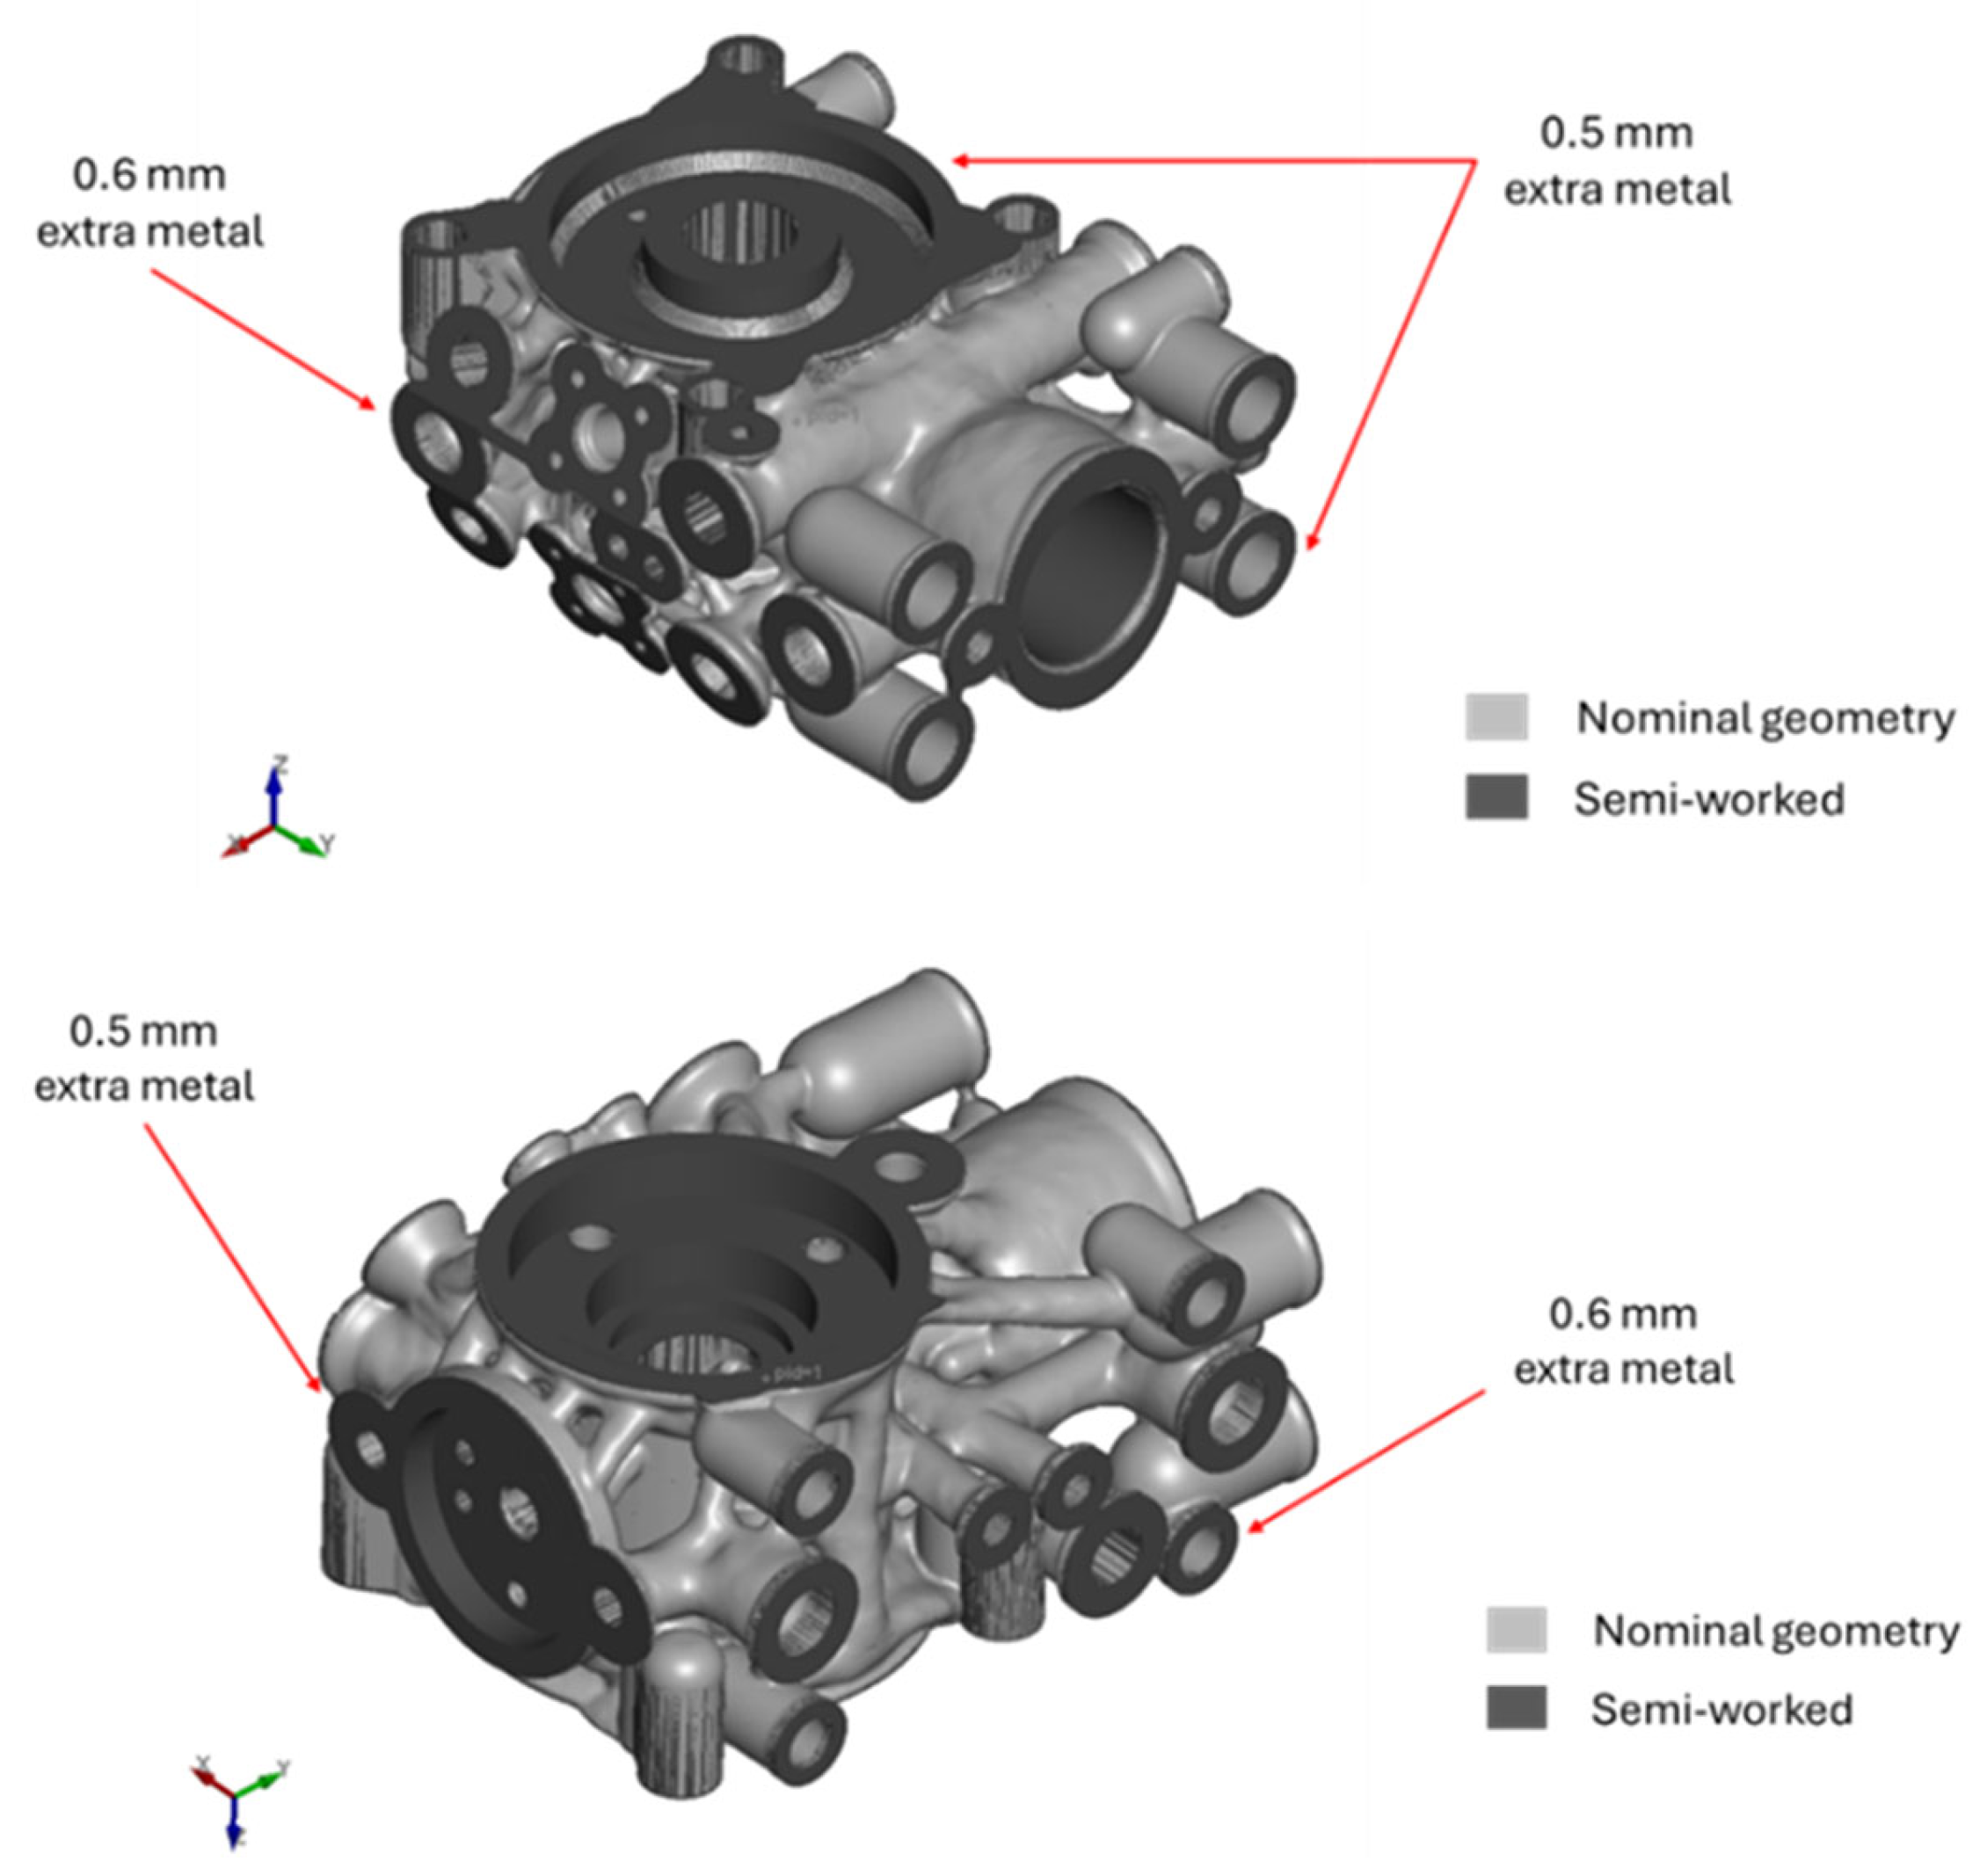
The geometry of the topology optimization of the refrigeration block needs some modifications to avoid problems during the additive manufacturing process. As in the case of the mixer head, CNC machining is used to finish the final surfaces, especially in the internal part of the cylinder. In addition, some refinements to the initial geometry obtained by ProTOp were necessary to avoid problems that were encountered during the topology optimization.
Figure 8 shows the nominal and semi-worked geometry obtained after the Boolean operations on the refrigeration block and describes the differences between the semi-worked parts and the nominal parts.
4.2. Thermal Analysis
The optimized geometry differs not only because of its reduced volume and weight but also in its refrigeration system, which is a spiral with an oval section instead of a circular section as it was before. Although the new section is smaller than the previous one, its topological arrangement provides better heat exchange, resulting in a more efficient cooling system.
Figure 9 shows the main differences between the original and the optimized geometry. It is important to note that not only the disposition of the ducts has changed but also their cross-section, although their areas are the same: 57 mm
2 for the original refrigeration block and 55.32 mm
2 for the serpentine; hence, they are very similar. The volume of the cooling liquid in the original thermal block is 18,470 mm
3, while the volume for the optimized serpentine is approximately 24,910 mm
3.
The thermal analysis of the refrigeration block is performed by FE (
Figure 10) in order to define the differences between the previous refrigeration system and the one with the new design. It is assumed that, in both cases, the internal cylinder has a temperature of 70 °C, while the refrigeration ducts have a temperature of 20 °C.
The material is an aluminum alloy used for AM (i.e., AlSi10Mg); hence, the material properties are shown in
Table 2. The assumed material properties are taken from the literature, so there may be some differences with the actual physical values. Such differences are not deemed important, as the main objective of the thermal analysis is to compare the original refrigeration block design and the new one performed with the topology optimization to quantify the heat flows and temperature distribution in order to evaluate the improvements.
The temperature distribution of the original design and the topology optimized are shown in
Figure 11a and
Figure 11b, respectively. The spiral configuration allows for a much better distribution of the cooling system, allowing for cooling over a larger area.
The comparison of the heat peak flows is shown in
Table 3. The optimized geometry shows a higher peak in the radial direction, implying that more heat is applied to the refrigeration block, but the spiral configuration permits the temperature distribution to remain cool over a larger portion of the component.
Figure 11c–e show that, on average, the heat flow in the radial direction is around 5000 (mW/mm
2) for the optimized geometry, which is still more than double that of the original refrigeration block, which is 2917 (mW/mm
2). The maximum value of the radial heat flow of 9353 (mW/mm
2) is also due to the presence of the pneumatic holes that go into the cylinder, which produce a higher gradient. The effects of the temperature distribution can be seen in
Figure 11, where the section also shows that the optimized geometry present in the upper part is not sufficiently cooled, but the overcooling is greater in the new design.
4.3. Simulation of the Powder Bed Fusion 3D Print
In the 3D printing simulation, there are two orientations in which the component is printed as follows: one where the print direction is in the axial direction of the cylinder, and a second one where the cylinder axis is tilted by 45° with respect to its initial vertical axis. The two cases are used to compare the differences due to the printing orientation and to find out which one is the most convenient to have. The main process parameters used for both analyses are presented in the appendix (
Table A2). The configuration of the supports can be observed in
Figure 12.
Preliminary results can be obtained by the configuration of supports created, and
Table 4 shows the differences between the two processes in terms of time, support volumes, and other characteristics that can be useful for the printer. The support volume for the second case increases by more than double, passing from 15,782 mm
3 to 43,279 mm
3, while the manufacturing time changes less significantly as follows: 24.4 h and 29.5 h for the first and second cases, respectively. The number of layers of the second case is 30% higher than the layers of the first case; however, the last layers of the second case have a smaller area. Another aspect of such an assessment is the support dimensions and geometry; the average areas of the support in the second case are higher, and this can change how the thermal distribution will affect the final distortions of the part.
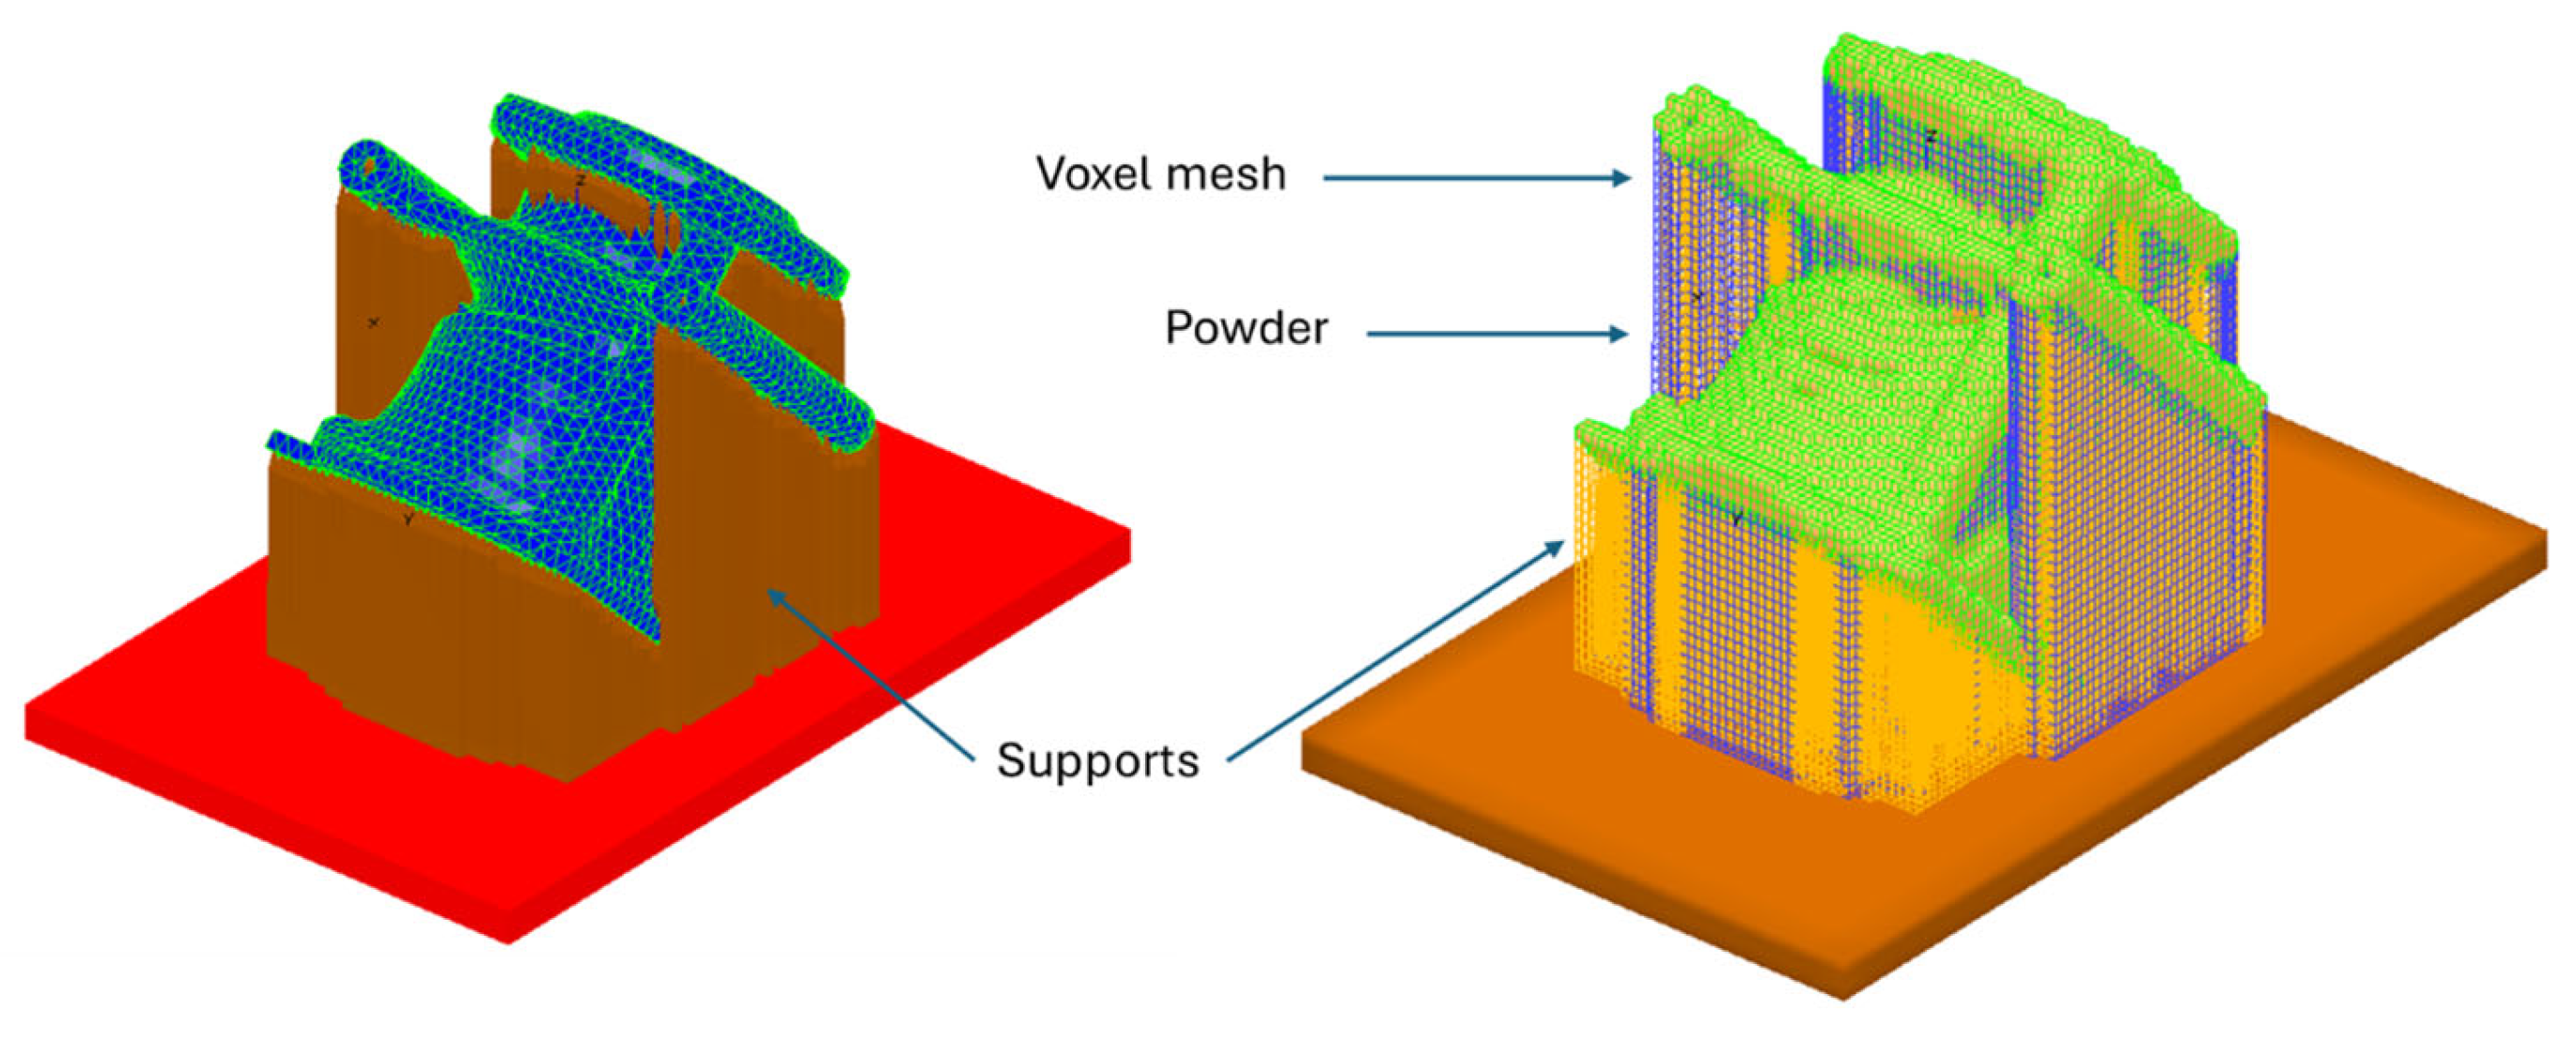
Once the manufacturing parameters are set, a voxel mesh can be created that includes the part, the supports, and the powder. Such mesh is then used for the FEM thermal analysis performed for each layer of the printing process.
Figure 13 shows the voxel mesh generated by AMTOP
® for the two cases analyzed.
The voxel mesh considered has a DIASCALE of 35 and a LAYTHICKNESSCALE of 40, making each voxel 3.4 × 3.4 × 2.0 mm3. This mesh size is a good compromise between the accuracy necessary for this study and the time for calculation.
To understand the mechanisms that induce residual stresses and distortions for the two orientations, it is possible to observe the layers during the build-up of the material to find out how to improve them.
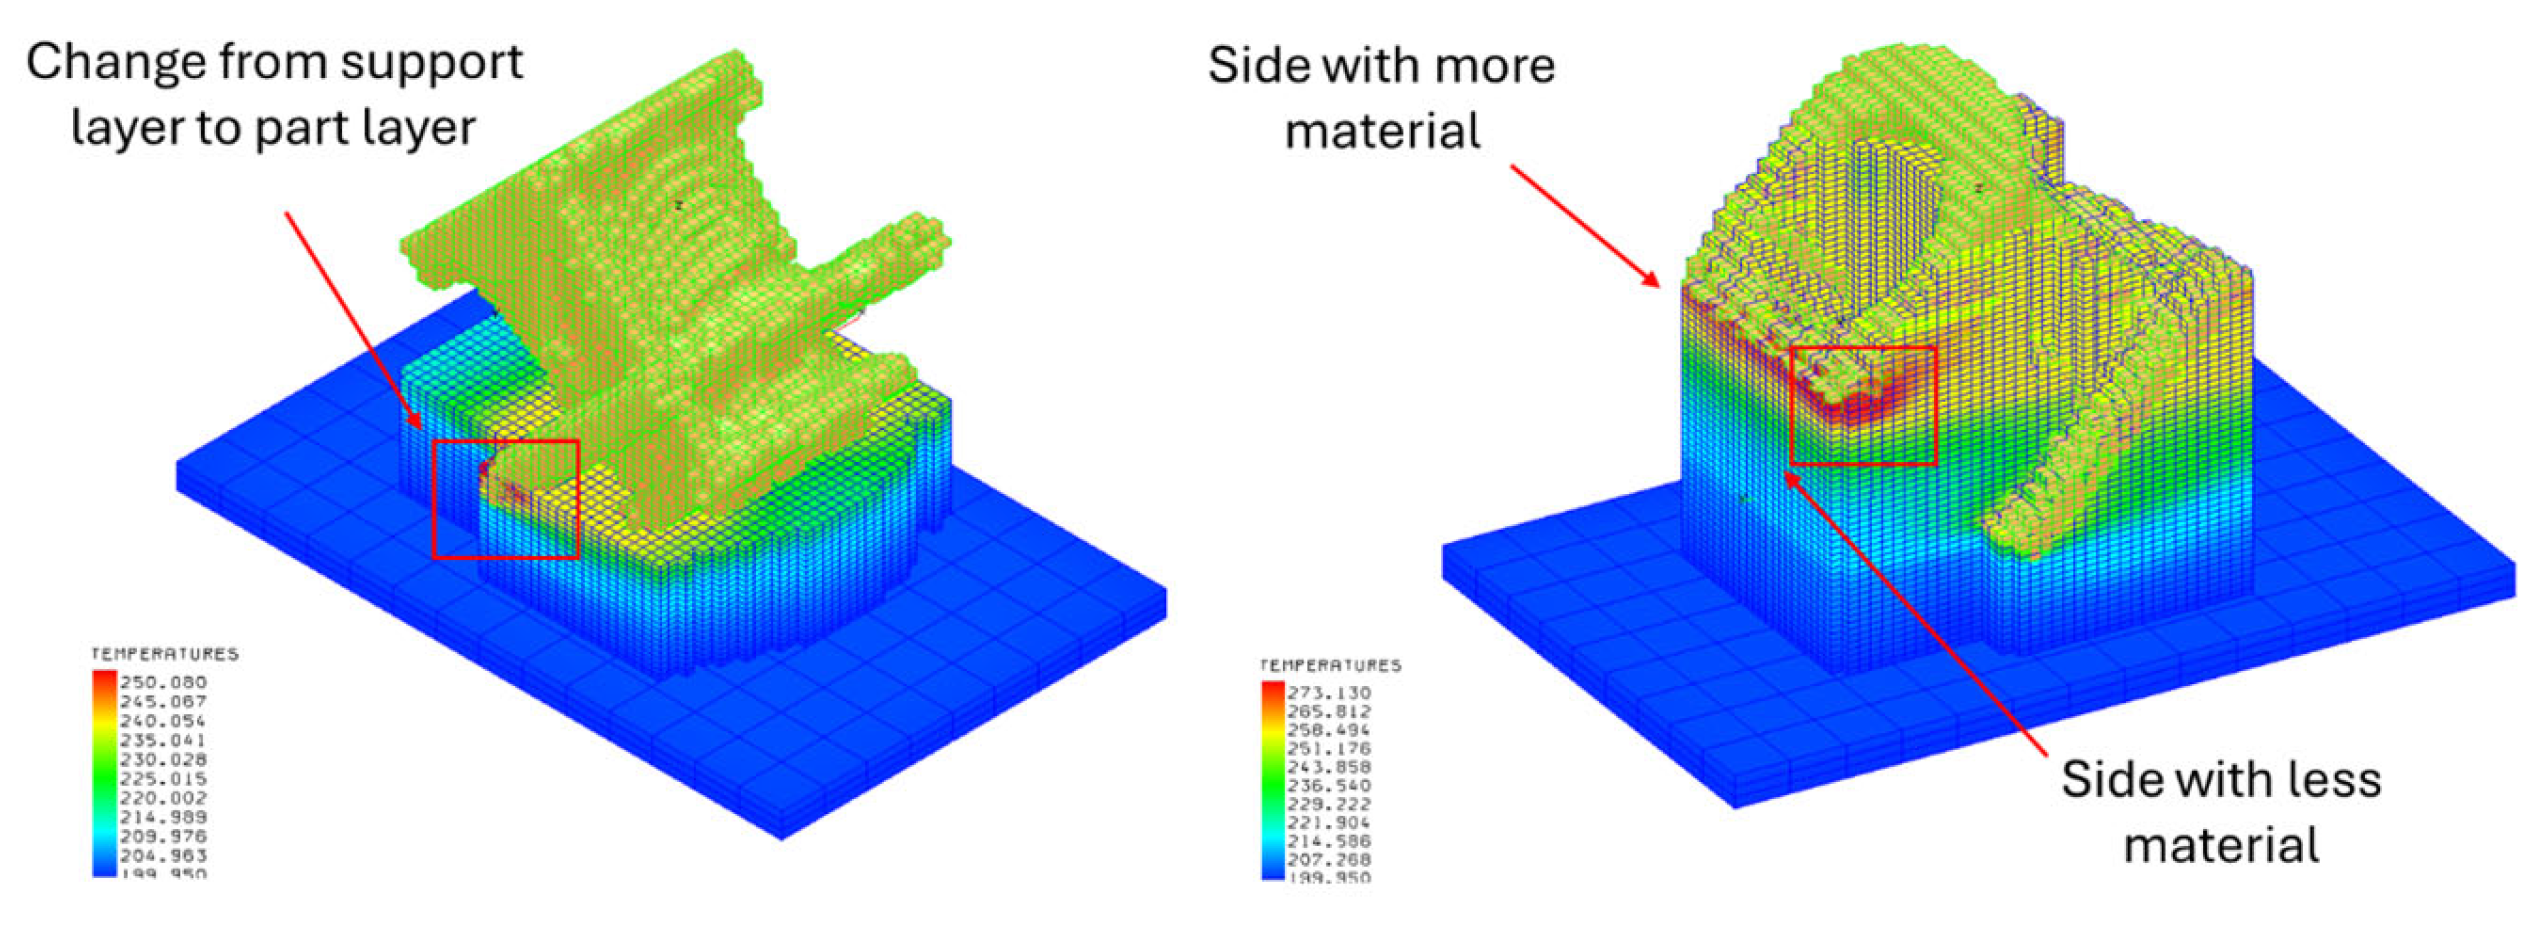
Figure 14 shows that for Case 1 (90° orientation), the corners have a higher gradient of temperature due to the change of the layer from support to part. Such a gradient remains for two of the four corners, even for successive layers, because there is less material in these corners, and the heat can only dissipate by radiation, which takes longer than dissipation by conduction through the materials.
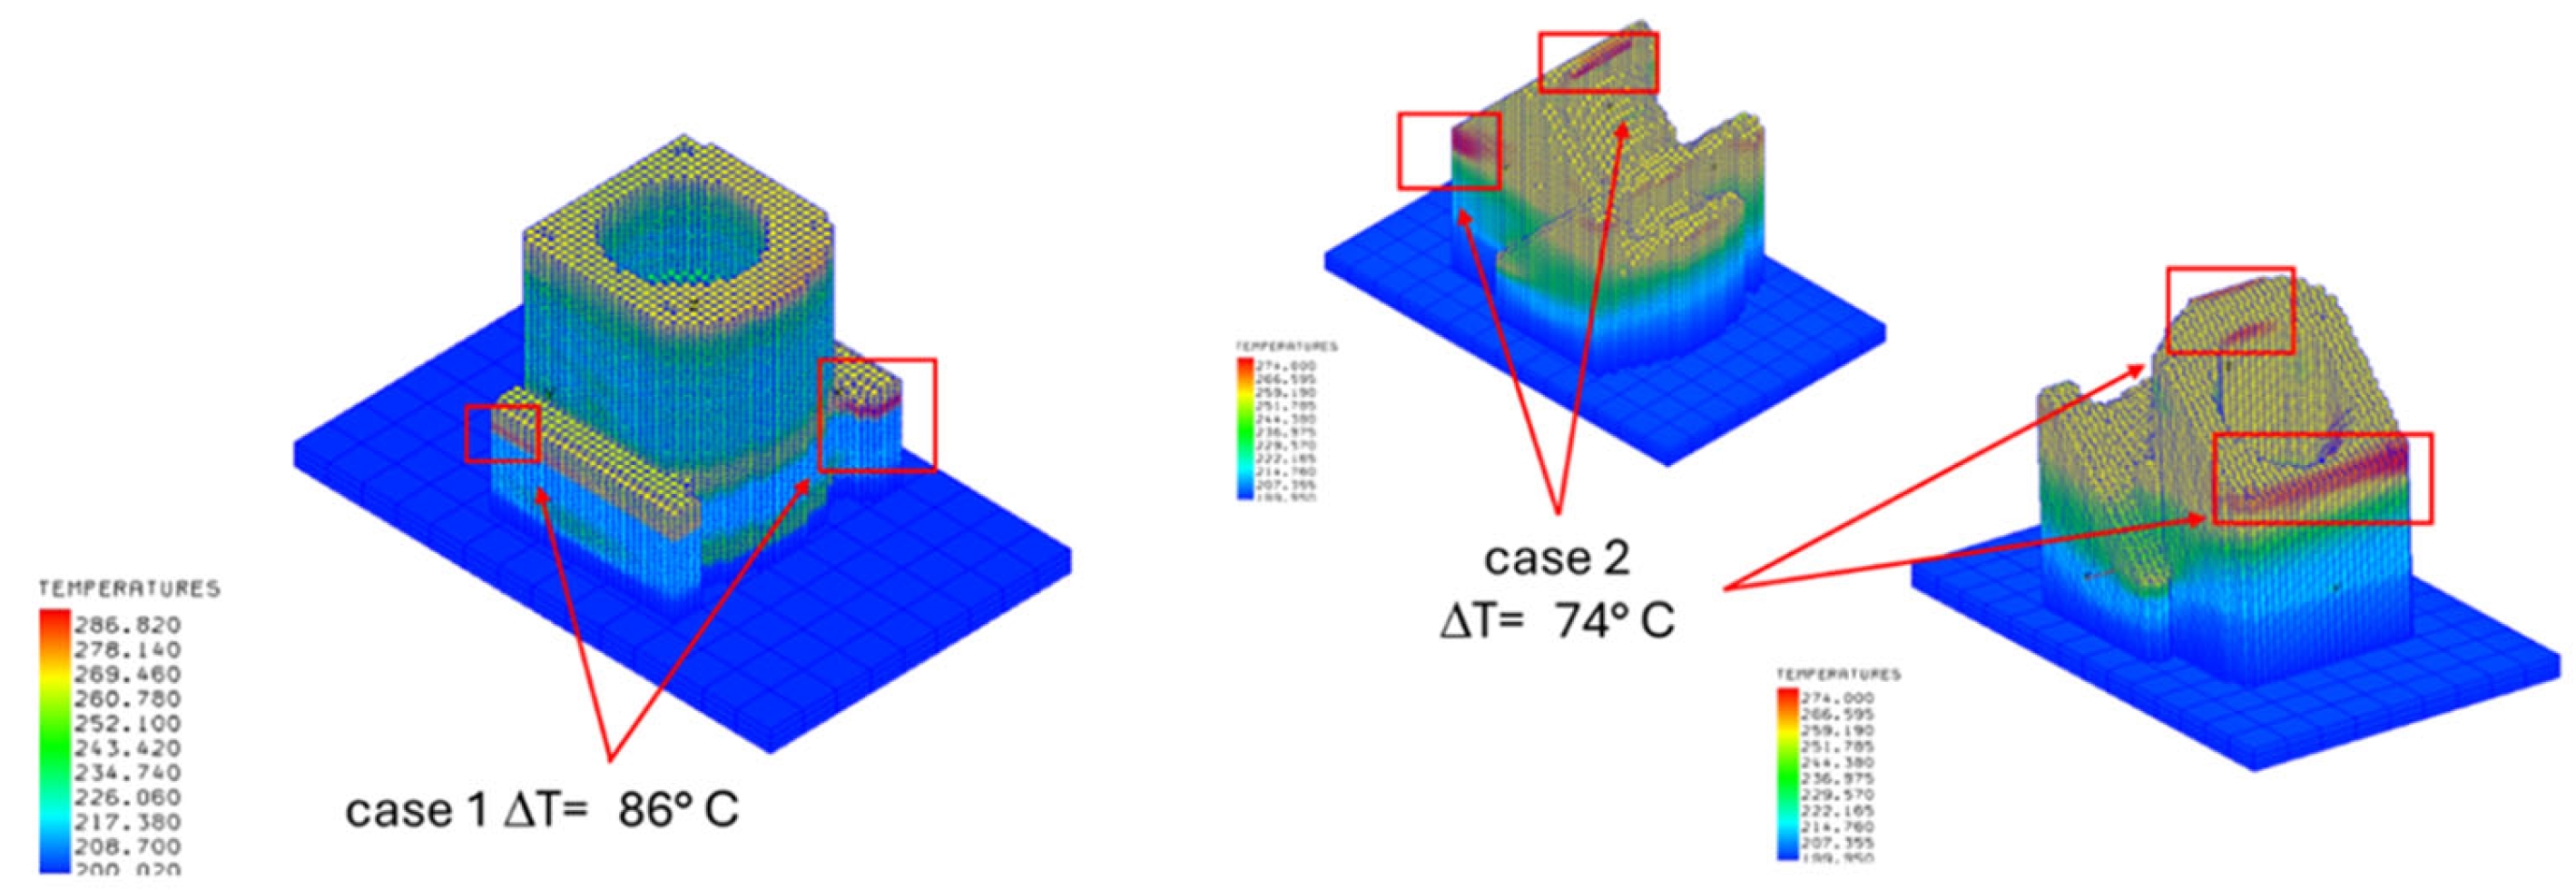
Such a gradient also occurs in Case 2 (45° orientation), but with a ΔT = 50 °C, with respect to ΔT = 80 °C for Case 1; hence, less distortion is expected. On the other hand, there is a similarly high gradient, ΔT = 73 °C, at the corner, which occurs at a layer height of approximately 80 mm, as shown in
Figure 15.
At the end of the print, it is possible to compare the two thermal analyses, and, while there is another area with a ΔT = 73 °C for Case 2, the only high gradient area found for Case 1 is at a layer height of 40 mm (
Figure 16).
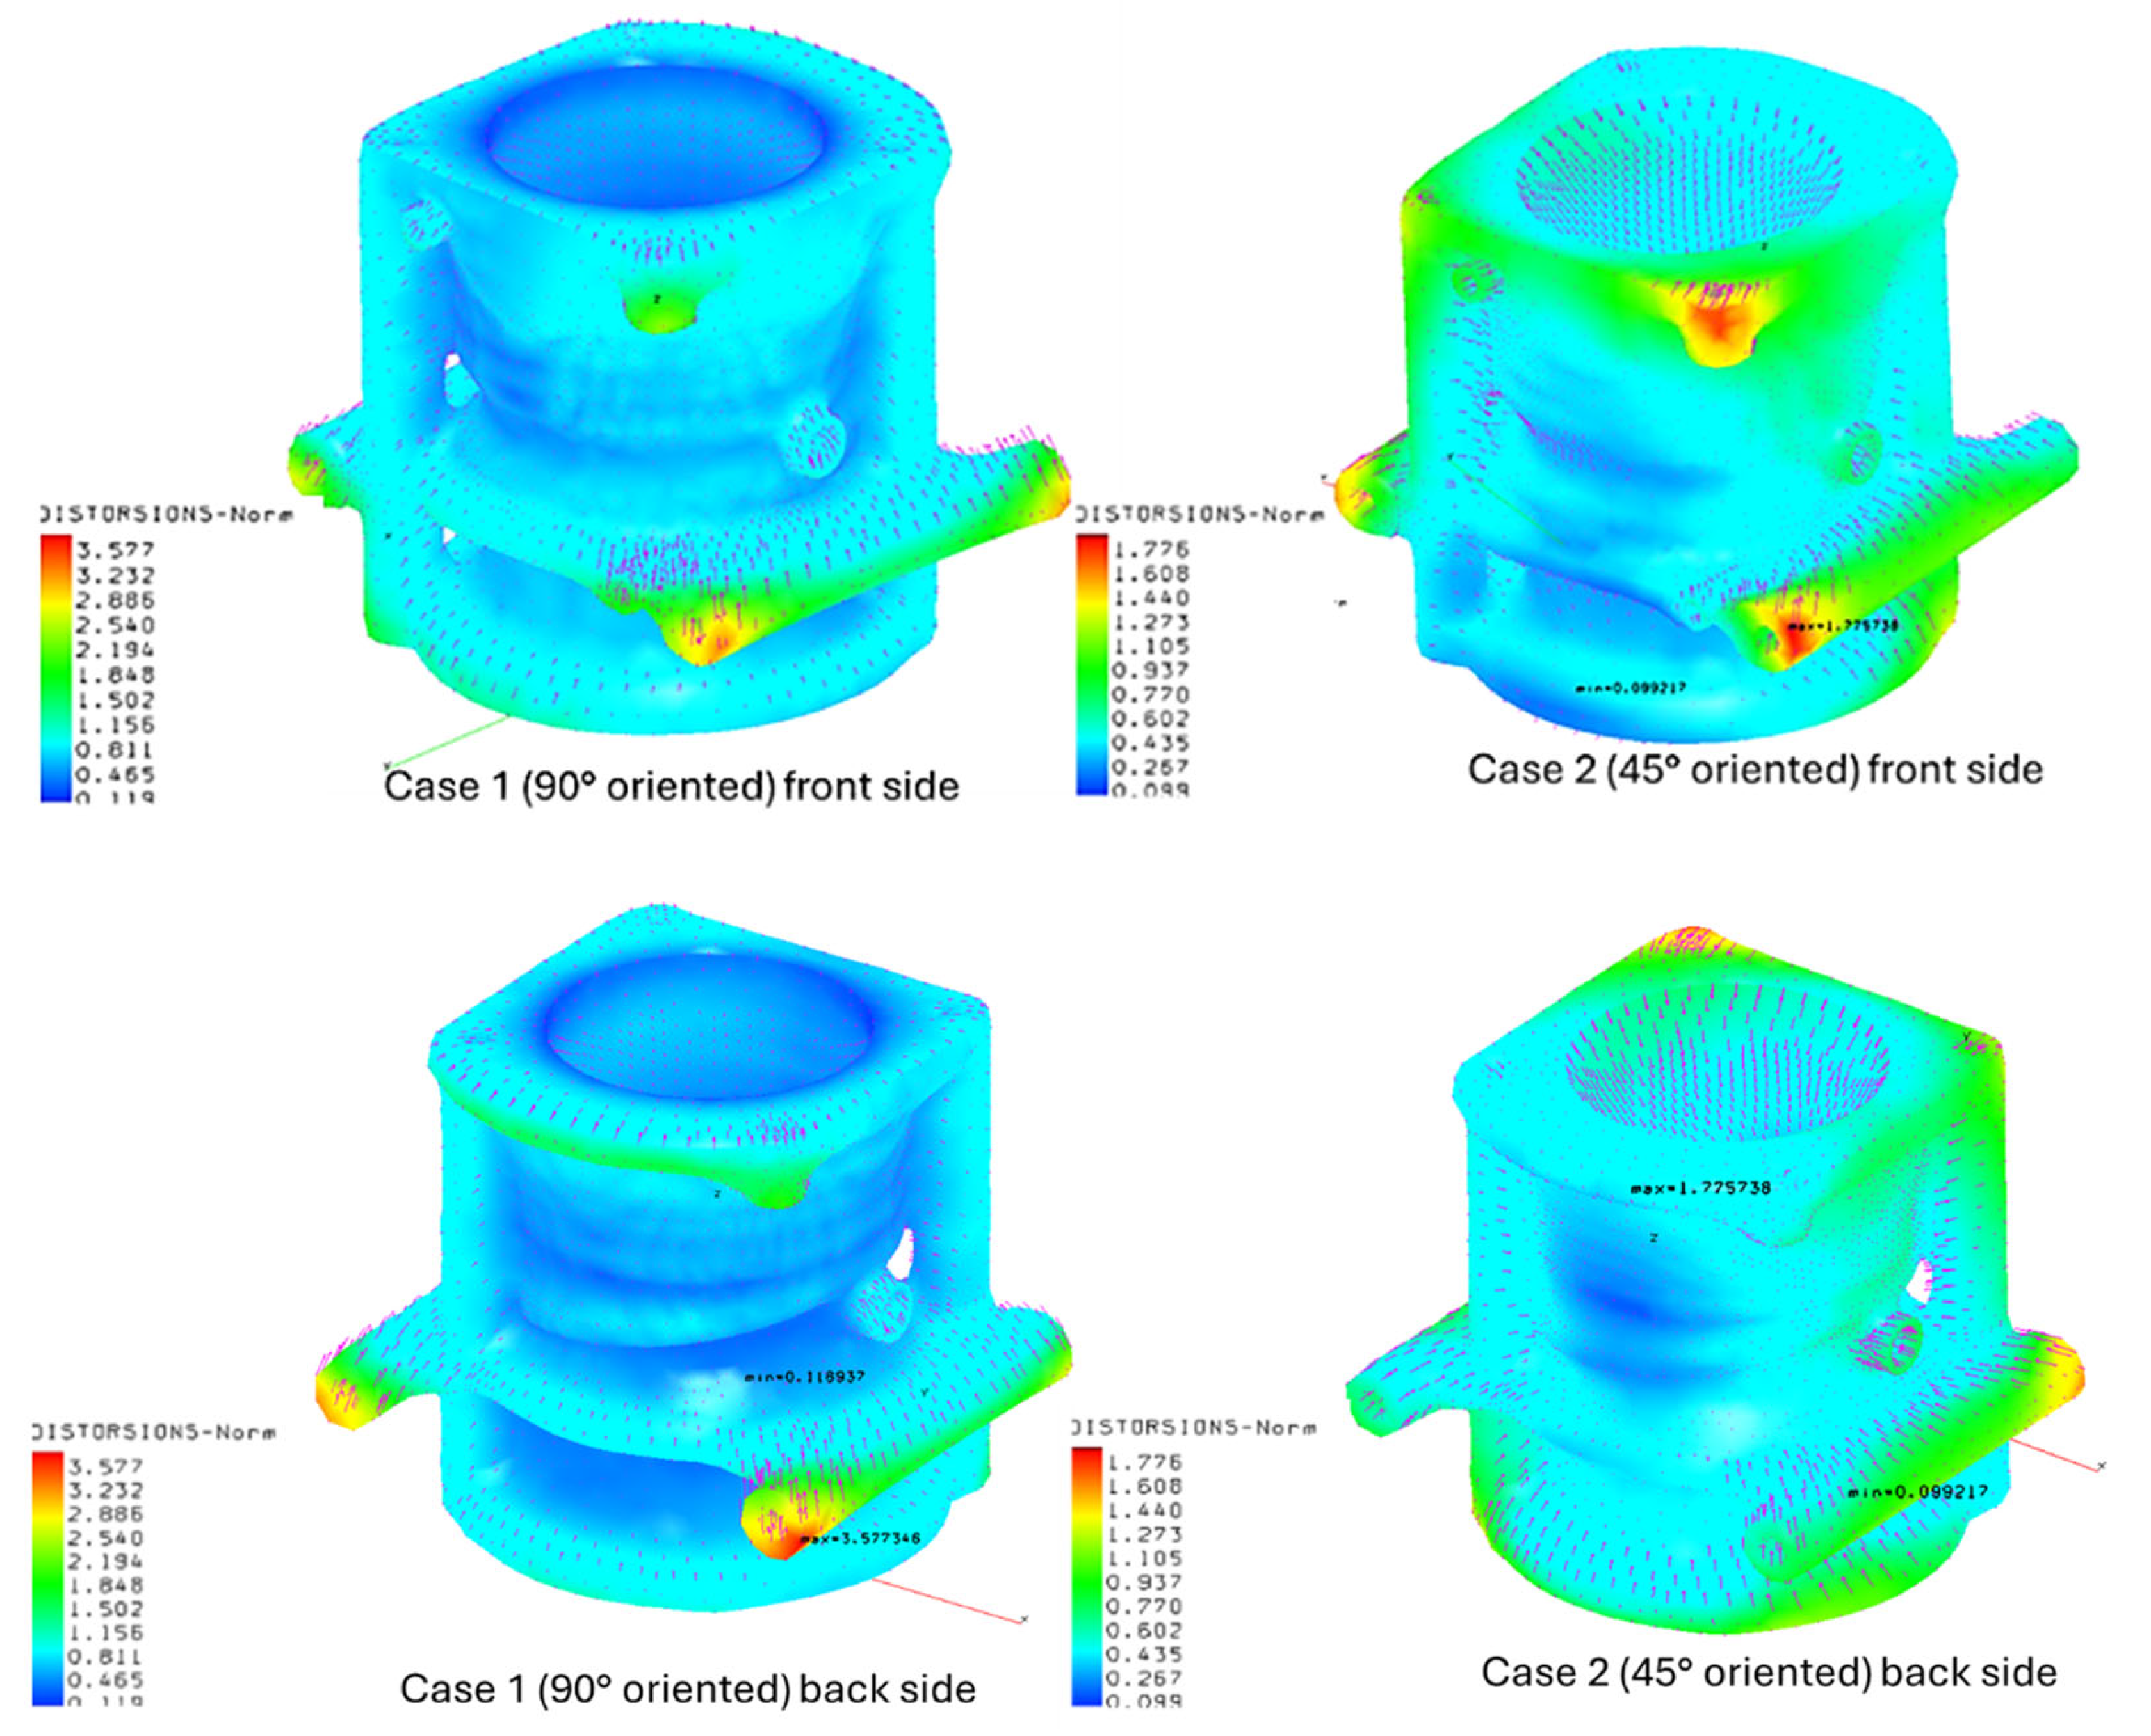
Figure 17 shows the distortion map of the two cases. The maximum distortion obtained is higher for Case 1, with a maximum value of 3.58 mm, while Case 2 has a maximum value of 1.78 mm (
Table 5). As observed from the temperature distribution at different layers discussed above, there are some areas with a higher thermal gradient that produced higher distortions; there is a correspondence between the thermal gradient and the maximum distortions. However, although the maximum ΔT for the two cases is similar (80° for Case 1 and 73° for Case 2), the maximum displacement for Case 1 is twice the maximum distortion for Case 2. This is due to the position of the thermal gradient for Case 1, which is at the end of the beam-shaped feature, which is much more distorted during cool-down compared to the other geometry features. At the same location, Case 2 has a gradient of ΔT = 50° C, while Case 1 has a thermal gradient of ΔT = 80° C.
4.4. Manufactured Geometries
The final geometries can be the proof that topology optimization with additive manufacturing is a good approach to obtain a reduction in volume and weight, as summarized in
Table 6. It is noteworthy that the mixer head version 1 has reduced its original weight from 4.26 kg to 0.67 kg, while for version 2, it decreases to 0.70 kg of its original weight. The latest has an extra volume due to the positions of the new holes (
Figure 18a). The refrigeration block reduces its weight from 1.45 kg to 0.84 kg, which is a smaller reduction compared to the mixer head because the material is the same.
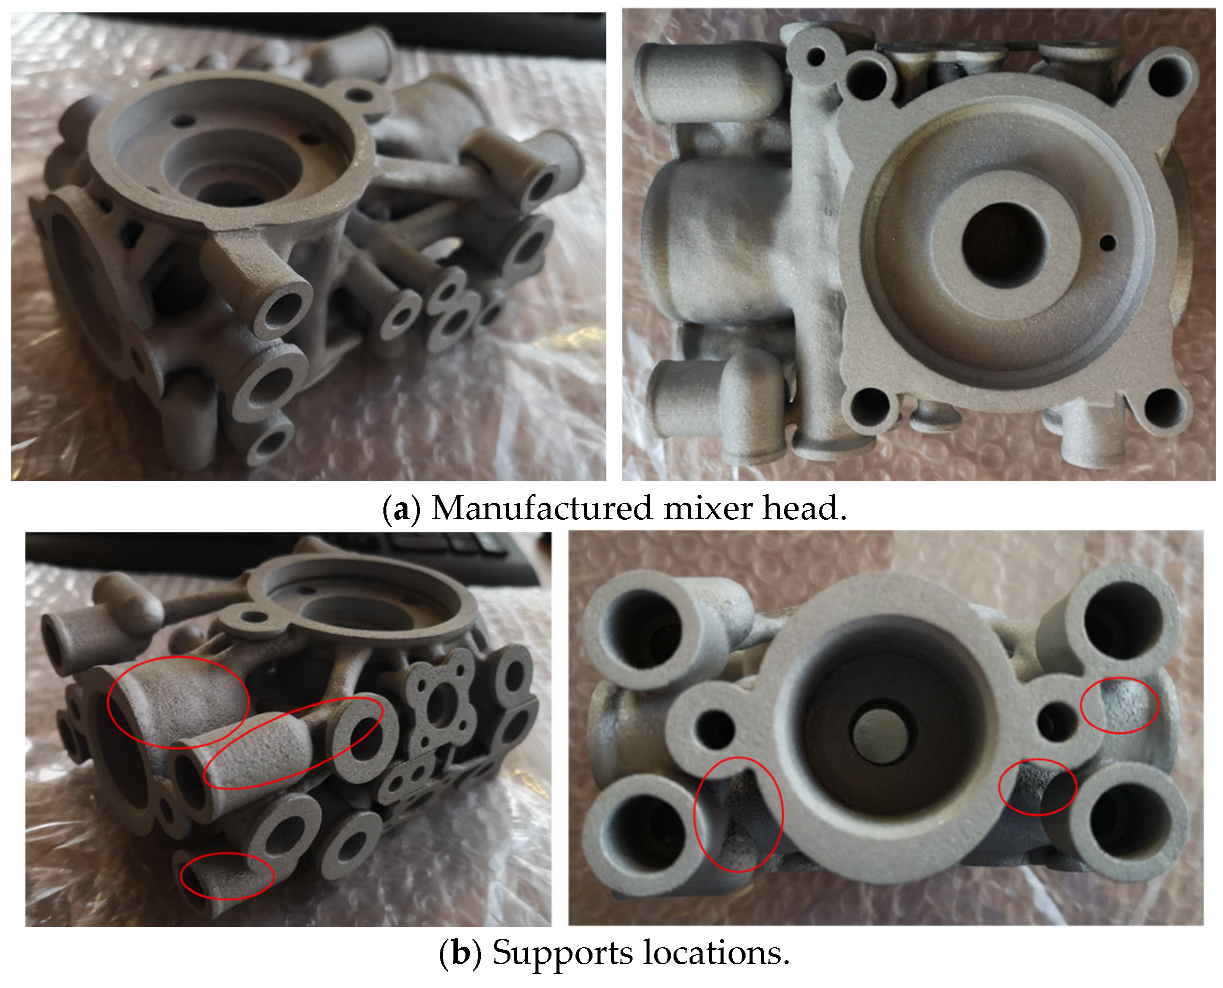
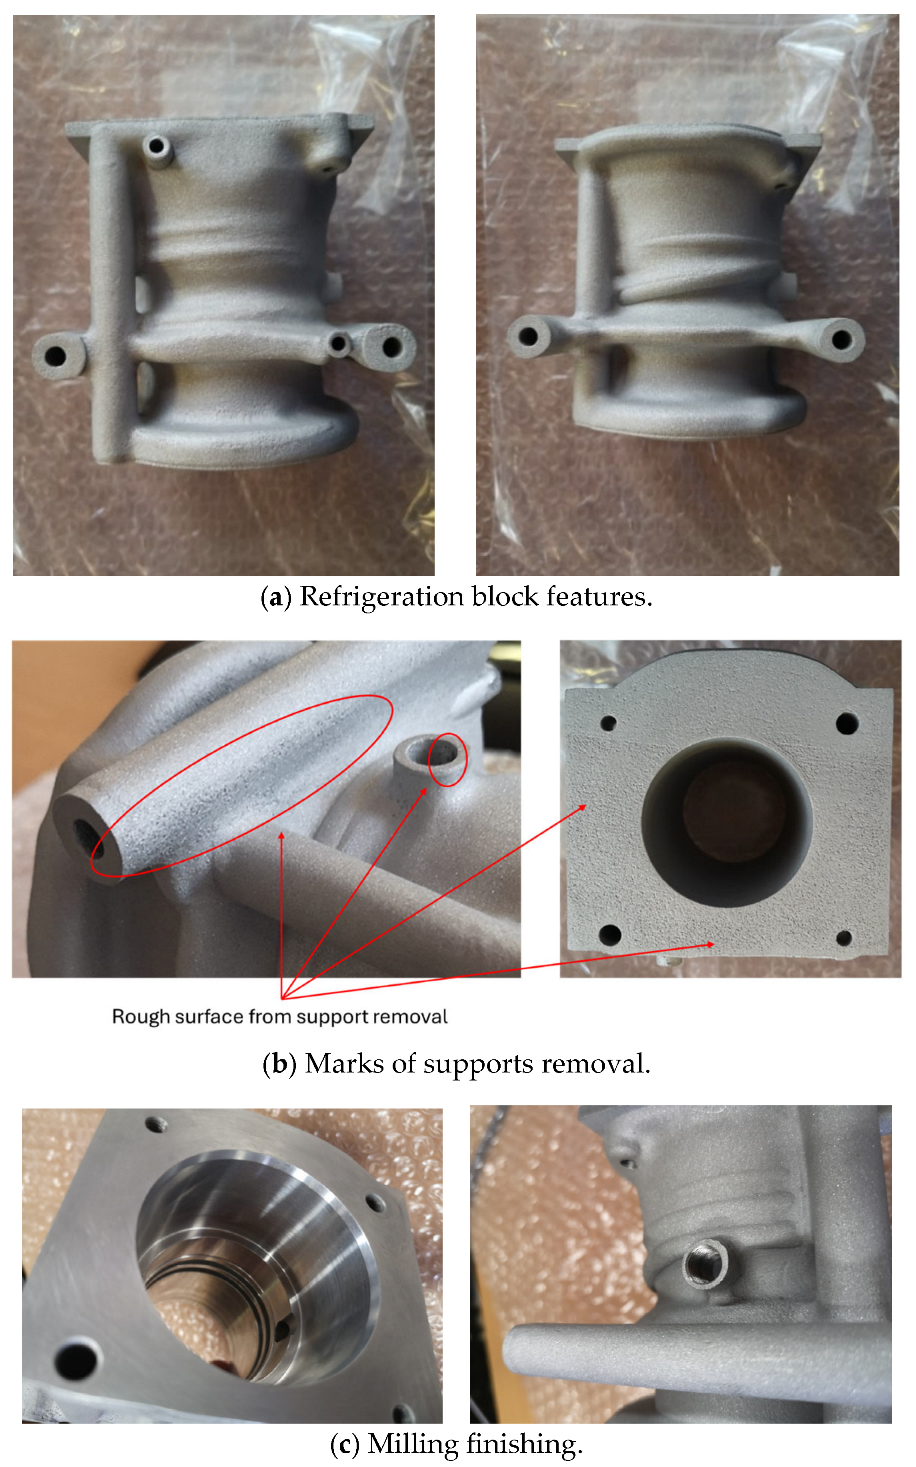
The mixer head and the refrigeration block printed with powder bed laser technology are shown in
Figure 18 and
Figure 19.
After printing, surface finishing was applied using a sandblasting technique to reduce the roughness of the refrigeration block. The surface roughness was not totally removed, and it is possible to observe the areas where the supports were placed, as shown in
Figure 18b and
Figure 19b.
Therefore, the orientation of the refrigeration block could be determined from the positions of the supports. The print was performed with an orientation of 45°, with respect to its vertical position, and the supports were generated also in the interior of the cylinder.
Figure 19c shows the refrigeration block worked with the milling machine in its internal part, where greater accuracy is required for the assembly, and on the thread to the connecting holes.
4.5. XCT Measurements
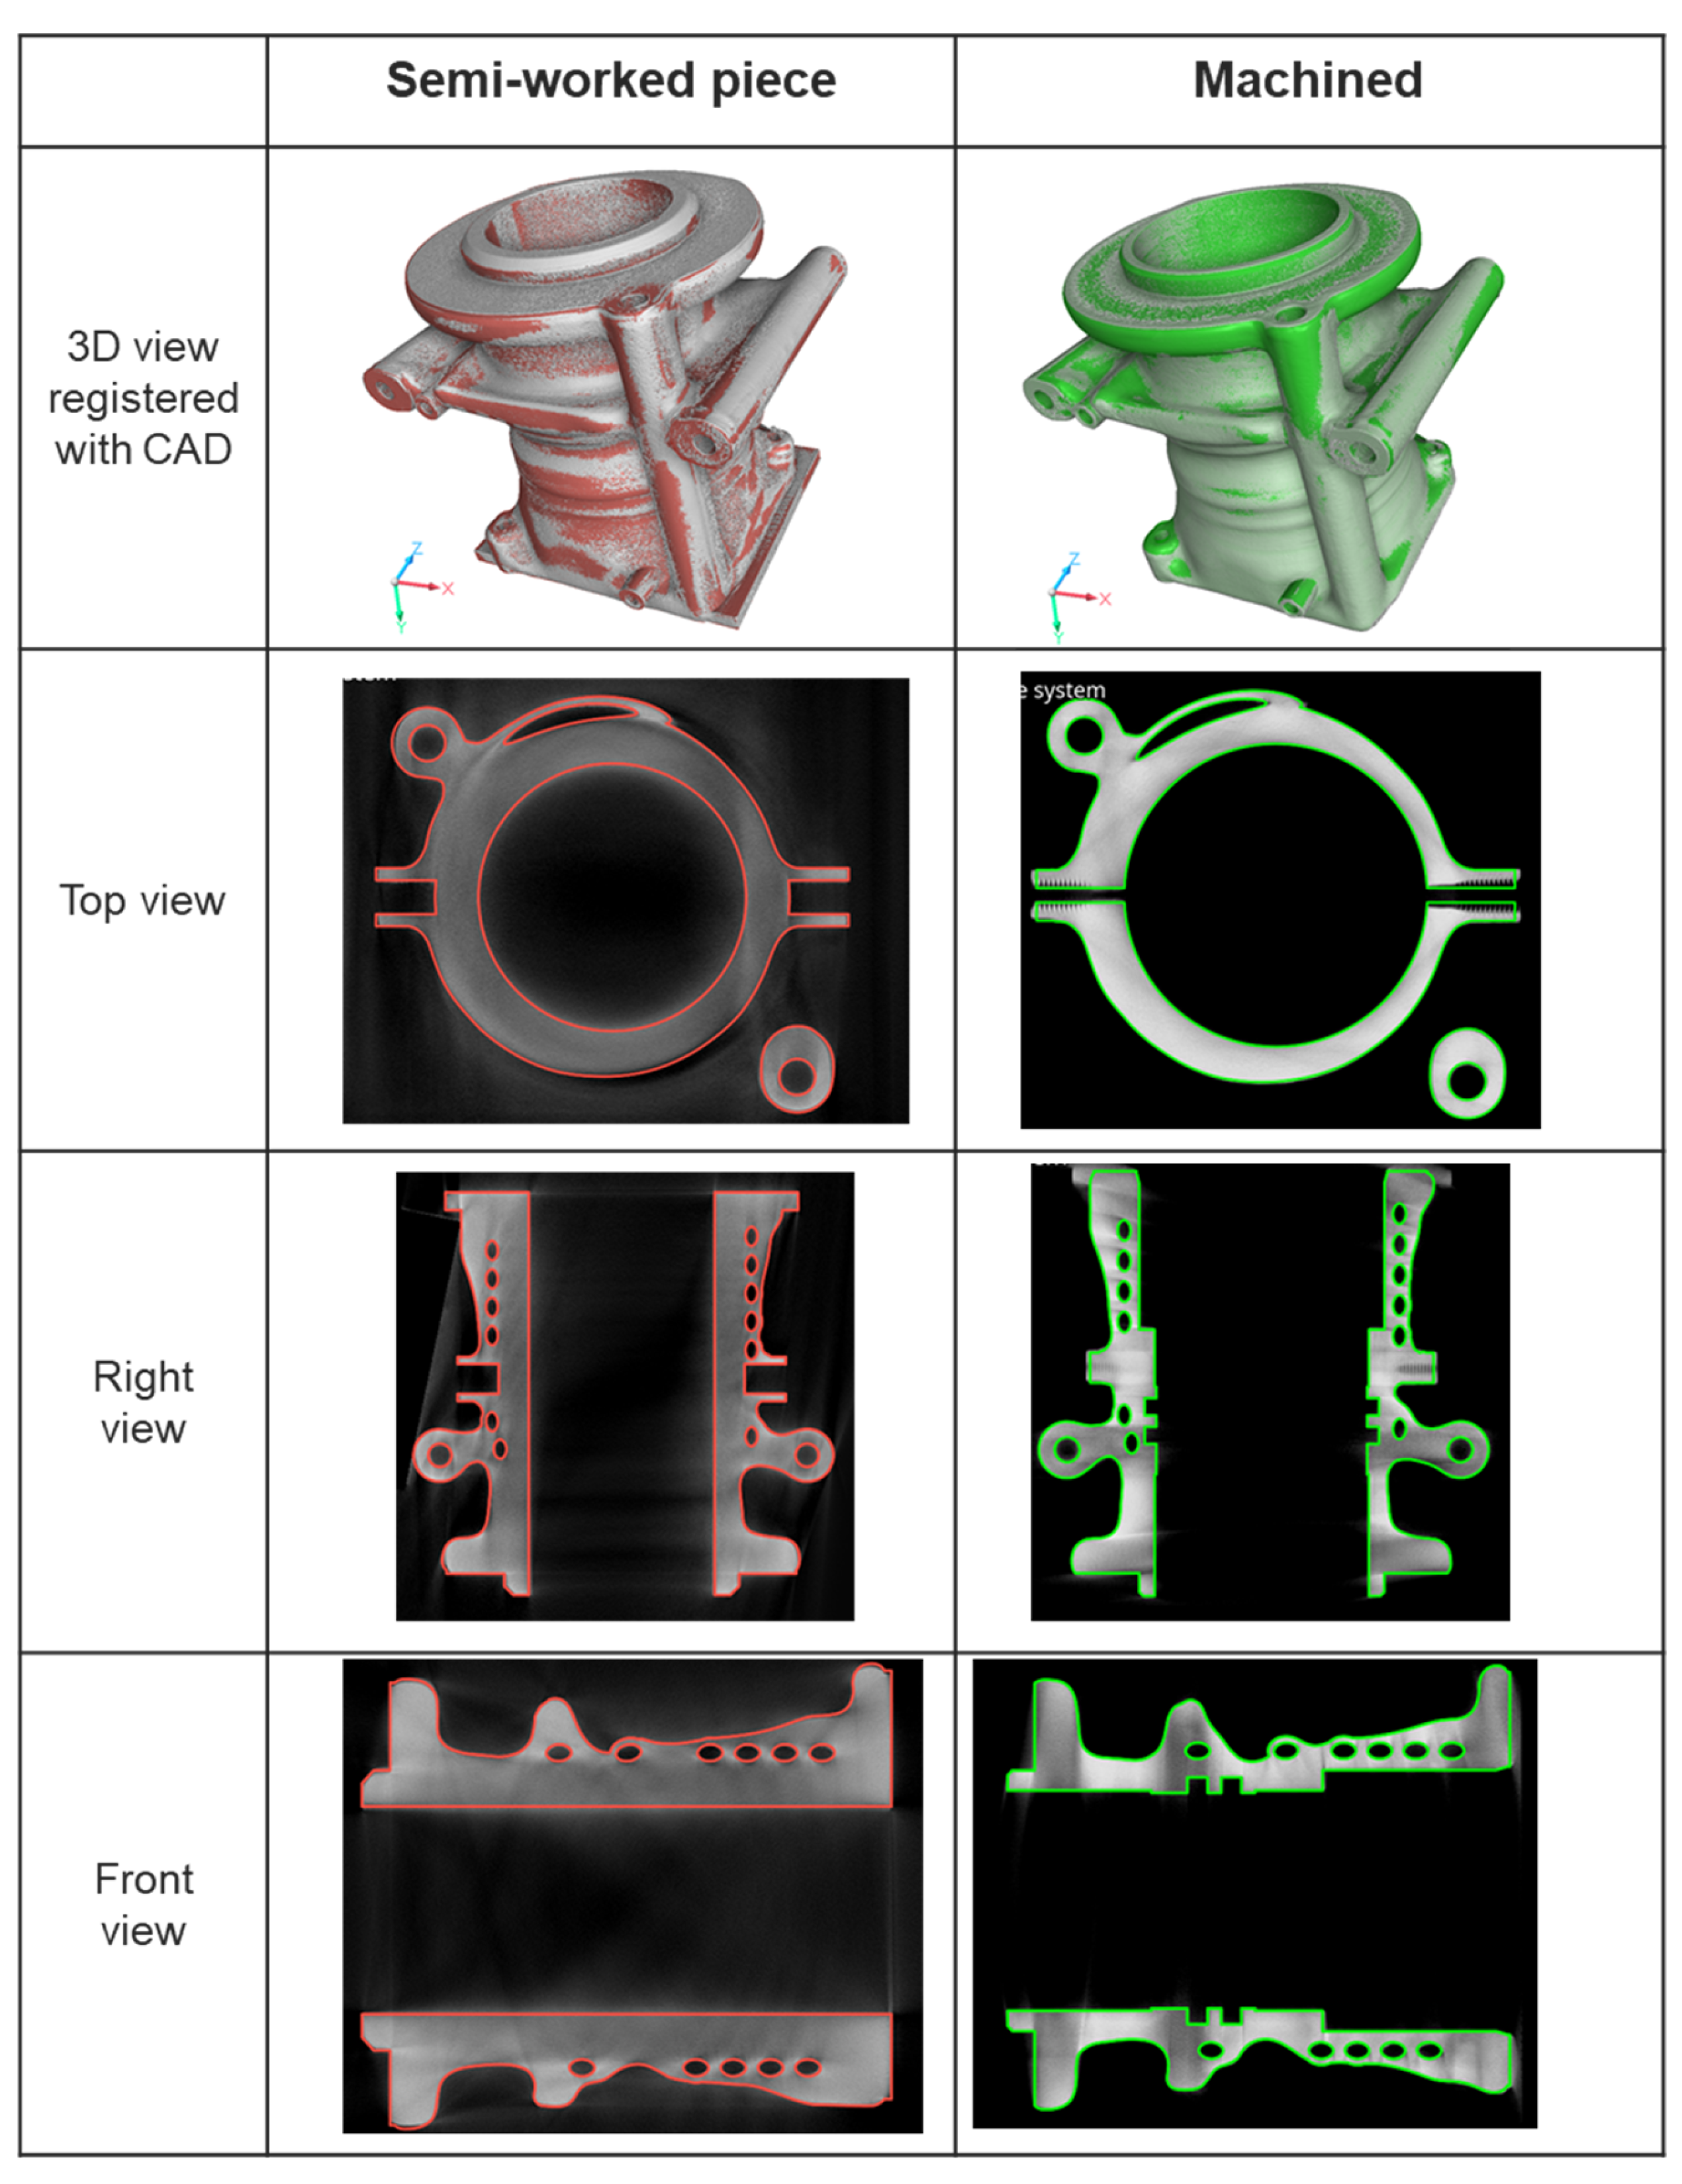
Figure 20 displays the geometric reconstructions derived from tomographic scans for both semi-worked (red) and machined (green) pieces. The top row presents a 3D comparison against their respective CAD models, followed by orthogonal slices from the top, right, and front views. There appears to be a strong correlation with the CAD models, particularly evident in the internal structure, where the machining operations were performed. This visualization not only highlights the exterior fidelity but also effectively reveals the intricacies within the block.
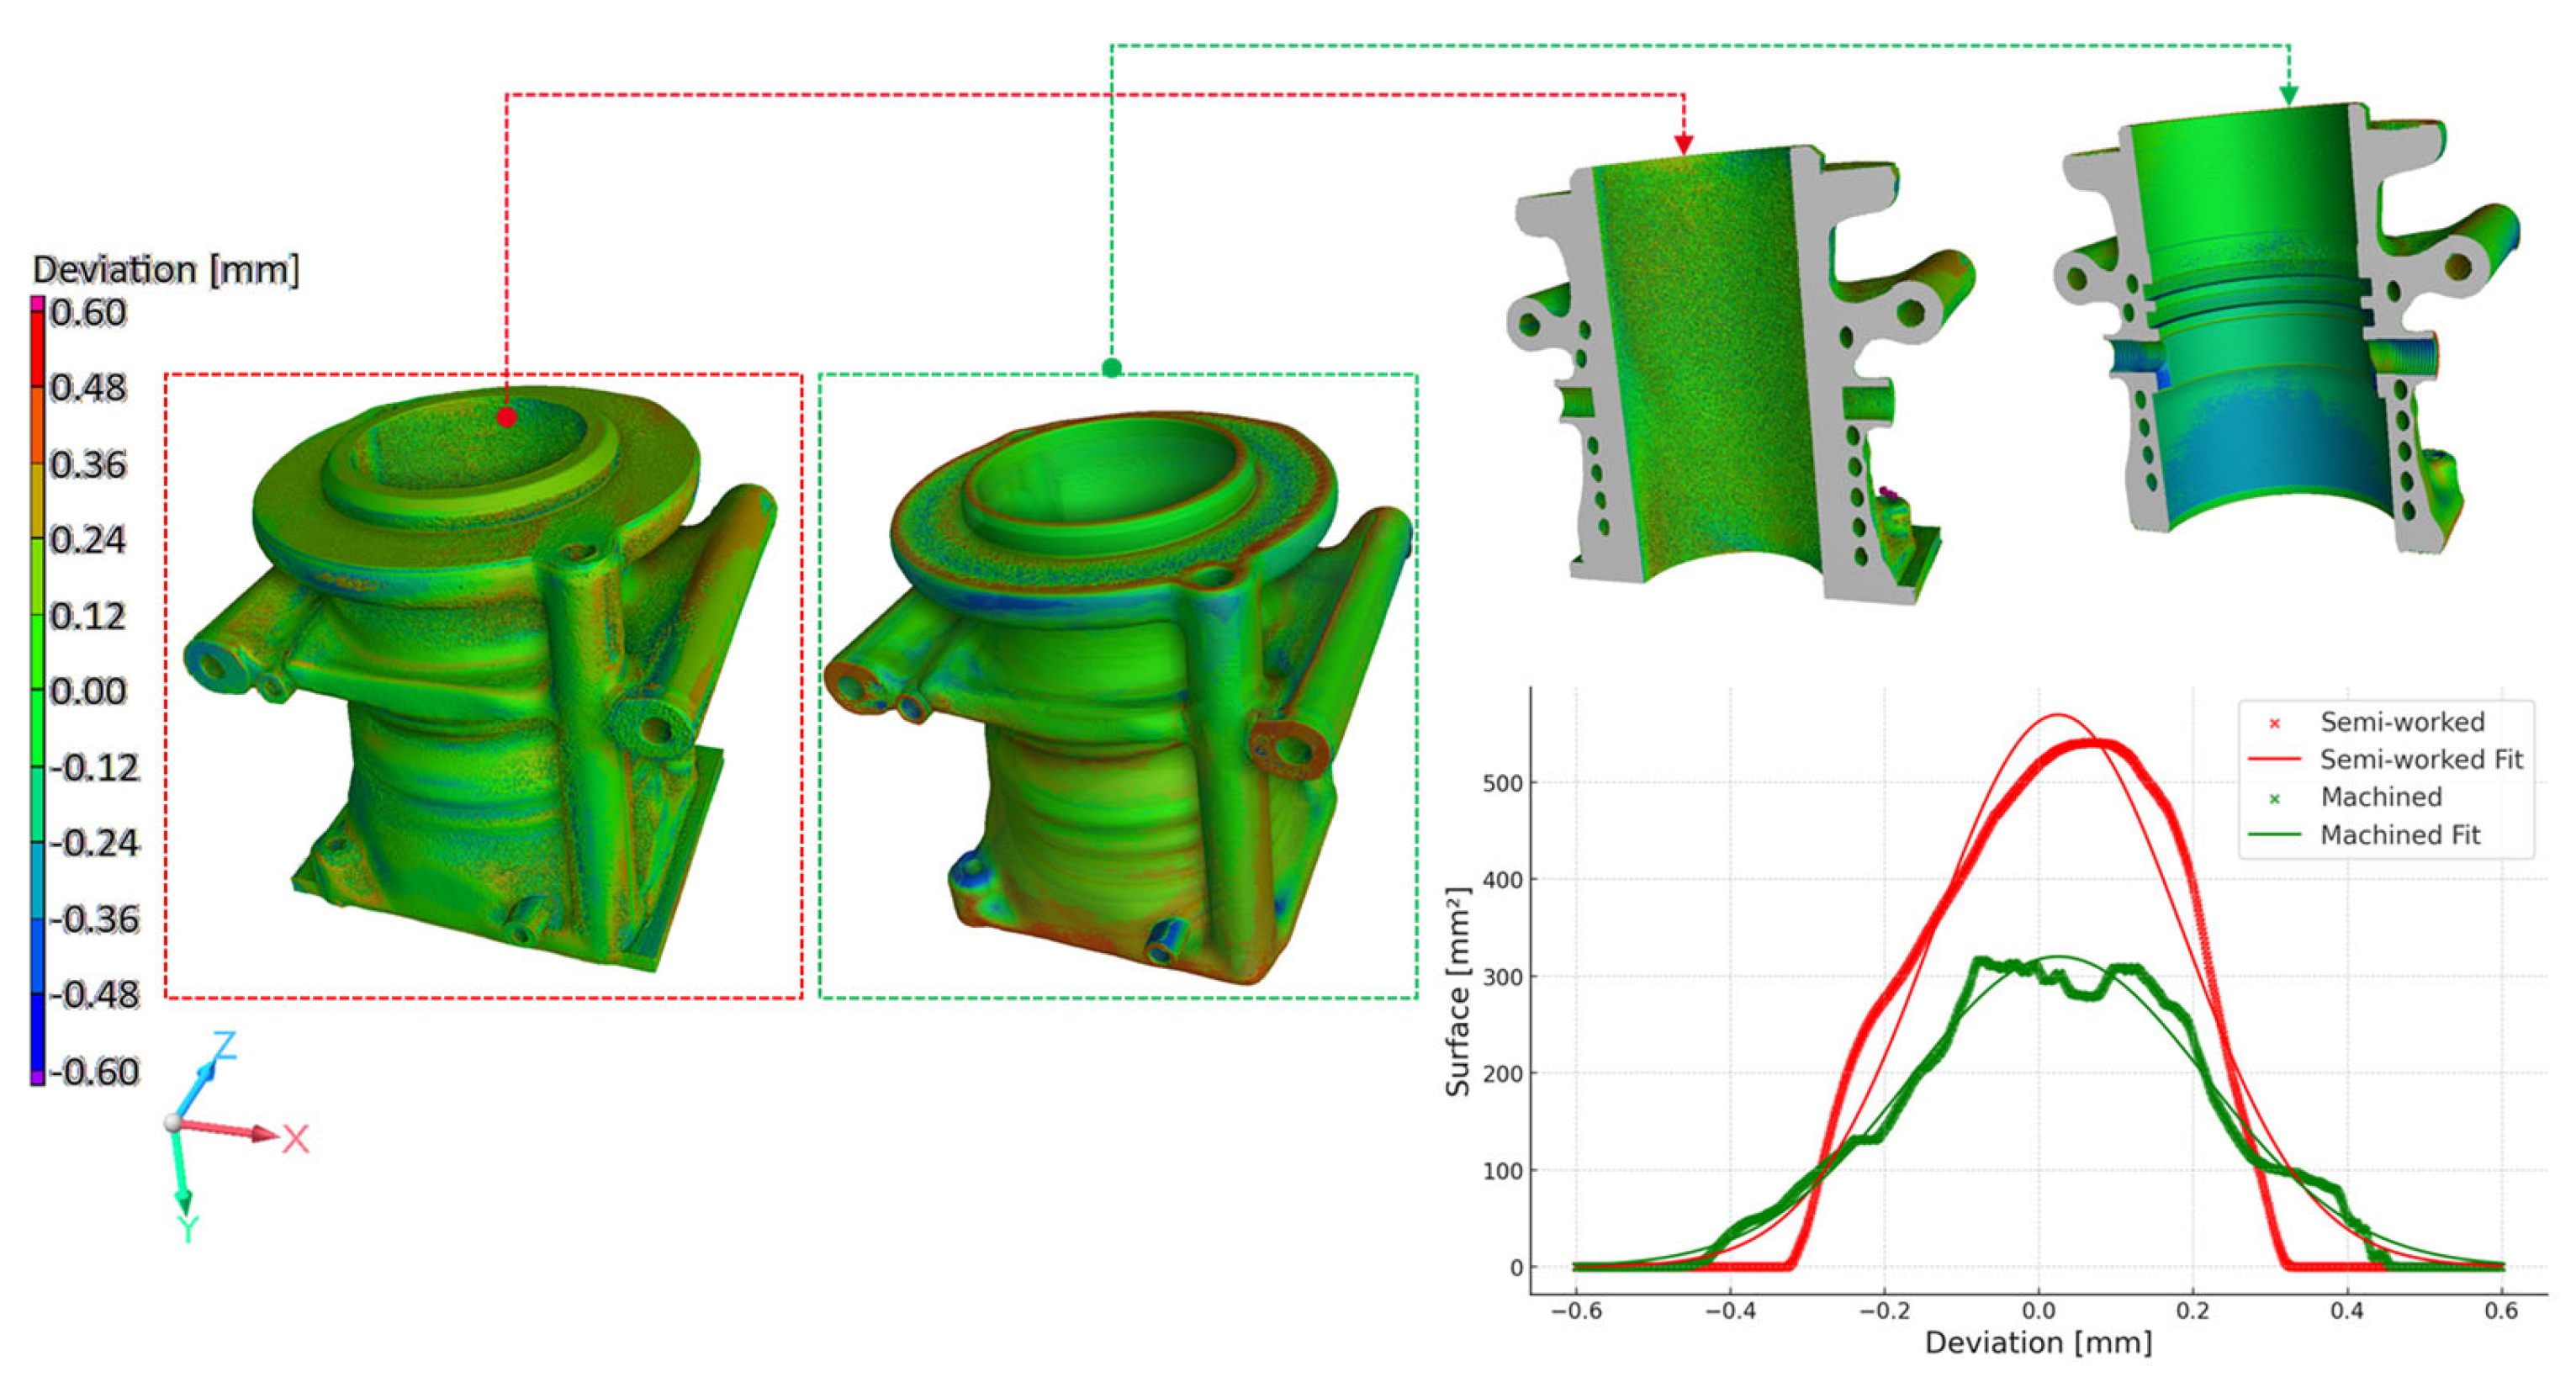
The tomographic volumes were aligned with their respective CAD models using a best-fit registration in VGStudioMax.V 3.5
Figure 21 presents the resulting surface deviation color maps and histograms. The
X-axis of the histogram represents deviation from the nominal CAD surface (in mm), while the
Y-axis quantifies the corresponding surface area (in mm
2) for each deviation range. The semi-worked samples, highlighted in red, exhibit a tall, narrow peak centered around +0.1 mm, indicating that a large portion of the surface consistently shows a small, uniform positive deviation. This suggests that the semi-working process introduces a systematic offset from the nominal geometry rather than random local variability. In contrast, the machined samples, shown in green, display a broader, lower distribution, centered closer to 0 mm. While machining effectively reduces the mean deviation, it is accompanied by a slightly wider spread in surface measurements.
Most deviations for both sample types fall within the range of −0.12 mm to 0.12 mm, as represented by the prevalent green color. Sectional views reveal significant differences in a surface finish: the semi-worked samples display considerable roughness on the interior walls, whereas the machined samples exhibit a much smoother surface. This analysis underscores the impact of manufacturing techniques on dimensional accuracy and surface quality.
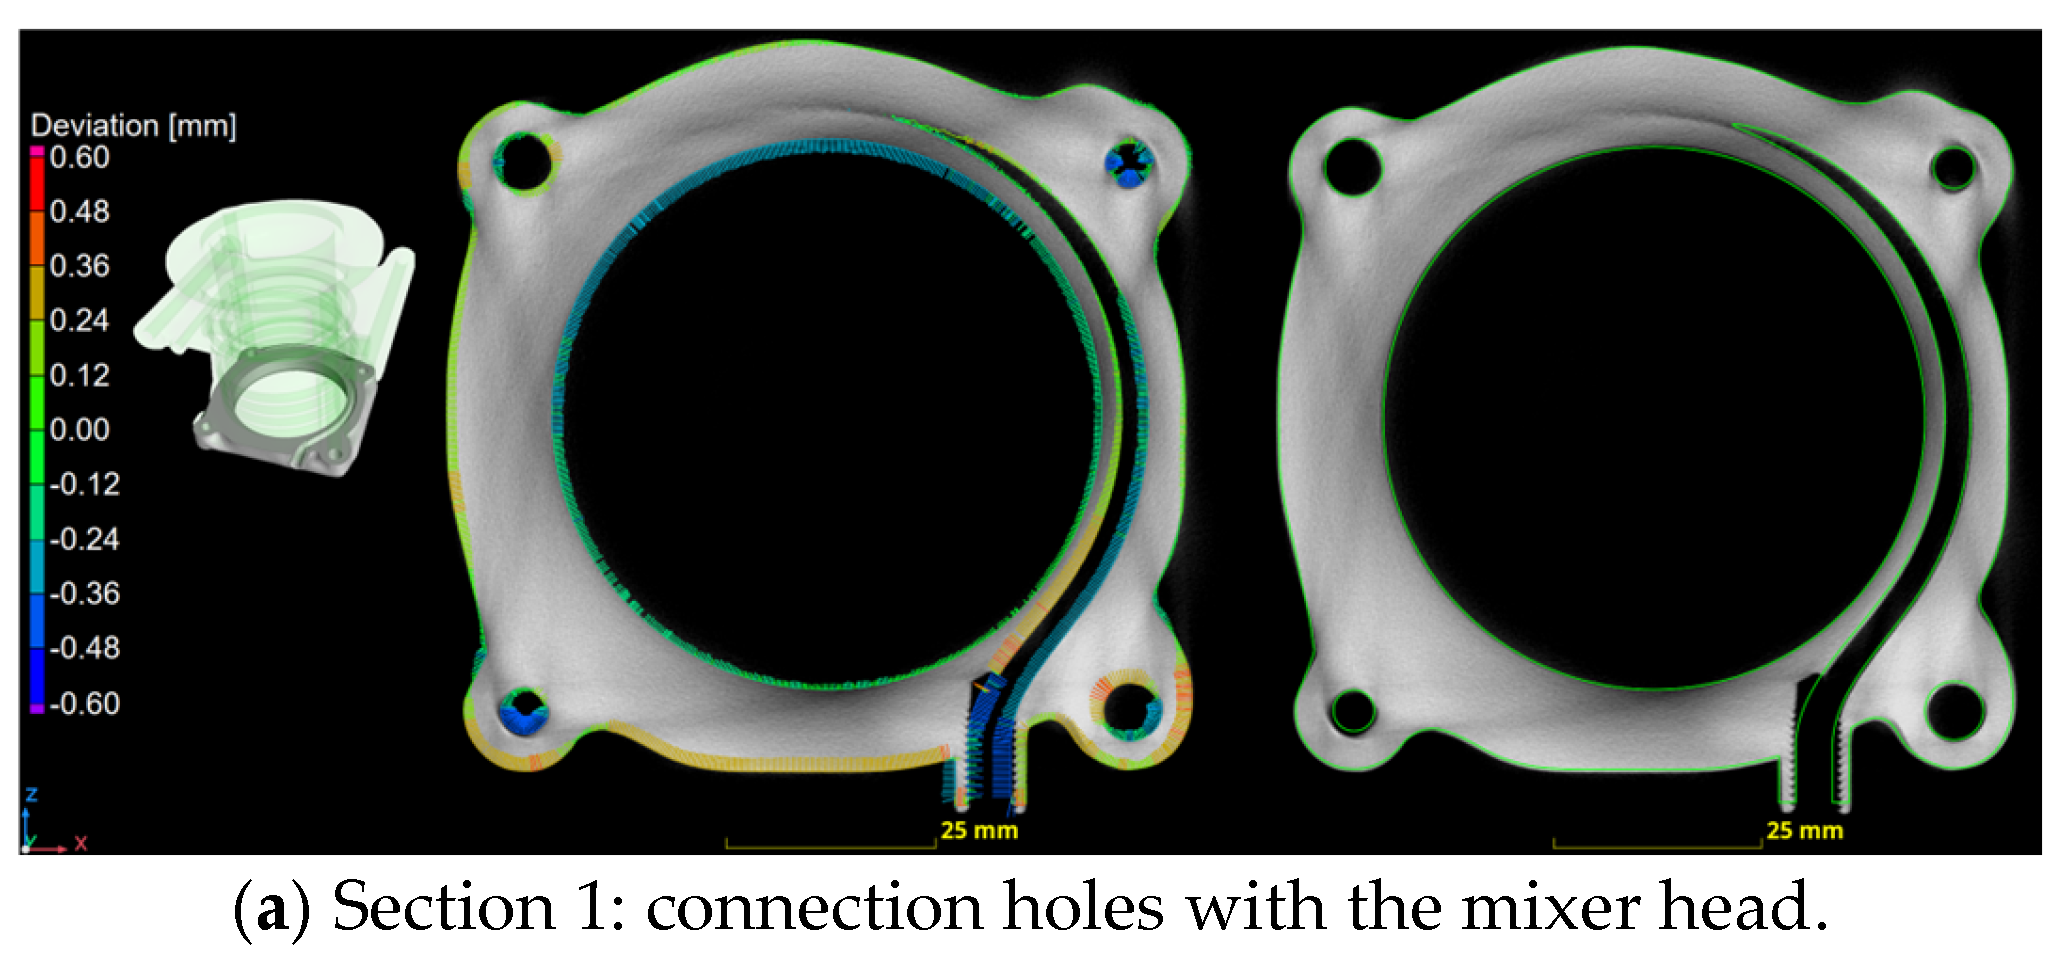
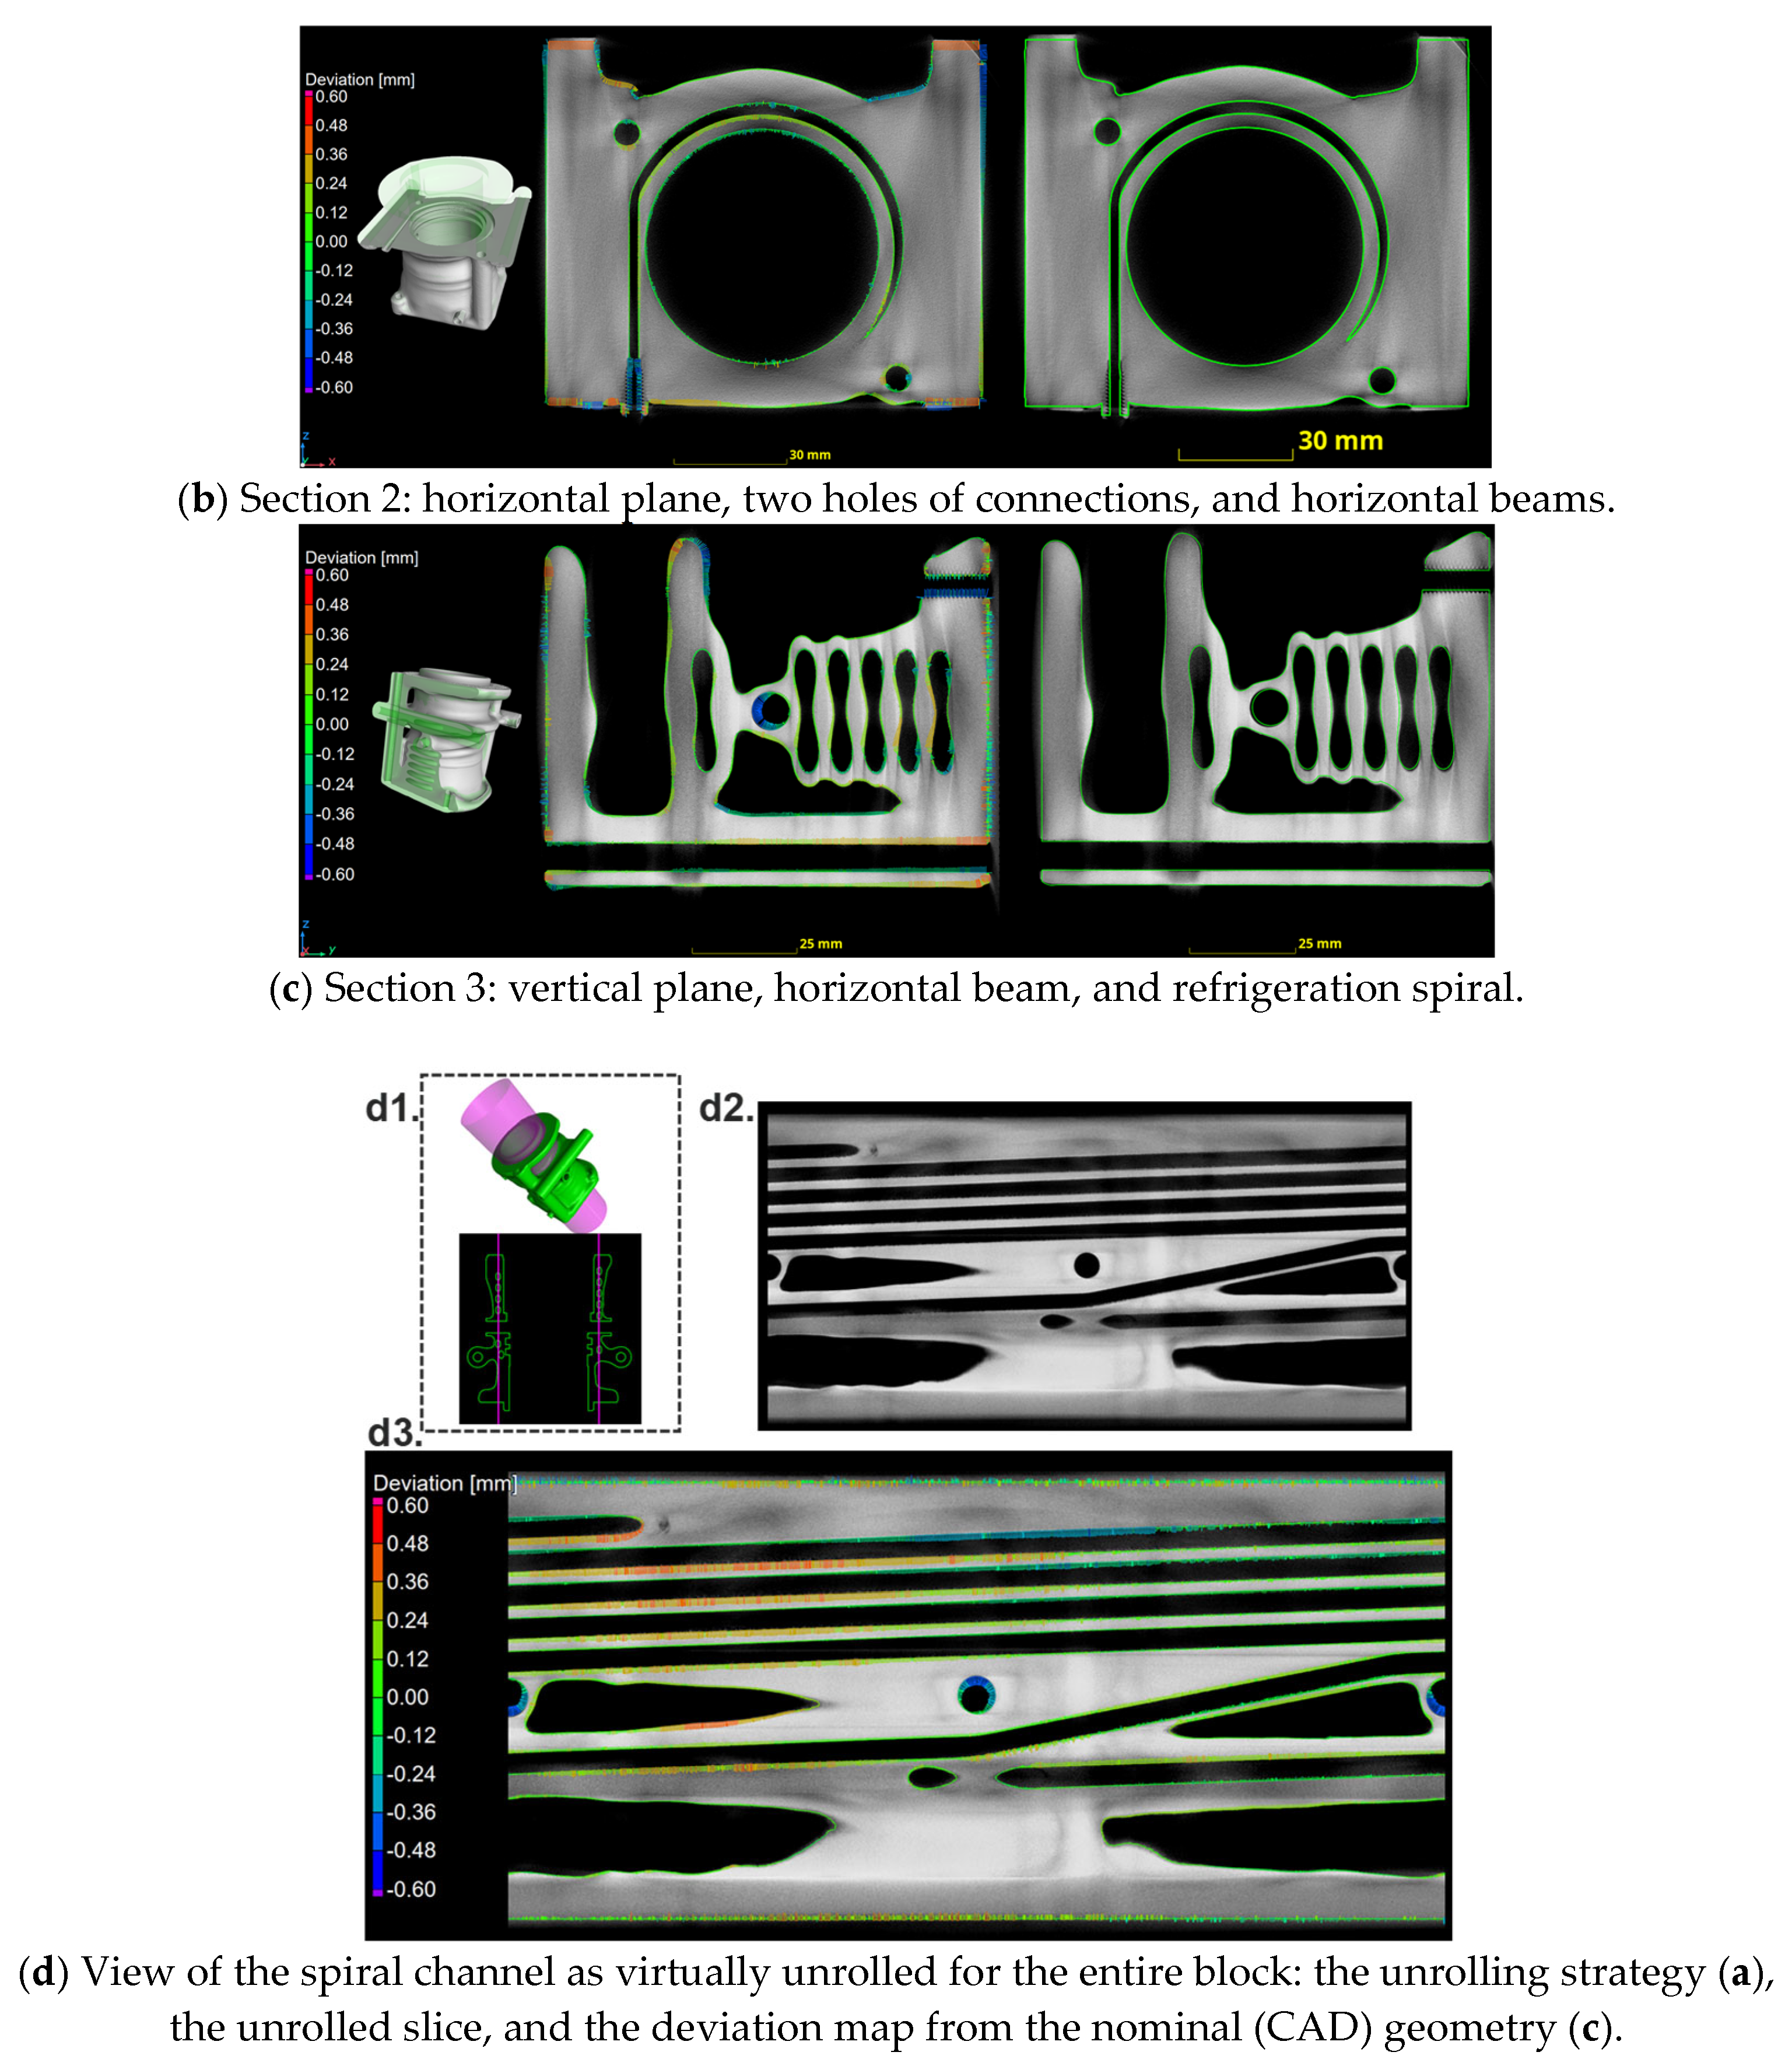
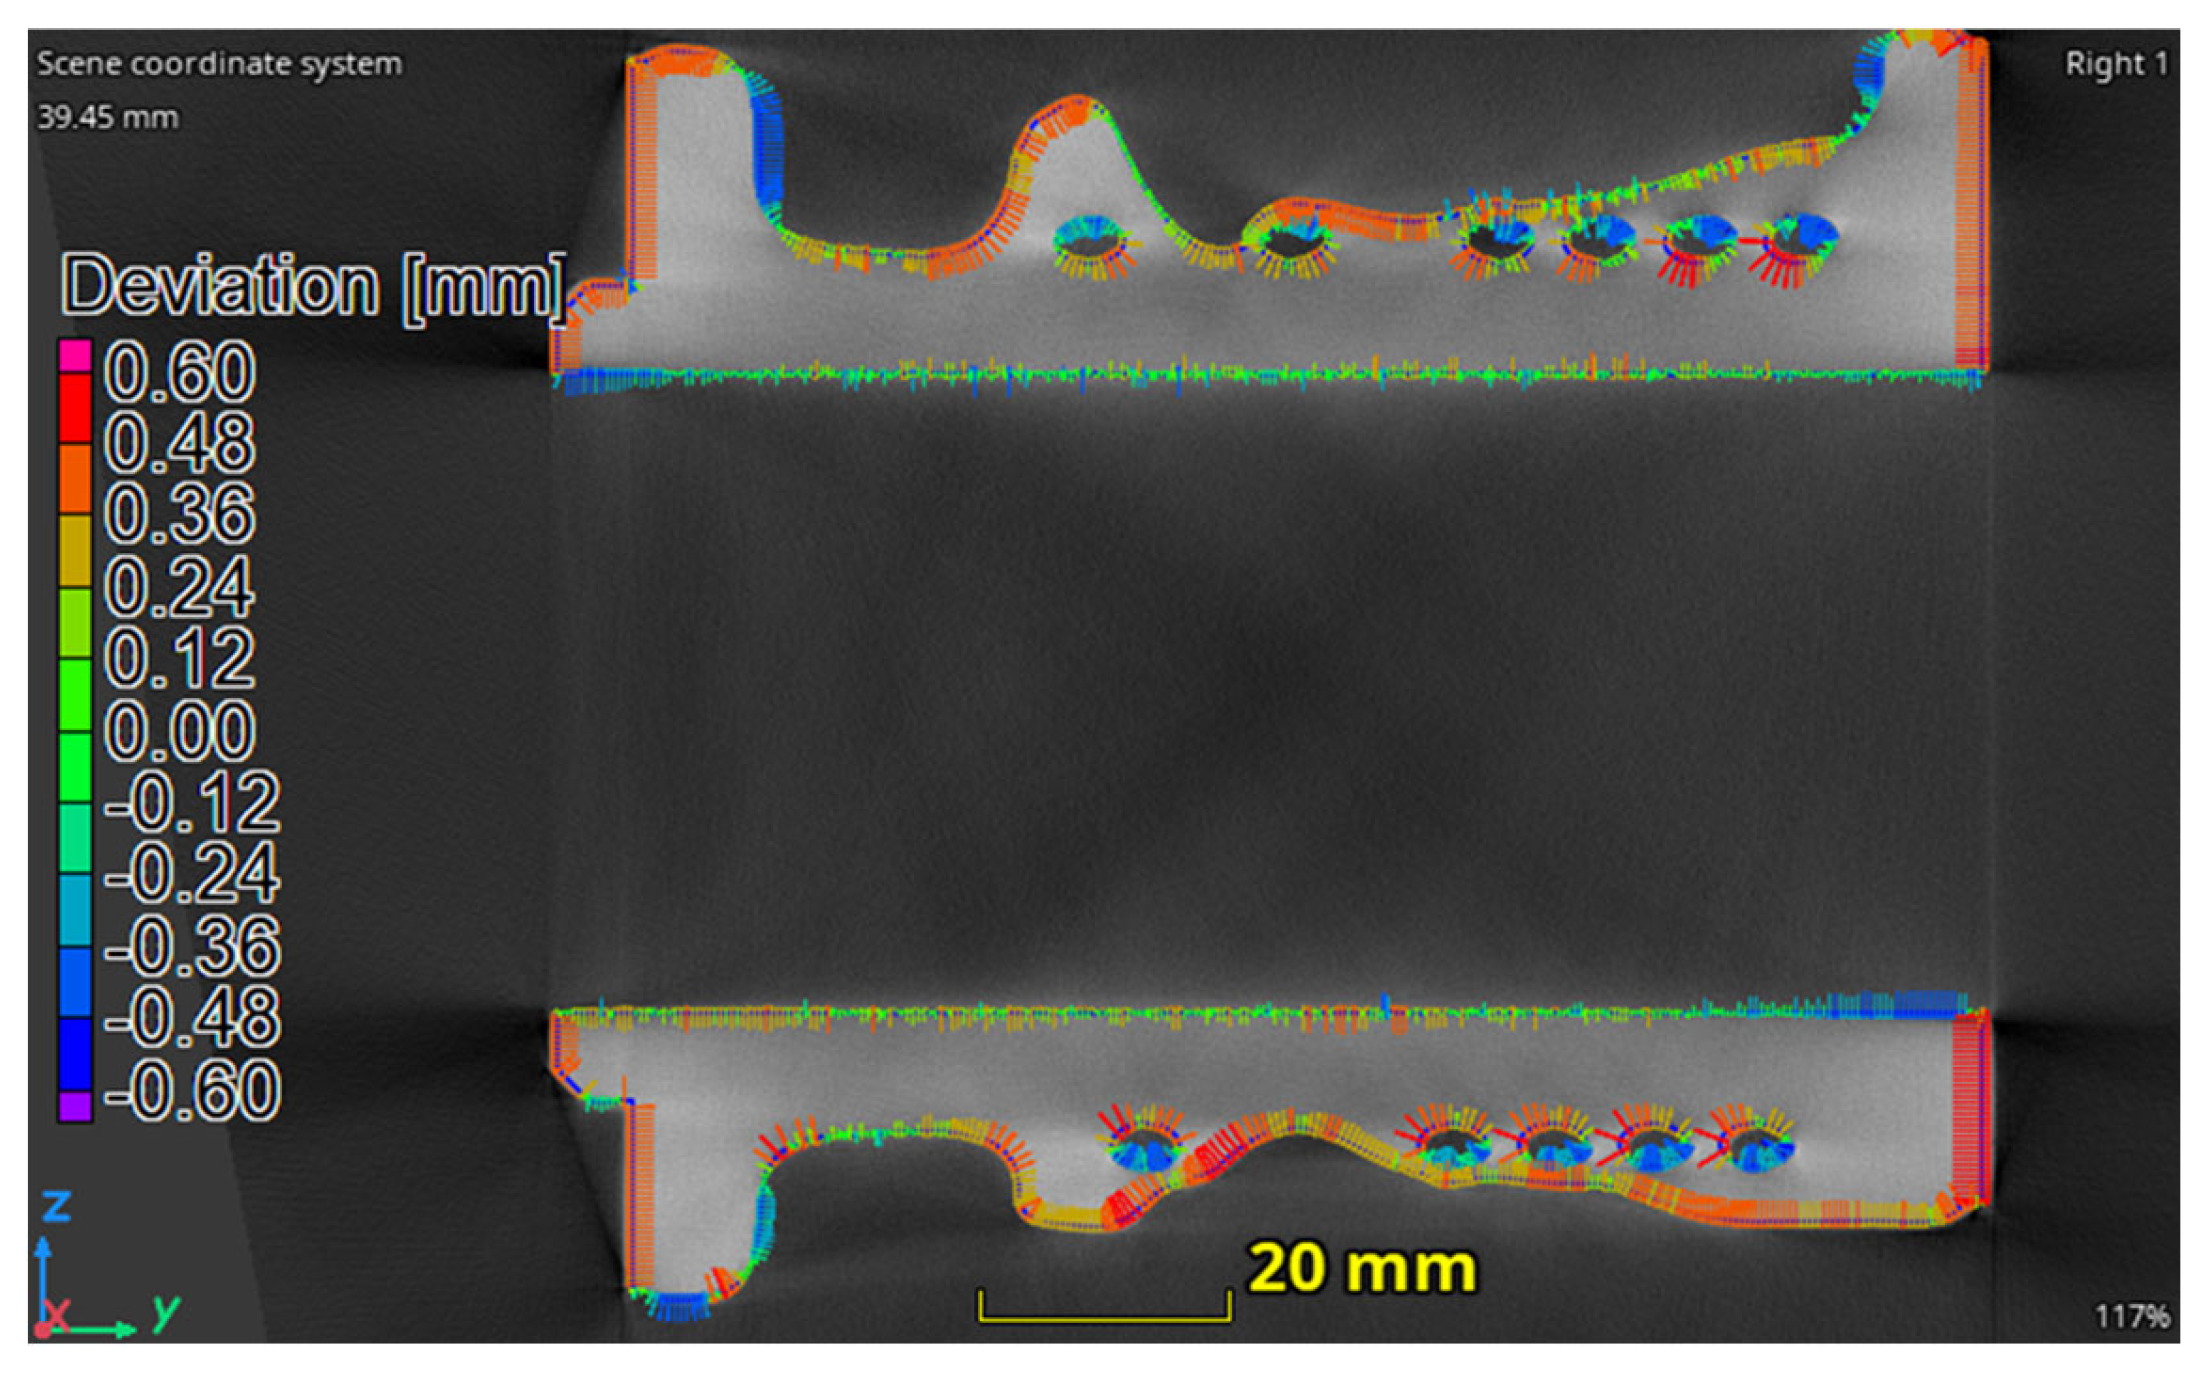
The qualitative comparison (
Figure 22) shows that the horizontal sections have a better match with respect to the vertical sections, which is confirmed by the relative measurements. Among the four holes shown in
Figure 22a, one of them shows good accuracy, with a deviation close to zero for almost the whole circumference, while the other three show differences in half of the circumference, suggesting a misalignment due to a major deformation of the block. Instead, the internal cylinder also shows low values of deviation. The section of the internal spiral has negative values of deviation (around 0.4 mm), suggesting a larger diameter of the internal ducts, although positive values occur as well. The graphic vector representation in
Figure 22b shows that in this case, there are more negative deviation values than positive values in the spiral section, confirming an increase in the internal diameter. The horizontal beams (
Figure 22b) have an asymmetrical behavior, possibly due to the duct spiral that allows for a major distortion to occur. The trend for both sides is to misalign in the outward direction.
Figure 22c shows that the section of the spiral has a positive deviation on one side and a negative deviation on the other side, suggesting a misalignment of the distortions in the vertical direction. The diameter of the vertical beam shows a good match for most of its length, although, toward the end (y-axis direction), there are deviations above 0.3 mm, suggesting a distortion in that area. The beam in the horizontal direction has mainly negative deviation values, suggesting an increase in the internal diameter, as observed for the horizontal plane on the spiral.
Figure 22c shows that the internal cylinder has low deviation values, apart from the lower and the upper parts, where there are some peaks around 0.5 mm deviation. A comparison with the section of the spiral confirms that there is a shift in the refrigeration block toward the outward direction.
4.6. Comparison of the Simulation Results vs. Measured Data
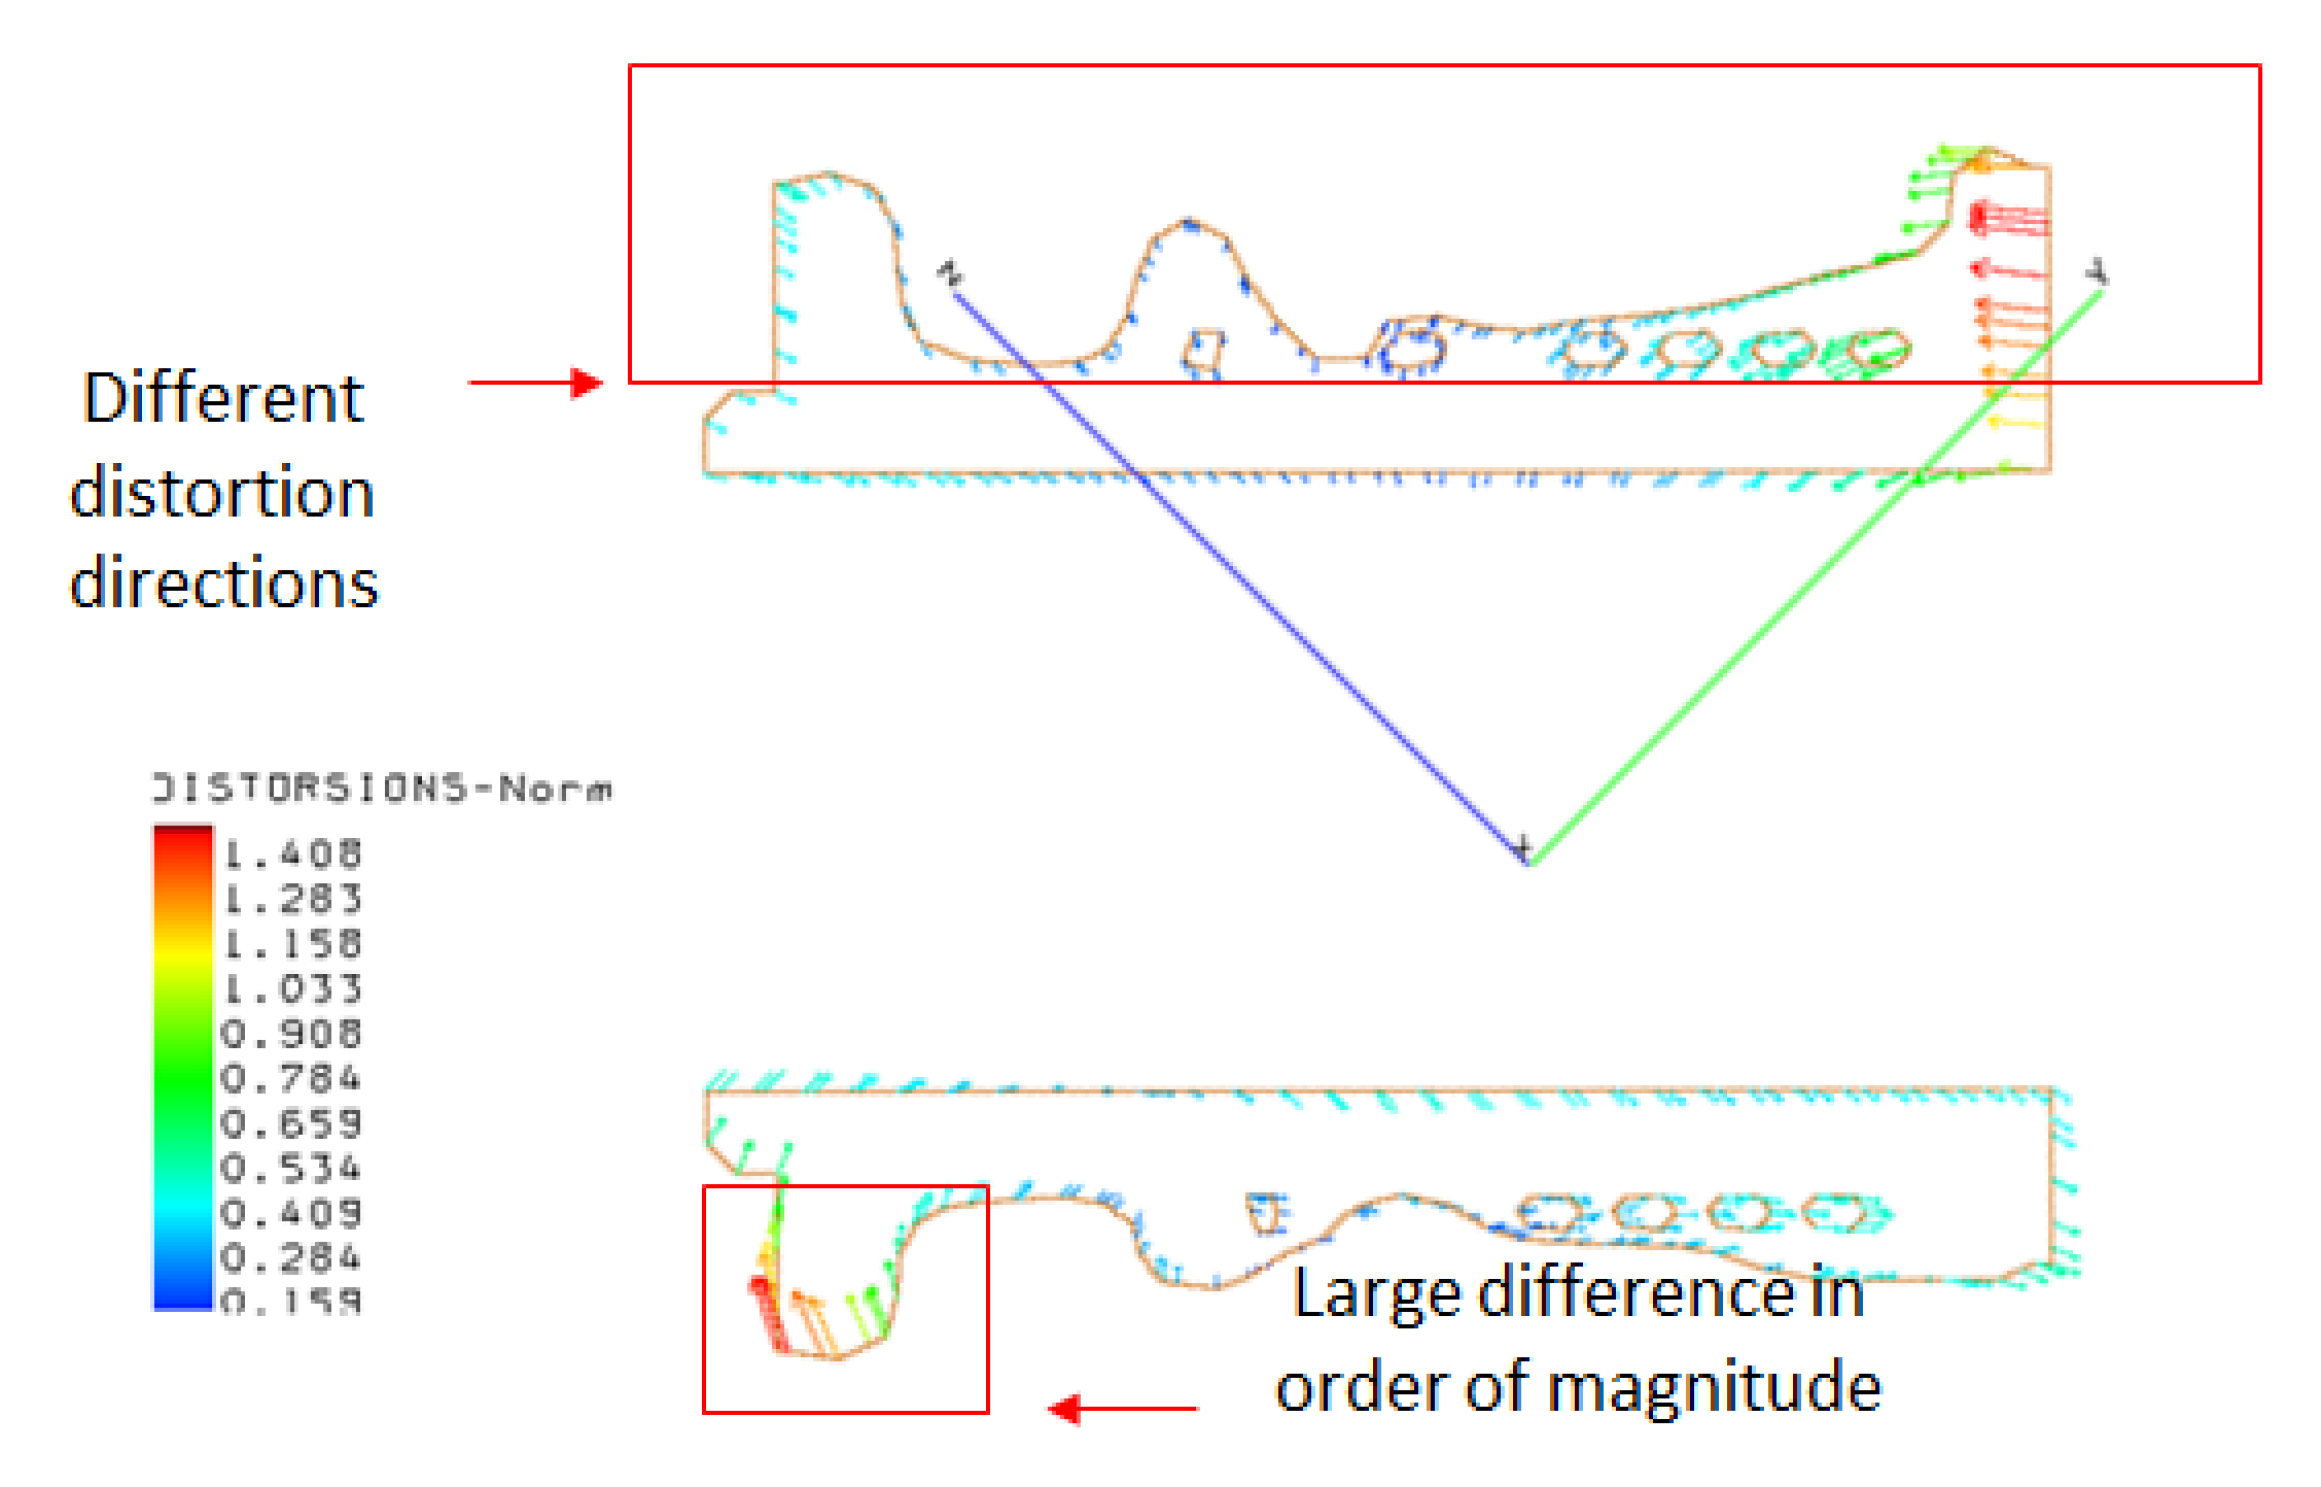
A comparison of the simulation results with the measured data is presented. However, because of the confidentiality of the printing parameters by the manufacturer, it was not possible to have a realistic comparison with the simulation results, but, some parameters based on literature were used in the analysis of comparison.
The supports are supposed to be conventional solid supports used for PBLF prints, and the material properties are the most commonly used ones for AlSi10Mg, considering a powder melting temperature of 500° C. The orientation that was derived from the images presented in the previous section is 45° and modelled as shown in
Figure 23. The parameters shown in
Table 7 were used in the simulation, with the results compared for one of the measured sections (
Figure 24). The measurements of the internal cylinder were similar, with values within the range of 0.2 and −0.4 mm for the measured value and deviation within a range of 0.4 and −0.4 mm for the simulation results. Other areas showed some discrepancy, both in order of magnitude and in the direction of the distortions.
The discrepancy between the measured results and the simulation results may be due to different factors. One of them is the mesh size, which was found to have an impact on the accuracy of the results. A mesh sensitivity was performed to find out the difference to expect among the analyses, but a better correlation may be pursued with the measured data. Another aspect to be addressed is the thermal properties used for the analysis, which are based on the previous literature, but they may play a different role depending on the material, i.e., powder characteristics, used. Some evaluation in this sense may be derived from the porosity measurements, which can give a better correlation of the microstructure of the object and, therefore, of the material characteristics.
The orientation could also have affected the distortions. The support geometry is also important to know when performing simulations, and data on them are normally more difficult to achieve in the literature, where there is an abundance of data on the process parameters. Therefore, this aspect can also be further investigated in future work.
5. Conclusions
This study showed the application of topology optimization for an AM process, i.e., the powder bed laser fusion, which was used to manufacture the refrigeration block, part of the original configuration of a mixer head. The redesign of the refrigeration block demonstrated a reduction of 15% in weight from its original configuration. The topology optimization was performed by assessing different configurations of the in-service conditions, hence, with different loads to find an efficient geometry. It was found out that a multi-step geometry analysis was effective in producing the final design and to address some of the problems that the topology optimization had. In the first phase of this approach, a topology optimization geometry is created with an optimizer (CAESS Protop) and Boolean operations, and it was validated with a final FE analysis. The second phase aims to find the AM technology constraints due to the optimized geometry, which is essential to know before manufacturing the proof of concept. Eventually, a final geometry of the refrigeration block is found with a reduction in weight of up to 58% of the original one. The refrigeration efficiency is also improved, having a different duct configuration made by a spiral that could move more heat in the radial direction, passing from a maximum of 2917 (mW/mm2) in the original configuration to 9312 (mW/mm2) in the redesign. Furthermore, the temperature distribution of the cooled surface is much larger than that of the original configuration.
To allow for the connection of the new refrigeration block to the mixer head, some modifications on the latter were performed by shifting the position of the upper connection holes; therefore, version 2 of the mixer head was created. The novel refrigeration block and mixer head versions were both manufactured with LBAM technology (i.e., AM via LPBF) as a proof of concept. The machine manufacturer was TRUMPF, the model TruPrint 3000 double laser made by WEAREAM S.R.L., via T. Edison n.18, 25050 Provaglio d’ISEO (BS), Italy.
An assessment of the error was performed with X-ray CT scanning. The distortions that occurred during the 3D printing showed a deviation from the nominal of lower than 0.6 mm, although these values were found only on some parts of the geometry, while the majority of the surface had a deviation of 0.4 mm from its nominal value. Such deviations were not deemed to compromise the functionality of the refrigeration block; hence, they were accepted as non-critical. From the tomography measurements, it can be concluded that the porosity was very low, as no pore was found at low resolution (voxel size of ~30 µm), suggesting the absence of micro-porosities.
To evaluate the AM process, the AMTOP® software was used to identify potential criticality and to establish the best printing configuration. A simulation of the LPBF manufacture was performed by using assumed parameters based on the literature, and, although some similarities with the measured results were found, some discrepancies were observed. The order of magnitude is similar for some areas; for example, the interior of the cylinder was simulated to be 0.4 mm versus 0.2 mm of the measured value; however, other areas showed deviation values of the simulation three times larger than the measured ones. Future work can be performed to compare the simulation results versus the measurements to understand which parameters in the simulation are more sensitive to the final results and find out the correlation with the measurements.
CNC milling was shown to be an effective approach that can be used in combination with AM. The feasibility study was successful in terms of manufacturing, resulting in a component with low dimensional errors and a low porosity level. Further tests can demonstrate the functionality in the operative environment and further prove the efficacy of the design and manufacturing.


