Article

Laser Powder Bed Fusion Processing of UNS C64200 Aluminum–Silicon–Bronze

Net Shape Manufacturing Group, Department of Mechanical Engineering, Dalhousie University, Halifax, NS B3H 4R2, Canada
*
Author to whom correspondence should be addressed.
J. Manuf. Mater. Process. 2025, 9(5), 147; https://doi.org/10.3390/jmmp9050147
Submission received: 25 March 2025 / Revised: 24 April 2025 / Accepted: 26 April 2025 / Published: 30 April 2025
(This article belongs to the Special Issue Additive Manufacturing of Copper-Based Alloys)

Abstract

This research focused on developing the processing parameters required to fabricate UNS C64200 aluminum–silicon–bronze (ASB) using laser powder bed fusion (LPBF) additive manufacturing. A full factorial design of experiments (DOE), followed by a central composite DOE, was employed to statistically optimize the as-built density while varying laser power, scan speed, and hatch spacing. Parameter sets that yielded high-density (>99.9%) products were then utilized to manufacture specimens to determine mechanical properties in both the as-built and heat-treated states. The as-built samples exhibited high tensile strength but relatively low ductility and absorbed impact energy, owing to the presence of a mixed α/β’ microstructure. Heat treatment at 620 °C eliminated the martensitic β’ phase, which manifested significant gains in ductility and absorbed energy. As such, the final tensile properties and impact toughness exceeded the Defence Standard minimum requirements for conventionally processed ASB.

1. Introduction

Aluminum bronzes are copper-based alloys in which aluminum is the primary alloying element. This family of alloys exhibits several traits that make it an advantageous selection for many marine-based applications. For instance, aluminum bronzes often have mechanical properties comparable to certain low-alloy steels, while providing excellent corrosion resistance that rivals that of stainless steels in saltwater conditions. They also benefit from improved oxidation resistance at elevated temperatures and often exhibit a tensile ductility > 20% that is not reduced at low temperatures [1].
Additional alloying elements can be added to these alloys to adjust their mechanical and chemical properties. One example is silicon, which increases the strength and impact resistance of the alloy while reducing its coefficient of friction. Termed aluminum–silicon–bronze (ASB), this sub-class of aluminum bronze alloys is specifically applicable in the fabrication of numerous components, including valves, gears, bearings, and bushings commonly utilized in marine applications. ASBs also exhibit excellent formability in the contexts of casting, forging, and machining [2]. They are also known to be compatible with various welding processes [2]. Within the marine defence sector, ASB systems are commonly employed in multiple product forms, including castings, forgings, wrought bars, plates, and sheets. Accordingly, specifications for such materials when used in naval defence scenarios are often stipulated in Defence Standards, such as DefStan 834 [3], developed in the United Kingdom. The specific ASB covered in this standard has been in active use for many years and features a chemical composition closely aligned with wrought UNS C64200 (Cu-Al6.5-Si1.5), with minor differences, including slightly broader ranges for the principal alloying elements and a lower permissible iron content.
An emerging alternative to conventional metal manufacturing techniques is laser powder bed fusion (LPBF). Here, the desired component is built directly through a repetitive sequence of powder spreading and laser irradiation. The laser selectively melts controlled regions of each powder layer, which then solidify into a solid portion of the intended product. This technology has numerous process variables that require careful optimization, as suboptimal parameters can lead to retained porosity, compromising the mechanical performance of the final component. Due to its relatively nascent status, the range of alloys available for commercial-scale LPBF operations remains limited. Most development efforts have focused on certain steels [4], nickel alloys [5], or titanium alloys [6]. Such alloys exhibit a strong absorptance for the radiation emitted from conventional fibre lasers (λ~1 µm); the preferred energy source in the bulk of LPBF systems. This has accelerated their development within the additive manufacturing (AM) community and manifested countless positive developments. However, copper poses a unique challenge due to its high reflectivity to such laser radiation [7], complicating its processing and concomitantly hindering the development and exploitation of copper-based alloys for LPBF.
A growing number of studies have sought to address this constraint by investigating copper alloys laden with alloying additions that are more absorptive of near-infrared radiation. Several of these have investigated nickel aluminum bronze (NAB) systems, such as NAB C95800 (Cu-Al9-Ni5-Fe4). For instance, Barr et al. [8] explored laser powers ranging from 100 to 300 W and scan speeds between 300 and 1200 mm/s, while Murray et al. [9] focused on lower laser powers (85 to 95 W) and generally slower scan speeds (100 to 500 mm/s). Although these parameter sets initially seem disparate, the corresponding linear energy densities (LED) fall within similar ranges, with Barr et al. [8] examining 0.07 to 1 J/mm, and Murray et al. [9] exploring 0.17 to 0.95 J/mm. Following this approach, Barr et al. [8] were able to achieve a peak printed density of 99.97%, while Murray et al. [9] reported a maximum density of 99.1%.
Similarly, NAB C63000 (Cu-Al10.5-Ni4.5-Fe3.5) was examined by Alkelae et al. [10] and Barr et al. [8]. Barr et al. [8] used the same methods as in their C95800 experiments, achieving densities above 99.9% once again. Alkelae et al. [10] tested 25 samples, varying laser power, scan speed, and hatch spacing, with a focus on the tribological aspects of the alloy. For their purposes, a printed density greater than 94% was deemed adequate. Rayner et al. [11] examined the LPBF of NAB C63020 (Cu-Al10-Ni5-Fe5), considering laser powers from 200 to 350 W and scan speeds ranging from 400 to 1200 mm/s. They reported achieving near-100% density with low residual oxygen content when using a laser power of 300 W and a scan speed of 800 mm/s.
These studies also conducted microstructural analyses via optical microscopy (OM), scanning electron microscopy (SEM), and/or transmission electron microscopy (TEM). In all cases, it was noted that as-built NAB exhibited a significantly finer microstructure than its respective wrought or cast counterpart, a characteristic typical of LPBF fabrication. SEM and TEM further highlighted microstructural differences, showing that the wrought NAB featured α bands with uniformly distributed globular κ phases, while as-built samples consisted entirely of martensitic β’.
Quantification of the tensile properties of printed NAB alloys was also performed using tensile specimens to determine the ultimate tensile strength (UTS), yield strength (YS), and ductility. The effects of post-build heat treatment procedures were also evaluated. Rayner et al. [11] reported a yield strength of 336 MPa and a ductility of only 2.9% when testing C63020 in the as-built state. Following conventional heat treatment at 675 °C for 6 h, these properties improved to 485 MPa and 11.4%, respectively. The applied heat treatment greatly diminished the volume fraction of martensitic β’ and invoked a modest coarsening of the α-Cu grains and κ-type phases to the benefit of tensile properties.
Although there exists a growing number of studies on LPBF of aluminum bronzes, a clear lack of studies on ASB alloys persists. Hence, the objective of this work was to investigate, for the first time, the LPBF processing of UNS C64200 ASB—one of the more commercially relevant ASB alloys that maintains widespread use in the marine defence sector. UNS C64200 is an alpha-aluminum bronze that should not have any κ or β phases present. Within NAB systems, different parameters were found for optimum performance within similar alloy compositions; as such, it is expected that ASB would exhibit a greater change in parameters from what has been previously studied.

2. Materials and Methods

2.1. Materials

The starting material utilized in the study was wrought UNS C64200 bar stock (Concast Metal Products Co., Mars, PA, USA). This alloy was selected owing to its general popularity and its close chemical composition to the ASB specified in Defence Standards 02-834 [3] and 02-879 [12,13]. The wrought stock was gas-atomized with argon at GKN Hoeganaes (Cinnaminson, NJ, USA). The resulting atomized powder was then sieved through a tandem of 20 and 53 µm wire mesh sieves using an ultrasonic sieve for 10 min to isolate a cut of powder appropriate for LPBF. The particle size distribution of the sieved powder is shown in Figure 1. The material maintained an average particle size of 33 µm, with 10% and 90% passing sizes of 18 µm and 54 µm, respectively. Additional tests confirmed the powder’s flow rate of 3.1 g/s (MPIF Std. 03 [14]), an apparent density of 4.45 g/cm3 (MPIF Std. 48 [15]), and a tap density of 4.55 g/cm3 (MPIF Std. 46 [16]). These properties corresponded to a Hausner ratio of 1.02, indicating excellent flow characteristics for the granular powder [17]. The theoretical density of the powder was 7.73 g/cm3 as measured through helium pycnometry (Micromeritics (Norcross, GA, USA) AccuPyc II 1340 Pycnometer). Chemical analyses of the starting wrought material and the LPBF powder cut were completed using inductively coupled plasma optical emission spectroscopy (ICP-OES). The results (Table 1) confirmed that both materials were compliant with the specifications for C64200. Figure 2 provides information on the powder shape and internal structure. Morphologically, the powder was primarily spherical, with few satellites or irregularities, as shown in Figure 2a. The particles were predominantly fully dense, though a small percentage contained internal porosity, typical of the gas-atomized powders seen in Figure 2b.

2.2. Specimen Printing

An open-source Aconity3D Mini LPBF system equipped with a 400 W Yb fibre laser was utilized for specimen printing. All samples were printed on a 140 mm diameter build plate made from UNS C63000, under a continuous flow of 99.999% pure argon. During printing, the oxygen level was continuously monitored and remained below 10 ppm throughout all build cycles. The recoater blade, made from silicone, passed over the build plate at a speed of 50 mm/s while being subjected to constant ultrasonic agitation at 180 Hz. In experiments designed to maximize as-built density, 10 mm × 10 mm × 13 mm cuboids with rounded edges in the y-axis were fabricated. A CAD drawing of the cuboid is shown in Figure 3. The scan strategy followed when producing the cuboids (Figure 4) was a meandering pattern rotated in 90° increments. In Layer 1, individual passes were made in the y-direction with a bulk scan pattern oriented toward the positive x-axis. For each subsequent layer, the scan pattern was rotated 90° clockwise from the previous layer. This caused the pattern to repeat every four layers. Contour scans were not applied.
To maximize printed density, a design of experiments (DOE) approach was employed. Preliminary experiments informed by prior work with other bronze alloys, including C61800 [18] and C63020 [11], were used to establish select parameters. These included a laser spot diameter of 0.09 mm, a layer height of 0.03 mm, and a hatch spacing of 0.1 mm.
The first DOE was a full factorial design involving the printing of 21 samples, with laser power ranging from 200 to 300 W and scan speed from 375 to 1125 mm/s. The build was designed using Netfabb 2022. The sample fabrication order was randomized, and the specific positions of each cuboid were selected to minimize overlap in both the x and y axes. Using the results from the first print, a second DOE was created wherein laser power varied from 300 to 400 W, and scan speeds ranged from 700 to 1050 mm/s. Hatch spacing was introduced as a third variable and ranged from 0.080 mm to 0.120 mm. The build included twenty cuboids using a mathematical analysis for spacing optimization to minimize the influence from neighbouring samples.
A third print was performed using the most effective processing parameters found from the second DOE. This print contained six rectangular prisms that were later machined into tensile bars geometrically compliant with MPIF standard 10 [19], along with four cuboids used to verify build quality. The setup of the tensile specimen can be seen in Figure 5. The tensile bars were printed prisms measuring 65 mm × 13 mm × 13 mm and were machined to meet the dimensions of Figure 5b. Any missing length in the tensile bars was removed from the threading to maintain a consistent gauge length. The cuboids remained unchanged from Figure 3, and round pins were added in the event that extra material testing was necessary. These round samples went unused. All samples followed the same meandering zig-zag pattern in 90° increments, as highlighted in Figure 4. The fourth print consisted of eight Charpy impact bars, which were later machined for testing, and two magnetic impedance samples, tested in both as-built and heat-treated conditions.

2.3. Statistical Investigation of Printing Response

The measured densities of printed specimens were compared through various means to identify the parameter ranges that manifested the most promising results. Initially, a basic plot of density vs. volumetric energy density (VED) provided an intuitive visualization of the overall trend. This visualization, combined with the resulting microstructures, allowed for the determination of the processing range for a second, higher resolution DOE. Here, the parameter ranges were narrower and aimed to produce a greater understanding of density as a response surface. While full factorial DOEs are limited to examining linear interactions between variables, the response surface was theorized to have specific peaks within the region of interest and, thus, mandated the use of a non-linear approach. A central composite DOE was thereby employed for the second build to capture these non-linear interactions. The specific placement of the samples not only characterizes the curvature of the response surface but also includes center-point duplicates to assess standard deviation and, in turn, the reproducibility of the process [20].
A central composite design allows for, at most, a second-order regression to characterize the results from a build. As such, the second build was characterized by examining the three input variables of power, scan speed, and hatch spacing, as well as the interactions of each combination. This also allowed for ANOVA to be completed, which was able to determine the most statistically significant variable(s) in producing high-density specimens.
Fitting the system to a regression model enabled the prediction of optimal parameters and allowed for the visualization of expected results within the parameter space. As this DOE involved three input parameters and one response variable (density), the resulting 4D space was simplified by holding one variable constant at its midpoint, plotting two variables on the X and Y axes, and using colour to represent density. This created contour plots that visualize the interactions between any two variables. Using the results of the statistical analysis, effective printing parameters were identified and then utilized to create the third build. Since all components in this build were printed using the same parameters, further statistical analysis was limited to calculating the standard deviation of densities and determination of any outliers.

2.4. Materials Characterization

All samples were removed from the build plate with a bandsaw for further analysis. The first test was Archimedes’ method for density determination following MPIF standard 42 [14], and the results were compared against the density of the powder as measured through helium pycnometry. Select samples were then sectioned with a Struers (Champigny-sur-Marne, France) Minitom diamond saw to reveal the x-y, y-z, and x-z planes. X-ray diffraction (XRD) was then applied on each plane using a Bruker (Madison, WI, USA) D8 Advance XRD machine equipped with a copper source, operated at an accelerating voltage and tube current of 40 kV and 40 mA, respectively, while scanning over a 2θ range of 5° to 100°. XRD specimens were then mounted in PolyFast Bakelite using a Struers (Champigny-sur-Marne, France) CitoPress-1 and subsequently polished in a Struers Tegramin-20 polishing system through a standard series of SiC grinding papers, polishing pads, and diamond pastes. The final step involved polishing the samples using a Pace Technologies (Tucson, AZ, USA) Giga-0900 Vibratory Polisher using a Pace Technologies (Tucson, AZ, USA) MICROPAD 2 polishing pad and Struers (Champigny-sur-Marne, France) OPS non-dry solution. As-polished samples were then imaged using a Keyence (Mississauga, ON, Canada) VK-X1000 laser confocal microscope. Following this, the mounted samples were etched using 1 g of ferric chloride in a solution of 10 mL of hydrochloric acid and 100 mL of water, and then re-imaged. Etched samples were also examined using a Hitachi (Toronto, ON, Canada) Cold-Field Emission S4700 Scanning Electron Microscope (SEM), operated with an accelerating voltage of 10 kV and a beam current of 10 µA.
Bars of wrought C64200, as well as all as-built tensile blanks, were machined into tensile specimens. Two of the printed/machined specimens, as well as all wrought specimens, were heat-treated following the standard cycle for alpha-aluminum bronzes (620 °C for 2 h, followed by water quenching) [21] after machining. Tensile testing was completed with an Instron (Norwood, MA, USA) model 5594-200 HVL load frame equipped with a 50 kN load cell and an Epsilon (Jackson, WY, USA) 3542 extensometer that remained attached through the point of fracture. All tensile tests were loaded at a rate of 5 MPa/s.
Further samples were produced under optimal printing conditions to fabricate Charpy impact bars, magnetic permeability samples, and density cuboids for electron backscatter diffraction (EBSD) analysis. Testing was conducted on both as-printed and heat-treated samples. The magnetic permeability samples were tested using a NDT Supply (Lenexa, KS, USA) FerroMaster magnetic permeability probe. The Charpy impact bars were machined to meet the surface finish requirements, then notched as per ASTM E23-23 [22], and tested. For EBSD, the density cuboids were sectioned, mounted, and polished using the same procedure as previously outlined. Each sample was then examined at multiple magnifications using a ThermoScientific (Dartmouth, NS, Canada) Apreo 2 S LoVac SEM operated at 20 kV and equipped with an Oxford Instruments (Abingdon, UK) Symmetry 3 EBSD detector.

3. Results

3.1. Full Factorial DOE Build

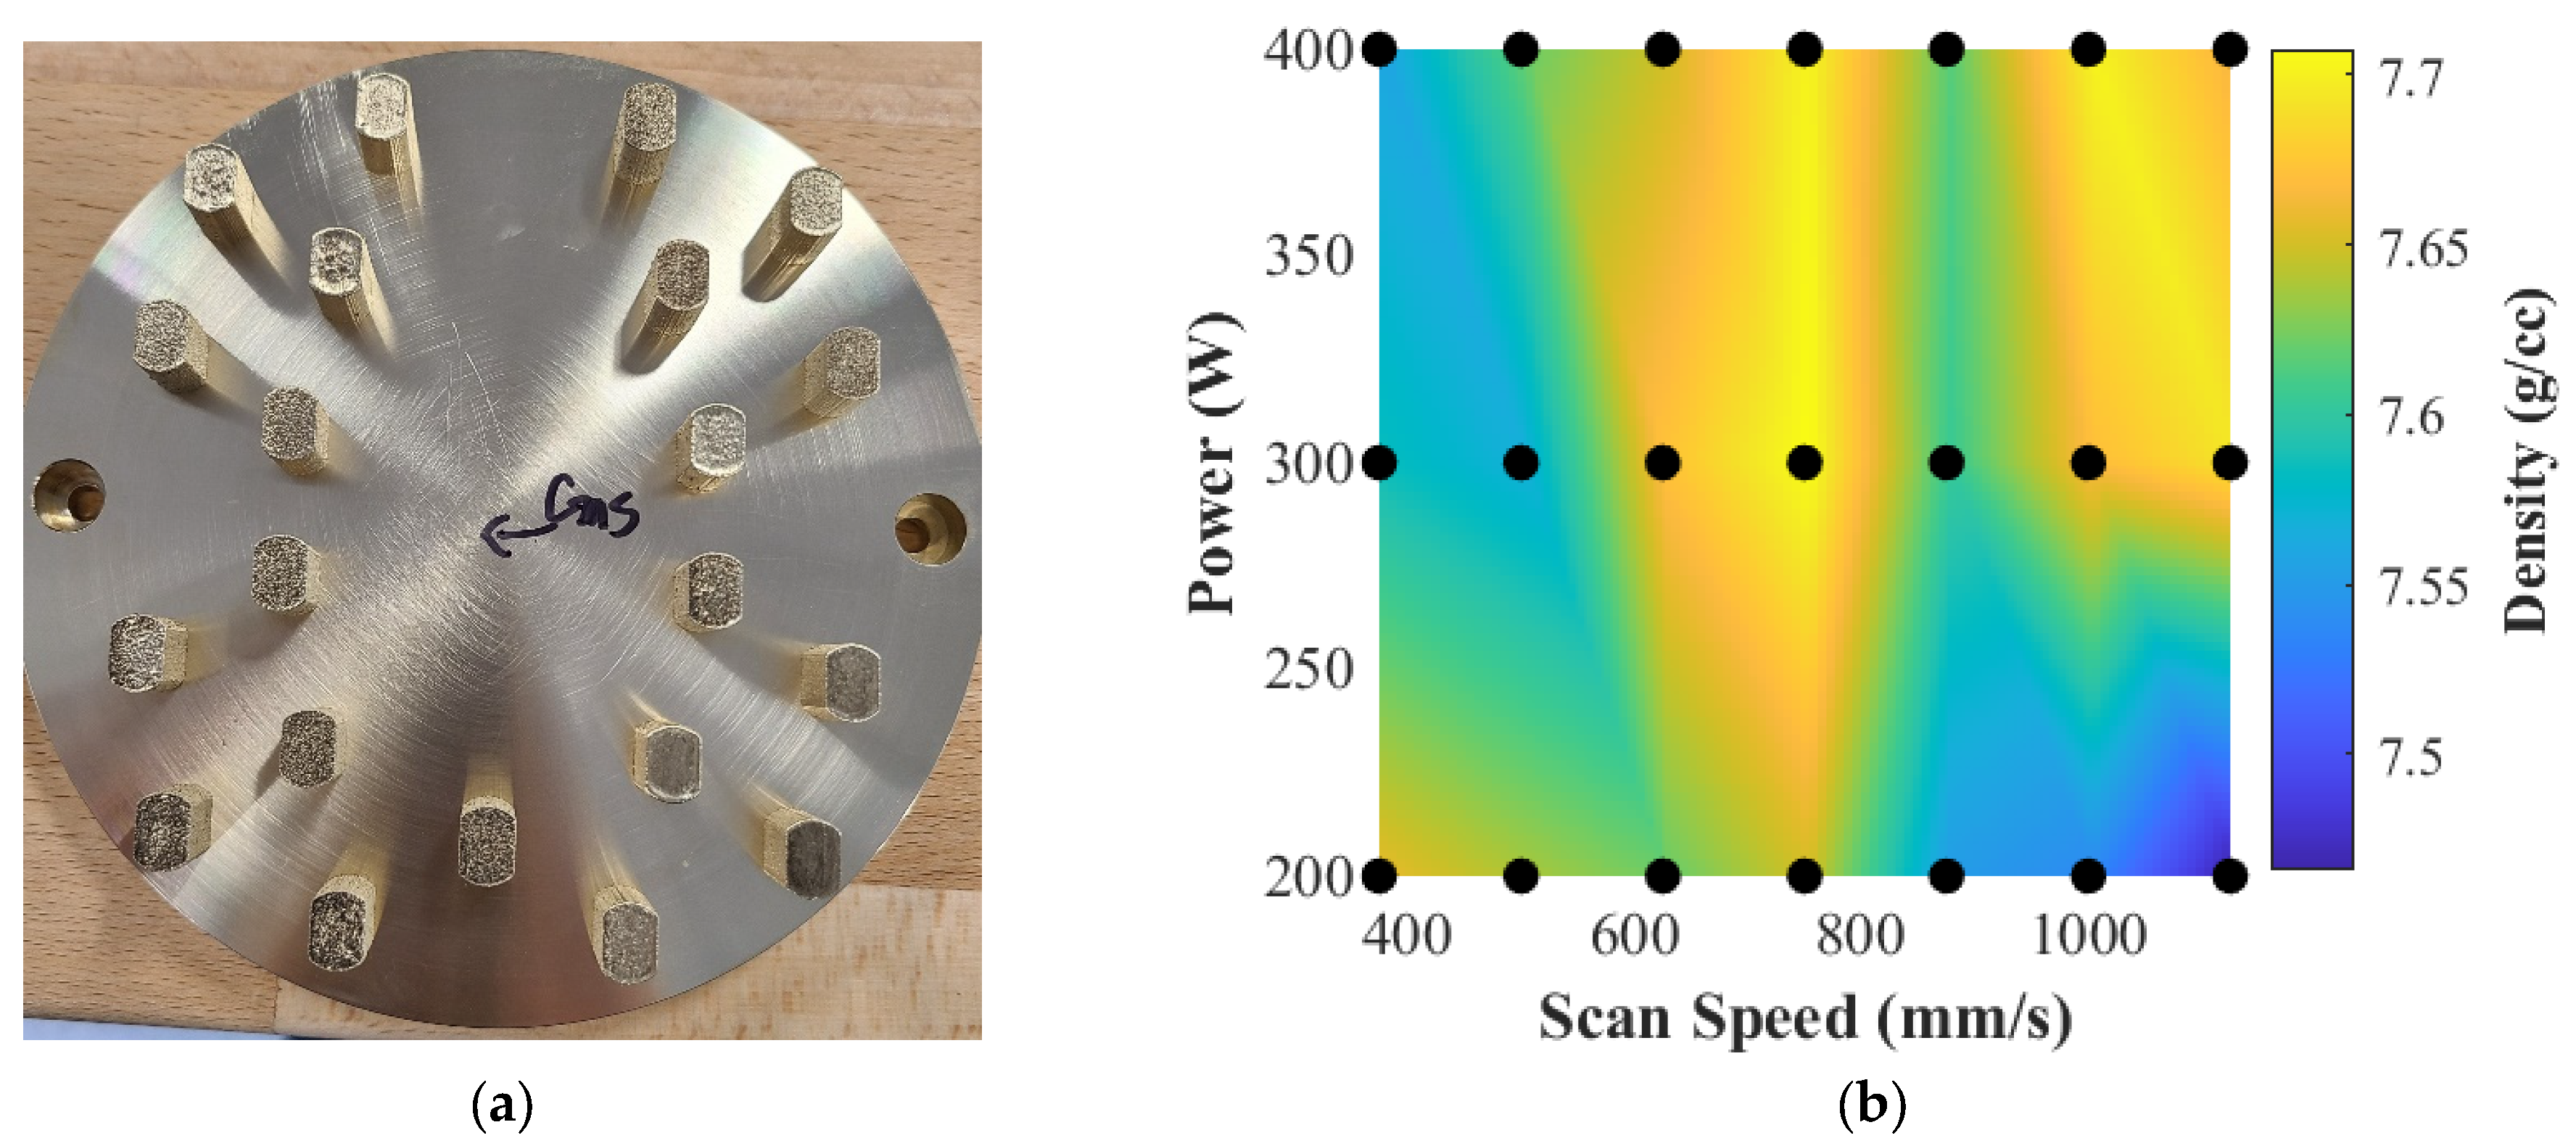
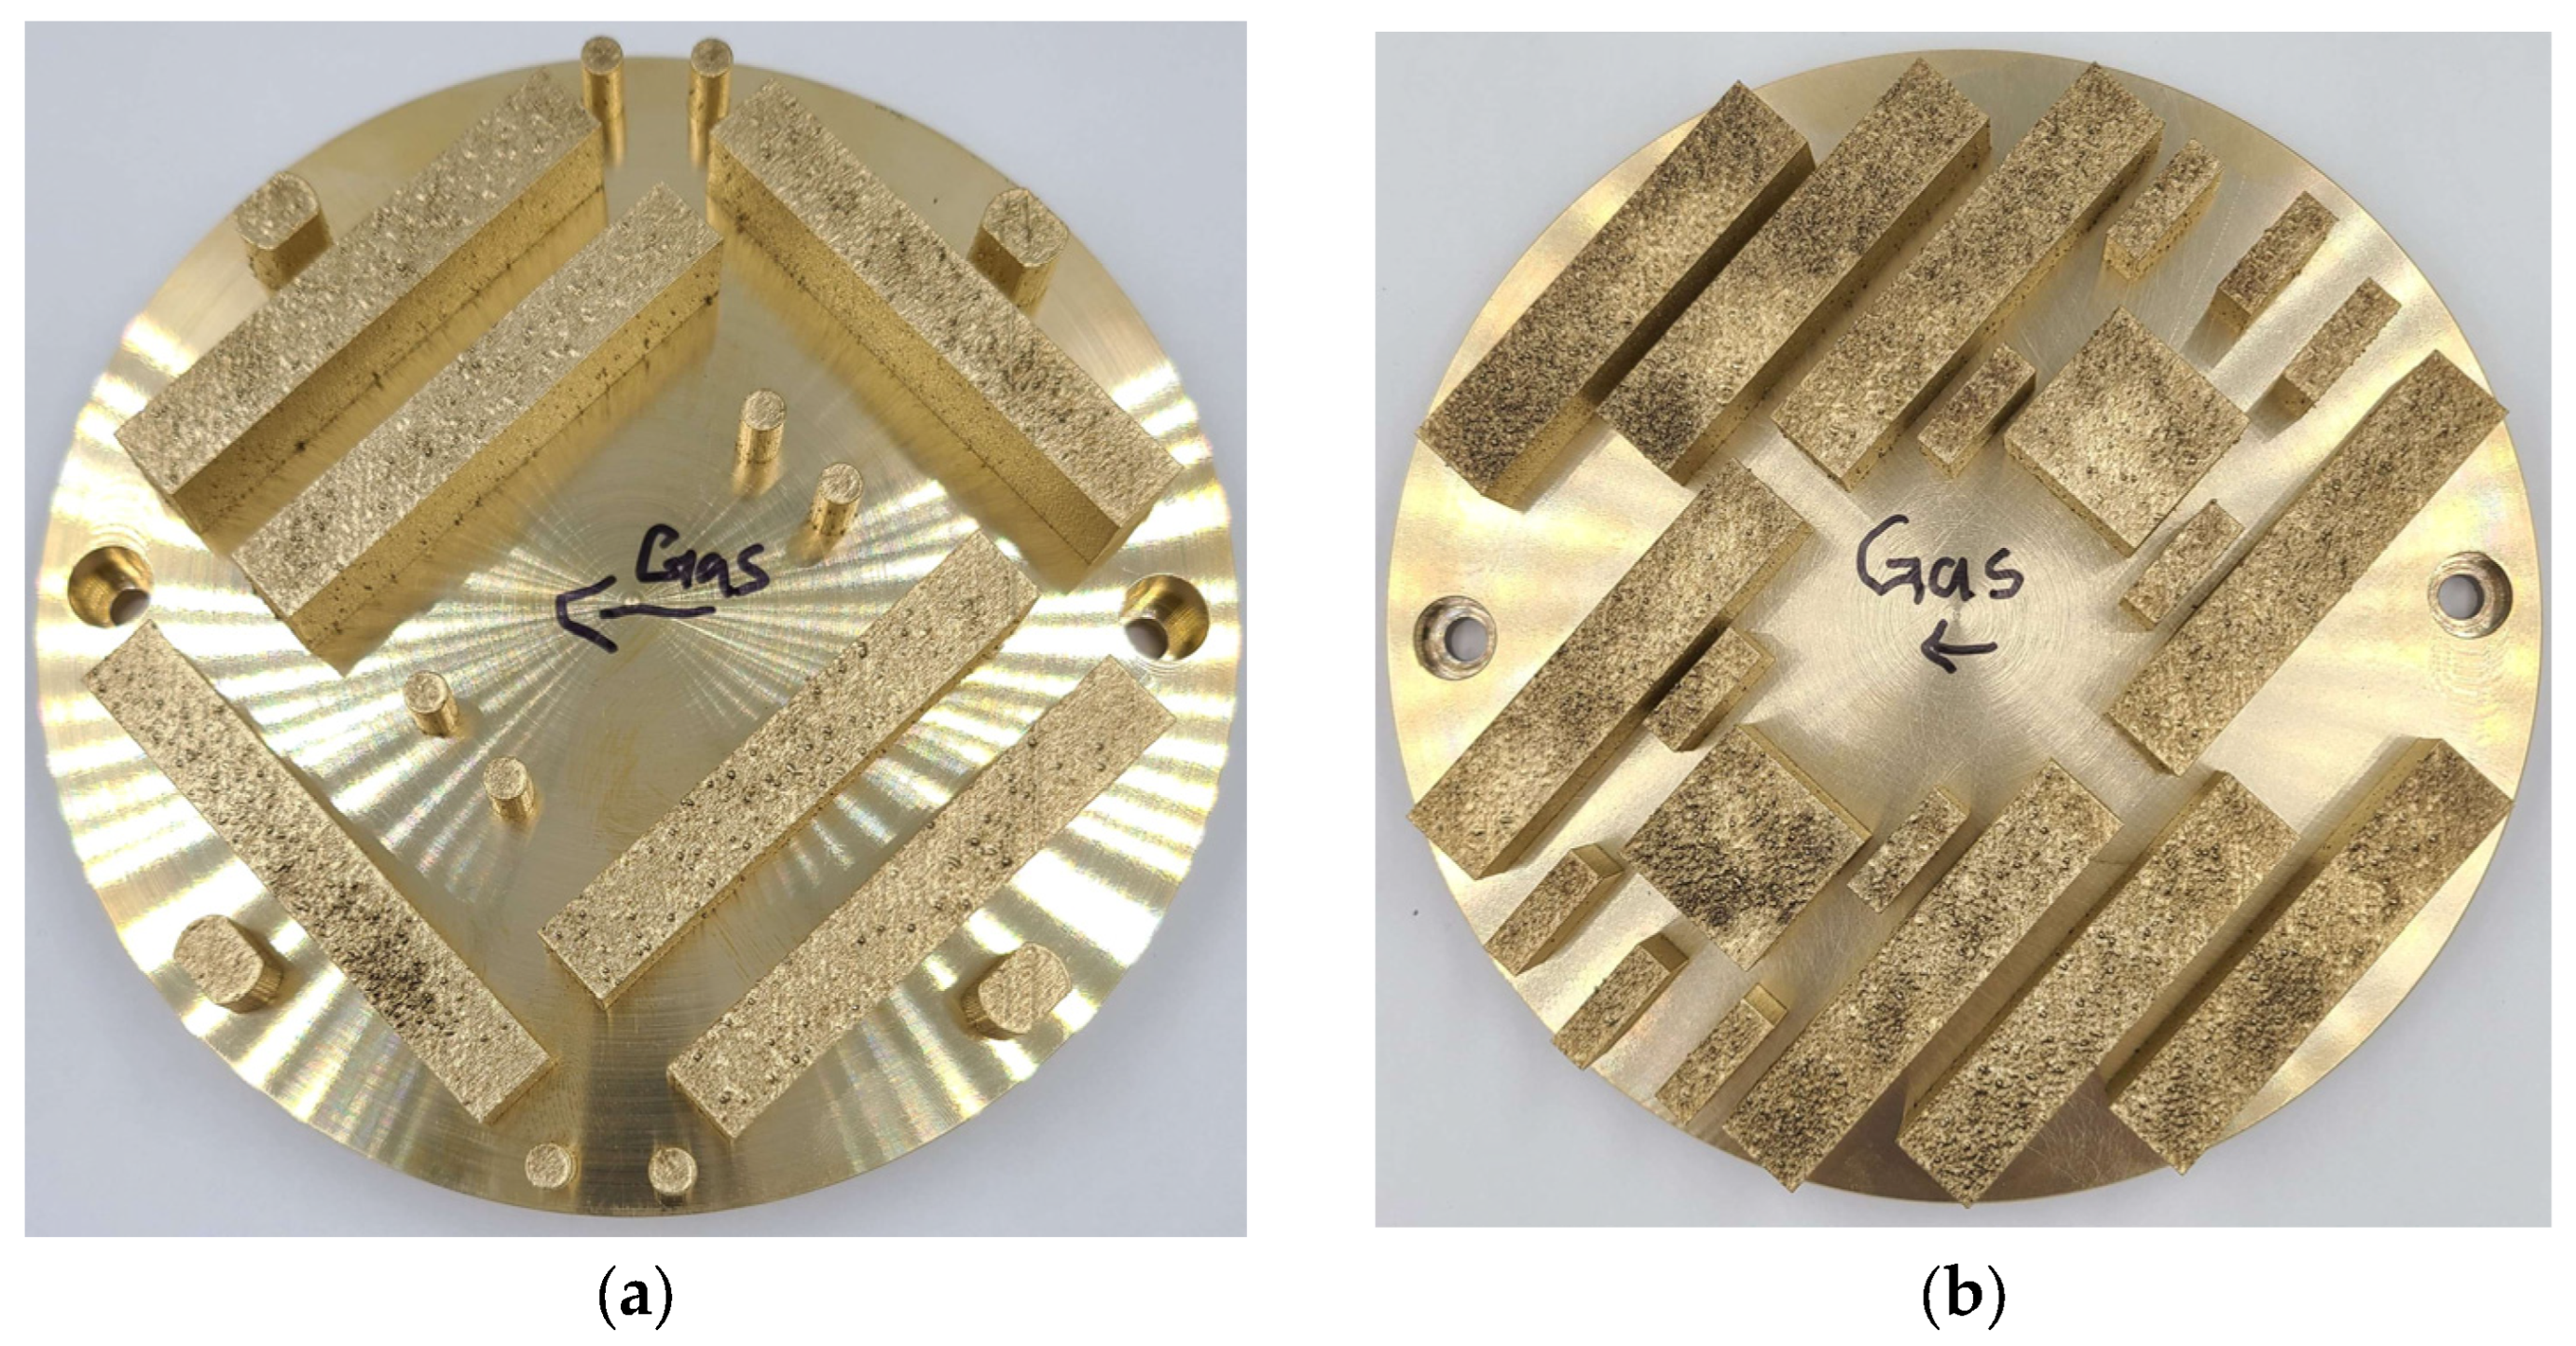
The specimens fabricated in the full factorial DOE build are shown in Figure 6. All samples were built successfully, with none requiring discontinuation as a result of defects such as over- or underbuilding, delamination, tearing from the build plate, etc. The measured cuboid densities ranged from 96.6% to 99.7% of the theoretical maximum (7.73 g/cm3).
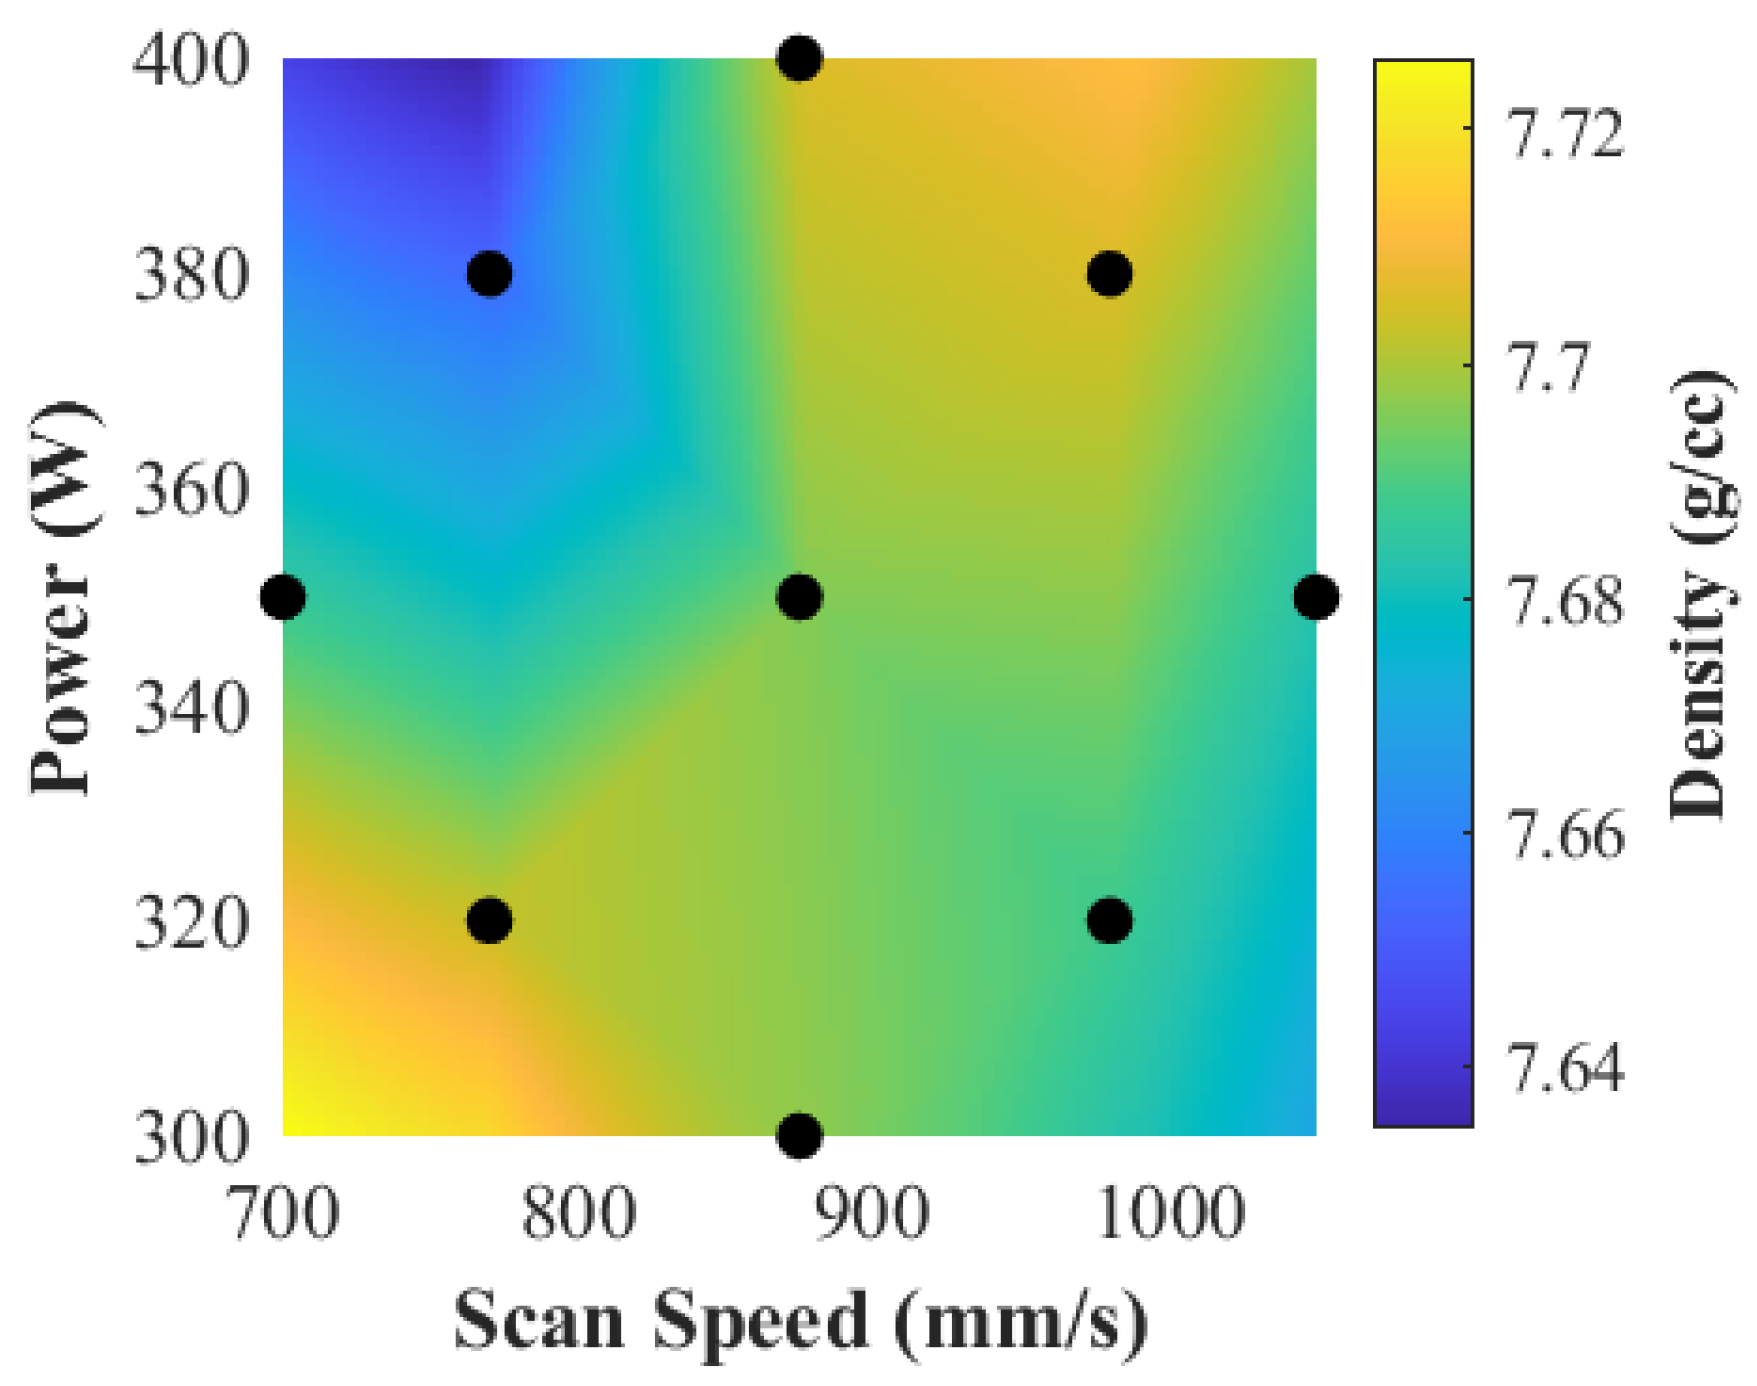
Figure 6b shows a surface map that utilizes density as colour with respect to the scan speed and laser power on the x- and y-axes, respectively. The black dots on the figure represent actual combinations of parameters tested. The maximum density was achieved at a laser power of 300 W and a scan speed of 750 mm/s. Interestingly, these values were closely aligned with high-density processing parameters deduced for C63020 NAB [11]. This implied that the two alloys responded similarly in an LPBF context despite having significant chemical differences in their respective concentrations of copper, aluminum, iron, and nickel. In general, the plot showed parameter ranges that would be appropriate for further analysis. While the density measurements alone show the center point performed the best, this plot also demonstrates that the 1000 mm/s samples also performed favorably and merit further exploration.
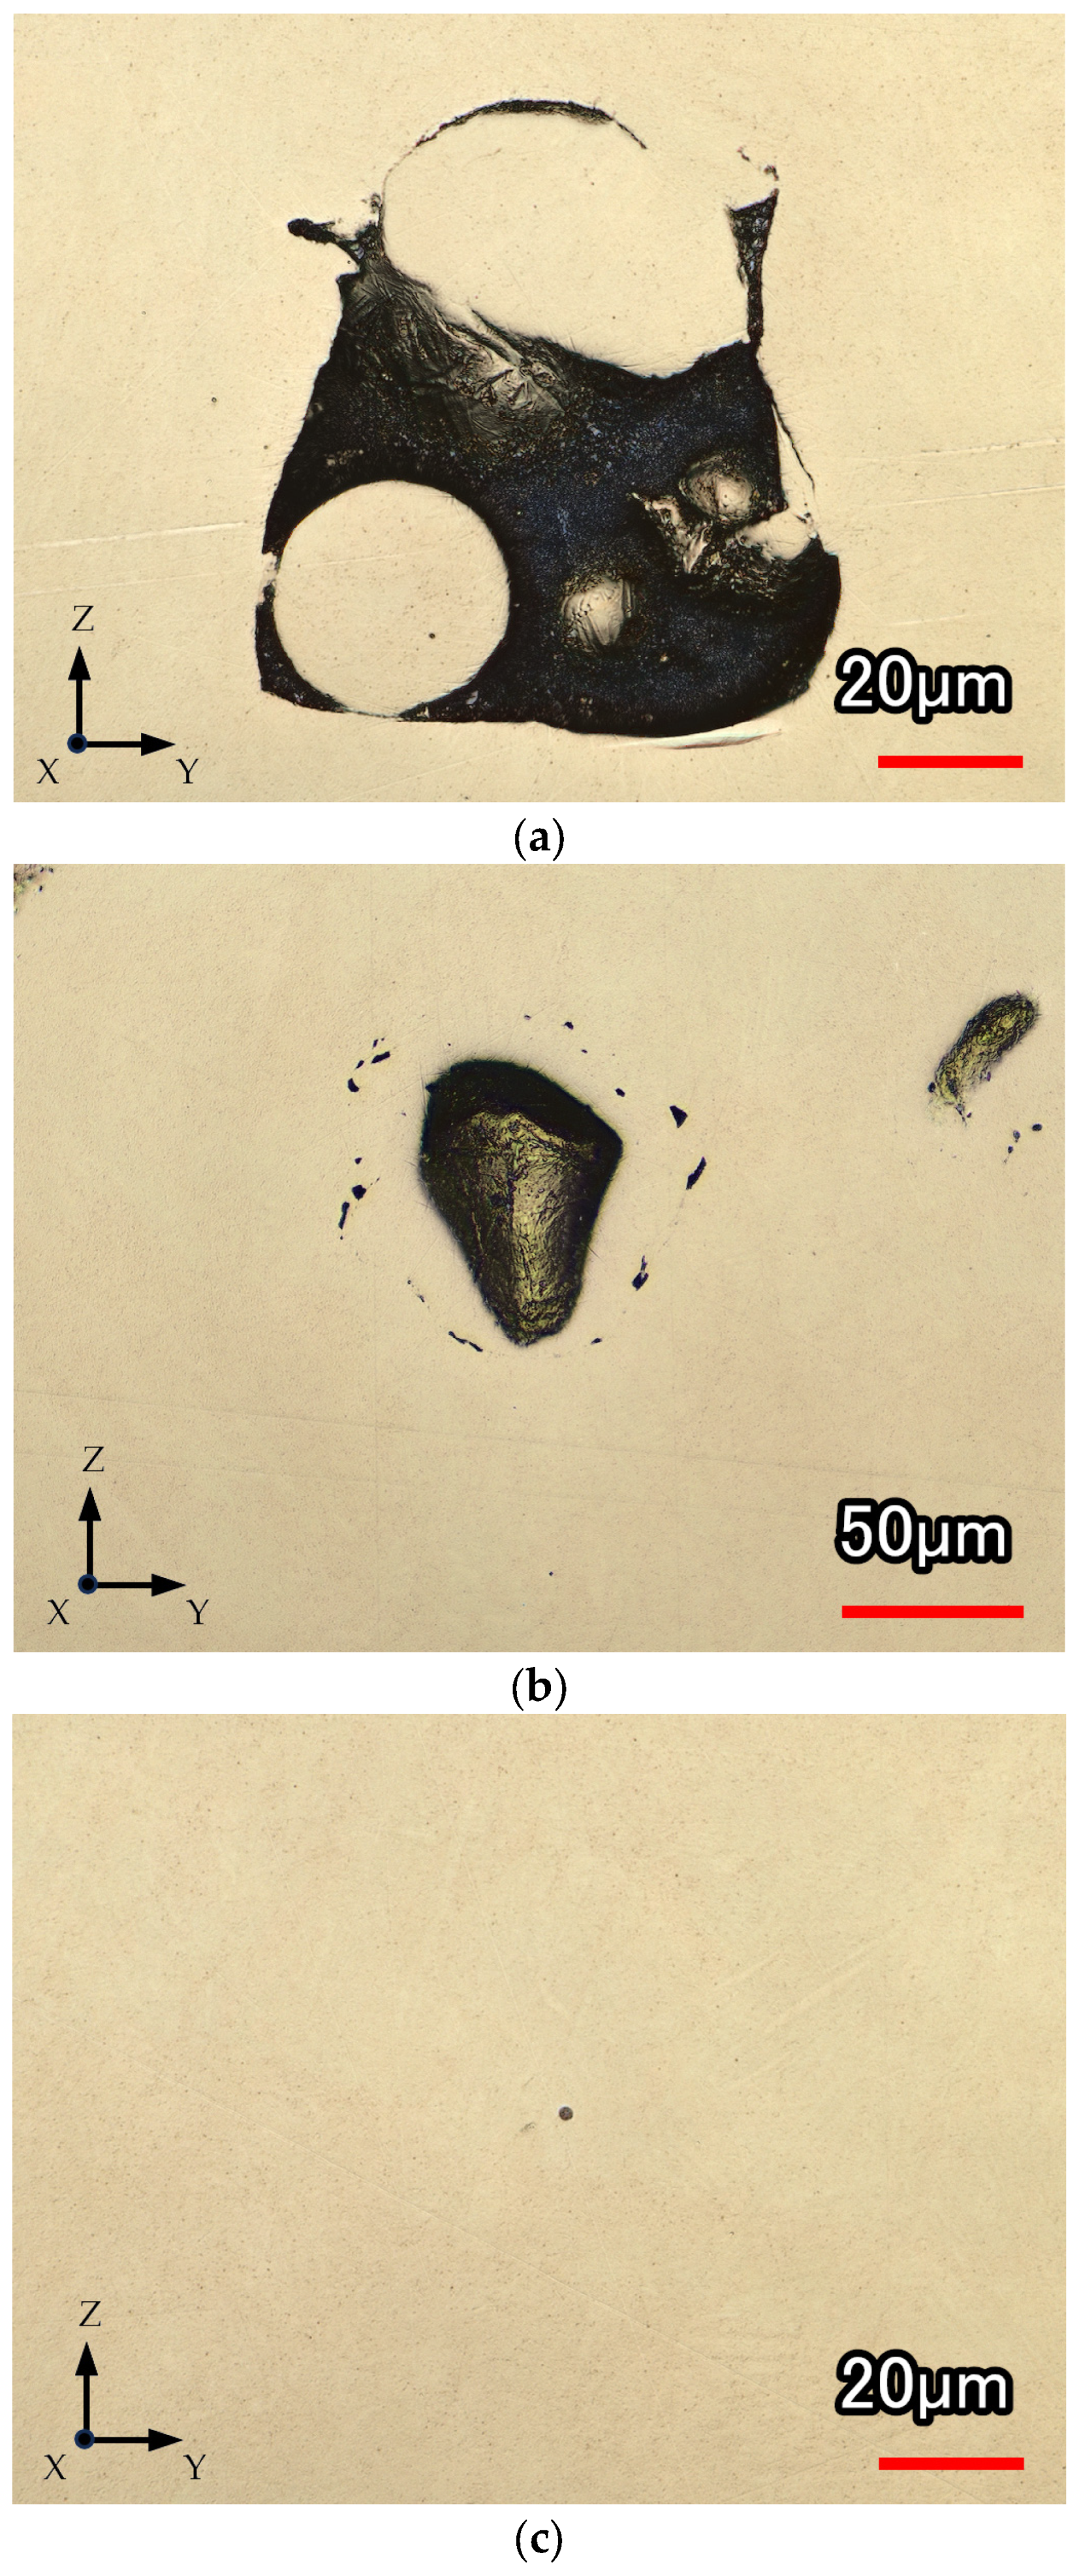
Microstructural inspections revealed the presence of three common types of porosity typically observed in LPBF products across different ASB prints. The lack of fusion porosity, characterized by irregularly shaped pores that often contain unfused powder particles, was observed in samples fabricated at the low end of the VEDs considered. An example of which can be seen in Figure 7a. This sample was fabricated with 200 W of laser power and 1125 mm/s scan speed, which equated to a VED of 59 J/mm3; the lowest VED examined.
When printing with an excessive amount of energy, melt pool instability occurs, which often results in keyhole porosity. Pores formed through this mechanism are relatively large, often appear in chains parallel to the scan direction, and are generally more rounded as compared to those produced as a result of a lack of fusion. A sample image of keyhole porosity is shown in Figure 7b. This particular sample was produced at 400 W of laser power and 375 mm/s scan speed, resulting in a VED of 356 J/mm3—the highest examined VED.
Gas porosity was also noted in select samples, formed when gases are entrapped within the melt pool upon solidification. Several gas sources exist, such as argon flowing within the build chamber, atomizing gas entrapped within the powder feedstock particles, as well as moisture and/or gas molecules adsorbed on the surfaces of powder particles. Gas porosity is also typically spherical, small, and relatively well distributed, as was found in the ASB specimen. An example of gas porosity observed in as-printed ASB can be seen in Figure 7c. This sample, produced at 300 W laser power and 750 mm/s scan speed—the center point of the DOE—had a VED of 133 J/mm3.
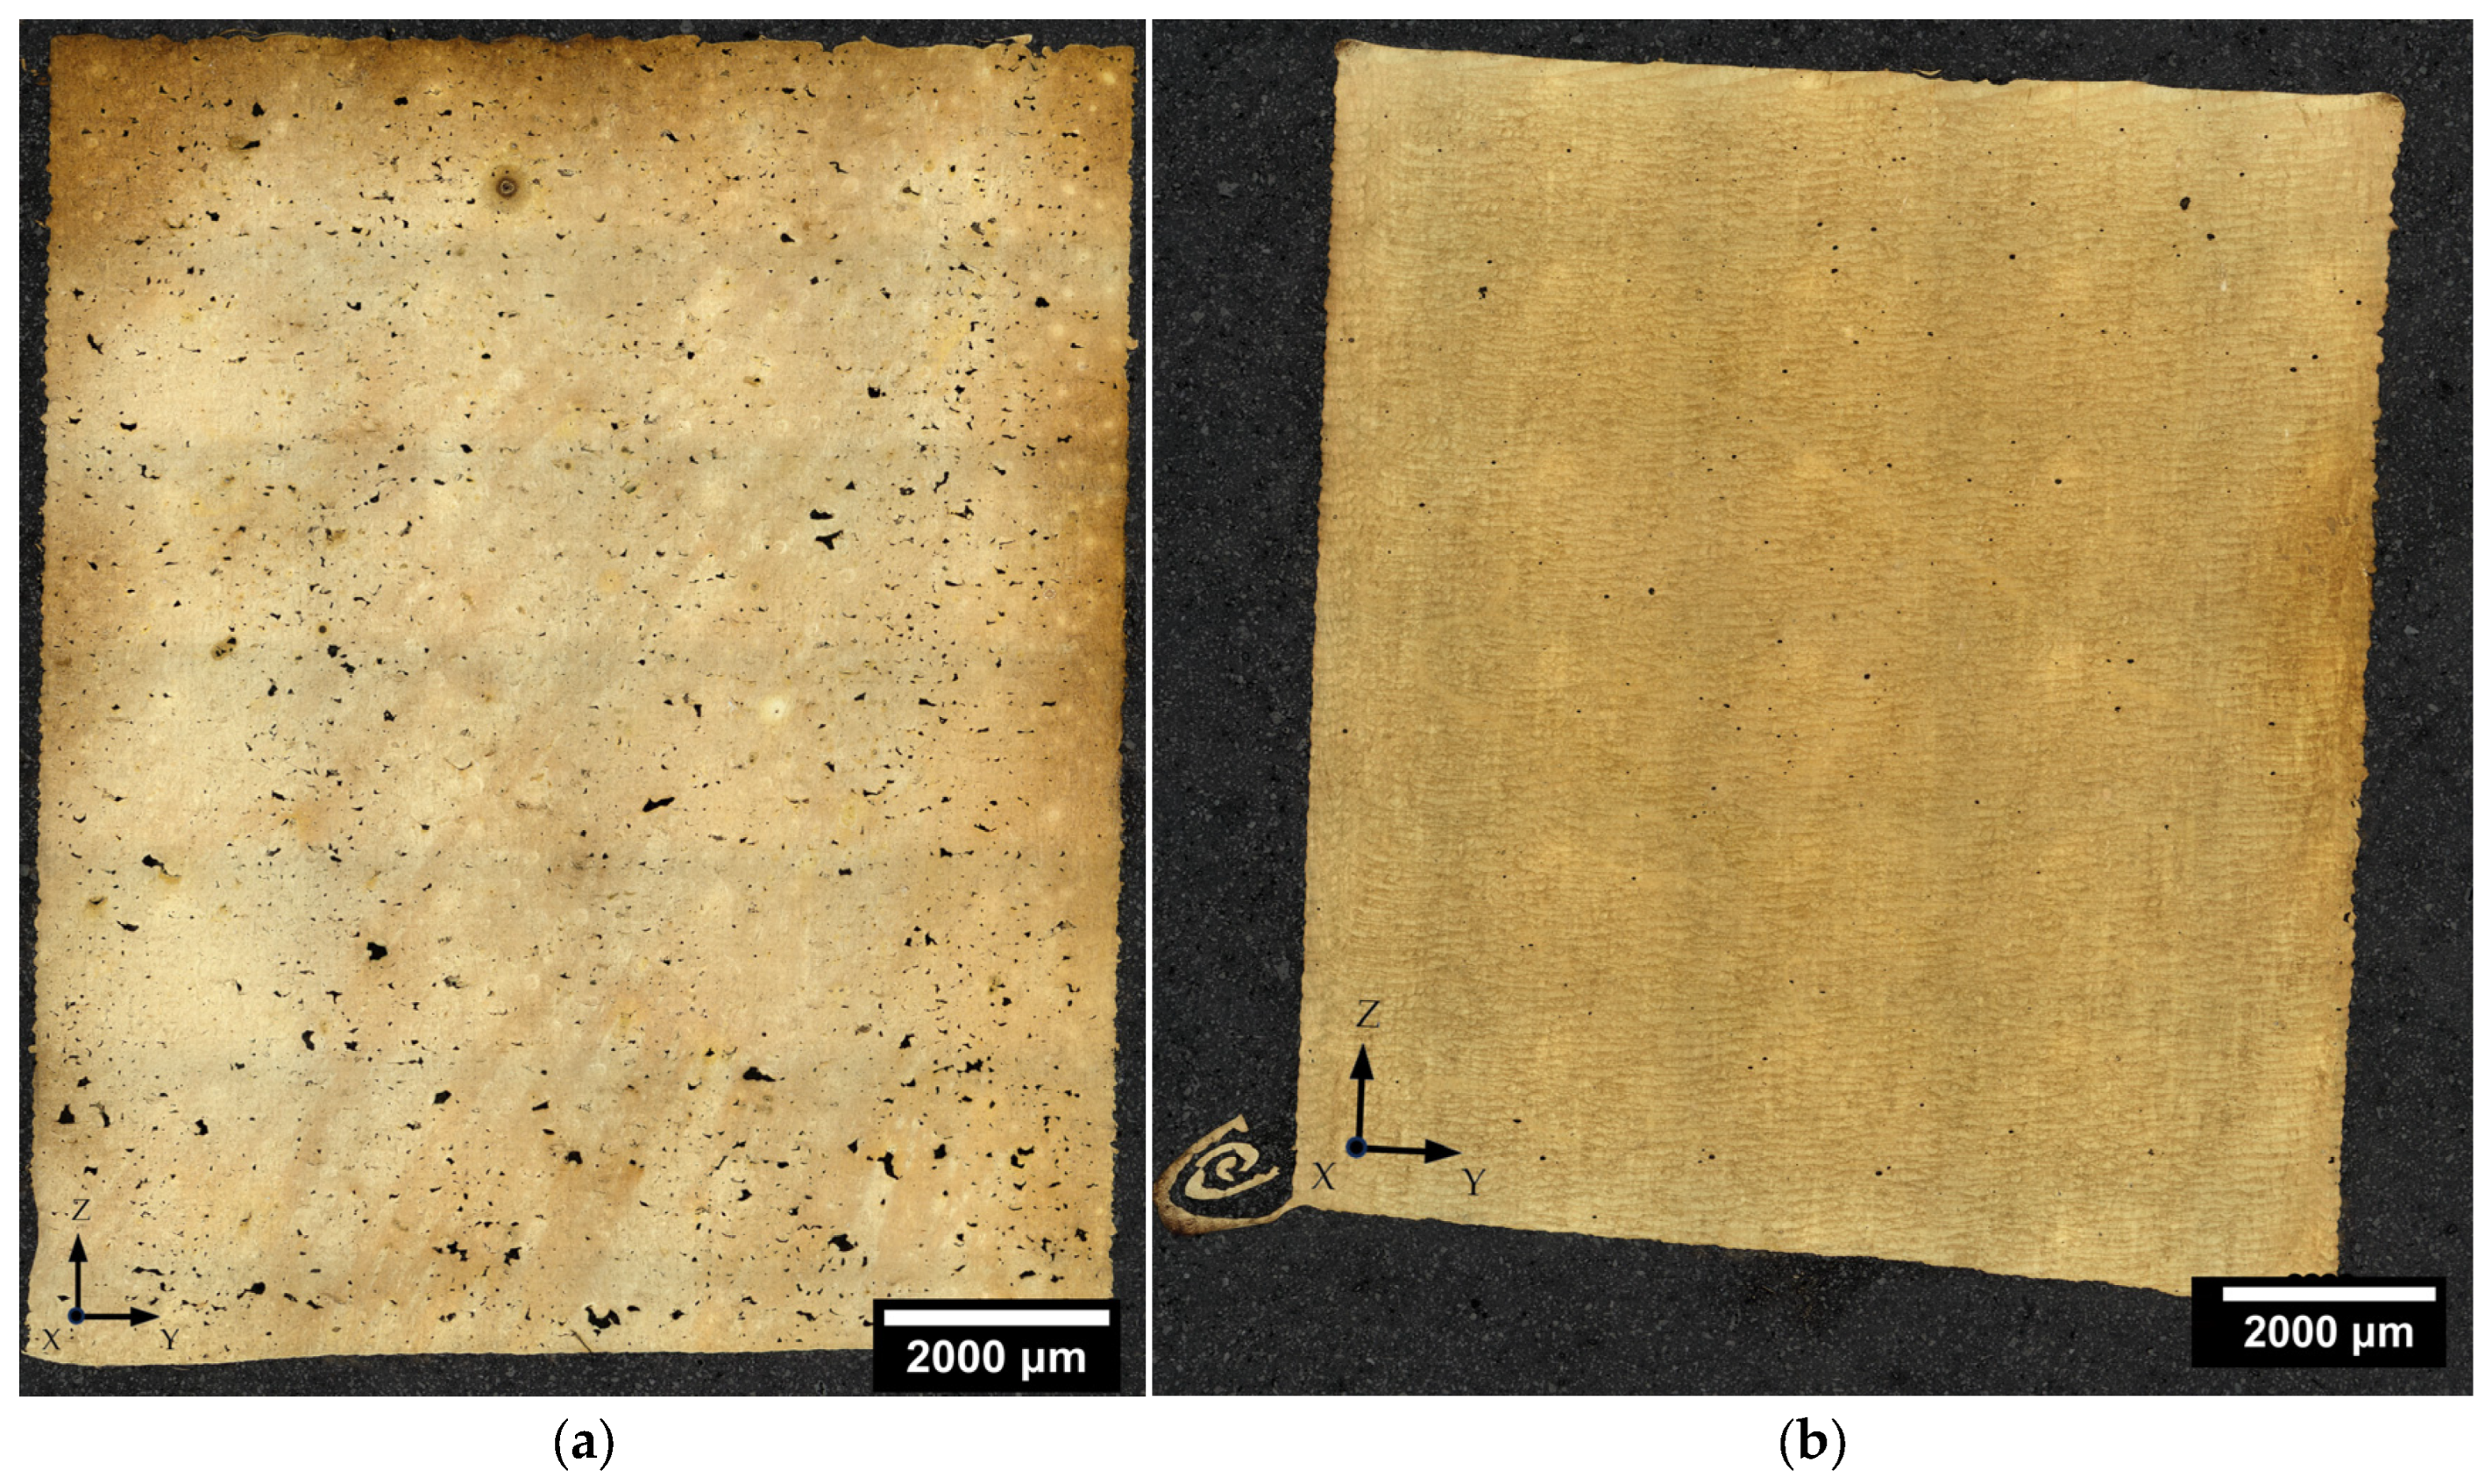
The lowest achieved density was measured in a cuboid processed at 200 W and 1125 mm/s scan speed. The overall porosity distribution of this sample and the one with the highest printed density (300 W, 750 mm/s) were examined by means of confocal microscopy. The resultant images are shown in Figure 8. Both samples demonstrated a relatively uniform distribution of porosity with no acute preference to location or direction.
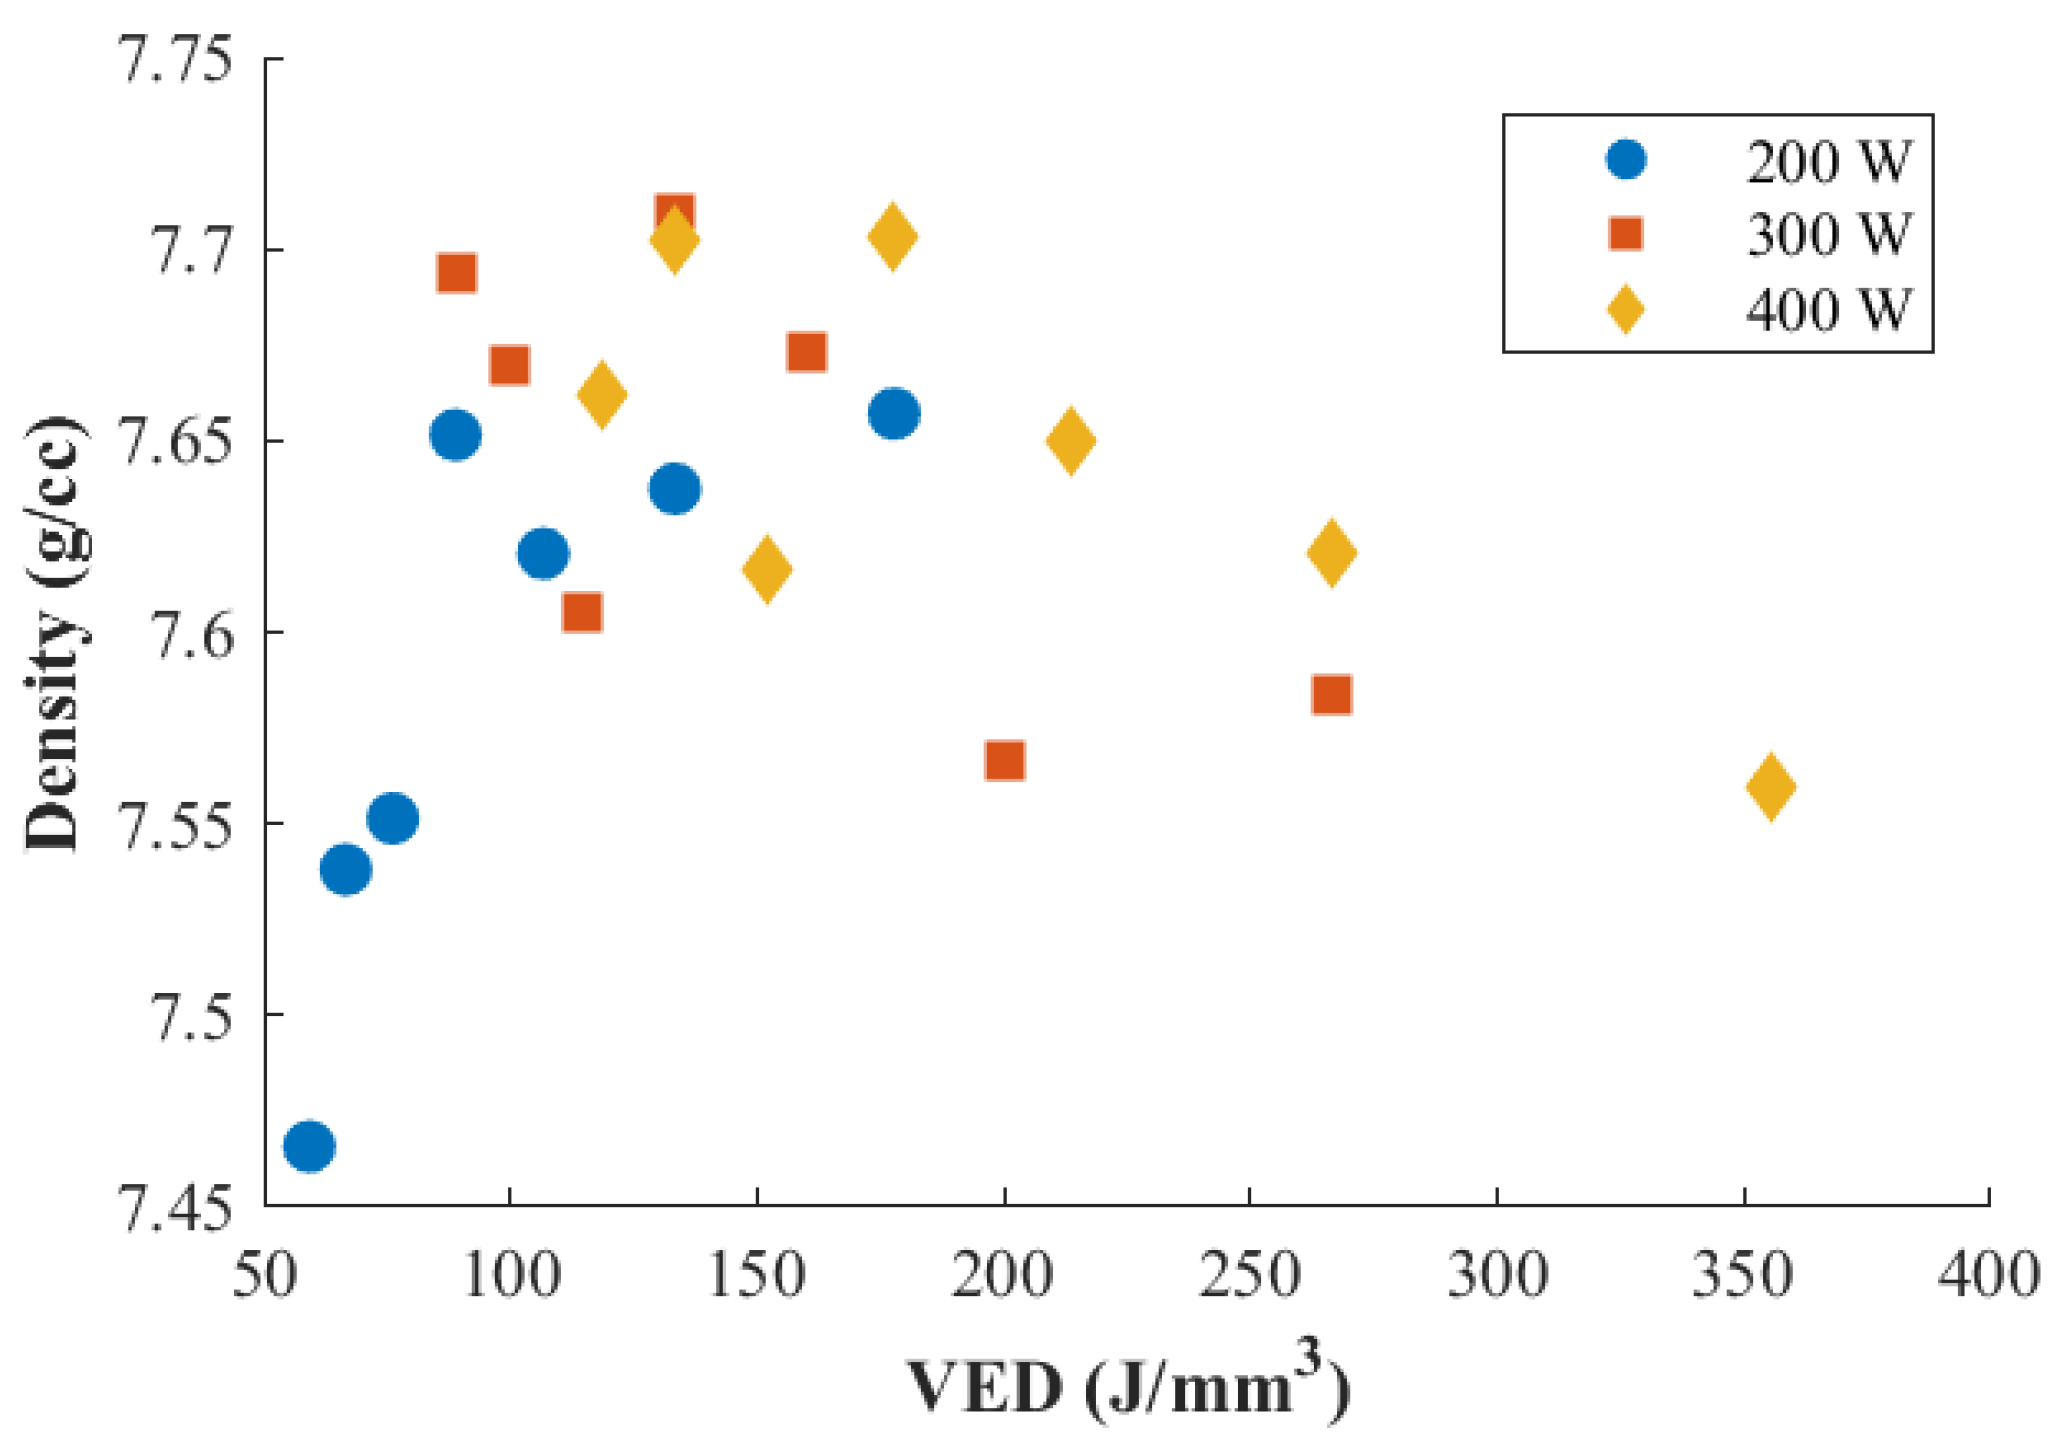
The response surface from this initial DOE was expected to have curvature and peaks within the examined range of parameters. Hence, an ANOVA assessment was not yet deemed valuable for characterizing this response. Conversely, an intuitive visualization approach was employed by plotting density vs. VED. This outlined a clear region that exhibited higher densities, between 75 J/mm3 and 175 J/mm3. However, this method obfuscated the varying parameter combinations contributing to each energy density. As such, the plotted points on the graph were colour-coded to match the associated laser power (Figure 9) and the corresponding scan speed (Figure 10) to help clarify the actual parameters associated with each result. This was completed to determine if any one parameter setpoint out or underperformed compared to the others. While some indications suggested that 200 W was insufficient to properly process ASB, the absence of clear and concise trends in the data limited confidence in further elimination of additional setpoints at this stage.

3.2. Central Composite DOE

The second DOE sought to investigate the effects of processing parameter changes at a higher resolution, anticipating potential non-linearity in data trends. Here, the density of the as-printed specimen ranged from 98.88% to 99.94%, while replicates of the center point parameter set averaged 99.58 ± 0.21% dense. The highest resulting density was processed at 320 W laser power, 770 mm/s scan speed, and 0.088 mm hatch spacing, which corresponded to a VED of 157 J/mm3. The lowest resulting density was processed at 380 W laser power, 770 mm/s scan speed, and 0.088 mm hatch spacing, which corresponded to the highest VED of the experiment at 187 J/mm3. The internal distributions of porosity within these specimens are shown in Figure 11. Figure 11a demonstrates that keyhole porosity prevailed throughout the low-density/high VED sample. Although this was the lowest-density product of this experiment, it remained significantly denser than many of the lower-density samples from the initial full factorial build. In contrast, gas porosity was the dominant defect noted in the high-density/moderate VED sample (see Figure 11b), consistent with observations from the first DOE.
The assessment of the density results from the full factorial DOE commenced with a visual inspection of the raw data in terms of a contour plot, as shown in Figure 12. Fundamentally, the plot exhibited a saddle-shaped contour that dropped off as VED deviated from the mean. To examine this in further detail, a regression analysis was completed to characterize the response of the material. Overall, the fit was produced in MATLAB R2021b and had a moderate r2 value of 64.41%. The results also indicated that the most statistically significant factor was laser power, followed by the interaction between laser power and scan speed. 
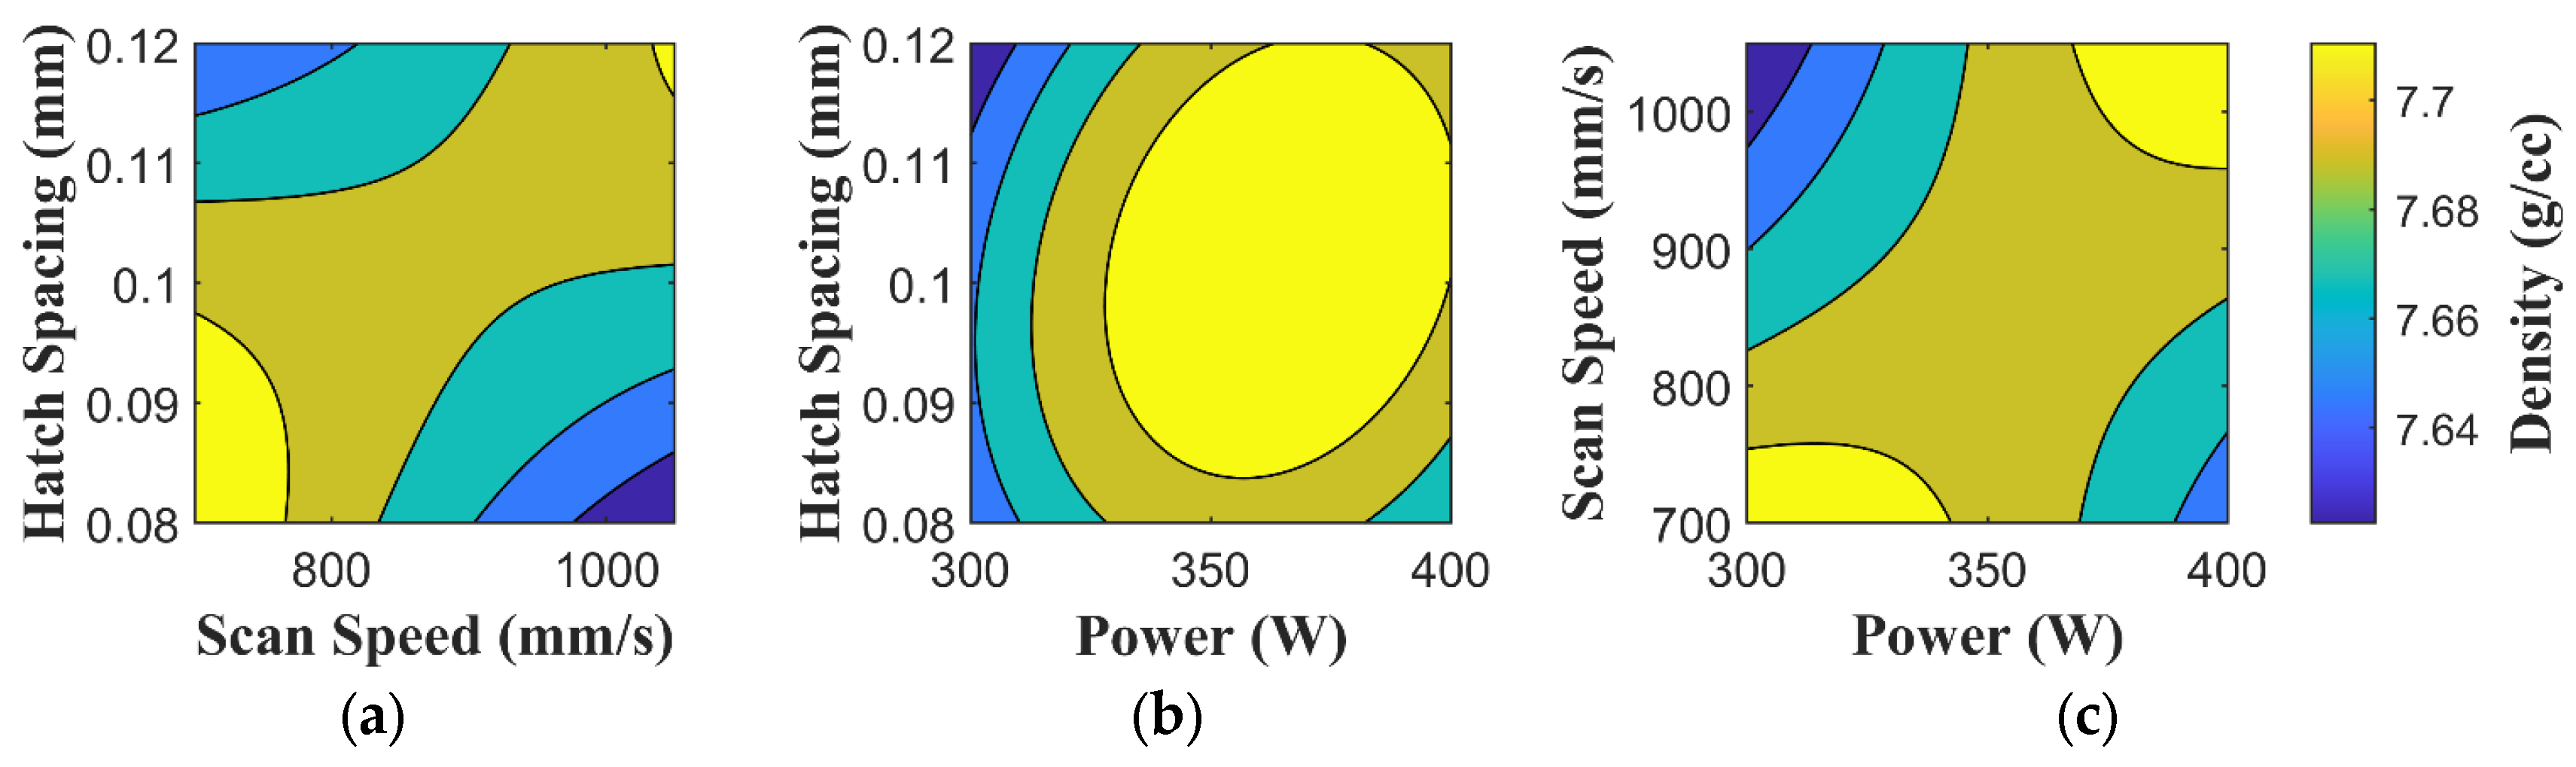
Figure 13 shows the fitted contour plots in 2D while holding the third parameter constant at the mid-point setting utilized in the DOE. These plots outline an optimal printing parameter set ranging from 700–750 mm/s scan speed, 325–350 W, and a hatch spacing of 0.085–0.090 mm. This directly matches the true response from Figure 12, where the highest density sample was printed at 320 W, 770 mm/s scan speed, and 0.088 mm hatch spacing. The most significant variable of this regression was the interaction between laser power and scan speed, which had a p-value of 1.9%, showcasing the importance of balancing the two parameters when considering an optimum.
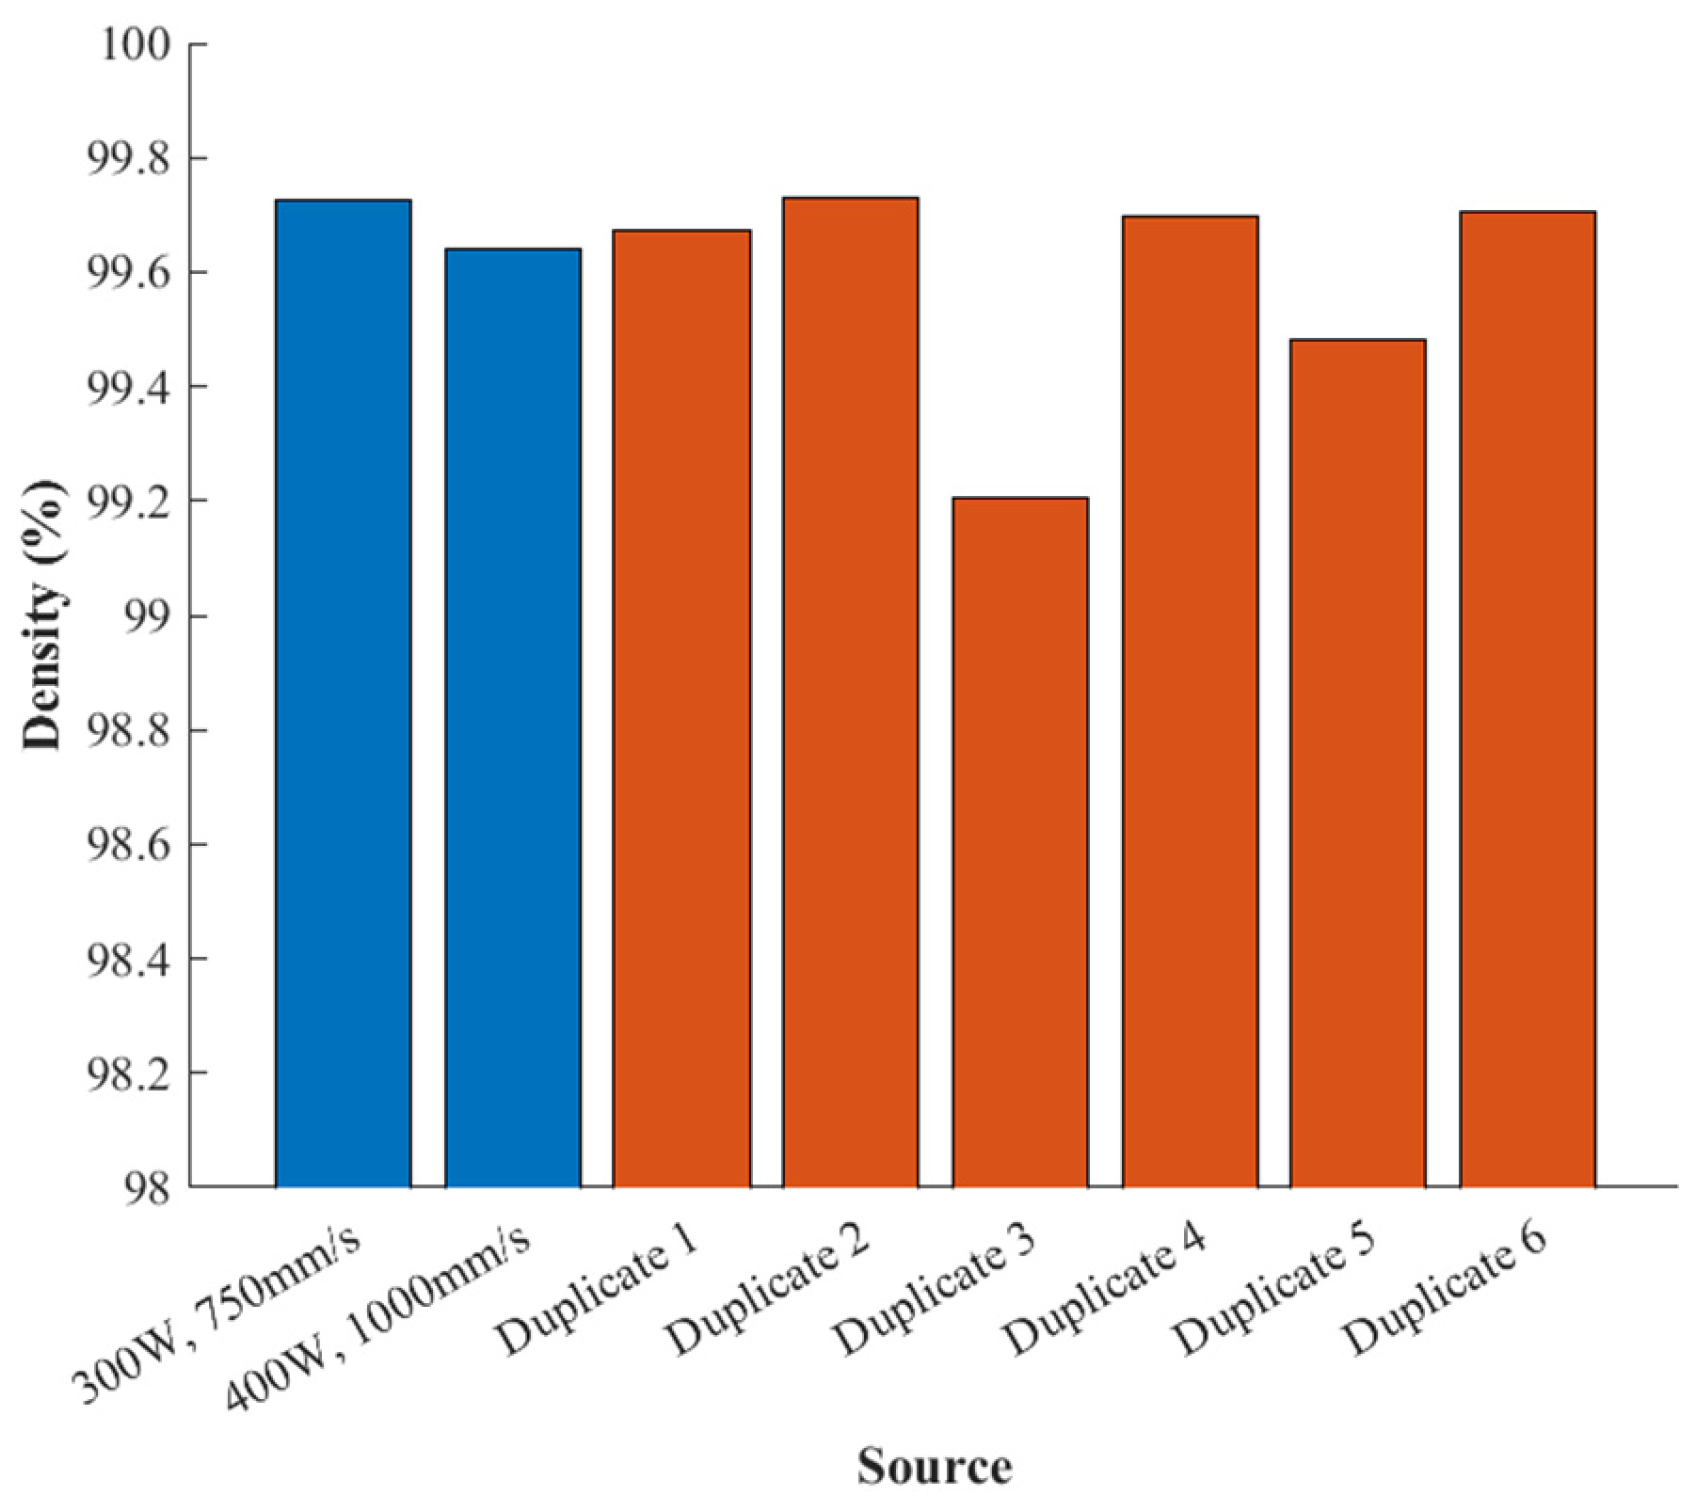
The second experiment introduced duplicates. The center point of the second experiment was set at 350 W laser power, 875 mm/s scan speed, and 0.100 mm hatch spacing. The duplicates yielded an average density of 99.58 ± 0.21%. The uncertainty from Archimedes’ method of density measurement, using precision equipment, was just 0.039%. This shows that a reasonable degree of repeatability was observed. Figure 14 shows a bar graph outlining the densities of these duplicates with an exaggerated deviation, as the y-axis only spans from 98 to 100%.
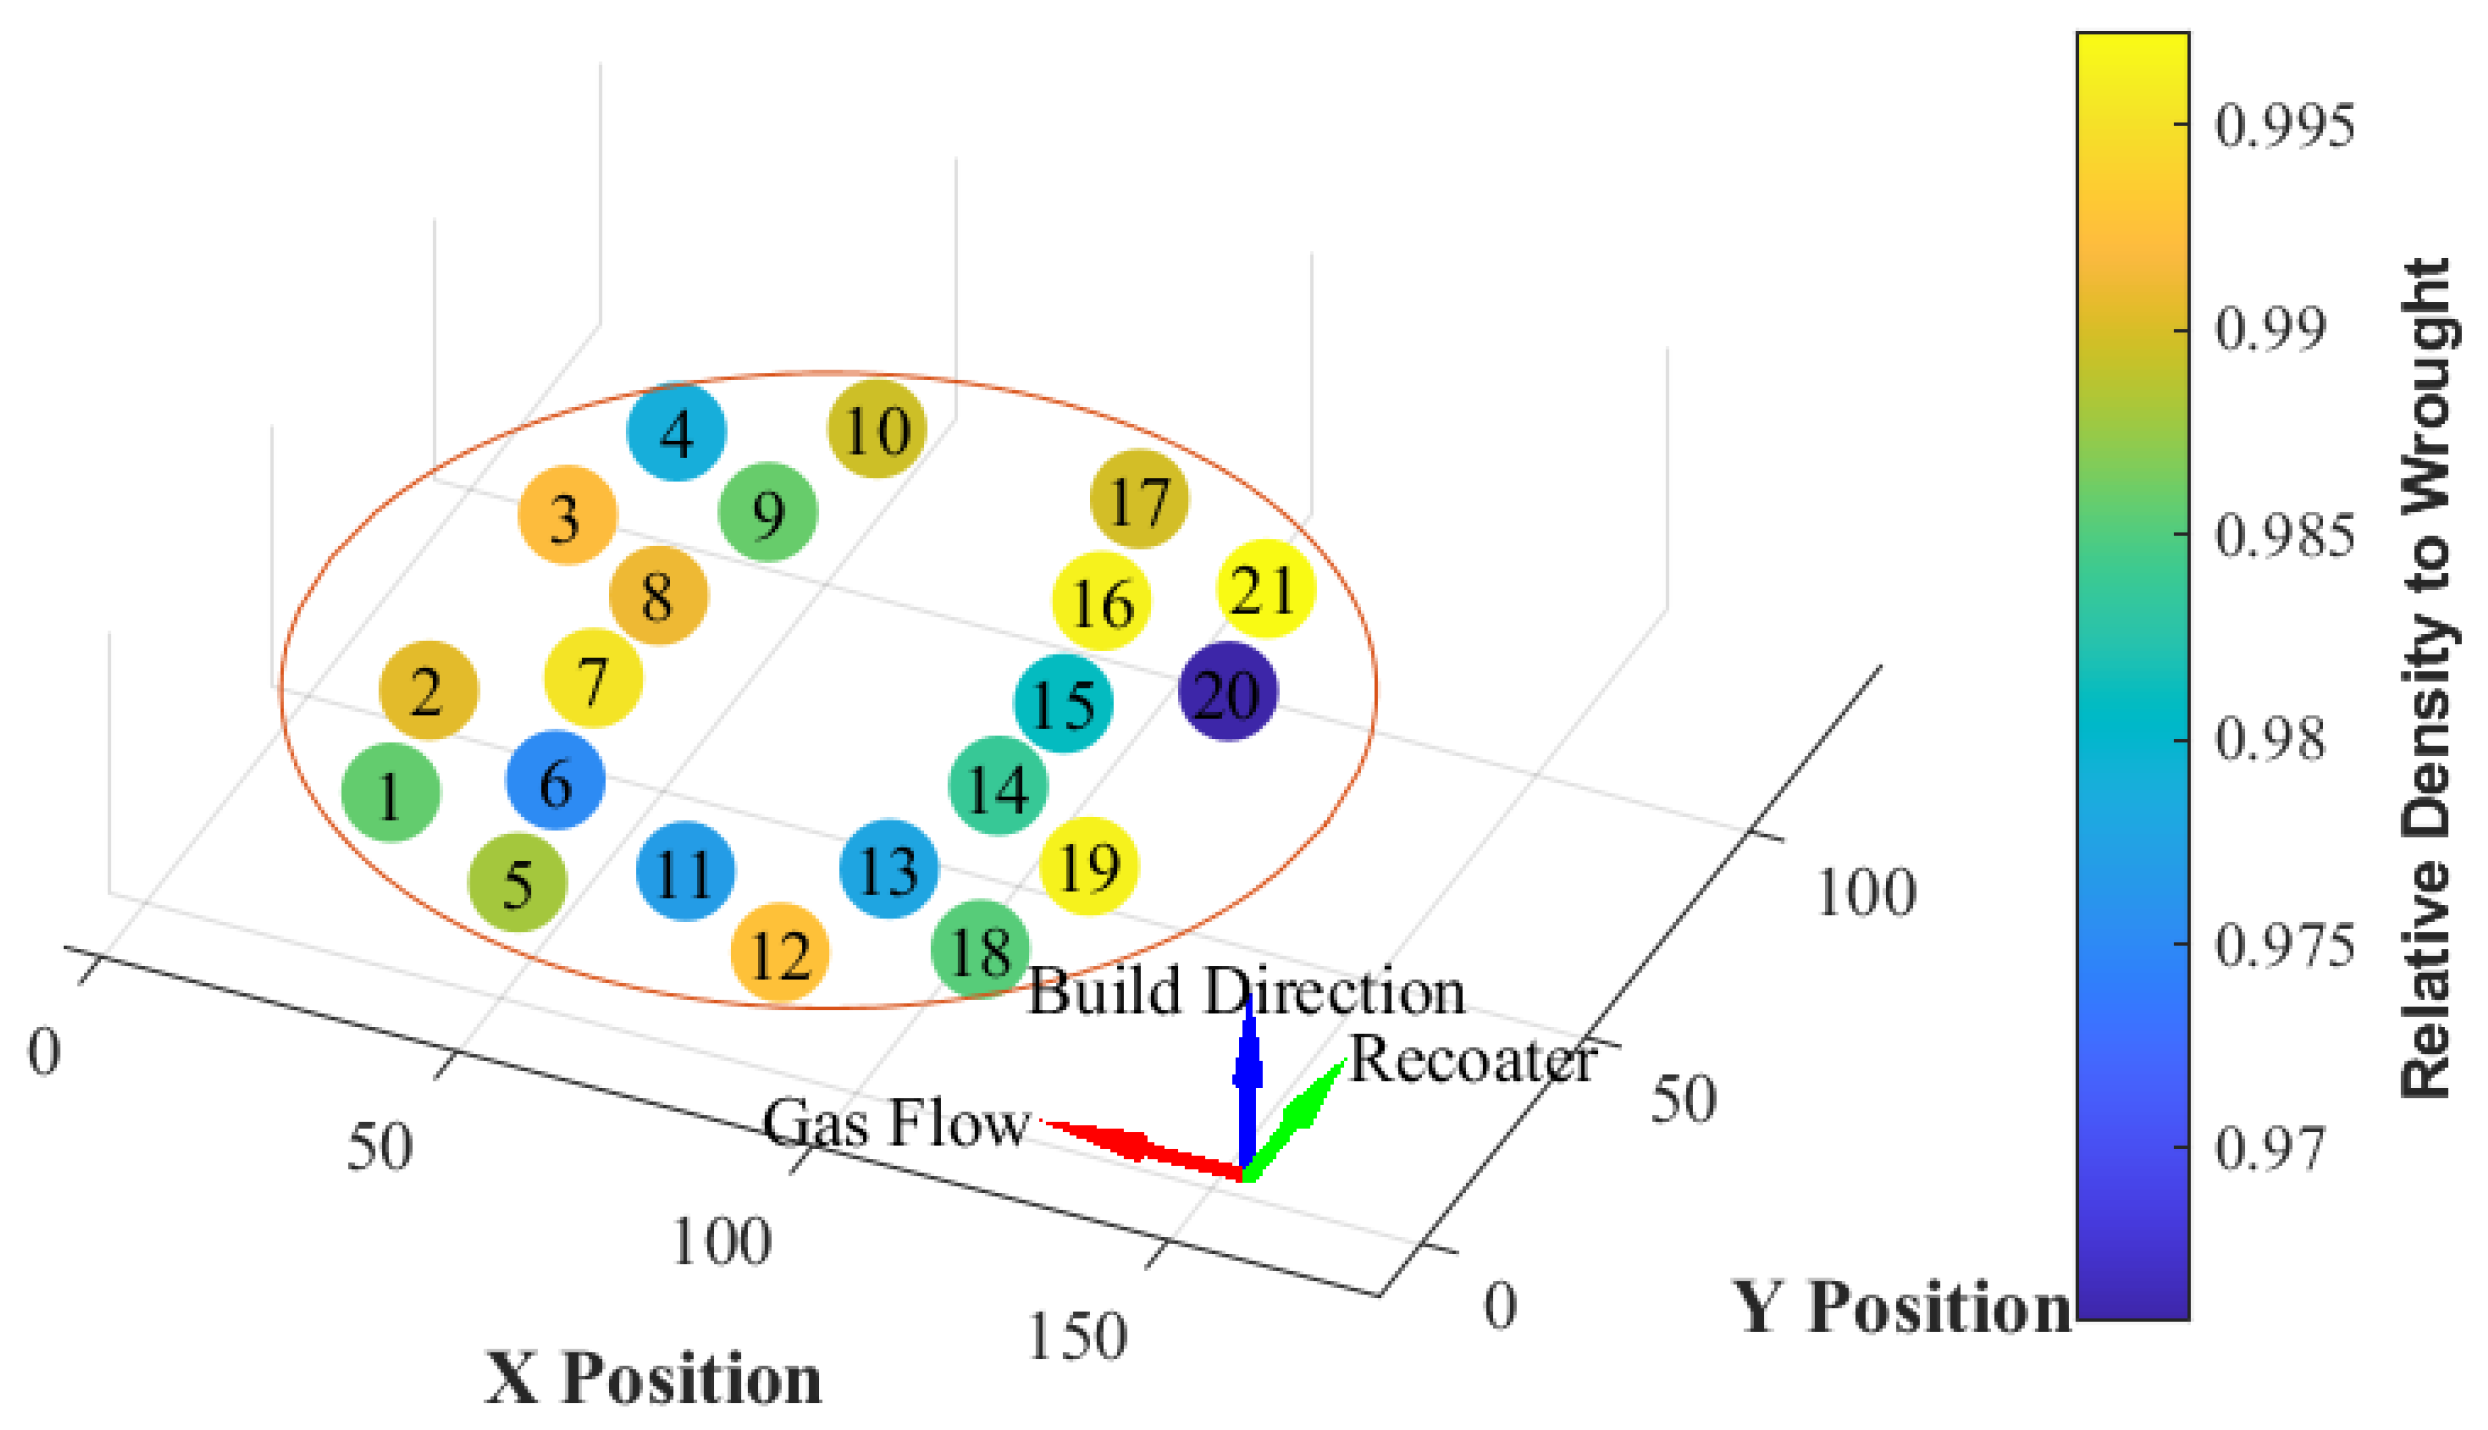
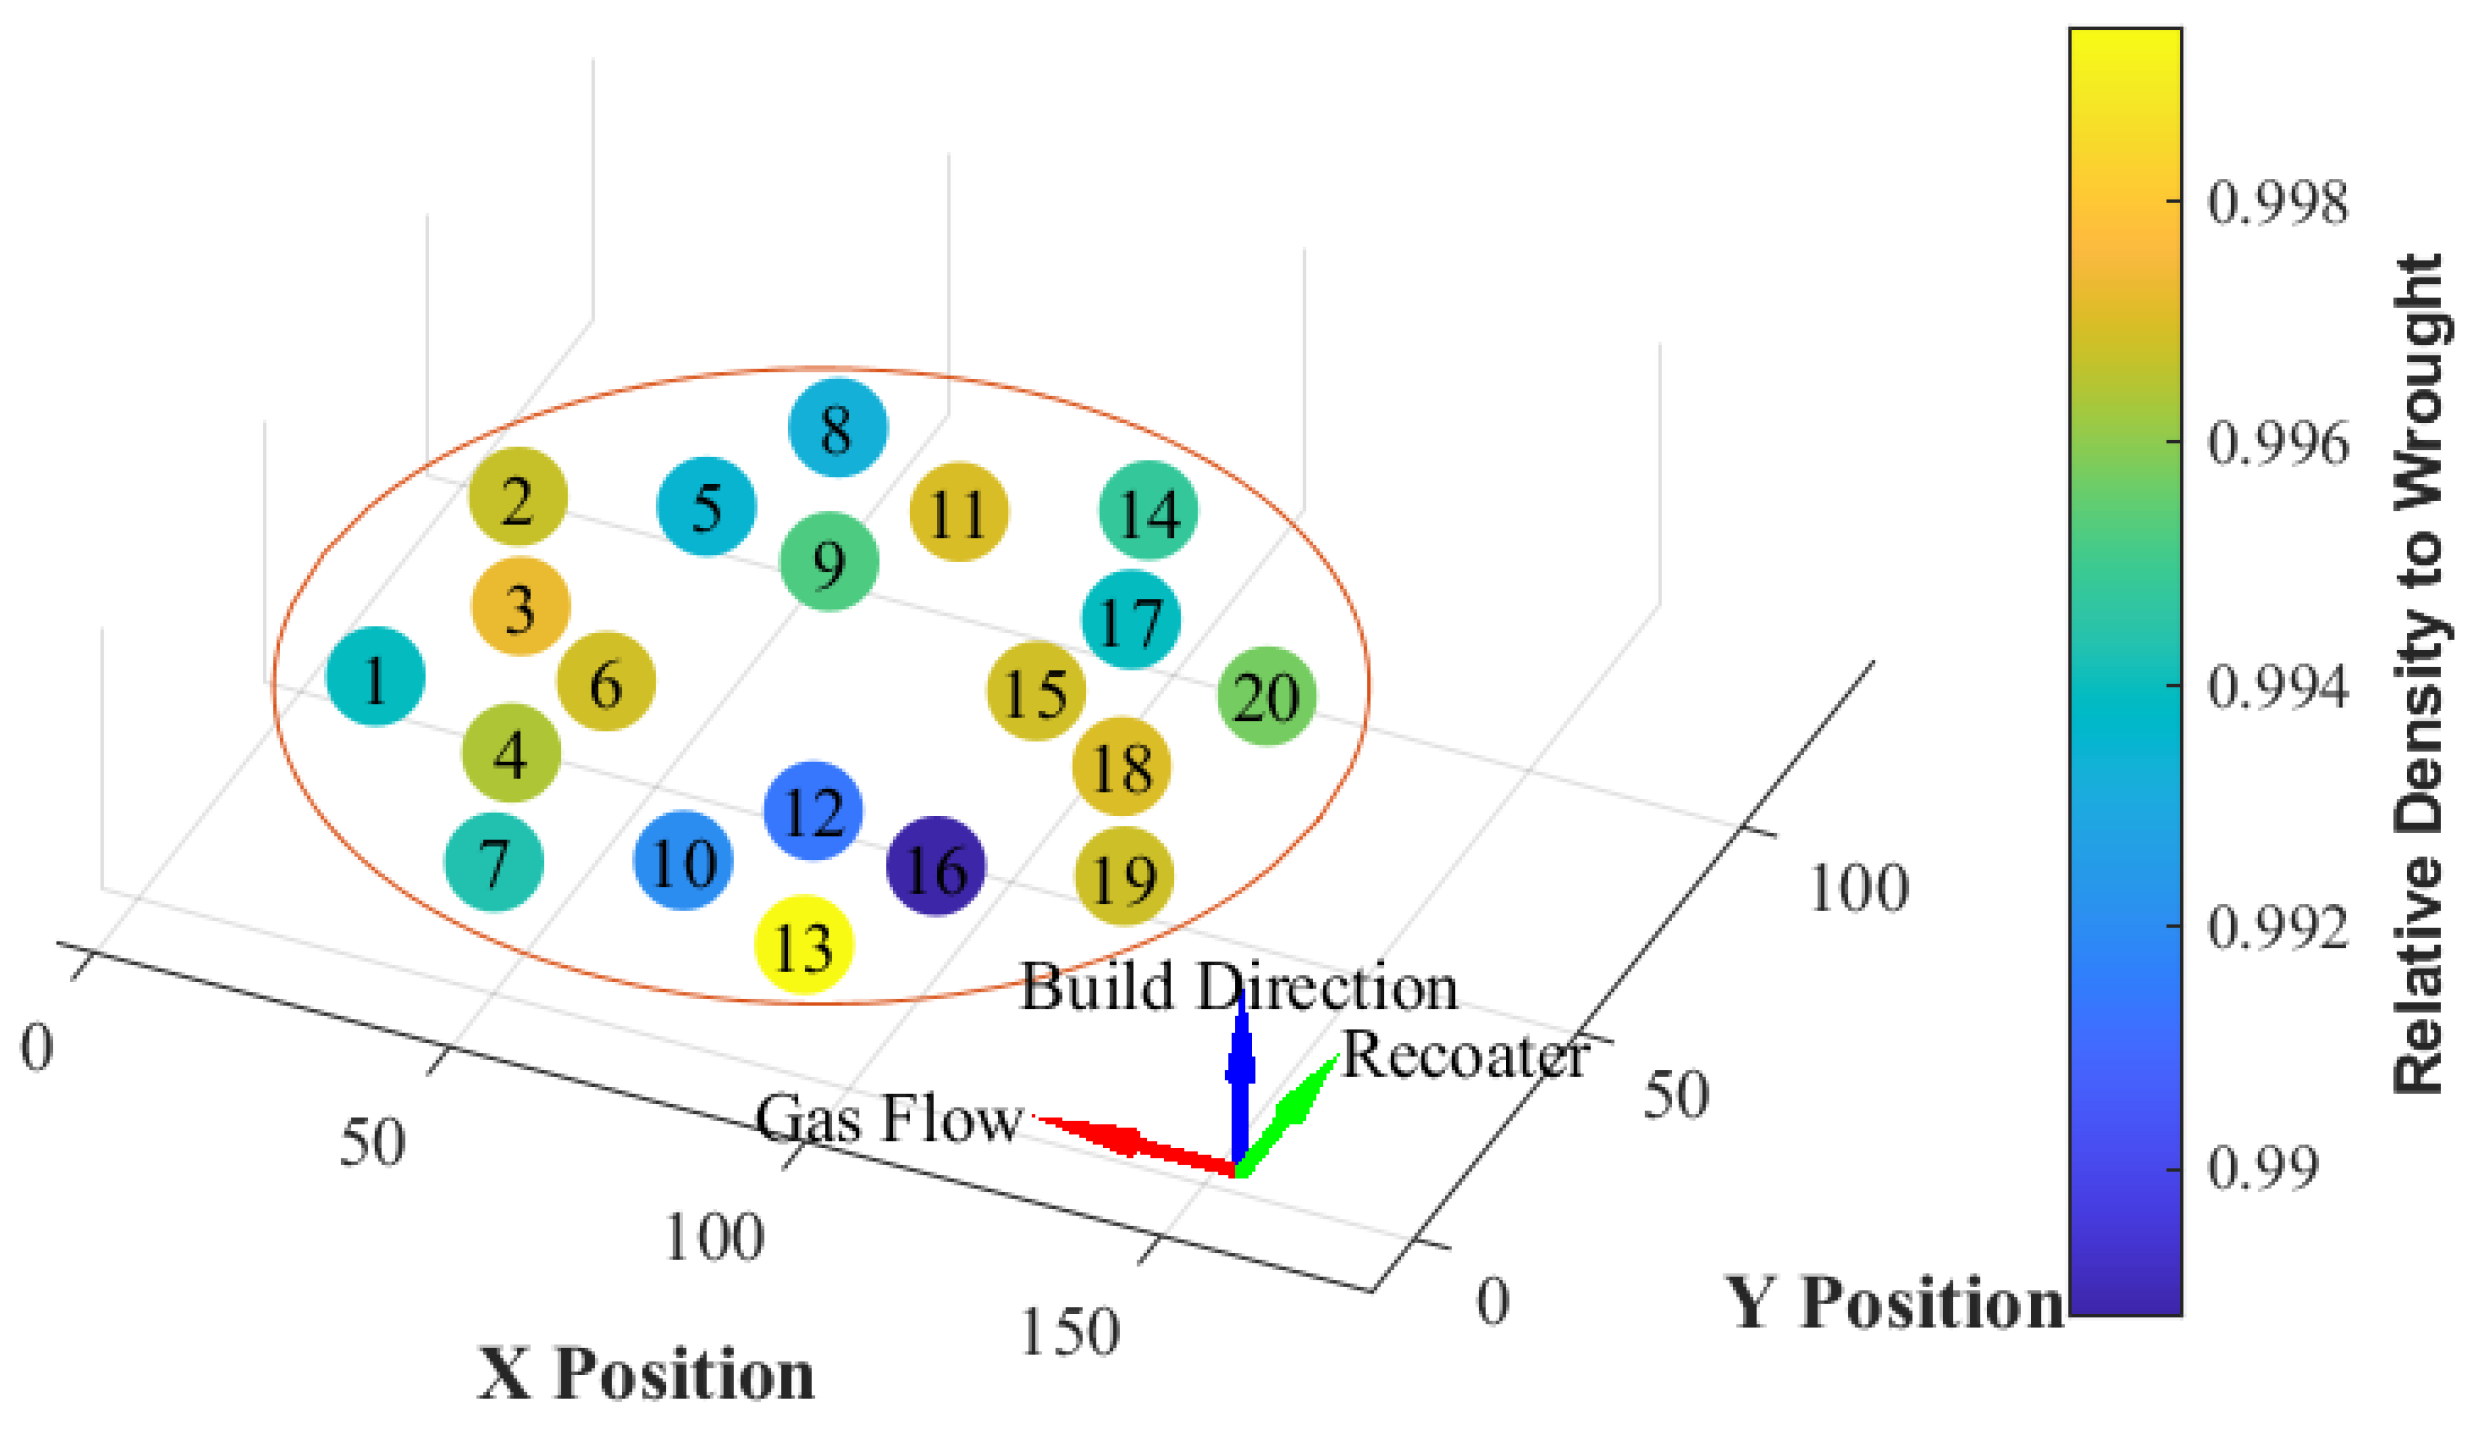
The potential influence of build plate position on build density was also statistically investigated. Here, regression analysis demonstrated poor fits for DOE1 and DOE2 as r2 values were only 2.53% and 0.54%, respectively. This indicated that no fit could be associated using plate position as a variable. This was further confirmed visually in Figure 15 and Figure 16, where the random distribution shows that no specific build position resulted in statistically significant deviations.
To verify the density data amassed using the Archimedes technique, the highest density samples from each build were also assessed by means of image analysis. For the high-density cuboid produced in the first DOE, the image analysis-based density was 99.72% of the full theoretical value, while the Archimedes’ method yielded a value of 99.74% on the same sample. A strong agreement between the two techniques was also observed for the high-density product of the second DOE, as densities of 99.87% and 99.94% were measured through image analysis and Archimedes, respectively. These results verified that high densities were achievable when printing ASB under multiple process settings.

3.3. Post-Build Heat Treatment

When processing aluminum bronze alloys via LPBF, the inherently rapid rate of solidification can invoke the formation of a martensitic structure [9,11]. This is generally brittle and manifests limited tensile ductility in the as-built product, thereby mandating a post-build heat treatment. As such, the heat treatment commonly applied to wrought C64200 (620 °C for 2 h, followed by water quenching) was applied to samples of the as-built ASB (350 W, 875 mm/s) and the as-received wrought counterpart material. Data were then acquired from as-built, printed and heat-treated, and heat-treated wrought samples for comparison. Laser confocal images of printed ASB before and after heat treatment are shown in Figure 17. The as-built microstructure (Figure 17a) showed limited evidence of the columnar growth that can be typically observed in LPBF-processed alloys and often extends through multiple layers. However, grain growth was still linked with the shape of the melt pool, making the discrete passes of the laser evident. As expected, grain growth was primarily perpendicular to the melt pool boundaries, creating semi-circular patterns when viewed in the y-z plane, as highlighted in Figure 17a. This highlighted region also appears slightly darker than other regions of the image, as this is also the martensitic β’ phase. An abundance of lathe-shaped features, consistent with the morphology of β’, was also present. After heat treatment, these features were seemingly eliminated from the microstructure, which now comprised predominantly equiaxed grains, with possibly some twin boundaries (to be further investigated using EBSD) (Figure 17b). In addition, the discrete laser passes were no longer discernible.
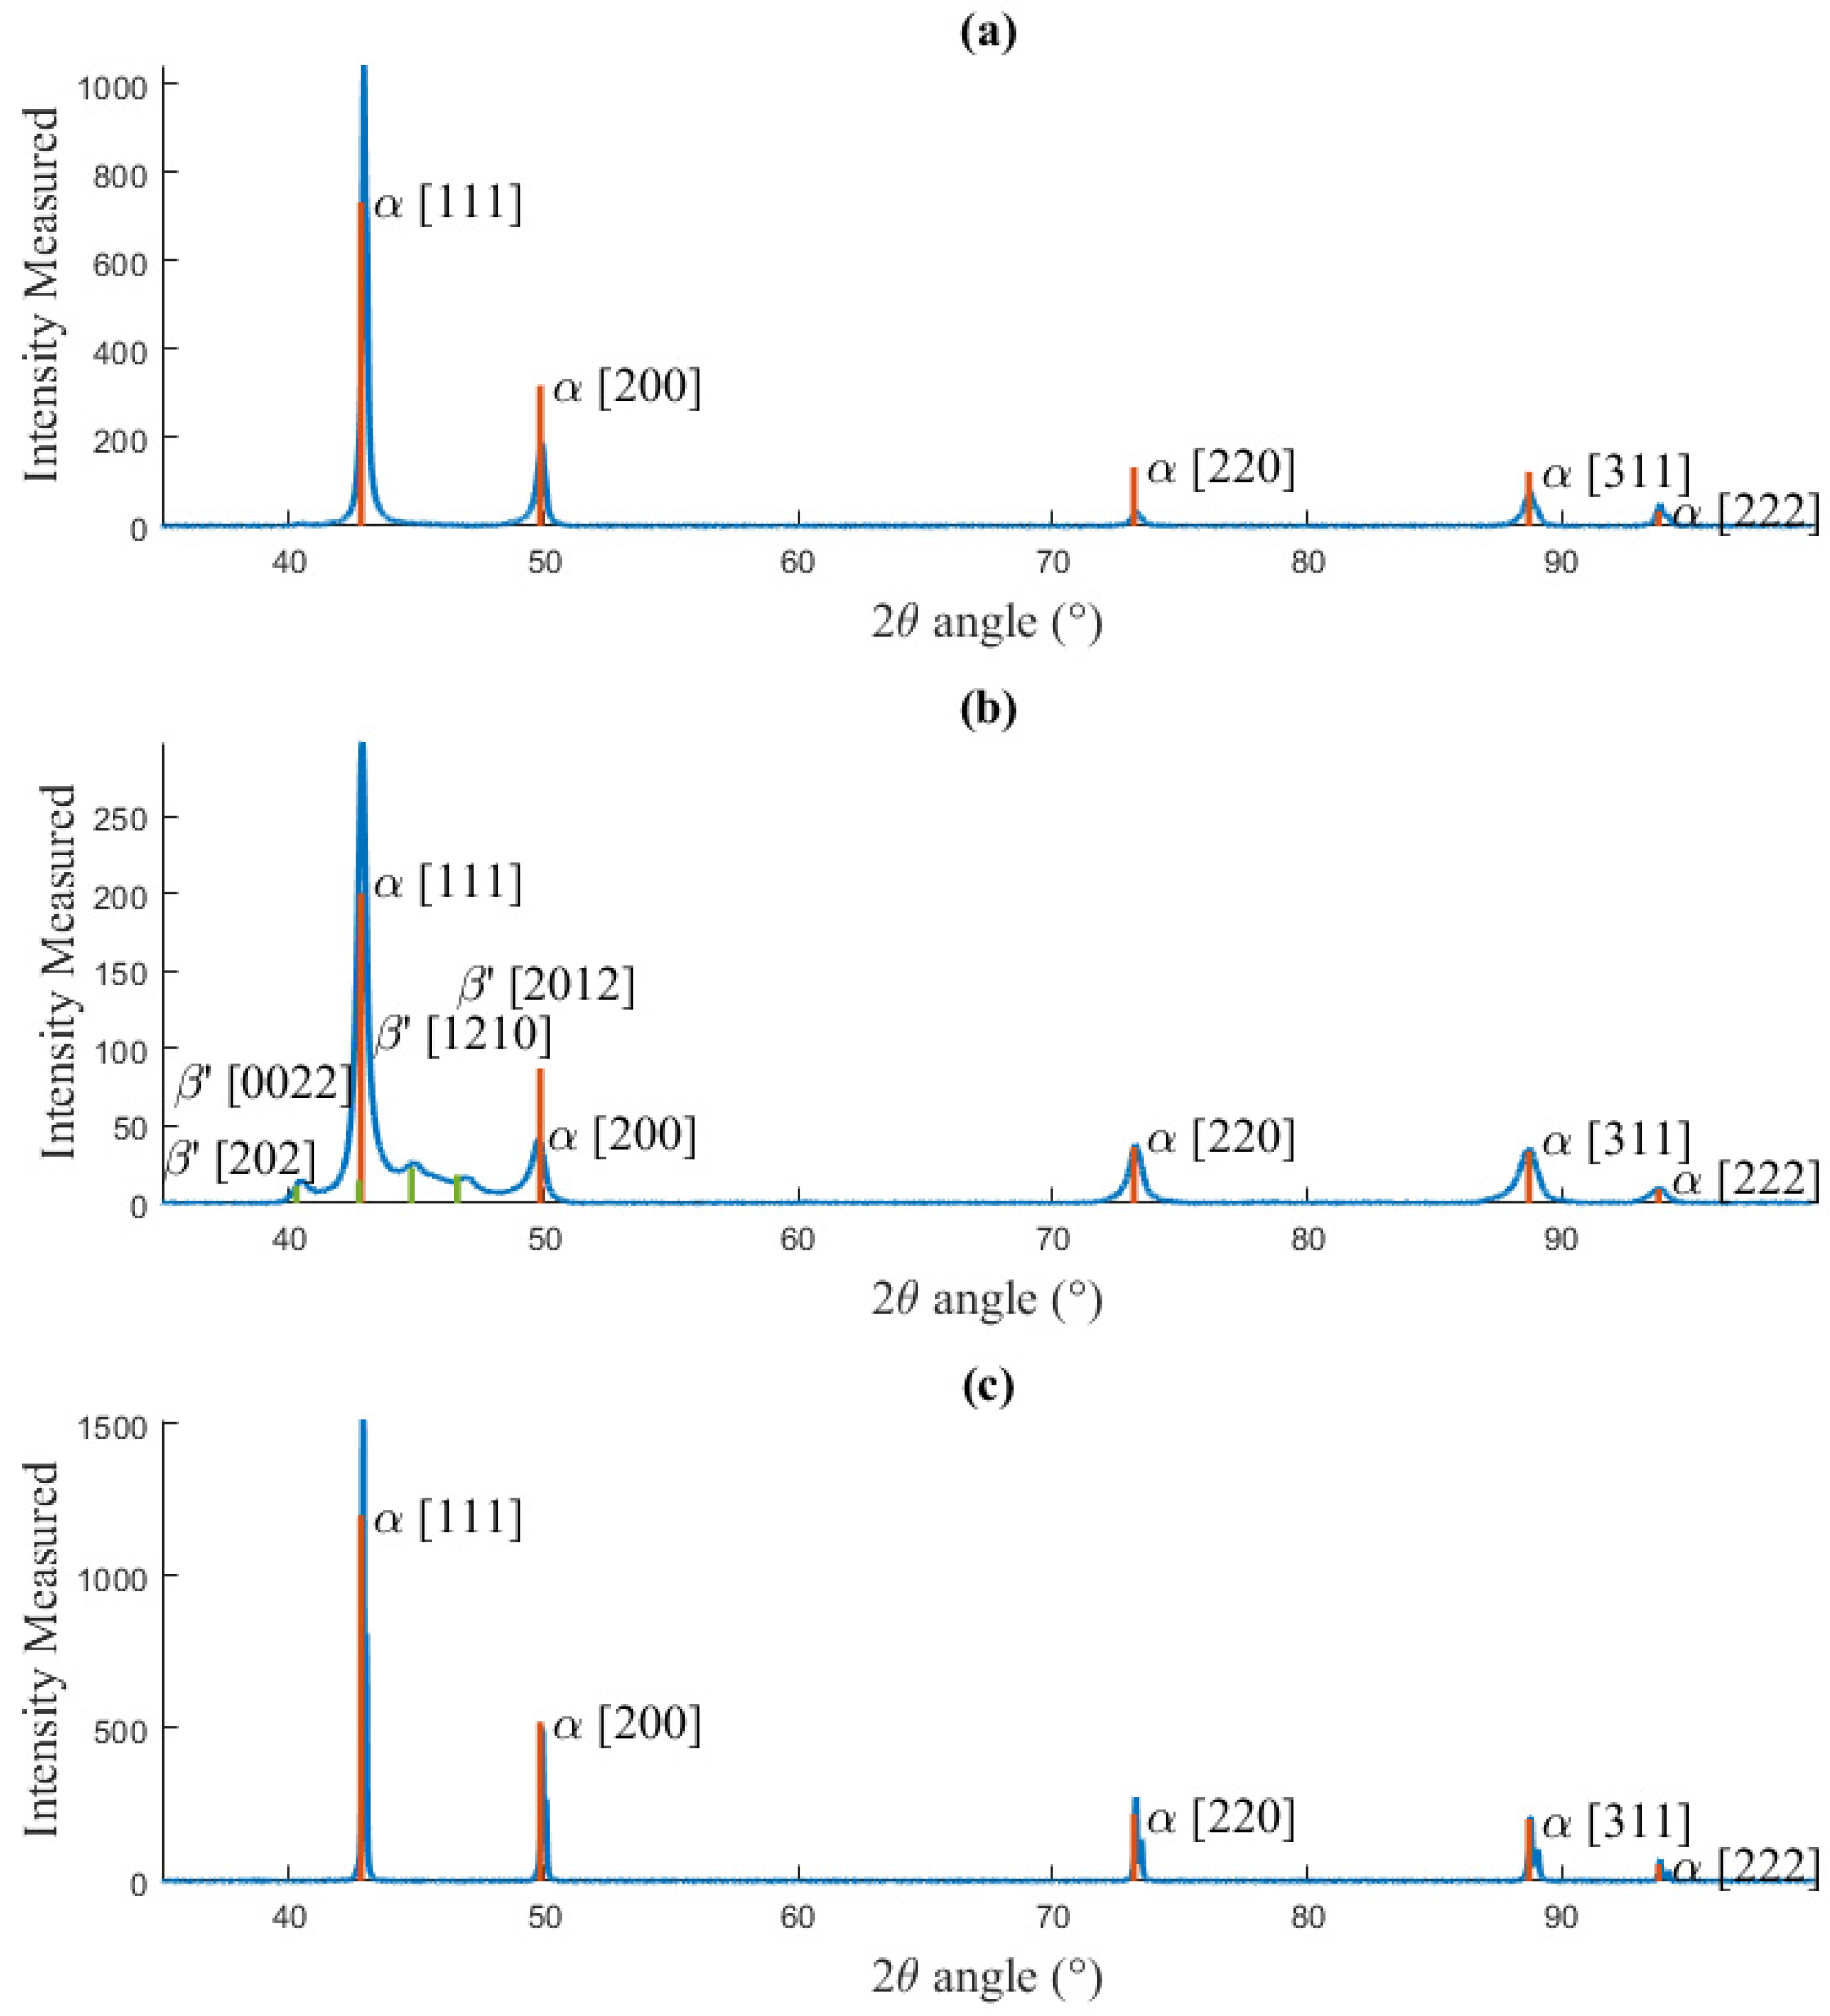
These microstructural transitions were further supported by XRD assessments (Figure 18). In the as-printed state, two phases were detected: α-Cu (aluminum copper 04-008-2100) and the martensitic phase β’ (AlCu3 00-028-0005). The heat treatment then converted the microstructure into single-phase α-Cu. The microstructure and existing phase in the wrought counterpart aligned closely with the printed and heat-treated material.
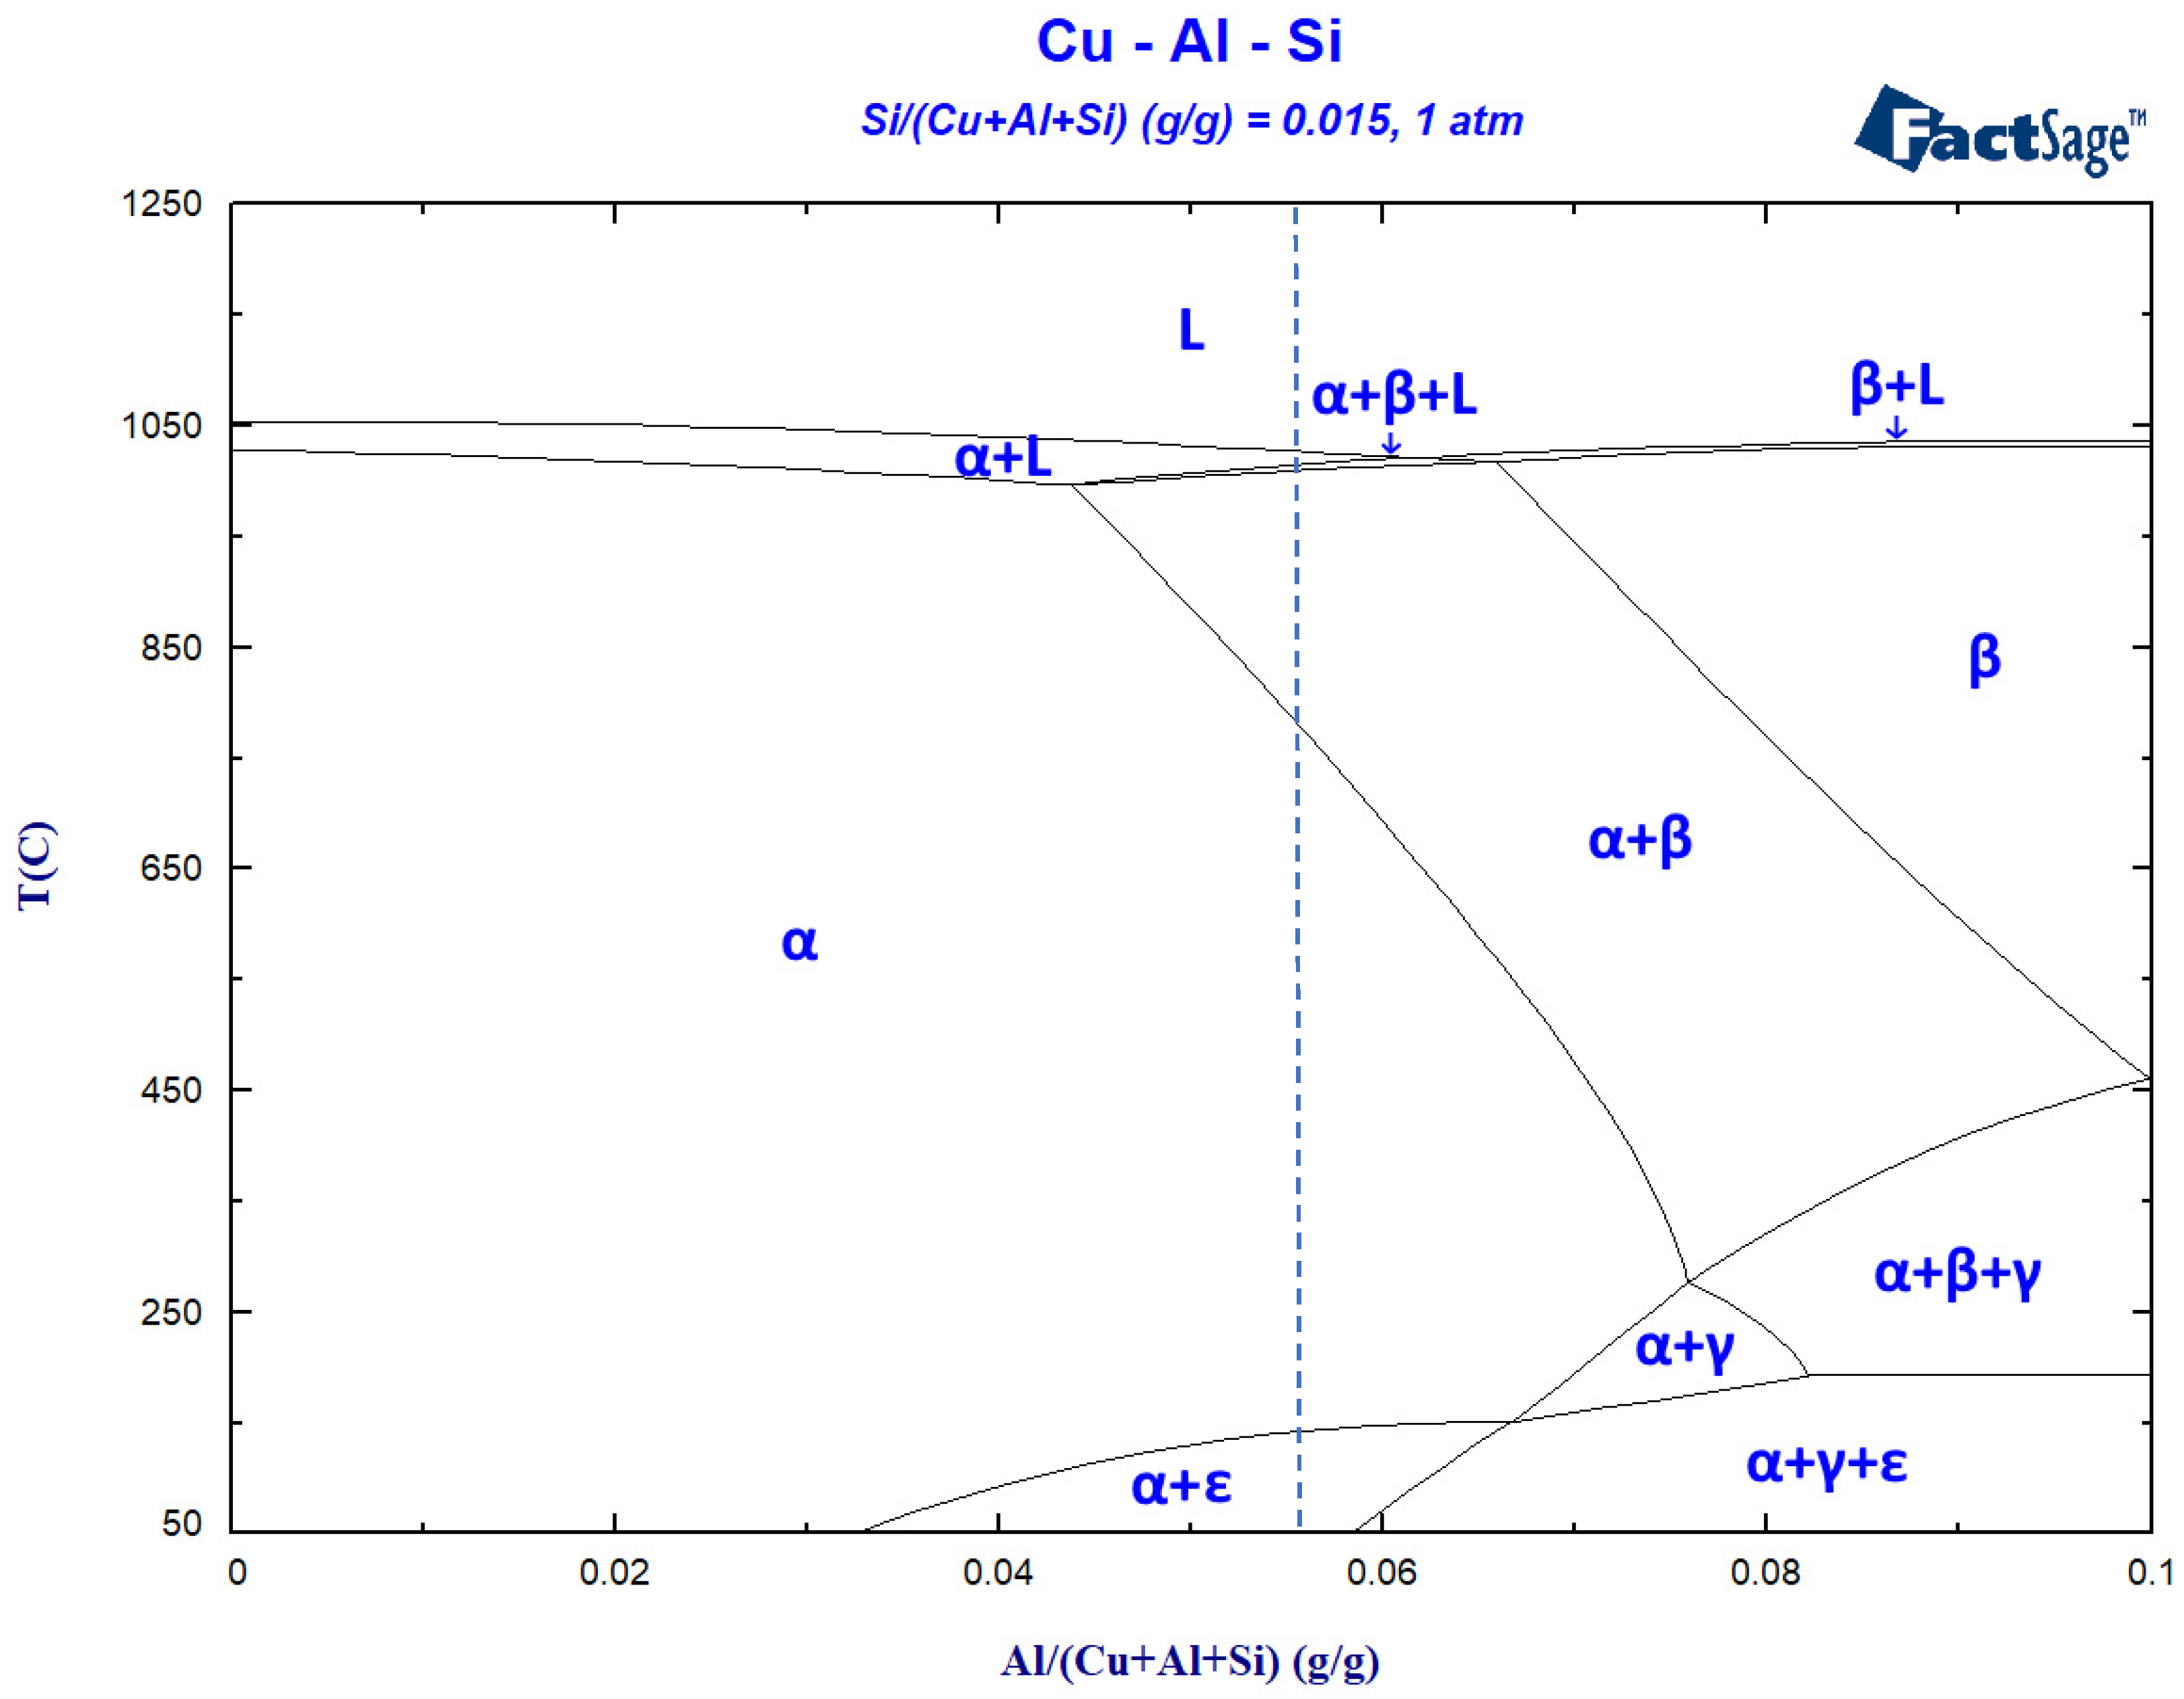
To further understand phase transitions, thermochemical calculations were completed using FactSage 7.2 software. These enabled the development of the pseudo-binary phase diagram shown in Figure 19. Here, the silicon content was held at a fixed value of 1.5 wt.%, while the respective amounts of Cu and Al were systematically varied. The diagram indicates that the solidification of a fully molten alloy with the same composition as the ASB powder (Table 1) would commence with the formation of a two-phase aggregate of solid α + β phases. While the phase diagram only predicts phase formation under equilibrium conditions, under conditions of non-equilibrium, rapid cooling, the α phase should remain largely unaffected, while the β phase would be expected to transform into martensitic β’ [23]. This was in direct agreement with the observed microstructure of as-built ASB (Figure 17 and Figure 18), given that both phases were detected with XRD, and a martensitic phase with a lathe/needle-like morphology was clearly present.
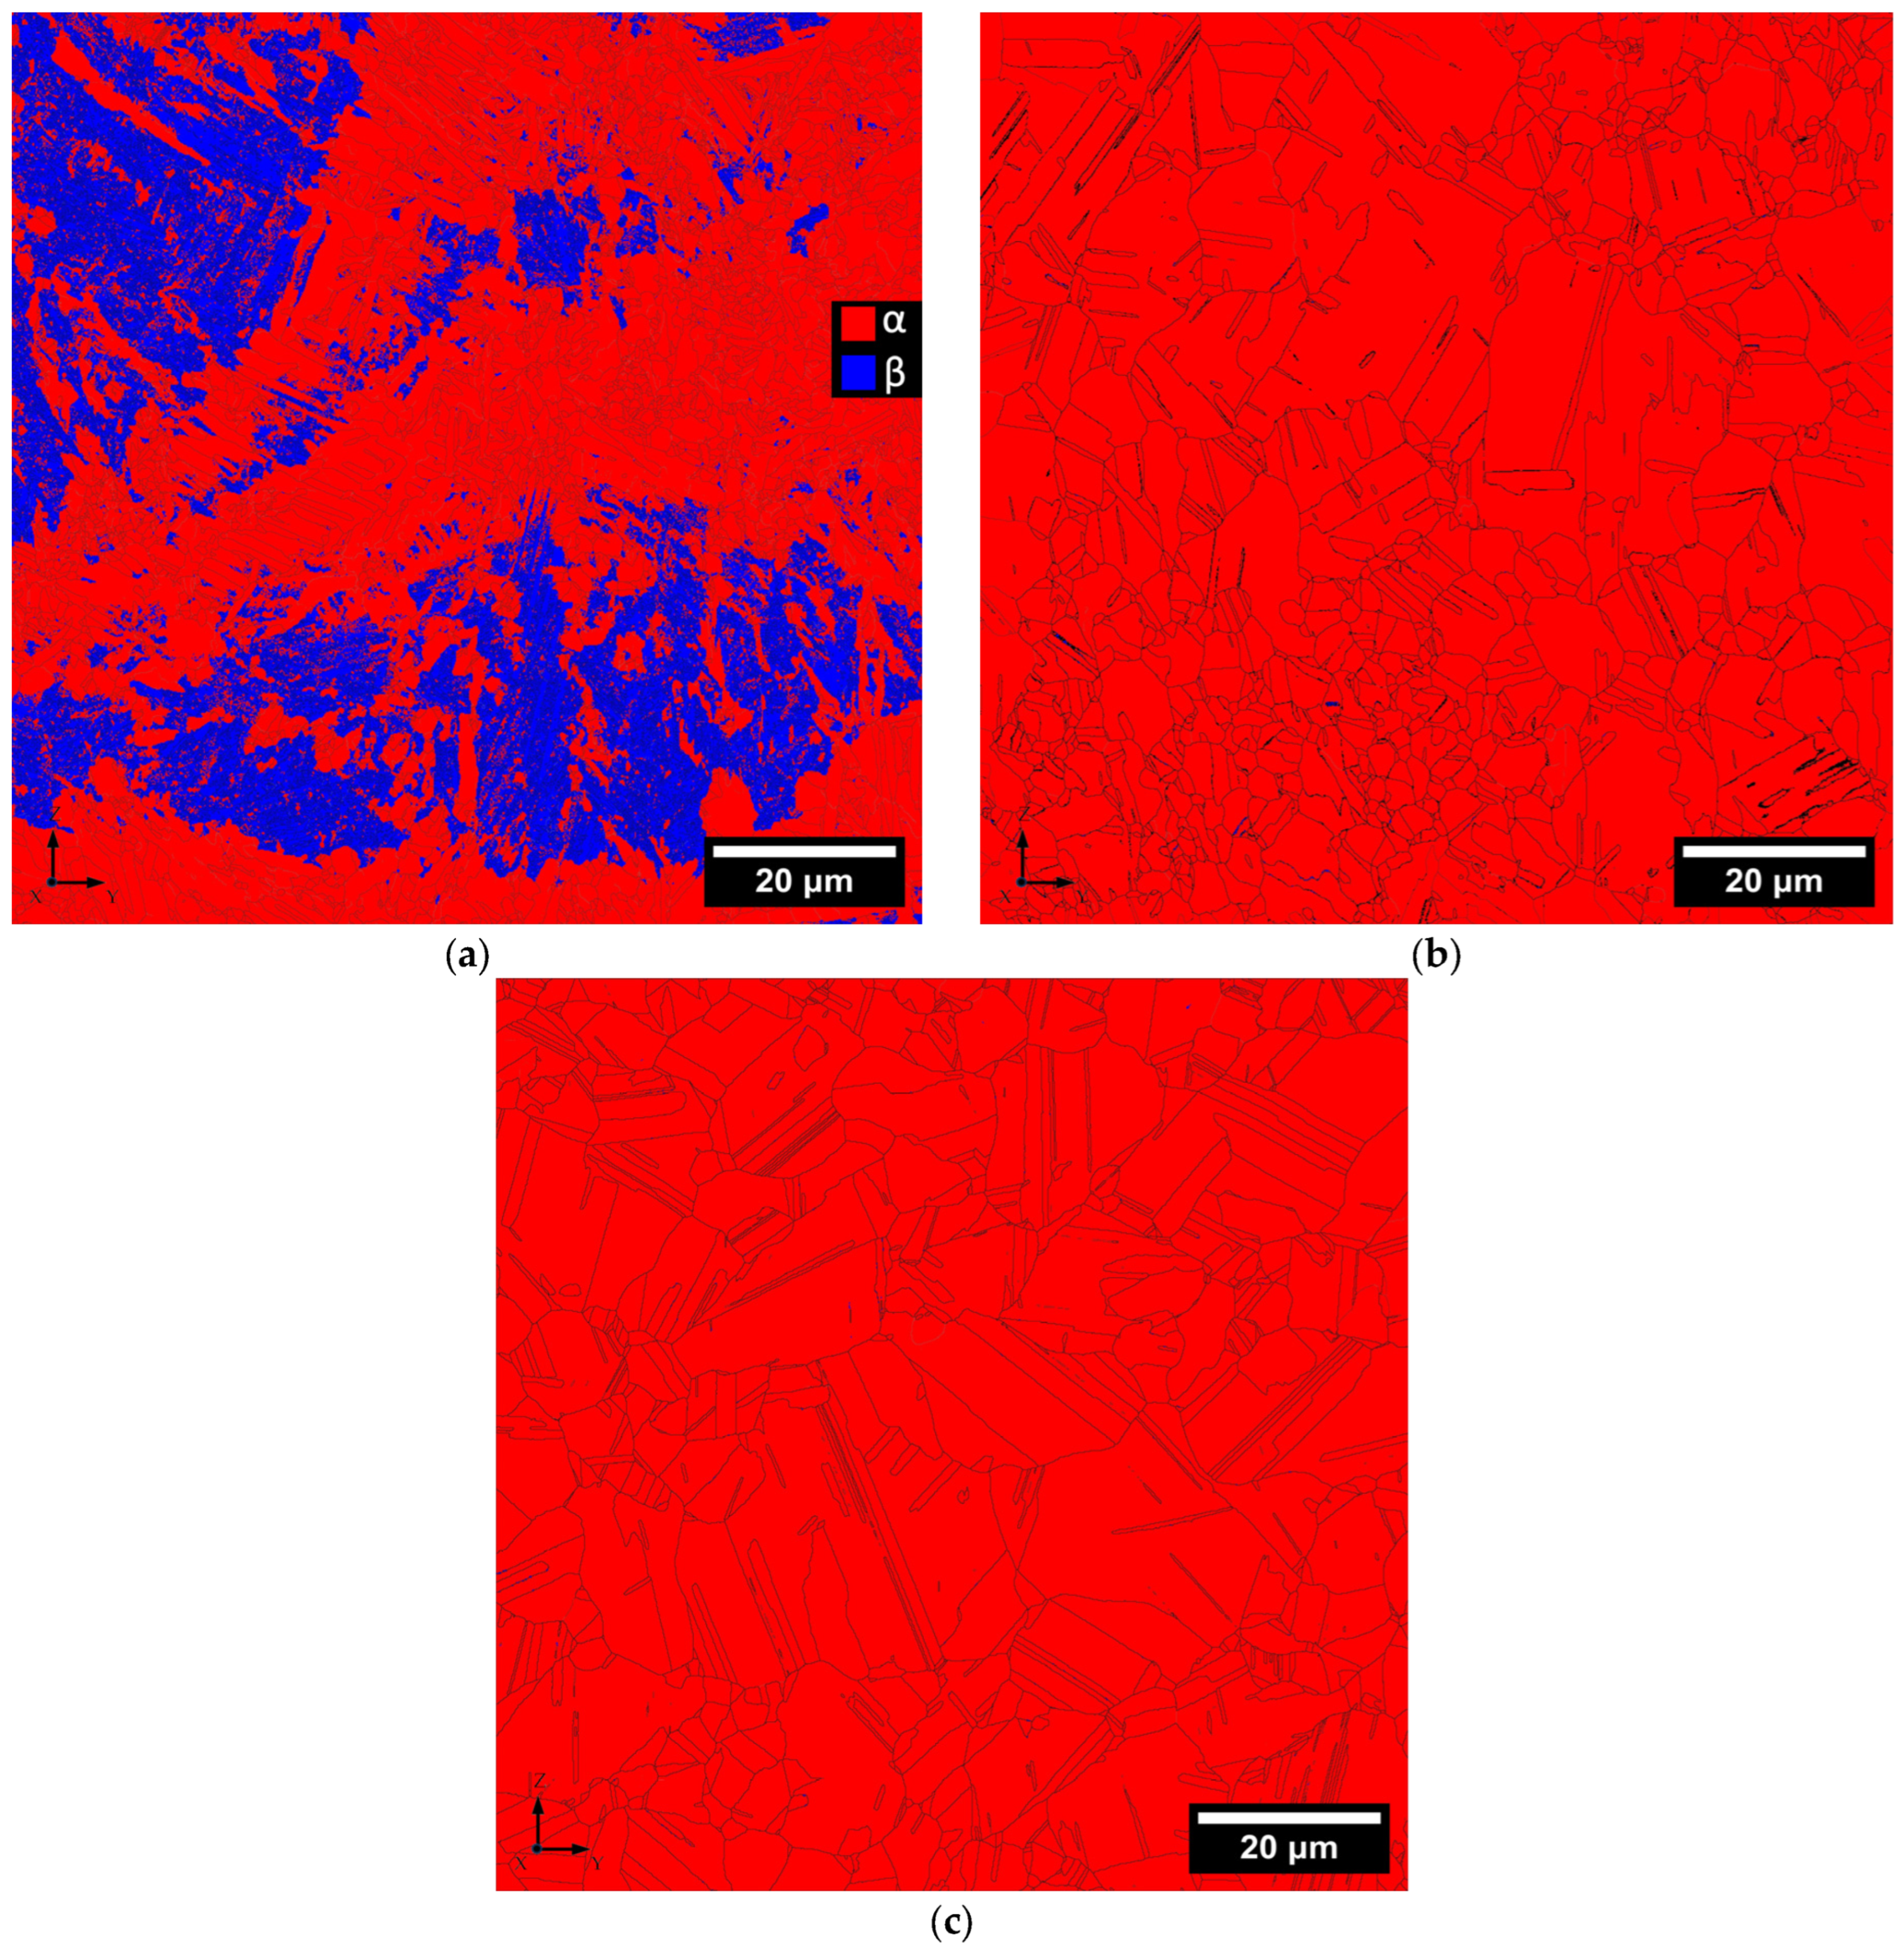
EBSD analysis was conducted on the three variants of ASB. Phase maps superimposed on the grain boundary maps generated through this assessment are shown in Figure 20. These results were in direct agreement with XRD findings (Figure 18), confirming that the as-built sample contained a mixture of α-Cu with FCC crystal structure (red phase) and martensitic β’ phases with BCC crystal structure (blue phase), while both of the heat-treated materials were single-phase α-Cu. The dual-phase nature of the as-built material was logical considering that solidification would commence with the simultaneous formation of α-Cu and β phases (Figure 19), with only the latter transforming into martensitic β’ as a result of the rapid solidification synonymous with LPBF processing. Results for the heat-treated specimen were also as expected. According to the pseudo-binary phase diagram (Figure 19), the as-built microstructure would have transformed to single-phase α-Cu during the isothermal hold at 620 °C. Water quenching would have then preserved this microstructure down to room temperature, thereby avoiding any chance of forming secondary phases such as metastable β’ as well as those that could otherwise form under slow cooling conditions; namely, γ and ε.
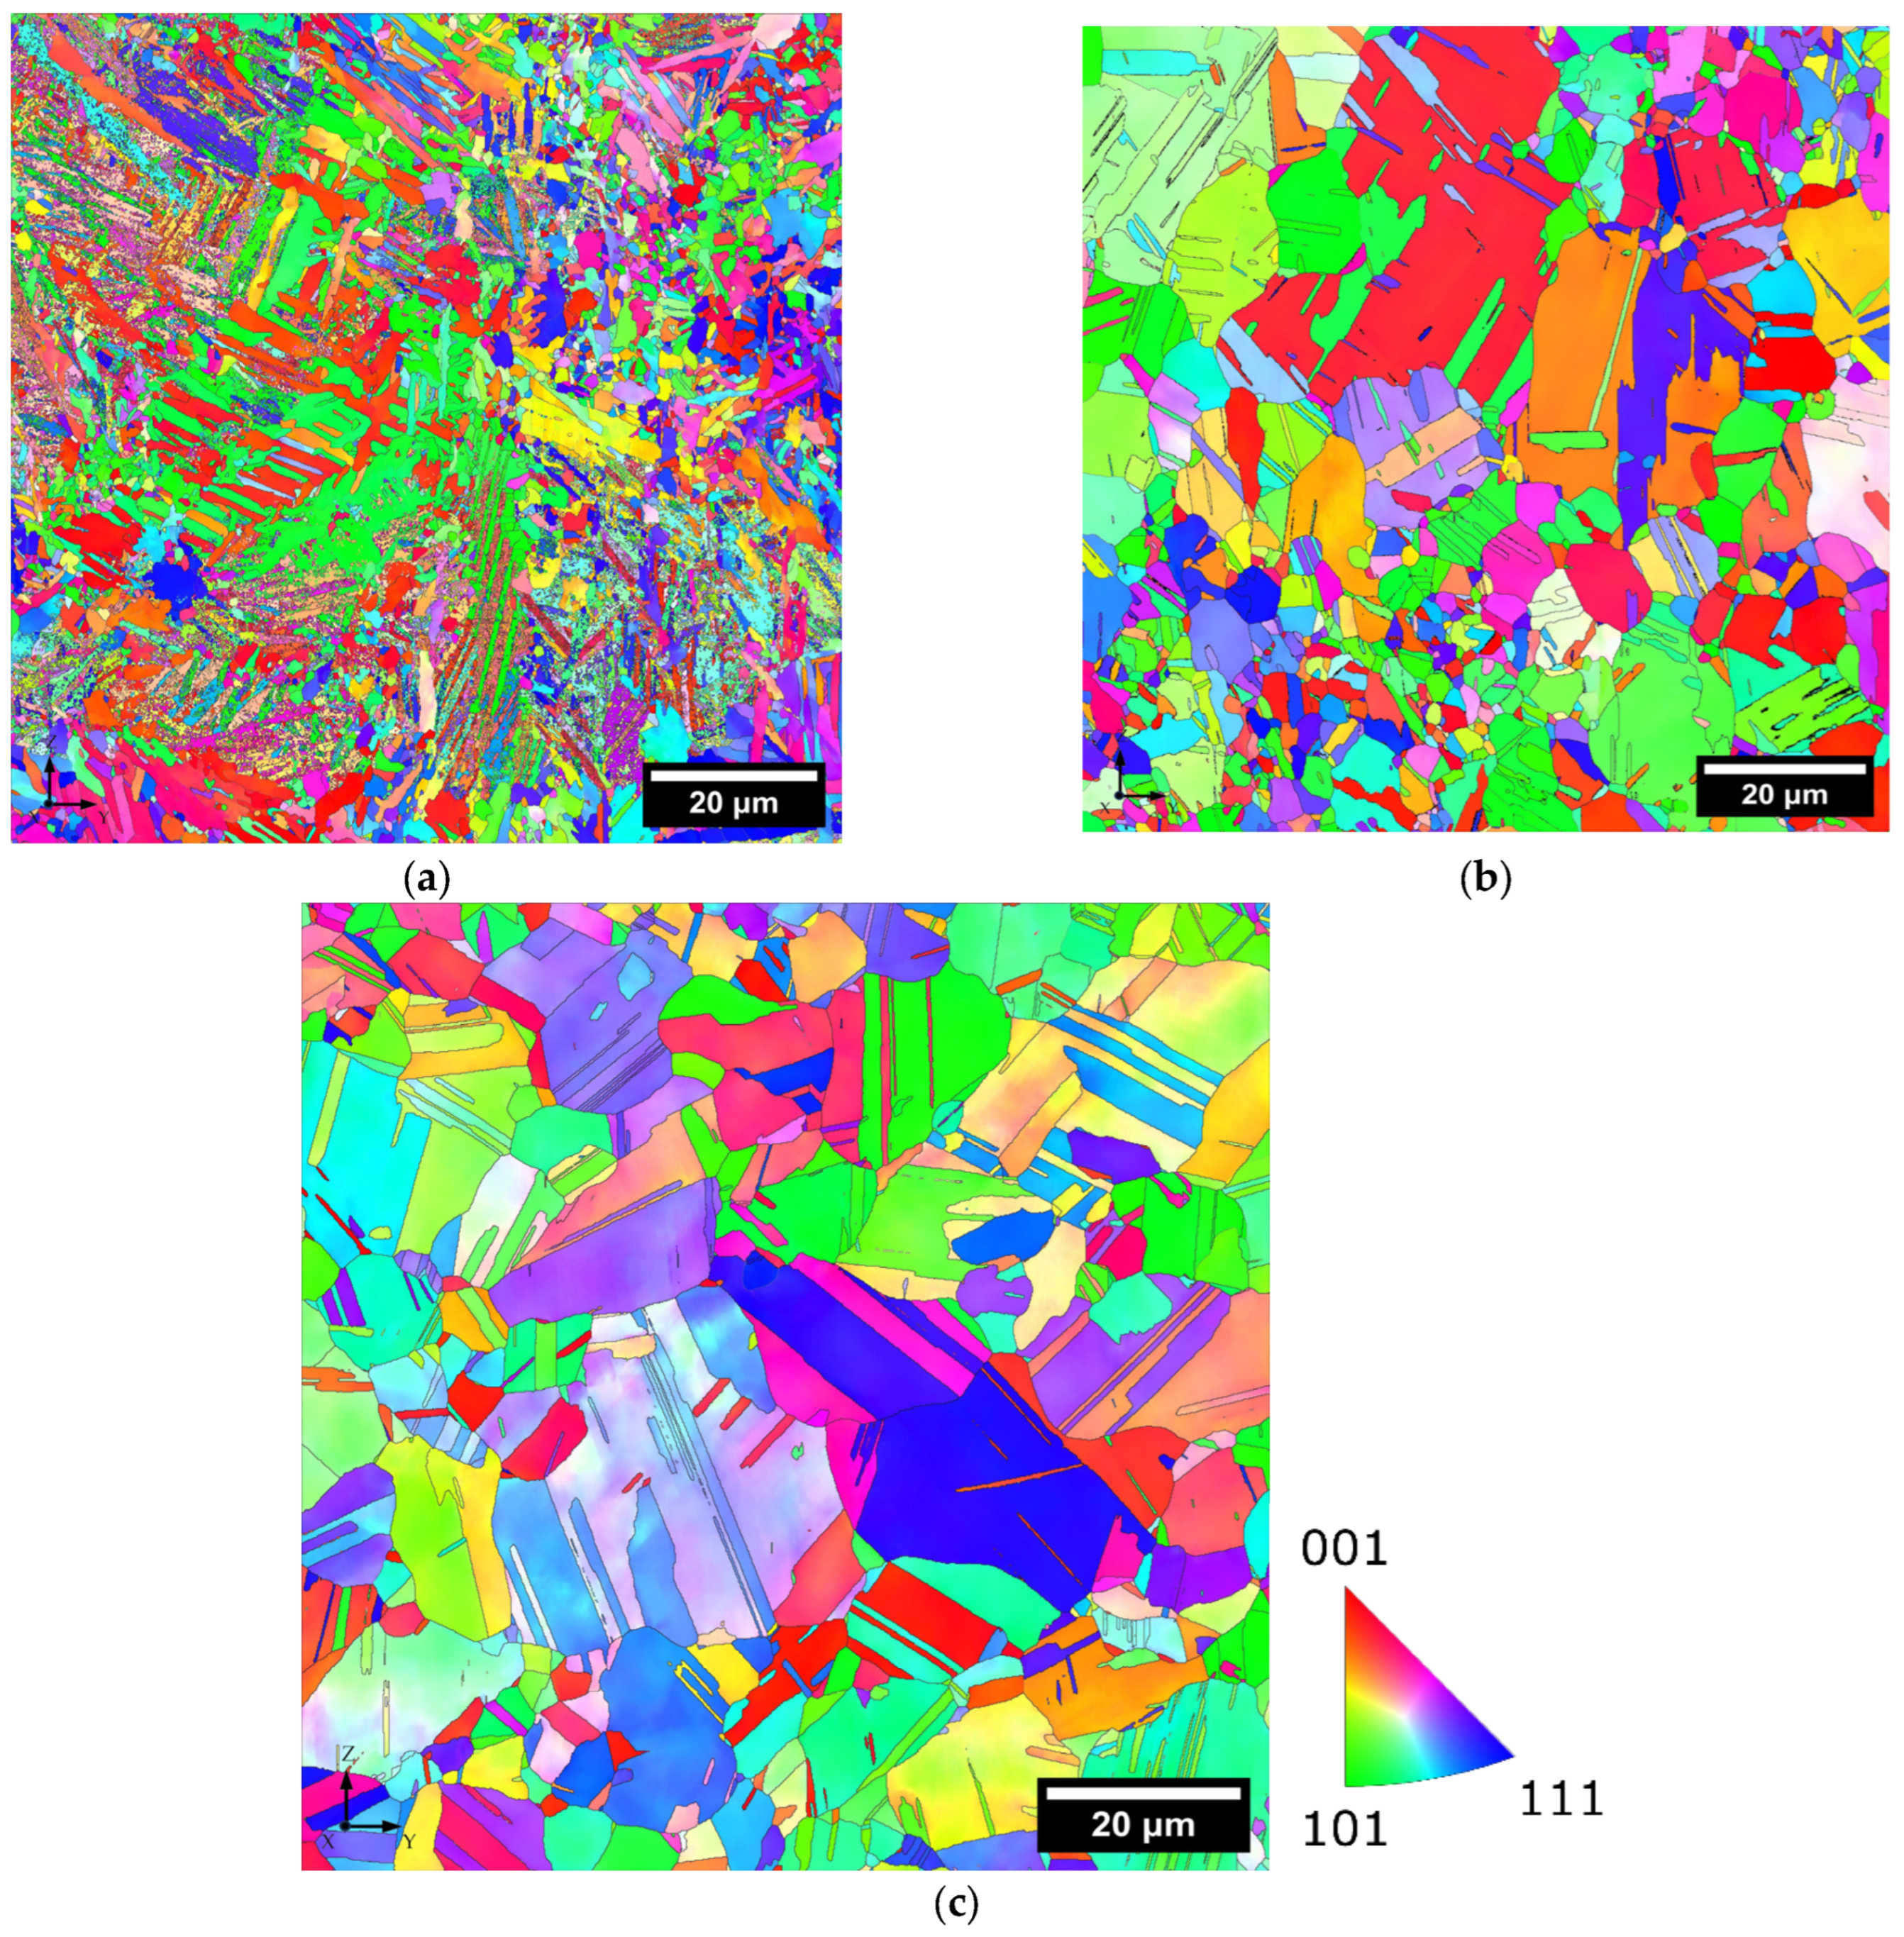
Inverse pole figures (IPF-z) (Figure 21), taken from 100 × 100 µm areas, and pole figures (Figure 22), generated from 500 × 500 µm areas, highlight grain orientation and the overall texture distribution throughout the samples. The IPF map of the as-built alloy revealed a mixture of equiaxed and columnar grains with relatively random orientation with respect to the building direction. The heat treatment resulted in noticeable grain growth, particularly for grains with their <001> and <110> directions aligned along the building direction. However, the grains in the heat-treated L-PBF ASB remain smaller compared to those in the wrought counterpart.
The PF graphs, shown in Figure 22, indicate that the as-built ASB exhibited a relatively stronger {100}<001> cubic texture, with a maximum intensity of 2.37. In contrast, the heat-treated L-PBF showed a reduced cubic texture intensity, with a peak value of 1.95, confirming that the applied heat treatment weakened the solidification texture. Unlike LPBF ASB, the heat-treated wrought alloy revealed shear texture components, specifically A 1 * (111)[ 1 ¯ 1 ¯ 2] and A 2 * (111)[ 11 2 ¯ ], with a texture strength of 2.37 times random.
EBSD also facilitated the analysis of grain boundaries, including average grain size, aspect ratio, and twinning, with data extracted from 500 × 500 μm scanning areas to aid statistical accuracy. The as-built ASB had an overall average grain size of 2.28 µm, as calculated following ASTM 2627 [24]. However, specific average grain sizes for the α-Cu and β’ phases were 2.71 µm and 1.61 µm, respectively. Heat treatment eliminated β’ and coarsened the α-Cu grains to an average size of 7.94 µm. Despite such growth, the average grain size remained approximately 33% smaller than that measured for the heat-treated wrought counterpart (11.62 µm).
In Figure 23, cumulative frequency plots for the aspect ratios of grains are shown. The distribution for the as-built ASB was distinctly different, while those for the two heat-treated alloys were nearly identical. Commonly, grains are classified as equiaxed (<3) or columnar (>3) based on their aspect ratio. In this context, approximately 20% of the grains in as-built ASB were columnar, while ~80% were equiaxed. However, heat treatment significantly altered these proportions, reducing the concentrations of columnar grains to 5% in printed and heat-treated ASB and its heat-treated wrought counterpart, with ~95% of grains becoming equiaxed.
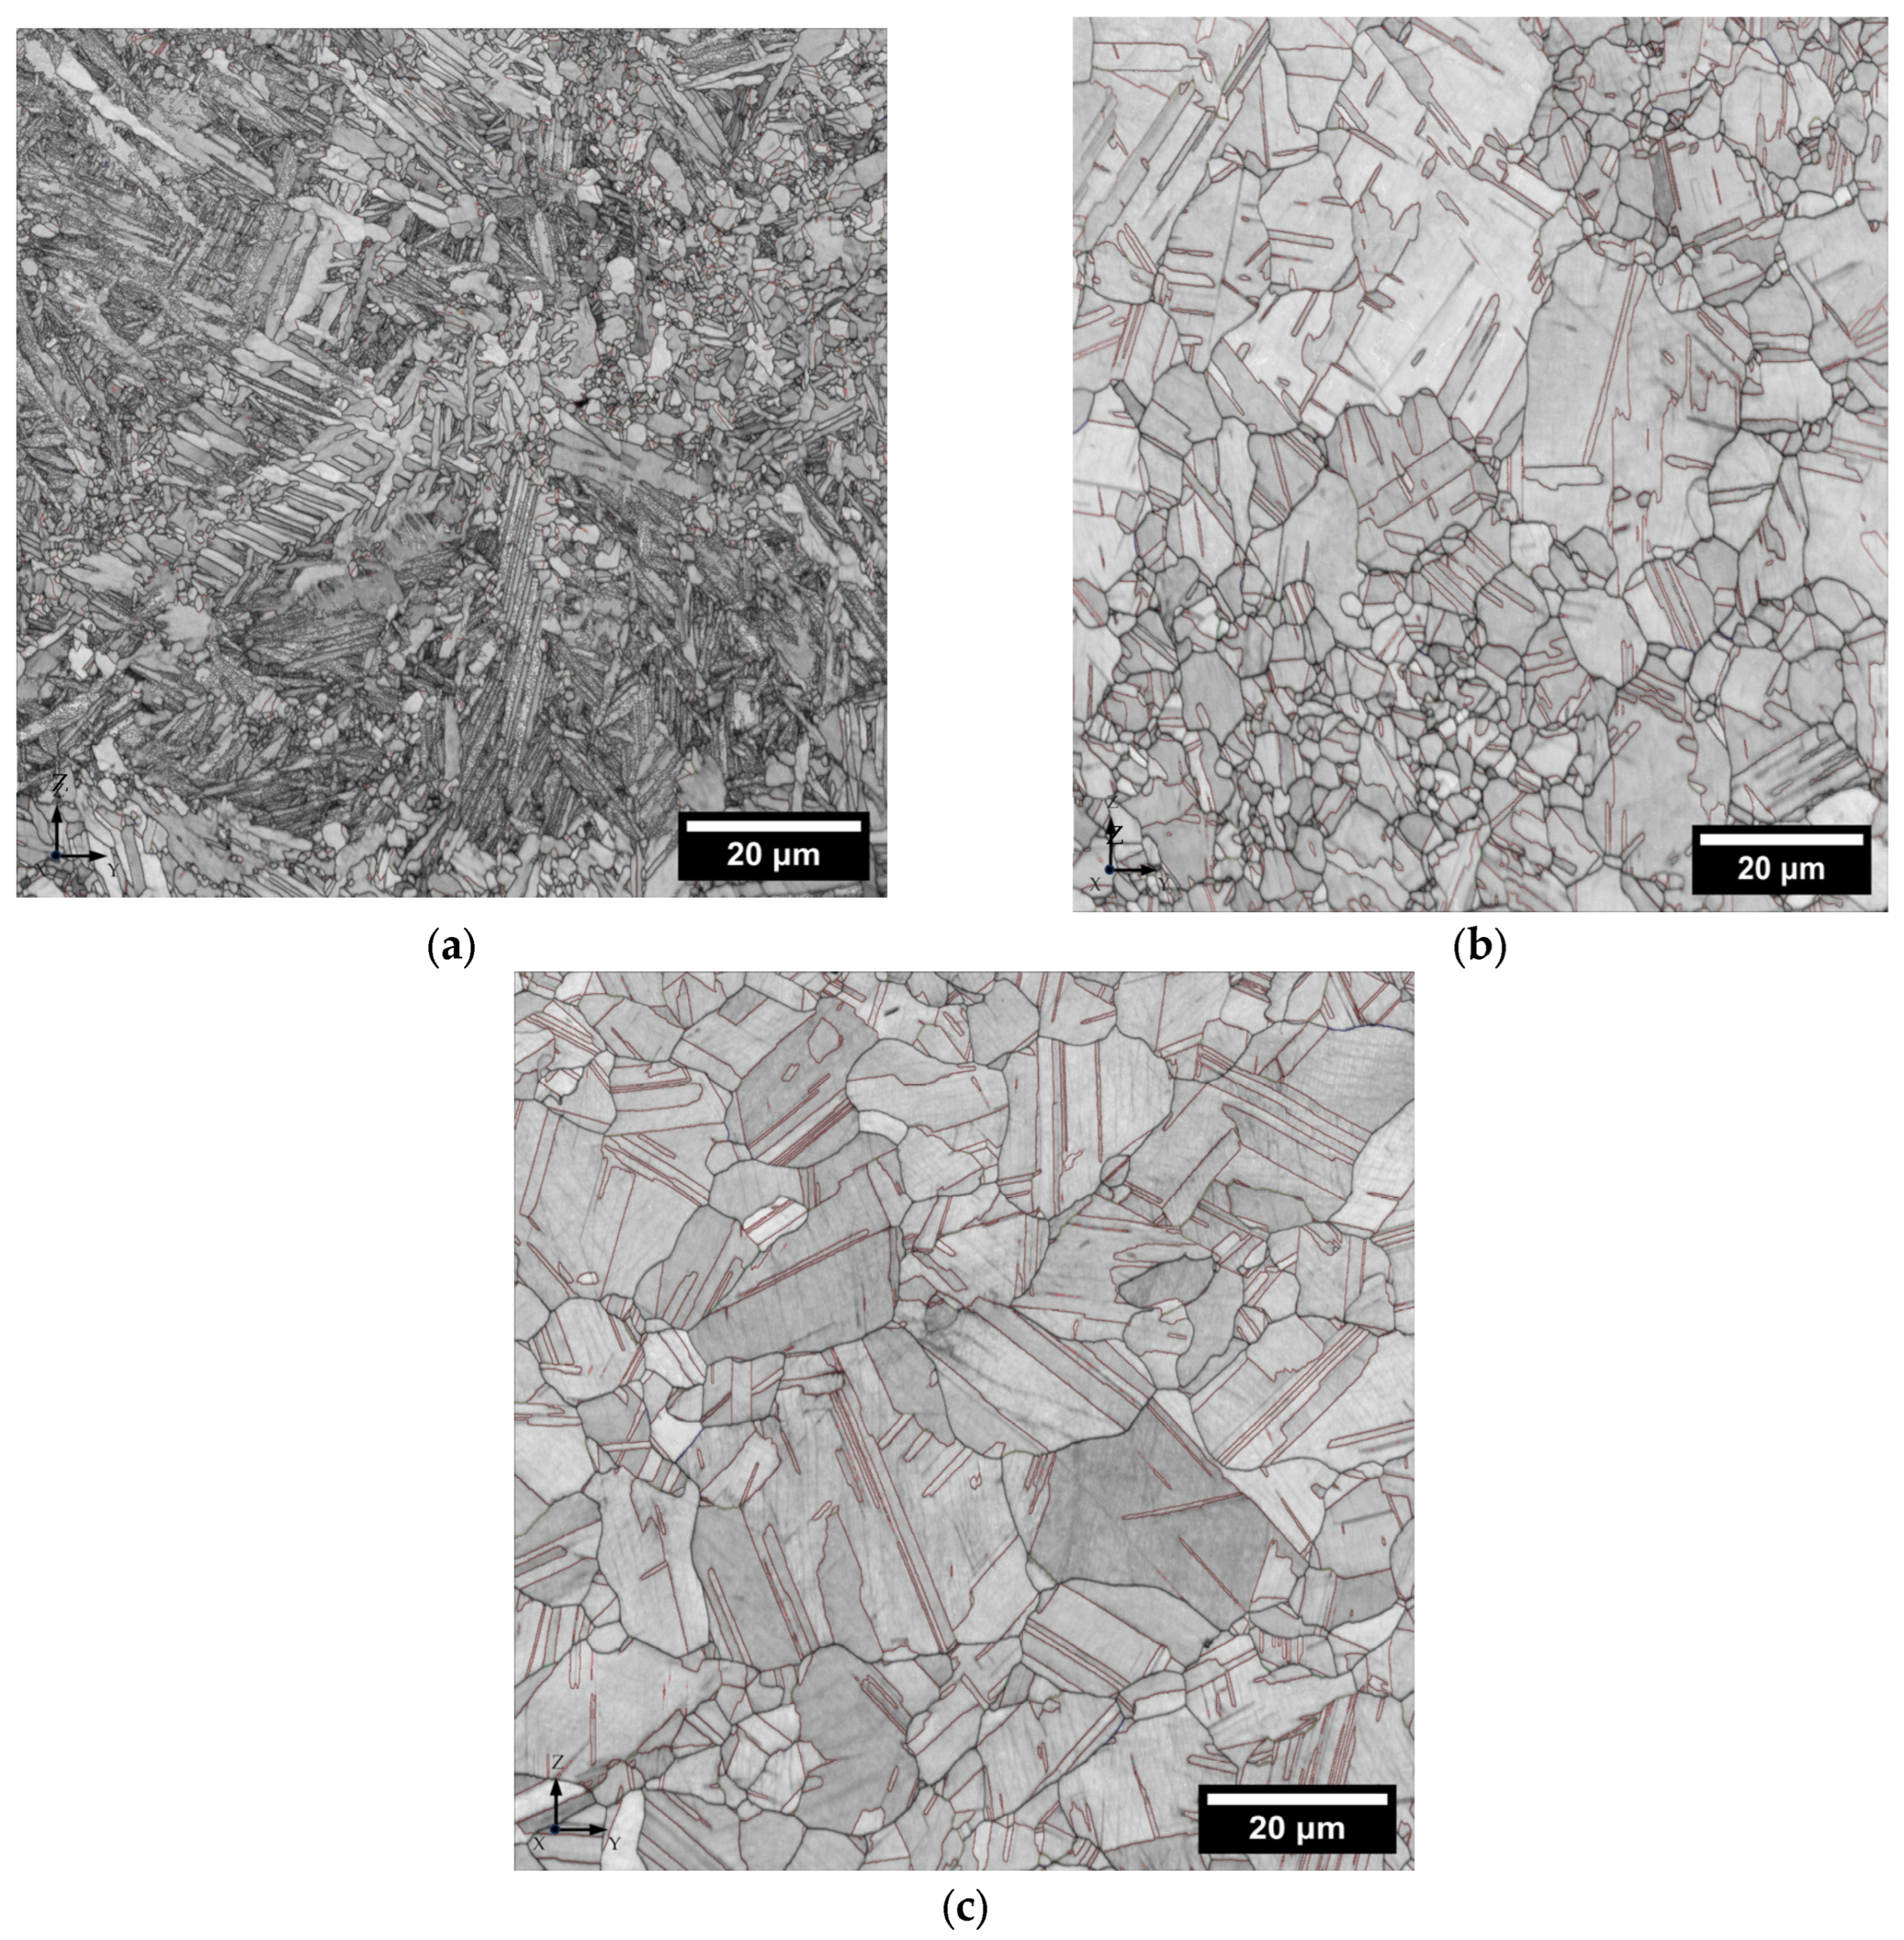
Band contrast images superimposed on the grain boundary maps in Figure 24 indicate the concentration of coincident site lattice (CSL) boundaries in each sample. In the as-built ASB, ~10% of the high-angle grain boundaries corresponded to Σ3-CSL boundaries, indicative of twin grains with a 60° rotation about the <111> direction. After heat treatment, the concentration of twin boundaries increased significantly to 58%, suggesting that annealing-induced twinning was responsible for this transformation in the absence of mechanical working. Notably, the concentration of twin boundaries in the heat-treated wrought ASB (64%) was closely aligned with printed and heat-treated ASB. Although these ASB specimens were subjected to the same thermal treatment, the former was heavily cold-worked immediately prior to heat treatment. As such, twin boundaries in the wrought ASB may have been induced through both mechanical and thermal mechanisms, possibly explaining the modestly higher concentration measured.
The physical and mechanical properties of the ASB materials were then assessed, commencing with magnetic permeability. Magnetic permeability is a relative measurement comparing the strength of a magnetic field before and after passing through a material, normalized to that of free space. A measured value of 1.00 indicates that the material does not affect the magnetic field, while values greater than 1.00 represent materials that attenuate the magnetic field, weakening its output. Conversely, values less than 1.00 indicate magnetic materials that increase the overall strength of a field. In many cases, for defence applications, high attenuation is desired for magnetic shielding against various radar technologies, while low attenuation may be preferred in scenarios where interference with onboard sensors must be minimized. Tests revealed that all formats of ASB maintained a magnetic permeability of 1.00, confirming that they have no significant effect on magnetic fields. Furthermore, Defence Standard 03-879 [3] specifies that ASB must maintain a permeability below 1.05 for in-service use, verifying that L-PBF processing had no impact on this property for alloy C64200.
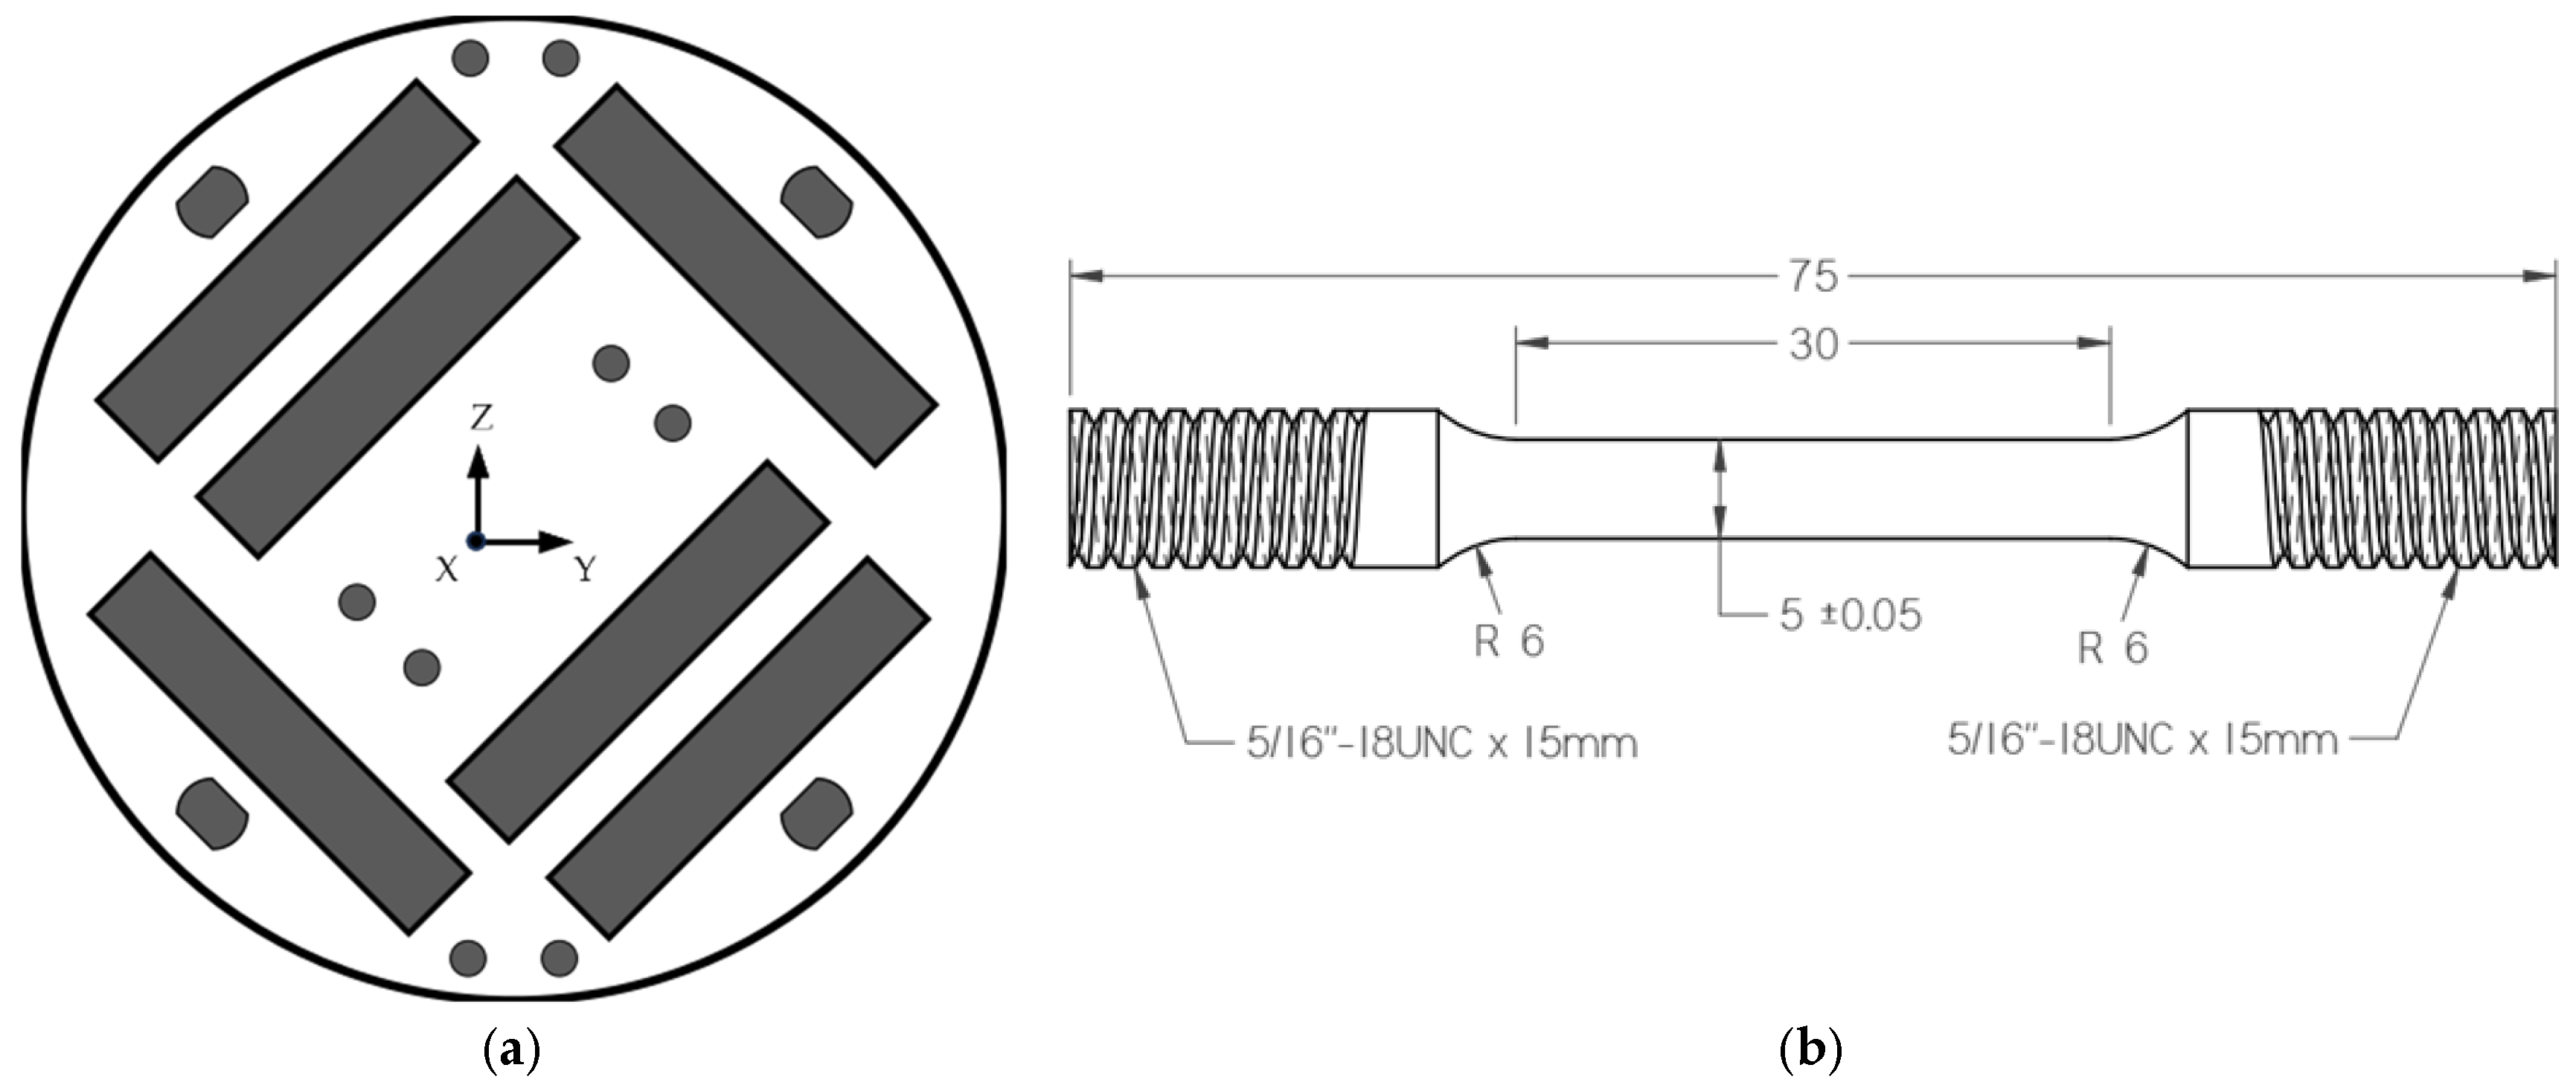
Mechanical properties assessments included tensile and Charpy impact testing on both printed and conventional wrought materials. Tensile blanks exhibited an average density of 99.5 ± 0.3%. These values were deemed to be in reasonable agreement with the anticipated density range for cuboid specimens based on DOE results (99.2% to 99.8%; Figure 14). The build plate is shown in Figure 25, and a summary of the averaged tensile results is shown in Table 2, with examples of the actual engineering stress-strain curves provided in Figure 26. For comparison purposes, property minima for ASB in conventional wrought and cast forms are included, along with those specified in ASTM B150 [25].
The as-printed ASB exhibited the highest strength among all tested variants. Its yield strength was more than double that of the heat-treated wrought counterpart, exceeding the lower limit for the strongest conventional form of ASB (cold-rolled sheet) by more than 300 MPa and surpassing that of cast ASB by more than three times. The UTS of the as-built ASB was also superior, exceeding that of heat-treated wrought by more than 200 MPa and greatly surpassing all minimum values specified for conventional ASB forms.
Although the ductility to fracture of as-built ASB was appreciable, it fell well below the values reached and/or expected for cast and wrought counterparts. Application of the post-build heat treatment significantly altered the tensile properties of printed ASB, primarily reducing both yield strength and UTS. However, the final values closely matched those of wrought ASB and still exceeded all minima for the different specifications noted for conventionally processed ASB. The most notable gain from heat treatment was a five-fold improvement in elongation to fracture.
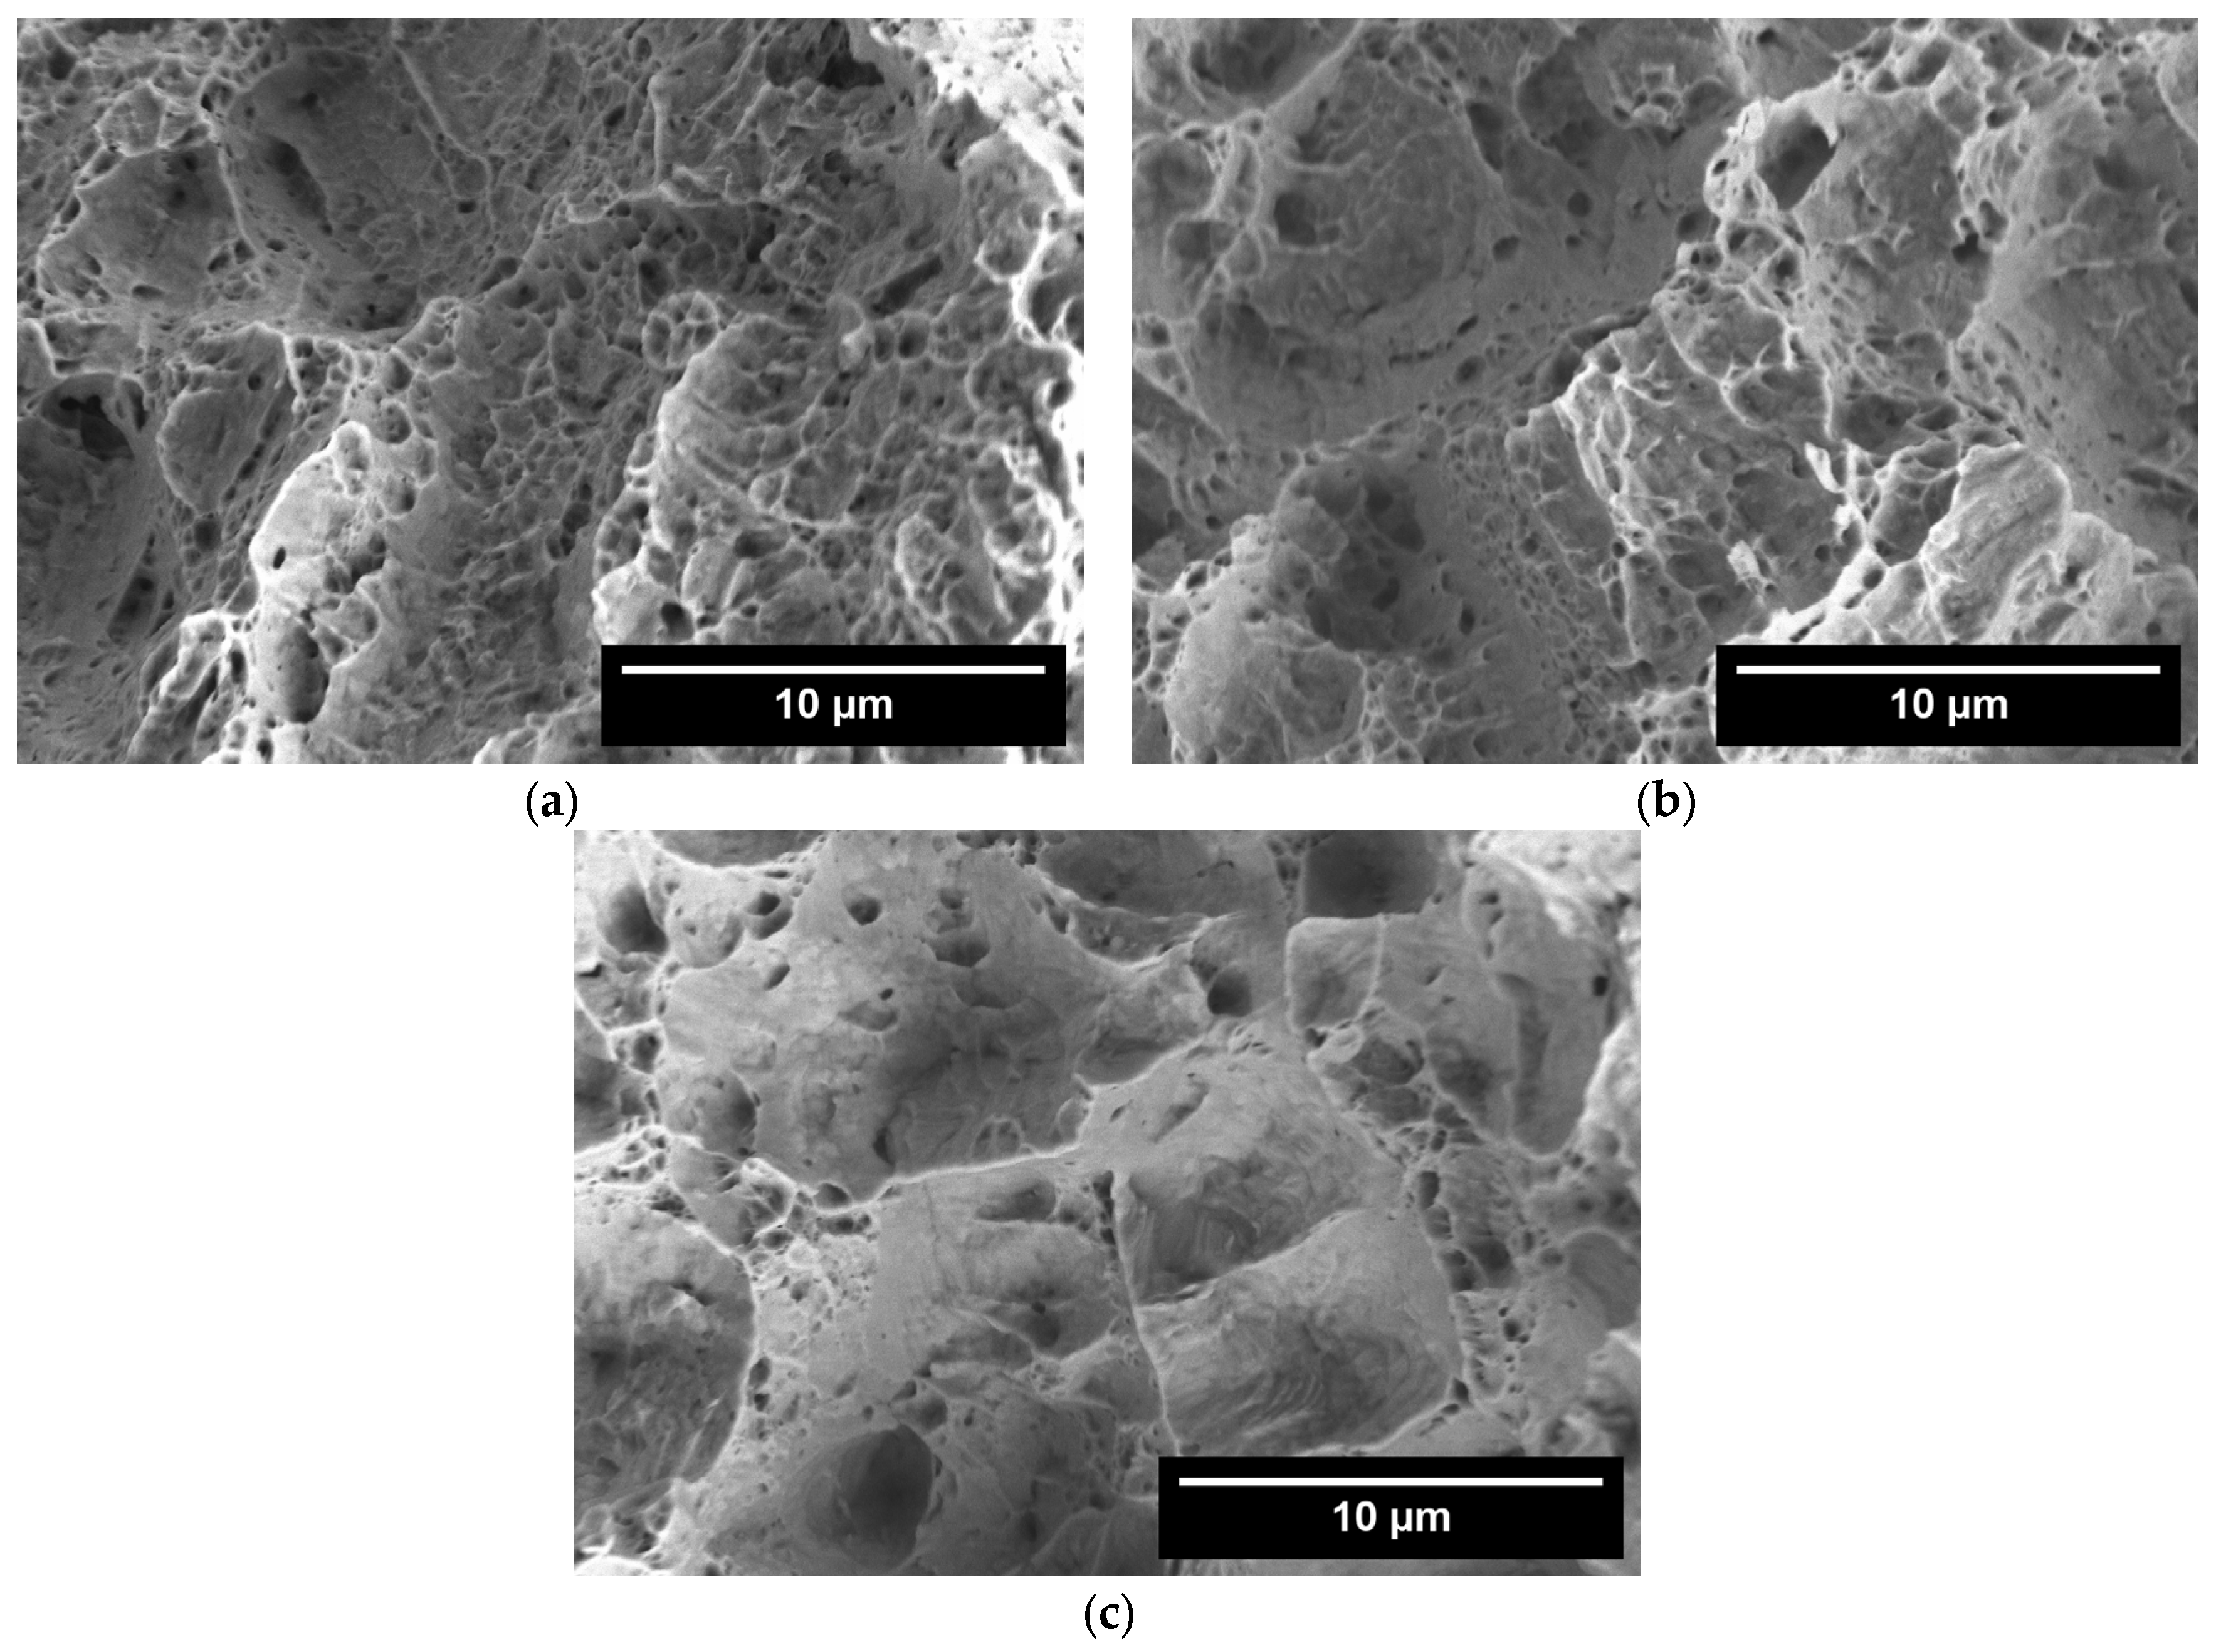
Representative images of the tensile specimen fracture surfaces for each ASB variant are shown in Figure 27. All fractures were consistent with a ductile failure mode, with microvoid coalescence as the dominant feature. However, the size of the microvoids varied among the materials. In the as-built ASB, the voids were consistently small, whereas they became coarser in the heat-treated printed counterpart and largest in the heat-treated wrought material. These findings were in agreement with tensile results, where all three variants exhibited appreciable ductility prior to fracture, with ductility improving steadily from as-built to printed and heat-treated, and finally to heat-treated wrought.
The only specification on absorbed impact energy for ASB is given in DefStan 02-879 Part 3 [3], which requires the material to absorb >33 J in an impact test. Data gathered on this trait are shown in 
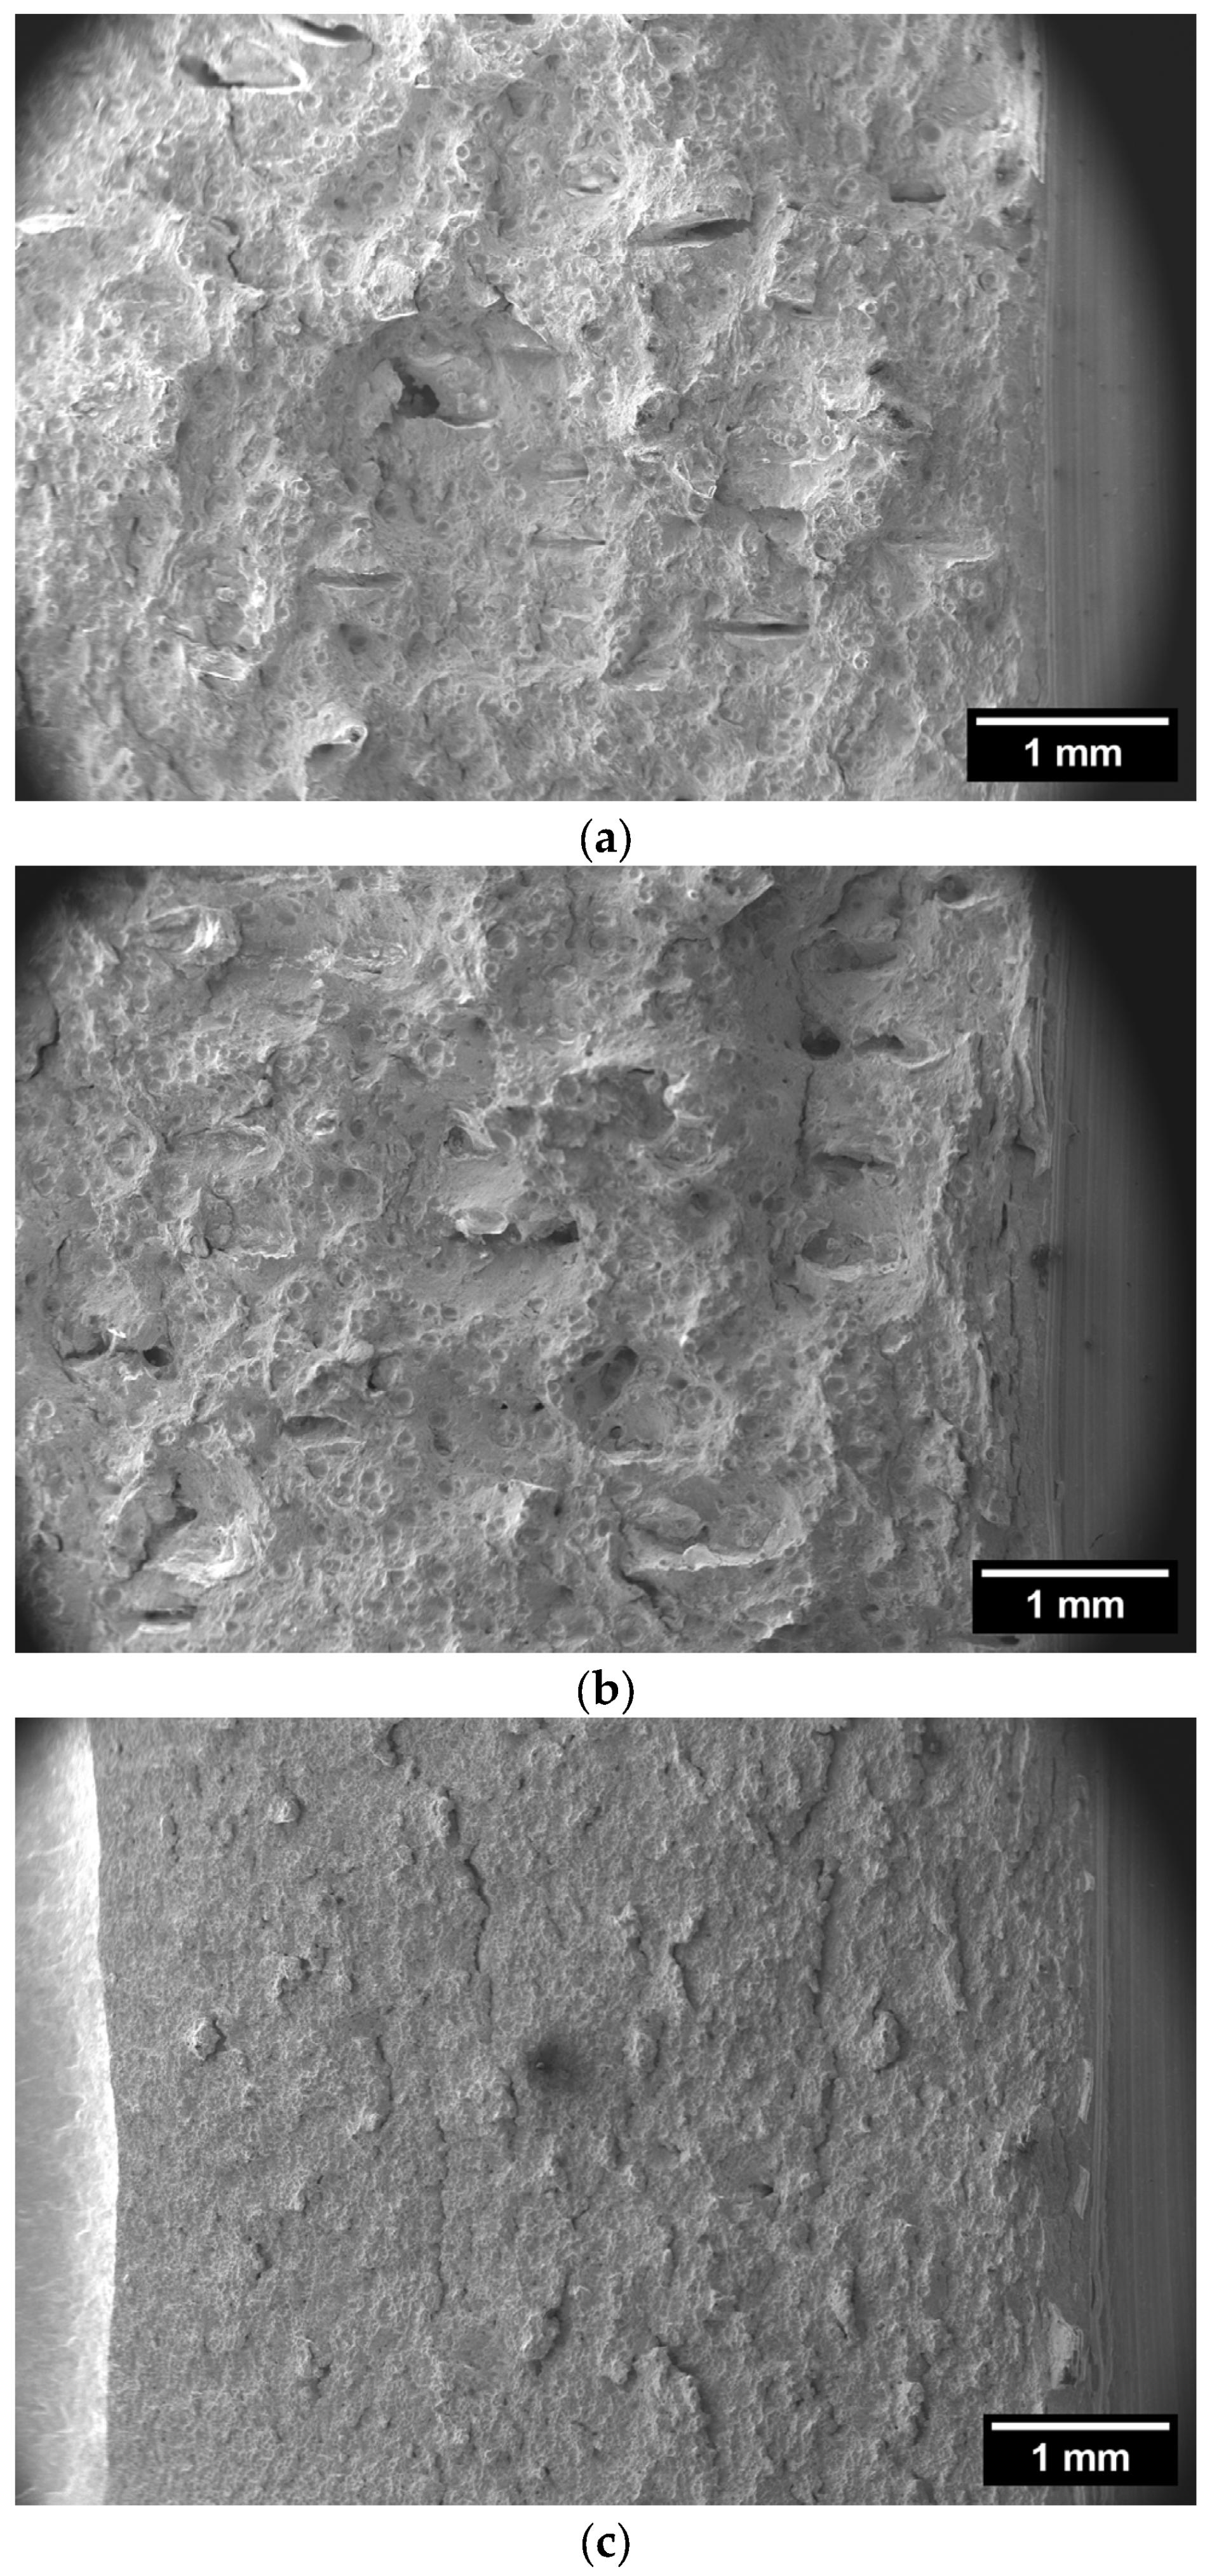
Table 2. Akin to tensile elongation results, ASB in the as-built condition failed to meet the minimum energy required for the alloy, falling slightly (3 J) below the specification threshold. However, this issue was resolved through heat treatment as impact energy was now doubled and thereby surpassed the minimum requirement to a significant extent. Examining the fracture surfaces of the impact samples (Figure 28) revealed horizontal cracks aligned with the printed layers, regardless of the fracture orientation. Such cracks were less apparent in the printed and heat-treated samples but were completely absent from the heat-treated wrought material.
Linking the mechanical results to the underlying microstructure shows a strong correlation between the two. The as-built ASB exhibited the finest microstructure, as well as being the only condition to contain the strong yet brittle β’ martensite. This matched the tensile properties with as-built ASB demonstrated the highest strength, but also the lowest ductility. The fine microstructure was further reflected in the fracture surfaces, with as-built ASB displaying the smallest scale of microvoid coalescence. Heat treatment allowed for the complete elimination of β’, dramatically increasing ductility while also coarsening the α-phase. This microstructural evolution resulted in a reduction in strength and a corresponding increase in the size of microvoids observed in the fracture surfaces.
The printed and heat-treated ASB exhibited a yield strength and UTS comparable to its heat-treated wrought counterpart. This was expected given that both materials were subjected to the same thermal cycle, and both were found to be single-phase α-Cu (Figure 18 and Figure 20). However, the printed version remained inferior in terms of total elongation to fracture and absorbed impact energy (Table 2). Factors that may contribute to these differences include the noted variations in grain size (~8 µm in printed and heat-treated ASB versus ~12 µm in wrought) and the presence of secondary horizontal cracks in the impact fracture surfaces of the printed material (Figure 28). As such, it was hypothesized that further adjustments in the processing of printed ASB (i.e., scan strategy changes and/or manipulation of heat treatment parameters) could narrow the prevailing differences.

4. Conclusions

This research focused on the laser powder bed fusion processing of UNS C64200 aluminum–silicon–bronze. Key findings are as follows:
  • Aluminum–silicon–bronze UNS C64200 was responsive to laser powder bed fusion additive manufacturing and readily produced high-density parts.
  • The optimum parameters were found to be 320 W laser power, 770 mm/s scan speed, 0.088 mm hatch spacing, with a set 0.030 mm layer thickness and a 0.090 mm laser spot size. This resulted in a VED of 157.4 J/mm3.
  • The printed samples showed consistency, with density variations of only 0.21% across multiple samples, and the standard deviation for UTS was as low as 0.3 MPa.
  • Although ASB is typically a single-phase alloy, the as-built variant contained significant amounts of β’ martensite, which increased tensile strength significantly but had a detrimental effect on ductility and impact toughness.
  • Post-build heat treatment (620 °C for 2 h, followed by water quenching) eliminated β’, as verified through both XRD and EBSD analyses. It also manifested grain growth, altered grain morphology to a more equiaxed structure, and increased the concentration of twin boundaries.
  • The as-built tensile performance showed improved strength over the wrought alloy but was quite brittle, with ductility of just 4.88 ± 0.97% due to the presence of the brittle β’ phase. The heat-treated sample achieved a Young’s modulus of 111.7 ± 1.3 GPa, yield strength of 328.8 ± 2.5 MPa, ultimate strength of 567.0 ± 0.3 MPa, and ductility of 24.60 ± 0.29% while returning to a primarily α-Cu alloy. The ductility of the heat-treated sample was over five times greater than the as-built sample, though strength was lowered by 230 MPa. Nonetheless, the heat-treated sample exceeded all requirements outlined in DefStan 02-834 [3].
  • The impact performance of the as-built sample was 30 J, just below the DefStan requirement of 33 J. However, heat treatment allowed the ASB to exceed this requirement, yielding a Charpy impact result of 63 J.

Author Contributions

Conceptualization, K.A.T.; formal analysis, K.A.T.; funding acquisition, D.P.B.; investigation, K.A.T.; methodology, K.A.T.; project administration, D.P.B.; resources, D.P.B.; software, K.A.T.; supervision, D.P.B.; validation, K.A.T.; writing—original draft, K.A.T.; writing—review and editing, A.N. and D.P.B. All authors have read and agreed to the published version of the manuscript.

Funding

This research was funded by the Natural Sciences and Engineering Research Council of Canada, grant number ALLRP 580290-22, and the Canadian Foundation for Innovation, grant number 36245.

Data Availability Statement

All relevant data supporting the findings of this research are included within this journal article. No additional datasets were analyzed during this study.

Acknowledgments

The authors would like to acknowledge the financial support provided by the Natural Sciences and Engineering Research Council of Canada (grant ALLRP 580290-22), the Canadian Foundation for Innovation (grant 36245), Research Nova Scotia, and supporting partners Defence Research and Development Canada, Apollo Laser Cladding, Babcock Canada, GKN Hoeganaes, and Tronos. They would also like to acknowledge the technical support from the Advanced Manufacturing Hub at Dalhousie University and assistance with EBSD from the Canadian Centre for Electron Microscopy, a core research facility at McMaster University.

Conflicts of Interest

The authors declare no conflicts of interest. The funders had no role in the design of the study; in the collection, analyses, or interpretation of data; in the writing of the manuscript; or in the decision to publish the results.

References

  1. Meigh, H.J. Aluminum Bronzes. 2000. Available online: https://www.copper.org/publications/newsletters/innovations/2002/08/aluminum_bronze.pdf (accessed on 24 September 2022).
  2. Righton Blackburns Ltd. Righton-Blackburns-Ltd_Copper-and-Copper-Alloys-DEF-STAN-02-834-NES834-Bar-Forgings_244.pdf. 2021. Available online: https://www.rightonblackburns.co.uk/datasheets/view/Righton-Blackburns-Ltd_Copper-and-Copper-Alloys-DEF-STAN-02-834-NES834-Bar-Forgings_244.pdf (accessed on 24 September 2022).
  3. MODUK DEF STAN 02-834: PART 3; Requirements for Aluminium Silicon Bronze Part: 3: Ingots & Castings. British Defence Standards: Glasgow, UK, 2018; No. 3.
  4. Narasimharaju, S.R.; Zeng, W.; See, T.L.; Zhu, Z.; Scott, P.; Jiang, X.; Lou, S. A comprehensive review on laser powder bed fusion of steels: Processing, microstructure, defects and control methods, mechanical properties, current challenges and future trends. J. Manuf. Process. 2022, 75, 375–414. [Google Scholar] [CrossRef]
  5. Adegoke, O.; Andersson, J.; Brodin, H.; Pederson, R. Review of Laser Powder Bed Fusion of Gamma-Prime-Strengthened Nickel-Based Superalloys. Metals 2020, 10, 996. [Google Scholar] [CrossRef]
  6. Colombo-Pulgarín, J.C.; Biffi, C.A.; Vedani, M.; Celentano, D.; Sánchez-Egea, A.; Boccardo, A.D.; Ponthot, J.P. Beta Titanium Alloys Processed By Laser Powder Bed Fusion: A Review. J. Mater. Eng. Perform. 2021, 30, 6365–6388. [Google Scholar] [CrossRef]
  7. Moghimian, P.; Poirié, T.; Kroeger, J.; Marion, F.; Larouche, F. Emerging Functional Metals in Additive Manufacturing. Adv. Eng. Mater. 2023, 25, 2201800. [Google Scholar] [CrossRef]
  8. Barr, C.; Pateras, A.; Molotnikov, A.; Clarke, D.; Brandt, M. Effect of composition on the tensile and corrosion performance of nickel aluminium bronze produced via laser powder bed fusion. Addit. Manuf. 2022, 54, 102771. [Google Scholar] [CrossRef]
  9. Murray, T.; Thomas, S.; Wu, Y.; Neil, W.; Hutchinson, C. Selective laser melting of nickel aluminium bronze. Addit. Manuf. 2020, 33, 101122. [Google Scholar] [CrossRef]
  10. Alkelae, F.; Sasaki, S. Tribological and Mechanical Characterization of Nickel Aluminium Bronze (NAB) Manufactured by Laser Powder-Bed Fusion (L-PBF). Tribol. Online 2020, 15, 126–135. [Google Scholar] [CrossRef]
  11. Rayner, A.J.; Hierlihy, J.; Trask, M.; Cooke, R.W.; Bishop, D.P. Laser powder bed fusion processing of UNS C63020 nickel aluminum bronze powder. Prog. Addit. Manuf. 2025, 10, 427–449. [Google Scholar] [CrossRef]
  12. DEFSTAN 02-879 (NES879); A 70% Copper, 30% Nickel Alloy with Additions of Iron and Manganese. Righton Blackburns: Wednesbury, UK, 2018; No. 3. Available online: https://www.rightonblackburns.co.uk/datasheets/view/copper-alloy-defstan-02-879-nes879 (accessed on 24 September 2022).
  13. MODUK DEF STAN 02-879: PART 2; Requirements for Copper Alloy Materials in HM Submarines and Surface Ships Not in Class Part: 2: Forgings, Forging Stock, Rods And Sections. British Defence Standards: Glasgow, UK, 2018; Issue 3, No. 3.
  14. MPIF Standard 03; Method for Determination of Flow Rate of Free-Flowing Metal Powders Using the Hall Apparatus. Metal Powder Industries Federation: Princeton, NJ, USA, 2022.
  15. MPIF Standard 48; Method for Determination of Apparent Density of Metal Powders Using the Arnold Meter. Metal Powder Industries Federation: Princeton, NJ, USA, 2022.
  16. MPIF Standard 46; Determination of Tap Density of Metal Powders. Metal Powder Industries Federation: Princeton, NJ, USA, 2022.
  17. Fitzpatrick, J. Powder properties in food production systems. In Handbook of Food Powders: Processes and Properties; Woodhead Publishing Limited: Cambridge, UK, 2013; pp. 285–308. [Google Scholar] [CrossRef]
  18. Krishnan, V.; Bishop, P. Laser Powder Bed Fusion of UNS C63020 Nickel Aluminum Bronze Powder. Manuscr. Prep. 2024, 10, 427–449. [Google Scholar]
  19. MPIF Standard 10; Test Method for Determination of the Tensile Properties of Powder Metallurgy (PM) Materials. Metal Powder Industries Federation: Princeton, NJ, USA, 2025.
  20. Clarke, D. Design and Analysis of Experiments, 8th ed.; Wiley: Hoboken, NJ, USA, 2013. [Google Scholar]
  21. ASM Metals Handbook Volume 4 Heat Treating; ASM Handbook Committee: Materials Park, OH, USA, 1991; Volume 4.
  22. ASTM E23-23(2023); Standard Test Methods for Notched Bar Impact Testing of Metallic Materials. ASTM International: West Conshohocken, PA, USA, 2023.
  23. Copper Development Association. Guide to Nickel Aluminium Bronze for Engineers; Copper Development Association: McLean, VA, USA, 2018. [Google Scholar]
  24. ASTM E2627-13(2019); Standard Practice for Determining Average Grain Size Using Electron Backscatter Diffraction (EBSD) in Fully Recrystallized Polycrystalline Materials, E2627. ASTM International: West Conshohocken, PA, USA, 2019.
  25. ASTM B150/B150M-19; Standard Specification for Aluminum Bronze Rod, Bar, and Shapes. ASTM International: West Conshohocken, PA, USA, 2025.
Figure 1. Particle size distribution measured for the LPBF ASB powder.
Jmmp 09 00147 g001
Figure 2. Images of the C64200 powder utilized. (a) Powder morphology captured through SEM and (b) internal structure captured through OM.
Jmmp 09 00147 g002
Figure 3. Geometry of the cuboid specimen printed to assess the effects of process parameter changes on printed density. All dimensions are in mm.
Jmmp 09 00147 g003
Figure 4. Scanning strategy setup for all prints following a 90-degree clockwise meandering pattern.
Jmmp 09 00147 g004
Figure 5. Geometries of tensile specimen and their location within the build plate; (a) shows the position of the tensile specimen, witness cuboids, and pins, (b) shows the geometry of the tensile specimen met post-machining.
Jmmp 09 00147 g005
Figure 6. Full factorial build results: (a) cuboid specimens on the build plate and (b) mapped density with reference to laser power and scan speed.
Jmmp 09 00147 g006
Figure 7. Confocal images of the porosity observed in the as-built ASB specimen. (a) Lack of fusion porosity (200 W, 1125 mm/s; VED = 59 J/mm3), (b) keyhole porosity (400 W, 375 mm/s; VED = 356 J/mm3), and (c) gas porosity (300 W, 750 mm/s; VED = 133 J/mm3).
Jmmp 09 00147 g007
Figure 8. Stitched confocal images of the (a) lowest (200 W, 1125 mm/s; 96.6% dense) and (b) highest (300 W, 750 mm/s; 99.7% dense) density cuboids printed from ASB powder in the full factorial build.
Jmmp 09 00147 g008
Figure 9. Density vs. VED plot sorted by laser power for DOE1.
Jmmp 09 00147 g009
Figure 10. Density vs. VED sorted by scan speed for DOE1.
Jmmp 09 00147 g010
Figure 11. Porosity distributions in the (a) lowest (380 W, 770 mm/s, 0,088 mm hatch; 98.9% dense) and (b) highest (320 W, 770 mm/s, 0.088 mm hatch; 99.9% dense) density cuboids produced in the central composite DOE.
Jmmp 09 00147 g011
Figure 12. Surface plot of the central composite DOE density results with respect to laser power and scan speed.
Jmmp 09 00147 g012
Figure 13. Regression analyses of contour plots produced while maintaining fixed values of (a) laser power (350 W), (b) scan speed (875 mm/s), and (c) hatch spacing (0.100 mm).
Jmmp 09 00147 g013
Figure 14. Reproducibility of results comparing center point duplicates in DOE2 (red bars; 350 W, 875 mm/s) to cuboids produced with an equivalent VED in DOE1 (Blue).
Jmmp 09 00147 g014
Figure 15. Plot illustrating cuboid density with respect to position on the build plate for the full factorial DOE build. Numbers indicate the build sequence.
Jmmp 09 00147 g015
Figure 16. Plot illustrating cuboid density with respect to position on the build plate for the central composite DOE build. Numbers indicate the build sequence.
Jmmp 09 00147 g016
Figure 17. Laser confocal images of ASB. (a) As-printed, (b) printed and heat-treated, and (c) heat-treated wrought. AM specimens printed at 300 W, 750 mm/s with a final density of 99.7%; etched with ferric chloride.
Jmmp 09 00147 g017
Figure 18. XRD plots acquired from the ASB specimen. (a) As-printed, (b) printed and heat-treated, and (c) heat-treated wrought.
Jmmp 09 00147 g018
Figure 19. Pseudo-binary phase diagram for the Cu-xAl-1.5% Si system calculated using FactSage 7.2 thermochemical software. The dashed line indicates the measured composition of ASB powder.
Jmmp 09 00147 g019
Figure 20. Phase maps of ASB acquired through EBSD. (a) As-built, (b) printed and heat-treated, and (c) heat-treated wrought. α-Cu is shown in red while martensitic β’ is coloured blue.
Jmmp 09 00147 g020
Figure 21. Inverse pole figures of ASB: (a) as-printed, (b) printed and heat-treated, and (c) heat-treated wrought alloy.
Jmmp 09 00147 g021
Figure 22. Pole figures were generated for the principal phases present in the ASB specimen. (a) As-built, (b) printed and heat-treated, and (c) heat-treated wrought pole figures for α-Cu.
Jmmp 09 00147 g022
Figure 23. Cumulative frequency plots of grain aspect ratios. Vertical line at an aspect ratio of 3 to mark columnar vs. equiaxed transition.
Jmmp 09 00147 g023
Figure 24. Band contrast images superimposed on the grain boundary maps reveal the general grain structure and CSL boundaries in the ASB specimen. (a) As-built, (b) printed and heat-treated, and (c) heat-treated wrought.
Jmmp 09 00147 g024
Figure 25. (a) The build plate of printed tensile samples, witness cuboids, and pins. (b) The build plate of the Charpy impact bars and magnetic permeability samples. All samples were printed under the same optimum parameters of 320 W laser power, 770 mm/s scan speed, and 0.088 mm hatch spacing.
Jmmp 09 00147 g025
Figure 26. Engineering stress vs. strain curves for C64200 in as-built, printed and heat-treated, and wrought conditions.
Jmmp 09 00147 g026
Figure 27. SEM images of the tensile fracture surfaces of ASB variants. (a) As-built, (b) printed and heat-treated, and (c) heat-treated wrought. The AM specimens were printed at 320 W, 770 mm/s, and a 0.088 mm hatch spacing.
Jmmp 09 00147 g027
Figure 28. Fracture surfaces of ASB impact specimens. (a) As-built, (b) printed and heat-treated, and (c) wrought samples. The AM specimens were printed at 320 W, 770 mm/s, and a 0.088 mm hatch spacing.
Jmmp 09 00147 g028
Table 1. Comparison of the measured and specified compositions for ASB. All values in weight %.
ElementC64200 (Specification)Wrought (Measured)LPBF Powder
(Measured)
Copper88.80–92.2091.1191.89
Aluminum6.30–7.606.786.29
Silicon1.50–2.201.791.52
Iron<0.300.090.09
Lead<0.05<0.005<0.01
Tin<0.200.030.02
Zinc<0.500.150.11
Magnesium--0.000.00
Nickel<0.250.040.05
Manganese<0.100.020.02
Impurities--0.250.23
Table 2. Comparison of the tensile properties measured for wrought and printed samples of C64200 against the specifications for conventional product forms.
Material FormE
(GPa)
Yield Strength (MPa)UTS
(MPa)
Elongation (%)Impact Energy
(J)
Rolled sheet [3]125>280>550>20>33
Castings [3]105>175>460>20No Spec.
ASTM B150 [25]-->205>485>15No Spec.
As-built106 ± 8595 ± 28797 ± 94.9 ± 1.030 ± 1
Printed and heat-treated 1112 ± 1329 ± 2567 ± 124.6 ± 0.363 ± 4
Heat-treated wrought 1109 ± 9292 ± 1583 ± 336.6 ± 3.7108 ± 3
1—Samples heat-treated at 620 °C for 2 h and water-quenched.
Disclaimer/Publisher’s Note: The statements, opinions and data contained in all publications are solely those of the individual author(s) and contributor(s) and not of MDPI and/or the editor(s). MDPI and/or the editor(s) disclaim responsibility for any injury to people or property resulting from any ideas, methods, instructions or products referred to in the content.

