1. Introduction
Additive Manufacturing (AM), particularly Wire Arc-Directed Energy Deposition (W-DED), has emerged as a transformative technology in the production of complex metal parts across various industries, including the aerospace and automotive industries. W-DED processes involve the continuous deposition of metal wire material, which is melted and fused onto a substrate through an energy source [
1]. Despite its advantages in terms of material utilization and capability to repair or fabricate large components, the technique faces substantial challenges associated with thermal management. Excessive heat accumulation during the process can lead to defects such as warping, residual stresses, poor surface quality, and porosity, thereby compromising the mechanical properties and dimensional accuracy of the final product.
Conventional W-DED processes rely on static dwell times—the pauses between the deposition of successive layers—to allow for sufficient cooling. However, this method often proves inadequate for managing the complex thermal dynamics in larger builds, where heat dissipation varies significantly across different sections of the workpiece. Static dwell times are inherently limited as they do not account for the real-time thermal state of the material, leading to non-uniform cooling rates and potential overheating [
2,
3].
Thermal accumulation can lead to geometric distortion and loss of dimensional accuracy in W-DED parts. As layers are deposited in a semi-molten state on a hot substrate, the substrate may undergo thermal expansion and warping, and the melt pool size can vary, causing the part to deviate from intended dimensions [
4]. According to Montevecchi et al., finite element simulations reveal that allocating sufficient interlayer cooling time effectively moderates heat accumulation and enhances dimensional accuracy [
5]. Experimental studies confirm that controlling interlayer temperature yields more consistent geometry: Halder et al. reported that increasing the interlayer dwell to 300 s (allowing the top layer to cool to a much lower temperature) reduced the peak temperature from 660 °C to 263 °C, which in turn stabilized the melt pool size and improved part accuracy [
6]. Conversely, without sufficient cooling, each layer’s residual heat can accumulate and cause the component to warp or dimensions to “grow” due to larger melt pools. These findings underline that a controlled interlayer temperature is critical for minimizing distortion and achieving dimensional fidelity.
Thermal conditions between layers also contribute to defect tendencies like residual stress-related cracking. The thermal gradient between layers influences residual stresses, which can cause cracks or deformations if not managed. Abusalma et al. showed that different interlayer dwell times alter the residual stress profile in W-DED parts, which means thermal management is key to mitigating the build-up of residual tensile stresses that could lead to cracking [
7]. Overall, controlling the interlayer temperature helps in moderating residual stresses, which can prevent component failure and improve part performance.
The thermal buildup can detrimentally affect surface quality—influencing surface finish, geometric accuracy, microstructure evolution, and defect formation [
8,
9]. Singh et al. observed that walls built with a very short interlayer delay (high thermal buildup) exhibited surface waviness with “humps and spatters”, while longer delays produced smoother, more uniform layers. In another study, Xiong et al. found that the surface waviness of W-DED-deposited 300M steel varied non-linearly with interlayer temperature—initially decreasing (improving) as interlayer temperature was reduced, then increasing again beyond an optimum range [
3]. This suggests an optimal intermediate temperature for best surface finish. Not all materials show a large roughness sensitivity, however; for instance, in W-DED of duplex stainless steel, changing interlayer temperature between 50 °C and 150 °C had no significant effect on the measured surface texture parameters [
10].
The thermal history governed by interlayer temperature profoundly affects the microstructure of deposited material. A higher interlayer temperature means slower cooling between passes, while a lower interlayer temperature (rapid cooling) yields different phase transformations. Several studies have reported that cooling rate differences alter grain structure and phase composition [
11,
12,
13,
14]. The finer-grained structure at lower interlayer temperatures resulted in higher hardness and strength in the as-deposited material. Similarly, Singh et al. found that increasing the interlayer dwell time (decreasing the temperature of the previously deposited layer) refines the grain size, which improved the wall’s micro-hardness and compressive strength [
9]. Zhai et al. [
15] investigated the effects of varying interpass temperatures (150 °C, 350 °C, and 600 °C) on metal-cored high-strength steel in WAAM, finding that 350 °C represented an optimal upper limit that balanced mechanical properties with deposition efficiency, while higher temperatures (600 °C) led to collapse of the deposited material. On the other hand, excessive cooling can promote certain phase imbalances; in W-DED of duplex stainless steel, very low interlayer temperatures increased the fraction of ferrite phase beyond desirable levels [
10]. Heat accumulation tends to homogenize and coarsen microstructures—Halder et al. observed that thermal buildup in a Ti–6Al–4V wall led to coarser prior-
grains and a drop in microhardness with increasing build height, an effect mitigated by extended interlayer cooling [
6]. Thus, by tuning interlayer temperature, one can influence microstructural outcomes such as grain size, phase distribution, and resultant mechanical properties (strength, hardness, toughness) of W-DED builds.
Thermal conditions also affect porosity formation in W-DED parts. On one hand, if the interlayer temperature is too low (the layer is too cold), inadequate remelting or wetting can occur, potentially trapping gas or lack-of-fusion flaws. On the other hand, if the part is too hot, excessive metal vaporization or fluid turbulence can introduce porosity [
6]. The literature shows varying trends depending on material systems. Derekar et al. (W-DED of Al alloy) reported significantly lower porosity when using a higher interlayer temperature, as compared to a cooler interpass, attributing ∼10% reduction in porosity to the improved layer bonding at elevated temperature [
16]. For duplex stainless steel, insufficient interlayer temperatures led to more internal porosity [
10], whereas moderate to high interlayer temperatures produced sounder weld beads. This is because when the previously deposited layer is still hot before the next layer is laid, it promotes better wetting and remelting at the interface. If the interlayer temperature is too low, the incoming molten metal may not adequately fuse with the underlying layer, leaving voids. Knezović et al. [
10] note that higher interlayer temperatures leave “less time for gas to form inclusions in the solidifying metal, leaving the walls with less porosity”. These results suggest there is an optimal interlayer temperature window to minimize porosity, avoiding both extreme rapid cooling and excessive heat.
Given the strong influence of thermal history on W-DED outcomes, researchers have explored various temperature feedback control strategies to regulate interlayer temperatures in real time. The goal of these controllers is to dynamically adjust the process (or interpass timing) to maintain optimal thermal conditions, thereby improving consistency and mitigating defects. The simplest strategy is to impose a fixed dwell time after each layer to allow cooling to a desired approximate temperature. Montevecchi et al. proposed a finite-element-based scheduling of interlayer dwell times tailored to the part, showing that such planning can reduce heat accumulation and improve accuracy [
5]. However, without feedback, there is a risk of under- or over-cooling if the assumed cooling rate differs from actual. Another approach is to actively remove heat between layers using cooling media (e.g., forced air jets, water mist, or thermoelectric coolers). This can dramatically shorten the time to reach a safe interlayer temperature. For instance, Scotti et al. demonstrated that using a fan or liquid cooling can mitigate heat accumulation in W-DED, enabling shorter interlayer delays [
17]. Tonelli et al. showed that forced air cooling between W-DED layers of 304L stainless steel had no significant detrimental effect on properties [
18]. In other words, active cooling needs to be modulated; an uncontrolled blast of air after each layer might eliminate heat but could also produce quenching effects (e.g., excessive hardness or residual stress). Thus, while active cooling improves throughput, it benefits from a feedback mechanism to decide when and how much cooling to apply.
True feedback control involves monitoring the actual interlayer temperature and making real-time decisions to maintain it within targets. Kozamernik et al. developed a closed-loop interlayer temperature control system for W-DED that is representative of this approach [
19]. A limitation, however, is that it implements a single-point temperature measurements notably with infrared pyrometers.It assumes that this reading is representative of the entire layer’s condition. In reality, however, temperature can vary significantly across a large deposited bead or wall. The area near the recent weld or the center of a thick section might remain hotter and longer than the edges or thinner sections. Instead of controlling interlayer cooldown, some studies focus on real-time control of the melt pool temperature during deposition [
20,
21,
22]. Fan et al. developed an infrared sensing system to monitor the area around the melt pool and adjusted parameters to control weld penetration in real-time based on the measured temperature profile [
20]. However, implementing such multi-sensor, high-speed control is complex. It requires reliable sensing of a high-temperature, emissive melt pool (IR sensors or cameras with robust image processing) and a controller capable of handling process dynamics. Moreover, most real-time melt pool controllers to date have been demonstrated on relatively simple builds or single-track experiments [
23]. Their effectiveness in large-scale, multi-layer W-DED parts (with evolving geometry and cooling conditions) is still an active research area. Additionally, these systems tend to control localized thermal behavior (melt pool) rather than the bulk interlayer temperature—they complement but do not replace the need for managing layer-to-layer heat accumulation.
In a summary shown in
Table 1, it can be seen that previous research in W-DED interlayer temperature control has predominantly focused on either fixed dwell time approaches or single-point temperature measurements, each presenting significant limitations for practical implementation.Recognizing the limitations, this study proposes a novel HIHC approach that integrates a dynamic thermal feedback control system into the W-DED process. By leveraging real-time data captured from a sideward thermal camera, the system enable full-field temperature measurement across the entire build surface that adjusts dwell times dynamically, responding to the thermal conditions observed on the part’s surface.This represents an advancement over single-point measurement systems, as it ensures uniform thermal conditions across the entire layer before proceeding with subsequent depositions. The second novel aspect of the system lies in its hybrid control architecture, which dynamically switches between fixed and adaptive cooling strategies based on real-time temperature feedback. This approach combines the reliability of predetermined cooling periods for lower temperature ranges with the flexibility of dynamic cooling for higher temperature conditions. The implementation of a buffer system for stability verification represents a contribution to the field, as it effectively filters out transient thermal fluctuations while ensuring genuine thermal stability before layer initiation.
The rest of this paper is structured as follows:
Section 2 outlines the methodology and theoretical framework.
Section 3 presents the results along with an in-depth discussion of the findings. Finally,
Section 4 concludes the paper and suggests directions for future research.
2. Methodology
2.1. System Architecture
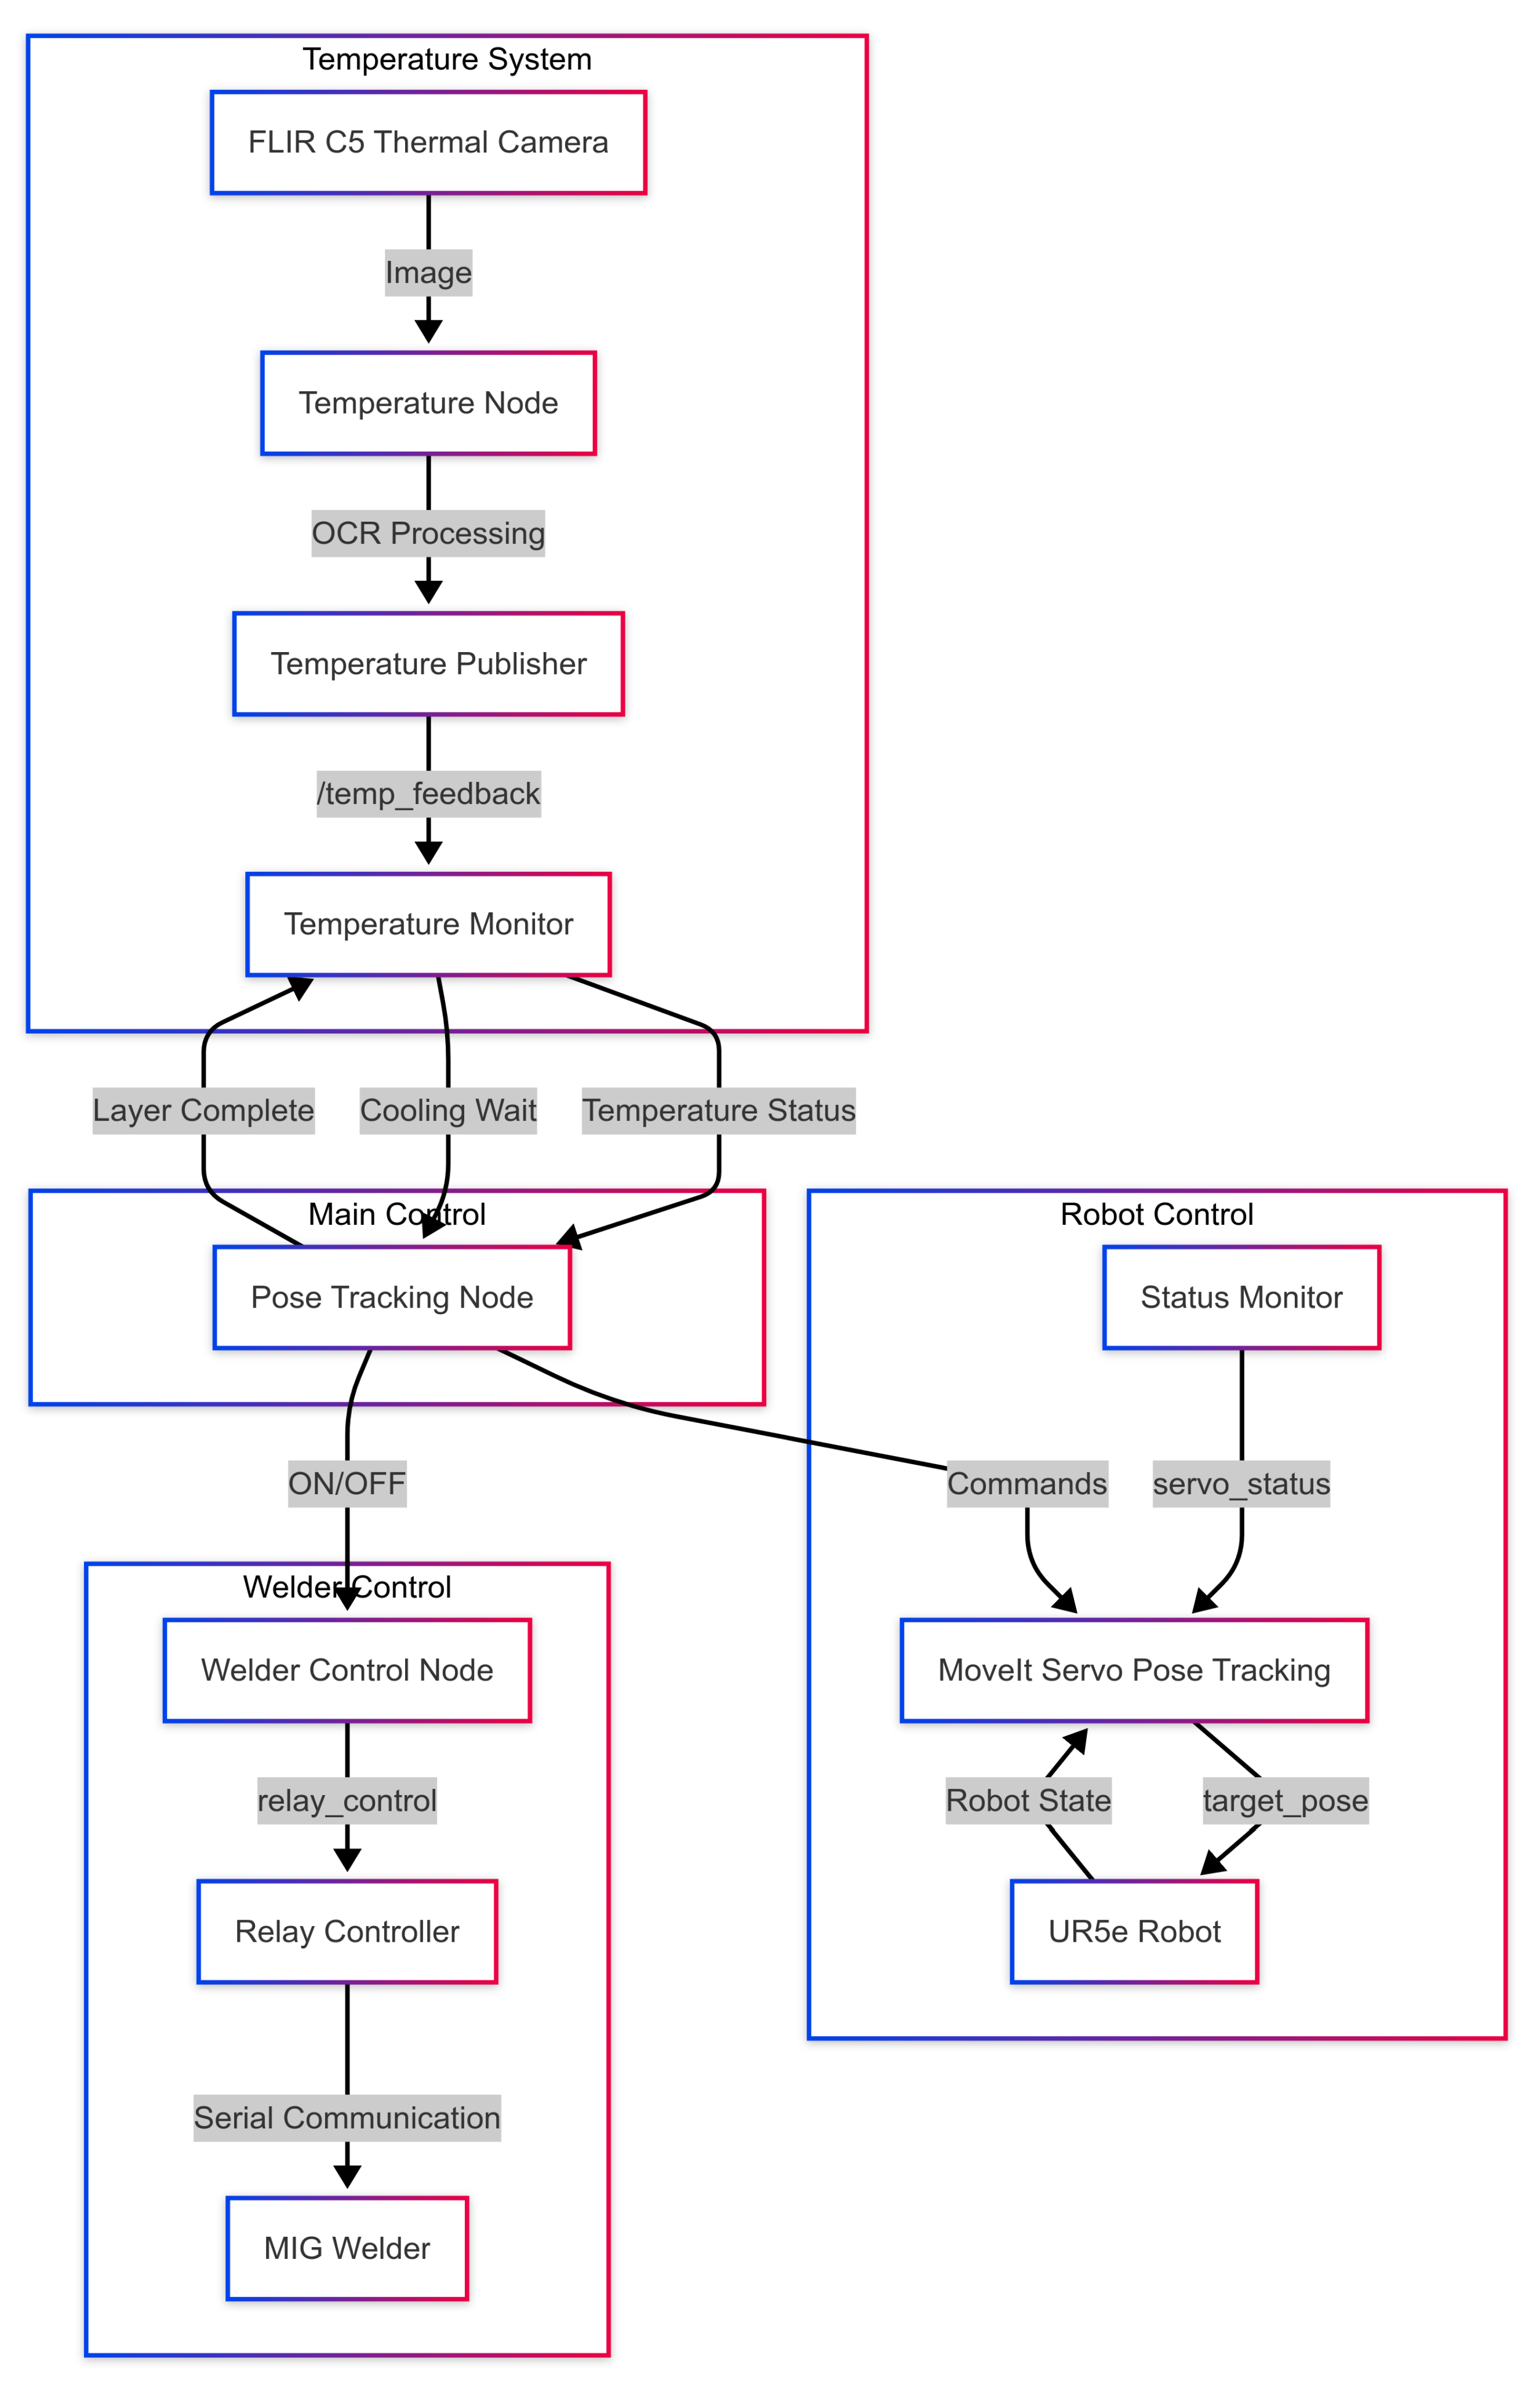
The experimental apparatus comprises integration of a UR5e robotic manipulator (Universal Robots, Odense, Denmark) with a Vulcan MIGMAX 215 MIG welding system (Harbor freight, Calabasas, CA, USA) for W-DED, as illustrated in
Figure 1. The system architecture encompasses three primary subsystems: a temperature monitoring system utilizing a FLIR C5 thermal camera (FLIR Systems, Wilsonville, OR, USA) with Optical Character Recognition(OCR)-based temperature extraction, a welder control system managing the MIG power supply through relay-based serial communication, and a robot control system implementing MoveIt Servo (version:2.5.4-1) [
24] for precise motion control. These subsystems are orchestrated through a central pose tracking node that coordinates layer completion, thermal management, and deposition processes. Robot Operating System 2 (ROS2) (version: Humble Hawksbill) [
25]-based implementation facilitates inter-node communication through well-defined topics, ensuring robust data flow between system components.
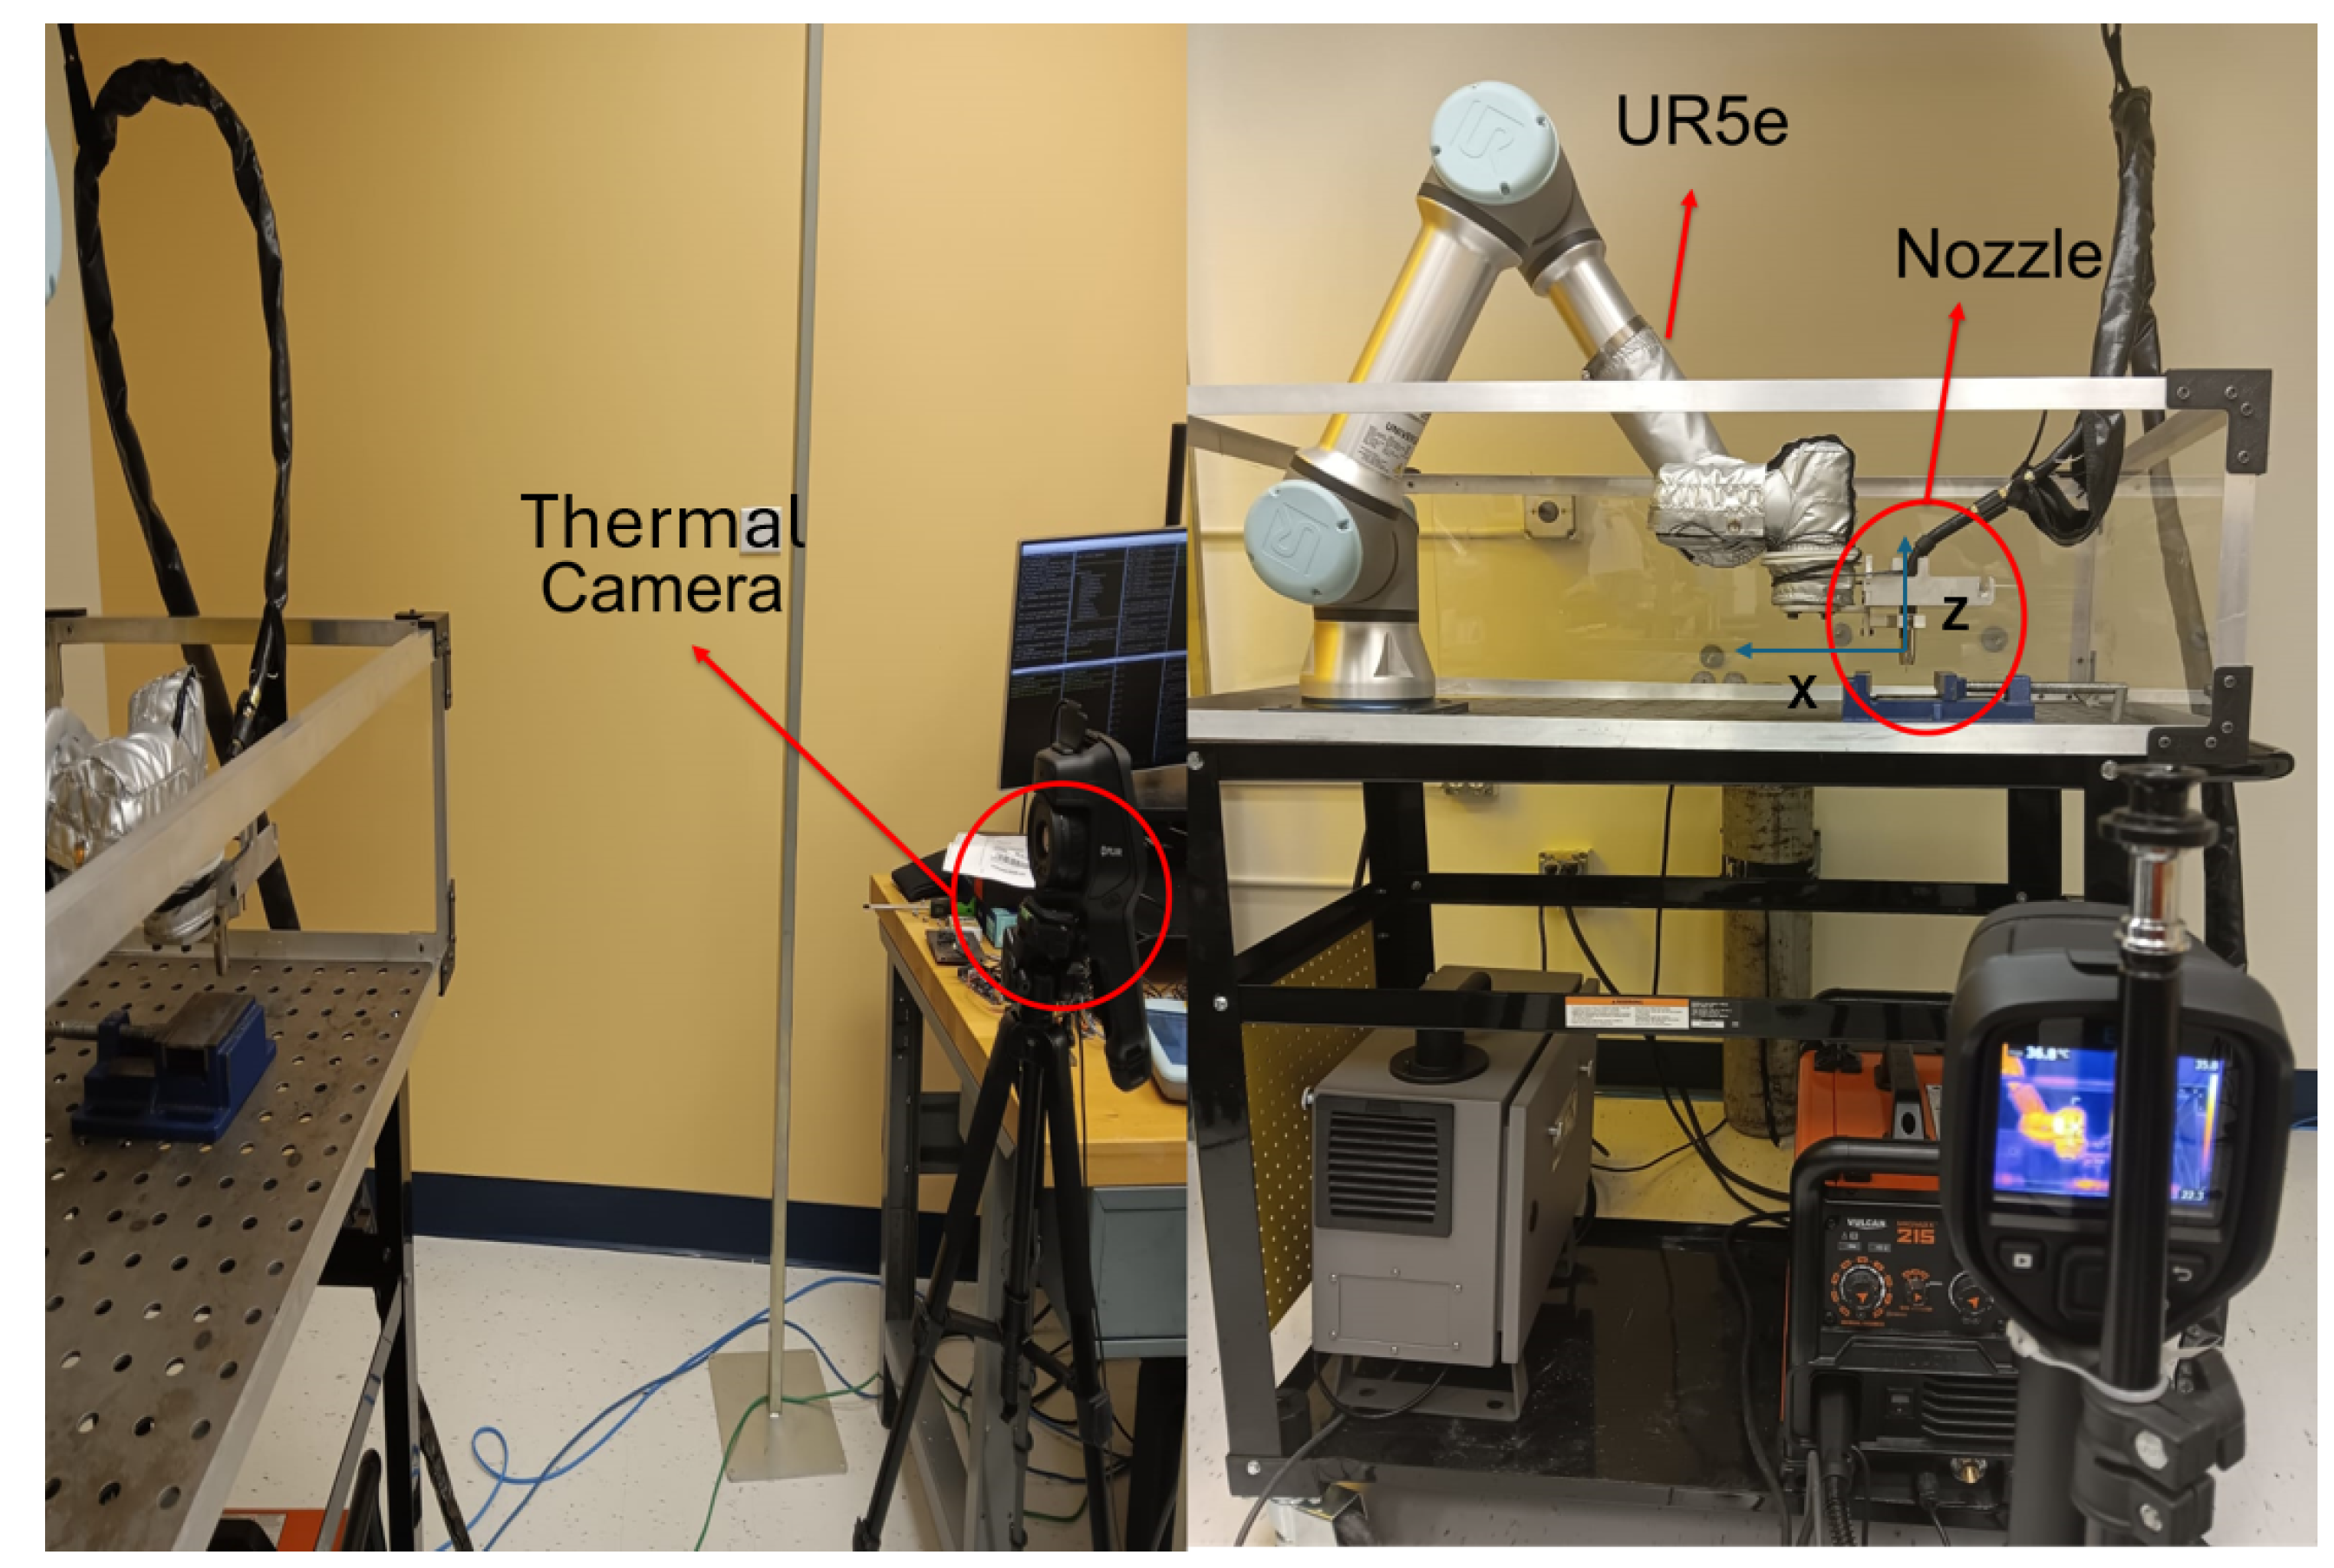
The thermal camera is positioned with a 1 m distance in the y-direction from the nozzle reference frame. Thin wall structures were selected as the primary test geometry for this study due to their prevalence in W-DED applications and their ability to highlight thermal management challenges. The limited heat dissipation pathways in thin walls create pronounced thermal gradients that make them ideal candidates for evaluating the effectiveness of the proposed HIHC. For each thin wall specimen, the target dimensions was 60 mm in length, 3 mm in width, and a target height of 30 mm, requiring 8 deposited layers at 3.75 mm layer height. This configuration represents a common feature in additive manufacturing while providing a geometry that enables clear thermal imaging and precise measurement of dimensional accuracy. Although the thermal camera cannot measure temperatures above roughly 770 °F (410 °C), this limitation does not affect the current setup. By the time each weld bead has solidified and cooled to the interlayer temperature regime that the controller must monitor–namely, at or below 392 °F (200 °C)—the wall’s surface is already within the camera’s measurable range. Thus, even though the peak welding temperatures exceed 770 °F during deposition, the critical data for the HIHC strategy fall squarely within the device’s capabilities once active welding ceases.
The full experimental setup is shown in
Figure 2, which incorporates the robotic system, thermal camera, and Vulcan Migmax 215 welding system.
2.2. Motion Control System
Motion control is achieved through the implementation of MoveIt Servo, a trajectory planning framework that enables real-time path adjustment and position control. The system operates through a pose tracking mechanism that maintains continuous spatial awareness of the end effector, essential for precise material deposition. The motion parameters are selected for a deposition velocity of 3.0 mm/s for a 60 mm deposition, with path updates processed at 10 Hz to ensure smooth trajectory execution. The layer height is maintained at 3.75 mm, with position control accuracy maintained within ±0.1 mm through the servo feedback loop. A low-carbon steel substrate with dimensions of
mm was utilized as the base material for experimentation. The W-DED process employed an ER-70S solid wire with a diameter (Harbor freight, Calabasas, CA, USA) of 0.889 mm. The chemical composition of the wire is presented in
Table 2.
Gas metal arc welding (GMAW) methodology was implemented for the deposition process. To maintain the integrity of the printing zone during operation, a shielding gas mixture comprising 20% CO
2 and 80% argon was utilized. Preliminary trials established that a slightly higher arc voltage coupled with a lower wire feed speed produced stable wetting and minimal spatter for chosen material and Vulcan Migmax 215 welder. Based on these trials, a voltage range of 120 V at a wire feed speed of 7.0 mm/s was chosen (
Table 3). Although the voltage is higher than typical ranges for ER70S-6, the synergy between voltage and wire feed speed ensured consistent bead formation. The process parameters shown in
Table 3.
2.3. Hybrid Interlayer Hysteresis Controller
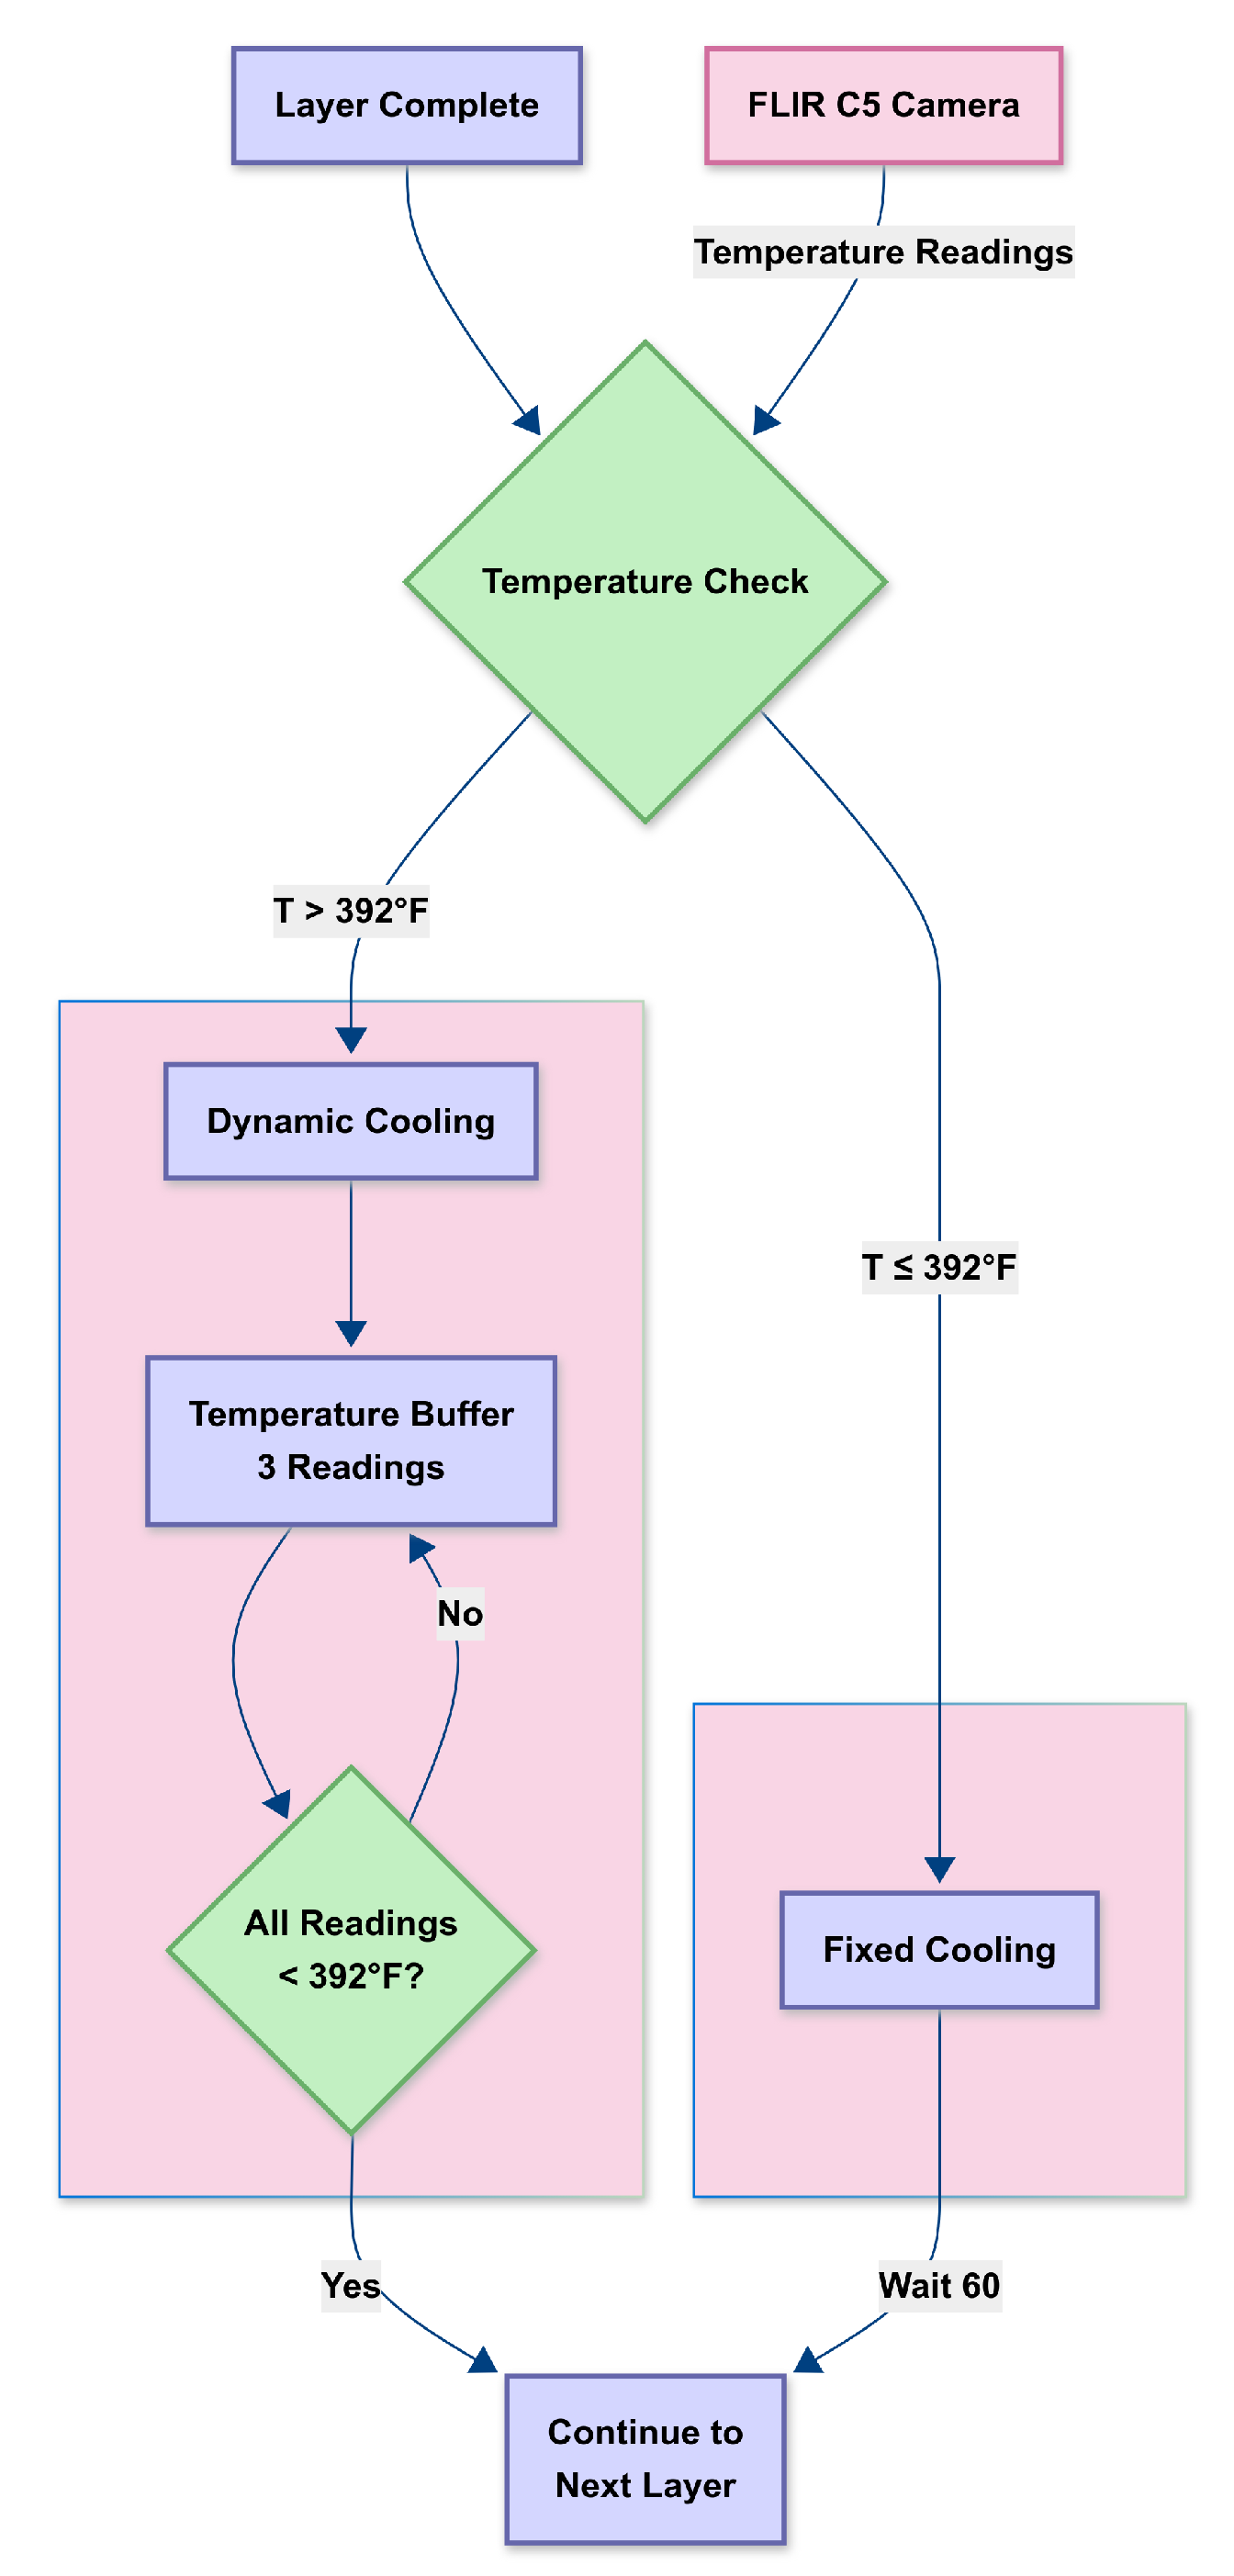
The thermal management of the W-DED process is accomplished through a novel HIHC controller. As depicted in
Figure 3, this sophisticated control architecture addresses the inherent thermal complexities of multi-layer deposition processes by implementing a dual-mode cooling strategy between successive layers. Upon layer completion, the system initiates a thermal assessment phase using data capture (20 Hz) from the FLIR C5 thermal camera. This hybrid approach combines real-time thermal monitoring with layer-wise adaptive control, enabling comprehensive thermal mapping between deposition phases without introducing potentially destabilizing continuous adjustments during active deposition.
The foundation of the HIHC system lies in its real-time temperature acquisition framework. The camera’s thermal data undergo frame-by-frame optical character recognition processing to extract precise temperature measurements. These measurements are then processed through a rolling buffer system that maintains three consecutive temperature readings, enabling robust thermal stability assessment while effectively filtering out transient fluctuations.
The controller’s decision-making architecture employs a bifurcated cooling strategy based on a temperature threshold of 392 °F (200 °C). Maintaining an interlayer temperature around 200 °C has been shown to balance deposition efficiency and material integrity effectively. For instance, a study on high-strength low-alloy steel fabricated using submerged-arc additive manufacturing demonstrated that an interlayer temperature of 200 °C resulted in a desirable microstructure predominantly composed of polygonal ferrite. This microstructure was associated with adequate strength and toughness, indicating that this temperature is effective in achieving favorable mechanical properties [
11]. Several other studies have demonstrated that lowering the interlayer temperature leads to improved strength in W-DED builds. For example, Wu et al. observed that dropping the interpass from 300 °C down to 200 °C yielded a noticeable increase in tensile strength of the deposited material [
26]. In one recent study on high-strength low-alloy steel WAAM, keeping the interpass at 200 °C (with additional cooling) produced tensile strengths of ∼860–900 MPa and yields ∼700–780 MPa, whereas higher interpass conditions without cooling led to much lower yield strength (520–590 MPa) despite similar ultimate tensile strength [
27]. The high-interpass samples in that study contained untempered martensite and retained austenite, which raised UTS but lowered yield, whereas the ∼200 °C interpass samples achieved a more balanced, tempered microstructure [
27]. This body of work underscores that the 200 °C threshold is not only widely used but also consistently beneficial in preserving mechanical properties for steel in wire-based additive processes. The experimental setup employs a thermal camera directed at the top layer of the thin-wall deposit. The camera’s software automatically captures the maximum temperature value within the region of interest, typically on or near the newly deposited bead. By design, this ensures that the measured temperature reflects the hottest point of the deposited layer and thereby the most critical thermal condition for subsequent deposition. Because thin-walled structures cool rapidly—especially near their edges—this peak-temperature tracking is essential for accurate interlayer control. If the measured temperature is detected to be below this threshold initially, the system automatically implements a predetermined cooling period of 60 s before allowing the next deposition. This fixed cooling time, which has been commonly used in previous studies [
28,
29], serves as a safety measure to prevent immediate redeposition and potential over-melting in the W-DED process. Conversely, when temperatures exceed the threshold, the controller transitions to a dynamic cooling mode that continuously monitors thermal conditions until stability criteria are met. Although the thermal camera identifies the instantaneous maximum temperature on the surface, the exact location of this peak can shift during cooling or after multiple layers are deposited. In early layers, heat conduction into the substrate can lead to a fairly uniform cool-down, whereas in later layers, the overall part temperature may rise due to heat accumulation from previous passes. However, in practice, the topmost region (where the next deposition will occur) typically remains the hottest point shortly after welding. As cooling proceeds, temperature gradients within the bead or across its length can cause the thermal hotspot to move. Despite these local variations, the decision algorithm consistently checks the upper surface’s highest temperature, ensuring the interlayer threshold has been reached at that critical interface between the newly solidified layer and the environment before depositing the next layer.
Critical to the system’s effectiveness is its hysteresis-based stability verification mechanism. The controller requires three consecutive temperature readings below the threshold before proceeding with the next deposition layer. This approach prevents premature layer initiation while ensuring adequate thermal conditions for optimal process control.
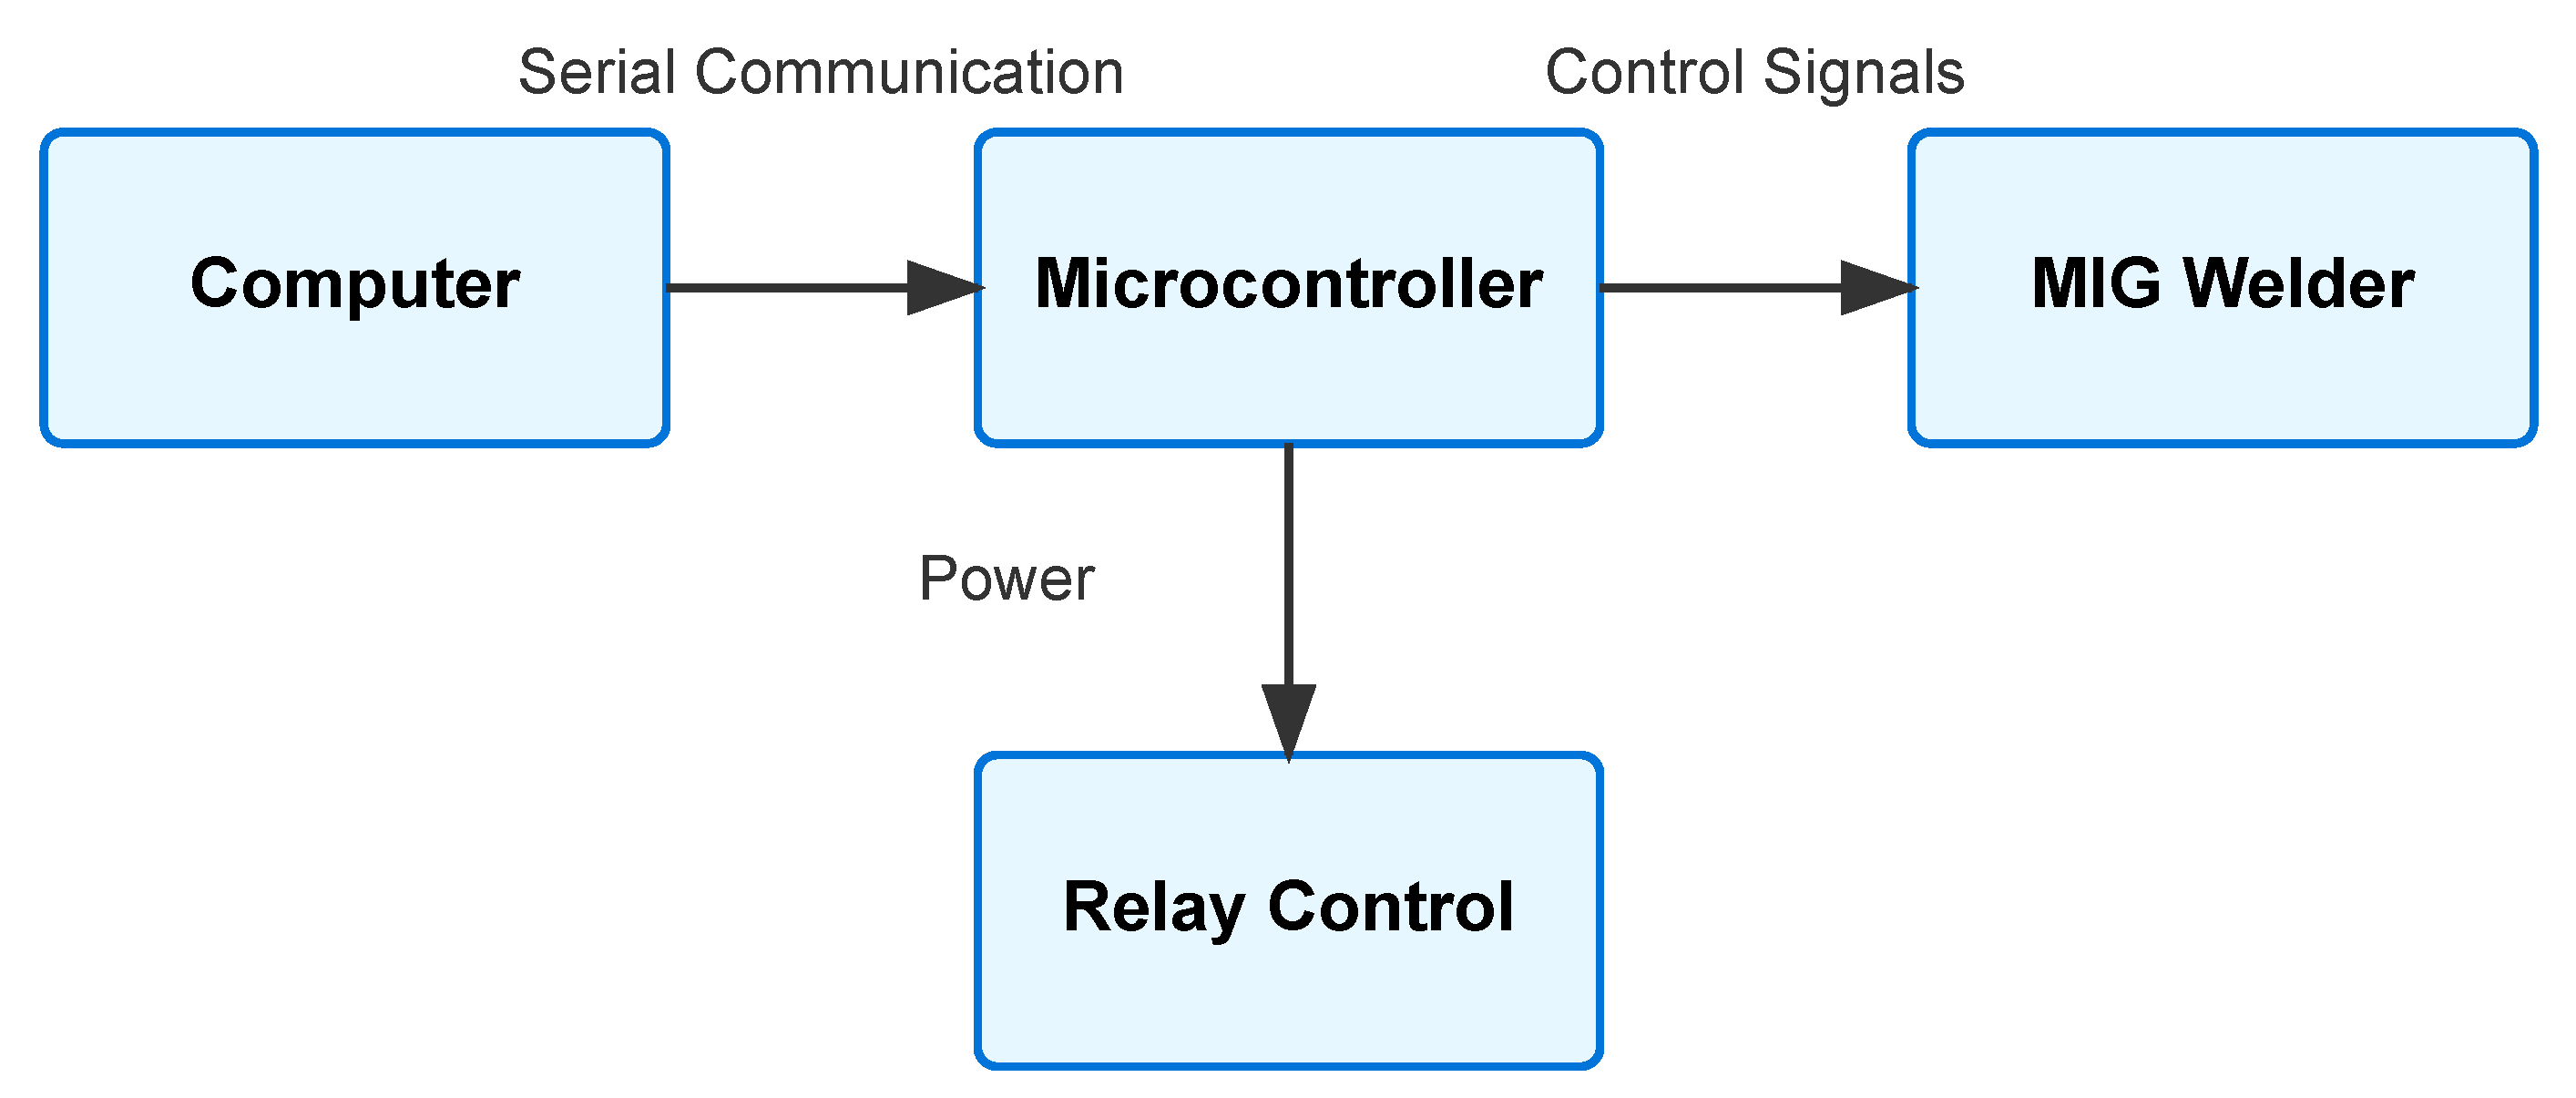
The welding process control is achieved through a dedicated relay control system that interfaces with the MIG power supply through serial communication. This interface enables precise control over the welding parameters while maintaining synchronization with the motion control system. The architecture is shown is
Figure 4.
2.4. Data Acquisition and Processing
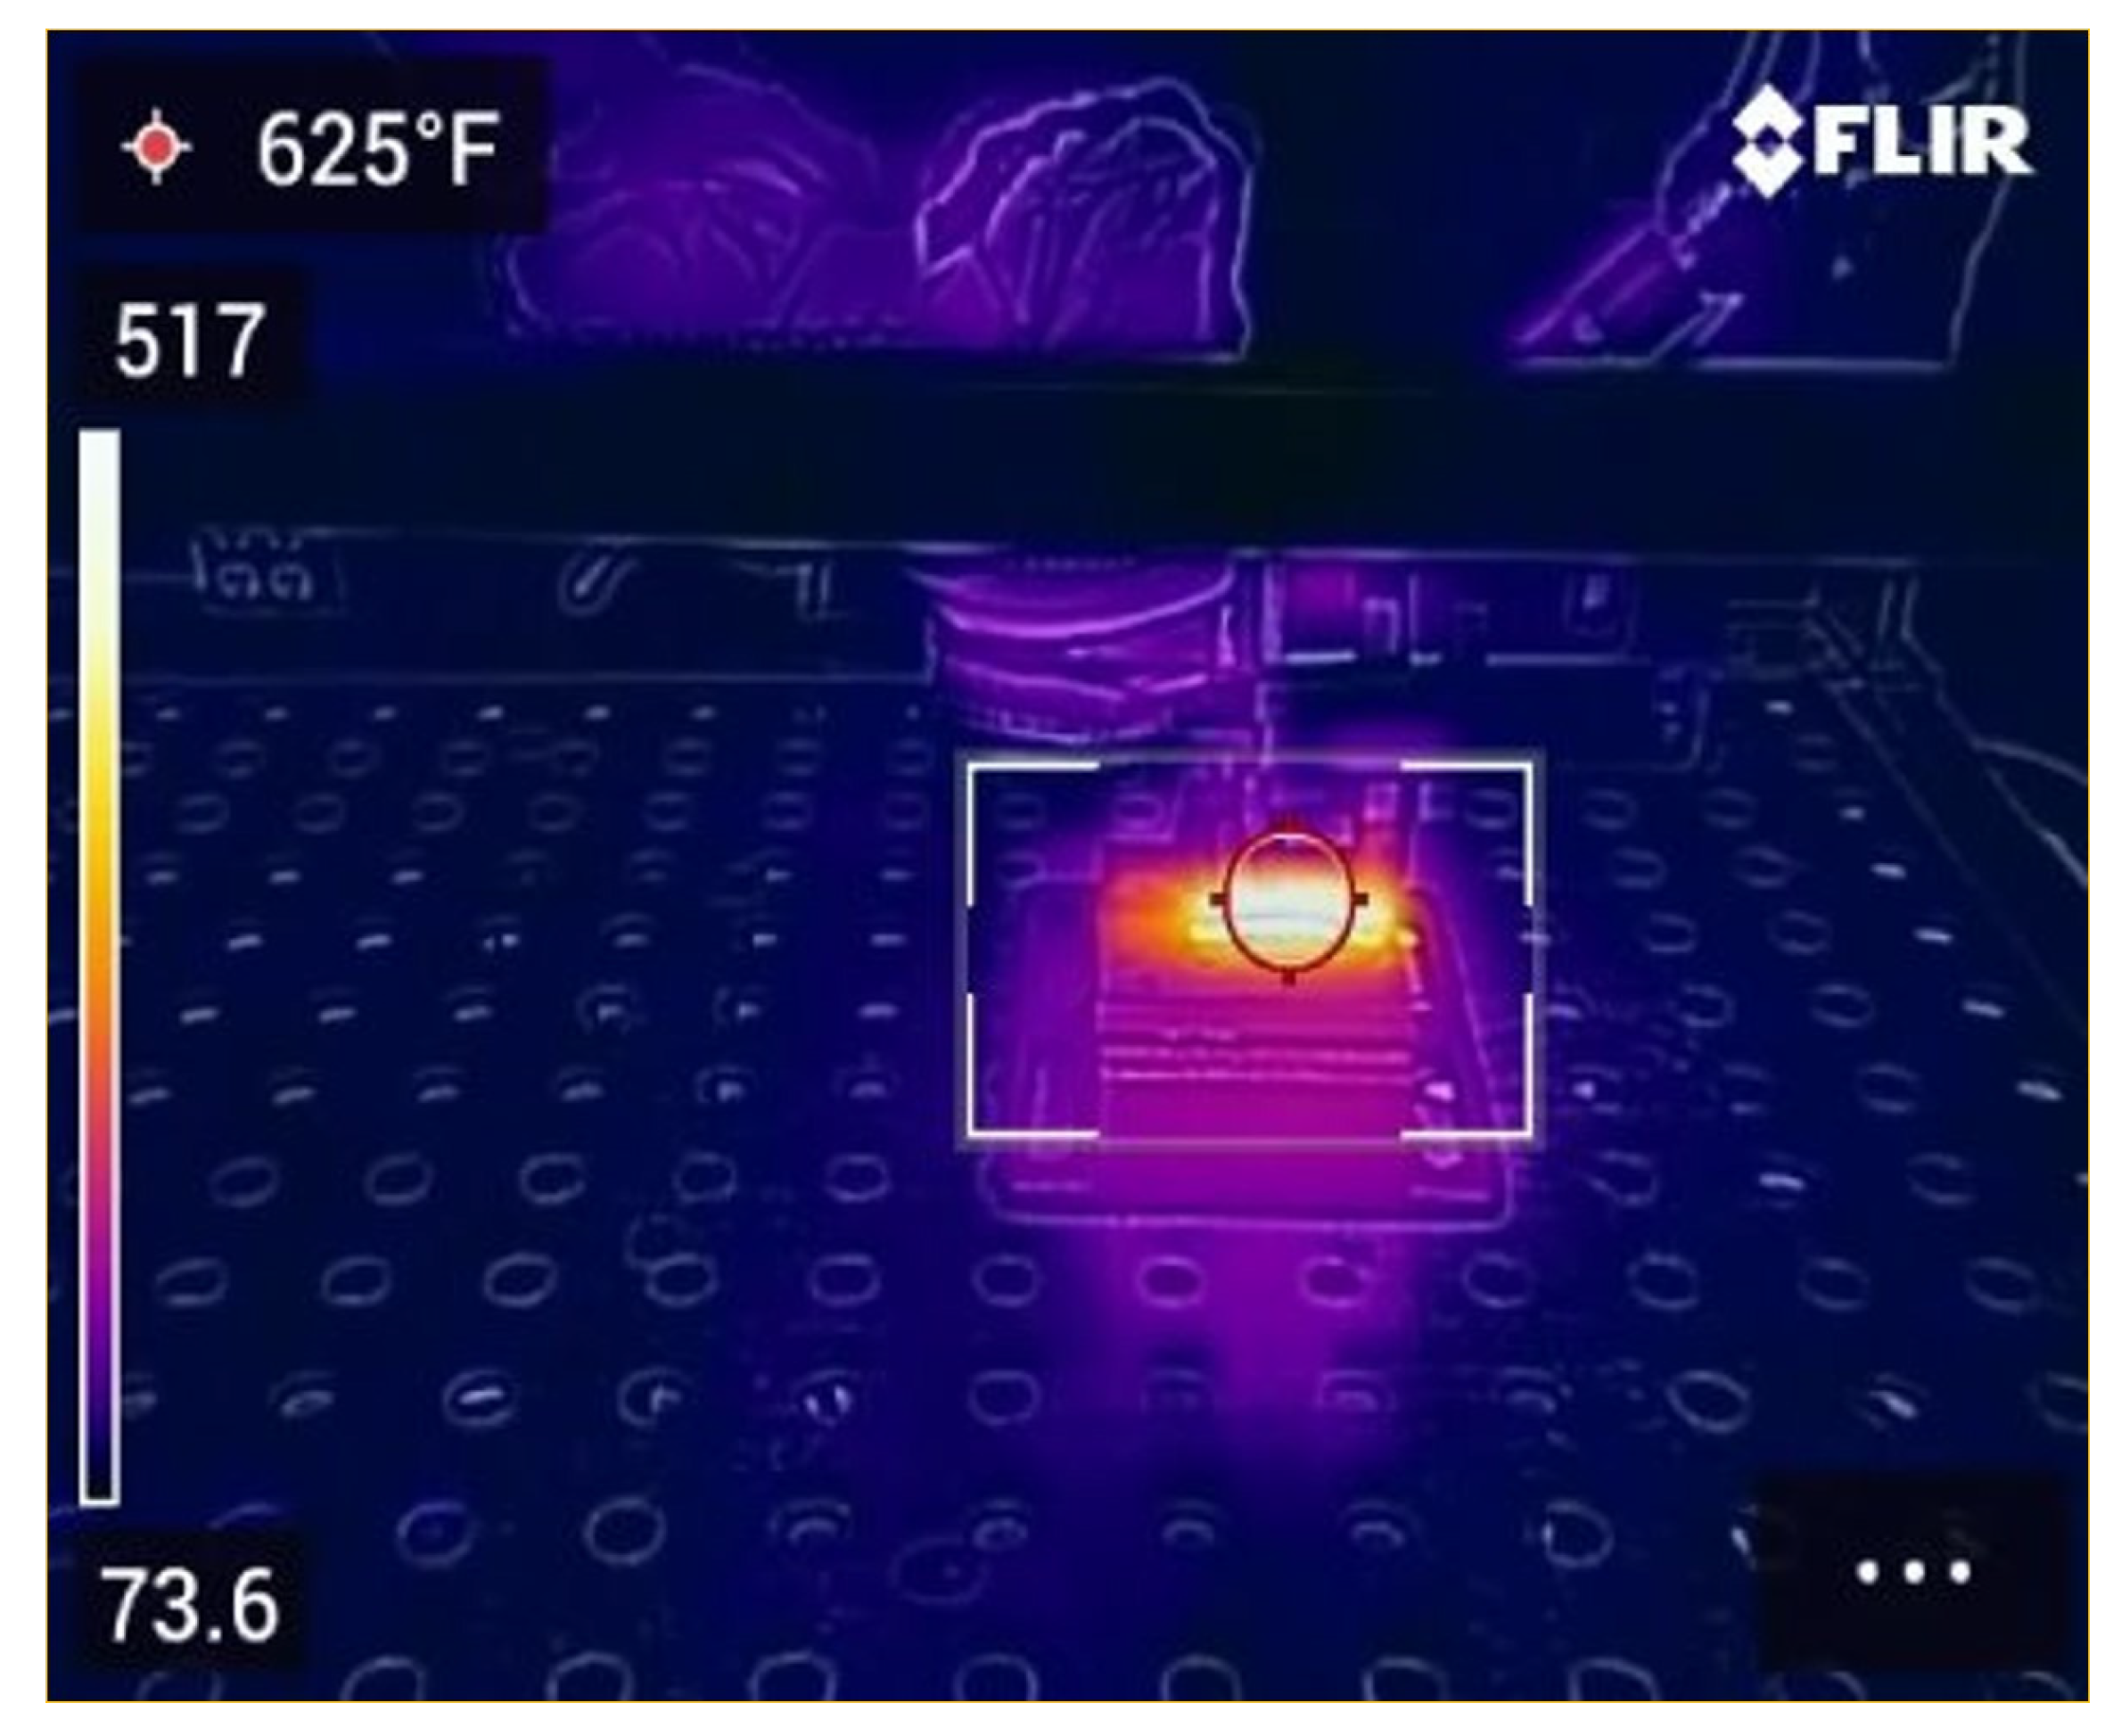
The thermal data processing system employs an OCR pipeline specifically engineered for thermal camera outputs. The system analyzes each frame by first identifying the interlayer region of the build, which serves as the primary region of interest. Within this region, the pipeline tracks temperature variations across the entire interlayer surface, with particular emphasis on detecting and measuring peak temperature values shown in
Figure 5.
This approach ensures comprehensive thermal monitoring by continuously scanning the full interlayer area while automatically identifying and recording the maximum temperature points, providing critical data for the control system’s decision-making process. The process data, including temperature measurements, cooling times, and system states, is logged with millisecond precision for subsequent analysis and process optimization.
Real-time process monitoring is achieved through a multi-modal approach that combines temperature feedback, position tracking, and system state monitoring. The status monitoring system provides continuous updates on servo controller state, enabling rapid detection and response to any deviations from nominal operating conditions. The system maintains a comprehensive log of temperature wait times and cooling periods, facilitating post-process analysis and system optimization.
2.5. Surface Roughness Analysis
The dynamic dwell time part and the fixed dwell time part were each digitized using a FreeScan UE Pro Metrology Laser Handheld 3D Scanner (SHINING 3D, Hangzhou, China) [
30]. This scanner specifications are listed on
Table 4.
Following data acquisition, the raw point clouds were processed (e.g., noise filtering, outlier removal) to generate polygonal meshes of each part. These meshes served as the digital representations for subsequent surface roughness analyses.
The surface roughness analysis was conducted through a systematic approach encompassing geometry preparation, region of interest identification, and precise roughness measurements. The study evaluated three distinct mesh types: an ideal mesh serving as a reference geometry, a mesh produced using closed-loop feedback control, and a mesh generated without feedback control (open-loop).
All meshes were processed using the trimesh library in Python (version: 3.10). To ensure consistent analysis, the meshes underwent rigid transformation and alignment to maintain uniform orientation and coordinate frames across all samples. This alignment step was crucial for enabling accurate surface-to-surface comparisons.
Two distinct regions were analyzed to provide comprehensive surface quality assessment: the entire front face and the top surface region. This dual-region approach allowed for both overall surface quality evaluation and focused analysis of the critical top portion where layer effects are most prominent.
For the front face analysis, automated bounding-box criterion was employed to eliminate manual selection bias. This process involved two key steps:
The bounding box coordinates were computed for each mesh.
A threshold value (
) was calculated using the formula:
The fraction value can be different based on the size and shape of the part (see
Table 4).
For the top surface analysis, an additional filtering step was implemented to isolate the uppermost region of the part. This involved the following:
This selective approach for the top surface ensures the most recently deposited layer is captured, where the effects of process control are most evident.
Surface roughness was quantified using an in silico technique comprising three main steps:
Dense point sampling: Points were densely sampled on each submesh surface to capture local geometry variations.
Best-fit plane calculation: A best-fit plane was calculated, yielding a point on the plane () and its normal vector (n). For the top surface analysis, the plane fitting was constrained to maintain alignment with the build direction, ensuring that the roughness measurements reflected layer-to-layer variations.
RMS Roughness Calculation: The root mean square (RMS) roughness was computed using the following formula:
where
represents the absolute distance from each sampled point to the best-fit plane, calculated as follows:
This calculation was performed independently for both the front face and top surface regions, allowing for comparison of surface quality metrics across different areas of the part.
3. Results and Discussions
The thermal camera video feed, as shown in
Figure 5, provided real-time temperature monitoring during the W-DED process. This implementation enabled continuous observation of interlayer temperature as the foundation for the dynamic dwell time control system.
3.1. Temperature Control Performance Analysis
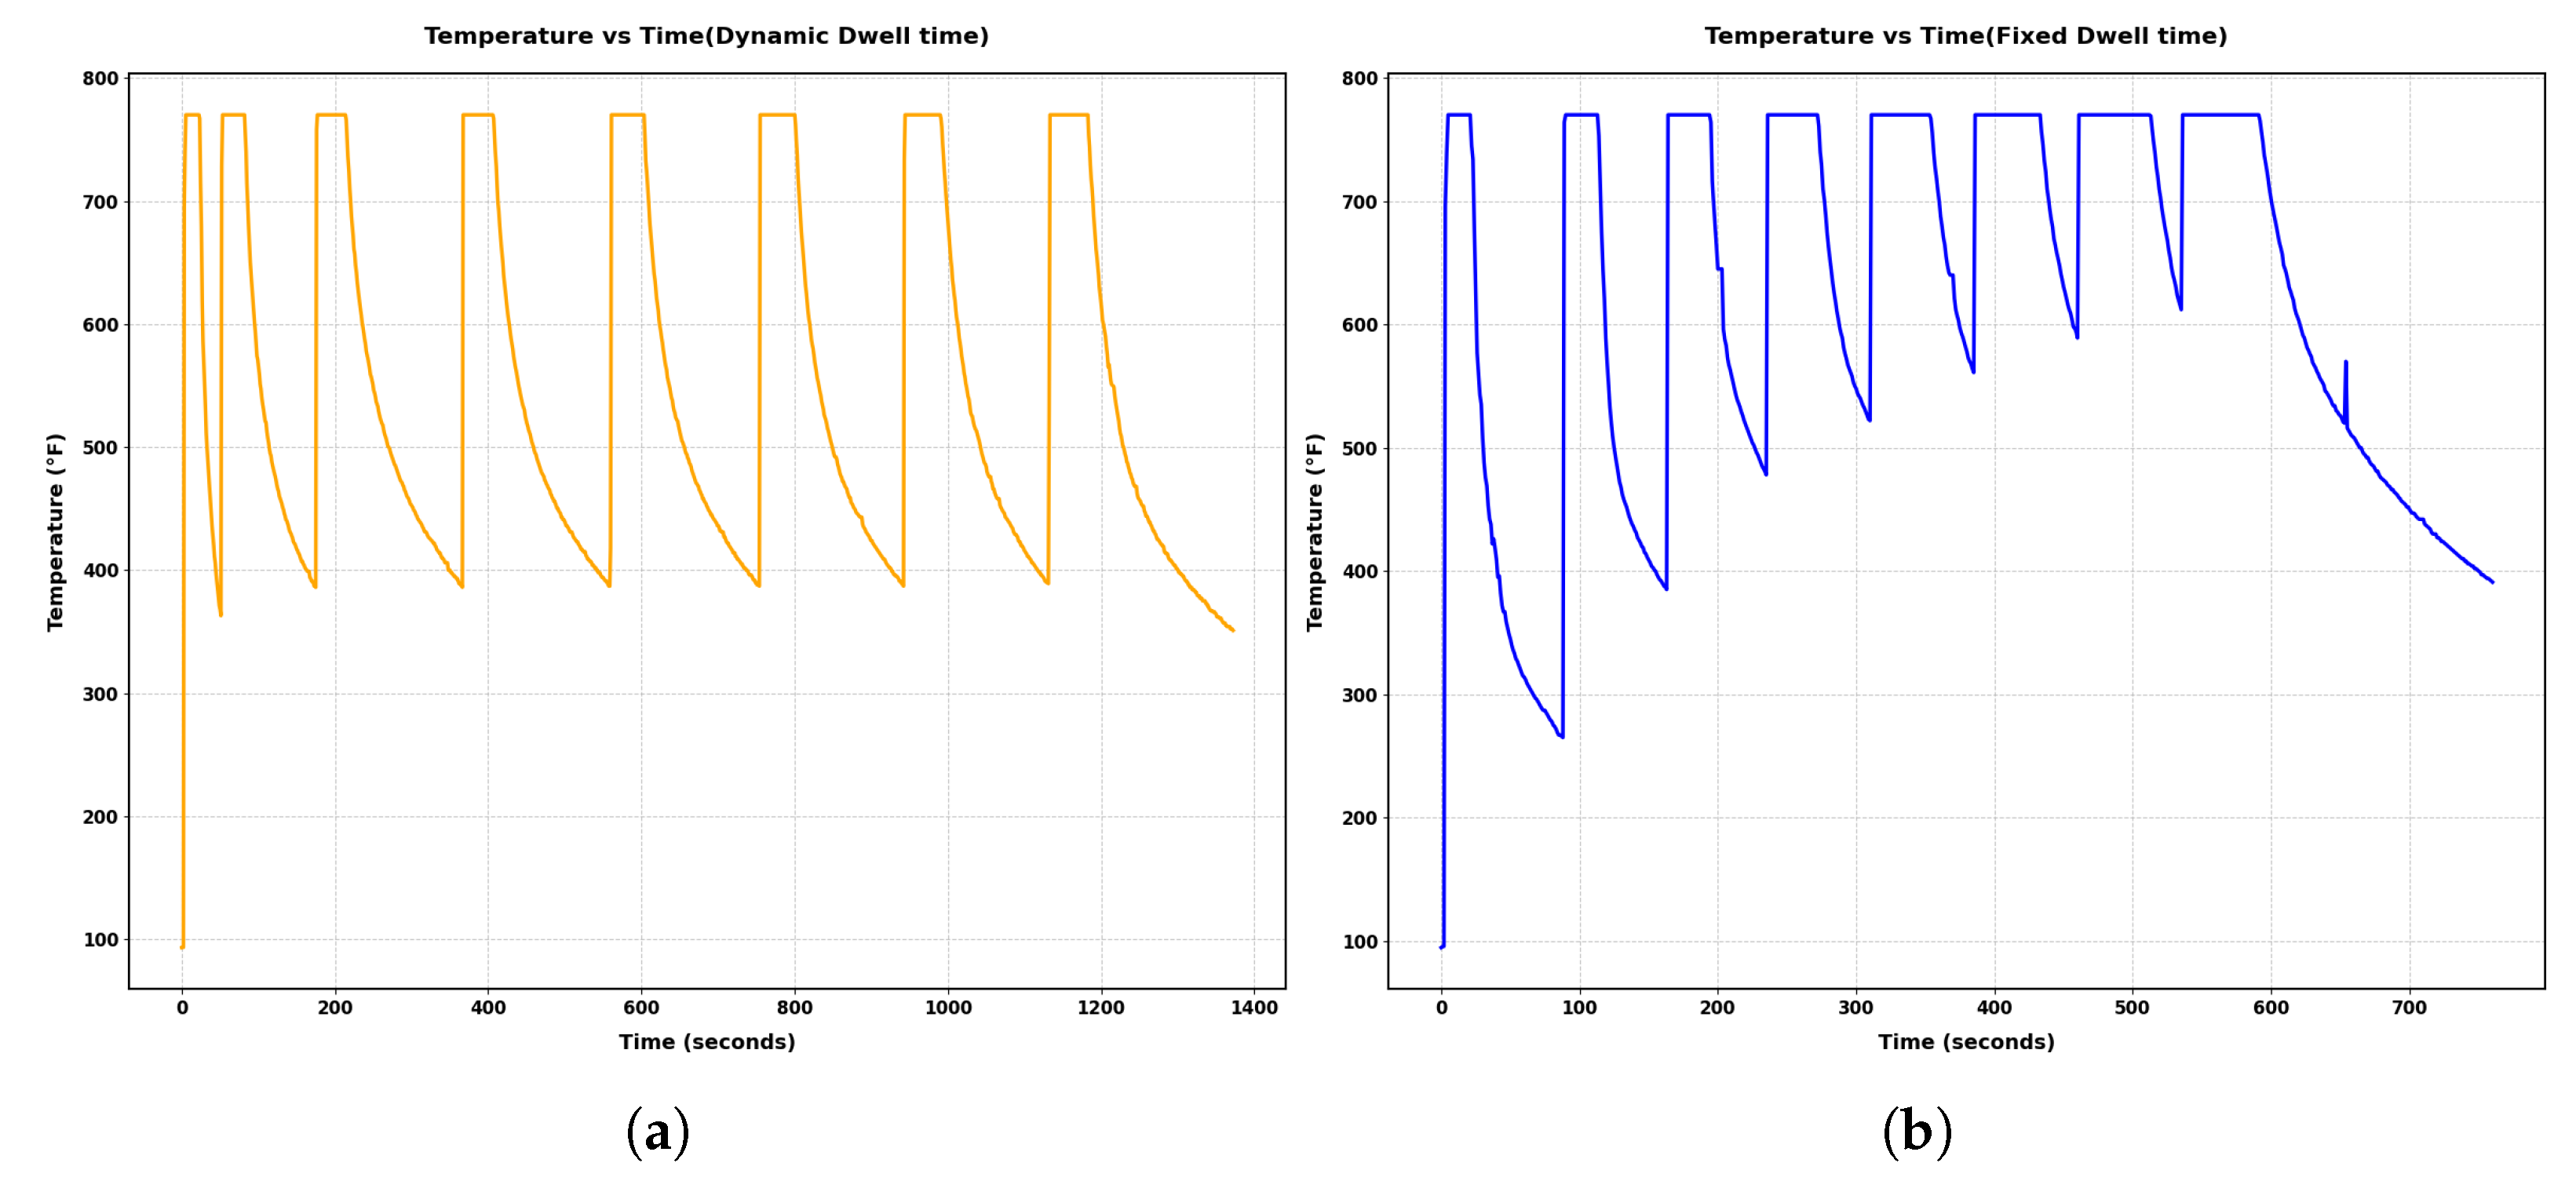
The temperature profiles obtained from the W-DED process reveal distinct thermal behaviors between dynamic and fixed dwell time control strategies.
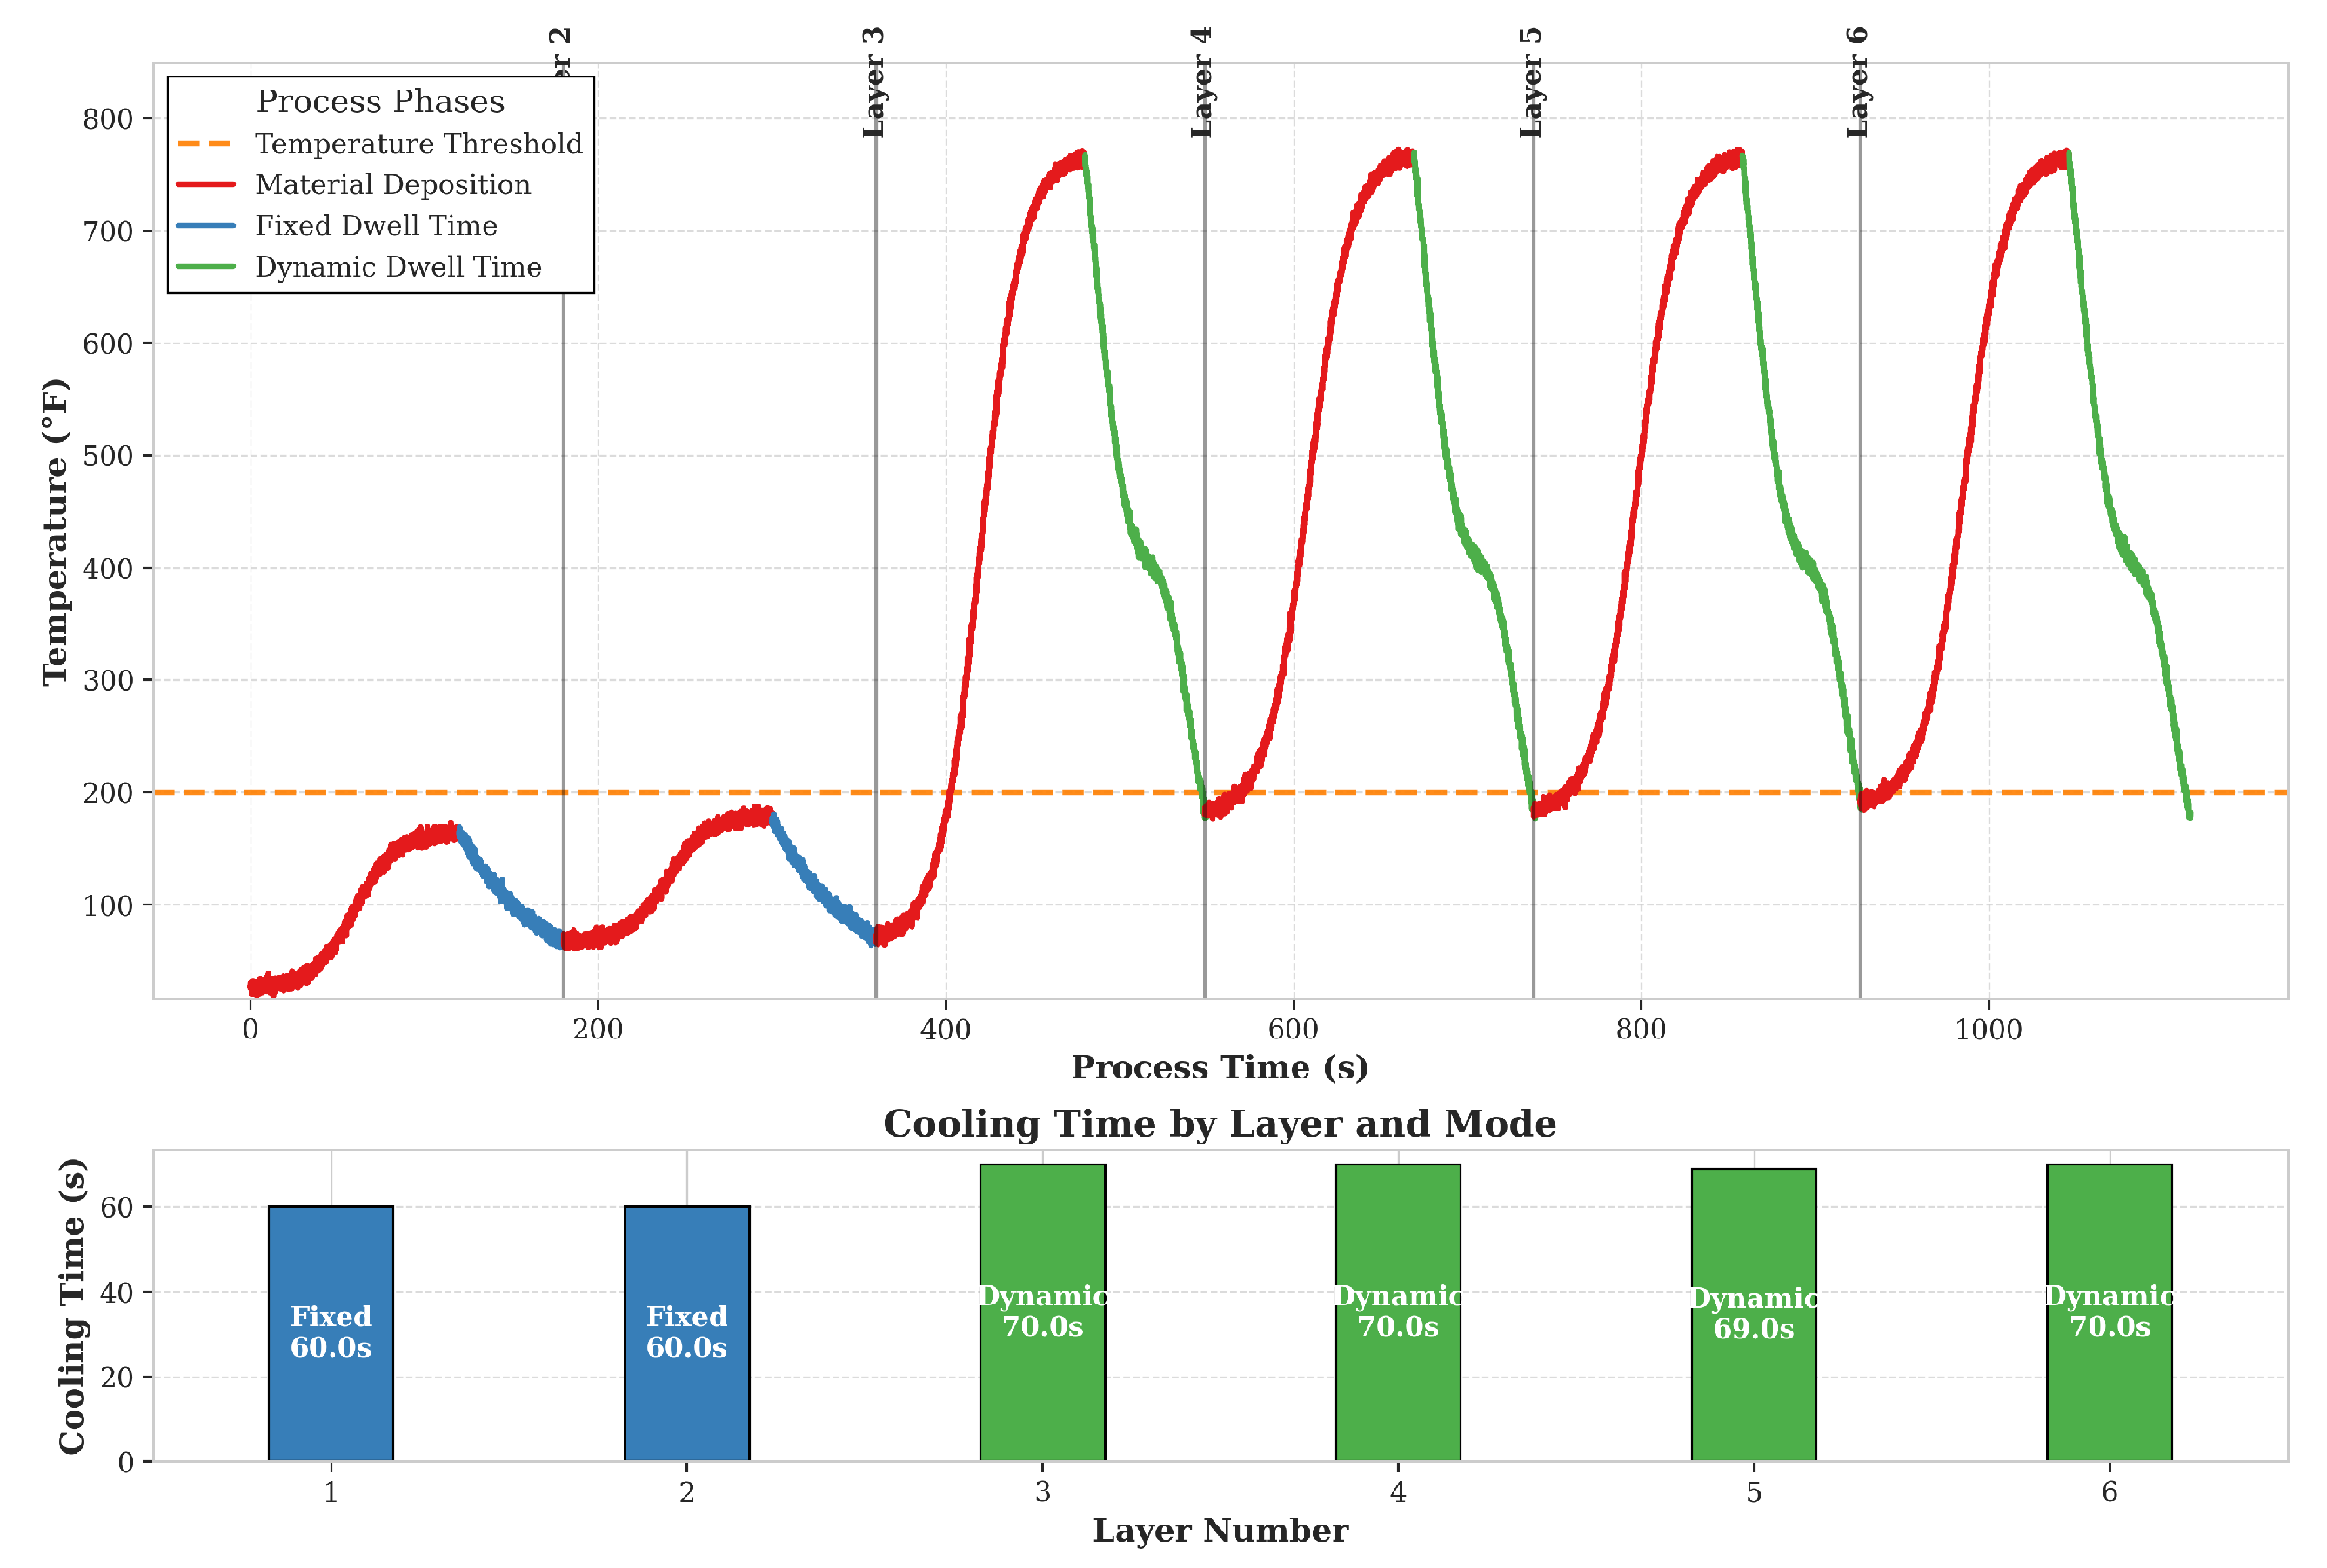
Figure 6 presents a comprehensive comparison of these thermal responses, highlighting several critical phenomena that significantly impact the manufacturing process.The dynamic dwell time profile reveals sophisticated control behavior through its precise management of the thermal cycle.
When examining the temperature evolution, it can be observed that the system demonstrates excellent setpoint tracking at the critical transition points between cycles. The temperature consistently returns to the 392 °F setpoint before initiating the next deposition cycle, with minimal undershoot or overshoot.In contrast, fixed dwell time approach shows irregular cooling patterns, rising minimum temperatures between cycles and inconsistent peak temperature durations. These issues are effectively eliminated in the feedback controller system.
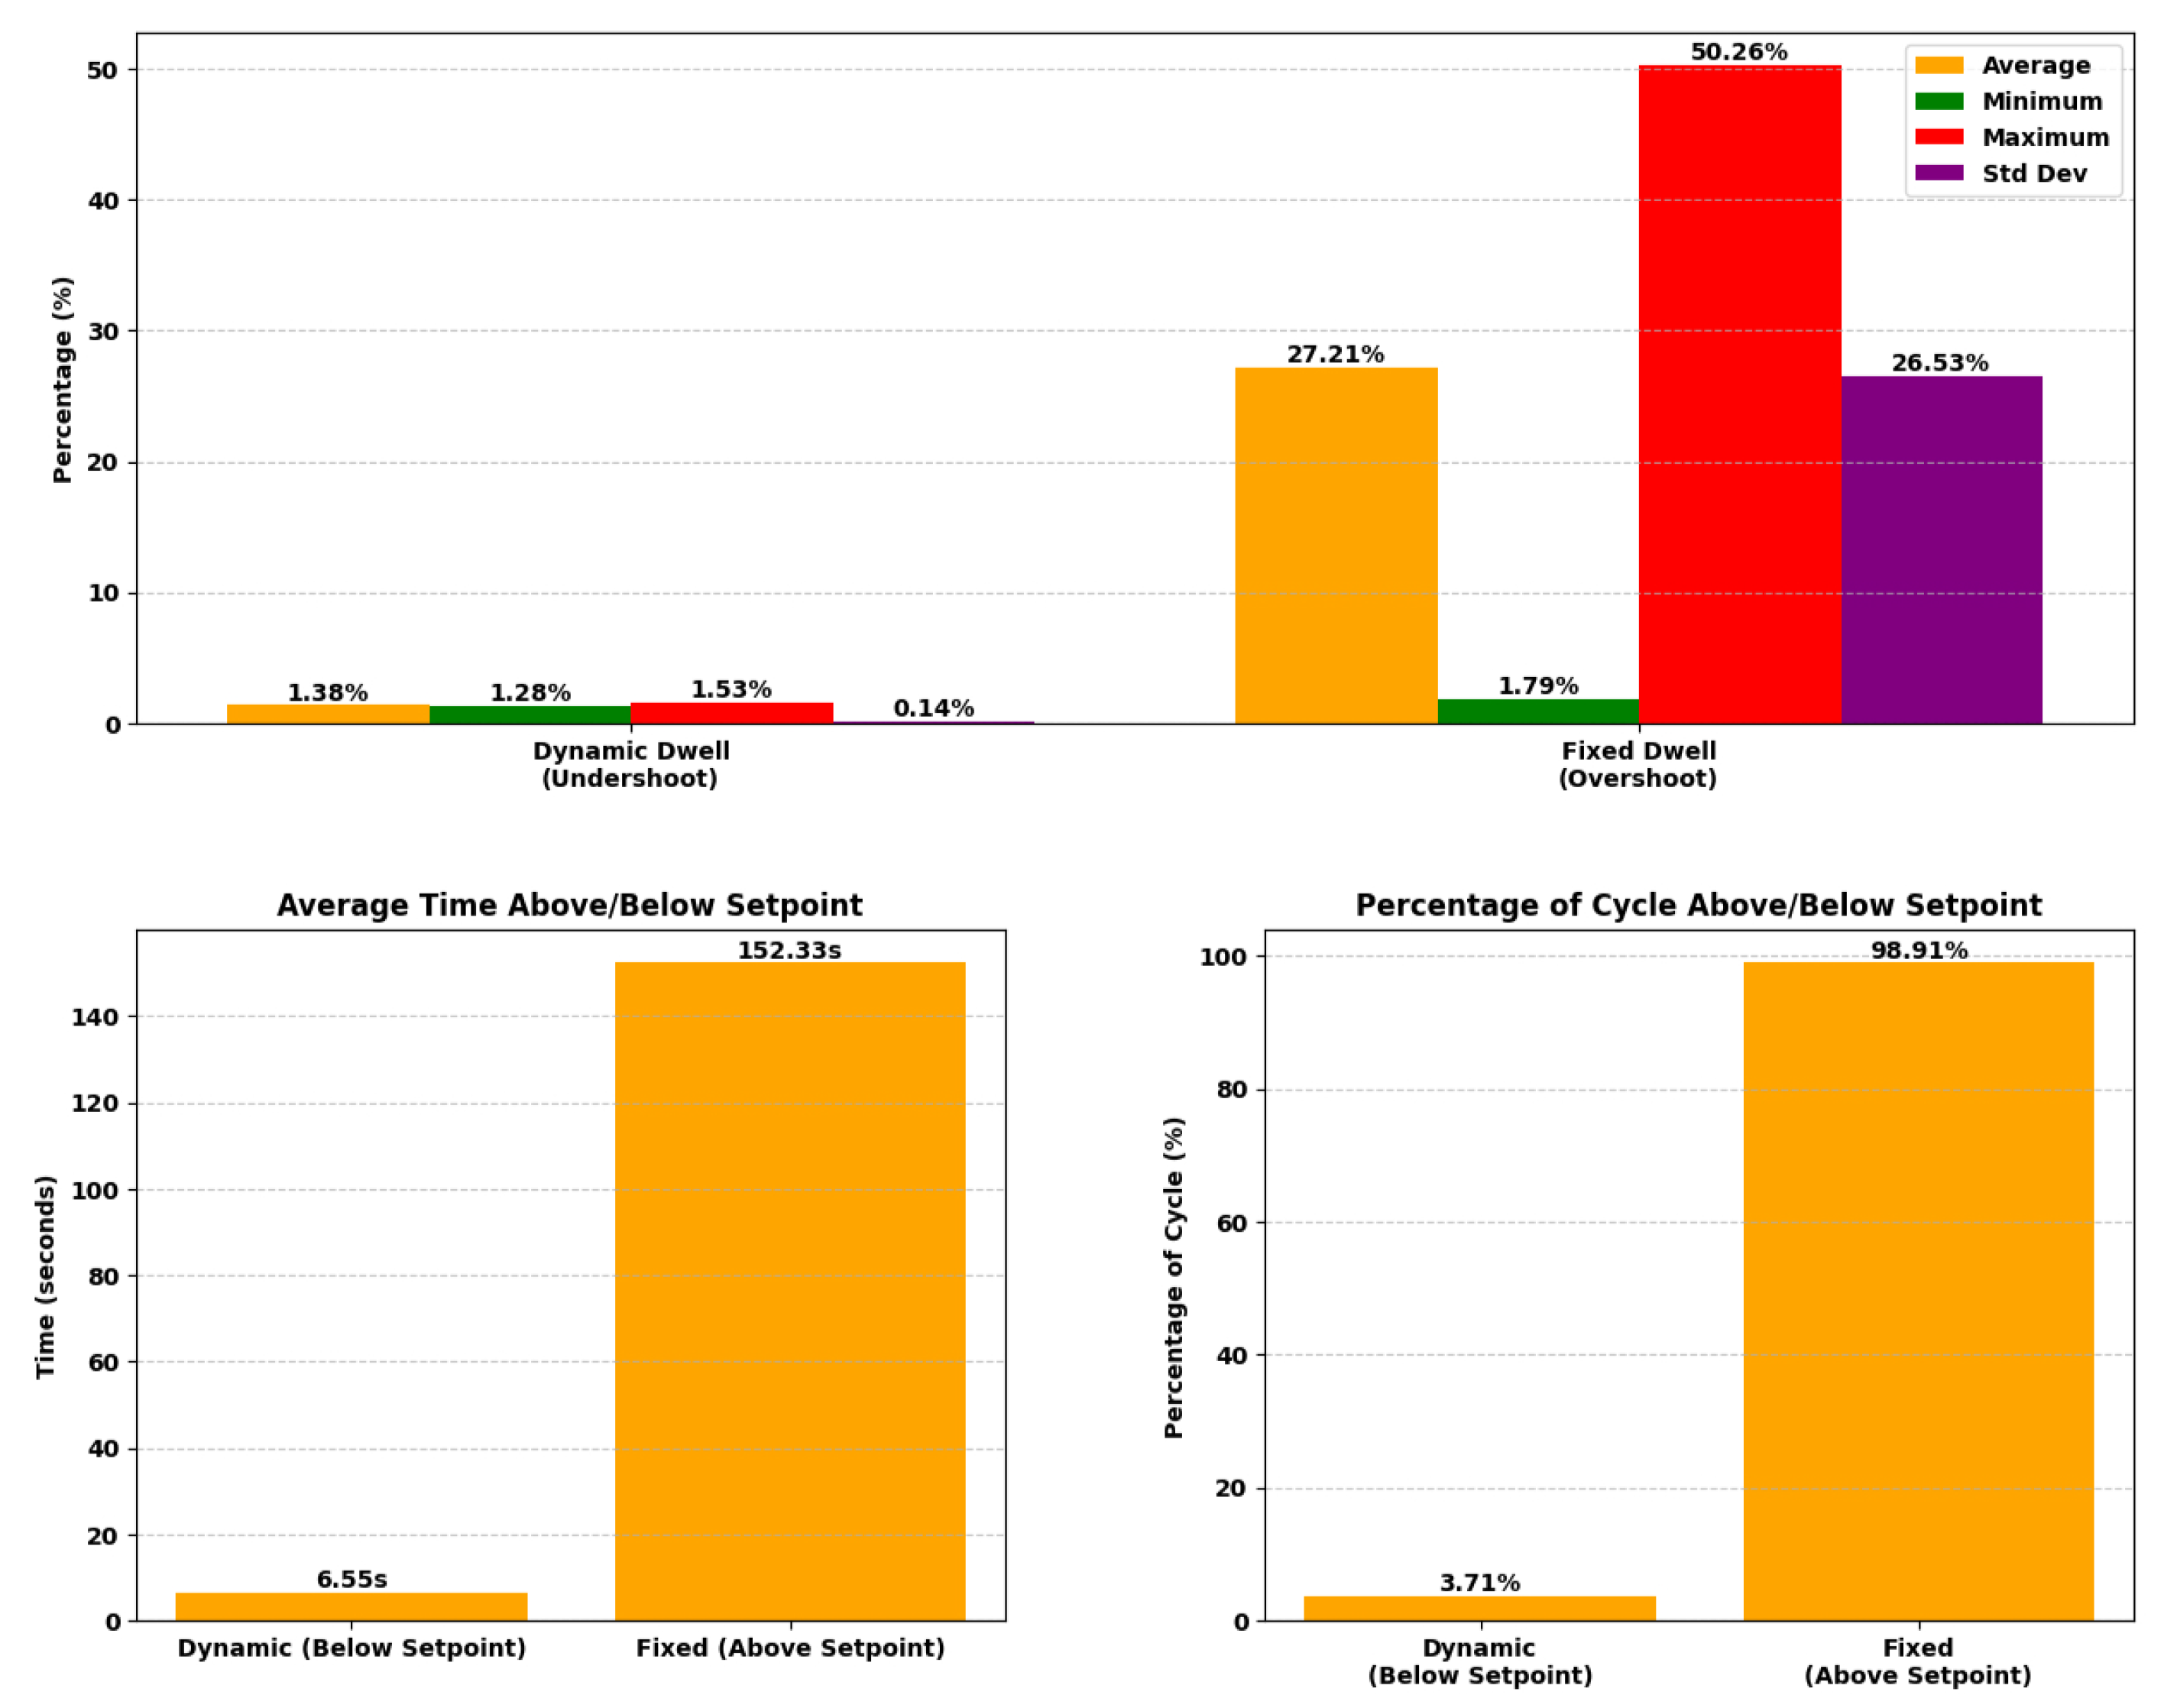
The effectiveness of the dynamic dwell time control system is further validated through detailed statistical analysis of the thermal behavior. The comparison of temperature control performance reveal remarkable improvements in temperature control precision. The dynamic system demonstrates exceptional control with an average undershoot of merely 1.38%, contrasting sharply with the fixed system’s substantial average overshoot of 27.21%. This precision is further emphasized by the dynamic system’s minimal variation, with undershoot values ranging from 1.28% (minimum) to 1.53% (maximum), resulting in a remarkably low standard deviation of 0.14%.
The temporal aspects of temperature control shown in
Figure 7 illustrate the potential advantages of the dynamic approach. On average, the dynamic control strategy keeps the temperature below the setpoint for only 6.55 s per cycle, or about 3.71% of its total cycle time. These values were calculated by examining each cooling cycle from the point of peak temperature until the setpoint was reached again, and then determining how long the temperature profile remained below 200 °C within that interval. In contrast, in the fixed dwell time strategy, the temperature remains above the setpoint for an average of 152.33 s—about 98.91% of its cycle time. This number was determined by measuring the cumulative duration during which the recorded temperature exceeded 200 °C for each cycle, again normalized by the total cycle length specific to that strategy. Although the two processes have different overall durations, this substantial difference in time spent outside the target temperature window points to the efficacy of the dynamic system and suggests that it may support better part quality. It is important to note that this 3.71% figure includes the interval required for confirming three consecutive temperature readings below the threshold, ensuring that the temperature remains stably below 392 °F before initiating the next deposition cycle.
3.2. Thermal Stability Margin Analysis
The thermal stability of the W-DED process was quantitatively assessed through stability margin calculations, defined as the difference between the threshold temperature (392 °F) and the actual measured temperature at the initiation of each subsequent layer.
The stability margin data exhibits a distinctive pattern where the first layer demonstrates a high margin of approximately 15 °F, which sharply decreases to approximately 2 °F by the second layer, followed by slight fluctuations between 2–4 °F for subsequent layers. This unique first-layer behavior can be attributed to the substrate thermal mass effect, where the build plate acts as a massive heat sink with thermal properties substantially different from the deposited material. Additionally, the absence of accumulated thermal history from previous depositions creates initial thermal conditions that significantly deviate from the quasi-equilibrium state achieved in later layers.
The rapid convergence to a significantly lower stability margin by the second layer indicates the effectiveness of the dynamic dwell time controller in establishing thermal equilibrium conditions.
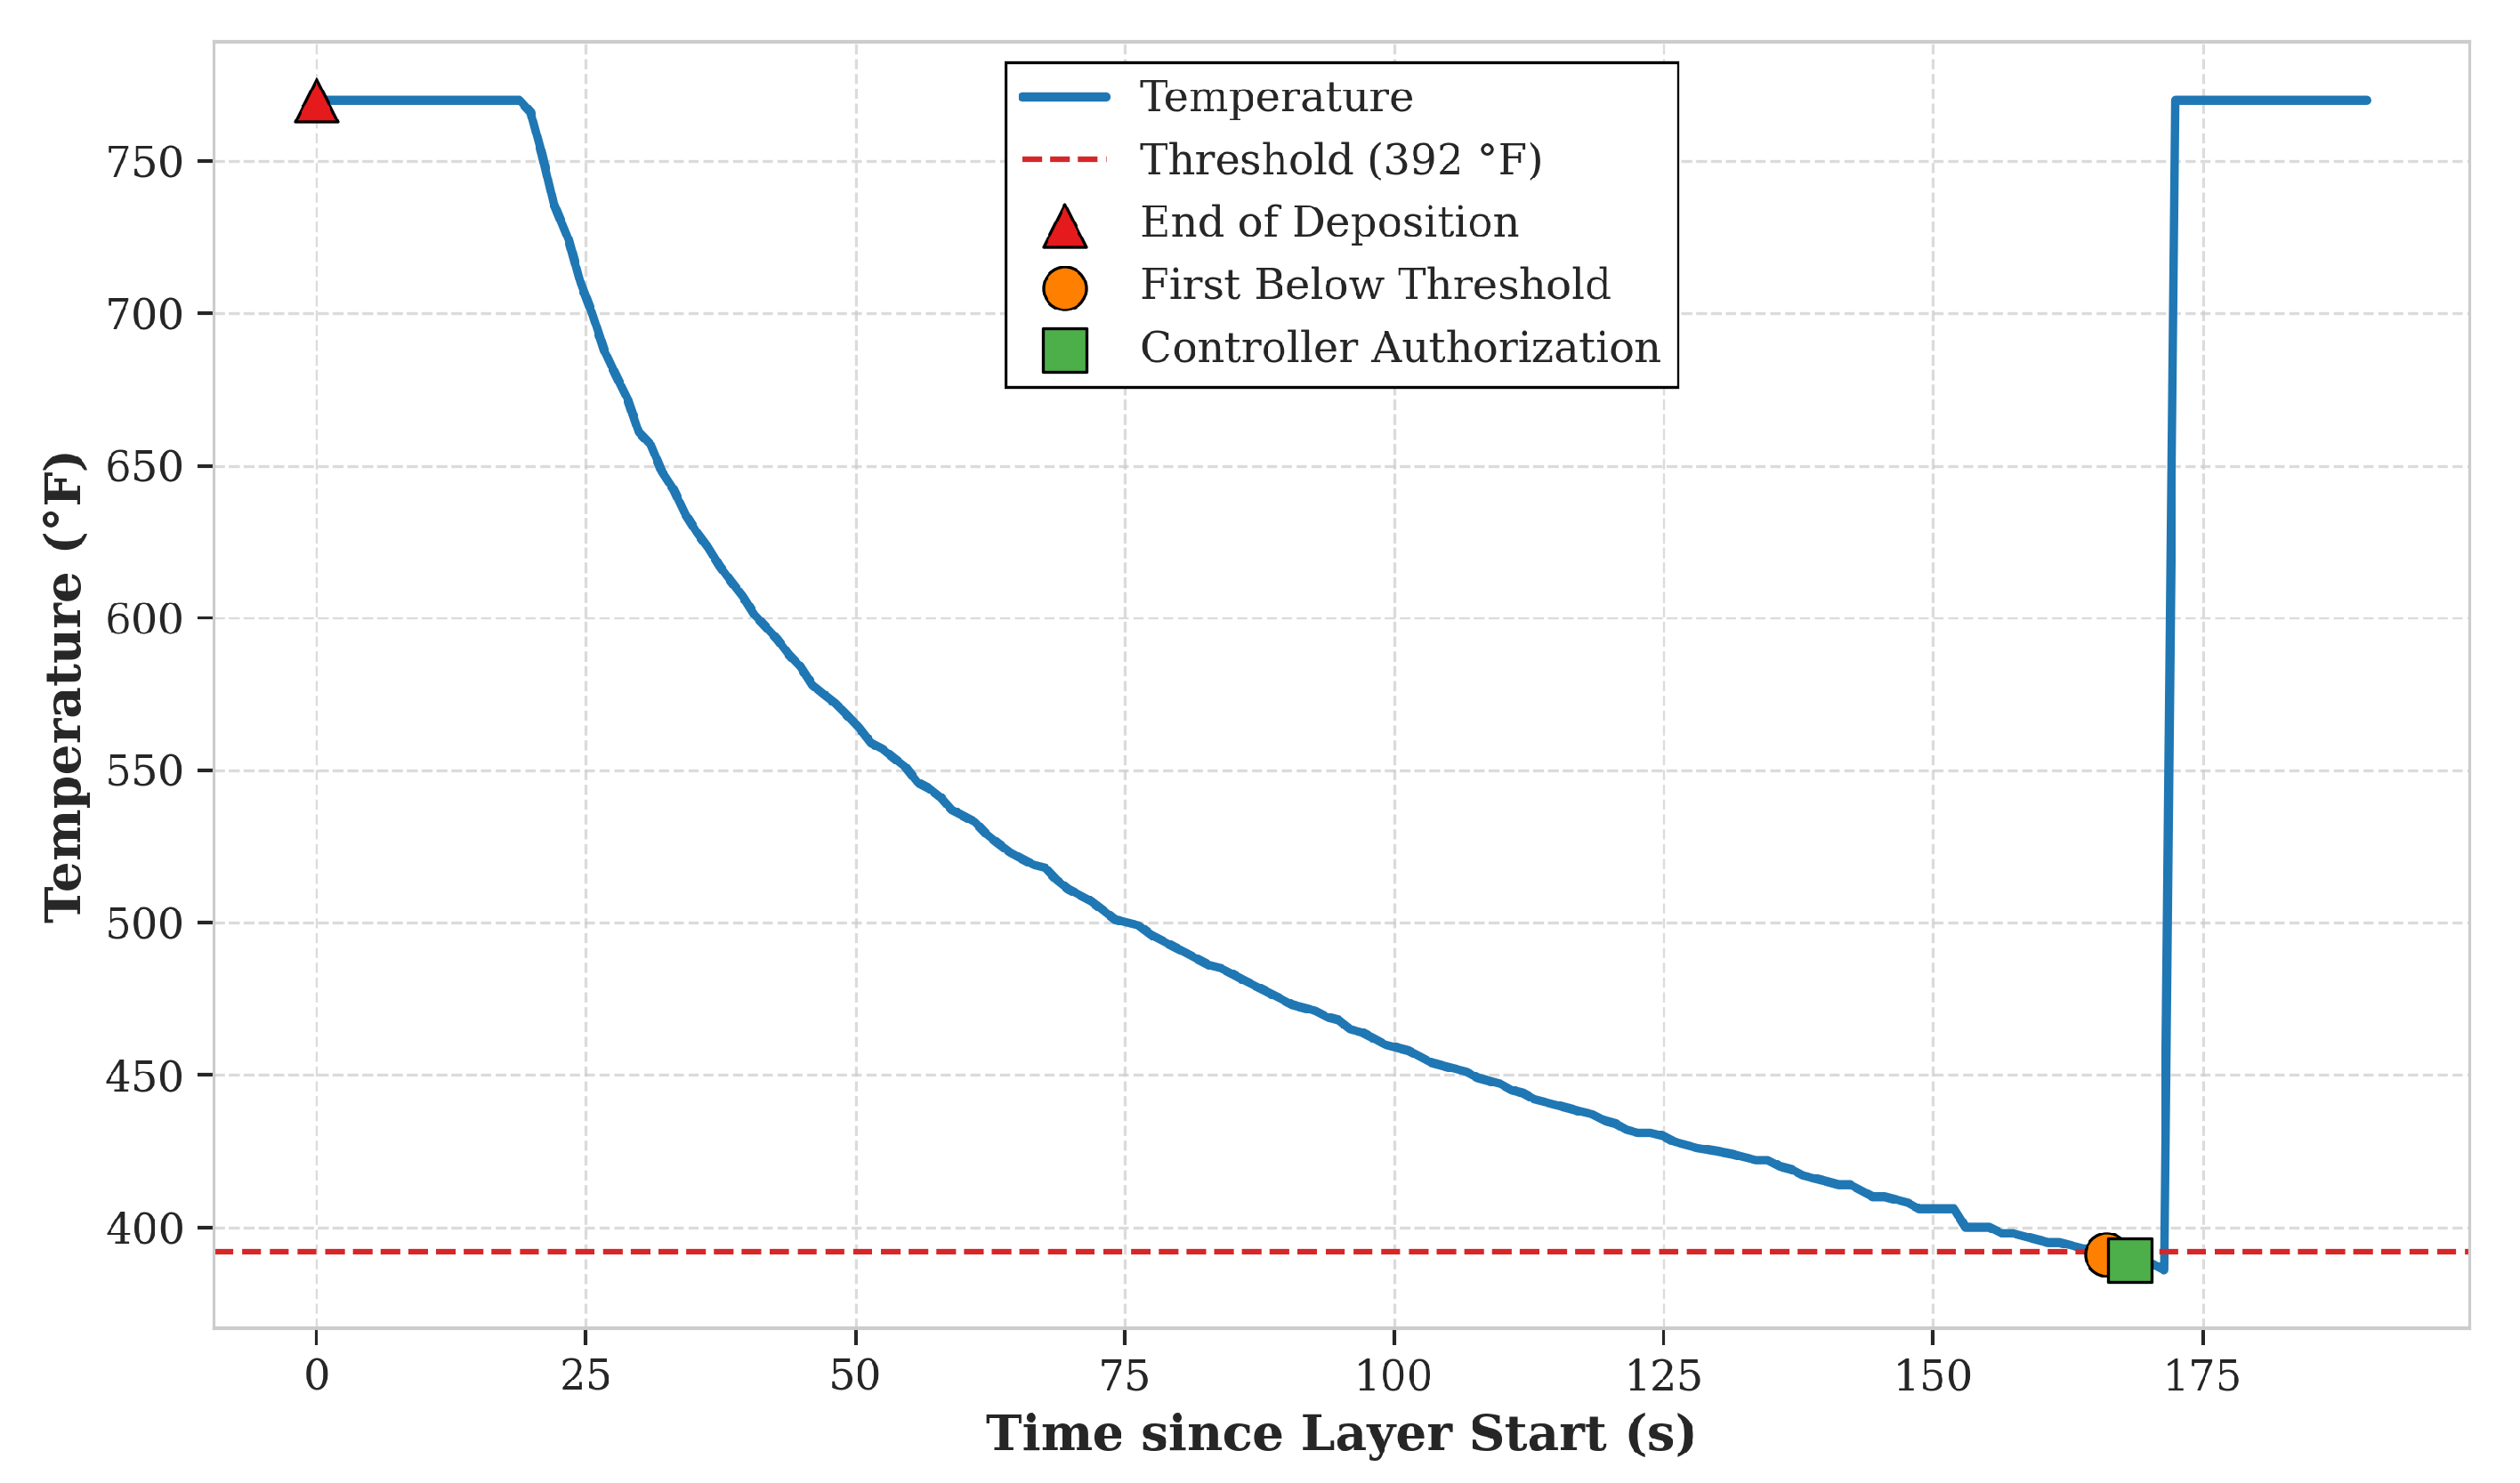
After the first layer, the thermal profiles demonstrate convergence, with stability margins consistently maintained between 2–4 °F. This narrow range represents a successful implementation of the thermal feedback control system in establishing repeatable thermal conditions. The detailed thermal profile of Layer 3 (
Figure 8) exemplifies the characteristic controlled cooling behavior achieved, with precise controller authorization at the threshold crossing point.
The average stability margin of 4.29 °F across all layers provides an intentional undershoot that serves several critical functions in the process: it creates a hysteresis buffer against measurement noise and minor temperature fluctuations, mitigates thermal gradients within the part. For layers 2–7, the mean stability margin of 2.65 °F with a standard deviation of just 0.87 °F demonstrates the system’s ability to maintain highly repeatable thermal conditions.
These findings corroborate the earlier temperature control performance results, where the dynamic dwell time control system demonstrated superior thermal management with an average undershoot of merely 1.38% compared to the fixed system’s substantial average overshoot of 27.21%. The consistency in stability margins after the first layer further validates the effectiveness of the dynamic feedback control approach in establishing stable thermal cycling despite the inherent complexities of the W-DED process. This capability is critical for achieving consistent material properties throughout the build, as the thermal history directly influences microstructural development and, consequently, the mechanical performance of the final part.
To validate the efficacy of the HIHC in dynamically transitioning between fixed and adaptive cooling strategies, a comprehensive simulation framework was implemented. This framework incorporated multiple thermal phenomena intrinsic to W-DED processes:
The framework incorporated a sigmoid-like temperature evolution profile to accurately model the non-linear heat accumulation dynamics during material deposition. Natural cooling phases were characterized by exponential thermal decay functions in accordance with Newton’s law of cooling. Stochastic variations in temperature measurements were simulated via Gaussian noise distribution (, °C) to replicate the measurement uncertainty inherent in thermal imaging systems. Additionally, low-amplitude sinusoidal perturbations ( °C) in cooling rates were implemented to represent environmental fluctuations and process variability.
The simulation parameters were selected using empirical thermal data extracted from previous W-DED experiments, as detailed in
Appendix A.
Figure 9 presents the temperature profile and mode switching, demonstrating that the controller effectively executed mode transitions between fixed dwell time and dynamic dwell time regimes based on the predetermined thermal threshold criteria.
3.3. Dwell Time Analysis
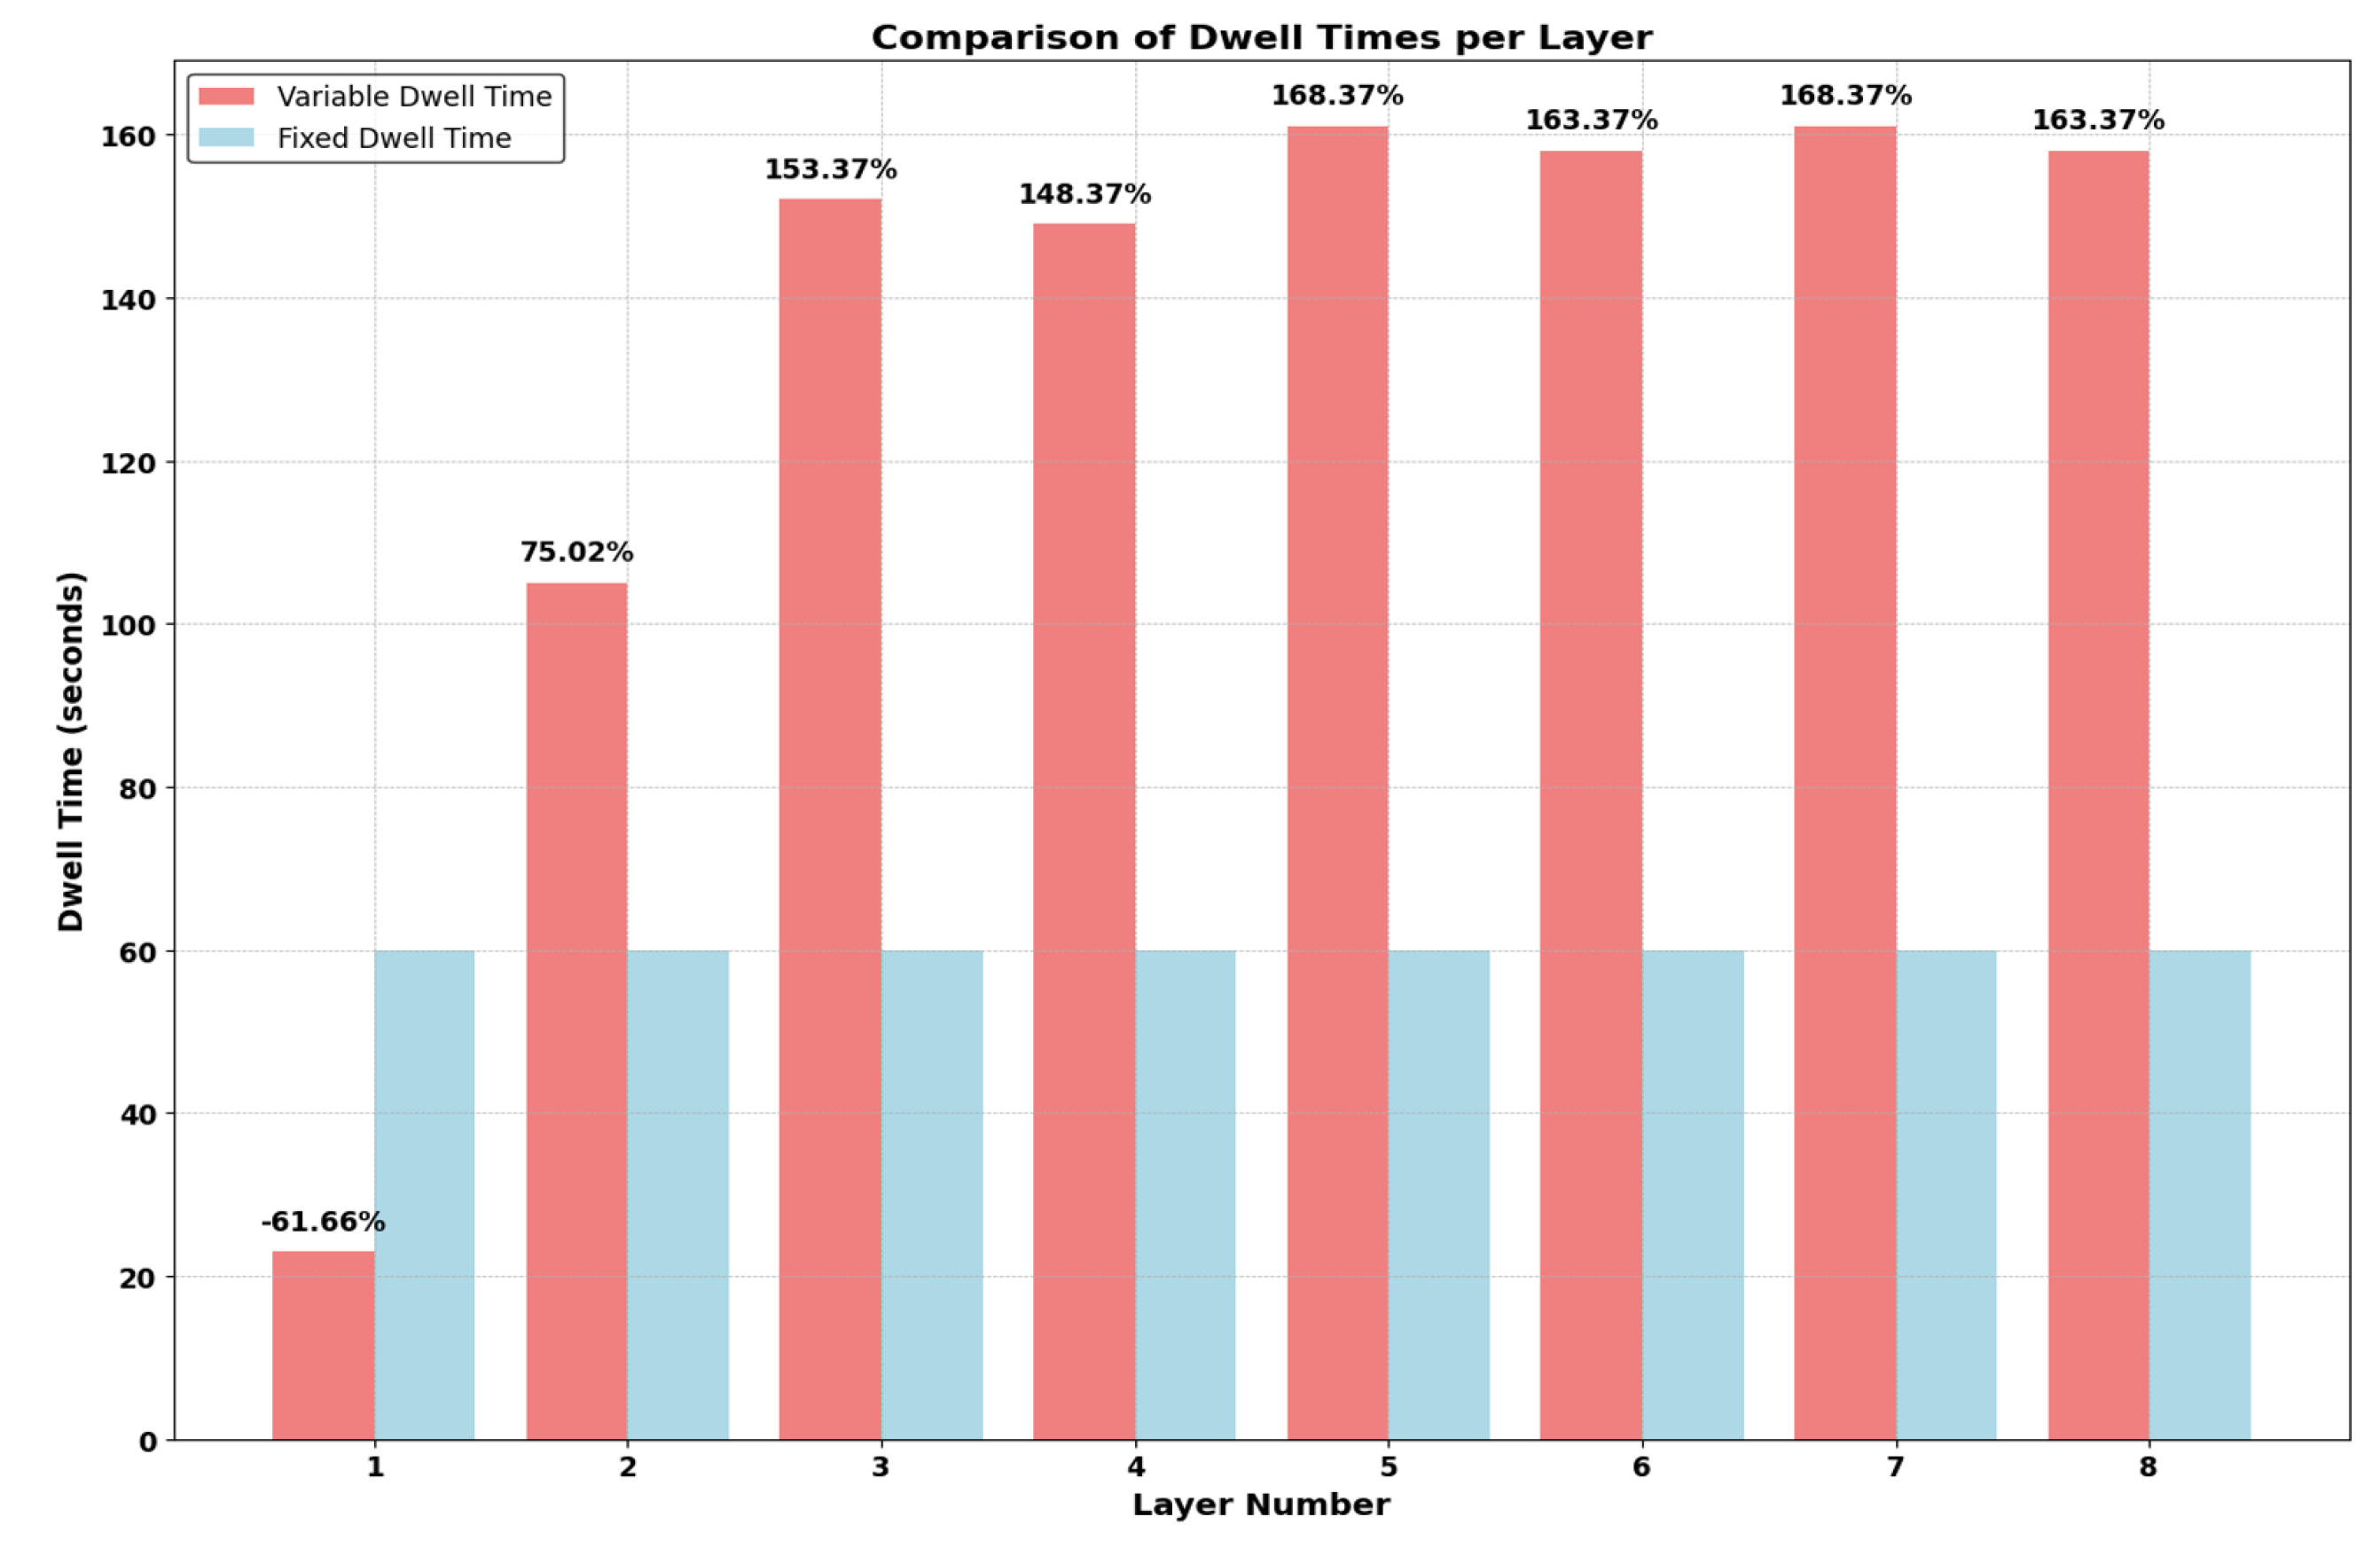
The bar chart presented in
Figure 10 illustrates the comparative analysis of dwell times per layer between fixed and variable dwell time approaches in the W-DED process. Analysis of Layer 1 reveals that the variable dwell time was significantly lower, reduced by approximately 61.66% compared to the fixed dwell time. This substantial reduction suggests that the initial conditions and material properties at the process onset enable more rapid operations without compromising quality. From Layer 2 onward, a notable shift in behavior is observed, where the variable dwell time consistently exceeds the fixed dwell time. The increases range from 75.02% in Layer 2 to 168.37% in Layers 4, 7, and 8. These progressive adjustments in process parameters, driven by feedback mechanisms, indicate an adaptive response to stabilize interlayer temperature as layers accumulate. This pattern demonstrates the system’s capability to dynamically adjust to changing thermal conditions throughout the build process.
The increase in dwell times for the variable approach after the first layer can be attributed to inherent heat build up inside W-DED part. The continuous monitoring of the interlayer temperature adjust dwell times in response to real-time feedback to ensure optimal material deposition and cooling rates.
The significant decrease in dwell time for the first layer under variable conditions might be due to the lower thermal mass at the onset of printing, which requires less cooling or solidification time. The variable increases in later layers could be necessary to counteract the cumulative heat build-up, which affects the deposition process. These adjustments are crucial for maintaining dimensional accuracy and mechanical properties across the entire build. While the HIHC strategy demonstrates superior thermal management capabilities, its implementation introduces a notable trade-off in production efficiency. The experimental results revealed that HIHC-controlled processes occasionally required dwell times approximately twice that of fixed-dwell approaches, with further extensions necessary for layers exhibiting slower cooling profiles. This increase in cycle time represents a significant consideration for industrial applications where throughput remains a critical factor. Nevertheless, the enhanced thermal control afforded by HIHC directly translates to measurable improvements in dimensional accuracy—benefits that may outweigh productivity concerns in high-value or quality-critical applications. Future development of the HIHC approach could incorporate accelerated cooling mechanisms, optimized deposition path planning, or machine learning algorithms to balance thermal management requirements with production efficiency. Such refinements would preserve the core advantages of adaptive temperature control while mitigating the current cycle time penalties observed in our validation experiments.
3.4. Effect of Dynamic Dwell Time on Geometric Distortions
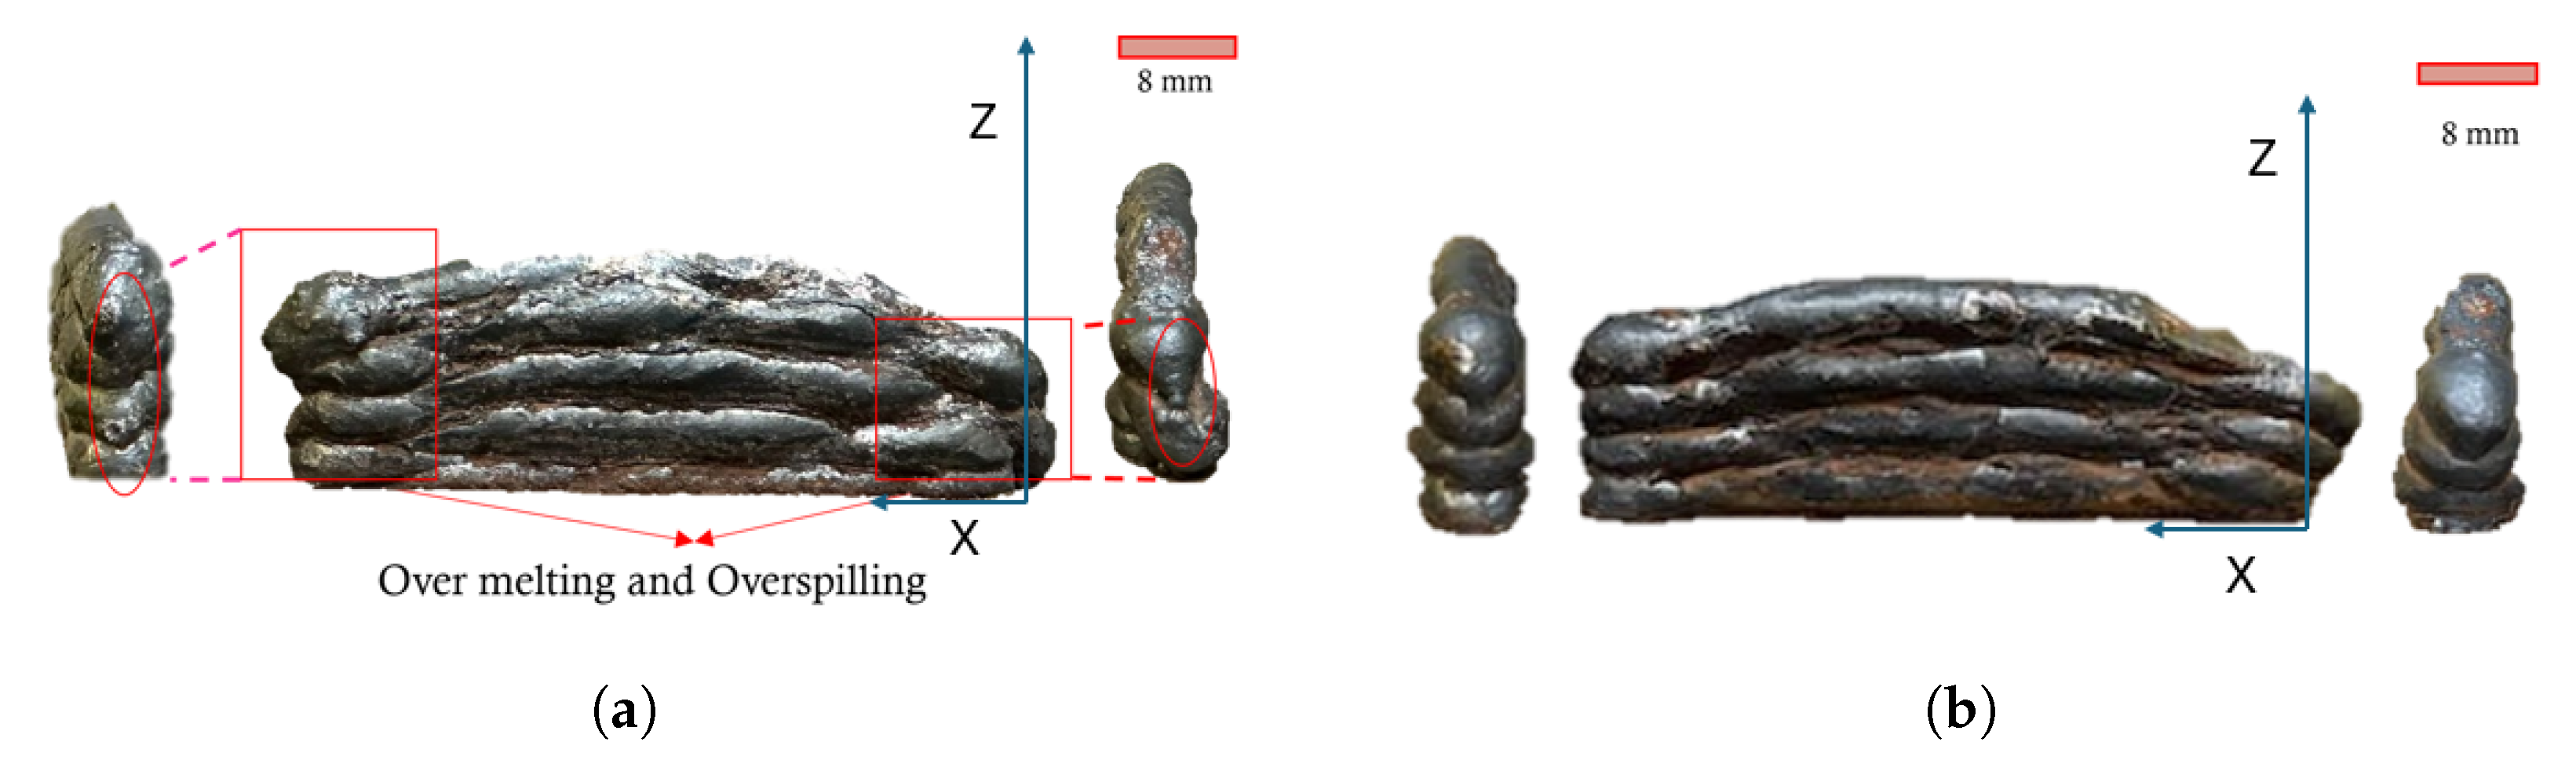
The
Figure 11 show two thin metal walls fabricated using W-DED with differing dwell times: one using dynamic dwell time adjustments and the other with fixed dwell times. As mentioned in the methodology the thin walls were digitized and two distinct conditions were analyzed to measure surface texture and overall dimension.
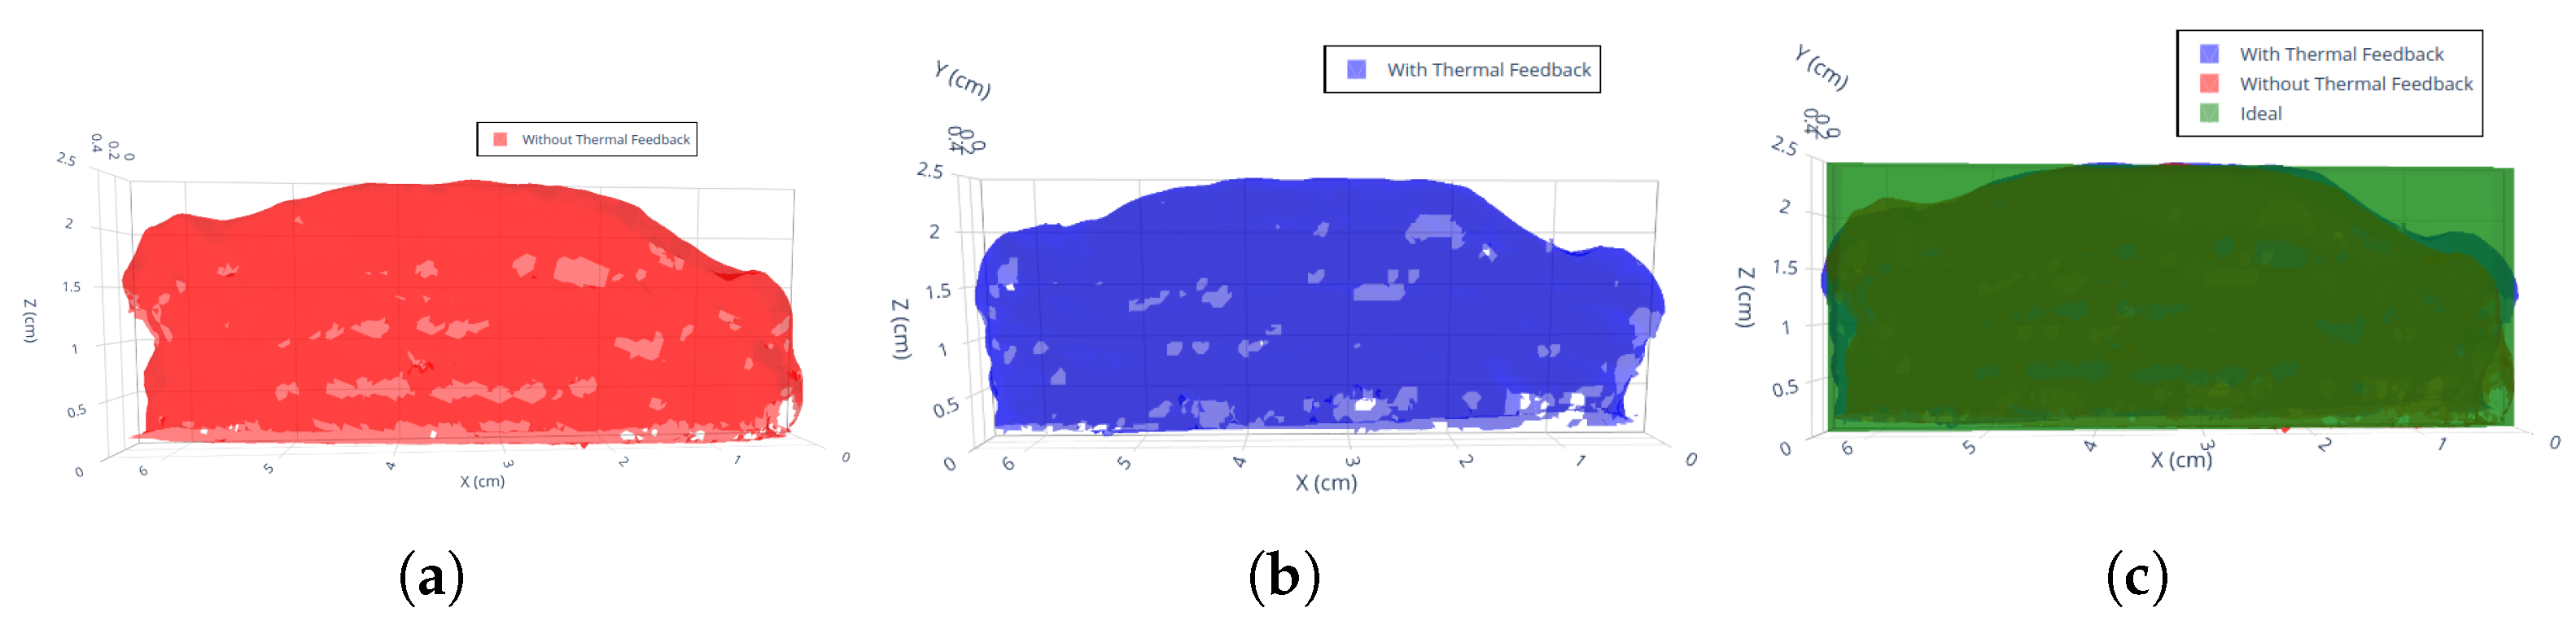
The surface texture analysis revealed distinct characteristics between thin walls manufactured using different dwell time strategies. Components built with dynamic dwell time demonstrated notably improved surface uniformity, characterized by smoother layer-to-layer transitions as evidenced in
Figure 12. This enhanced surface quality can be attributed to the adaptive control system’s ability to modulate dwell time based on real-time feedback, ensuring consistent energy input and cooling rates throughout the build process. In contrast, thin walls manufactured using fixed dwell time exhibited more pronounced surface irregularities, particularly in the form of layer ridging. These surface inconsistencies likely stem from non-optimal cooling and reheating cycles, as the fixed parameters were unable to adjust to the evolving thermal behavior of the material during the build process. To validate these observations, two independent analyses were conducted on separate sample sets, providing comprehensive insights into the effectiveness of feedback control on surface quality. This dual analysis approach strengthened the reliability of the findings regarding the impact of dwell time control on surface characteristics.The RMS roughness values for different manufacturing conditions are summarized in
Table 5.
Overall Dimensions:
Table 6 summarizes the measured dimensions (width and heights at three specific lateral positions) for the thin walls produced with and without feedback control. All width measurements were taken using a digital slide caliper, allowing straightforward yet reliable checks at each lateral position. These values provide a complementary perspective on overall geometric fidelity alongside the roughness metrics discussed previously.
The planned robot path for this build was designed to span a total width of 60 mm. From
Table 6, the dynamic dwell time sample (61.98 mm) is much closer to the intended path width than the fixed dwell time sample (66.43 mm). This indicates that the closed-loop control strategy more accurately regulated over spill, thus minimizing excessive buildup.
Regarding height measurements at the right, middle, and left ends, the dynamic dwell time part exhibits slightly higher and more uniform heights. Its middle section (30.30 mm) is close to the right end (27.00 mm) and left end (23.70 mm), showing reasonable consistency across the part. By comparison, the fixed dwell time sample shows somewhat similar variability (26.50–29.60–23.20 mm), but the overall shape is less aligned with the intended width, pointing to larger lateral distortion despite comparable local height variations.
These observations support the conclusion that real-time feedback control can perform both of the following:
Reduce horizontal overshoot, ensuring the final width is closer to the planned 60 mm toolpath.
Stabilize the additive process along the build height, thereby mitigating unwanted fluctuations caused by thermal accumulation or over-deposition.
In essence, the dimensional analysis aligns with the surface roughness results, underscoring how closed-loop control strategies help maintain geometrical accuracy and uniformity. Such improvements reflect an enhanced ability to adapt to transient conditions (e.g., local thermal changes, wire feed inconsistencies) during deposition, paving the way for tighter dimensional tolerances and improved part quality.
In summary, the dimensional analysis corroborates the trends observed in the roughness measurements: feedback control improves overall process stability. However, local variations in geometry underscore the need for further refinements in control algorithms, especially if a tighter dimensional tolerance is required across various regions of the printed part.
4. Conclusions
This research has implemented a novel framework for W-DED process control through the development and validation of a Hybrid Interlayer Hysteresis Controller (HIHC). The innovative integration of real-time thermal feedback with adaptive dwell time control represents an advancement in additive manufacturing process management.The dynamic dwell time control system demonstrated potential improvements in both thermal management and geometric accuracy when compared to conventional fixed dwell time approaches. The controller’s effectiveness is evidenced by its precise temperature regulation, maintaining an average undershoot of merely 1.38% compared to the fixed system’s 27.21% overshoot, with a minimal standard deviation of 0.14%, indicating exceptional process stability.
The HIHC system’s thermal management capabilities resulted in measurable improvements in part quality. Surface roughness analysis revealed an 8.67% improvement in front face smoothness and a 5.15% enhancement in top surface quality compared to fixed dwell time specimens. Furthermore, the dynamic control system demonstrated superior dimensional accuracy, producing thin walls with widths of 61.98 mm, much closer to the intended 60 mm specification compared to fixed dwell time samples (66.43 mm). These improvements in geometric precision and surface quality directly translate to enhanced part reliability and reduced post-processing requirements.
The system’s ability to adaptively modify dwell times based on real-time thermal feedback represents an advancement in W-DED process control technology. By maintaining temperatures within the optimal processing window for 96.29% of the cycle time—compared to just 1.09% in fixed dwell time approaches—the HIHC system effectively addresses one of the fundamental challenges in additive manufacturing: consistent thermal management across multiple layers. This precise thermal control contributes to more uniform material properties and reduced residual stress development throughout the build process.
The integration of optical character recognition-based temperature monitoring with hysteresis-based stability verification has proven to be a robust and effective approach for real-time process control. This methodology not only enhances build quality but also provides a foundation for future developments in adaptive manufacturing systems. The successful implementation of this control strategy demonstrates the potential for significant improvements in additive manufacturing process stability and reliability.
Looking forward, this research opens several promising avenues for future investigation, including the optimization of thermal setpoints for different materials, the development of machine learning-enhanced control algorithms, and the extension of this methodology to more complex geometries. Machine learning can benefit this research by analyzing the large quantity of sensor data collected in real time—beyond what manual or heuristic methods typically capture—and extracting correlations between process variables (e.g., temperature, melt pool dimensions, layer thickness) and final part quality. By training predictive models on these correlations, the control system could better anticipate evolving thermal conditions, autonomously adjust its operating parameters for specific geometric or material demands and continuously improve over time. Such data-driven strategies could further refine dwell time decisions, reduce the trial-and-error in selecting setpoints, and adapt to dynamic in-process variations that are challenging to model explicitly. The demonstrated success of the HIHC system suggests that similar approaches could be beneficial for other additive manufacturing processes where thermal management is critical for part quality. Future work will focus on improving the quality and consistency of deposited walls through parameter optimization to develop more refined structures that maintain dimensional accuracy while enhancing surface finish and mechanical properties. Additionally, future work will test the hypothesis that the benefits of dynamic temperature control become significantly more pronounced in larger-scale W-DED builds, where thermal gradients are more complex and cooling times scale non-linearly with part dimensions.


 ,
, 

