
Scarf Adhesive Bonding of 3D-Printed Polymer Structures


 , and
, and
Abstract
1. Introduction
2. Materials and Methods
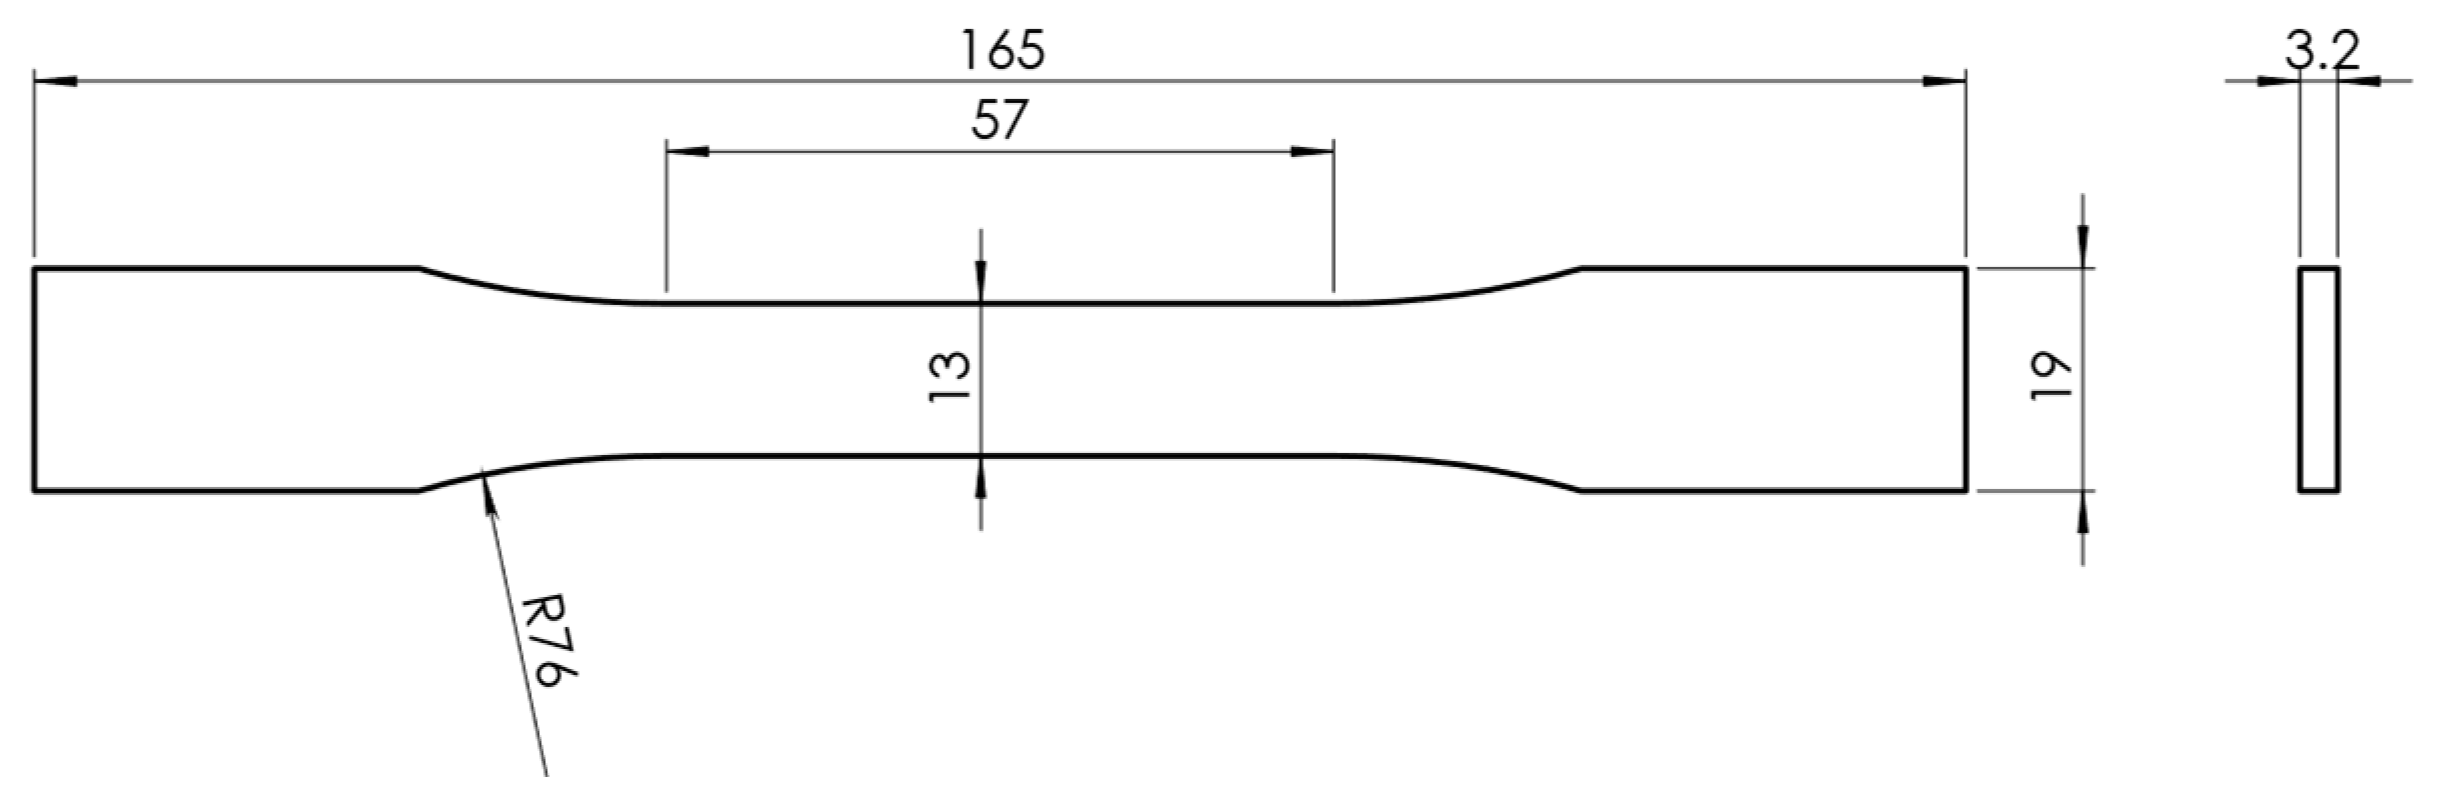
2.1. Adherends’ Characterisation
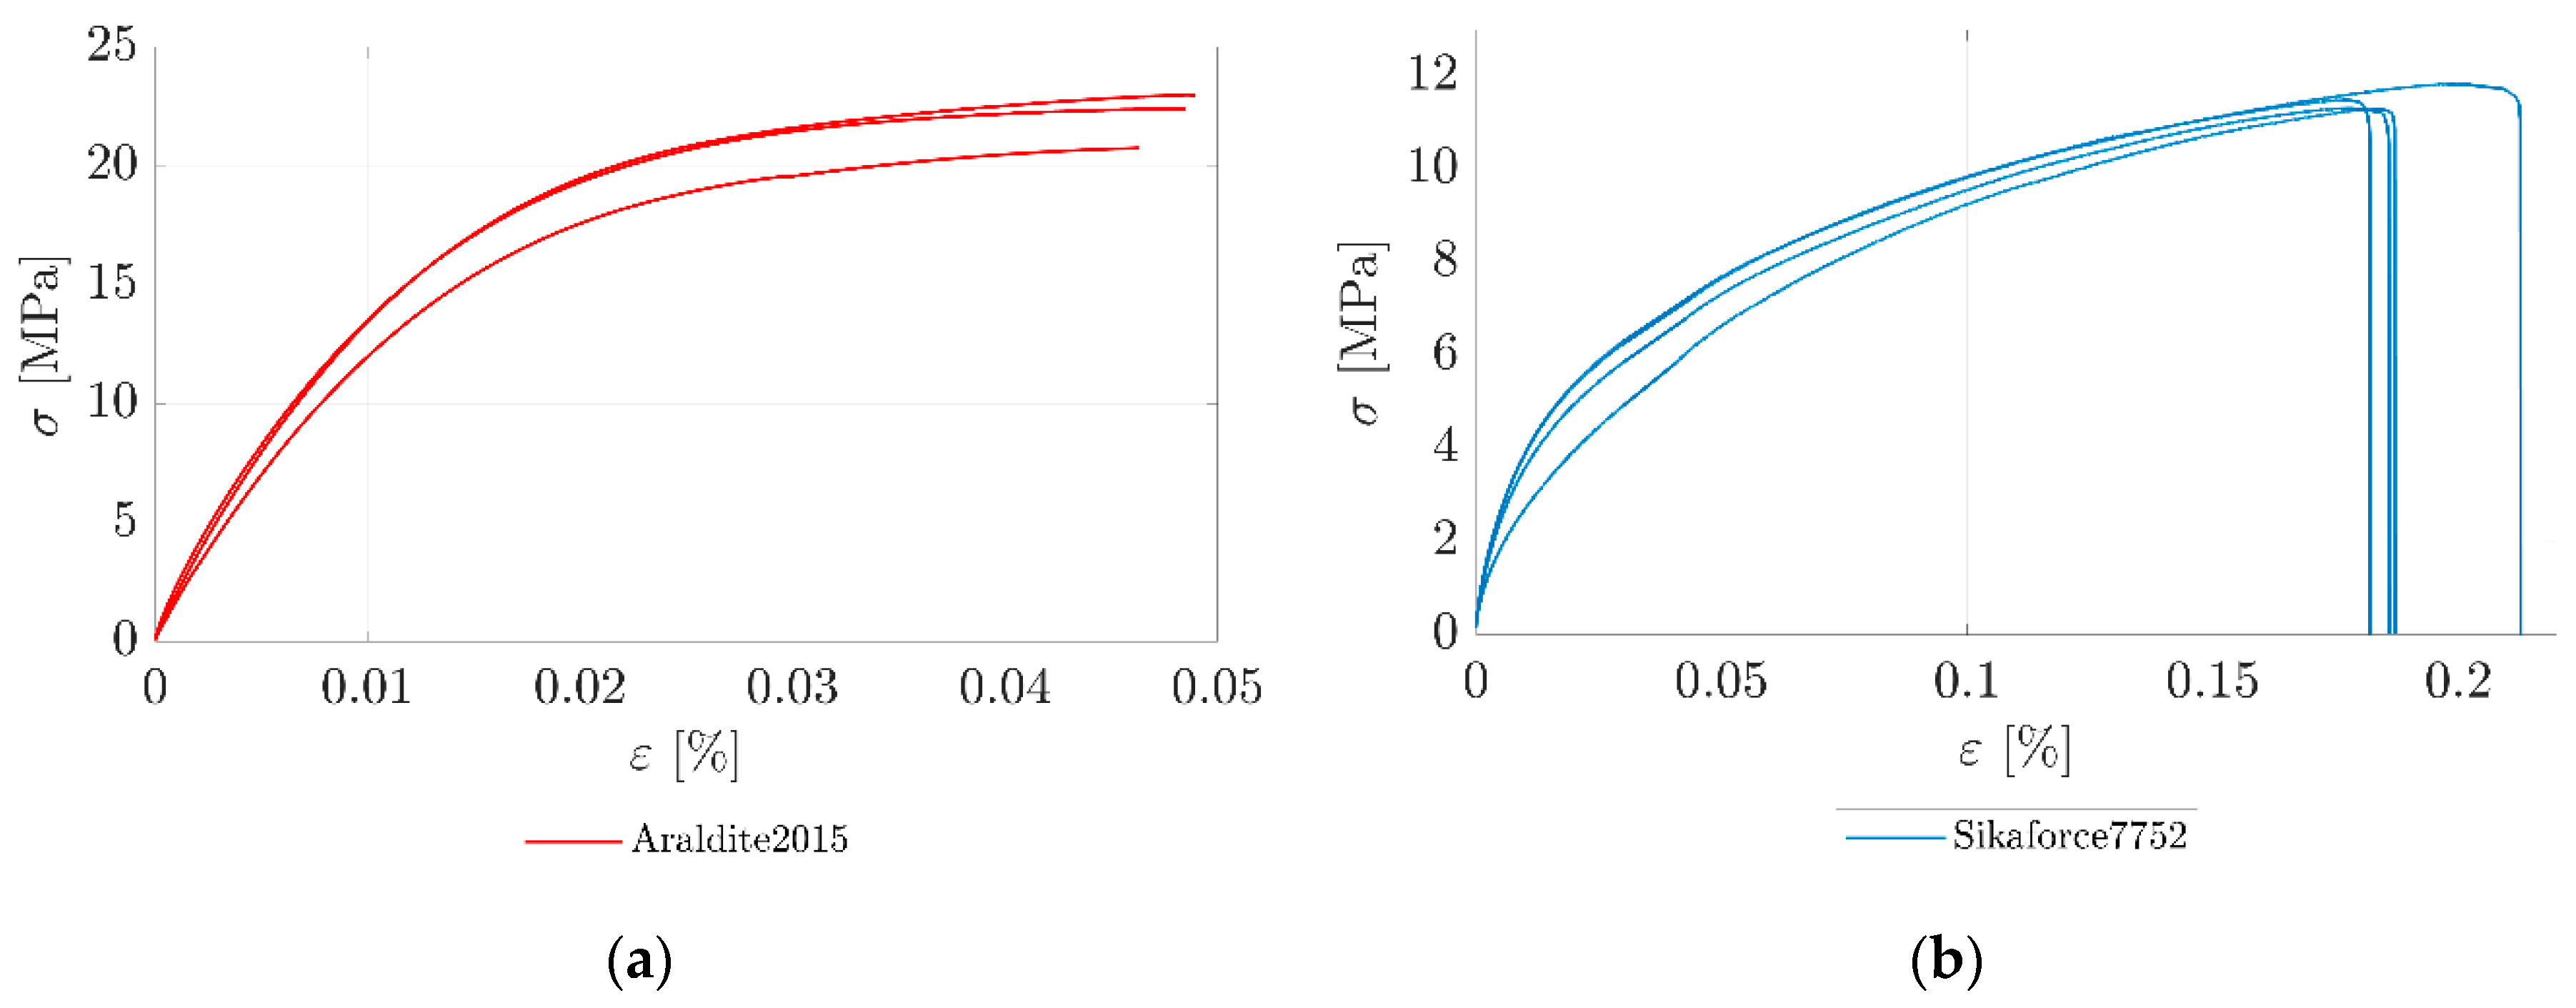
2.2. Adhesives Characterisation
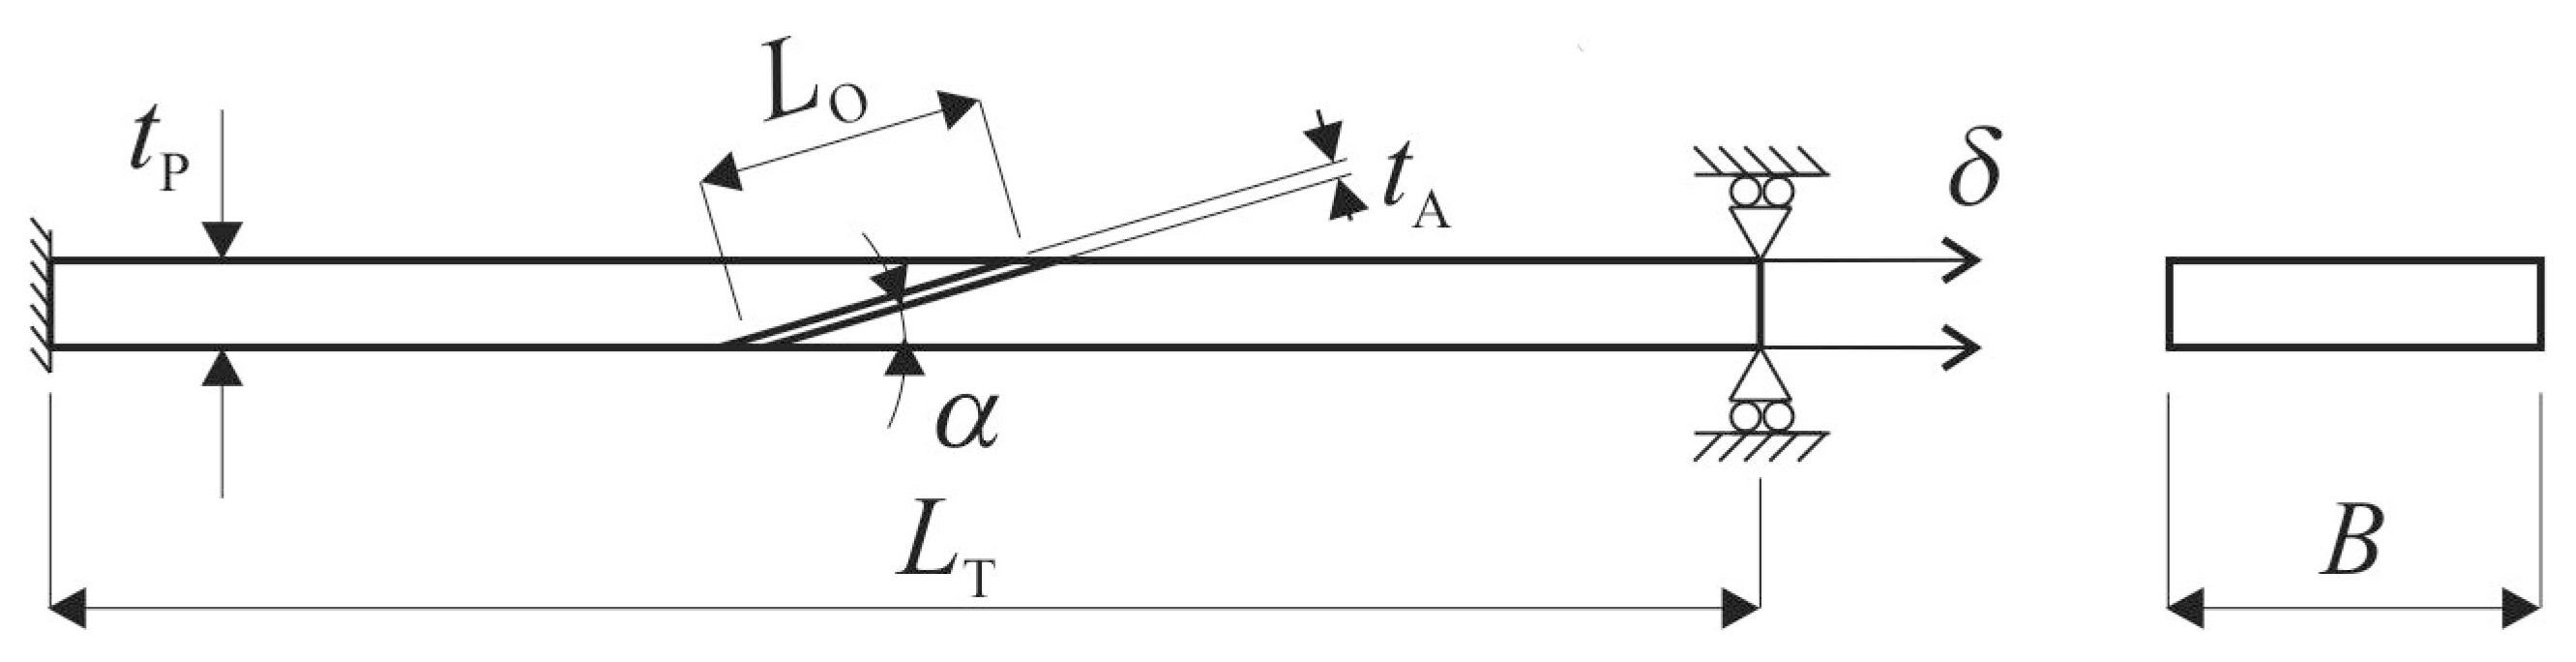
2.3. Joint Geometry, Fabrication, and Testing
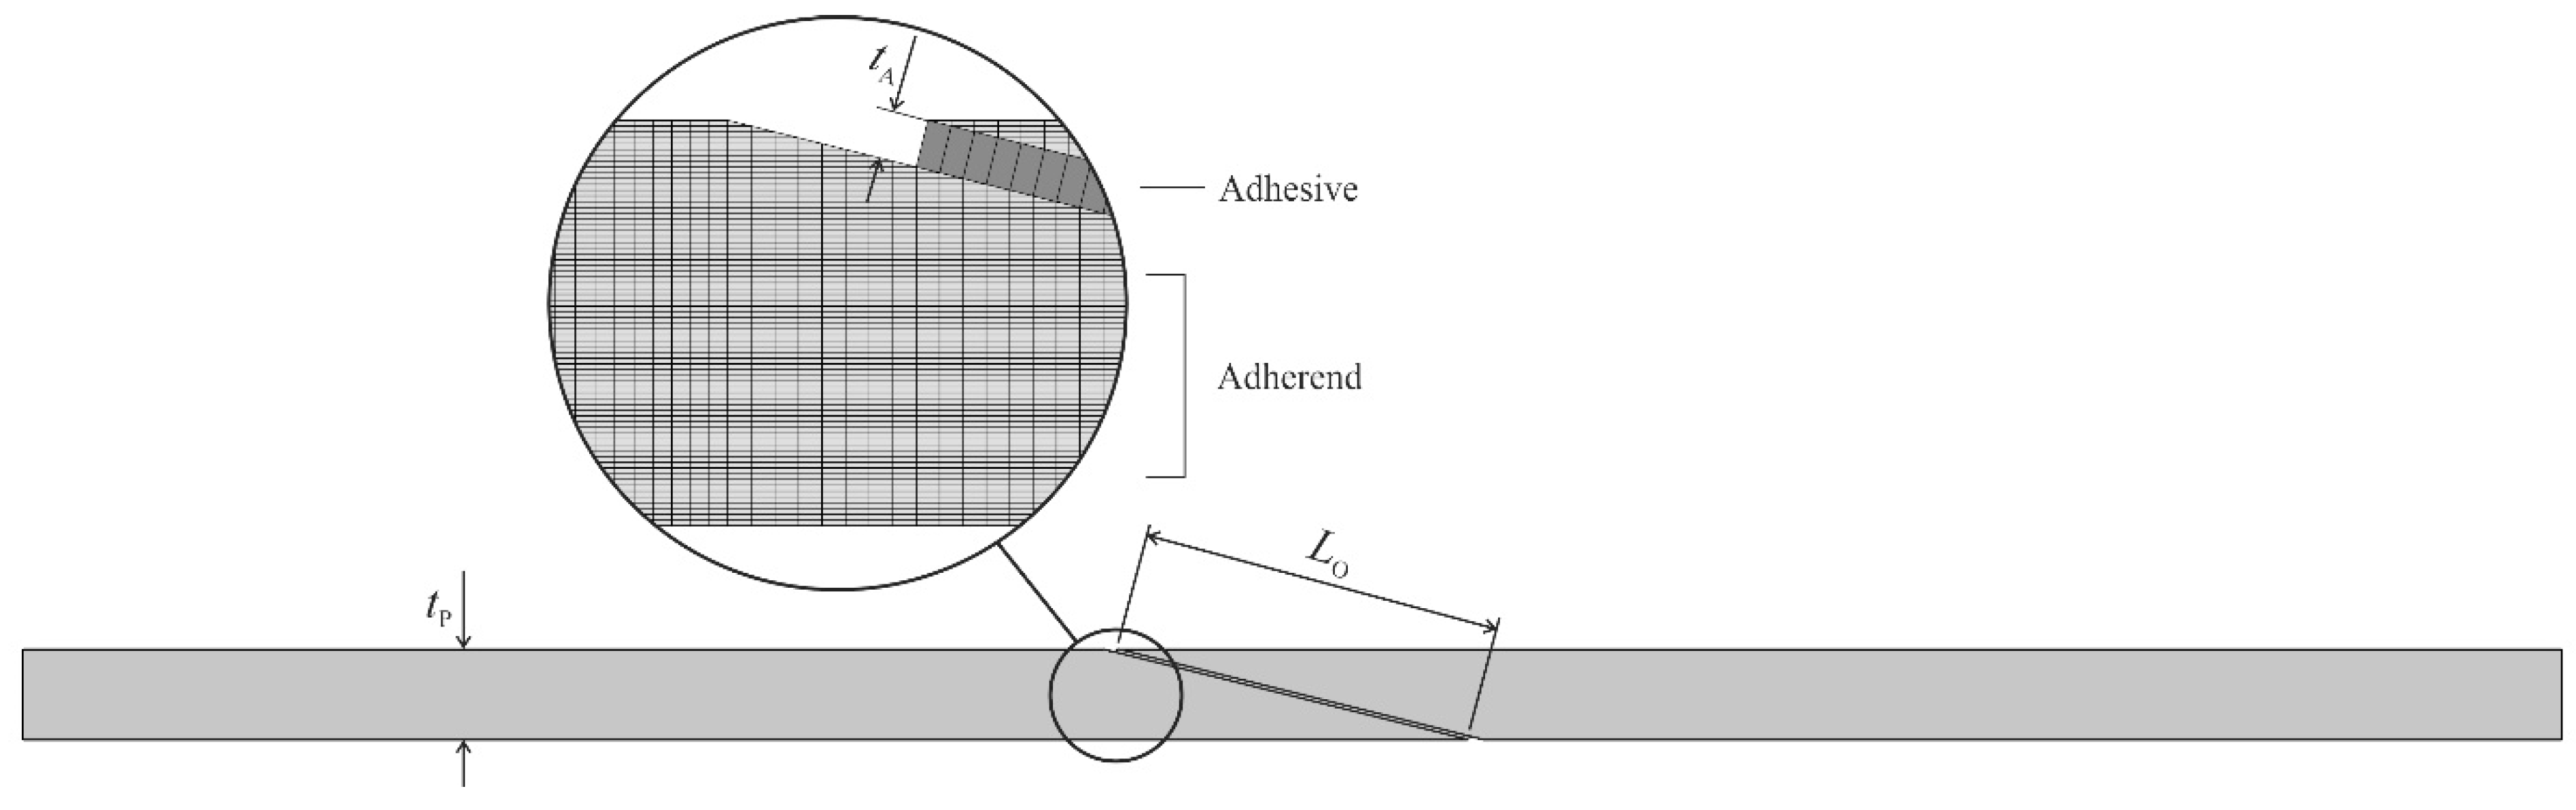
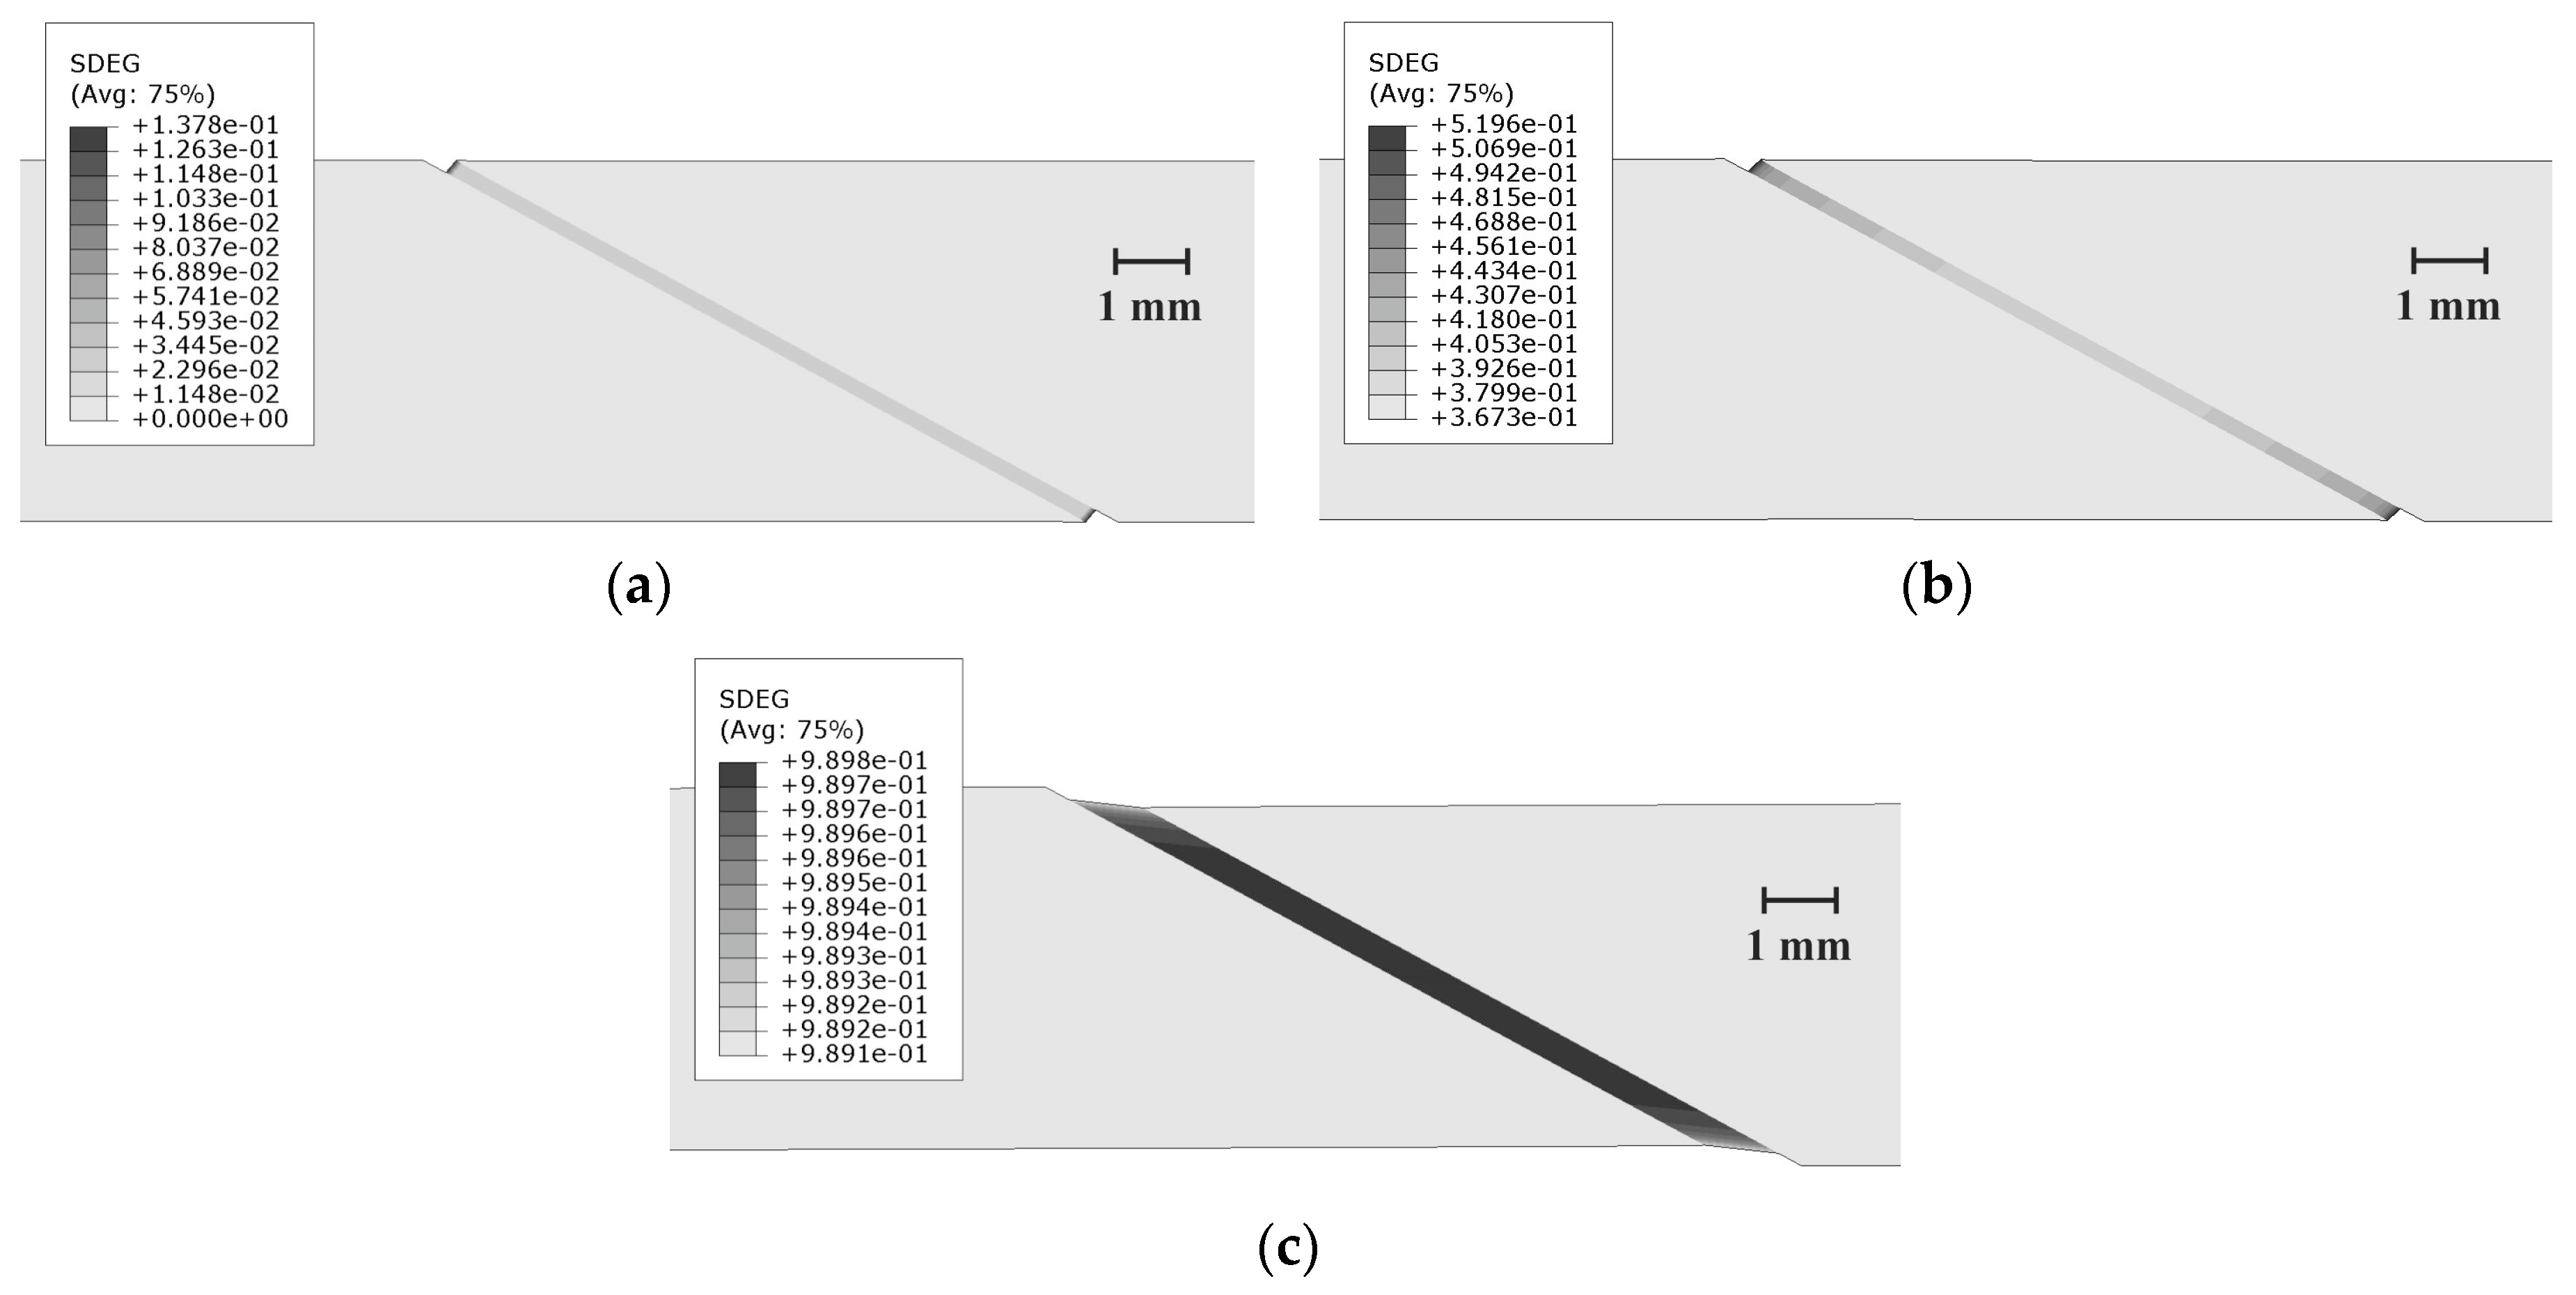
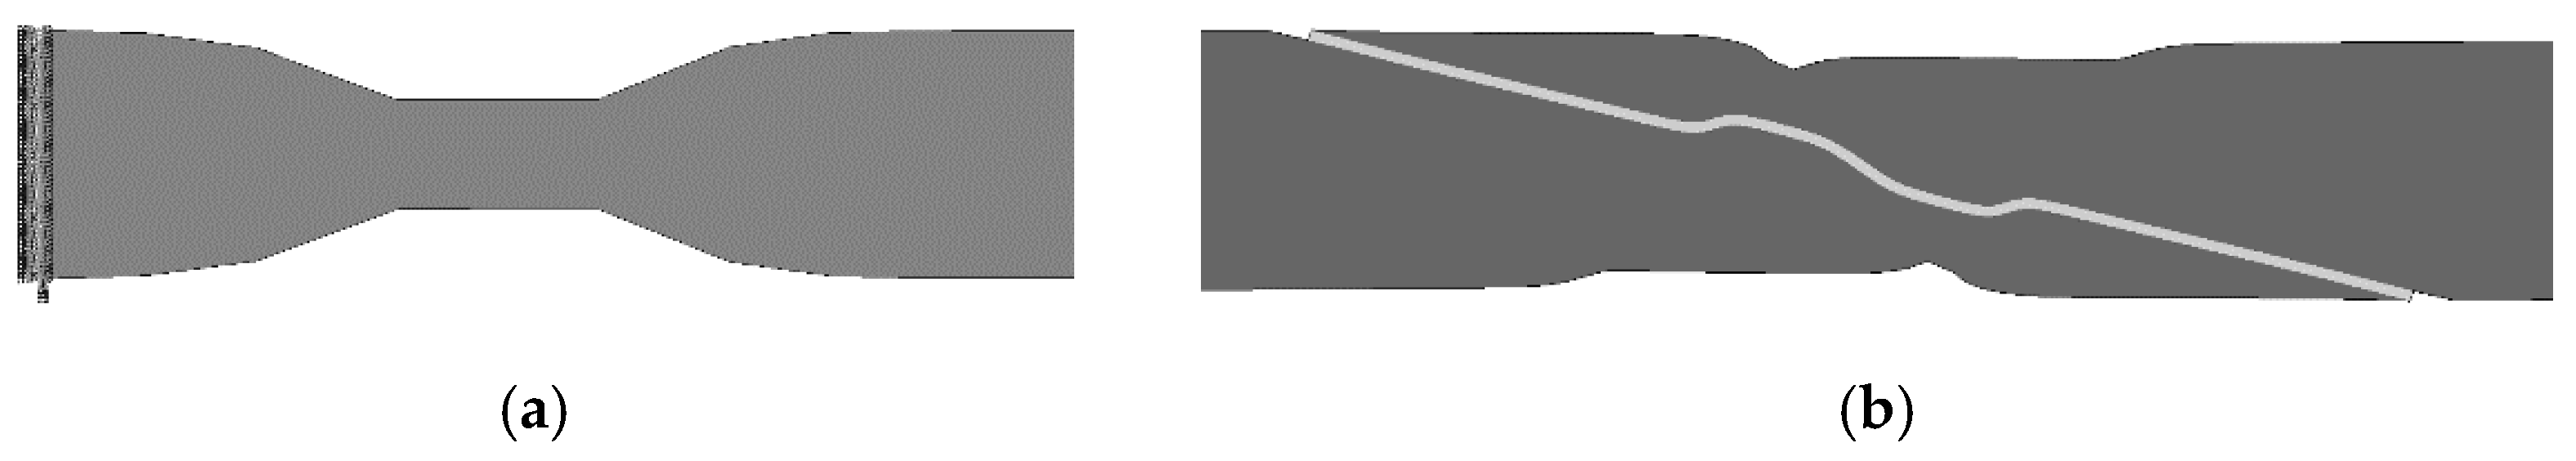
2.4. Model Pre-Processing
3. Results and Discussion
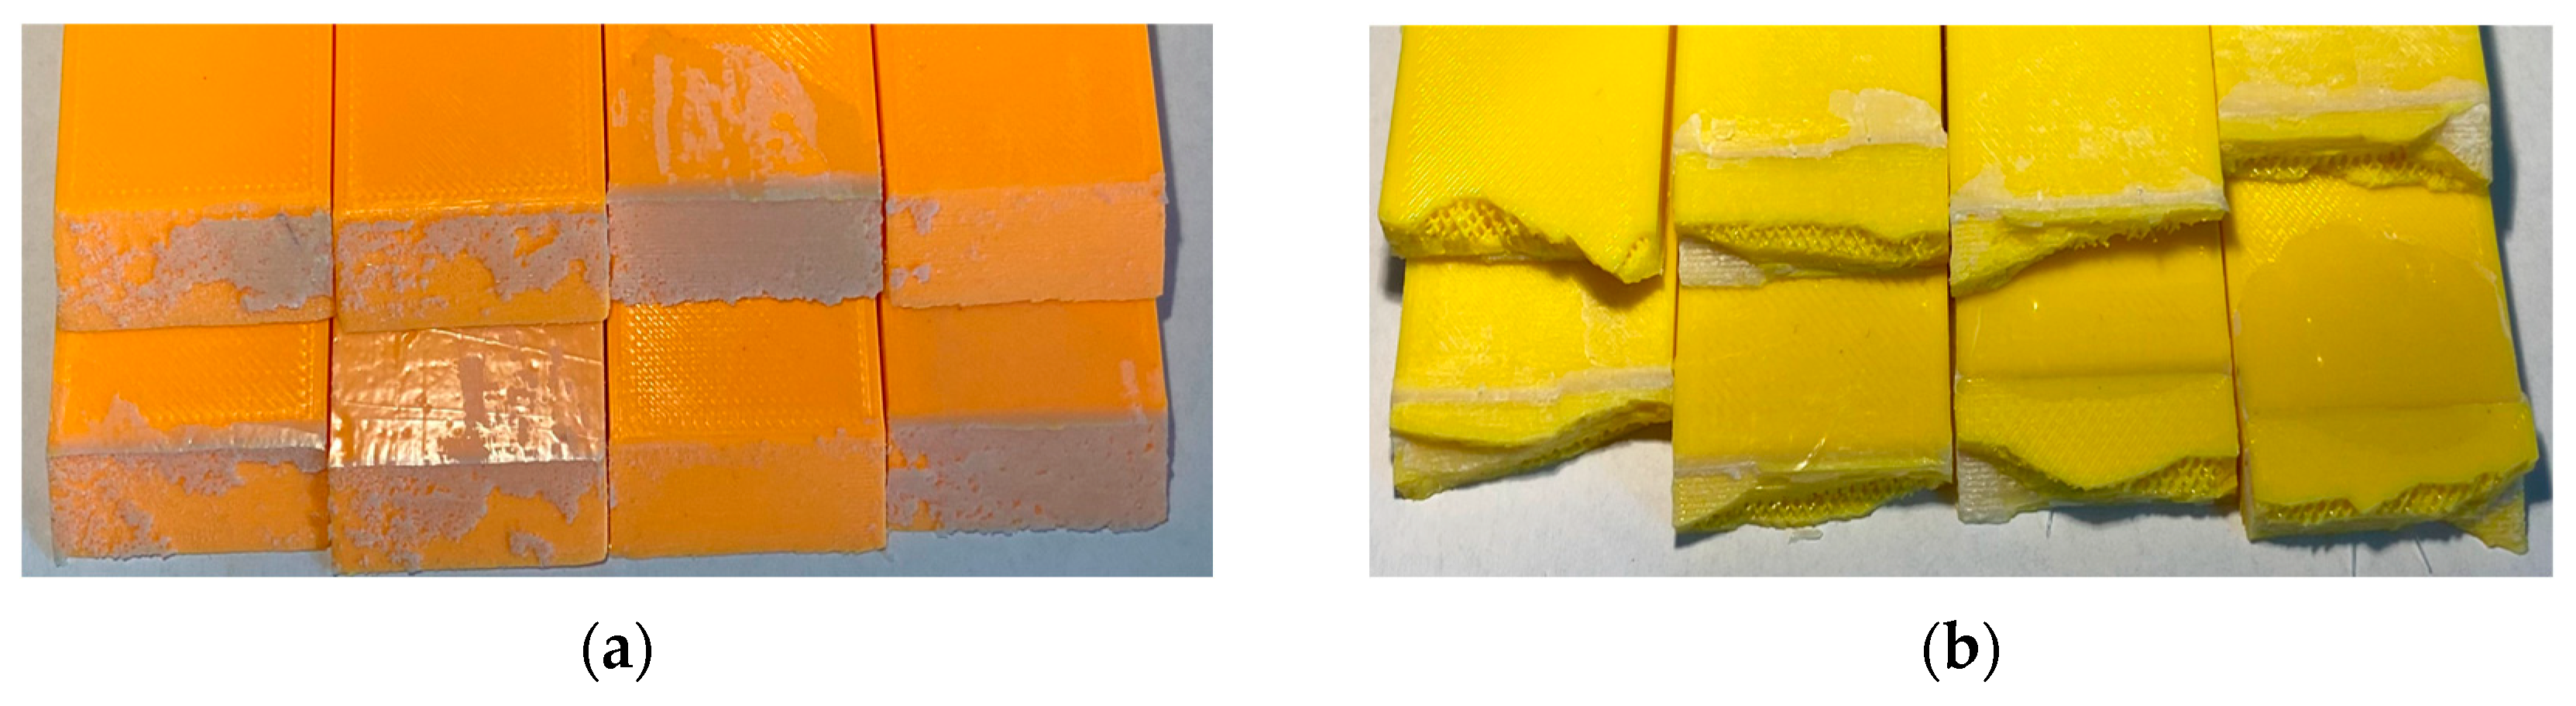
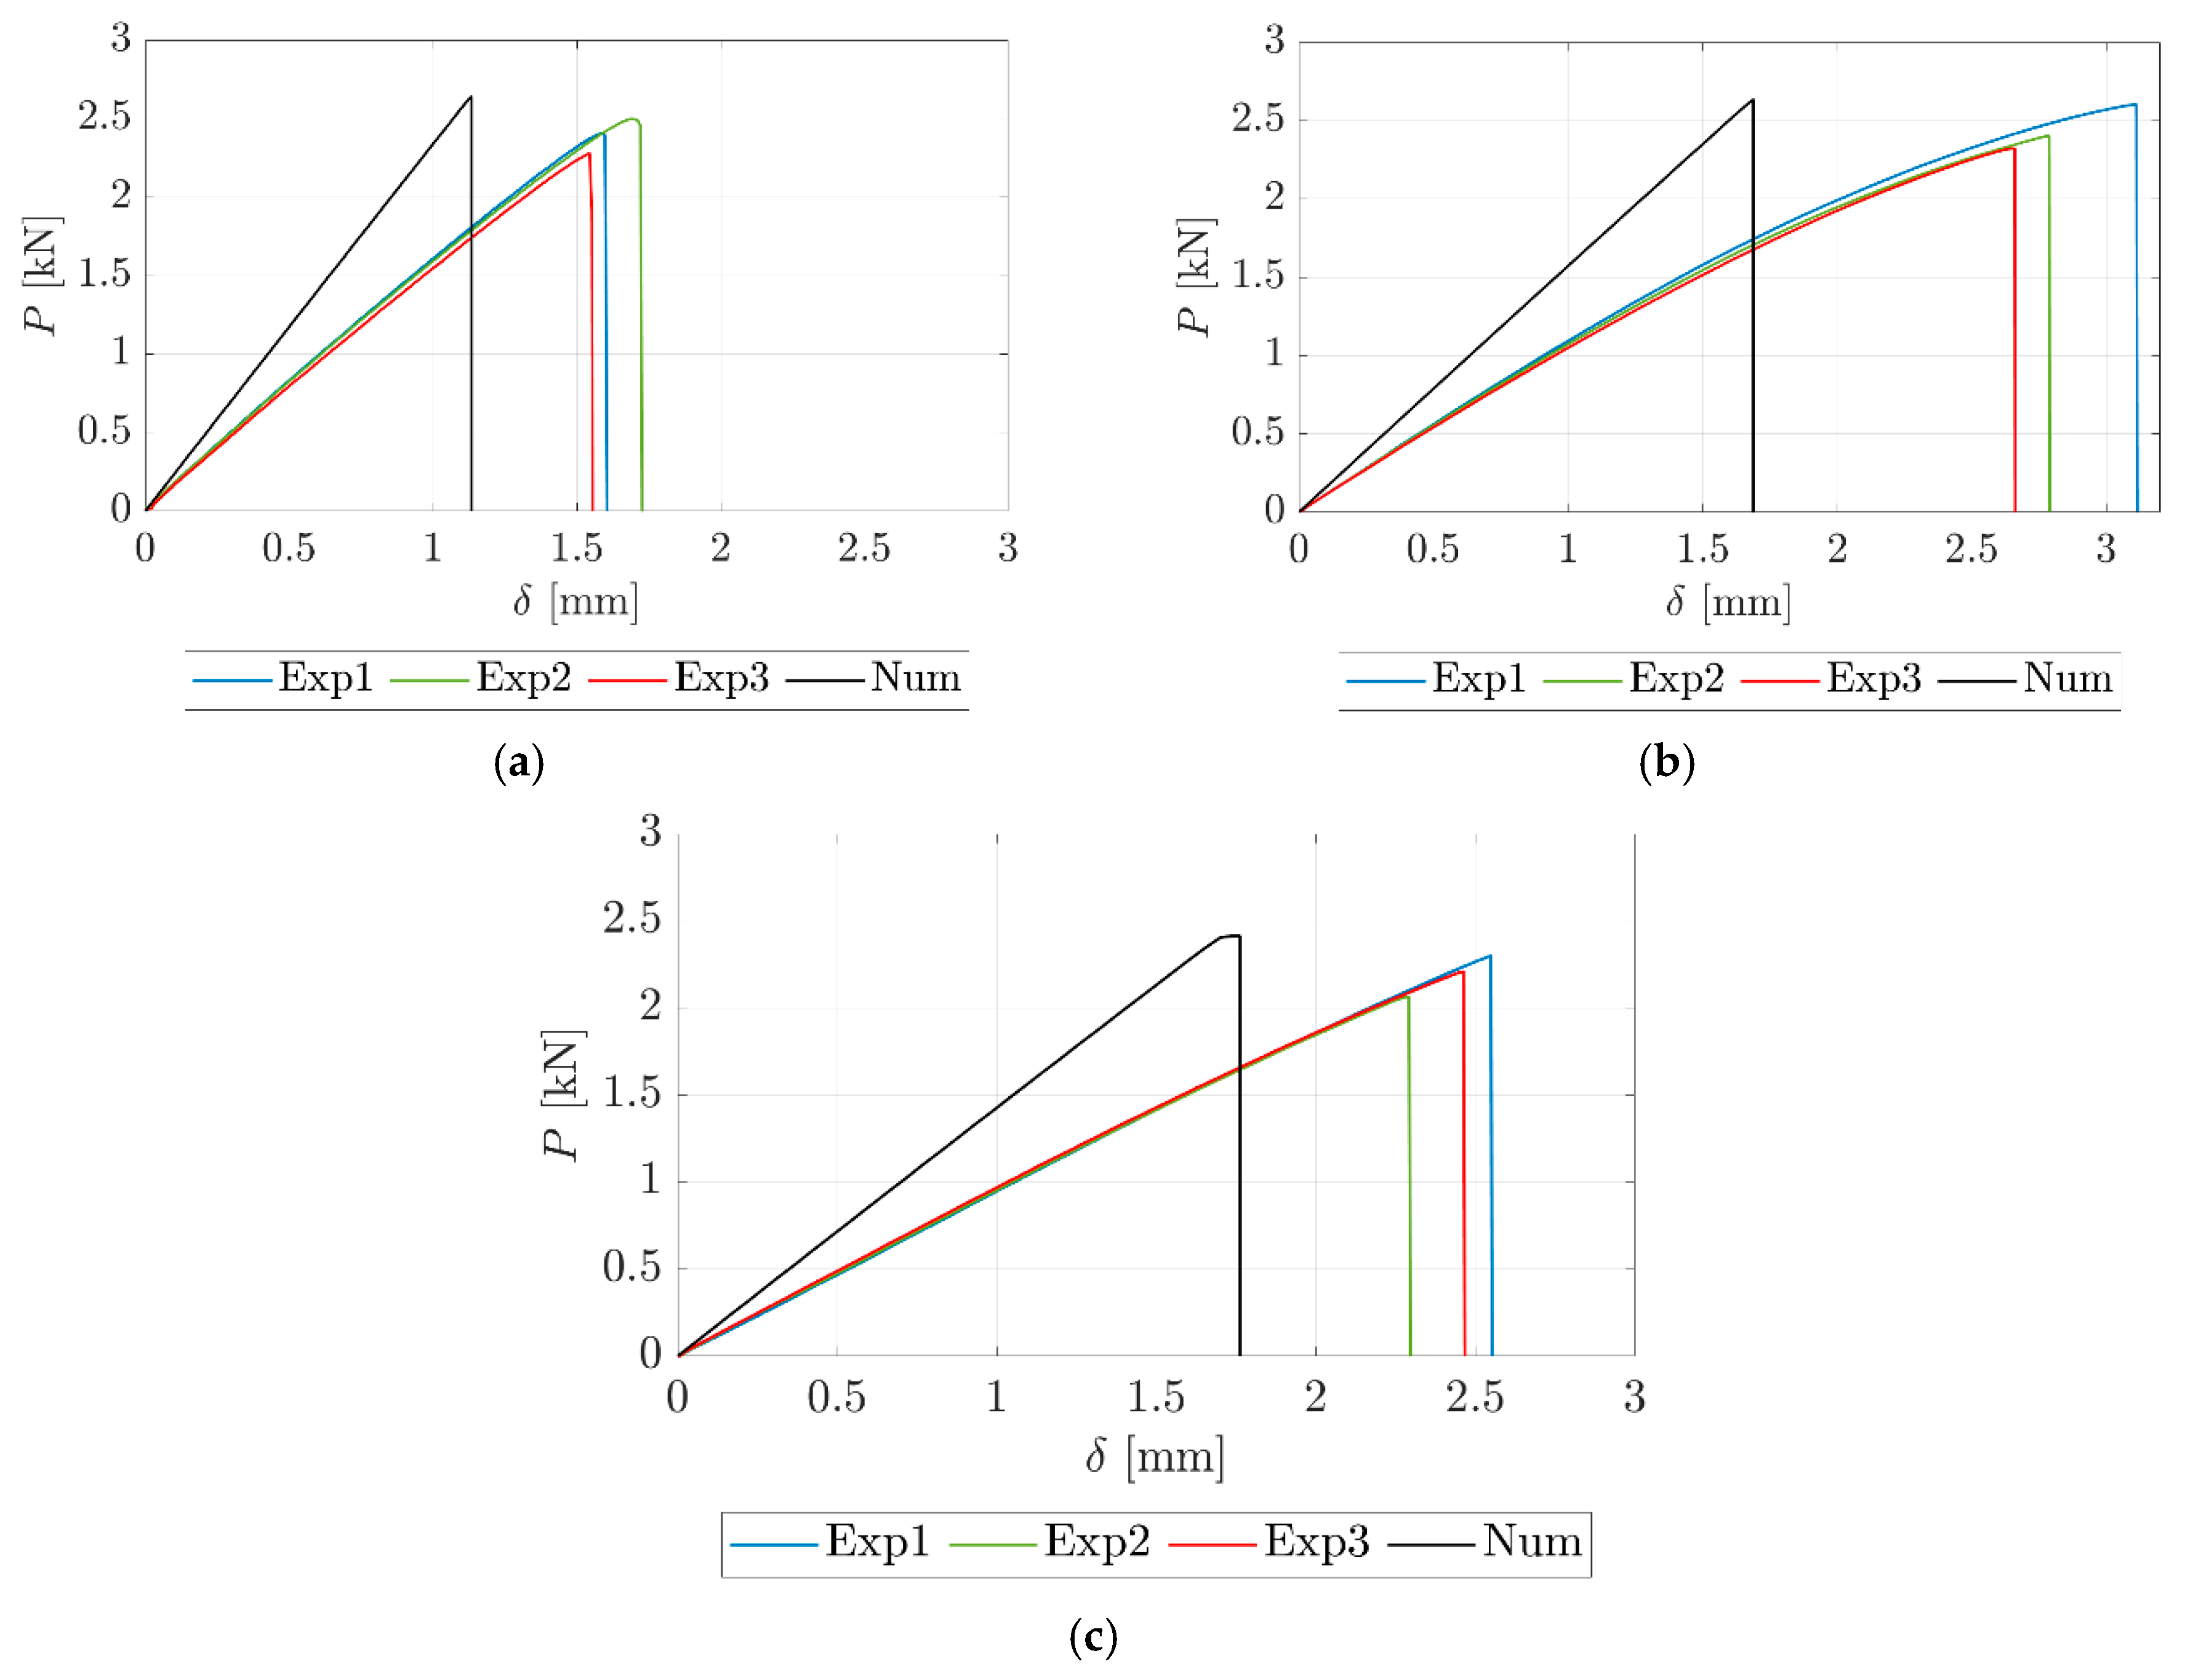
3.1. Failure Modes
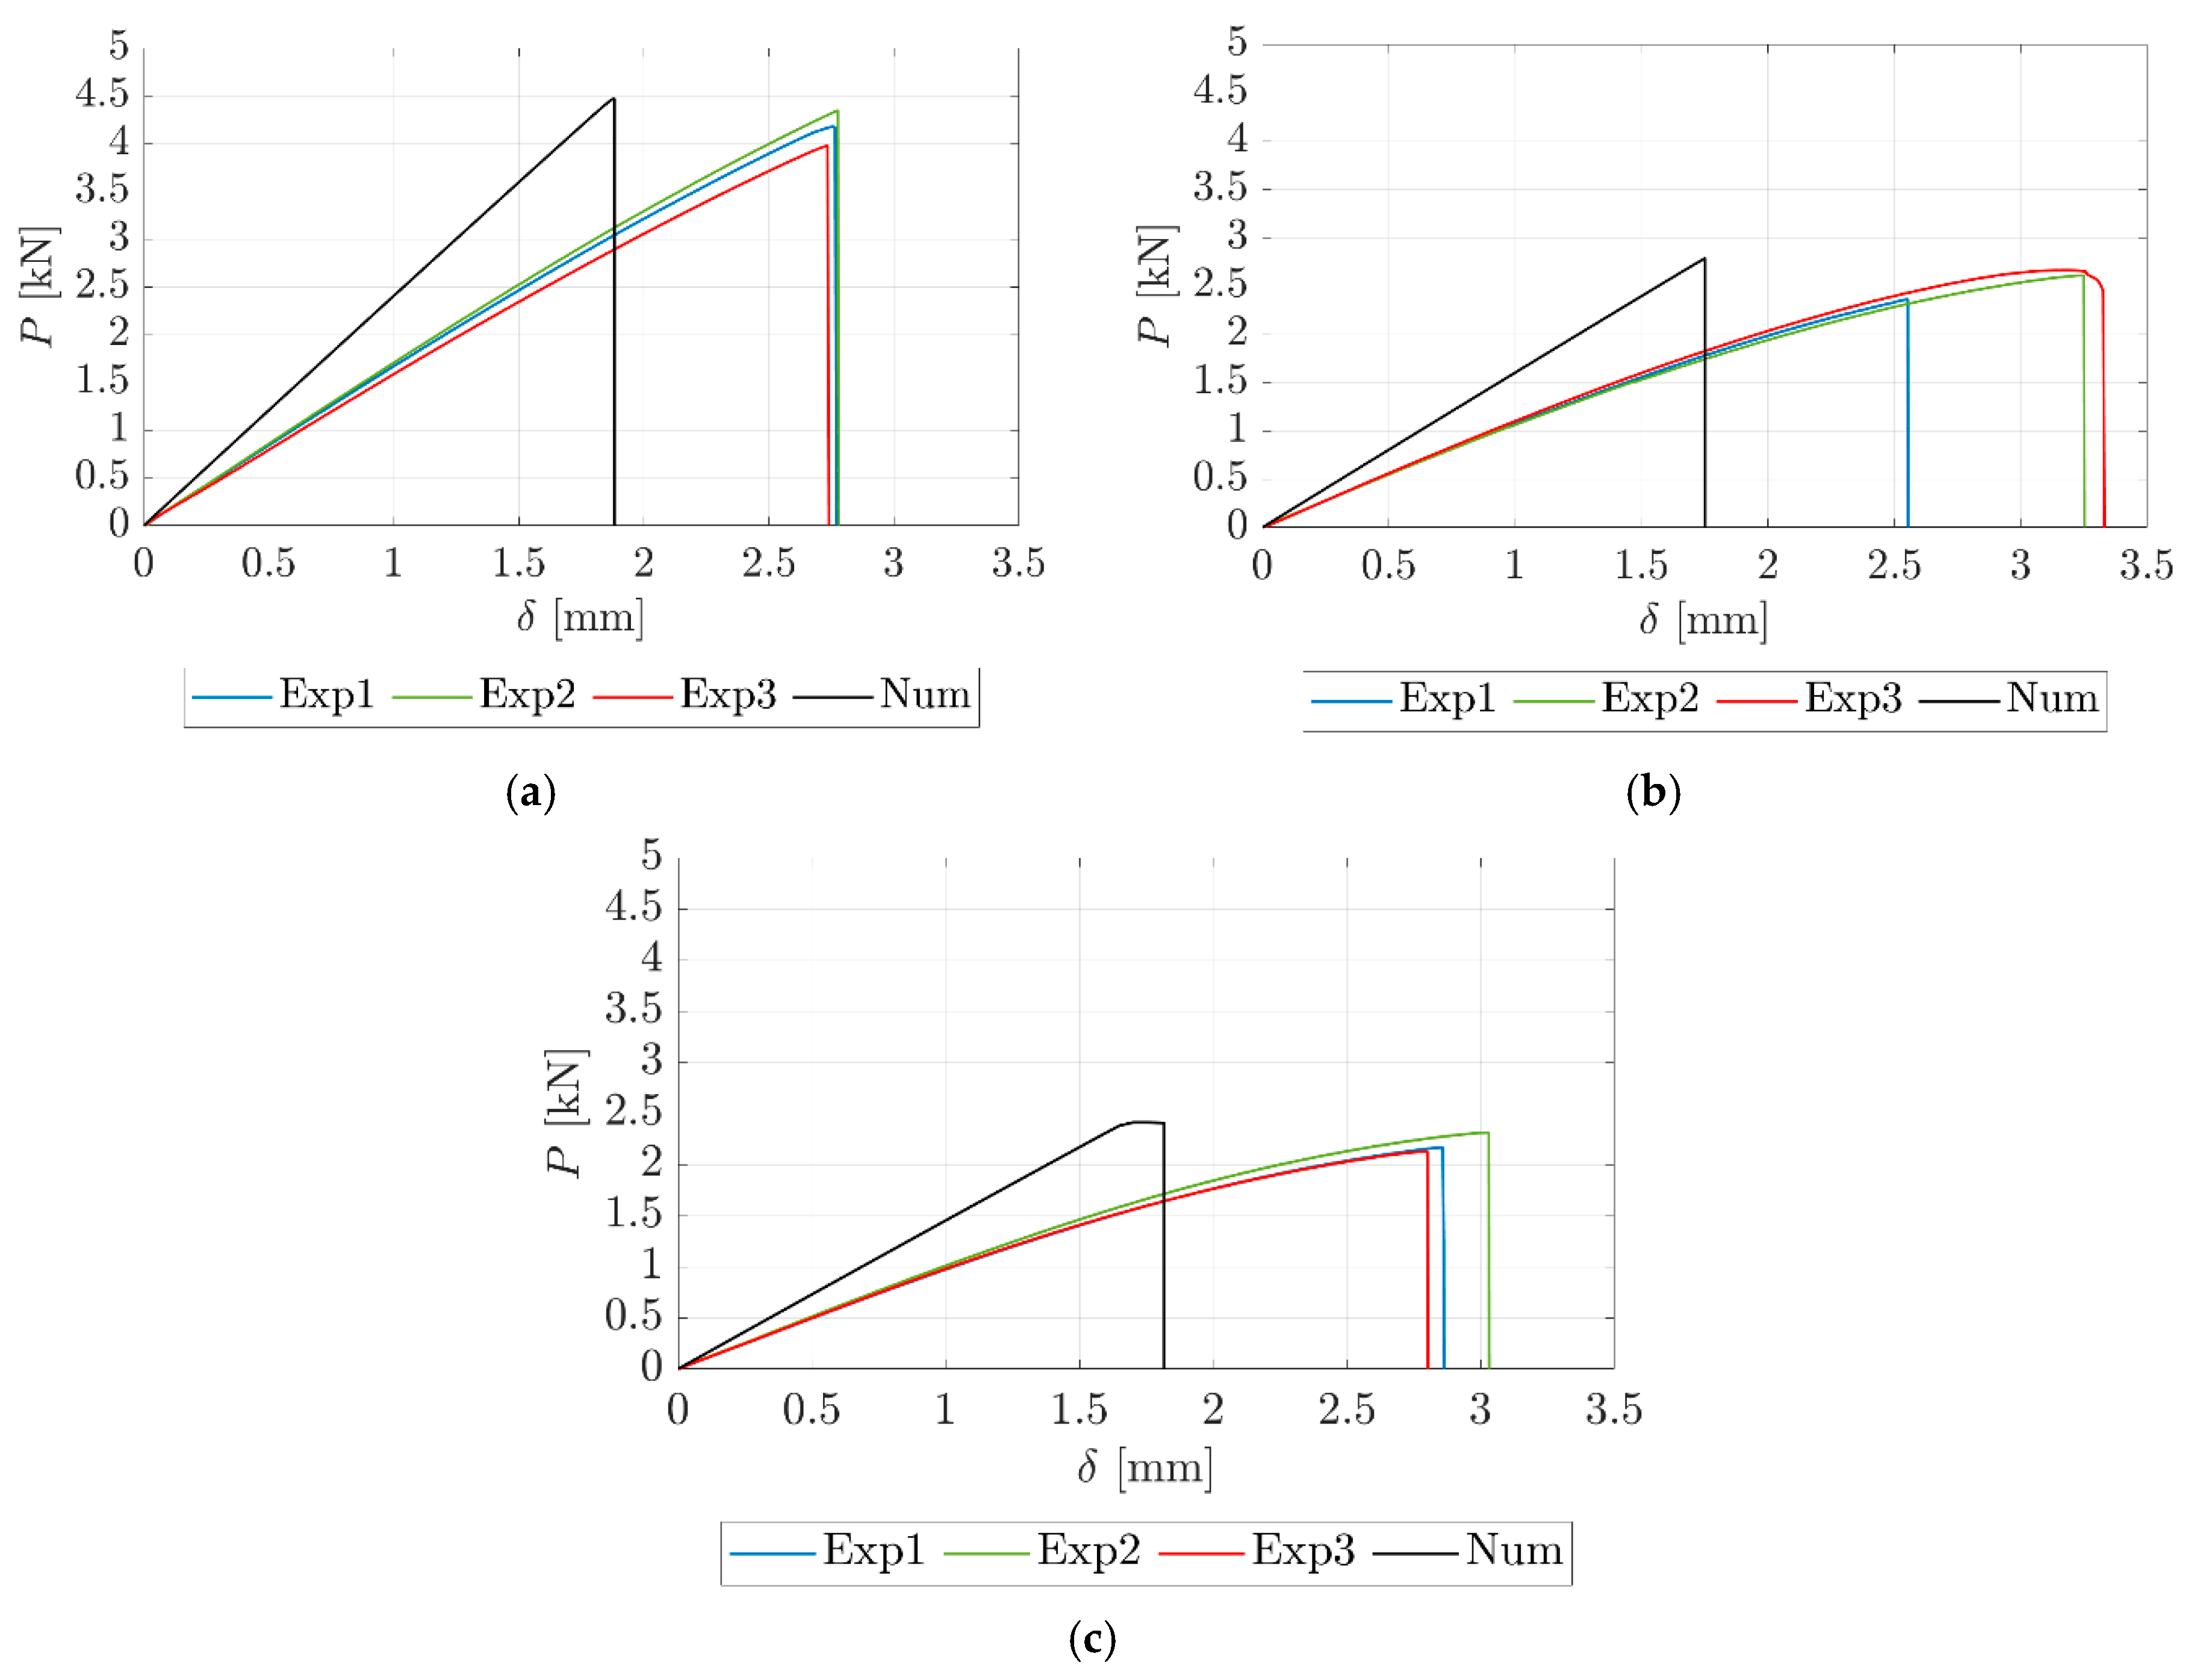
3.2. Joint Strength
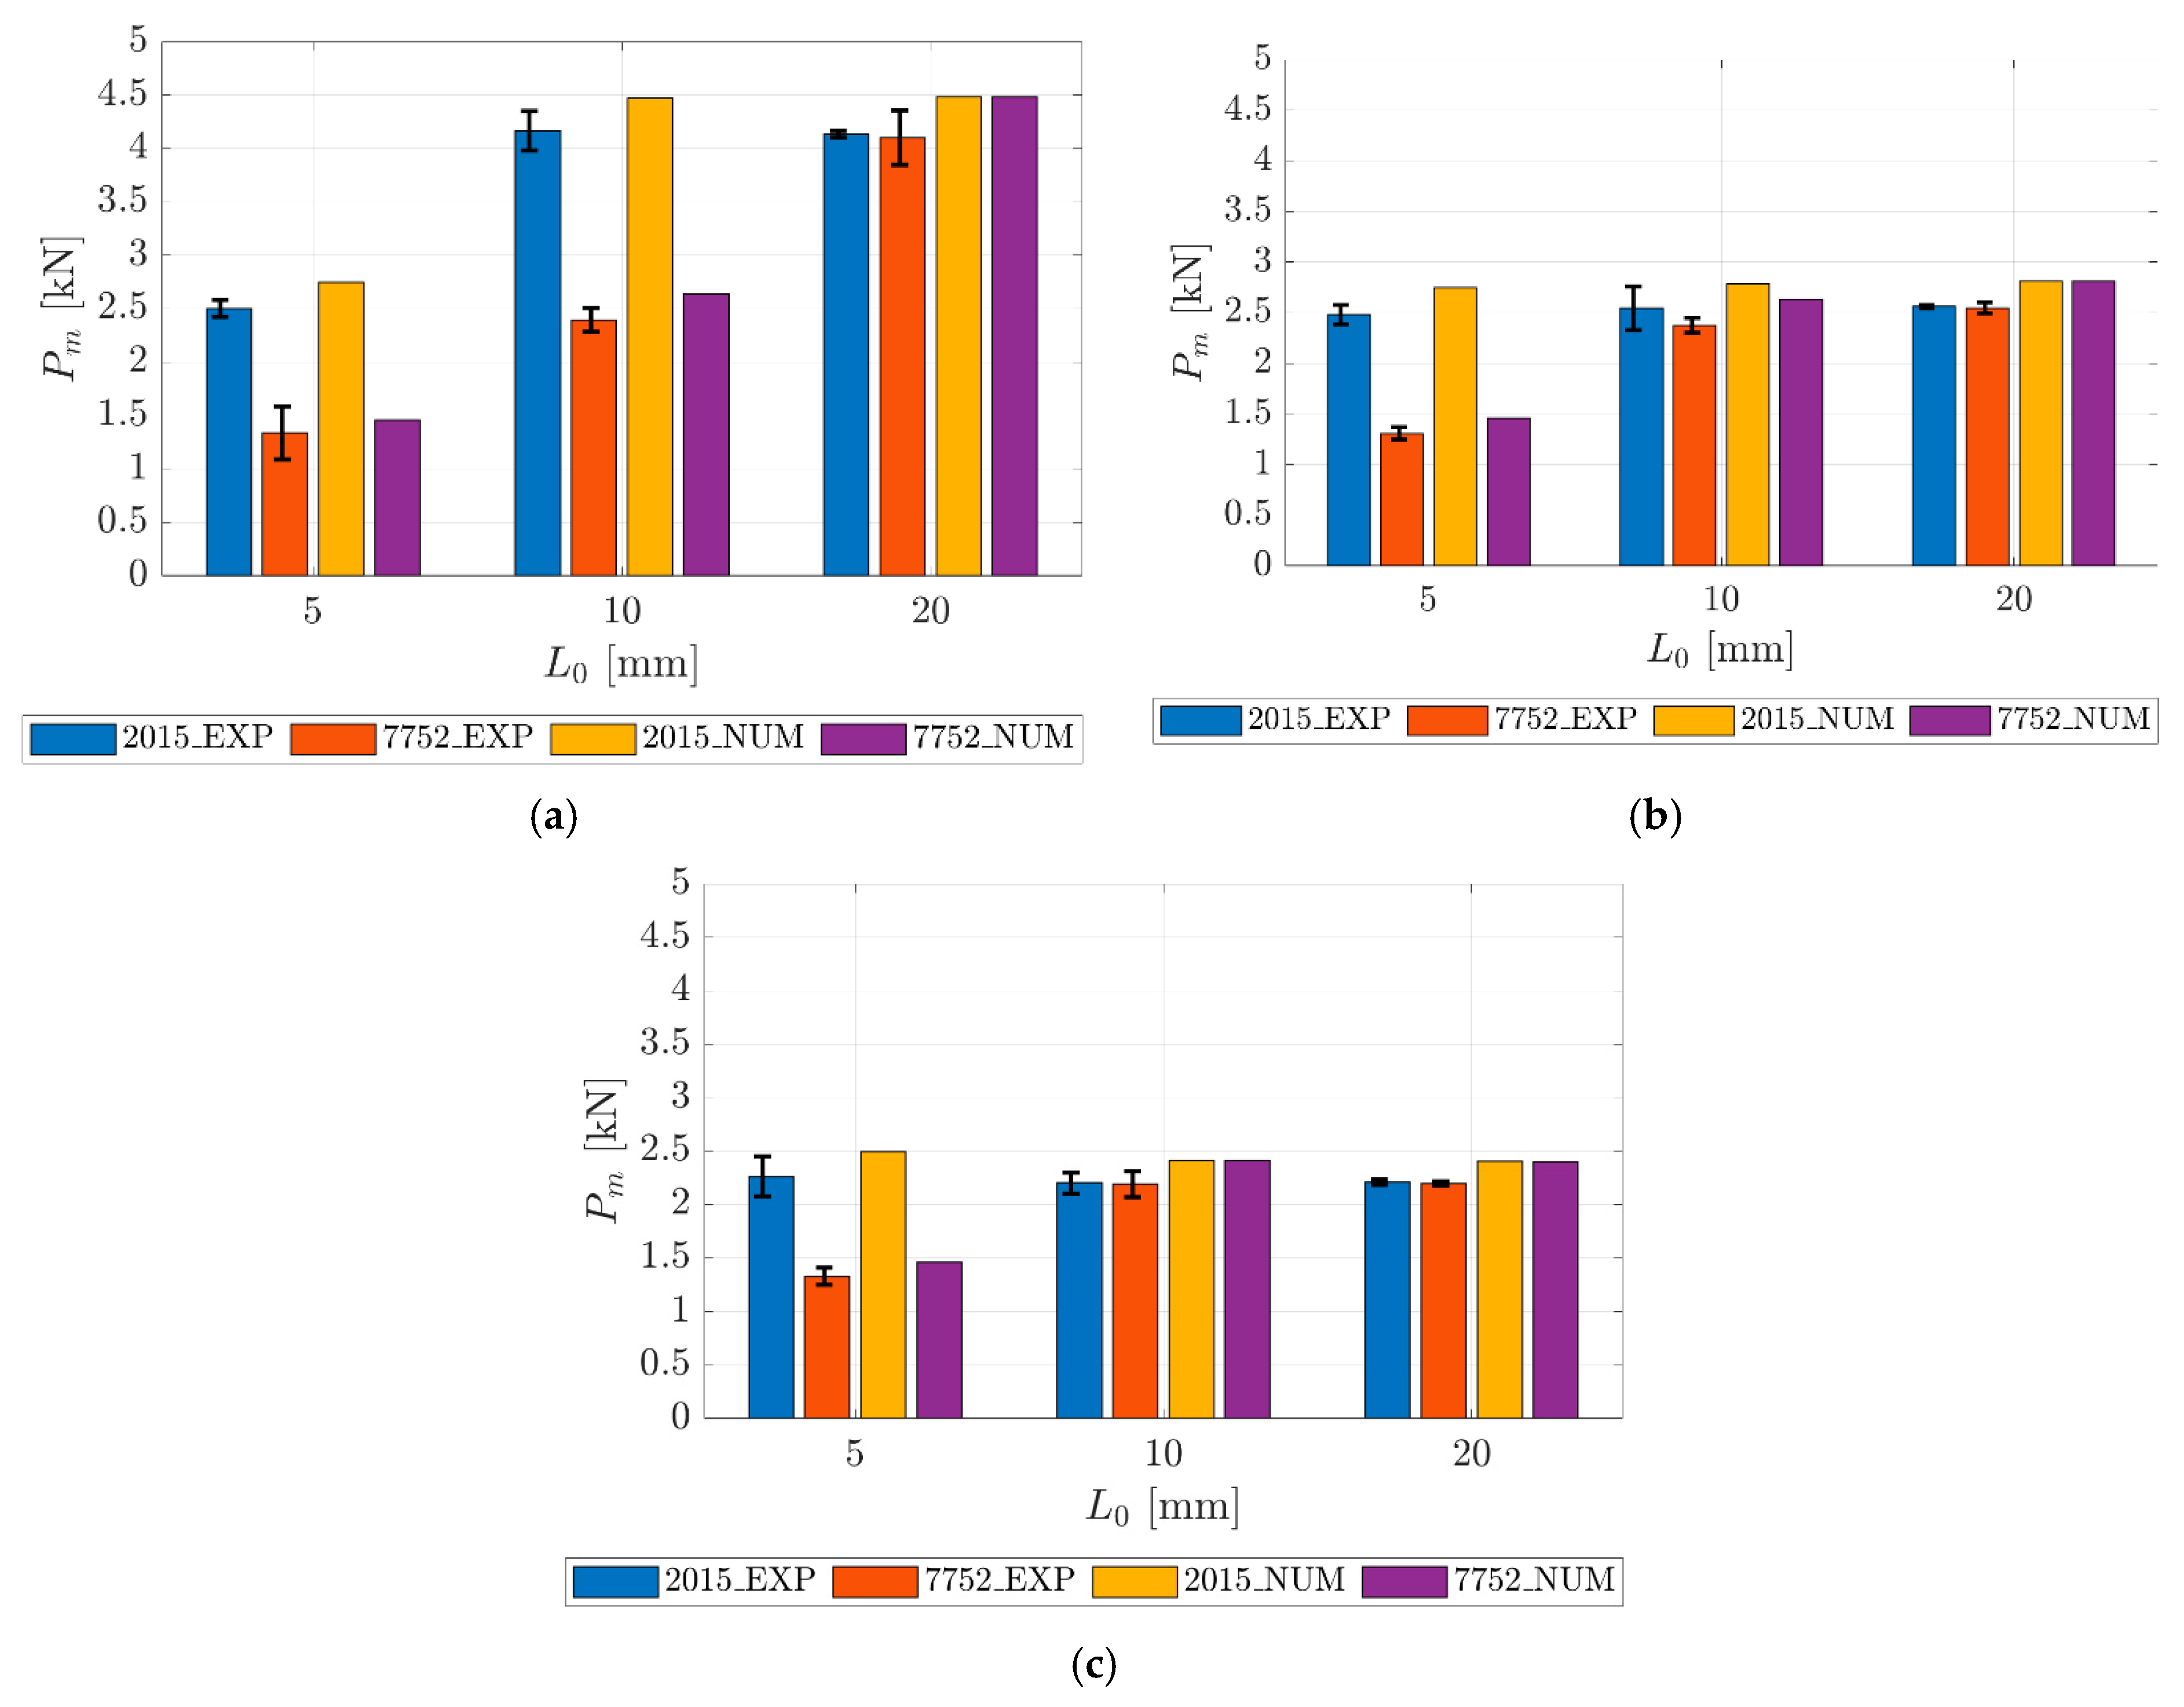
- In the joints with PLA and Araldite® 2015, Pm increases by 66.5% for LO = 5–10 mm, as a result of different types of failure, including cohesive and adherend failures, respectively. For LO = 10–20 mm, the same failure was obtained, and no increase is noted. However, using Sikaforce® 7752, Pm increased to 79.0% and 71.4% for LO = 5–10 mm and LO = 10–20 mm, respectively, as cohesive failures were always obtained. Comparing both adhesives with LO = 5 mm, the SJs with Araldite® 2015 were 87.0% more resistant than those with Sikaforce® 7752. The same fact is obtained for LO = 10 and 20 mm, with Araldite® 2015 being more resistant by 74.0% and 0.8%. The minor percentile difference for LO = 20 mm is related to the adhesive’s mechanical properties, such as stiffness, strength, and ductility. For higher LO, Sikaforce® 7752 increases its load capacity as it is a more flexible and ductile adhesive than Araldite® 2015, which is stiffer and more brittle.
- For the SJs with ABS and Araldite® 2015, the failure mode always occurred due to the adherend. For the different LO values, no increase in Pm was noticed. For Sikaforce® 7752 with LO = 5–10 mm, a Pm increase of 81.6% was obtained, mainly due to different failure modes in each length. When the failure occurs in the adherend at LO = 10–20 mm, the Pm increase was reduced to 7.2%. This slight increase results from the elastic properties of the ABS shown in Section 2.1. For the different LO values, Araldite® 2015 was always superior to Sikaforce® 7752: 89.8% for LO = 5 mm, 7.1% for LO = 10 mm, and 0.6% for LO = 20 mm.
- Using PETG and Araldite® 2015, similar to the ABS results, no increase in Pm was detected due to identical adherend failures. Using Sikaforce® 7752, Pm increased 65% for LO = 5–10 mm. Despite the same failure mode, for LO = 5–10 mm, the pull-out force transforms in shear force due to an increase in α, allowing the adherend and the adhesive to resist more forces. For LO = 10–20 mm, the increase was nearly 0%. When comparing the different adhesives, Araldite® 2015 was superior to Sikaforce® 7752. For LO = 5 mm, Pm for Araldite® 2015 was 70.5% higher compared to Sikaforce® 7752. This percentage reduces to nearly 0.5% for LO = 10 and 20 mm.
3.3. Assembly Stiffness
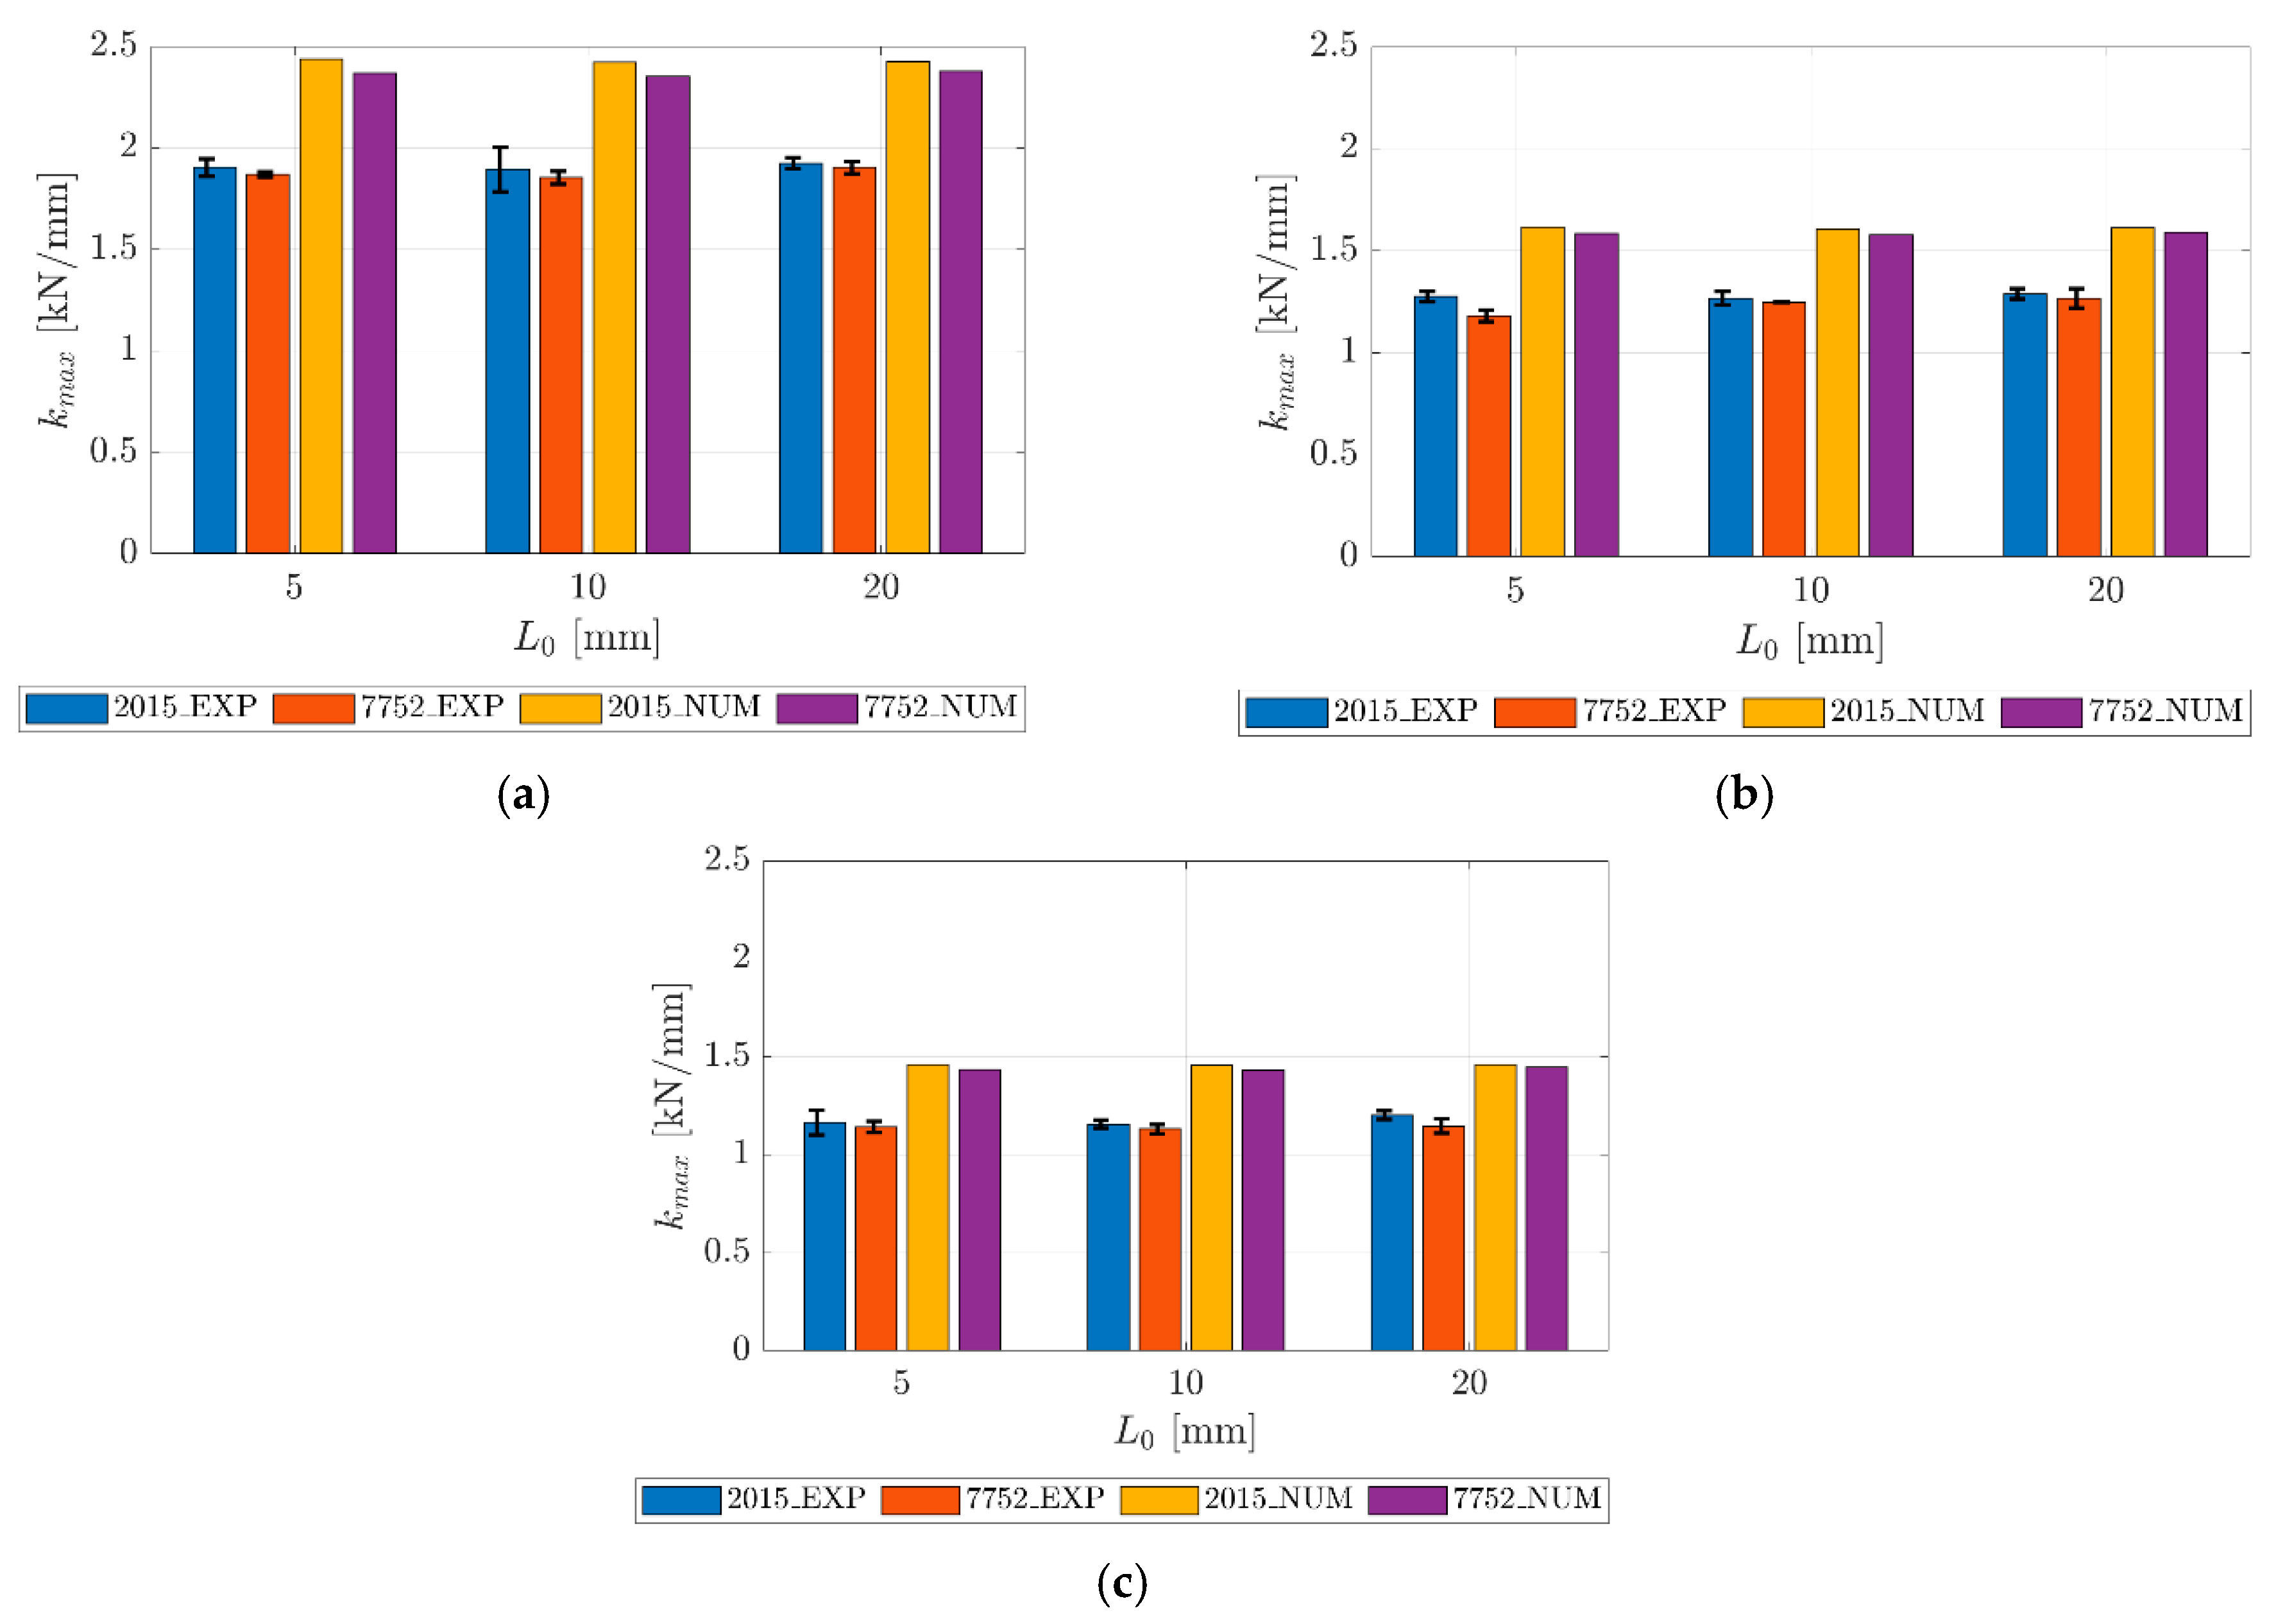
- For joints with PLA and adhesive Araldite® 2015, it is observed that Km values are higher with LO = 5 mm than with LO = 10 mm, specifically, 0.5% higher. For LO = 10–20 mm, the stiffness increases by 1.6%. Using the adhesive Sikaforce® 7752, Km was higher at LO = 5 mm than at LO = 10 mm, possibly due to better fusion of the layers, allowing it to withstand more load without deforming. The difference between LO = 5 and 10 mm was 0.9%. Between LO = 10 and 20 mm, a stiffness increase of 2.8% was recorded. In the joints with PLA, a higher Km was recorded with the adhesive Araldite® 2015 when compared to Sikaforce® 7752 by 1.8%, 2.2%, and 1.1% for LO = 5, 10, and 20 mm, respectively.
- In the joints with ABS adherends and adhesive Araldite® 2015, a higher stiffness was recorded with LO = 5 mm than with LO = 10 mm, specifically, 0.6% higher. Between LO = 10–20 mm, an increase of 1.7% was recorded. For the adhesive Sikaforce® 7752, the increase in Km was gradual at 5.8% between LO = 5 and 10 mm and 1.4% between LO = 10 and 20 mm. With ABS, the stiffness of the adhesive joints with Araldite® 2015 was 8.0, 1.5, and 1.8% higher when compared to the stiffness of the joints with Sikaforce® 7752 for LO = 5, 10, and 20 mm, respectively.
- The joints with PETG adherends recorded a higher stiffness for both adhesives with LO = 5 mm than with LO = 10 mm. For the adhesive Araldite® 2015, the difference was 0.7%, and it was 0.8% for the adhesive Sikaforce® 7752. Between LO = 10 and 20 mm, a 3.9% increase in stiffness was recorded with the adhesive Araldite® 2015 and 1.3% with the adhesive Sikaforce® 7752. For PETG, the percentage differences were 2.0%, 2.2%, and 4.9% higher with adhesive Araldite® 2015 than with Sikaforce® 7752 for LO = 5, 10, and 20 mm, respectively.
- In terms of the CZM stiffness numerical model results, it can be observed (in Figure 13) that the values are overestimated for all investigated scenarios but faithfully predict the trend of the stiffness. Here, the PETG samples have the highest value, followed by the ABS and PLA samples. The overestimated values are 18–21% for PETG, 20–26% for ABS, and 20–22% for PLA. Also, similar to the experimental results, within each group, the joint size and adhesive seem to be irrelevant, whereas the adherend is the biggest contributor to the stiffness value.
3.4. Failure Energy
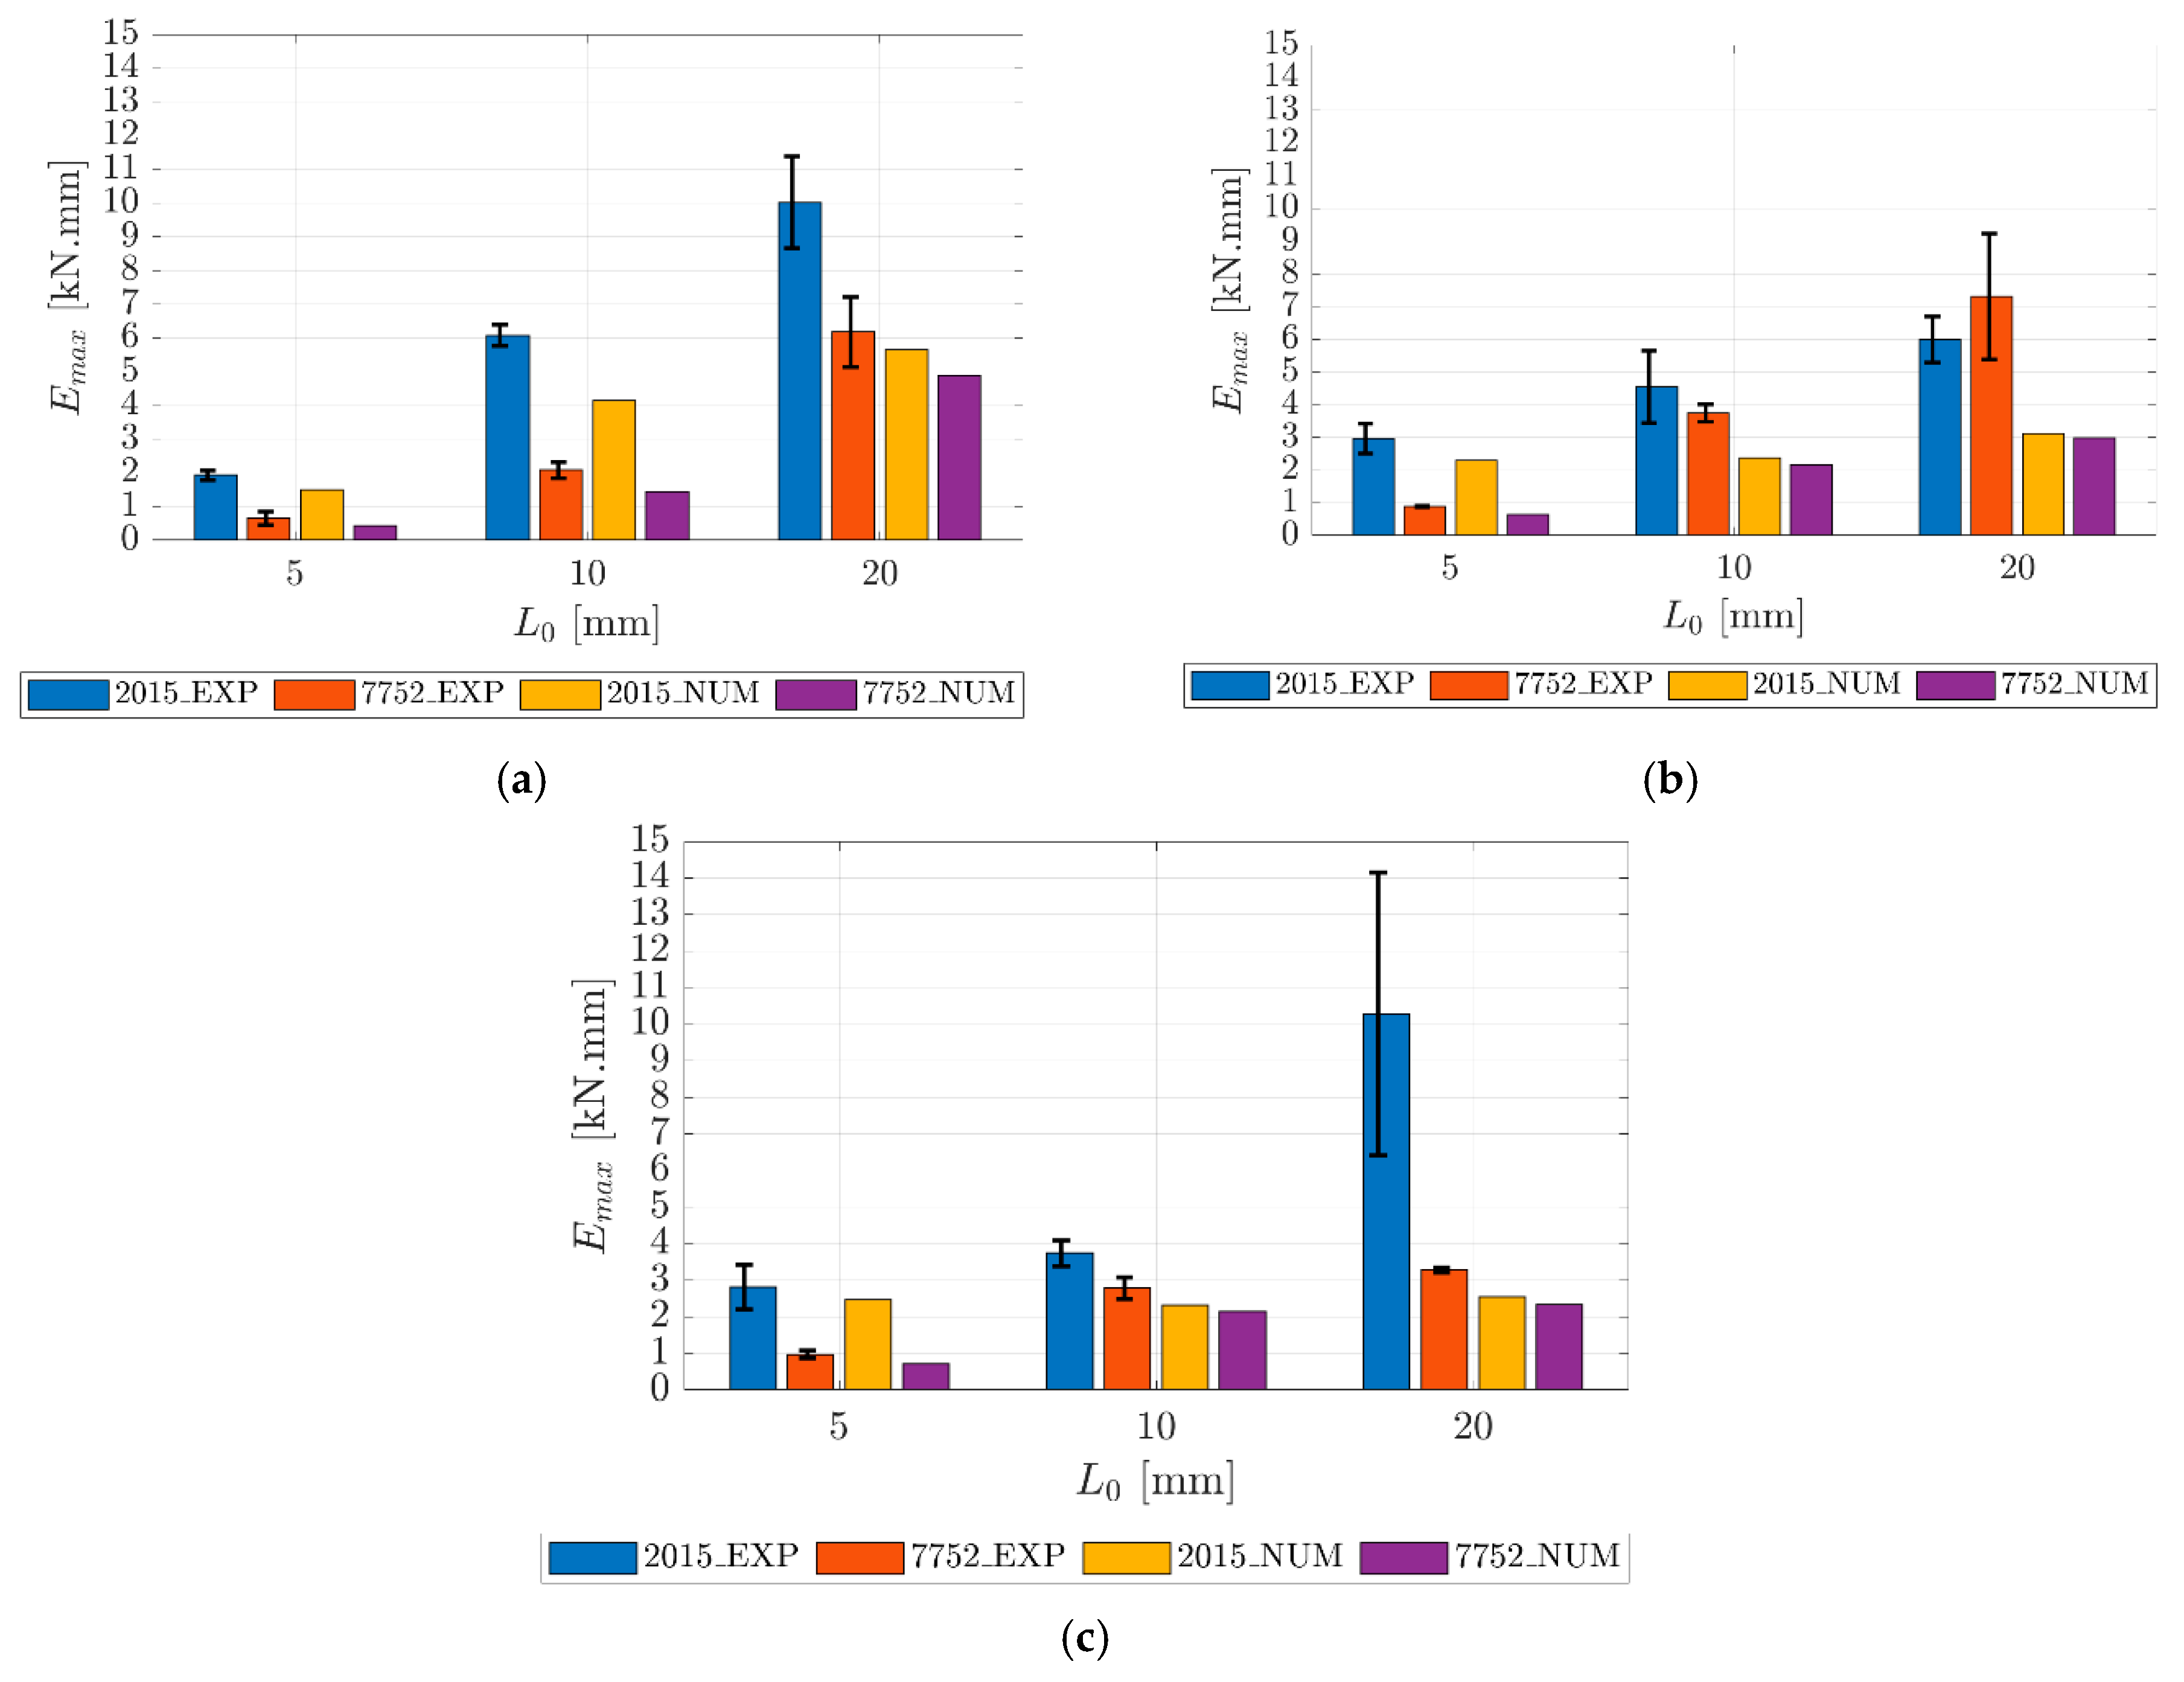
- In the joints with PLA and Araldite® 2015 adhesive, an increase in Emax of 214.8% is observed between LO = 5 and 10 mm and 64.9% between LO = 10 and 20 mm. For LO = 5 mm, the rupture occurred in the adhesive with a Pmax relatively lower than that obtained with LO =10 mm where the rupture occurred in the adherend. Between LO = 10 and 20 mm, the increase is significantly reduced due to the fracture that occurs in the adherend, resulting in a similar Pmax. However, with LO = 20 mm, there is a slight plasticisation of the adherend prior to rupture, which causes the displacements at rupture to be higher with LO = 20 mm. Thus, a higher Emax is obtained as well. For the Sikaforce® 7752 adhesive, the fractures always occurs in the adhesive, which means that there is not much difference in the increase in Emax between the different LO values. Between LO = 5 and 10 mm, Emax increased by 220.0%. Between LO = 10 and 20 mm, it increased by 197.4%. With the PLA adhesive, the Araldite® 2015 adhesive shows a higher Emax than the Sikaforce® 7752 adhesive with increases of 197.3%, 192.4%, and 62.1% for LO = 5, 10, and 20 mm, respectively. These differences are due to the failures in the adhesive with Sikaforce® 7752, which resulted in Pmax values that were relatively lower than those obtained with the Araldite® 2015 adhesive.
- In the joints with the ABS adherend, the increases in Emax values that were observed with the use of the adhesive Araldite® 2015 were 53.5% and 31.8% for LO = 5–10 mm and LO = 10–20 mm, respectively. With the Sikaforce® 7752 adhesive, increases in Emax of 322.3% and 95.1% were observed for the intervals of LO = 5 to 10 mm and LO = 10 to 20 mm. The significant increase in Emax between LO = 5–10 mm is due to the Pmax and displacements recorded with LO = 10 mm being much higher than those recorded with LO = 5 mm. With ABS, the Araldite® 2015 adhesive was superior to Sikaforce® 7752 for LO = 5 and 10 mm, with superiority values of 234.2% and 21.5%. The difference of 234.2% is due to the Pmax obtained with the adhesive Sikaforce® 7752 being relatively lower because of the rupture occurring practically in the adhesive. However, for LO = 20 mm, the trend is reversed, and there is a clear improvement in the Sikaforce® 7752 adhesive joint when compared to Araldite® 2015.
- In the joints with PETG adherends using the Araldite® 2015 adhesive, the increase in Emax was 32.9% and 175.0% for LO = 5–10 mm and LO = 10–20 mm, respectively. The increase of 175.0% is due to the plasticisation observed in the adherends, which caused a significant increase in the displacement at rupture. With the adhesive Sikaforce® 7752, the increases in Emax observed were 186.4% and 17.9% for LO = 5–10 mm and LO = 10–20 mm, respectively. The increase of 186.4% is due to the different modes of failure, including cohesive failure in the adhesive with LO = 5 mm and adhesive failure with LO = 10 mm, which cause substantial increases in the Pmax and displacements in the adhesive failure. The joints with PETG show a superior performance of Emax with the adhesive Araldite® 2015 over Sikaforce® 7752 with increases of 189.3%, 34.2%, and 213.0% for LO = 5, 10, and 20 mm, respectively. Among the different adherend materials used in the applications of adhesive Araldite® 2015, PLA showed the highest energy absorption, followed by PETG and ABS. For the Sikaforce® 7752 adhesive, the order of performance was ABS, followed by PLA and PETG.
- The numerical CZM fracture energy model predictions show that, for all adherends and adhesives, as the SJ angle increases, so does the fracture energy. Overall, the numerical predictions underestimate the fracture energy when compared with the experimental data. PLA samples show differences of 21–44%, ABS samples show differences of 22–59%, and PETG samples show differences of 12–75%.
4. Conclusions
- Joint failure modes: Cohesive failures in the adhesive layer predominantly occurred in joints with PLA adherends and Sikaforce® 7752, while adherend failures were more common in joints with ABS and PETG, regardless of the adhesive.
- Peak load numerical results showed strong agreement with experimental data, with peak load deviations of 7–10%, demonstrating the reliability of the CZM approach to predict the peak load of SJs.
- Stiffness values are similar when comparing the performance of the same adherend regardless of the LO value or the adhesive. This shows the insensitivity of the SJ geometry and adhesive to the stiffness results. The PETG adherend shows the highest SL joint stiffness, followed by ABS and then PLA.
- Stiffness values are numerically overpredicted by 18–26% for all joint scenarios. However, the trend of the experimental results is captured, showing that the SJs depend more on the adherend rather than on the adhesive or joint angle.
- The joints with the Araldite® 2015 adhesive exhibit higher energy than the Sikaforce® 7752 overall. Among the adherends, PLA was the material that allowed the joints to absorb more energy.
- The numerical CZM models underpredict the fracture energy for all scenarios with predictions falling between 12% and 75%. This result shows that the current model does not perform well to predict the fracture energy and that more research is required for the prediction of this characteristic.
- A major advancement in the state-of-the-art described in Section 1 is presented, namely by validating the CZM approach on a new geometry and performing a systematic study on the effect of adherend and adhesive effect, including both failure modes and mechanical behaviour.
- Overall, the present investigation shows that the application of the CZM method, as implemented herein, to predict adhesive joint performance is excellent for determining the peak load at failure and still acceptable to analyse the fracture stiffness but falls very short on the prediction of the failure energy. Further investigation is required for the implementation of this methodology to properly predict all the relevant fracture properties.
Author Contributions
Funding
Data Availability Statement
Conflicts of Interest
References
- Kiraz, A.; Canpolat, O.; Özkurt, C.; Taşkın, H. Analysis of the factors affecting the Industry 4.0 tendency with the structural equation model and an application. Comput. Ind. Eng. 2020, 150, 106911. [Google Scholar]
- Bahnini, I.; Rivette, M.; Rechia, A.; Siadat, A.; Elmesbahi, A. Additive manufacturing technology: The status, applications, and prospects. Int. J. Adv. Manuf. Technol. 2018, 97, 147–161. [Google Scholar]
- Noorani, R. 3D Printing; Taylor & Francis: Boca Raton, FL, USA, 2018; Volume 1, p. 294. [Google Scholar]
- Olawumi, M.A.; Oladapo, B.I.; Ikumapayi, O.M.; Akinyoola, J.O. Waste to wonder to explore possibilities with recycled materials in 3D printing. Sci. Total Environ. 2023, 905, 167109. [Google Scholar] [CrossRef]
- Herderick, E.D. Progress in Additive Manufacturing. JOM 2015, 67, 580–581. [Google Scholar]
- Praveena, B.A.; Lokesh, N.; Santhosh, N.; Praveena, B.L.; Vignesh, R. A comprehensive review of emerging additive manufacturing (3D printing technology): Methods, materials, applications, challenges, trends and future potential. Mater. Today Proc. 2021, 52, 1309–1313. [Google Scholar]
- Jandyal, A.; Chaturvedi, I.; Wazir, I.; Raina, A.; Ul Haq, M. 3D printing—A review of processes, materials and applications in industry 4.0. Sustain. Oper. Comput. 2022, 3, 33–42. [Google Scholar]
- Iftekar, S.F.; Aabid, A.; Amir, A.; Baig, M. Advancements and Limitations in 3D Printing Materials and Technologies: A Critical Review. Polymers 2023, 15, 2519. [Google Scholar] [CrossRef] [PubMed]
- Pérez, M.; Carou, D.; Rubio, E.M.; Teti, R. Current advances in additive manufacturing. Procedia CIRP 2020, 88, 439–444. [Google Scholar]
- Bikas, H.; Stavropoulos, P.; Chryssolouris, G. Additive manufacturing methods and modelling approaches: A critical review. Int. J. Adv. Manuf. Technol. 2016, 83, 389–405. [Google Scholar] [CrossRef]
- Fu, P.; Li, H.; Gong, J.; Fan, Z.; Smith, A.T.; Shen, K.; Khalfalla, T.O.; Huang, H.; Qian, X.; McCutcheon, J.R.; et al. 4D printing of polymers: Techniques, materials, and prospects. Prog. Polym. Sci. 2022, 126, 101506. [Google Scholar]
- Yap, Y.L.; Toh, W.; Koneru, R.; Lin, R.; Chan, K.I.; Guang, H.; Chan, W.Y.B.; Teong, S.S.; Zheng, G.; Ng, T.Y. Evaluation of structural epoxy and cyanoacrylate adhesives on jointed 3D printed polymeric materials. Int. J. Adhes. Adhes. 2020, 100, 102602. [Google Scholar] [CrossRef]
- Chierici, M.; Berto, F.; Kanyilmaz, A. Resource-efficient joint fabrication by welding metal 3D-printed parts to conventional steel: A structural integrity study. Fatigue Fract. Eng. Mater. Struct. 2021, 44, 1271–1291. [Google Scholar] [CrossRef]
- Markforged. 3D Printed Joinery: Simplifying Assembly. Available online: https://markforged.com/resources/blog/joinery-onyx (accessed on 9 October 2024).
- Chand, R.; Sharma, V.S.; Trehan, R.; Gupta, M.K. A physical investigation of dimensional and mechanical characteristics of 3D printed nut and bolt for industrial applications. Rapid Prototyp. J. 2022, 28, 953–966. [Google Scholar] [CrossRef]
- Kastner, T.; Troschitz, J.; Vogel, C.; Behnisch, T.; Gude, M.; Modler, N. Investigation of the Pull-Out Behaviour of Metal Threaded Inserts in Thermoplastic Fused-Layer Modelling (FLM) Components. J. Manuf. Mater. Process. 2023, 7, 42. [Google Scholar] [CrossRef]
- Adams, R.D. Adhesive Bonding: Science, Technology and Applications; Woodhead Publishing Limited: Cambridge, UK, 2005. [Google Scholar]
- Khosravani, M.R.; Soltani, P.; Reinicke, T. Failure and fracture in adhesively bonded 3D-printed joints: An overview on the current trends. Eng. Fail. Anal. 2023, 153, 107574. [Google Scholar] [CrossRef]
- Cavalcanti, D.K.K.; Banea, M.D.; Queiroz, H.F.M. Mechanical characterization of bonded joints made of additive manufactured adherends. Ann. “Dunarea De Jos” Univ. Galati Fascicle XII Weld. Equip. Technol. 2019, 30, 27–33. [Google Scholar]
- Manoj, I.; Kumar, S.; Jain, A. A numerical study on stress mitigation in through-thickness tailored bi-adhesive single-lap joints. J. Adhes. Sci. Technol. 2023, 37, 3652–3686. [Google Scholar] [CrossRef]
- Ribeiro, T.F.R.; Campilho, R.D.S.G.; Pinto, R.F.R.; Rocha, R.J.B. Structural behaviour of adhesive bonds in 3D printed adherends. J. Adhes. Sci. Technol. 2024, 1–25. [Google Scholar] [CrossRef]
- Faria, A.; Campilho, R. Parametric analysis of composite tubular adhesive joints bonded by the bi-adhesive technique. Acad. Mater. Sci. 2024, 1, 1–10. [Google Scholar] [CrossRef]
- Leicht, H.; Orf, L.; Hesselbach, J.; Vudugula, H.; Kraus, E.; Baudrit, B.; Hochrein, T.; Bastian, M. Adhesive bonding of 3D-printed plastic components. J. Adhes. 2019, 96, 16. [Google Scholar] [CrossRef]
- Spaggiari, A.; Denti, F. Mechanical strength of adhesively bonded joints using polymeric additive manufacturing. Proc. Inst. Mech. Eng. Part C J. Mech. Eng. Sci. 2021, 235, 1851–1859. [Google Scholar] [CrossRef]
- Hiremath, V.S.; Reddy, M.D.; Reddy, R.M.; Naveen, J.; Chand, R.P. Enhancing shear strength in 3D printed single lap composite joints: A multi-faceted exploration of GNP integration, print orientation, utilizing artificial neural networks, and dynamic analysis. J. Appl. Polym. Sci. 2024, 141, e55469. [Google Scholar]
- Khosravani, M.R.; Soltani, P.; Reinicke, T. Fracture and structural performance of adhesively bonded 3D-printed PETG single lap joints under different printing parameters. Theor. Appl. Fract. Mech. 2021, 116, 103087. [Google Scholar]
- Morano, C.; Scagliola, M.; Bruno, L.; Alfano, M. Crack propagation in adhesive bonded 3D printed polyamide: Surface versus bulk patterning of the adherends. Int. J. Adhes. Adhes. 2024, 131, 103660. [Google Scholar]
- Khosravani, M.R.; Soltani, P.; Weinberg, K.; Reinicke, T. Structural integrity of adhesively bonded 3D-printed joints. Polym. Test. 2021, 100, 107262. [Google Scholar]
- ASTM D638; Standard Test Method for Tensile Properties of Plastics. American Society for Testing and Materials (ASTM): West Conshohocken, PA, USA, 2014; pp. 1–17.
- Campilho, R.D.S.G.; Banea, M.D.; Neto, J.A.B.P.; Silva, L.F.M. Modelling adhesive joints with cohesive zone models: Effect of the cohesive law shape of the adhesive layer. Int. J. Adhes. Adhes. 2013, 44, 48–56. [Google Scholar]
- Faneco, T.M.S.; Campilho, R.D.S.G.; Silva, F.J.G.; Lopes, R.M. Strength and fracture characterization of a novel polyurethane adhesive for the automotive industry. J. Test. Eval. 2017, 45, 398–407. [Google Scholar]
- ASTM Standard D638-14; Standard Test Method for Tensile Properties of Plastics. ASTM International: West Conshohocken, PA, USA, 2022. [CrossRef]
- Rocha, R.; Campilho, R. Evaluation of different modelling conditions in the cohesive zone analysis of single-lap bonded joints. J. Adhes. 2018, 94, 562–582. [Google Scholar]


| Material | PLA | PETG | ABS |
|---|---|---|---|
| Printer model and make | Ender 3 Max | Ender 3 Max | Ender 6 |
| Adhesion table type | Vidro Carborundum | Vidro Carborundum | Vidro Carborundum |
| Adhesion table temperature [°C] | 60 | 80 | 70 |
| Extruder nozzle temperature [°C] | 215 | 230 | 230 |
| Material deposition speed [mm/s] | 75 | 75 | 120 |
| Layer height [mm] | 0.2 | 0.2 | 0.2 |
| Extruded line thickness [mm] | 0.4 | 0.4 | 0.4 |
| Outer wall thickness [mm] | 1.2 (3 lines) | 1.2 (3 lines) | 1.2 (3 lines) |
| Bottom and top shell thickness [mm] | 0.8 | 0.8 | 0.8 |
| Extruded filament thickness [mm] | 0.4 | 0.4 | 0.4 |
| Infill pattern | Lines | ||
| Infill density [%] | 50 | 50 | 50 |
| Printing direction |  | ||
| Build plate adhesion type | Skirt | Skirt | Skirt |
| Adherend | Stress at 0.2% [MPa] | Peak Stress [MPa] | Peak Strain [%] | Young’s Modulus [MPa] |
|---|---|---|---|---|
| PLA | 32.07 | 35.55 | 2.06 | 2353.74 |
| ABS | 20.11 | 25.28 | 3.77 | 1362.01 |
| PETG | 17.15 | 22.30 | 5.27 | 1559.02 |
| Properties | Araldite® 2015 | Sikaforce® 7752 |
|---|---|---|
| Young’s modulus, E [GPa] | 1.85 ± 0.21 | 0.49 ± 0.09 |
| Poisson’s ratio, ν * | 0.33 | 0.30 |
| Yield tensile strength, σy [MPa] | 12.63 ± 0.61 | 3.24 ± 0.48 |
| Ultimate tensile strength, σf [MPa] | 21.63 ± 1.61 | 11.48 ± 0.25 |
| Tensile strain at failure, εf [%] | 4.77 ± 0.15 | 19.18 ± 1.40 |
| Transverse elastic modulus, G [GPa] | 0.56 ± 0.21 | 0.19 ± 0.01 |
| Shear yield strength, τy [MPa] | 14.60 ± 1.30 | 5.16 ± 1.14 |
| Shear ultimate strength, τf [MPa] | 17.90 ± 1.80 | 10.17 ± 0.61 |
| Shear strain at failure, γf [%] | 43.90 ± 3.40 | 54.82 ± 6.38 |
| Tensile toughness, GIc [N/mm] | 0.43 ± 0.02 | 2.36 ± 0.17 |
| Shear toughness, GIIc [N/mm] | 4.70 ± 0.34 | 5.71 ± 0.47 |
| Adhesive | LO [mm] | PLA | ABS | PETG | |||
|---|---|---|---|---|---|---|---|
| Analysis | EXP | NUM | EXP | NUM | EXP | NUM | |
| Araldite® 2015 | 5 | Coh | Coh | Adh | Coh | Adh | Adh |
| 10 | Adh | Adh | Adh | Adh | Adh | Adh | |
| 20 | Adh | Adh | Adh | Adh | Adh | Adh | |
| Sikaforce® 7752 | 5 | Coh | Coh | Adh | Coh | Coh | Coh |
| 10 | Coh | Coh | Adh | Adh | Adh | Adh | |
| 20 | Coh | Adh | Adh | Adh | Adh | Adh | |
Disclaimer/Publisher’s Note: The statements, opinions and data contained in all publications are solely those of the individual author(s) and contributor(s) and not of MDPI and/or the editor(s). MDPI and/or the editor(s) disclaim responsibility for any injury to people or property resulting from any ideas, methods, instructions or products referred to in the content. |
© 2025 by the authors. Licensee MDPI, Basel, Switzerland. This article is an open access article distributed under the terms and conditions of the Creative Commons Attribution (CC BY) license (https://creativecommons.org/licenses/by/4.0/).
Share and Cite
Ribeiro, T.F.R.; Campilho, R.D.S.G.; Pinto, R.F.R.; Rocha, R.J.B. Scarf Adhesive Bonding of 3D-Printed Polymer Structures. J. Manuf. Mater. Process. 2025, 9, 115. https://doi.org/10.3390/jmmp9040115
Ribeiro TFR, Campilho RDSG, Pinto RFR, Rocha RJB. Scarf Adhesive Bonding of 3D-Printed Polymer Structures. Journal of Manufacturing and Materials Processing. 2025; 9(4):115. https://doi.org/10.3390/jmmp9040115
Chicago/Turabian StyleRibeiro, Tiago F. R., Raul D. S. G. Campilho, Ricardo F. R. Pinto, and Ricardo J. B. Rocha. 2025. "Scarf Adhesive Bonding of 3D-Printed Polymer Structures" Journal of Manufacturing and Materials Processing 9, no. 4: 115. https://doi.org/10.3390/jmmp9040115
APA StyleRibeiro, T. F. R., Campilho, R. D. S. G., Pinto, R. F. R., & Rocha, R. J. B. (2025). Scarf Adhesive Bonding of 3D-Printed Polymer Structures. Journal of Manufacturing and Materials Processing, 9(4), 115. https://doi.org/10.3390/jmmp9040115