1. Introduction
Composite materials, combining various substances, enhance the mechanical and structural qualities of engineering products, driving research and development, particularly with the utilization of commercial 3D printing technology [
1]. The concept of 3D printing was invented back in 1980s, with the manufacturing of parts for prototyping or 3D model creation employing computer-aided design (CAD) and layer-by-layer polymer deposition to construct the entire shape, facilitating engineers in realizing their ideas and utilizing prototypes for model analysis and theoretical studies [
2]. The material benchmark for this can be a number of substances including but not limited to reinforced polylactic acid (PLA) [
3]. Technology has yet to entirely replace conventional manufacturing methods, as limitations in size, material, and strength persist. Although it enables the production of metal and ceramic parts, not all manufacturing materials have been fully replaced thus far [
4]. The application of this technology extends across various industries, including aerospace and defense, automotive, food industry, architecture, electronics, automation, medical and surgical fields, functional prototypes, robotics, prototyping, tool production, exploration robots, spare parts, welding jigs, and more [
5].
In Fused Deposition Modeling (FDM), thermoplastic polymers are extruded from a heated nozzle while they are still fused together. The call of fiber reinforcement in FDM lies in its ability to enhance the mechanical properties, such as strength and stiffness, of printed parts, enabling the production of robust and durable components of practical application [
5]. Fiber-reinforced composites, or FRPCs, have become increasingly popular because of their high specific strength and modulus, fatigue resistance, and versatility [
6]. Multiple methods, like parameter optimization, the addition of continuous or discontinuous fibers, cross linkage via ion radiation, or the addition of nanofibers, are used for the enhancement of mechanical properties [
7]. The critical parameters impacting property enhancement include layer thickness, infill density, printing speed, nozzle temperature, and air gaps, which can occur both within layers and between them. In FRPCs, the primary determinants are the volume proportion of fibers and their orientation. At low loading ratios, mechanical parameters like elastic modulus rise with fiber loading but deteriorate after reaching an optimal value [
8]. To reinforce materials, a range of fibers, including chopped carbon fibers, carbon nanotubes, glass fibers, natural fibers, and others, have been employed [
9,
10,
11,
12,
13]. Many researchers have developed composites using FDM in the literature. The ones deemed relevant are presented in “
Table 1”.
Shofner et al. [
14] worked on carbon nanofibers with acrylonitrile-butadiene-styrene (ABS) to develop fiber reinforced products. Tekinalp et al. [
8] took the work significantly forward by developing products with a tensile strength increase of 94.44%. Their methods left the products significantly porous; the results showed that these have a positive impact on tensile strength and modulus. Ning et al. [
15] researched in a different direction by adding powders instead of conventional fibers. Li et al. [
16] introduced novel nozzle and path control methods to improve product strength and were significantly successful in achieving a high tensile strength increase of 225%. Matsuzaki et al. [
17] presented a technique through which he completely removed the use of molds without sacrificing tensile strength and modulus, and it is now one of the standard next gen methodologies. Ning et al. [
18], after further deliberation, researched powder and fiber length. The direction of their work was on CFRP parts as a replacement of pure plastic products; thus, strength increase was relatively less (23.53%). Yang et al. [
19] developed a novel composite extrusion head improving the flexural strength and the tensile strength to 127 and 147 MPa, respectively. Liao et al. [
20] developed the printable filaments of carbon fiber/PA12 composites with different mass fraction enhancing the tensile and flexural strength by 102.2% and 251.1%, respectively. Prajapati et al. [
21], whilst using strong fiberglass, tested other properties including flame retardation. Keeping in check the tensile strength (26%), Yao et al. [
22] tested material amalgamation and mixing with carbon and basalt fiber. They proposed that quasi-static stretching reduces microcracks. In more recent times, Beyzavi et al. [
23] investigated the electrochemical behavior, while Hua et al. [
24], taking the work forward with basalt fiber for thermoplastics, improved tensile strength by 142%. Similar work on continuous carbon fiber was carried out by Kargar et al. [
25], producing a relatively similar strength increase (160%).
Now, in order to minimize both numerical and experimental efforts, Kumar et al. [
26] employed the Taguchi L9 method to optimize the printing parameters for PETG-based composites reinforced with carbon fiber. These composites are advanced materials engineered by incorporating fillers, fibers, or nanoparticles into a PETG matrix, significantly enhancing their mechanical, thermal, and functional properties. PETG itself is a modified copolymer of polyethylene terephthalate (PET), where the addition of glycol improves toughness, transparency, and processability, making it a suitable choice for high-performance applications. They found that higher printing speed and infill density were key to increasing hardness and tensile strength, while higher infill density and layer height were linked to higher bending strength. According to Wang et al. [
27], using smaller layer thicknesses for layers increases tensile strength since thinner layers indicate fewer interlayer gaps, reducing the likelihood of air gaps. The nozzle temperature is another important consideration, as it affects both the flow of the extruded thermoplastic material and the strength of the bonds formed between solidified layers. Yang et al. [
19] discovered that there is a 21% discrepancy in crystallinity between nozzle temperatures of 360 °C and 480 °C, with higher temperatures leading to increased crystallinity. Wang et al. [
27] analyzed that, due to the higher viscosity of fiber-reinforced polymer composites (FRPCs), print speeds above 30 mm/s are not feasible, as they compromise the quality of the print. Conversely, lower printing speeds allow for increased interaction time between the extruded filament layer and the surrounding material, resulting in stronger layer bonding. Tensile strength and density exhibit an inverse relationship with print speed because higher printing speeds lead to inadequate layer bonding. This occurs because at higher speeds, the next layer may overlap or contact the previous layer before it is fully solidified, hindering layer diffusion and crystallization, thereby compromising bonding quality. When fiber-reinforced polymer composites (FRPCs) are loaded, their mechanical properties are directly linked to the amount of reinforced fiber in each direction. Fiber reinforcement is divided into two categories, continuous and discontinuous fibers, based on the critical length of the fibers [
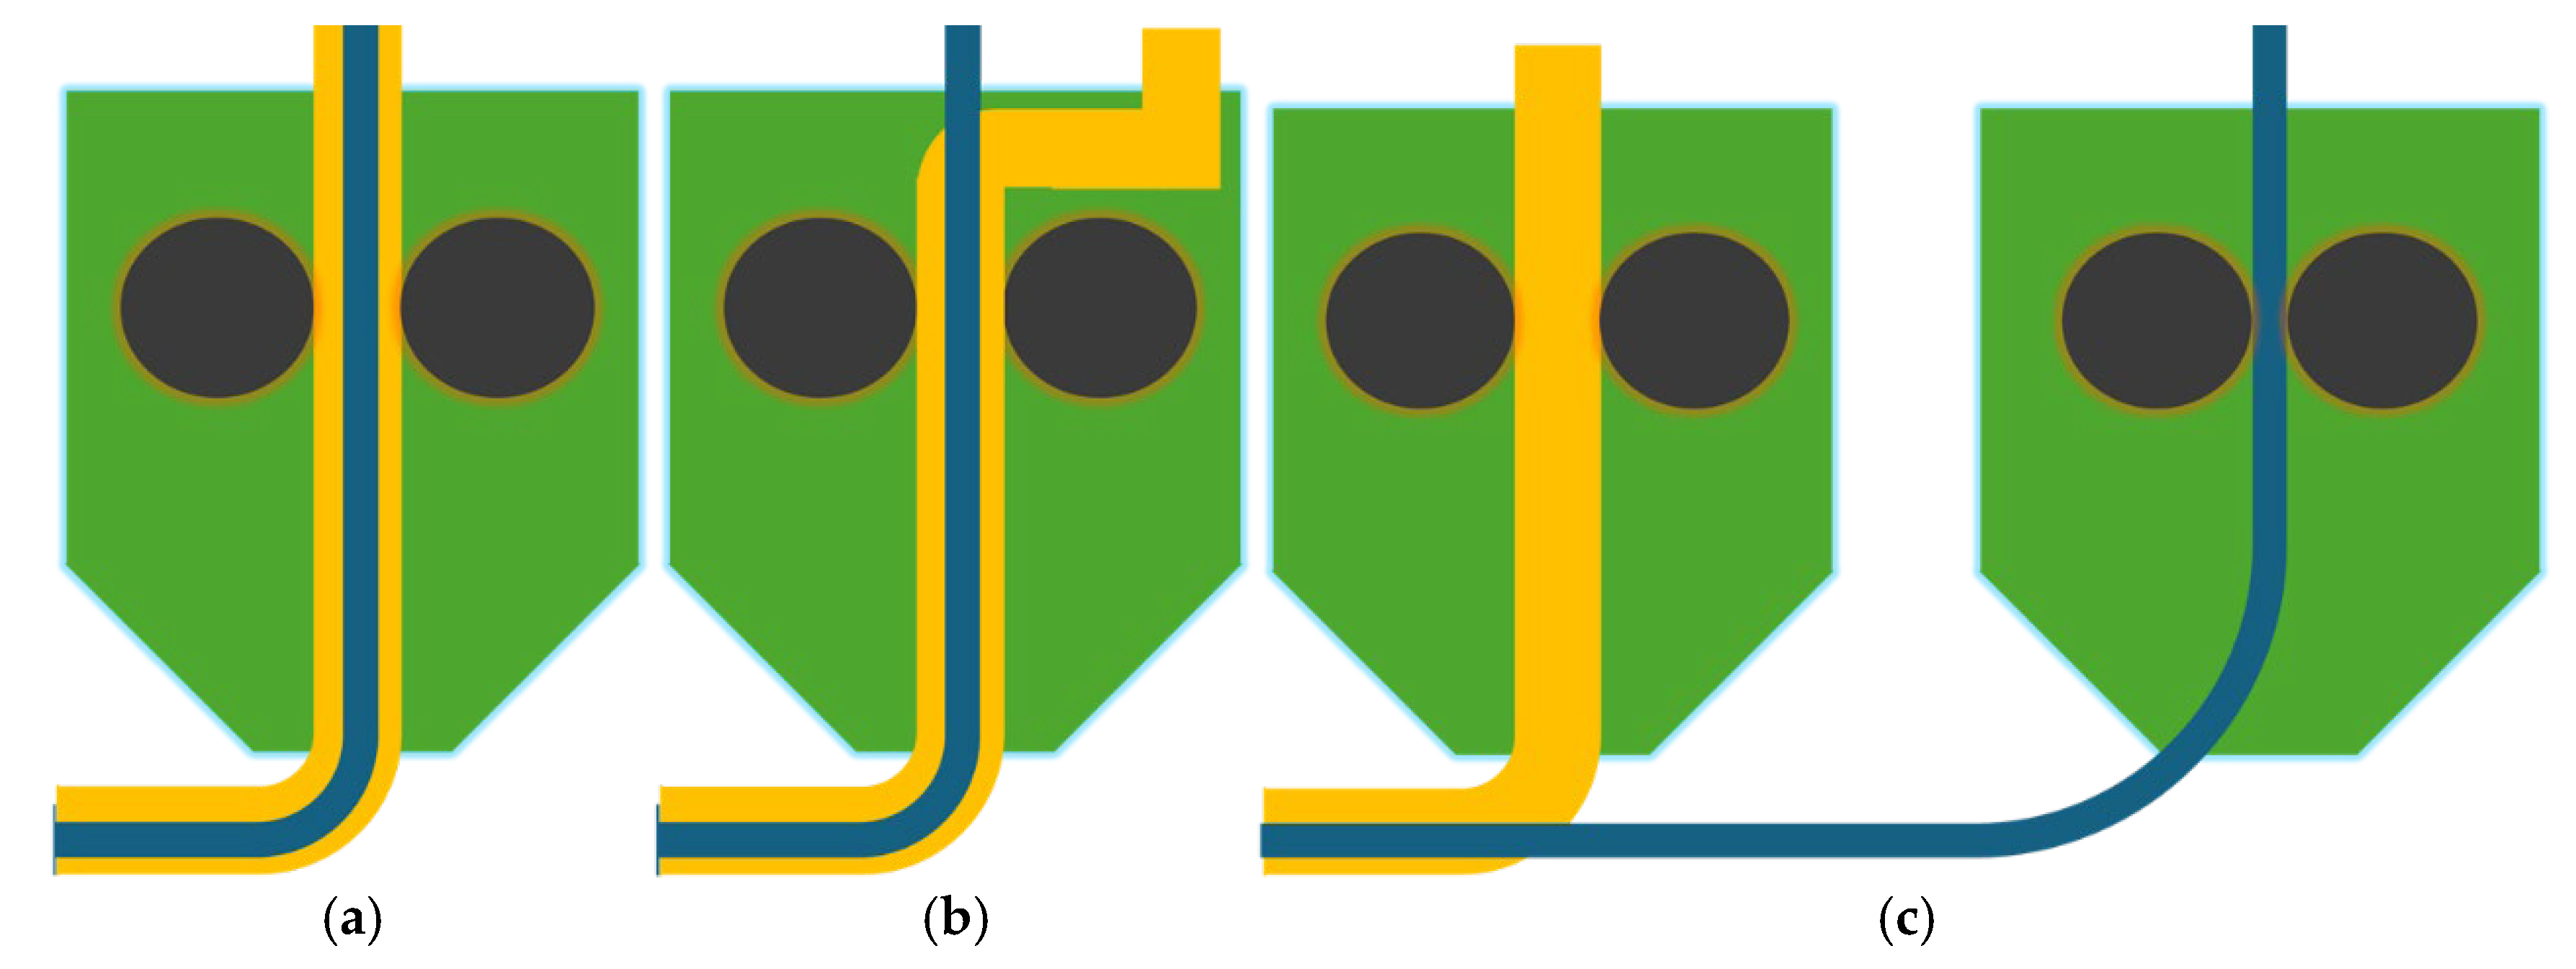
28]. The critical length of fibers (Lc) is a fundamental concept in fiber-reinforced composites, defined as the minimum fiber length required for effective stress transfer from the matrix to the fiber. It is the length at which the fiber reaches its maximum tensile strength without pulling out of the matrix. Three distinct embedded techniques are utilized for FRPC printing (
Figure 1) [
29]. The first technique entails embedding fibers prior to the printing process. The second one involves the insertion of the fiber inside the nozzle enclosure. The third technique entails integrating the fiber and polymer onto the component by utilizing two distinct nozzles.
The process parameters, such as fiber weight percentage, infill density, and printing speed, significantly influence the mechanical properties of 3D-printed fiberglass-reinforced ONYX polymer. While existing studies have explored the effects of individual parameters, a comprehensive understanding of their combined influence on properties like strength, stiffness, and surface finish remains limited. The research gap lies in optimizing these parameters to enhance performance without compromising material efficiency or print quality. This study aims to address these gaps by developing optimized process settings that balance mechanical performance and material consumption for advanced manufacturing applications.
This article will utilize technique three for producing samples, specifically using the Mark Two 3D printer manufactured by MarkForged
® Company. For this study, three printing parameters namely FG reinforcement percentage, infill density, and pattern shapes were considered [
30]. The measured responses were impact strength, compression strength, and Shore D hardness. The L9 array (L9 3
3) was generated using Taguchi’s design of experiments for the purpose of conducting ANOVA and multi-objective optimization of the 3D printing process parameters.
The Taguchi Design of Experiments (DoE) is a systematic method for optimizing processes and product quality by using orthogonal arrays to efficiently study multiple factors with minimal experiments, focusing on robustness against variability.
Analysis of Variance (ANOVA) is a statistical tool used alongside Taguchi DoE to analyze experimental data, determine the significance of factors, and quantify their contributions to the output, enabling data-driven optimization and decision-making. Together, they provide a powerful framework for improving performance and reducing variability in engineering and manufacturing processes.
The Taguchi technique aims to minimize variation in a process by implementing a robust experimental design. The primary objective was to optimize the printing parameters for the maximization of responses within the specified range of input parameter values. The secondary objective was to minimize the input parameters while obtaining the maximum output results.
2. Experimental Setup
The FRPC’s printer is a MarkForged
® dual nozzle semi-industrial grade 3D printer. It can automatically and continuously reinforce 3D-printed nylon pieces using various continuous materials like carbon fiber, glass fiber, and Kevlar. The printer, originally known as “Mark One”, was developed to produce stronger and more reliable parts compared to other 3D-printed parts [
31]. The next generation of the Mark One printer, called the Mark Two, also features dual nozzle technology and uses composite filament fabrication (CFF) technology. Unlike the Mark One, the Mark Two can embed both concentric and isotropic fibers in the 3D-printed components simultaneously, providing enhanced structural reinforcement [
32]. Fiberglass, a MarkForged continuous fiber, combined with Onyx, boosts component strength tenfold compared to ABS, as claimed by its manufacturer. MarkForged trademarked materials, Onyx and fiberglass, compatible with Mark Two and X7, offer a cost-effective alternative to carbon fiber [
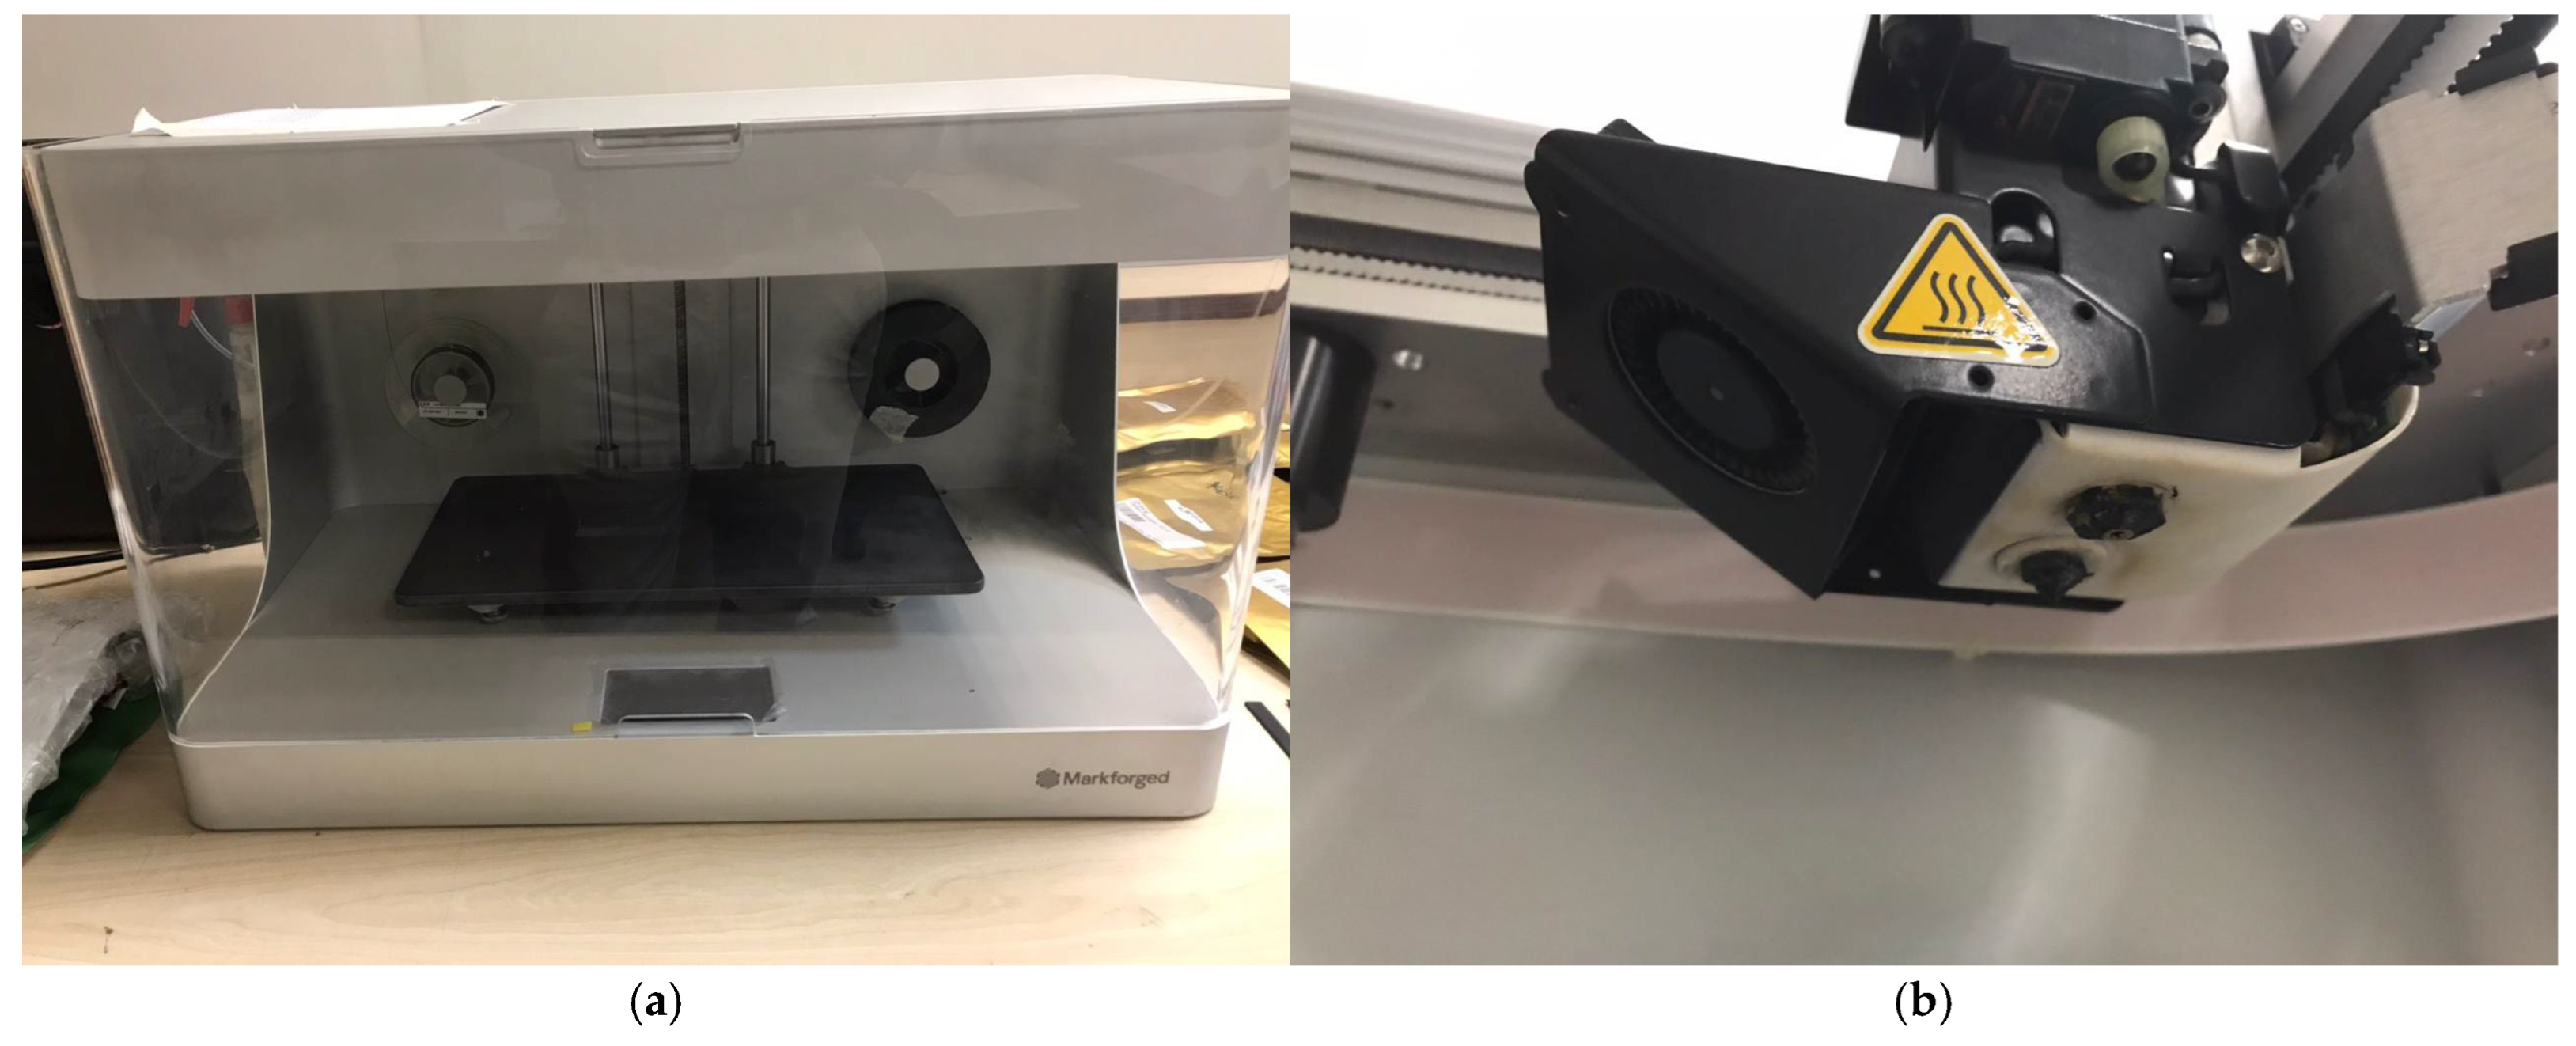
5]. The Mark Two, a desktop 3D printer by MarkForged
® Inc. in Watertown, MA, USA, has a build size of 12.59 × 5.19 × 6.06 inches (320 × 132 × 154 mm). It supports dual nozzle printing, one for Onyx and the other for fiberglass reinforcement, using continuous fiber, as presented in
Figure 2. CAD models are sized to ASTM D256 dimensions and then exported as STL files to Eiger
® software for printing.
Onyx-FR from MarkForged
® was used as the primary polymer material. It is a blend of nylon with micro-filled carbon fibers, offering strength and stability 1.4 times greater than any continuous fiber, including reinforcing materials like ABS [
33]. The primary material, Onyx FR, boasts the mechanical properties outlined in
Table 2, as reported by its manufacturer, i.e., MarkForged. Known for its cost-effectiveness and as reinforcement, fiberglass offers strength comparable to carbon fiber but is approximately 40% less stiff and twice the weight. Fiberglass is ideal for applications prioritizing strength, with a tensile strength of 560 MPa and an Izod impact strength of 2600 J/m, surpassing carbon, carbon FR, and Kevlar
® (60 Tower Rd, Waltham, MA 02451, USA) [
33].
The process parameters were chosen based on past research and the potential of the 3D printer. SEM was performed to analyze possible failure causes. The DOE was performed in accordance with three printing parameters, i.e., F1, F2, and F3, respectively, with three different levels, as presented in
Table 3. The fixed parameters are layer height, number of wall layers, roof and floor layers, and the type of fiber fill with orientation angles, i.e., isotropic fiber 0°, 45°, 90°, and 135°.
Design of Experimentation (DOE)
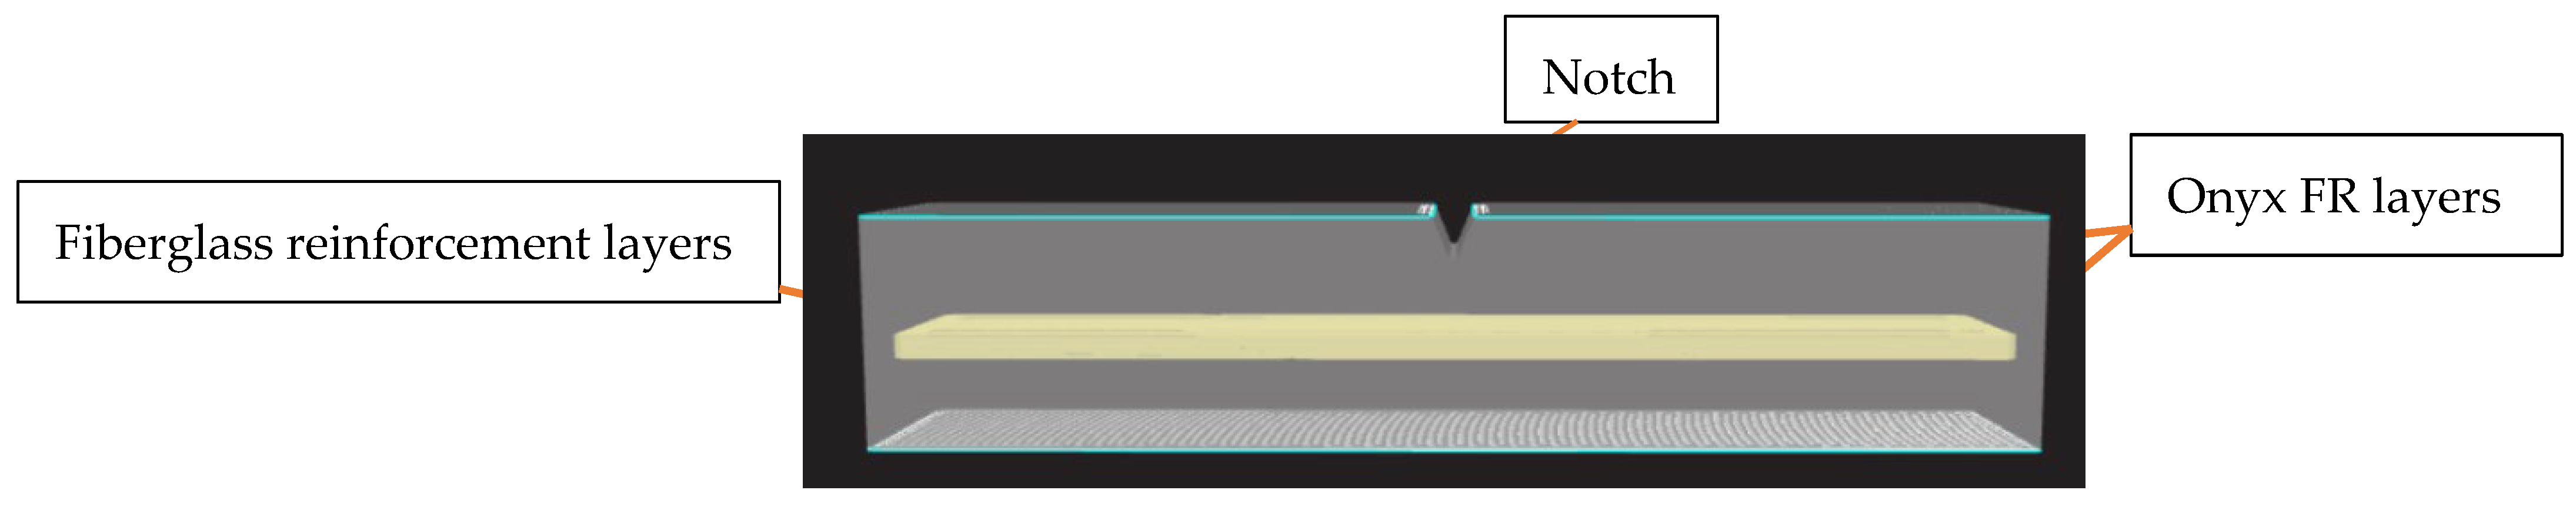
A Taguchi L9 array consisting of 33 components was constructed using Minitab Version 19 software, as presented in
Table 4. The test specimens are prepared in compliance with ASTM D256. Two specimens of the same composition were printed, and a test was performed on each specimen to obtain an average value. A 3D view of the FG-reinforced sample is shown in
Figure 3. Individual responses were analyzed using main effect graphs. Response surface methodology (RSM) was employed to investigate various responses by using the Design Expert tool.
3. Results
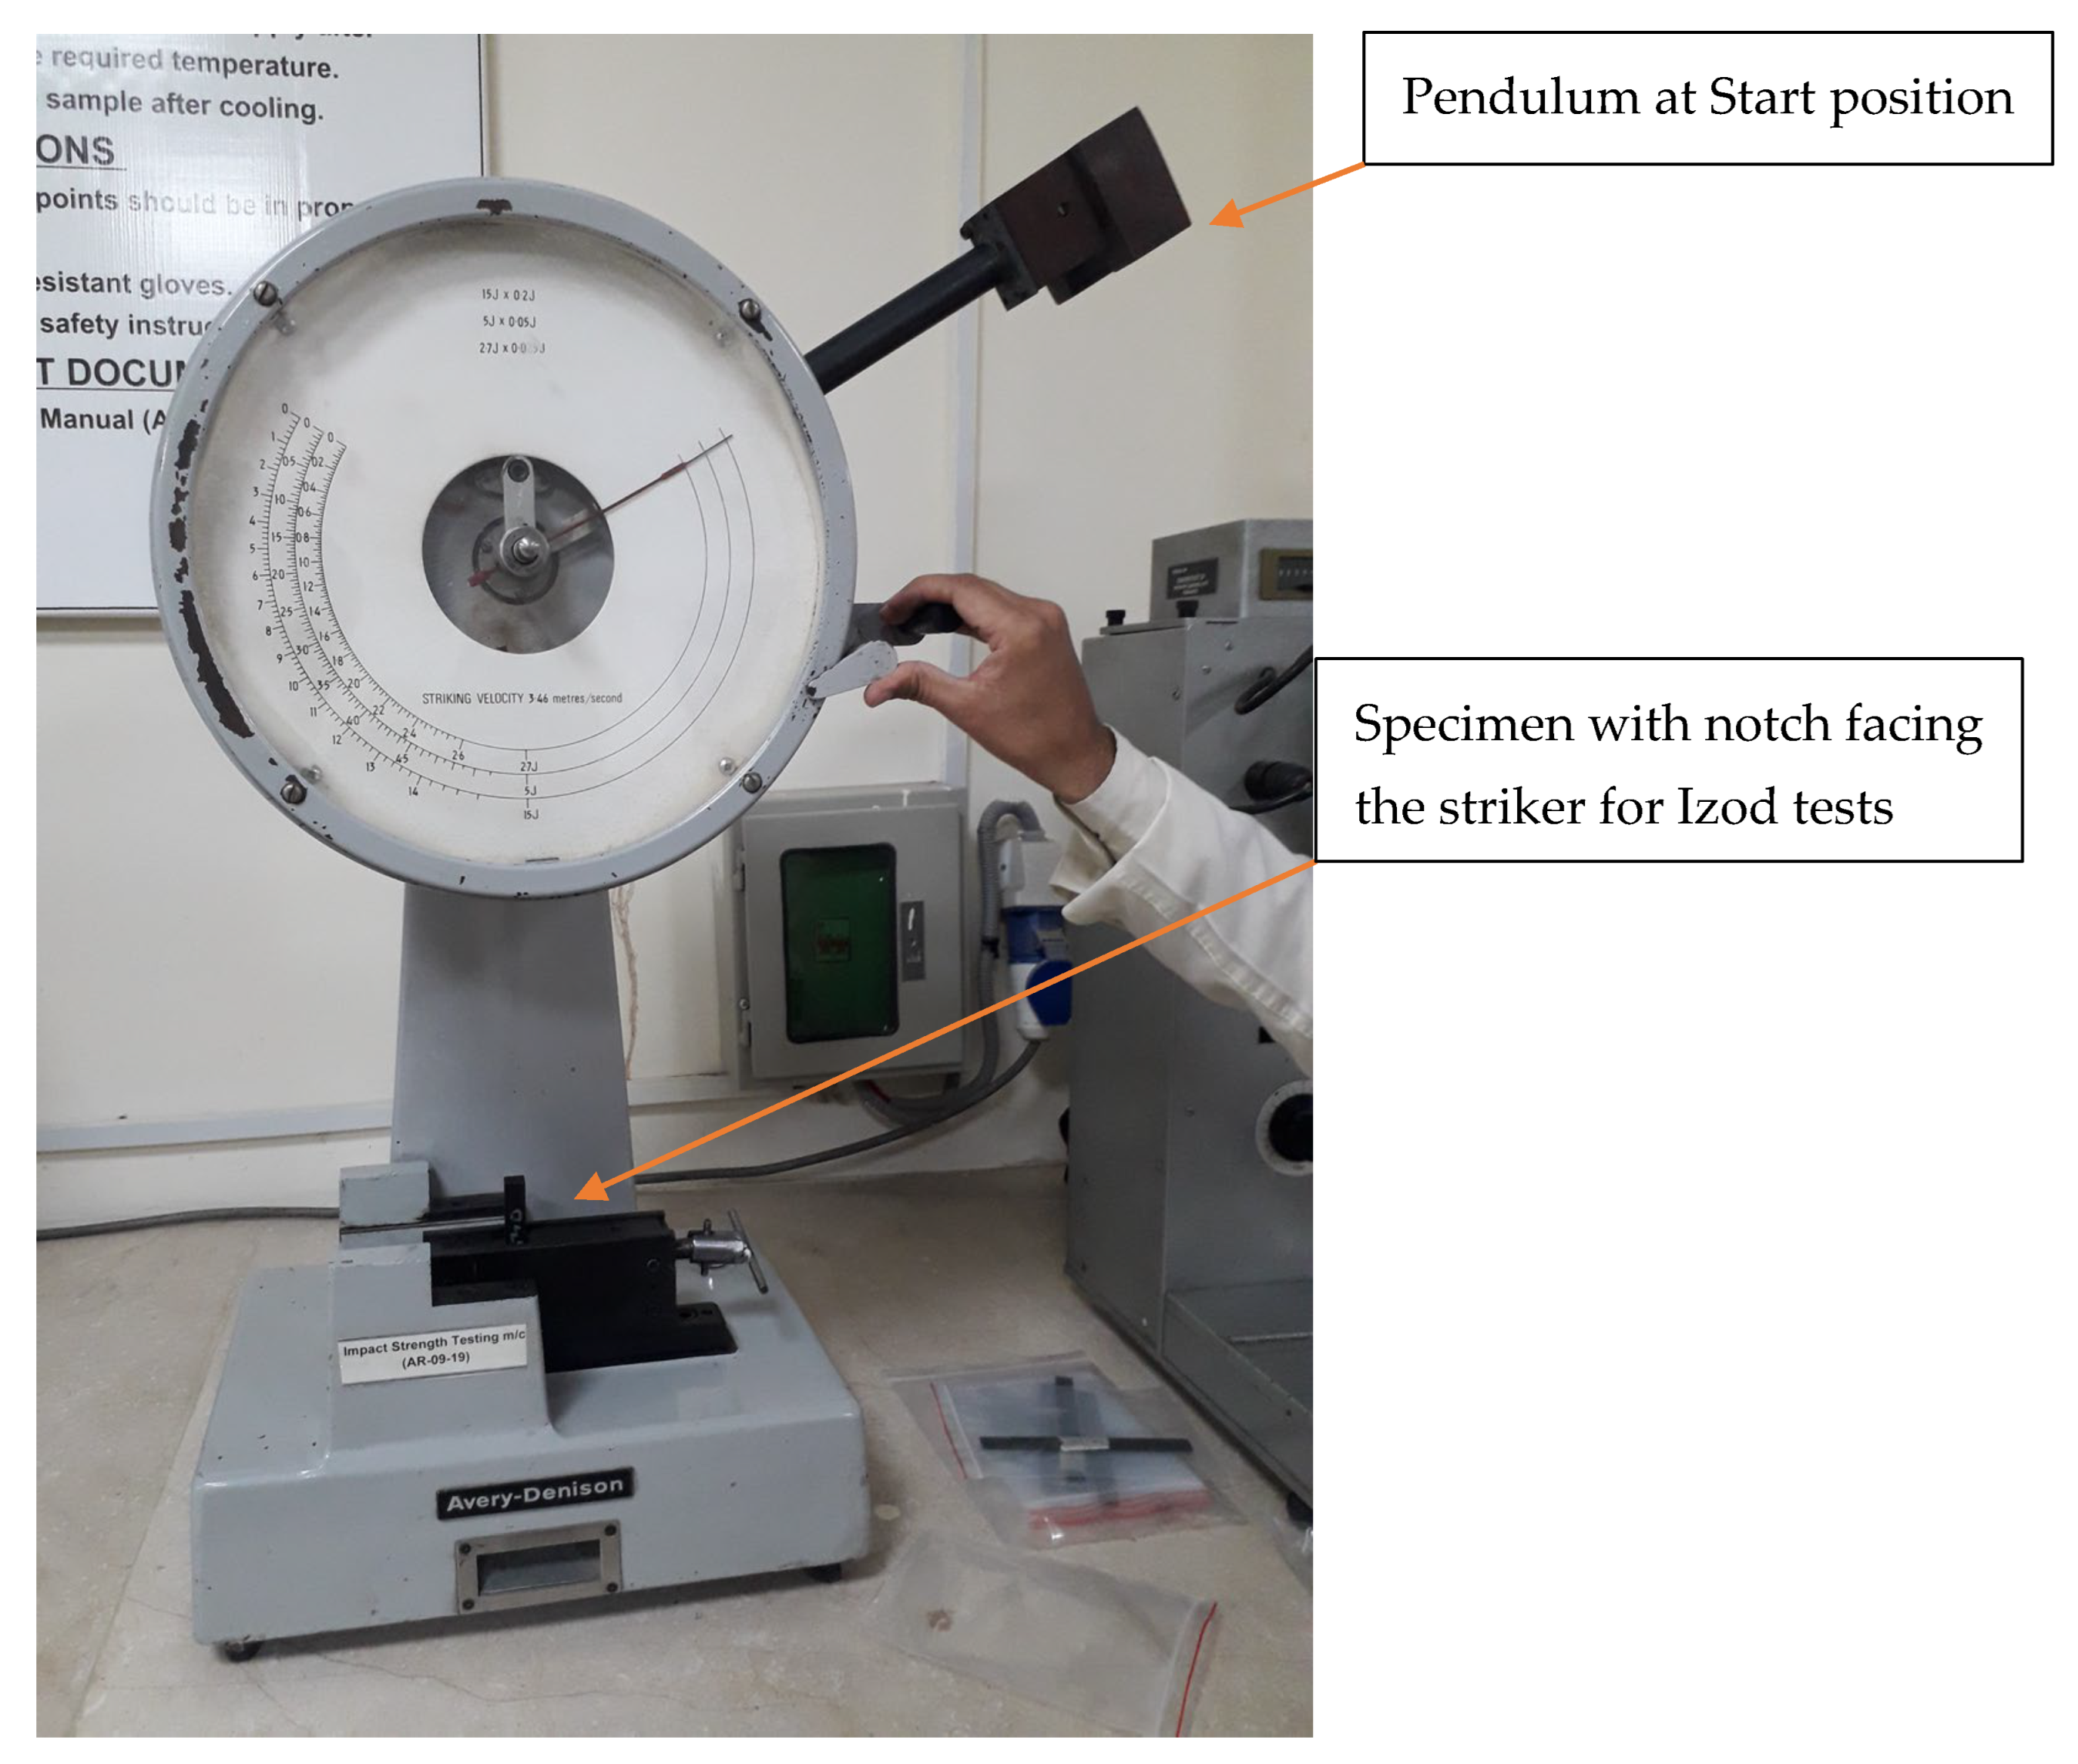
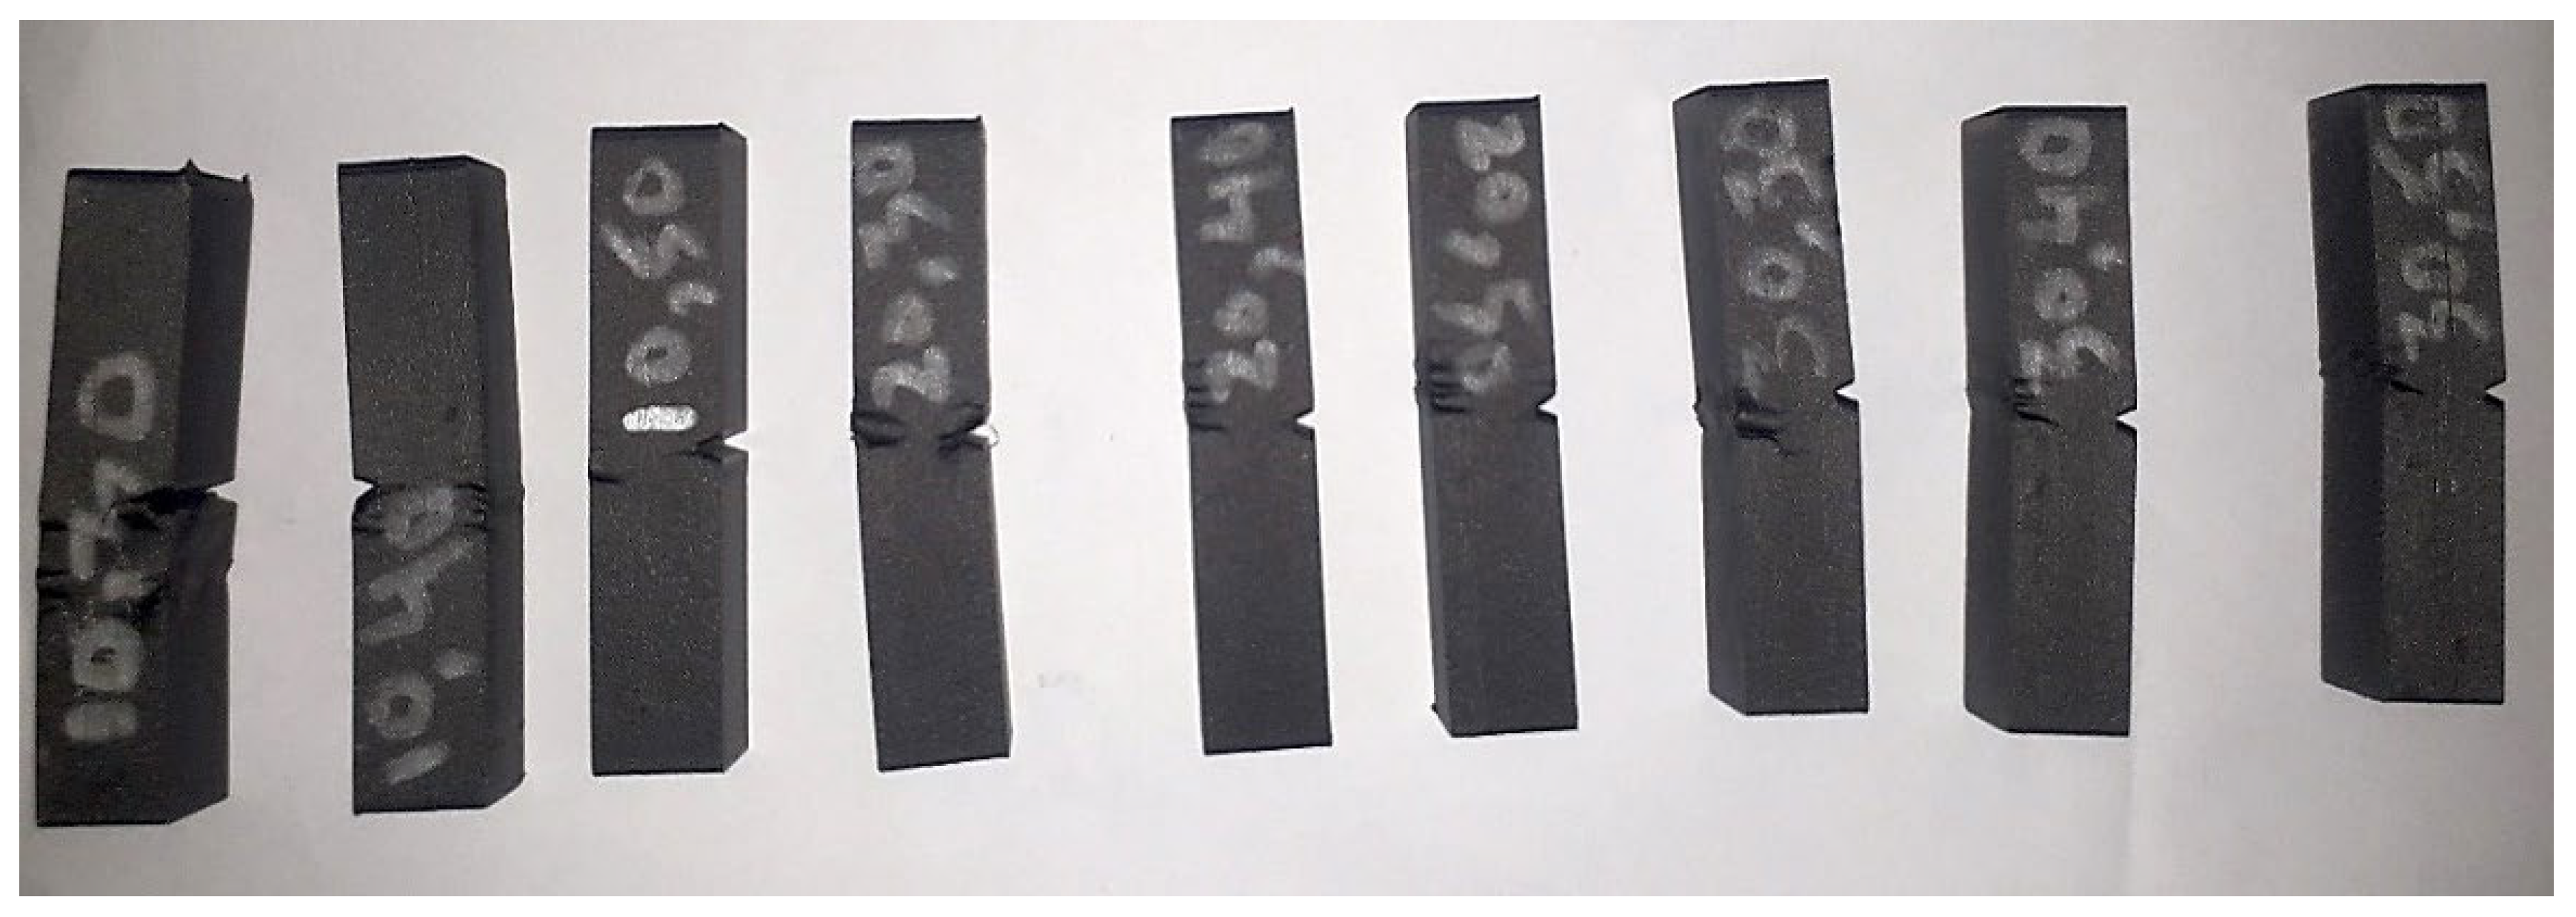
The impact test apparatus, Avery Denison-UK, has a striking velocity of 3.46 m/s and is used for Izod testing. The impact specimen under the test conditions is presented in
Figure 4. Each specimen’s failure type was recorded in accordance with ASTM D256-10 [
35]. It was observed that most of the samples exhibited “partial break” while some samples followed the definition of “non-break”, as presented in
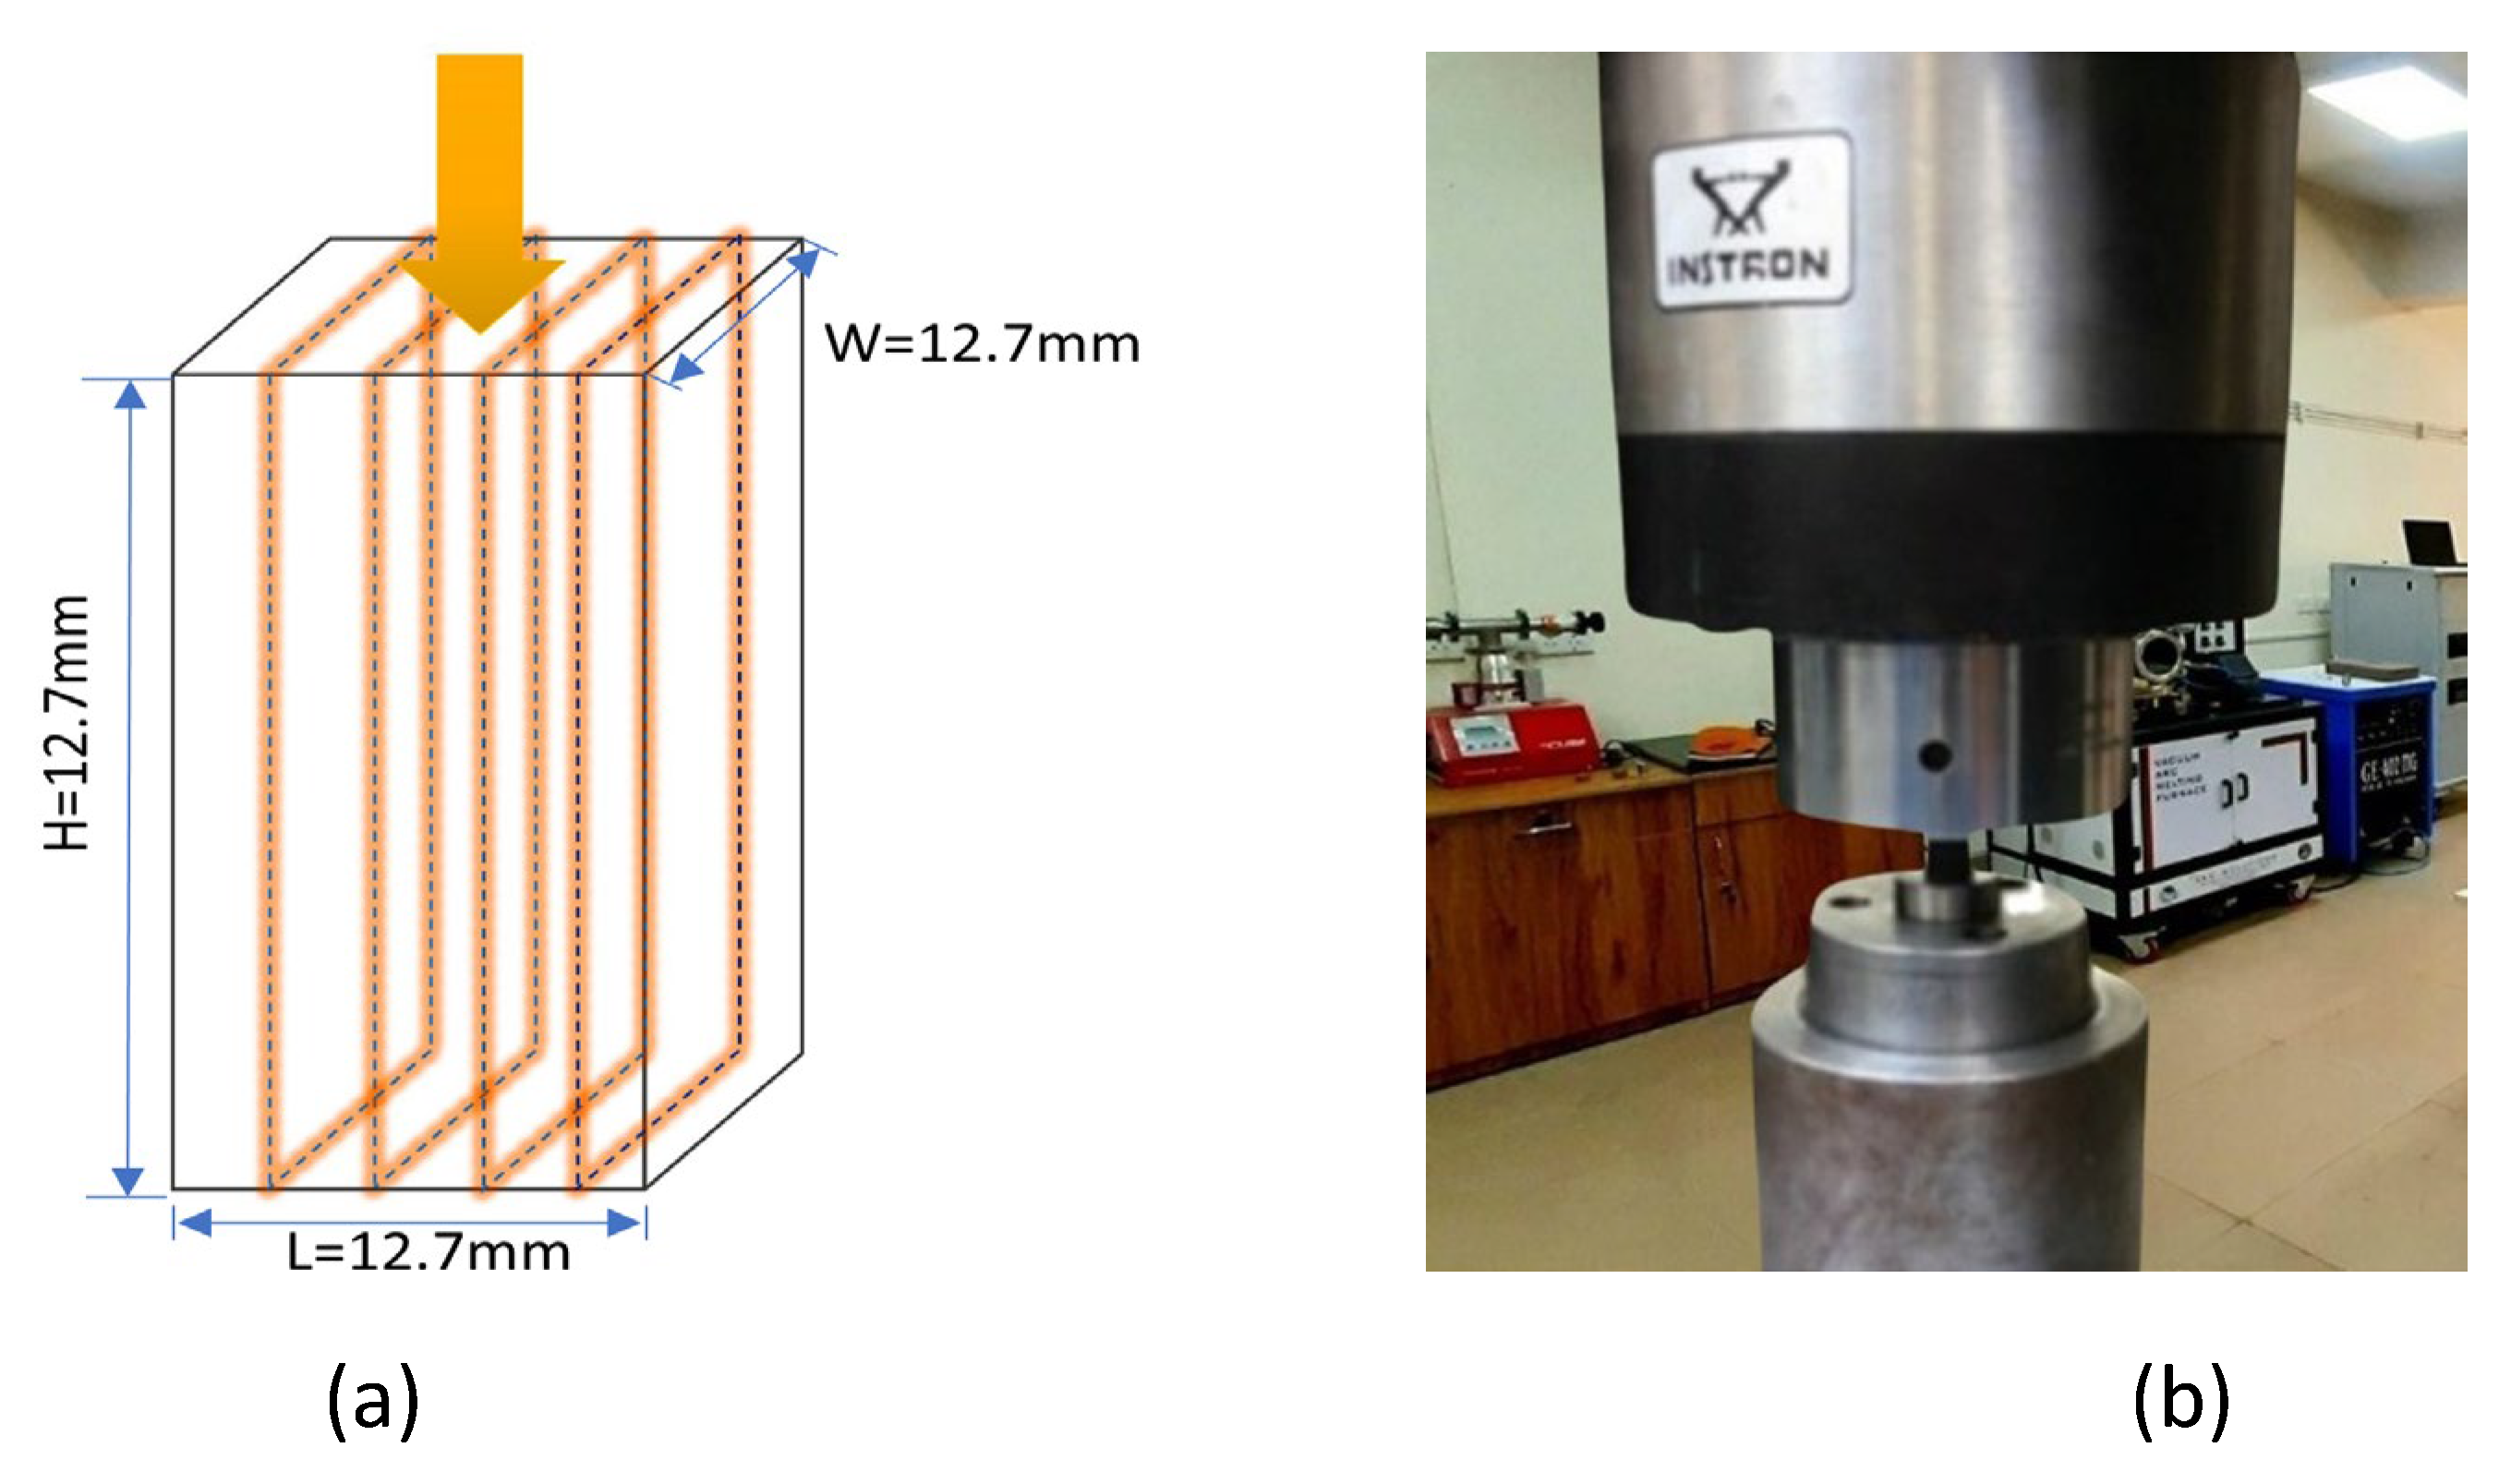
Figure 5. For the compression test, specimen loading direction was kept in the longitudinal direction (
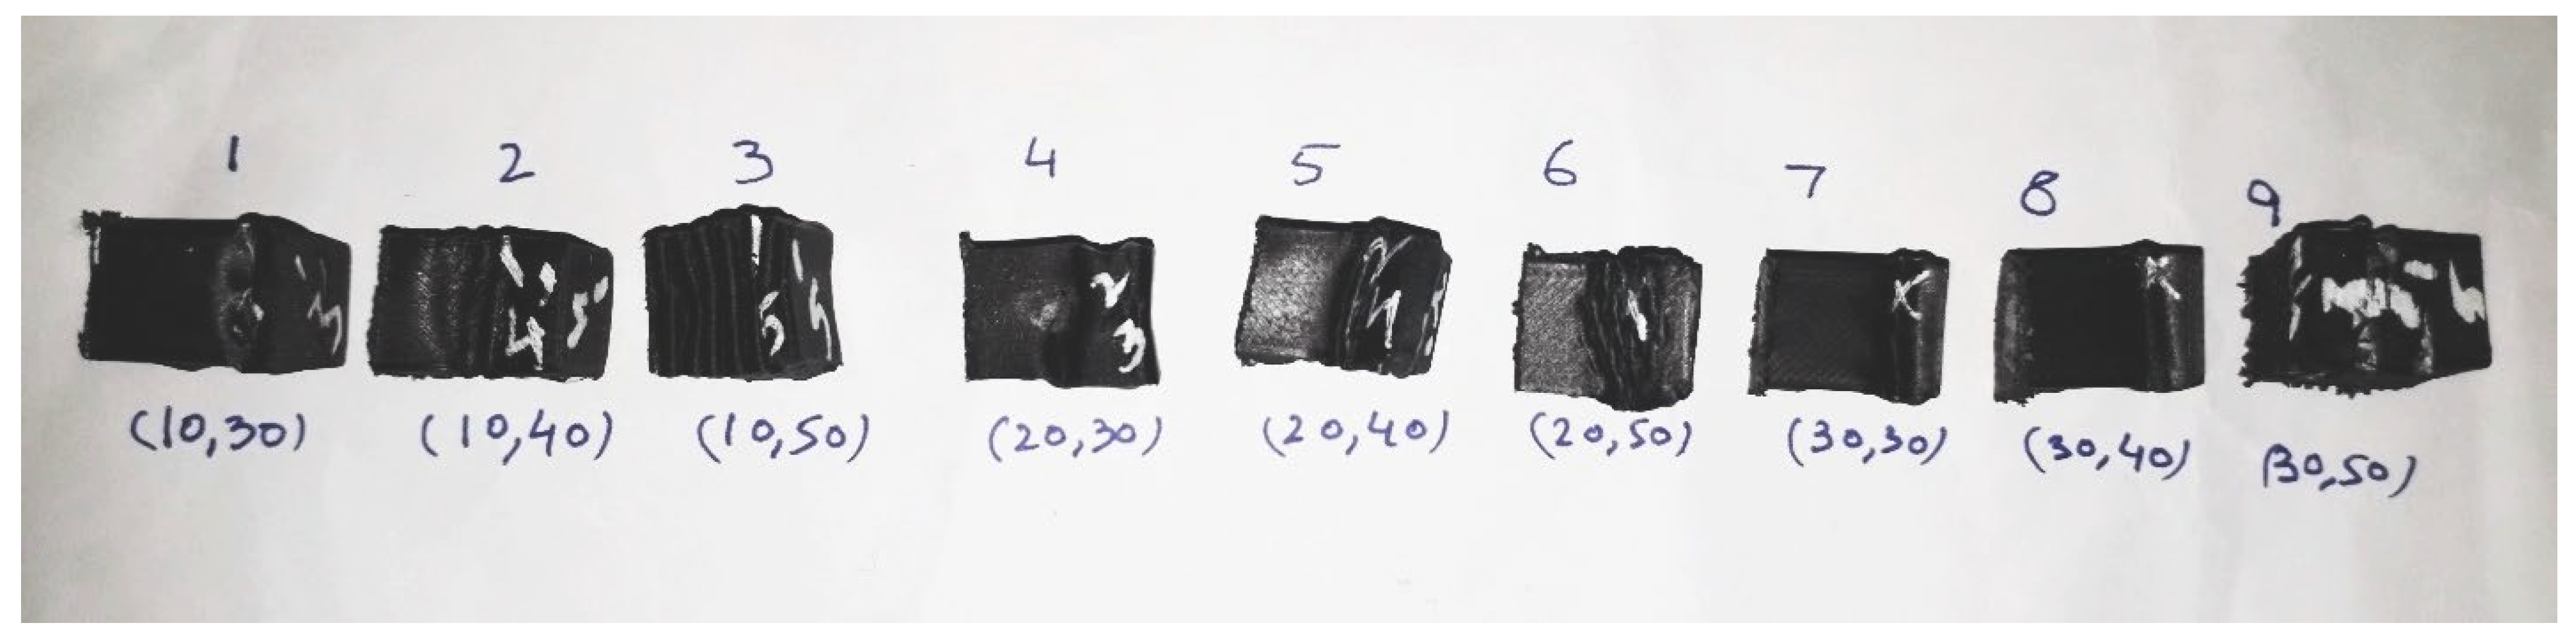
Figure 6). The machine used for the compression test was a Load frame by Instron 5589 and by ASTM D695-10, specimen under loading.
Figure 7 displays the deformed compression samples following loading in the direction parallel to the fibers.
The Shore D hardness measurements were obtained using the DuroTech WS777 Digital Hardness Tester, and the testing procedure followed ASTM D2240 standards. It was noted that all the specimens have infill densities of 30%, 40%, and 50%; thereforem while measuring hardness, the specimen deformed as no rigid surface was available to resist the indenter loading. Various studies also reveal details about the deformation of polymer on the application of loading. It was also observed during hardness testing that there was variation in the hardness values. This was due to the fact that the infill density varied from 30 to 50% only and no slid space was available for the indenter and most of the time, as the indenter is above the void, the resistance to hardness force was very minimal. The value appeared on the higher side when the indenter was above the connection point of two similar patterns because of prominent resistance, as stated above. Therefore, the values are taken as an average of three values.
Data were collected from all response parameters (R1, R2, R3, and R4) and analyzed to determine the effect of different printing parameters (F1, F2, F3) on these responses, as tabulated in
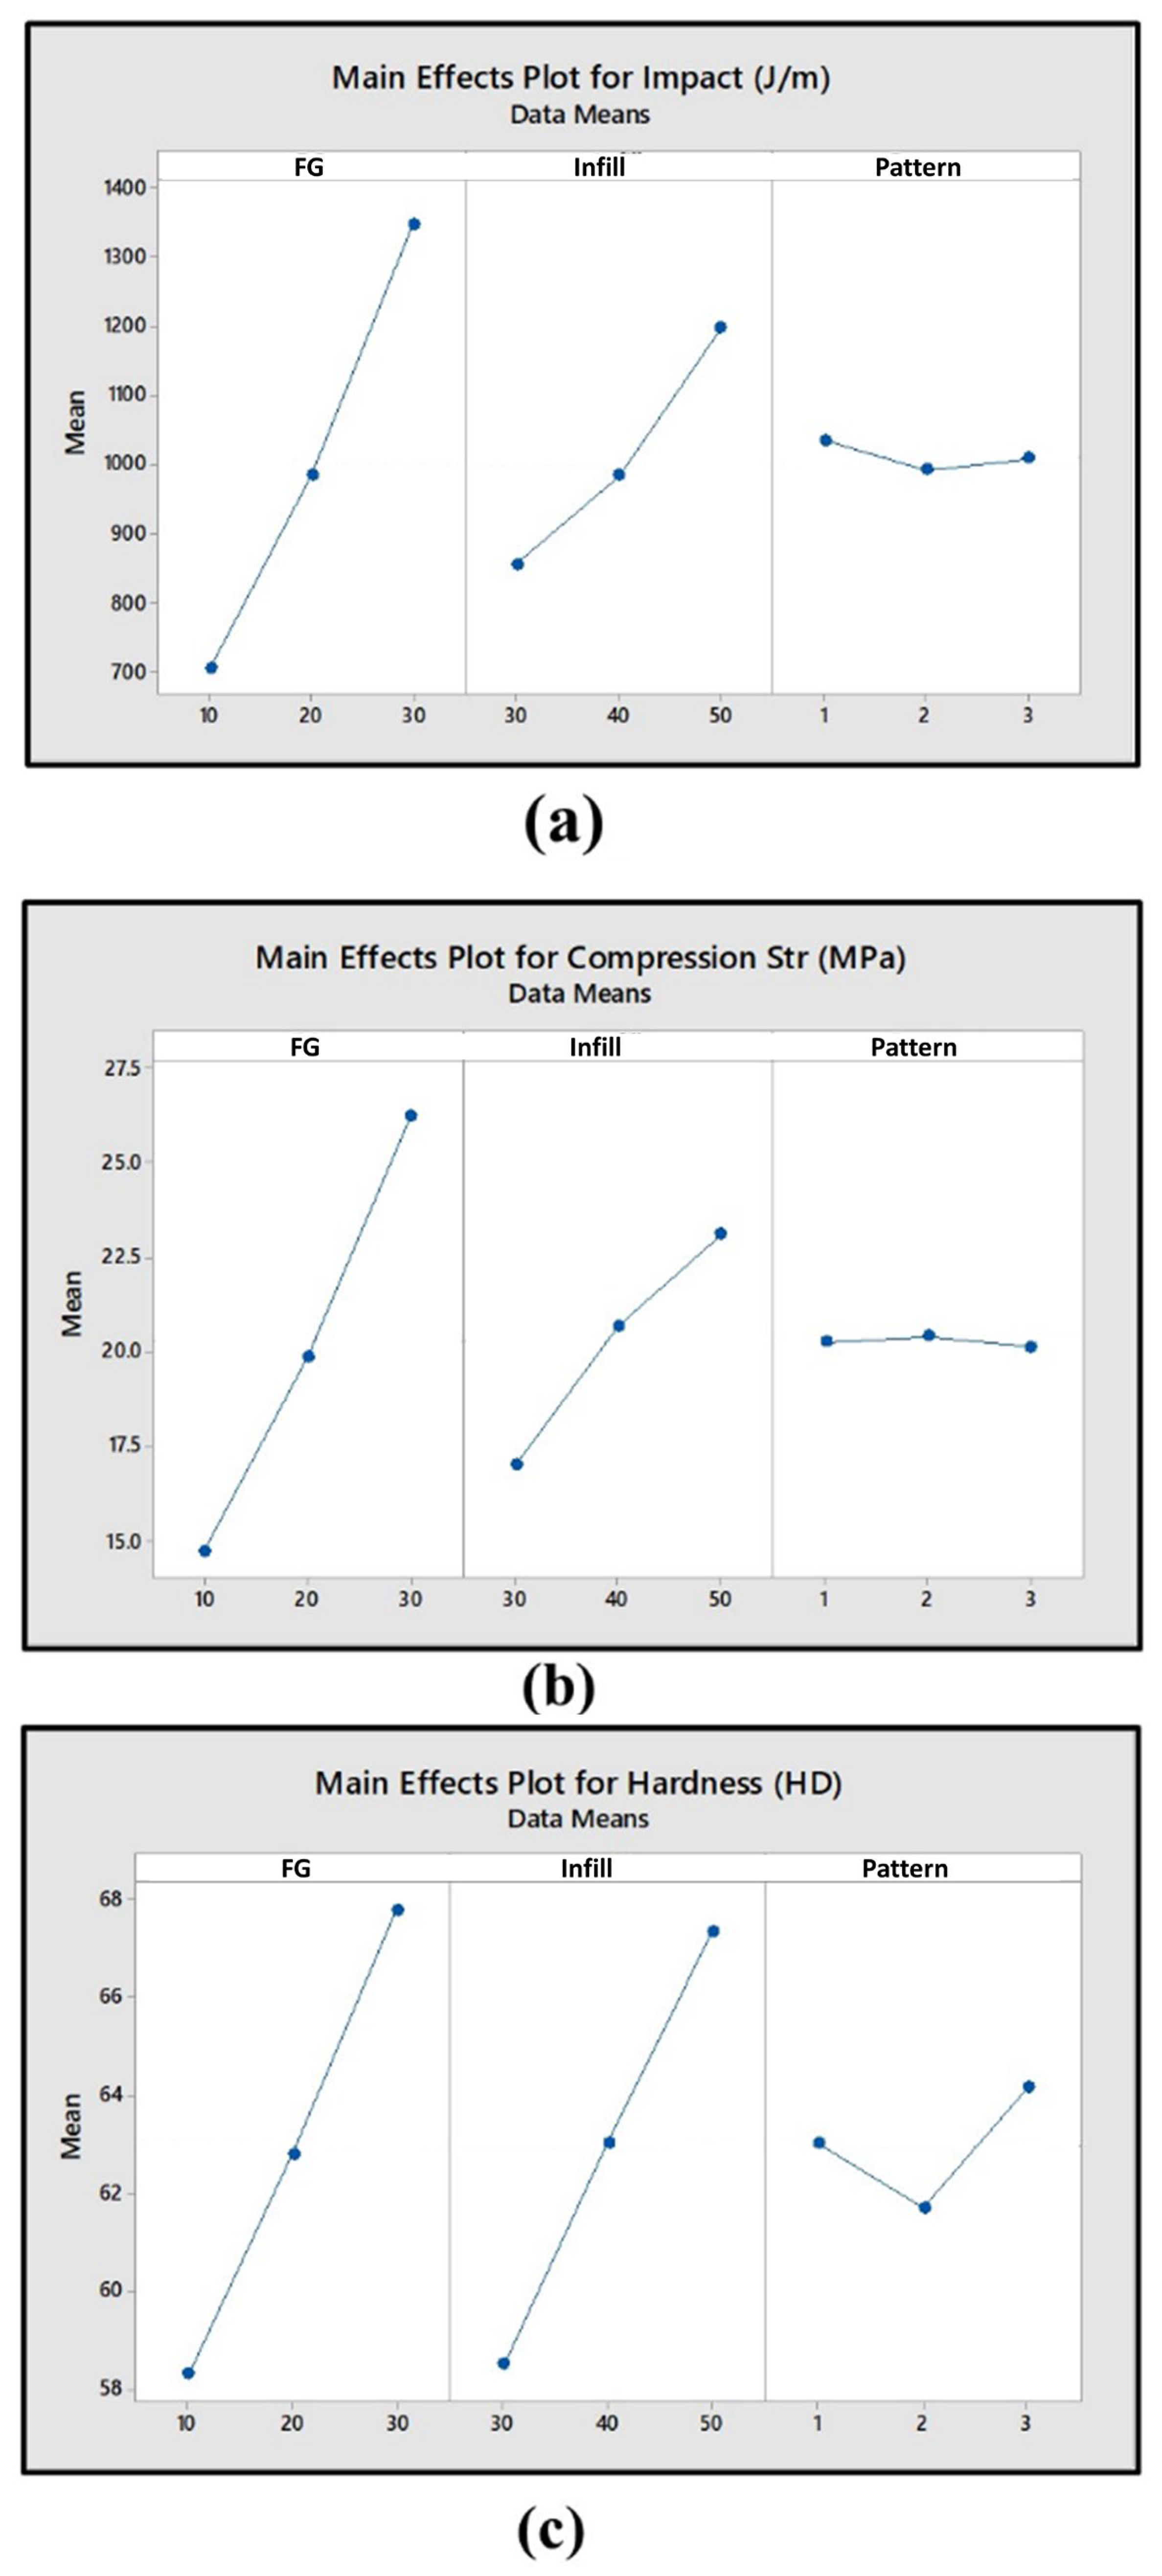
Table 5. The standard deviations are as follows: R1 (impact strength): 319.37 J/m; R2 (compression strength): 5.67 MPa; and R3 (Hardness): 5.95 HD. The main effects plots are shown in
Figure 8a–c. The main effects plot in
Figure 8a indicates that when the FG percentage increases, the Izod impact strength tends to increase.
Figure 8a represents the main effects plot for impact strength (J/m), illustrating how fiberglass (FG) content, infill density, and pattern shape influence the response variable. The FG content exhibits the most significant impact, as impact strength increases from approximately 750 J/m at 10% FG to nearly 1400 J/m at 30% FG, demonstrating a steep upward trend. Similarly, infill density positively affects impact strength [
36], increasing from around 850 J/m at 30% infill to 1200 J/m at 50% infill. In contrast, pattern shape has a minimal effect, with impact strength values remaining relatively stable, fluctuating slightly around 900–950 J/m. These findings suggest that FG content is the dominant factor, followed by infill density, while pattern shape has negligible influence on impact strength. The average mean Izod impact strength is measured to be 704.726 J/m for a parentage of 10% FG. However, when the FG percentage was raised to 30%, the mean Izod impact strength increased. This was observed under conditions of 100% infill density and a solid pattern [
37].
The studies demonstrate that there is a direct correlation between infill density and impact strength, as supported by the evidence [
34]. It was observed that higher infill density leads to significantly improved quality. When comparing the hexagonal-shaped design to other designs, it showed the highest energy absorption [
38] and is validated by our experimental results too, as shown in
Figure 8a. The pattern shapes in the plots are represented by the numbers 1, 2, and 3, where 1 corresponds to hexagonal, 2 corresponds to rectangular, and 3 corresponds to Triangular. The hexagonal pattern design exhibits a maximum mean impact strength whereas the rectangular pattern shape shows a minimum mean impact strength. The impact strength found at a 50% infill density was highest in the Tri hexagonal design, compared to the rectangular and Triangular patterns. The second highest impact strength was observed at the rectangular infill pattern [
36].
For response R2 and R3, i.e., compression strength and hardness value, a similar trend was observed, i.e., there is a direct relation for both FG percentage and infill density as evident from the main effects plot in
Figure 8b,c.
The main effects plot for compression strength (MPa) in
Figure 8b illustrates the influence of fiberglass (FG) weight percentage, infill density, and pattern shape on the mean compression strength. The first plot indicates that increasing the FG content from 10% to 30% results in a significant rise in compression strength, from approximately 15 MPa to 27.5 MPa, demonstrating the dominant role of FG in enhancing mechanical properties. The second plot shows that increasing the infill density from 30% to 50% also leads to an improvement, raising compression strength from around 17 MPa to 22 MPa. However, the third plot reveals that the pattern shape has a relatively minor effect, as the compression strength remains nearly constant across different pattern levels, fluctuating slightly around 20 MPa. This suggests that FG content and infill density are the primary influencing factors, while pattern shape has a negligible impact on compression strength.
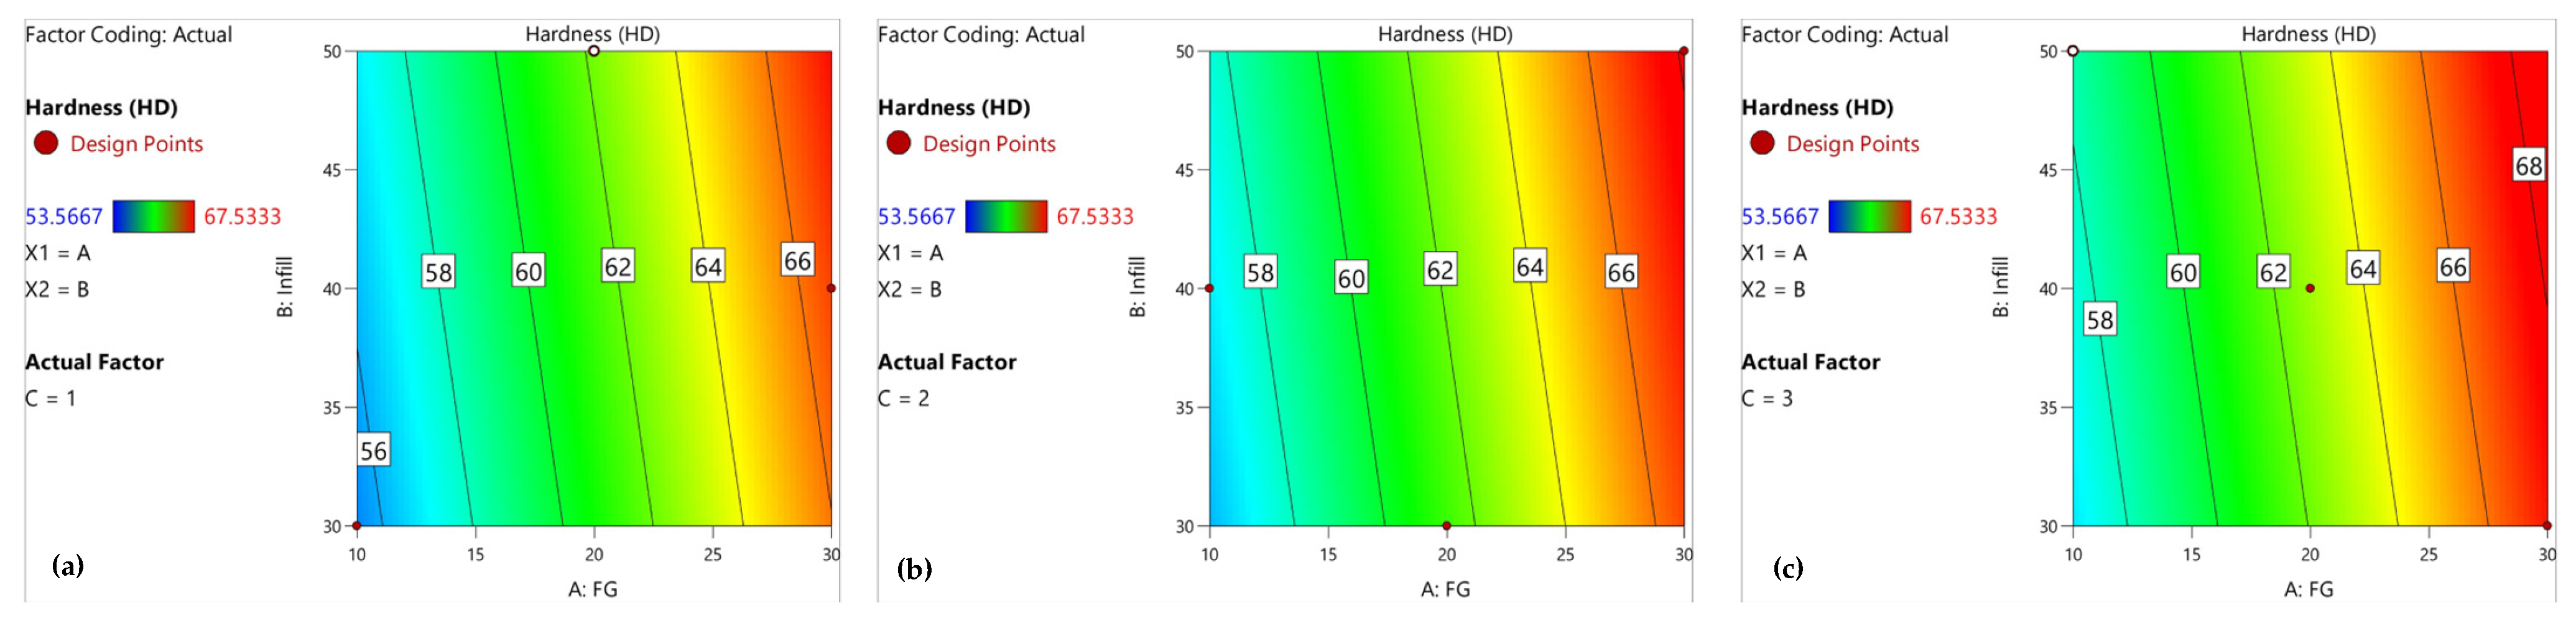
Figure 8c illustrates the main effects plot for Shore D hardness (HD), showing the influence of fiberglass (FG) content, infill density, and pattern shape on the material’s hardness. The FG content exhibits a significant positive correlation with HD, increasing from approximately 58 HD at 10 wt.% to around 68 HD at 30 wt.%. Similarly, infill density follows a rising trend, with HD increasing from about 58 HD at 30% infill to nearly 68 HD at 50% infill. In contrast, pattern shape has a relatively minor effect, with slight variations observed. HD decreases slightly at level 2 but increases again at level 3, indicating a non-linear influence. These findings suggest that FG content and infill density play dominant roles in determining hardness, whereas pattern shape has a comparatively lesser impact.
Figure 9 shows the actual compression curves generated by Load Frame (Instron 5589), which illustrates the mechanical response of 3D-printed specimens under compressive loading, with each curve representing a unique combination of fiberglass (FG) content and infill density. The axes follow the notation X/Y, where X refers to FG content (1 = 10% FG, 2 = 20% FG, 3 = 30% FG) and Y represents infill density (3 = 30% infill, 4 = 40% infill, 5 = 50% infill). The curves demonstrate that higher FG content, such as 30%, and greater infill density, such as 50%, result in steeper slopes and higher peak values, indicating improved compression strength and stiffness. Conversely, specimens with lower FG content, such as 10%, and infill density, such as 30%, exhibit more gradual slopes, signifying lower load-bearing capacity. The results highlight the synergistic influence of FG content and infill density, confirming that increasing both parameters enhances the material’s ability to withstand compressive forces, making it more suitable for load-bearing applications.
To analyze input factors’ impacts on the process, statistical methods like regression and t-tests are applied. This involves examining each input parameter (fiber percent, infill density, pattern form) individually and their interactions with dependent variables (impact strength, hardness, and compression strength). Interpretation includes assessing both statistical significance (p-values) and practical importance, ensuring a comprehensive understanding of the data.
A two-level factorial model with nine runs and three-factor interaction was created in Design Expert 13. The two-level factorial model is a design that is usually used to test the impact of multiple factors, each at two levels (such as low and high), on an outcome. It efficiently reveals the main effects of individual factors and their interactions, making it a practical choice for experimentation. In a traditional two-level factorial design, the number and levels of variables are systematically varied to explore their significant effects and interactions. A 3FI design includes the main effects, two-factor interactions, and three-factor interactions. A two-level factorial design with a 3FI model and nine runs typically has three factors (A: FG wt. percentage; B: infill density; and C: pattern shape) at two levels (low and high). The number of variables is “n” and the number of experimental trials is 2n. This design allows for the examination of the main effects of each component (A, B, and C), two-factor interactions (AB, AC, and BC), and the three-factor interaction (ABC). Design Expert 13 software was used to study each factor’s influence on the targeted response. Response surface plots were created to evaluate how each variable affects each response parameter simultaneously. AB, BC, and AC interactions were also examined.
3.1. Analysis of Variance (ANOVA)
Analysis of Variance (ANOVA) is employed to assess the variance within and between groups of data. The model calculates the F-statistic to compare the mean squares, determining whether the differences between the group means are statistically significant. If the F-statistic deviates substantially from the critical value or if the p-value is below 0.05, the null hypothesis of equal means across all groups is rejected, indicating a significant effect.
The F-statistic assesses the significance of model terms by comparing explained variance to unexplained variance. A p-value lower than 0.05 confirms the significance of a term. Adequate Precision (Adeq Precision) evaluates the signal-to-noise ratio, where values exceeding 4 indicate that the model provides sufficiently precise predictions. These statistical measures ensure the reliability and accuracy of the model in analyzing experimental outcomes.
3.1.1. ANOVA for Impact Strength
Impact strength is analyzed using a linear regression model without transformation. The model exhibits strong predictive capability, as indicated by an Adjusted R
2 of 0.9947 and a Predicted R
2 of 0.9177, with a difference of less than 0.2, confirming a satisfactory model fit. The Adeq Precision value is 46.617, signifying a strong signal-to-noise ratio and sufficient precision for navigating the design space. The ANOVA results for the two-factor interaction (2FI) model are summarized in
Table 6.
All the factors presented in the table were coded. The term df represents the Degrees of Freedom, i.e., the number of estimated parameters used to compute the source’s sum of squares. The overall model is highly significant, with an F-value of 250.90 and a p-value of 0.0040, indicating only a 0.40% probability that the observed results are due to random noise. A high F-value and a low p-value confirm that the model effectively fits the data.
Model terms with p-values below 0.0500 are deemed significant contributors. Factors A (fiberglass content), B (infill density), AC (interaction between A and C), and BC (interaction between B and C) significantly influence impact energy. Conversely, factor C (pattern shape) and the interaction term AB (interaction between A and B) are statistically insignificant and may be considered for removal if doing so does not compromise model hierarchy.
The final empirical model for impact strength, derived from the ANOVA study, is expressed in symbolic form as follows:
where
A = Fiberglass content (wt. %).
B = Infill density (%).
C = Pattern shape.
AB, AC, BC = Interaction terms.
3.1.2. ANOVA for Compression Strength
A linear regression analysis without transformation was conducted to evaluate compression strength. The half-run plot demonstrates the contribution of each factor to compression strength, revealing that fiberglass (FG) weight percentage has the most significant influence at 77.45%, followed by infill density at 20.87%, while pattern shape exhibits a negligible contribution of 0.052%, as shown in
Table 7.
The model is statistically significant, as evidenced by an F-value of 52.97, indicating a 1.86% probability that the results are due to random noise. Factors A (FG) and B (infill) are the primary contributors to compression strength, while factor C (pattern shape) and interaction terms show minimal impact. To confirm the response with the same parameters, ANOVA was conducted for the 2FI model, which is consistent with the approach used for impact strength. This model provides a reliable framework for predicting compression strength across the design space.
Based on the ANOVA analysis, the final empirical model equation in terms of actual factors is derived from Design Expert.
where
A = Fiberglass content (wt. %).
B = Infill density (%).
C = Pattern shape.
AB, AC, BC = Interaction terms.
This equation allows for precise predictions of compression strength based on factor variations. In the coded equation, higher factor levels are represented as +1 and lower levels as −1, allowing for a direct assessment of their relative effects.
3.1.3. ANOVA for Hardness
Following the same methodology, a linear regression model without transformation was employed to analyze hardness. The analysis indicates that fiberglass (FG) weight percentage has the highest impact at 82.133%, whereas infill density and pattern shape contribute marginally. The ANOVA for 2FI is presented in
Table 8.
The model’s F-value of 9.06 and
p-value of 0.0183 confirm statistical significance, suggesting that the likelihood of the results occurring due to random noise is only 1.83%. The primary contributor to hardness is fiberglass content (A), while B (infill) and C (pattern shape) show minor effects. Using these data, the final coded equation was developed (Equation (3)) and is presented as follows:
where
A = Fiberglass content (wt. %).
B = Infill density (%).
C = Pattern shape.
3.2. Response Surface Methodology
Response surface methodology (RSM) uses statistical and mathematical methods to identify the functional relationship between an input variable and many control variables [
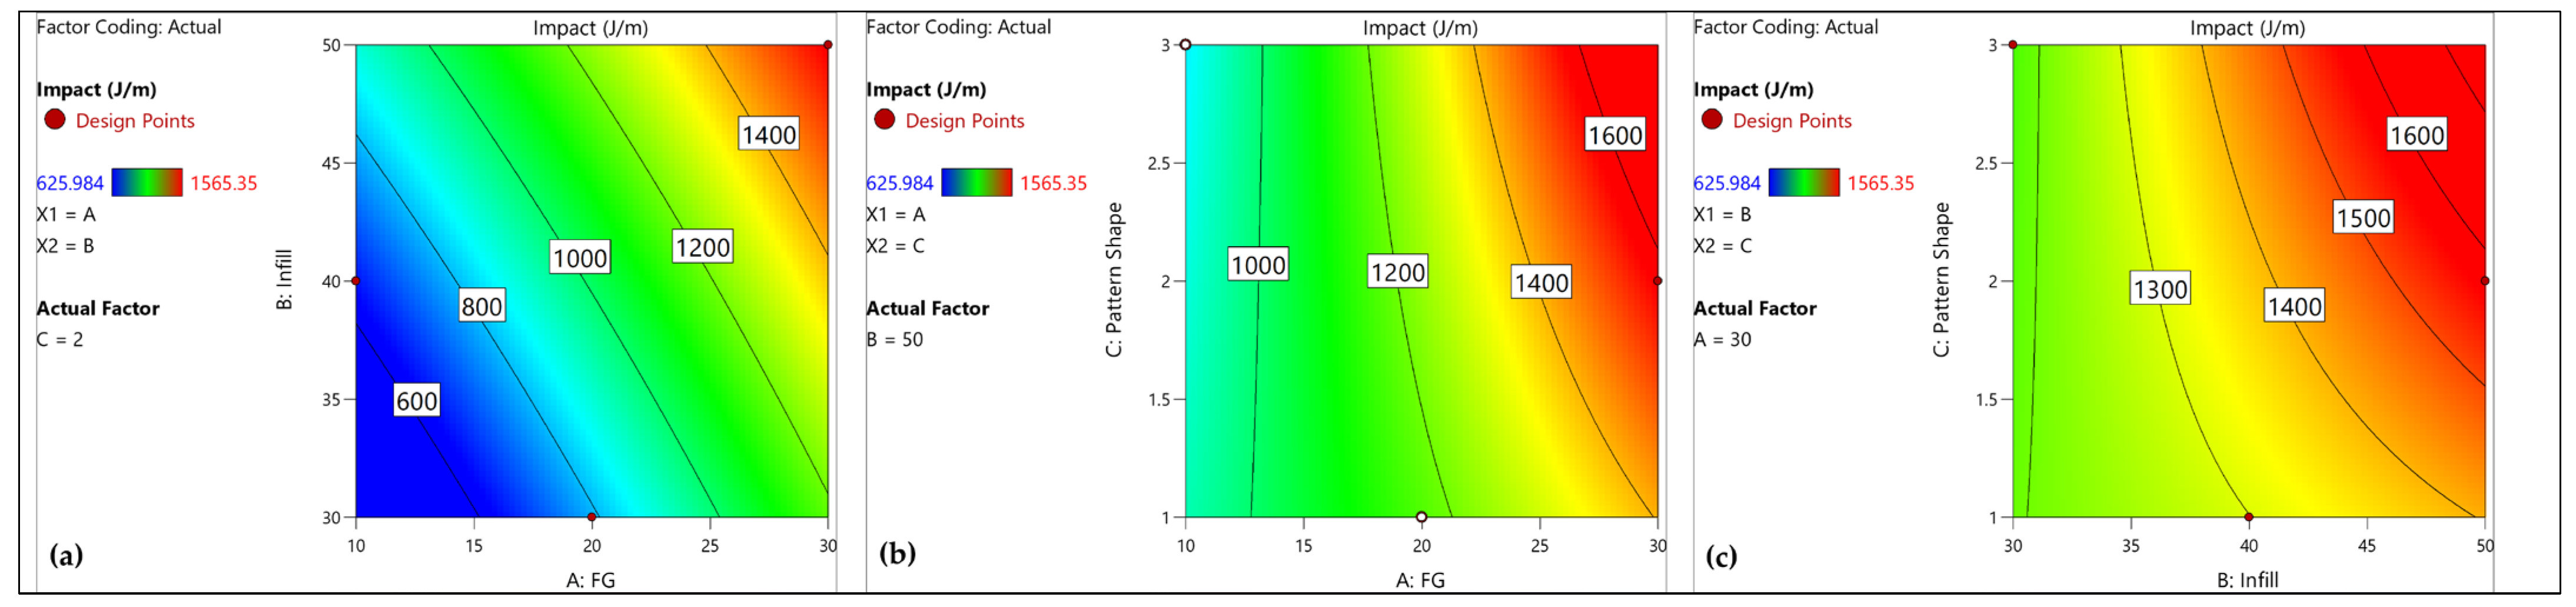
39]. In
Figure 10a–c, a contour plot of impact strength is shown for three different interactions, AB, AC, and BC, respectively.
Figure 10a illustrates that the impact energy increases with higher fiber weight percentage and greater infill density. This trend indicates that both factors contribute significantly and almost equally to enhancing the material’s impact strength. As the fiber content and infill density increase, the material’s ability to absorb and dissipate energy under impact also rises, resulting in improved impact resistance. The FG wt. percent and infill density show similar behavior against pattern shape, as shown in
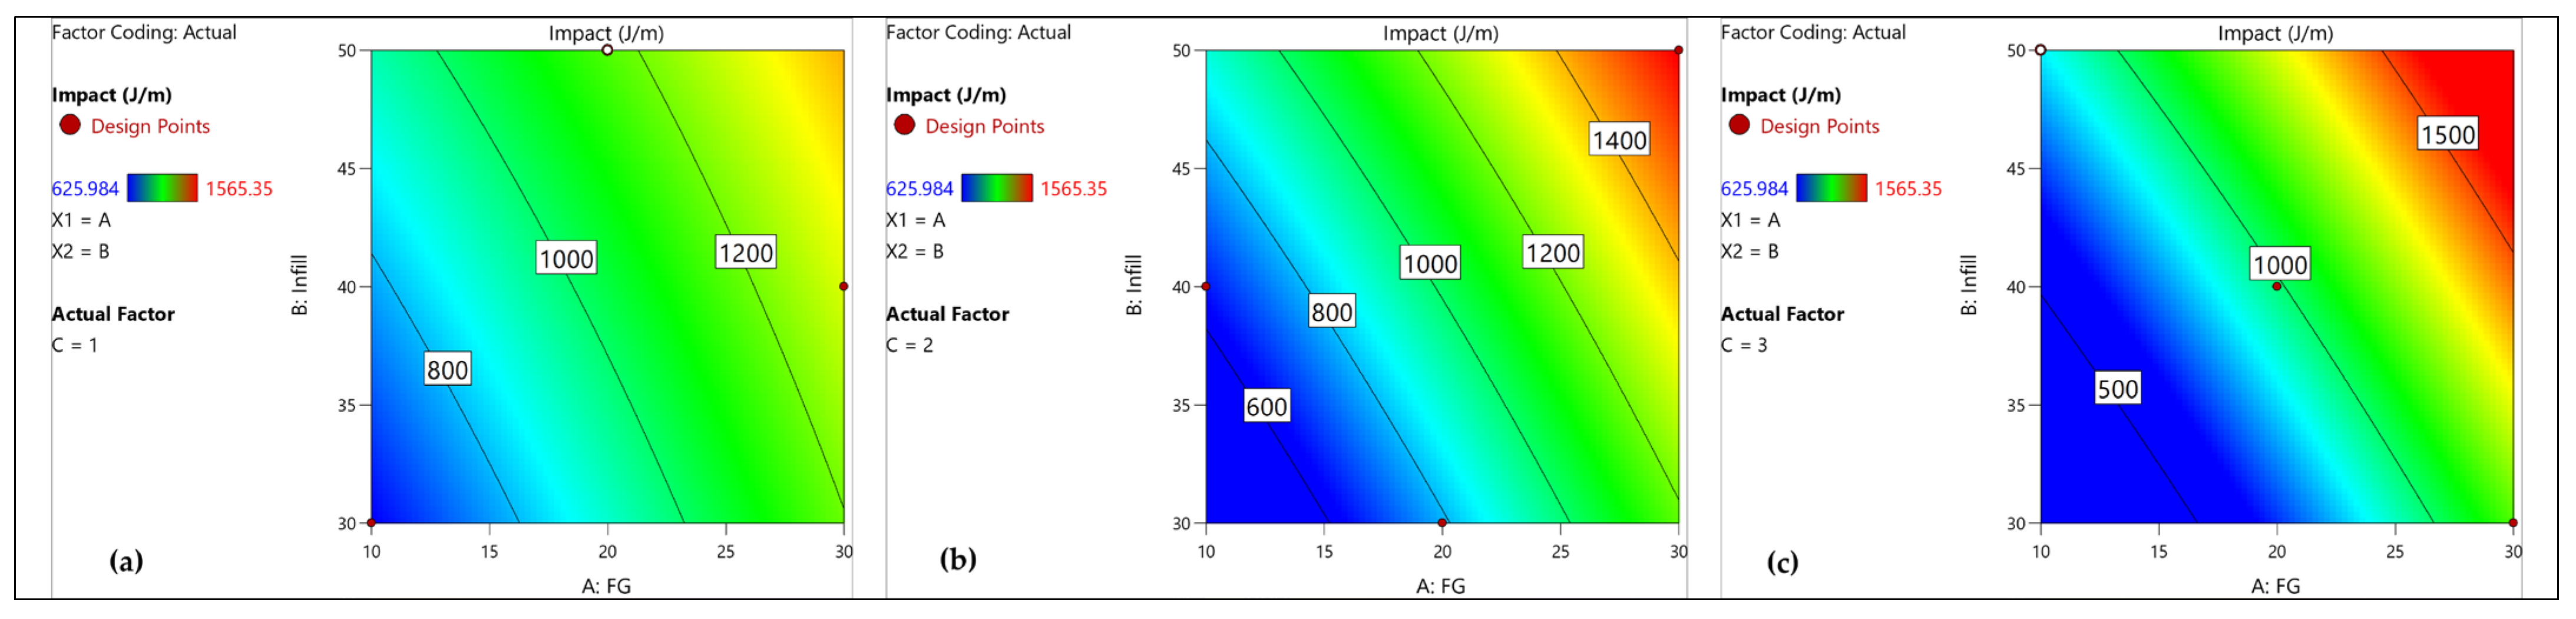
Figure 10b,c. Now, based on this, contour plots (
Figure 11a–c) were made with increasing levels of C (pattern shape). In these, it can be observed that pattern shape has a good contribution over impact strength, requiring over 1500 J/m for pattern shape (C = 3), further explaining the results.
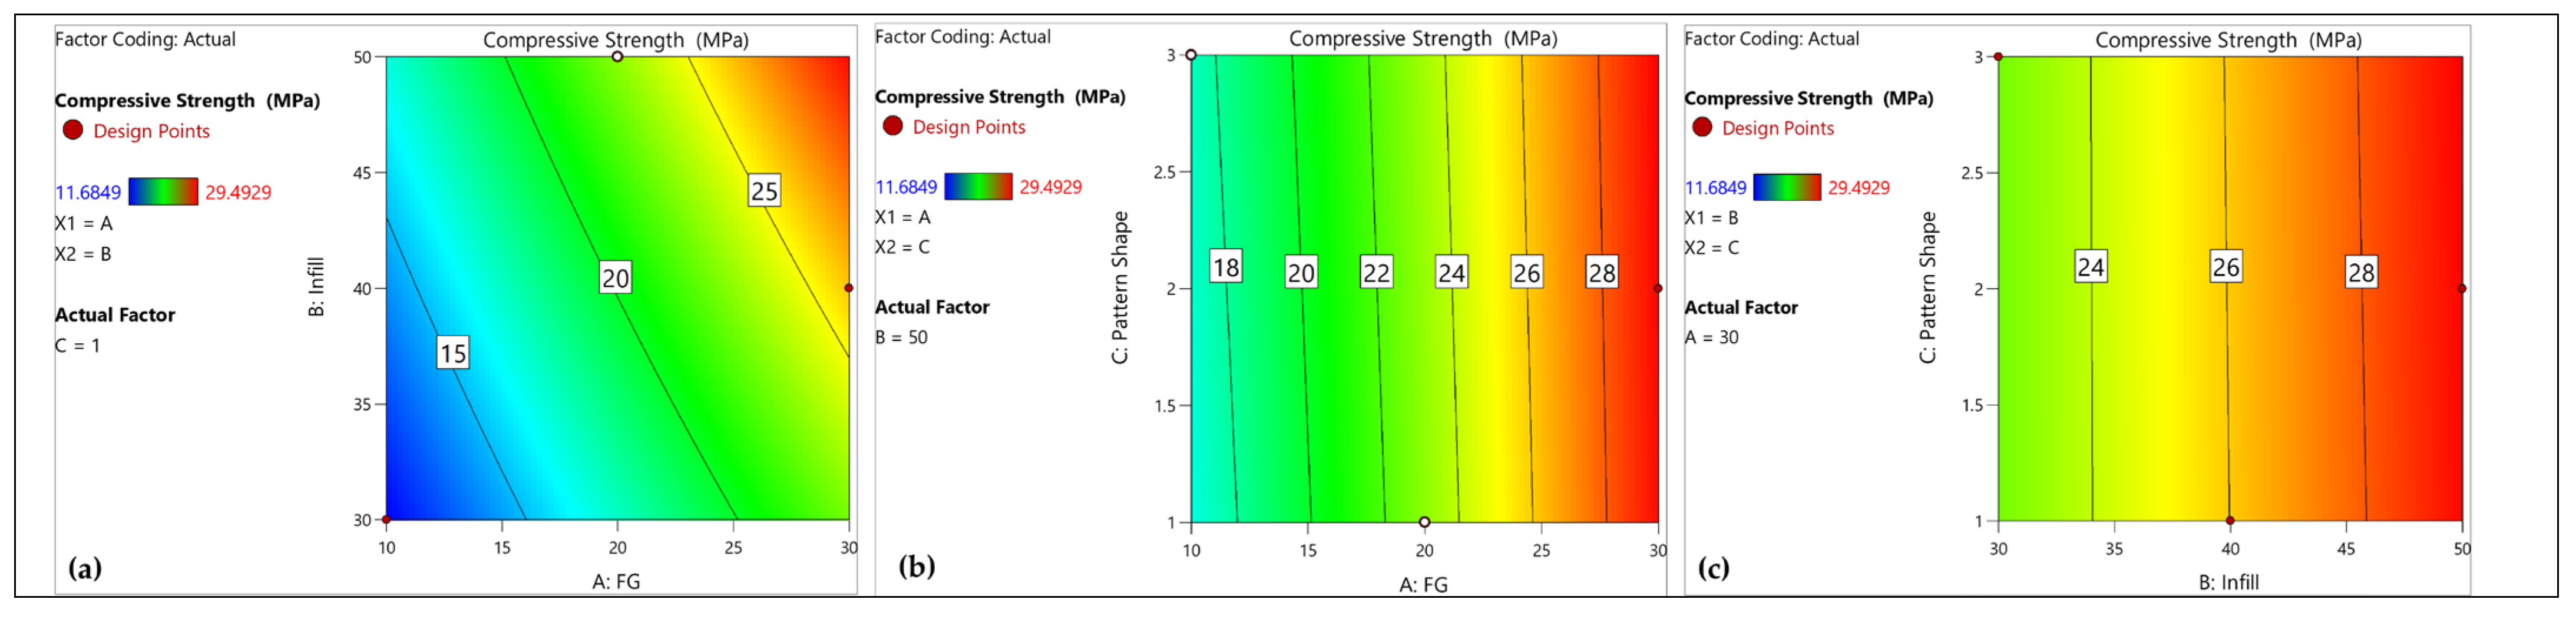
Contour plots for compression strength are presented in
Figure 12a–c with interactions of AB, AC, and BC, respectively.
Figure 12a is a relation between factors A and B with pattern shape 2. The maximum compression strength region is with an FG wt. percent of 30% and infill density of 50%. Here, similar to the previous contour plots, an almost equal contribution of A and B can be seen (
Figure 12a) with similar trends against pattern shape in
Figure 12b,c.
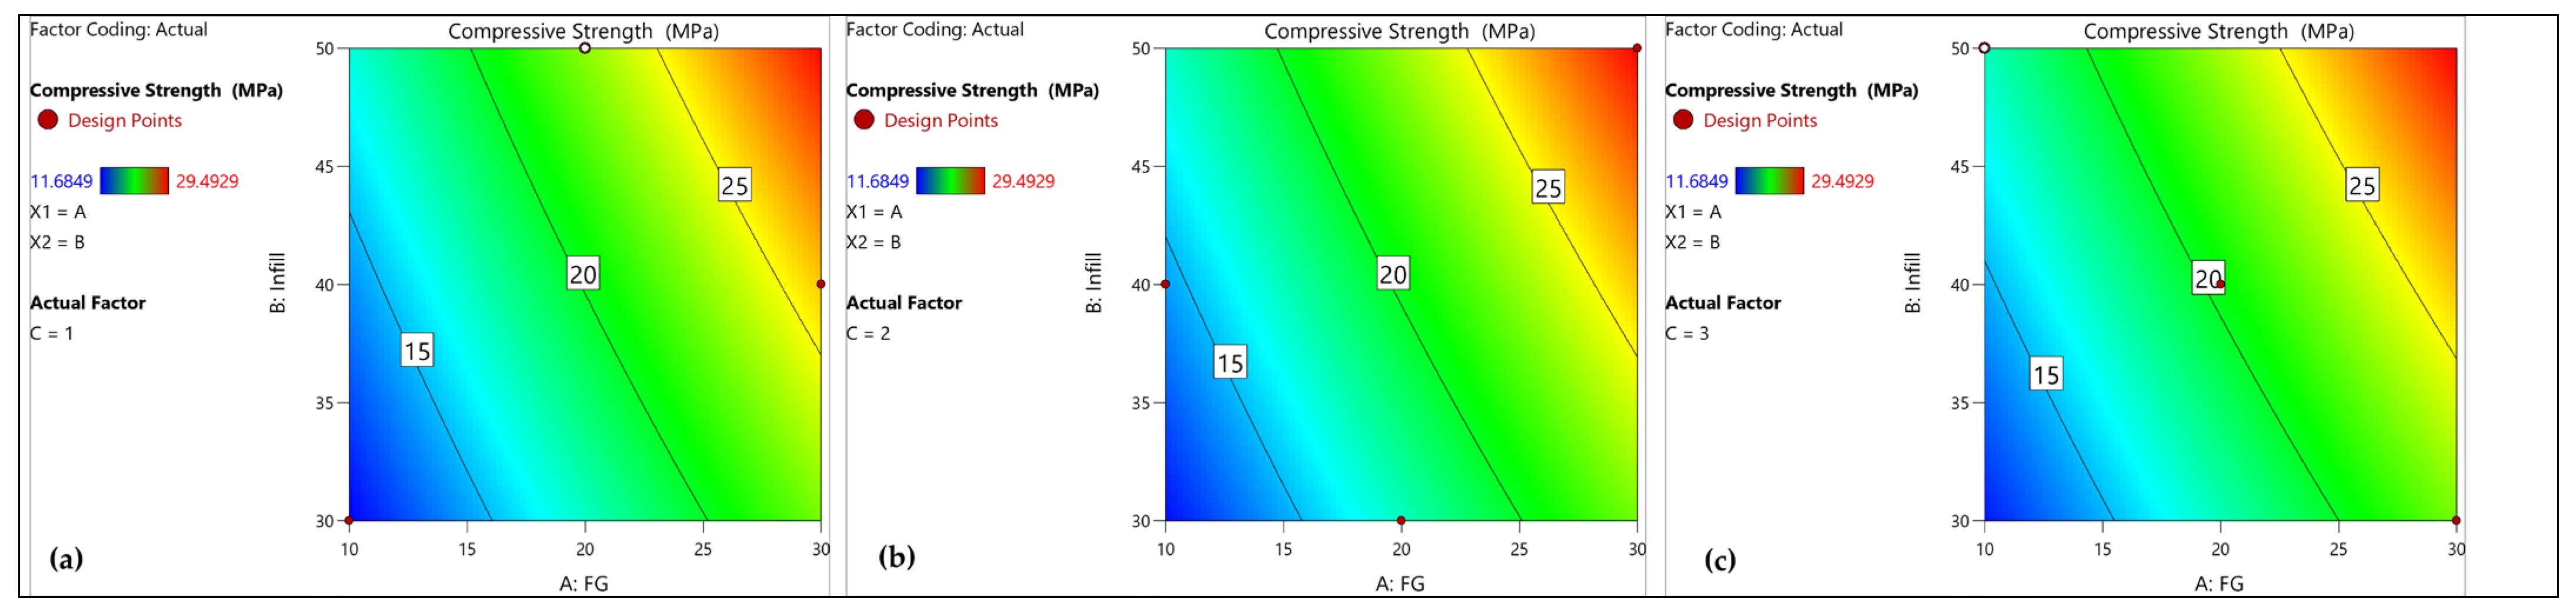
Figure 13a–c presents contour plots similar to those in
Figure 11, depicting the compression strength as a function of factors A (fiber weight percentage) and B (infill density) at varying levels of factor C (pattern shape). It is evident from the plots that pattern shape does not have a prominent effect on the overall compression strength.
Contour plots for hardness are shown in
Figure 14a–c for AC interaction and increasing levels of B, i.e., 30%, 40%, and 50%, respectively. For an infill density of 50%, maximum hardness is observed.
3.3. Parametric Study
A parametric study was conducted with a set of constraints selected from the literature [
39,
40], as presented in
Table 9. The selection was based on the availability of testing equipment. The initial value for the weights is set as 1.0. The maximum importance value of 5 is assigned to all factors and responses.
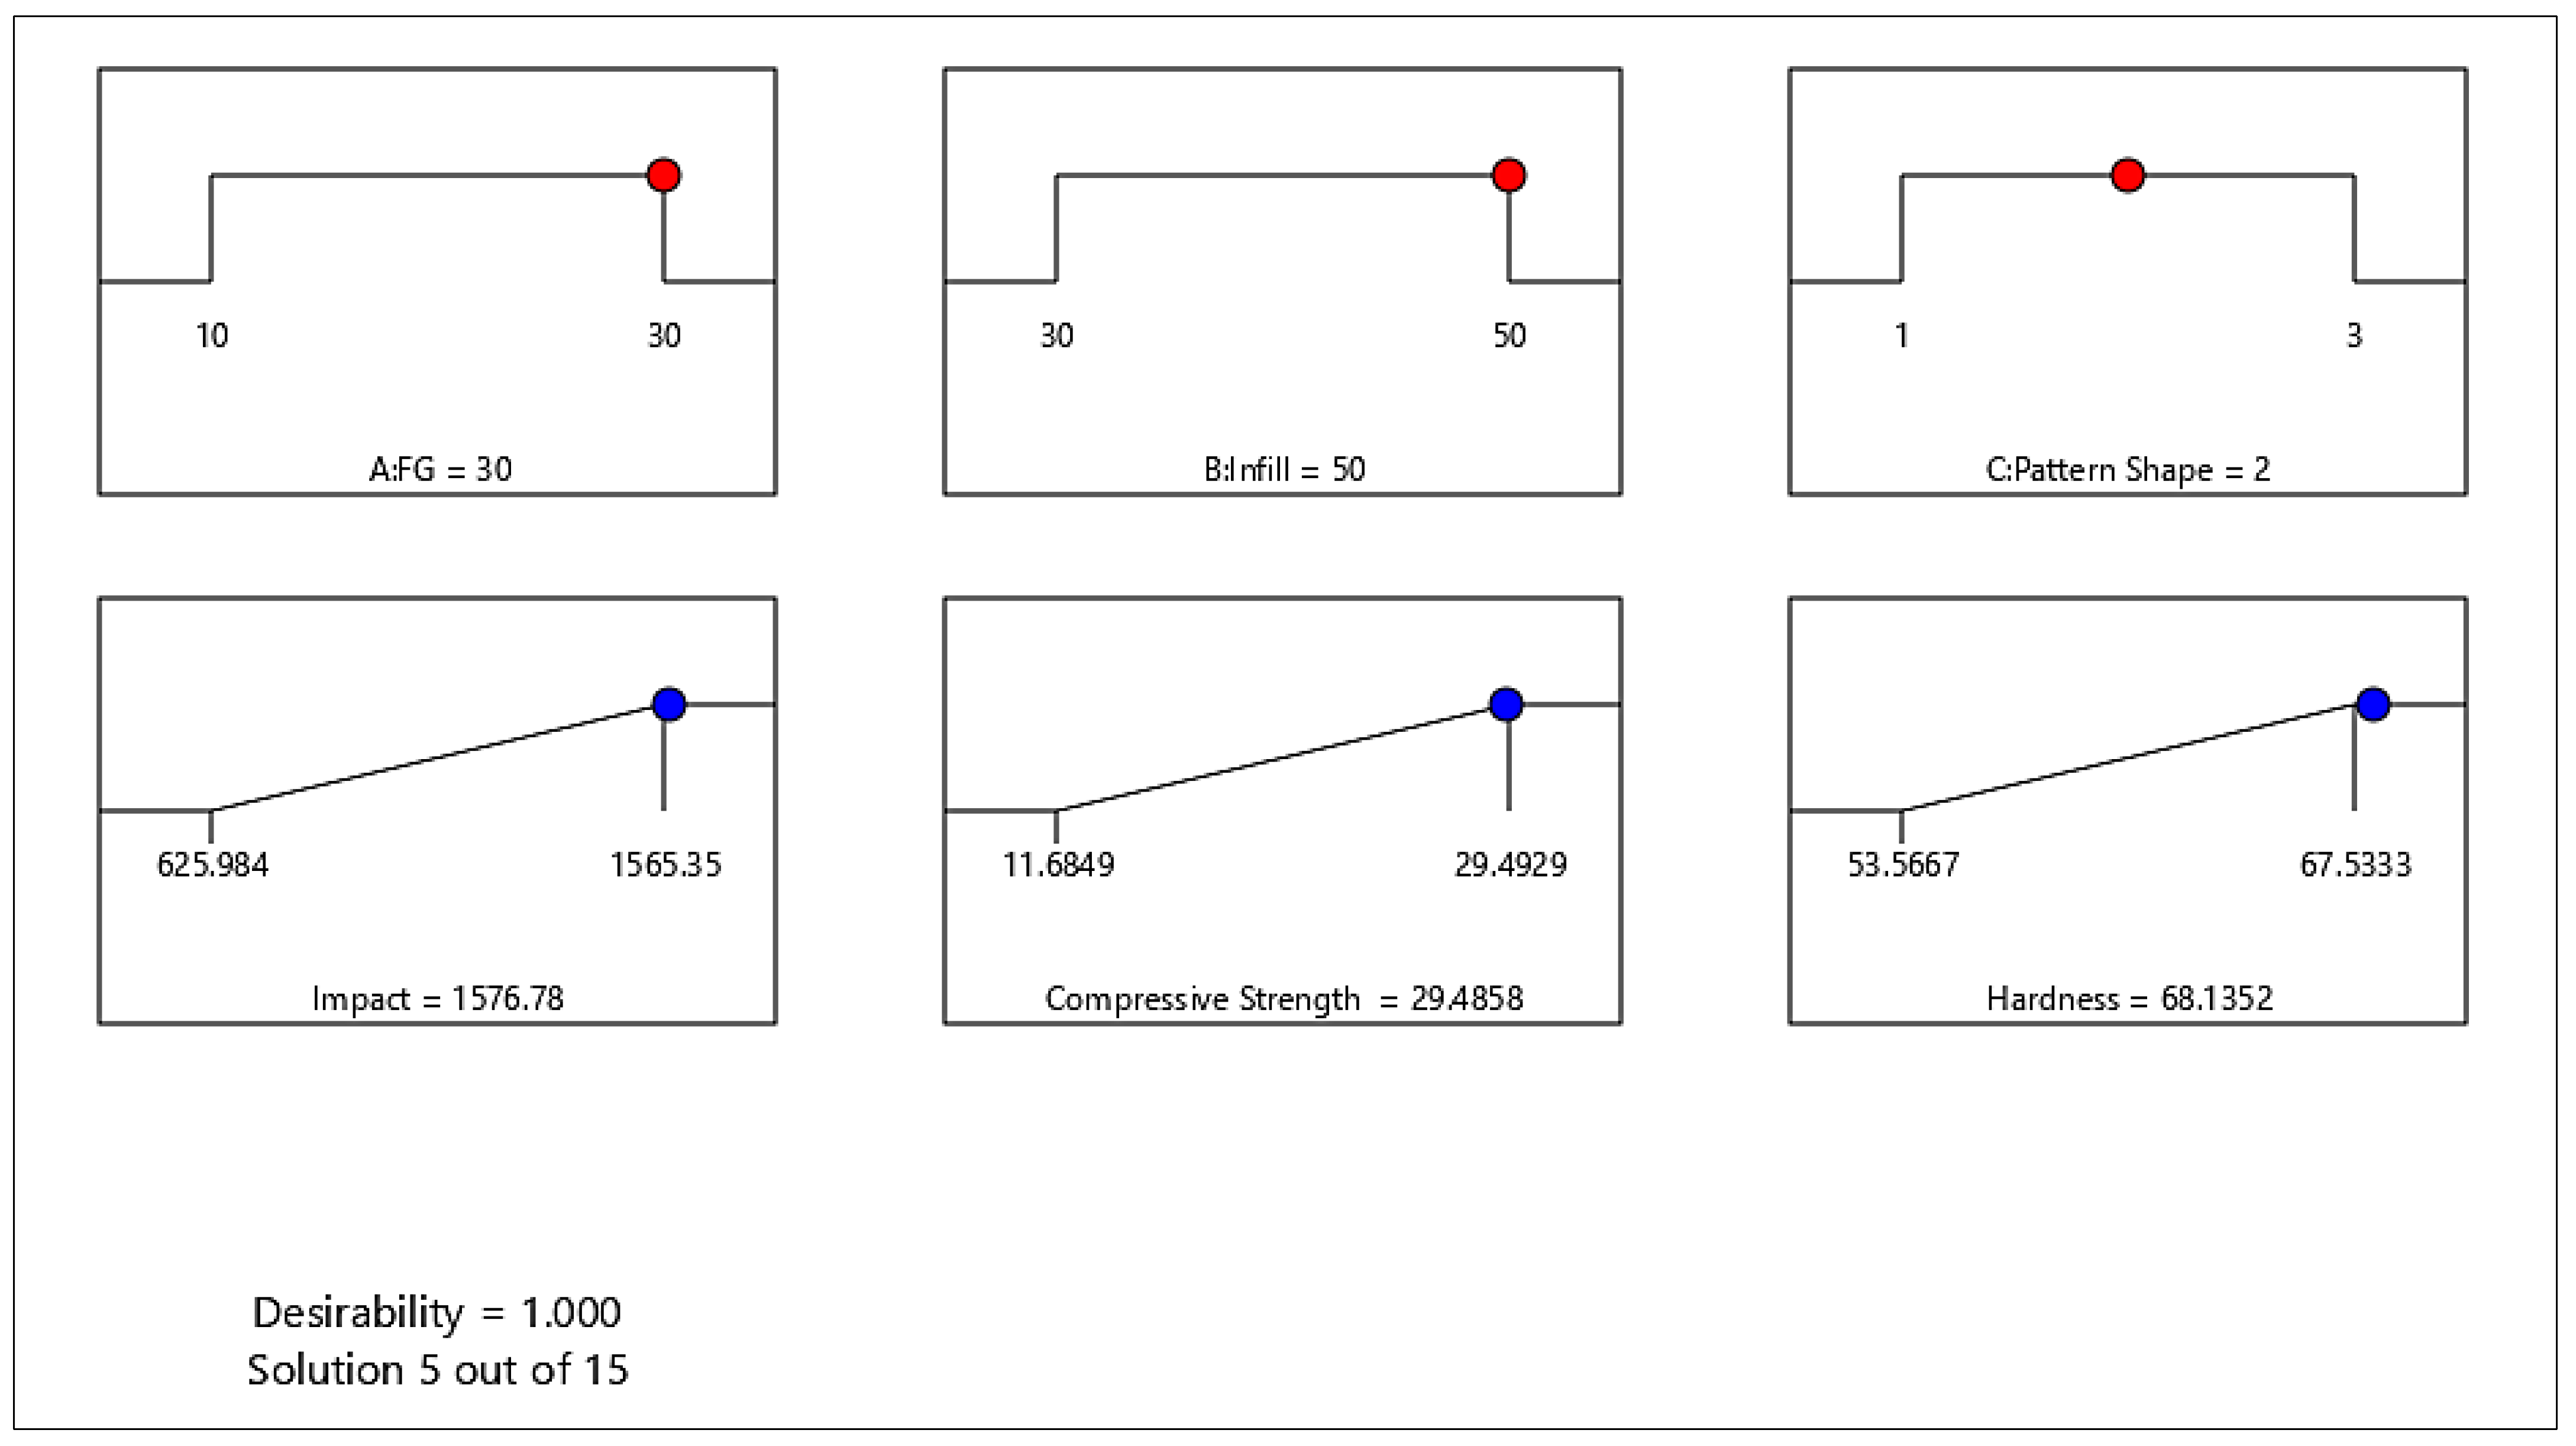
The goal set for responses was “to Maximize” the results with parameter values set as “In range”. As a result of the optimization run, it gave 15 possible solutions with a desirability value 1 for five solutions. The selected optimization model was number 5 and is presented in
Table 10.
Among the proposed solutions with a desirability score of 1, solution #5 was chosen. When reviewing the table in reverse order (from desirability value 15 to 1), solution #5 stands out because it achieves a desirability of 1 with a fiber weight percentage (FG) of 30% and an infill density of 50%. Notably, this is the only solution among those with a desirability score of 1 that is configured for pattern shape 2. All other solutions with a desirability score of 1 are associated with pattern shape 3. Therefore, solution #5 is chosen for its optimal parameter settings and its alignment with pattern shape 2.
Figure 15 shows the ramp model for the selected optimization solution with a maximum goal and with a desirability factor of 1. For an FG wt percent of 30% and infill density of 50% and pattern shape rectangular, all the responses have maximum values.
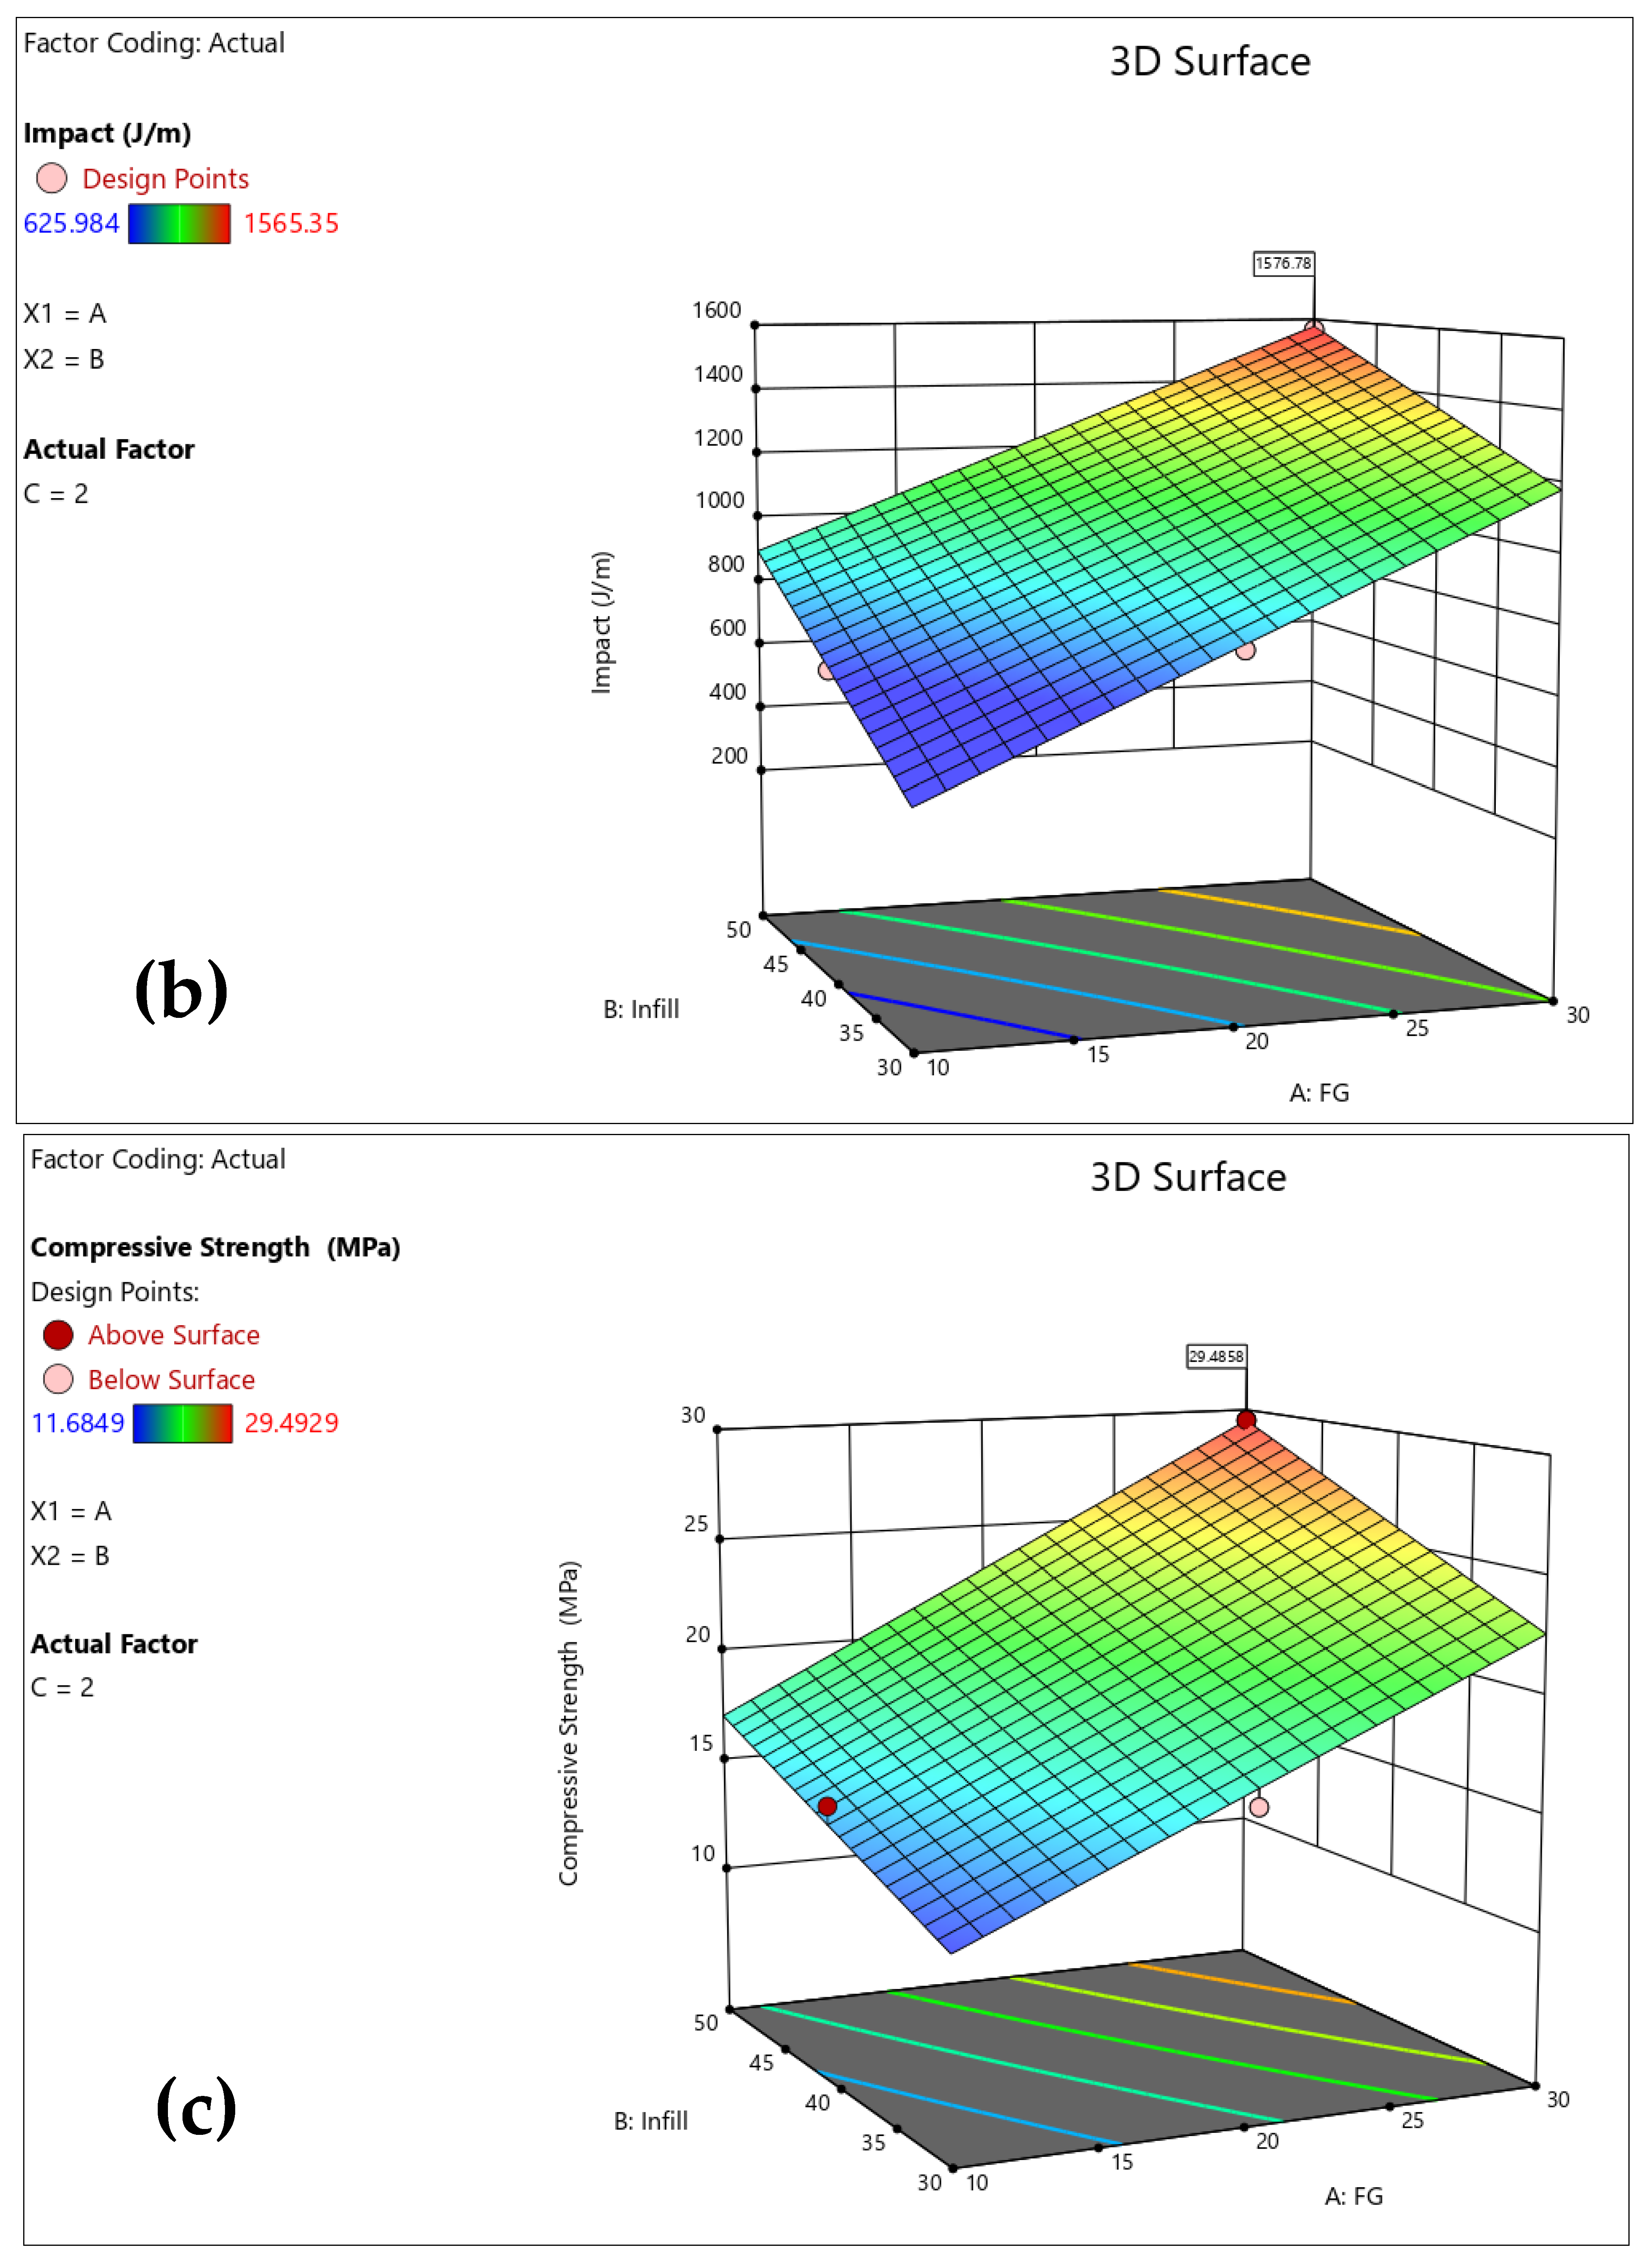
The optimized parameter contour plots with a desirability plot and for all responses, i.e., impact, compression, and hardness, is presented in
Figure 16a. It can be observed that to obtain a desirability of 80%, the infill density should be greater than 34% while the FG wt. percentage should be at max, i.e., 30%. The optimized model 3D contour plots to obtain an understanding of the relationship between 3 x-factors at a time and to know the optimized responses, separate 3D contours for impact strength, compression strength, and hardness are presented in
Figure 16b–d.
A confirmatory test was conducted as shown in
Table 11 using the optimal parameters obtained from the optimization results. Due to the limitation of the 3D printer, which can only print in whole numbers, the fifth best result from
Table 10 was selected. The results from the confirmatory test aligned closely with those from the optimization, with minor variations potentially attributed to human error. The values presented are averaged from a total of three tests.
4. Discussions
This study investigates the mechanical properties of fiberglass (FG)-reinforced Onyx composites using a dual nozzle FDM process. The results show that both FG weight percentage and infill density significantly enhance the Izod impact strength, with a maximum value of 1565.35 J/m, which is 4.743 times higher than the 330 J/m for pure Onyx. This improvement aligns with previous studies that highlight fiber reinforcement as key to enhancing impact resistance.
Similarly, the compressive strength increases with FG percentage, with the highest values observed at 30% FG and 50% infill density, supporting findings from other research on fiber-reinforced composites. However, the pattern shape did not significantly affect compressive strength, which differs from some studies suggesting its influence. This warrants further investigation.
Hardness values also increased with FG percentage and infill density, with the maximum value 33.8137% higher than pure PLA, confirming the role of fiber reinforcement in improving stiffness. The SEM analysis revealed that FG reinforcement reduced crack propagation, and defects like de-bonding and delamination could be mitigated by post-processing, as noted in other studies.
In summary, the results highlight the potential of FG-reinforced Onyx for improved mechanical properties in 3D printing, contributing to existing research on composite material optimization. These findings have implications for industries such as aerospace, automotive, and biomedical engineering.
5. Conclusions
The primary goal of this study was to determine the optimal conditions to improve Izod impact strength, compression strength, and hardness performance. Utilizing an FDM dual nozzle 3D printer, continuous FG-reinforced Onyx composites were manufactured for the Izod impact test, compression test, and hardness test, and their performance was evaluated. The effect of process parameters, such as fiber wt. percentage, infill density, and infill pattern, were examined and main effects plots and interaction and contour plots were established. It was found that the FG weight percentage and infill density parameters have a significant impact on the Izod impact strength.
The maximum reported impact strength 1565.35 J/m is 4.743 times greater than the reported value of Onyx by MarkForged® data sheet, i.e., 330 J/m. In our experimental results, the maximum impact energy of 19.88 J is greater than the maximum observed impact energy, i.e., 8.8 J of fiber-reinforced 3D filament material by the Mark X7 3D printer. The maximum hardness was achieved at an FG wt. percent of 30% and infill density of 50% with pattern shape rectangular. The experimental results were validated with the optimization solutions of Design Expert with a percent difference of only 0.73%. The best conditions were already in the design of experiments.
The compression strength increases with the increase in FG volume percent from 10 to 30% and the maximum observed value is at 30% with an infill density of 50%. The pattern shape does not significantly affect the compression strength. The maximum hardness reported from the experimental results is 33.81% greater than the pure PLA. The overall value of hardness increases with the increase in FG volume and infill density from 10 to 30% and 30 to 50%, respectively.
Optimization was performed, with a case scenario, i.e., maximizing responses with factors in range. A small variation from the experimental results was observed. The error of 0.73% was recorded with desirability 1 for FG wt. 30%, infill density 50%, and rectangular pattern shape. The values obtained for predicted impact energy, compressive strength, and Shore D hardness are 1576.78 J/m, 29.49 MPa, and 68.14 HD, respectively.


 ,
, 


