1. Introduction
In progressive stamping, the main factors like speed, force, tool design, and quality of production play a crucial role in the material flow and tool interactions. This directly affects the final part dimensions. Several studies have shown that increased press speed can lead to undesirable dimensional deviations. Hu et al. [
1] noted that faster stamping rates can result in increased dynamic forces, which can cause material deformation and tool misalignment, which can alter component geometry. Higher stamping rates reduce material flow control, leading to problems like spring-back and feature misalignment on the stamped item [
2]. In progressive stamping, press force has a significant effect on part quality. Even when sufficient force is needed for material deformation, excessive press force can cause undesirable dimensional deviations such as spring-back, thinning, and tool damage. Excessive press force during stamping can entail a variety of dimensional problems. Research shows that more force increases thinning and pushes strain over the material’s elastic limit, resulting in irreversible deformation. The authors of [
3] claim that excessive force causes an uneven distribution of stress, which leads to warping in high-strength steel components. Additionally, overstressing aluminum or other alloys results in spring-back, which reduces dimensional accuracy by forcing parts to partially return to their original shape [
2].
High press forces make spring-back, a frequent dimensional problem in steel stamping, worse. As press forces increase, the steel deviates from the intended shape because of its elastic rebound during unloading. In the literature, the authors of [
2] conclude in their analysis of advanced high-strength steels (AHSSs) that excessive press force increases residual stresses, which in turn results in increased spring-back effects. These variations are particularly noticeable in designs that are lighter and use thinner steel plates. Regarding unalignment and warping, the uneven distribution of stress during the stamping process is the cause of the warping and misalignment of steel plates under high-force circumstances. Localized deformation brought on by high loads results in bending surfaces and an uneven assembly fit [
4,
5,
6,
7,
8,
9,
10]. This is extremely risky since cumulative mistakes have the potential to spread across subsequent stamping lines. This is particularly problematic in progressive stamping lines, where cumulative errors may span multiple steps. Excessive press forces accelerate punch and die wear, which leads to tool geometry problems. By creating burrs and irregular cuts on steel plates, excessive force usage reduces tool life and compromises dimensional accuracy [
5,
6,
7,
9]. The research emphasized the need for wear-resistant tool coatings and advanced lubricants in mitigating these effects [
11]. In scientific articles, it was found that high press forces cause an uneven distribution of stress, which results in misalignments and out-of-plane distortions in multi-stage assemblies [
12,
13]. If these are increased forces, the likelihood of residual stresses, which worsen warping and lower assembly quality, increase [
6]. Sophisticated monitoring systems and careful force optimization are required to lessen these issues [
6,
9,
10].
It is crucial to recognize that tool design plays a key role in minimizing the impact of speed. Advanced progressive tools are more resilient to the effects of high-speed operations because they have characteristics like improved die clearance and sophisticated coatings [
13]. It was noted that using optimized die geometries to reduce stress concentrations at faster speeds can improve the uniformity of parts [
3,
14,
15,
16,
17,
18,
19,
20]. Additionally, servo-driven presses allow for more precise control over stamping parameters, improving the ability to maintain dimensional tolerances.
A review of the literature suggests that the introduction of sensor technology into the stamping tool allows for independent or semi-independent monitoring of the process and part quality. The main aim of this research is to investigate the possibility of using load sensor technology to autonomously monitor part quality in a continuous process.
A couple hypotheses were formulated:
1. There is an existing relationship between the applied stamping force and the geometric dimensions of the part;
2. Stamping force could be used to monitor part bending angles and the overall width of stamping parts.
Both hypotheses are based on the principle of the force–distance measurement, where the force on the material grows exponentially with the tool top plate being lowered.
The primary objective of this research is to explore the application of load sensor technology for autonomous monitoring of part quality in a continuous progressive stamping process. The research aims to establish a direct relationship between stamping force and the geometric dimensions of stamped components.
The novelty of this research lies in real-time monitoring using load sensors. Unlike traditional quality control methods, this research investigates the feasibility of using load sensors to continuously monitor and assess the part quality without interrupting the manufacturing process.
Regarding force–dimension correlation, this research hypothesizes that applied stamping force directly influences part dimensions, particularly bending angles and overall width. This relationship has not been extensively researched for real-time quality control in progressive stamping.
The next section of this research reveals the methodology, simulations, and numerical setup of this research.
2. Experimental Research Methodology
In metal forming operations, stamping force is an essential characteristic since it has a direct impact on the quality of the finished product. By altering the press slide height, this parameter can be changed, giving operators more control over the force used during stamping. Under controlled circumstances, stamping tests were conducted to determine the relationship between the stamping force and the bending angle. The data during these tests were acquired from the flywheel angle sensor and the press load sensors (JZT1 and JZT2). On the diagonally opposite columns of the press, the JZT1 and JZT2 sensors were positioned strategically, as seen in
Figure 1.
The total force exerted by the press is the combined result of forces generated during each operational phase and the resistance from the mechanical springs within the system. To better understand the specific contribution of the bending phase to the overall force, a mathematical model of the bending process was developed and analyzed through simulation. This approach offered deeper insights into the distribution of forces and their influence on the resulting bending behavior.
The experimental and simulated processes began with DC01 steel sheets having a nominal thickness of 1 mm. The press was operated at a speed of 40 cycles per minute, with lubrication levels set according to the specifications outlined in the tool instruction. These conditions ensured consistency and reliability for comparative analysis.
To measure the press load of the tool, two load sensors, JZT1 and JZT2, were installed on diagonally opposite columns of the press, as seen in
Figure 2. These sensors were calibrated to ensure their combined output accurately reflected the total force exerted by the press. The technical specifications of the sensors are provided in
Table 1.
A shaft position sensor, model CEV58S–00117, was integrated into the press to monitor its operation. The technical specifications of this sensor are detailed in
Table 2.
The sensors were linked to the data processing and control system, the compact PRESS smart LINE. An intelligent controller that continuously monitors and analyzes the signals from the connected sensors, ensuring the protection of both the press and the installed tooling, while optimizing and controlling the production process, is central to this system. Additional components of this system are outlined in
Table 3, and their integration and practical application within the stamping line are illustrated in
Figure 3.
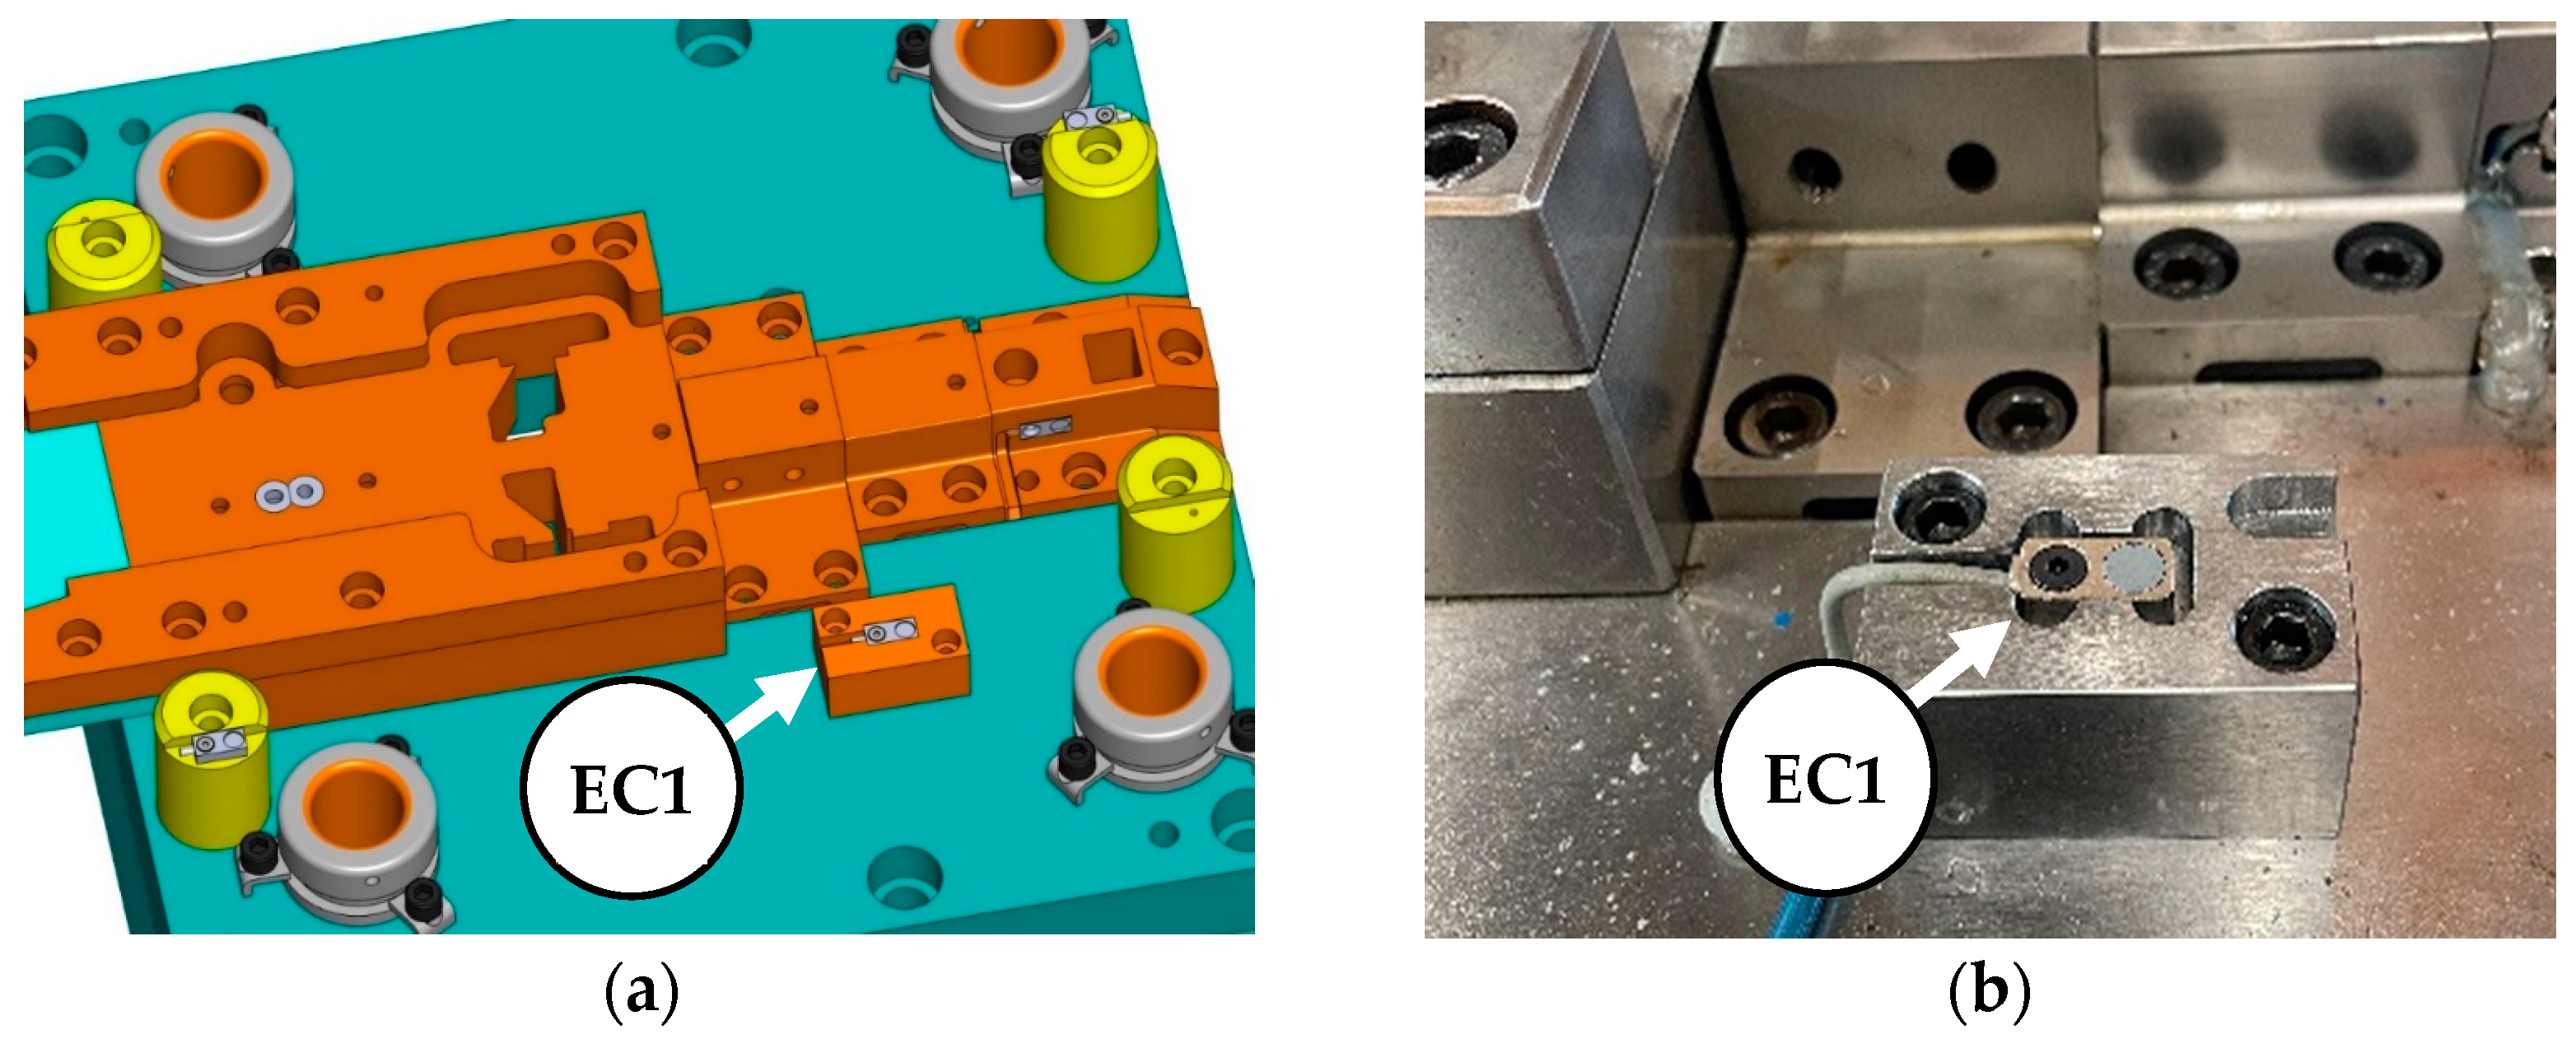
An eddy current sensor was placed to compare the determined press slide with the real press slide. The eddy current sensor was selected because of its measuring range and good resolution. To provide precise, localized readings, it was set up on the backing plate next to the bending step. The locations of the eddy current sensor installation are illustrated in
Figure 3. Technical specifications can be found in
Table 4.
In parallel, a mathematical model was developed based on the existing progressive tool design. This model was utilized to perform simulations under the same set-up parameters as those used in real production, allowing for a comparative analysis of theoretical and actual outcomes.
The Transvalor Forge, a non-linear solver program, was used to simulate the mathematical model. To isolate the effects of other stations and produce more lucid findings, the main goal of these simulations was to duplicate the bending process steps carried out in the tool with the same process settings. The oil lubrication between the sheet and bending punches was simulated using a Tresca-limited Coulomb friction model, with a friction factor of 0.1. Based on weak exchange conditions, the default heat transfer rate between the tools and the sheet was calculated to be 2000 W/m2K. All model components were initially set to a temperature of 20 °C.
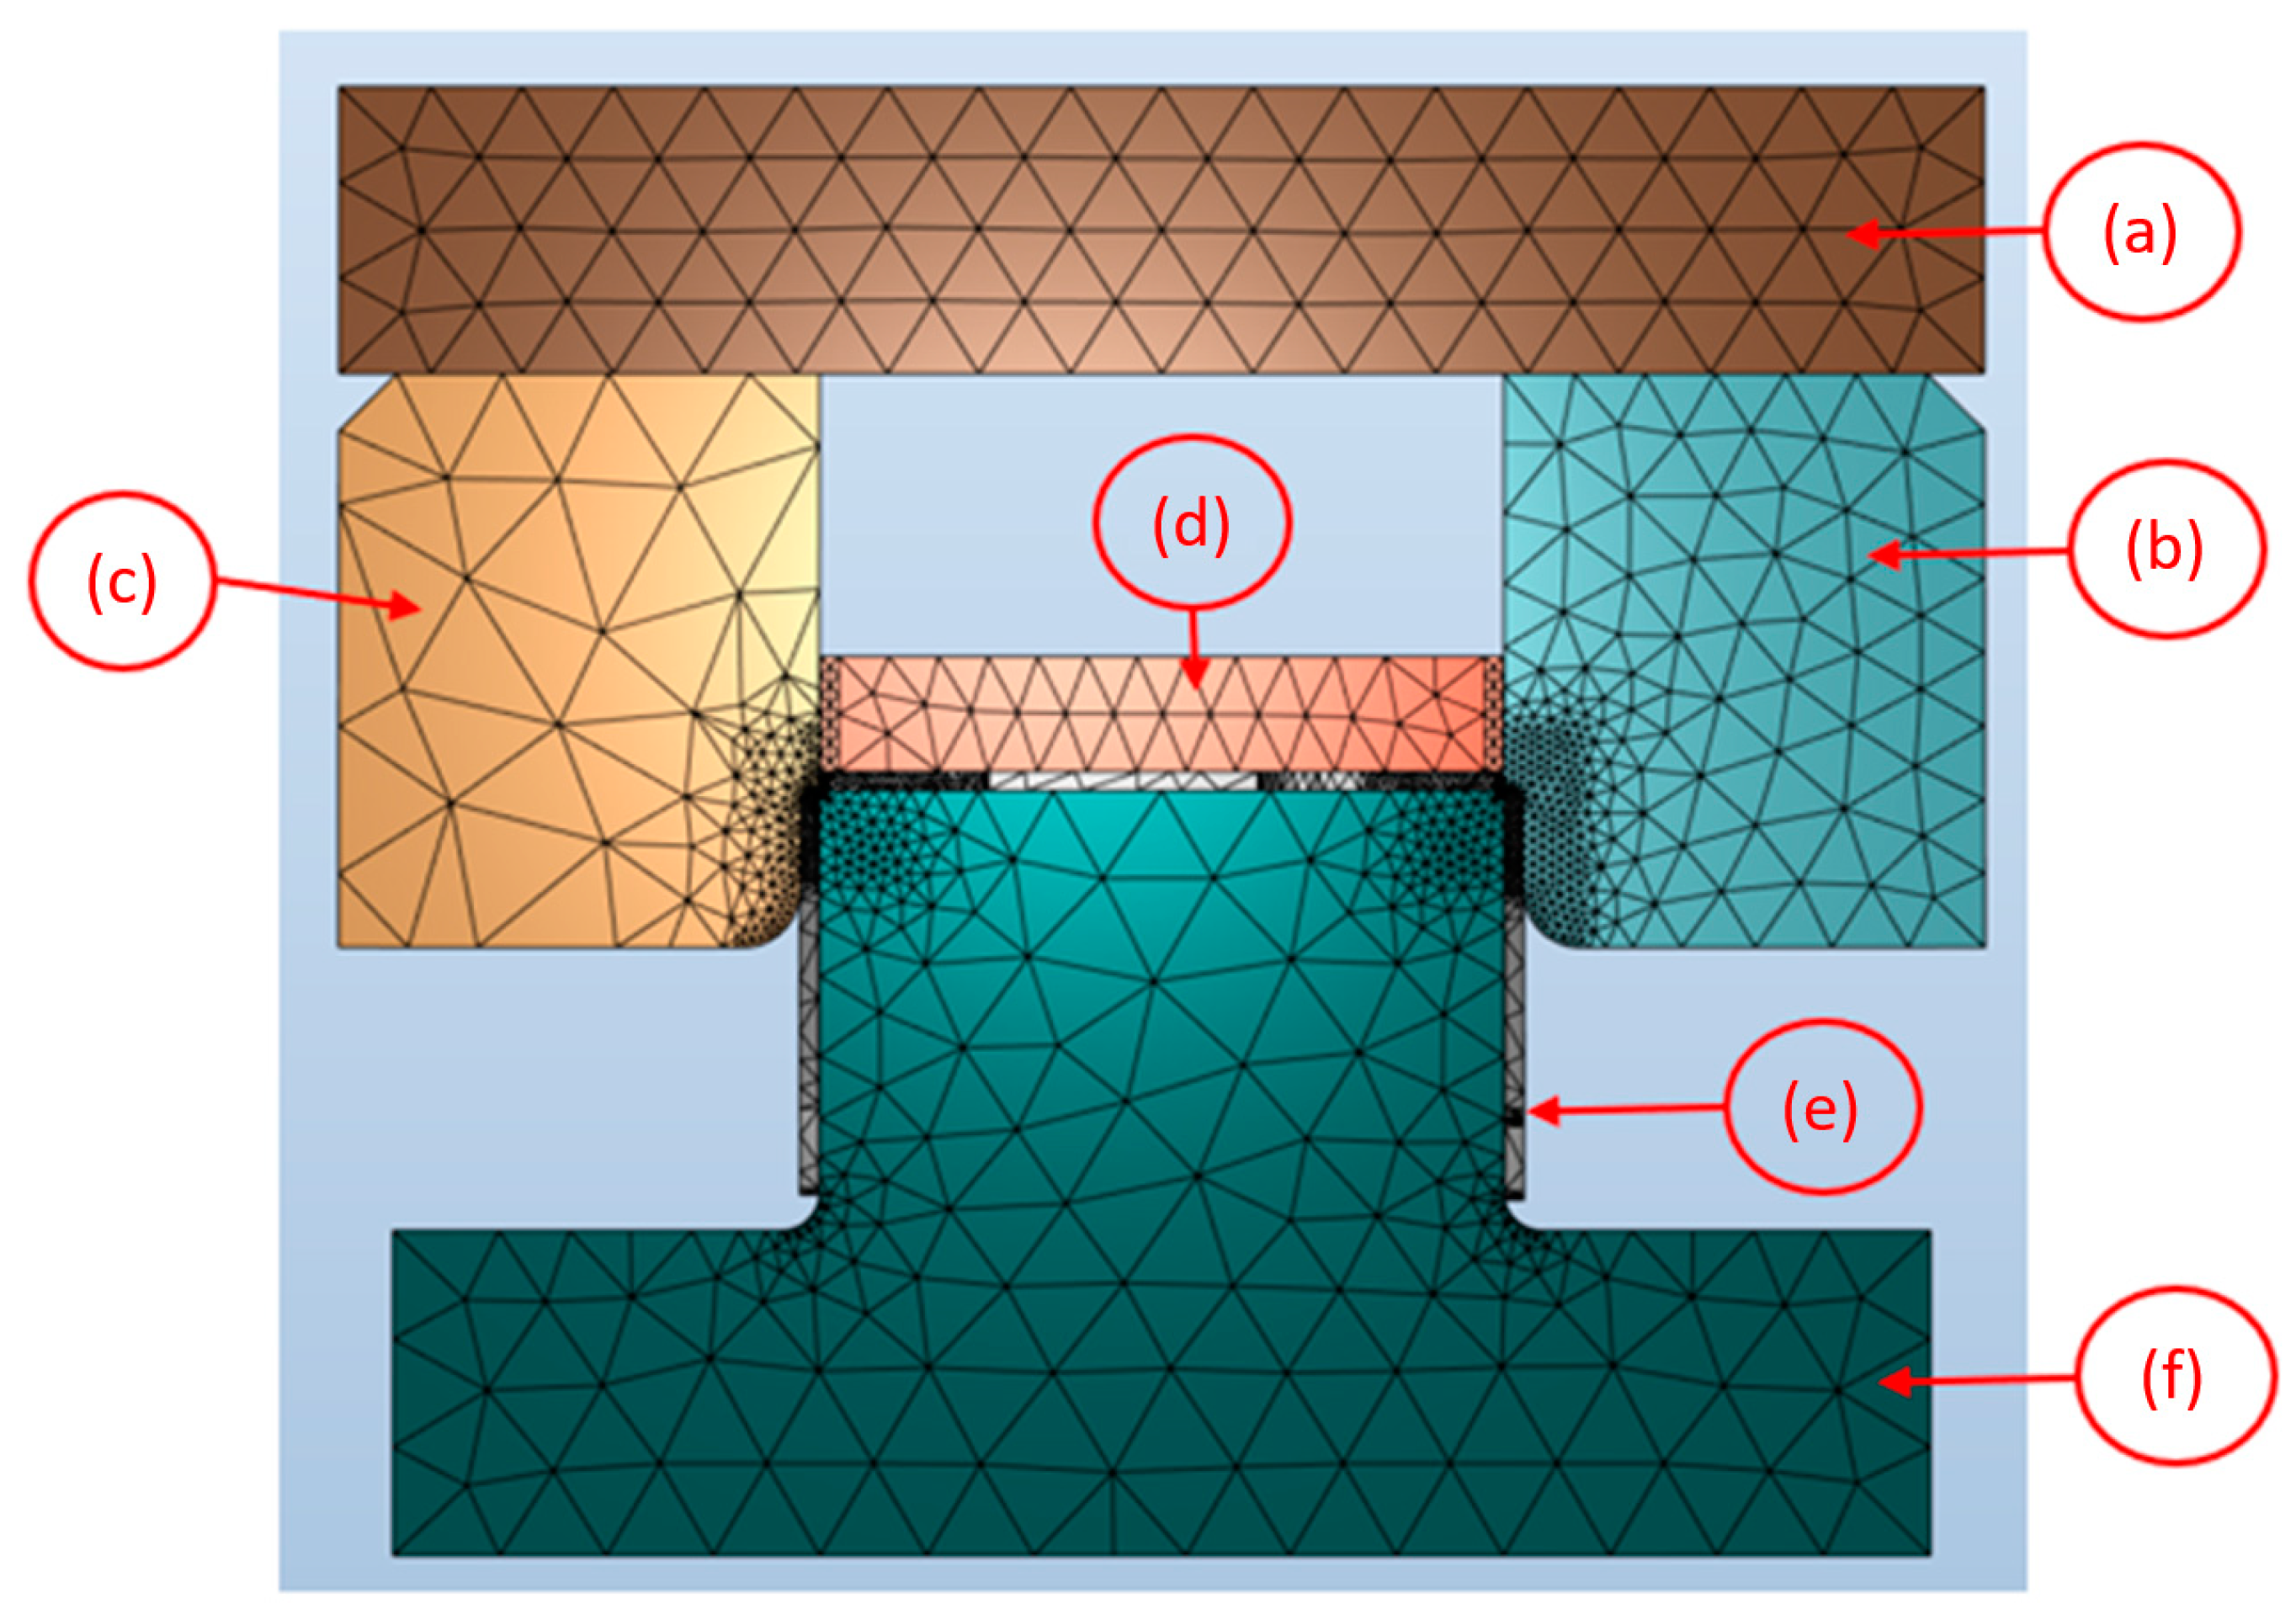
The mechanical press model used for the simulations had a nominal speed of 40 strokes per minute (SPM), with an operating contact length ranging from 9.6 to 11.2 mm. It took about 0.15 s to complete the entire simulated bending cycle. Both sheet and tool components were meshed using automatic remeshing. In the deformation and shearing zones, a fine 0.2 mm volumetric tetrahedral mesh was selected. A coarser mesh was used in places that were not in contact. A 0.6 mm trigger size was used to initiate remeshing in the deformation zones.
Figure 4 displays a completely configured model with the mesh included.
3. Results
As soon as the punches engage the workpiece, cutting and bending occur, resulting in a sudden rise in force. When the punches pierce the material, the load temporarily drops before suddenly increasing as the die descends, further bending and pushing the workpiece. This cycle phase ends when the rotor reaches around 180° and starts to move upwards. During this phase, the workpiece is fully formed; this explains our hypothesis that a relationship between the applied stamping force and the geometric dimensions of the part exists. At the end of the forming cycle, the stripper begins to rise, and the load on the columns rapidly declines until it reaches the free-running values seen at the beginning. In addition to monitoring press load and flywheel angle sensor readings, the data from the EC1 sensor, which measures stripper position, were also recorded. This additional eddy current sensor has been chosen to assess whether there are any discrepancies between the set-up and actual stripper positions. Moreover, the goal was to determine which of these process parameters serves as a better indicator of the force acting on the part.
Before the tests started, the slide of the press, using 1.0 mm thickness material, was determined. For this determination, common practice in production, the essence of which is to select the position of the press slide that produces the highest quality part, was used. In this case, the main criteria were the bending angles of the part, its width obtained after bending, and the imprints left on the surface of the part, indicating the level of compression of the part. The optimal slide position was identified and marked with an asterisk in the results seen in
Table 5.
The testing procedure began with the press slide raised to its highest position (382.0 mm) and then gradually lowered in increments of 0.2 mm. Once the full injection point was reached, the increments were reduced to 0.1 mm. At each increment, between 30 and 40 parts were produced at a speed of 40 strokes per minute, and the last five parts produced at each increment were labeled and set aside for measurements.
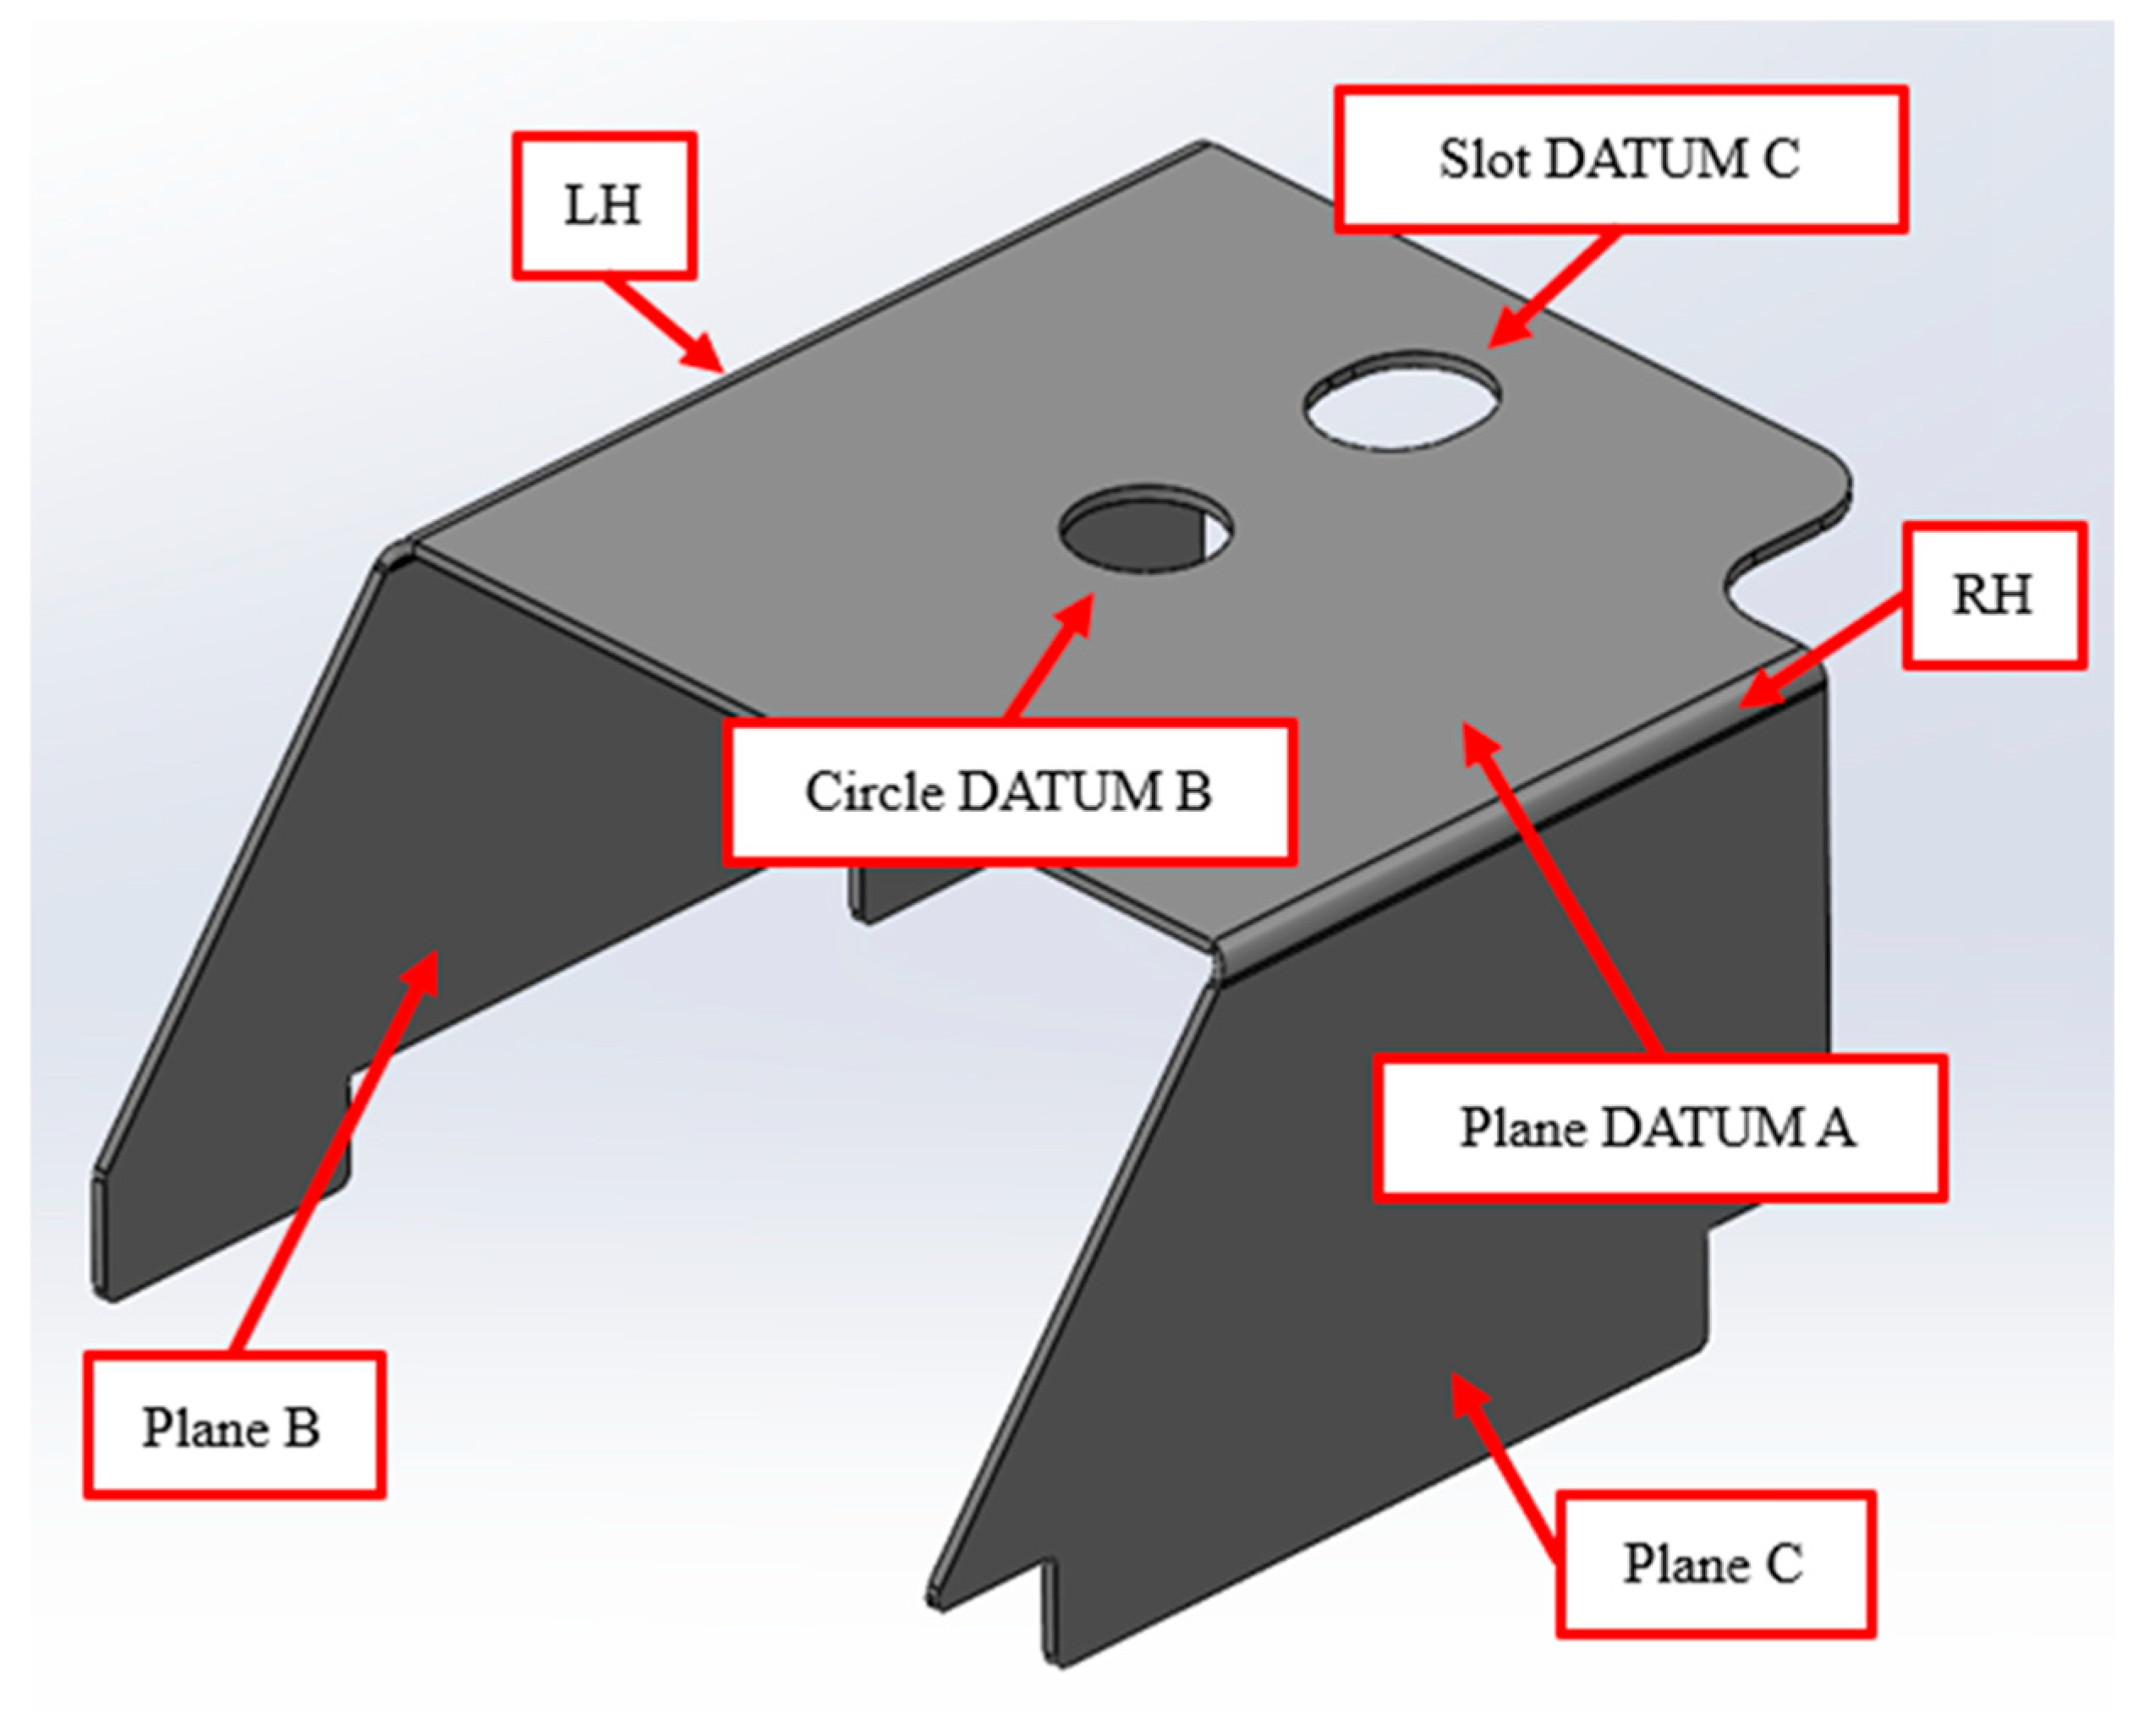
Labeled parts were measured using a coordinate measuring machine (CMM), and the results are presented in
Table 5. A fully formed part with features and alignment in the CMM is presented in
Figure 5. Plane Datum A was measured by 25 points, both circle Datum B and slot Datum C were measured by 15 points, and each plane (B and C) was measured by 20 points. Angle characteristic was evaluated as 3D angle between two planes in order to acquire a result without deviations, and part width evaluations were acquired by plane B and C average values. It is noticeable that the part-bending lines are of different lengths. The length of the left side’s bending line (LH) was 34.3 mm, and that of the right side (RH) was 25.4 mm. Overall, 60 samples were measured. The results table also includes the determined and actual slide positions, as well as the stamping forces recorded by the JZT1 and JZT2 force sensors.
The results (
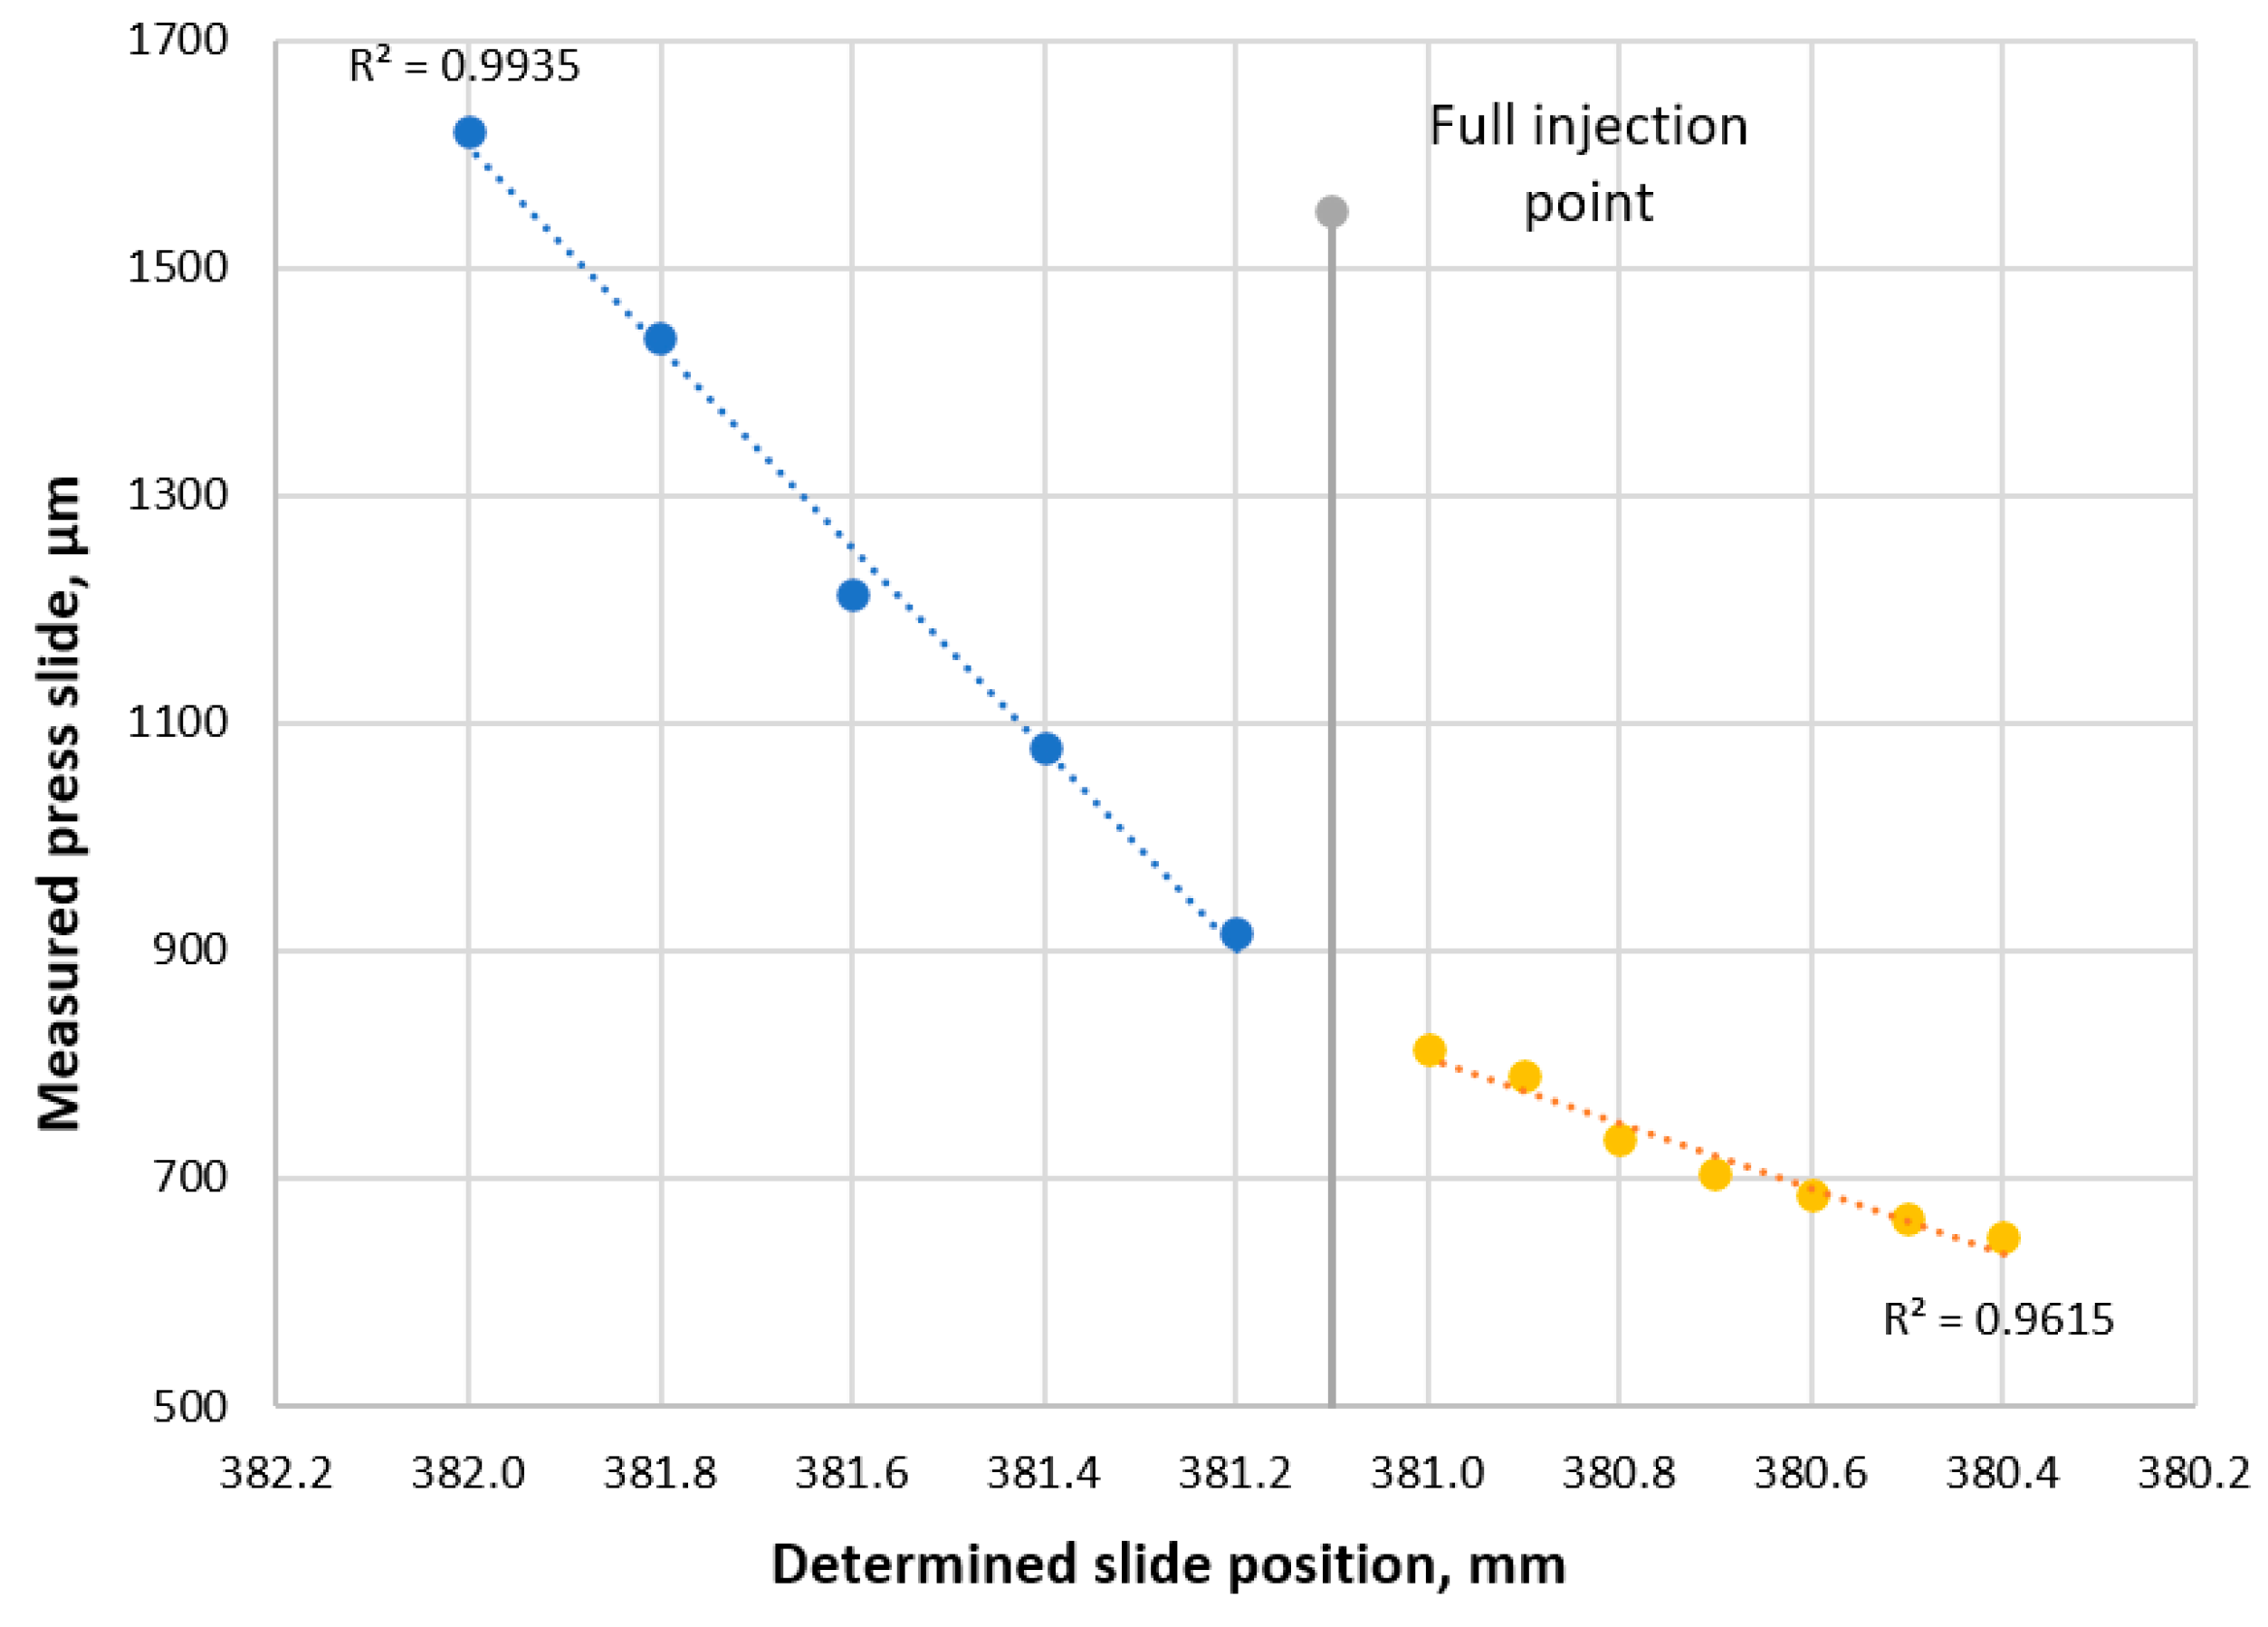
Table 5) show that the relationship between the determined position of the angle (the primary independent variable) and its measured position is non-linear. As shown in
Figure 6, the curve exhibits a nearly linear trend at the beginning but starts to deviate (bend) with the press slide lowering. This alteration occurs near the point of complete injection. Until this moment, the curve had a nearly perfect linear trajectory with a high coefficient of determination (R
2 = 0.9935). However, beyond the full injection point, the variance in measured position slows and eventually stabilizes. In the following phase, the coefficient of variation decreases to R
2 = 0.9615, indicating that the die is fully injected and the upper and lower sections rest on each other. As the slide lowers, the upper plate position becomes almost static, with any additional motion absorbed by the press and die elements.
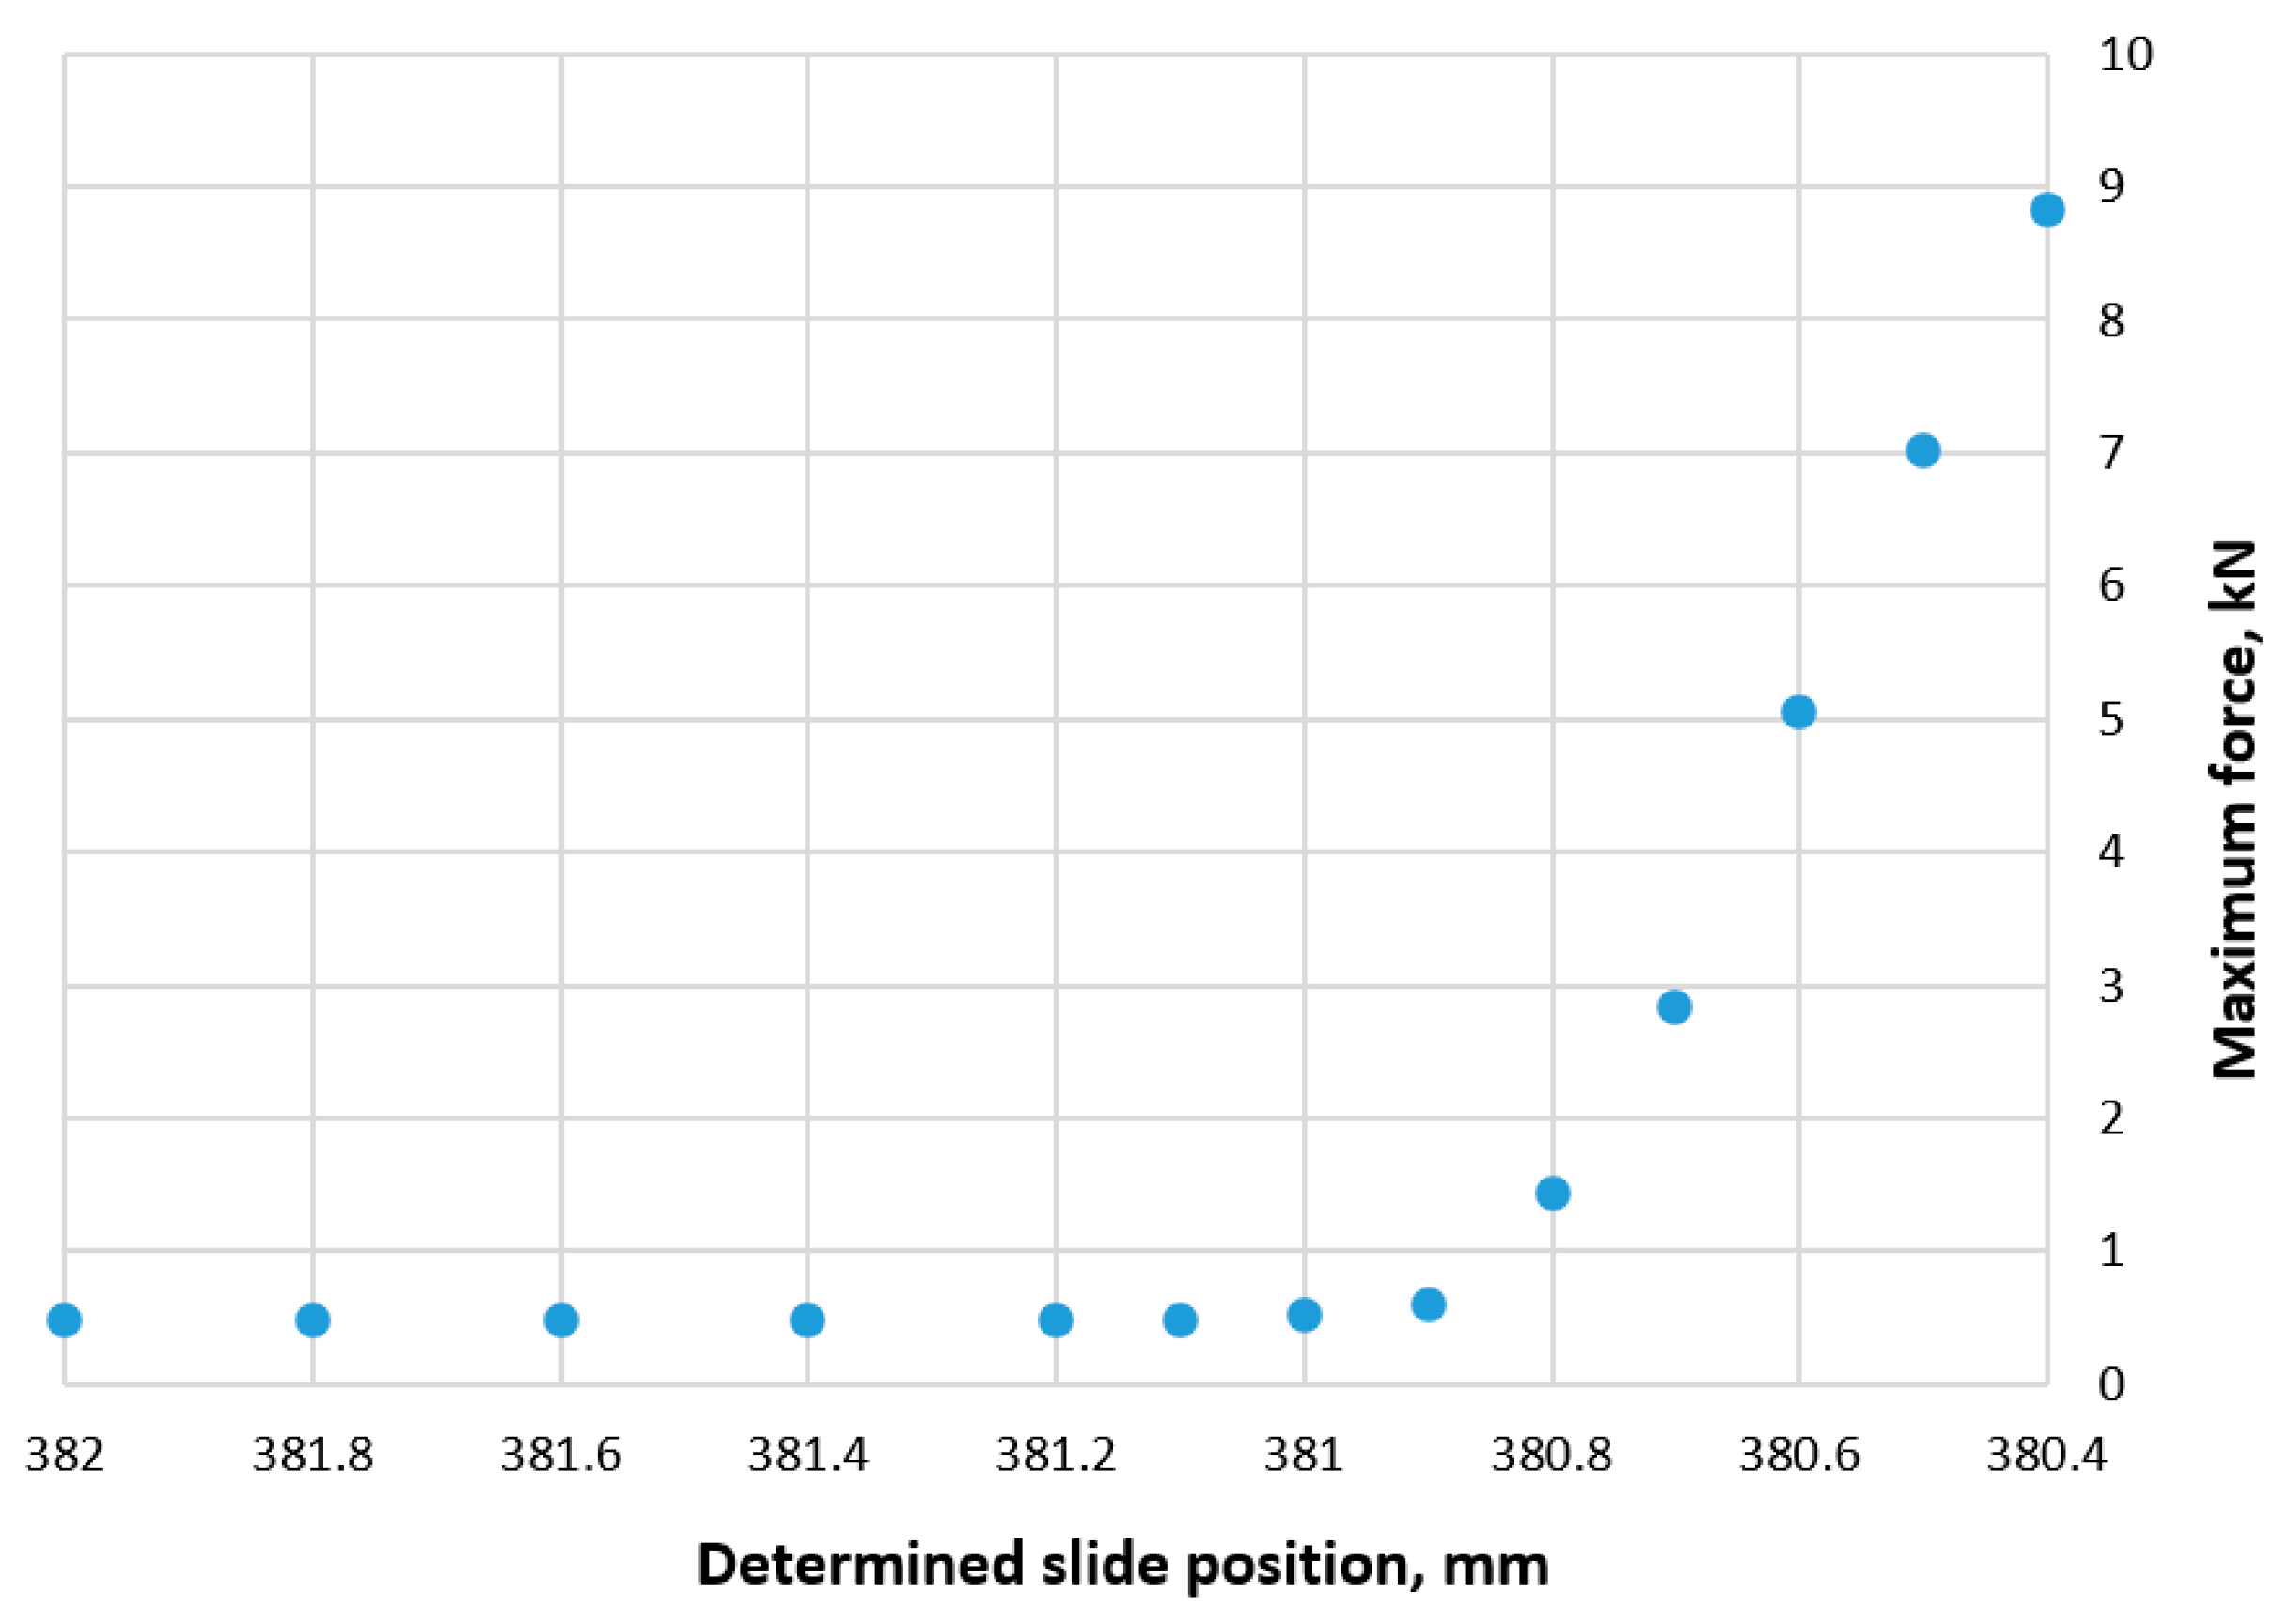
The next scientific observation is the dependence between the maximum generated force and the measured slide position. As shown in
Figure 7a, the force initially increases gradually with the slide being lowered. However, the rate of increase accelerates before slowing down again, resulting in an S-shaped curve. The initial portion of the curve, or the left “tail”, can be attributed to the stripper being too high. In this position, the die is not fully injected, allowing the rising pressure to be easily absorbed, which leads to only a slight change in the load on the press columns. When the slide approaches the ideal “bottom” position, the clearance between tool components and the workpiece diminishes, resulting in increased resistance and column load. The flattening of the curve at the end indicates that the stamping force has reached the point where the workpiece begins to experience plastic deformation of material, absorbing part of the load from the columns.
The relationship between force and measured stripper position (
Figure 7b) is simpler. Initially, the force gently rises until it accelerates sharply. In contrast to the fixed threshold position, there is no deceleration at the end of the curve. This phenomenon can be explained by the fact that, once the die is fully injected and the slide continues to fall, the actual location of the slide changes more slowly, as seen in
Figure 6, and this is consistent with the deceleration of column elastic deformation previously discussed. These displacement decelerations appear proportional to one another, resulting in a curve that looks more like an L-shape than an S-shape, with no obvious flattening. Real-life test results are shown in (
Figure 7), while (
Figure 8) shows simulated data results of only the bending step.
The results of the simulated force influence show that the research area observed in the simulated bending step (
Figure 8) closely mirrors the experimental findings. Before the optimal tool injection point, the force remains relatively constant. This can be explained by the force required to overcome the yield strength of the material during the initial stages. When the tool is fully injected, a significant increase in force is observed, marking the beginning of the bending phase. This rapid rise in force occurs because the bending punches start applying pressure to compress the material. With the upper plate moving downwards, the material begins to deform, and the force reflects the growing resistance against the punch motion. This resistance increases as the material is progressively shaped and compressed, requiring more force to continue the movement. At the first two increments following tool optimum injection, force remains constant with negligible growth due to material thickness reduction along the bending line.
This process aligns with the known theories of material deformation under pressure, where the force needed to deform a material increases as it resists being reshaped because it will change the inner structure of the material. For instance, thicker or stronger materials require more force to bend because they resist deformation more than thinner or softer materials [
21].
An important observation when comparing the curves in
Figure 7a,b is the force spike that occurs around the ideal injection point for the observed slide position. This spike is less pronounced in the case of the determined slide position, suggesting that combining the force generated by the press with the measured stripper position allows for a more accurate determination of full injection point. This would help achieve optimal part quality, maintain a stable production process, and prevent potential overloads on both the press and the die.
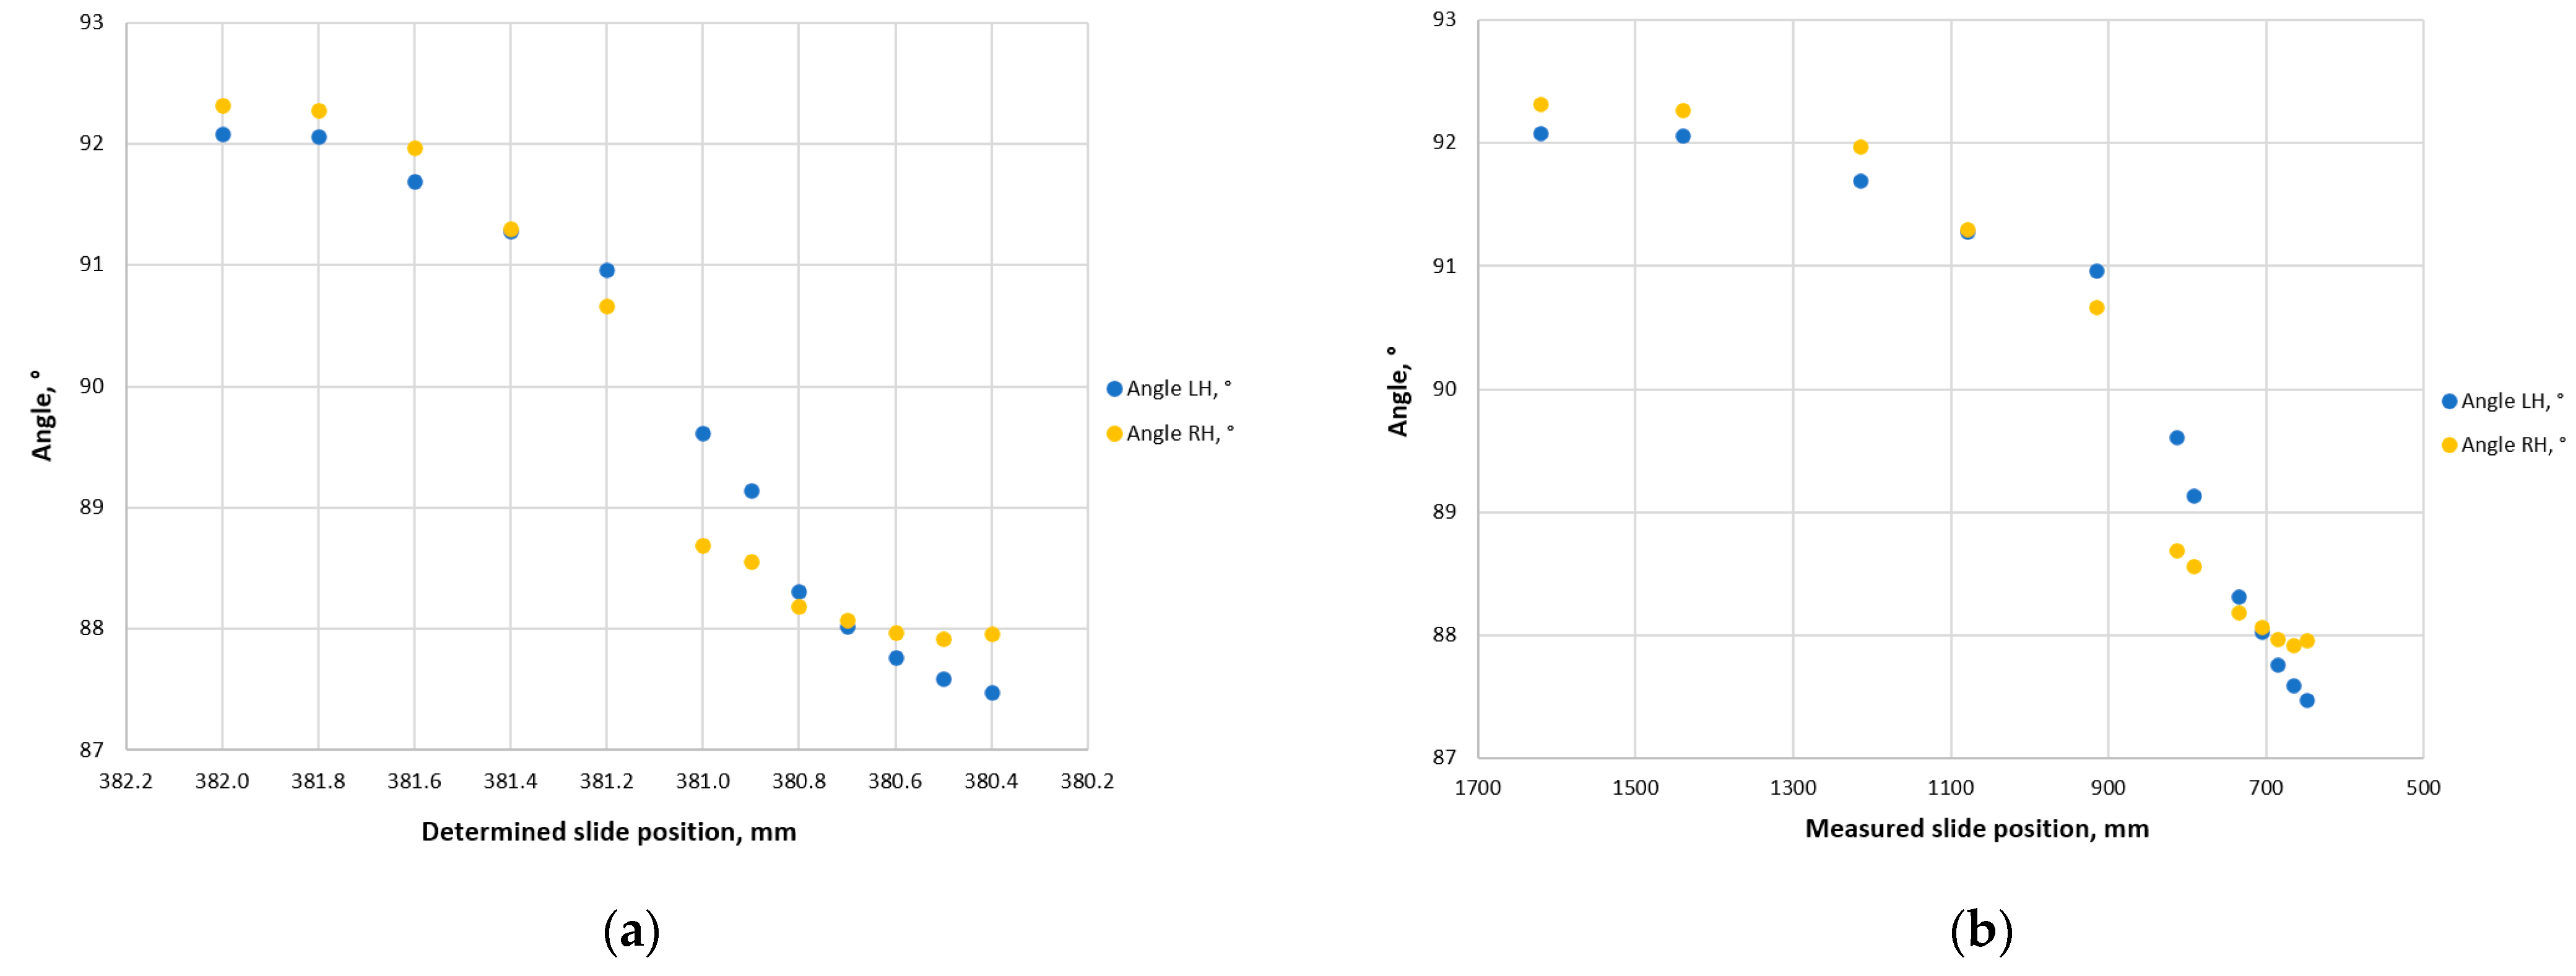
When comparing the effects of the measured and determined slide positions on the right-hand (RH) and left-hand (LH) angles of the part, a clear discrepancy emerges (see
Figure 5). Both angles exhibit an S-shaped relationship with the stripper position, as shown in
Figure 9. Initially, a small reduction in the stripper’s position results in minimal changes to the angles, especially when the position is still far from the ideal. At this stage, the bending punch primarily bends the workpiece downward without significant pressure being applied to it, as there is still considerable space between the bending punch workpiece and the die (see
Figure 4). However, as the stripper position approaches the optimal injection point, the workpiece begins to press against the edge of the matrix, which locks the bend and minimizes elastic recovery. This highlights the importance of achieving precise control over the stripper’s position to ensure optimal part geometry and process stability. This behavior is in line with previous research findings that emphasize how important it is to align and place tools properly to get dependable stamping process results [
5].
As the slide is lowered further, this impact intensifies, resulting in an almost linear influence on the angles. Toward the end, the change slows down once more before coming to a complete halt. This is because, despite the stripper’s growing pressure, the part’s sides rest against the support and are unable to bend any further. Furthermore, the graphs show that the component flap angles fall below the 90-degree mark. This is explained by the fact that the material is compressed and, due to elastic deformation, the workpiece can bend at an angle greater than 90 degrees.
In the case of the measured slide position, the curves (see
Figure 9b) also exhibit an S-shape, but they are more convex and only slightly curve toward the end. This behavior can be explained by the fact that, as the stripper is lowered further, the actual position of the slide remains relatively unchanged because the die is already fully injected. The slowing of position change coincides with a reduction in the bending angle, as the workpiece begins to press against the matrix’s side. This results in a less pronounced flattening of the curve compared to the determined slide position.
Given the observed differences, the question arises as to which of the following dependencies, seen in
Figure 9a,b is more realistic and could be more useful for practical application. On the one hand, the slide’s measured location should more accurately depict the dynamics of the bending angle since it displays the actual progress of the bending punch. However, as we know from the results discussed above, when the slide is low, even a slight change in its measured position results in a significant increase in force (see
Figure 7b and
Figure 8). This force determines the plastic deformation of the part as well as the tool and press overload. It is simpler to forecast when these detrimental processes would start. Based on the angle’s dependence on the slide’s identified position, it is easier to forecast when these detrimental activities would start because curve bending is more noticeable there.
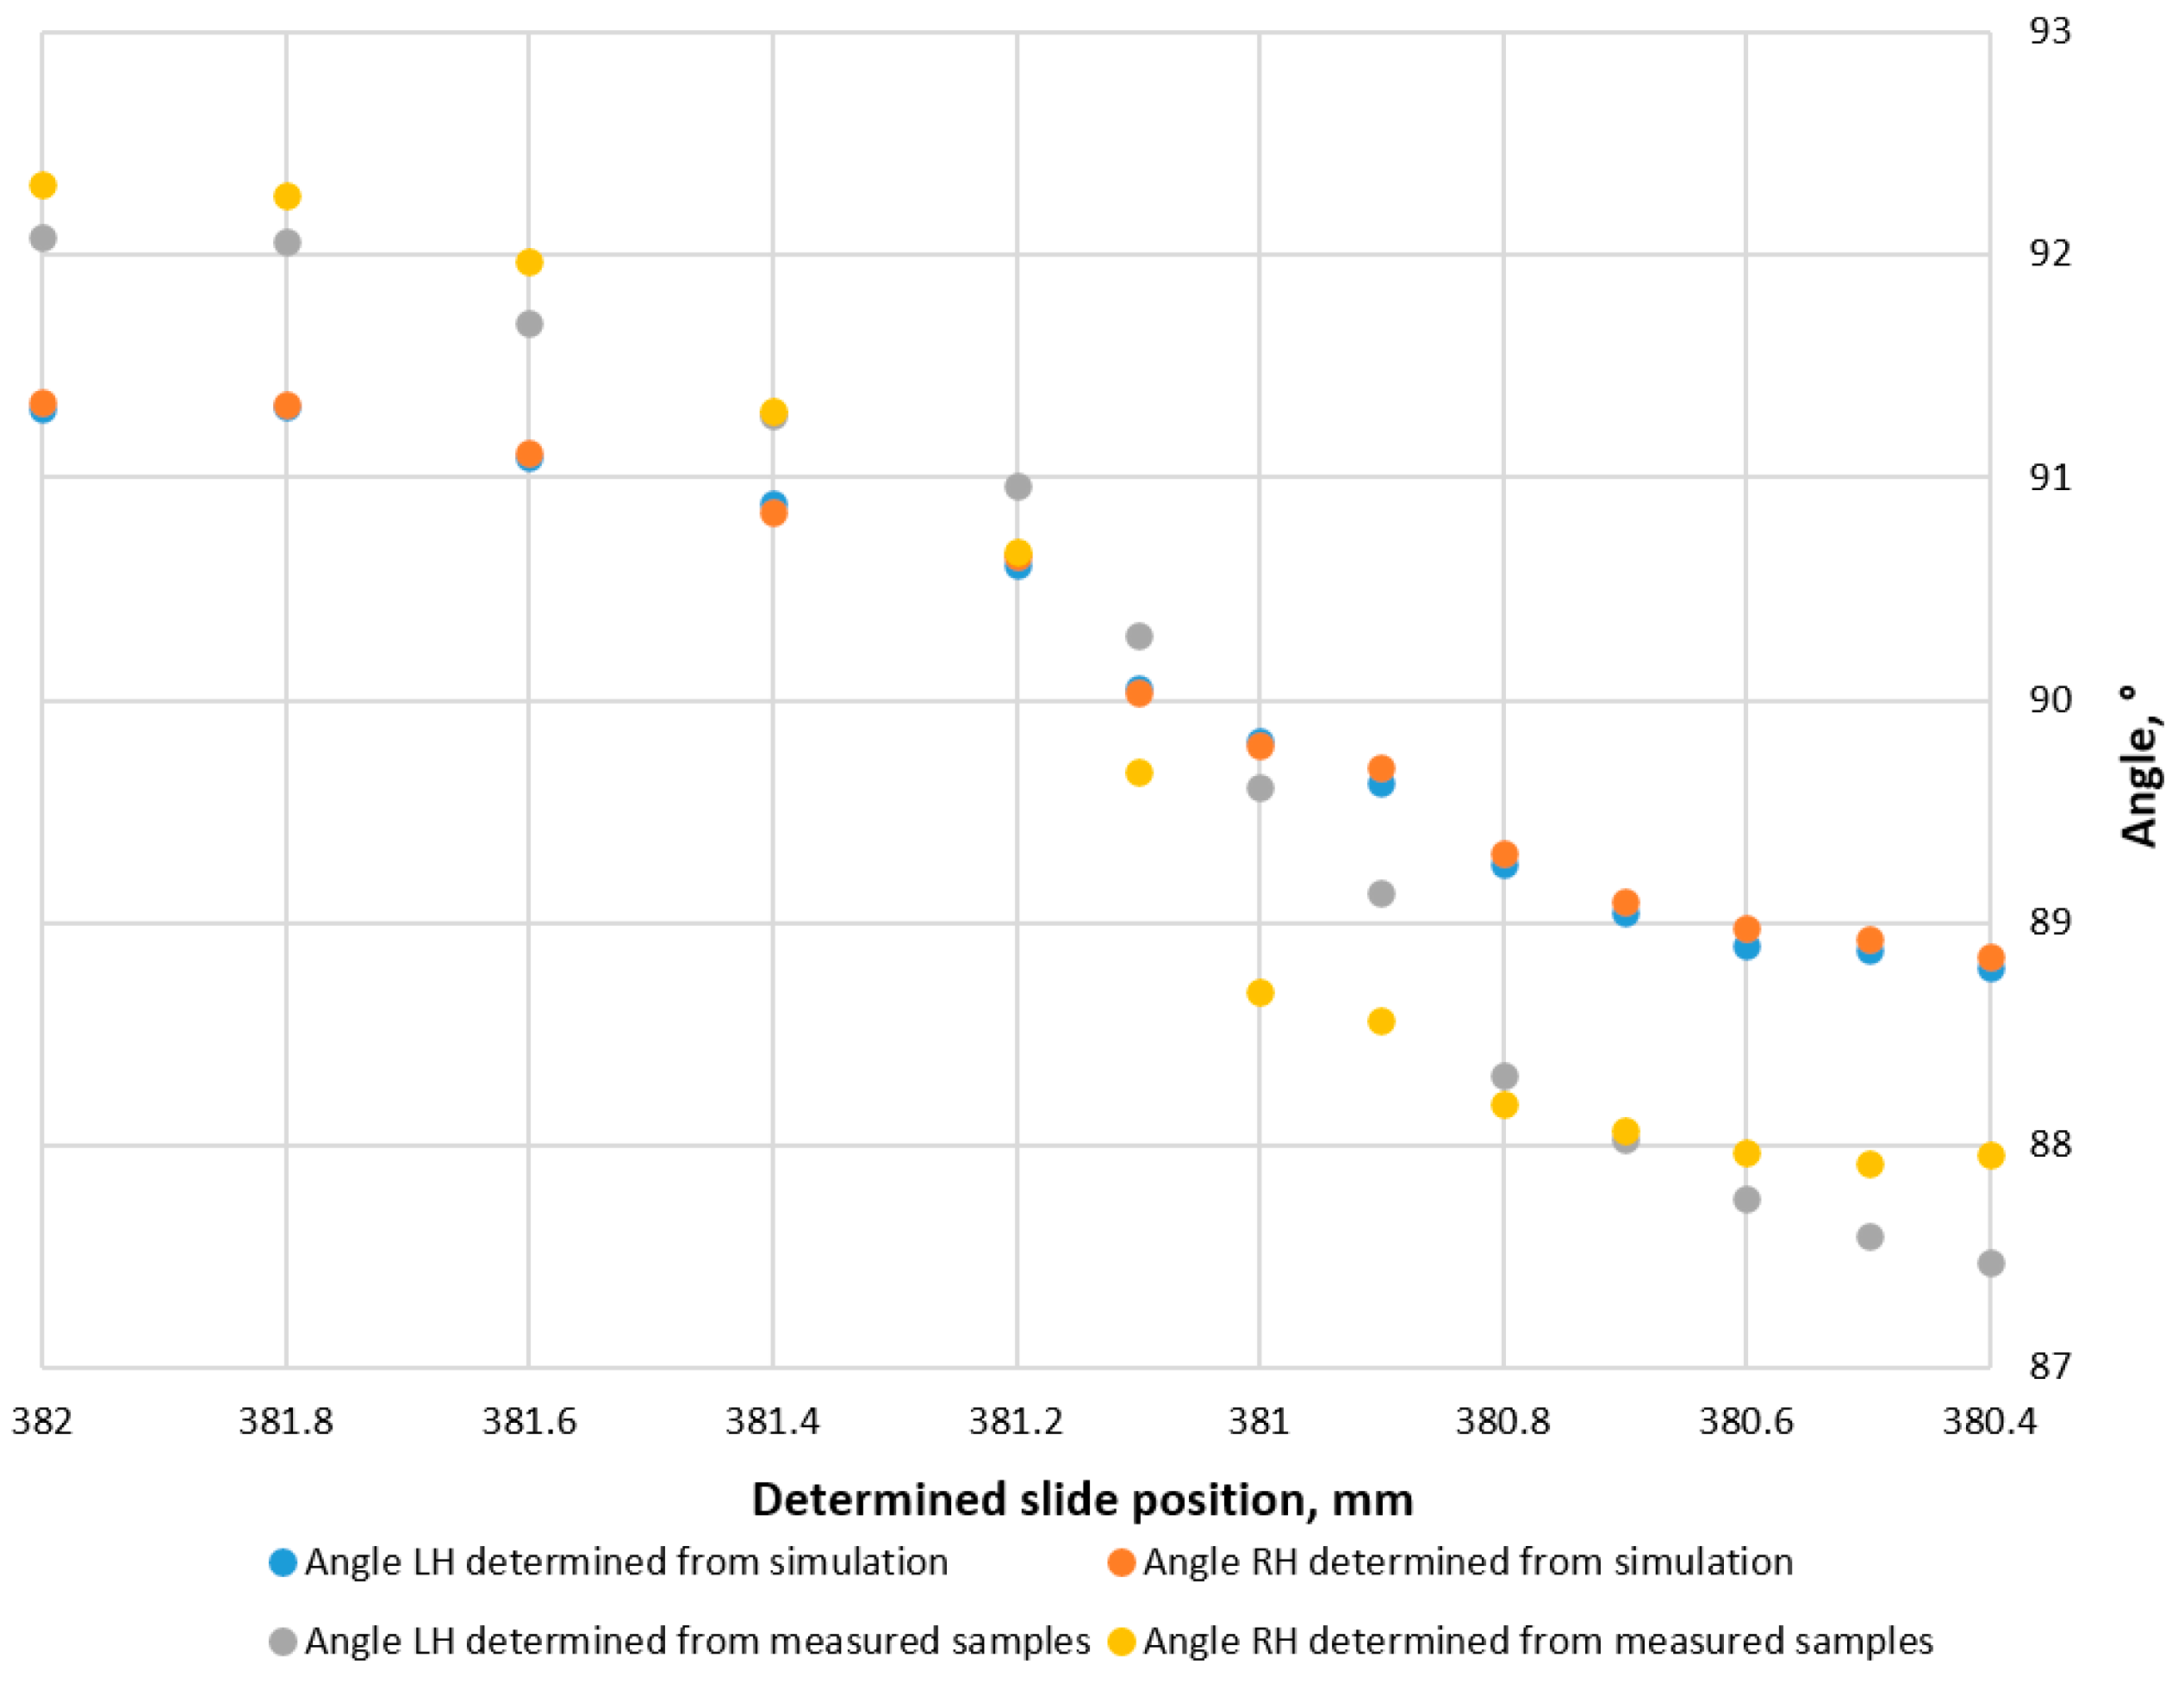
The results of simulated part angles are presented in
Table 6 and
Figure 10, with a comparison between the part angles derived from the measured samples and the simulated values. The disparity between the two datasets is the first obvious finding. For every determined slide position, the measured part angles show steadily higher values. This is caused by the CMM (coordinate measuring machine) measurement technique, which calculates angles by measuring the intersection of two planes constructed from user-defined points. The simulated part geometry has smaller plane deflections, and even small changes could significantly affect the results. However, the simulated samples only consider spring-back at the bending lines and exclude any plane deflection, which could be accountable for the differences between the measured and simulated angles.
Analyzing the impact of the measured and determined slide position on the part’s width presents similar results. It is not surprising that the dependencies in
Figure 11a,b mirror the corresponding curves in
Figure 9a,b since this dimension represents the cumulative consequence of the side bend angles. Although the measured slide position is more convex and only starts to tilt slightly at the very end, the dependence on the determined slide position is still S-shaped.
Analysis of simulated and measured angles in the progressive stamping process shows that almost perfect matches in part widths were achieved/taken (
Table 7 and
Figure 12). Also, it was observed that variation in part angles between measured samples and simulated results offers significant details on the mechanics of the bending process and the precision of the simulation model. The consistent part width measurements across the experimental and simulated data indicate that the mathematical model used in simulations accurately predicts the deformation behavior along the bending line.
The deviation divergence in part angles can be attributed to deflection in the planes of the post-bending of measured samples. In real life, slight plane misalignments may be driven by minimal minute flaws, irregular substances, or elastic recovery effects. These are recorded during measurements by the coordinate measuring machine (CMM), which uses user-defined points to create planes. Deviations from the simulated results may result from minimal deflections in these planes, which may cause variability in the recorded angles. As a result, by assuming idealized conditions and calculating spring-back effects only along the bending lines without factoring potential plane deflections into account, the simulation streamlines the bending process.
The consistency in part widths between the measured and simulated samples suggests that, while plane deflection impacts angle measurements, it does not significantly affect the overall material flow or deformation in the width direction. This underlines the importance of considering plane deflections in experimental setups and supports the simulation model’s capabilities to capture crucial aspects of the bending process. These findings highlight the value of sophisticated modeling methods in estimating process results and finding potential causes of measurement discrepancies in practical applications.
The results of the research support the hypothesis that the stamping force used to bend parts to form angles can be used to monitor the overall width of parts. This is confirmed by the data in
Figure 13. The curves shown previously with the bending angle are first significantly affected by the stamping force, but at certain points, the angles basically cease to change; in this case, the break occurs after the force rises from 60 to 80 kN.
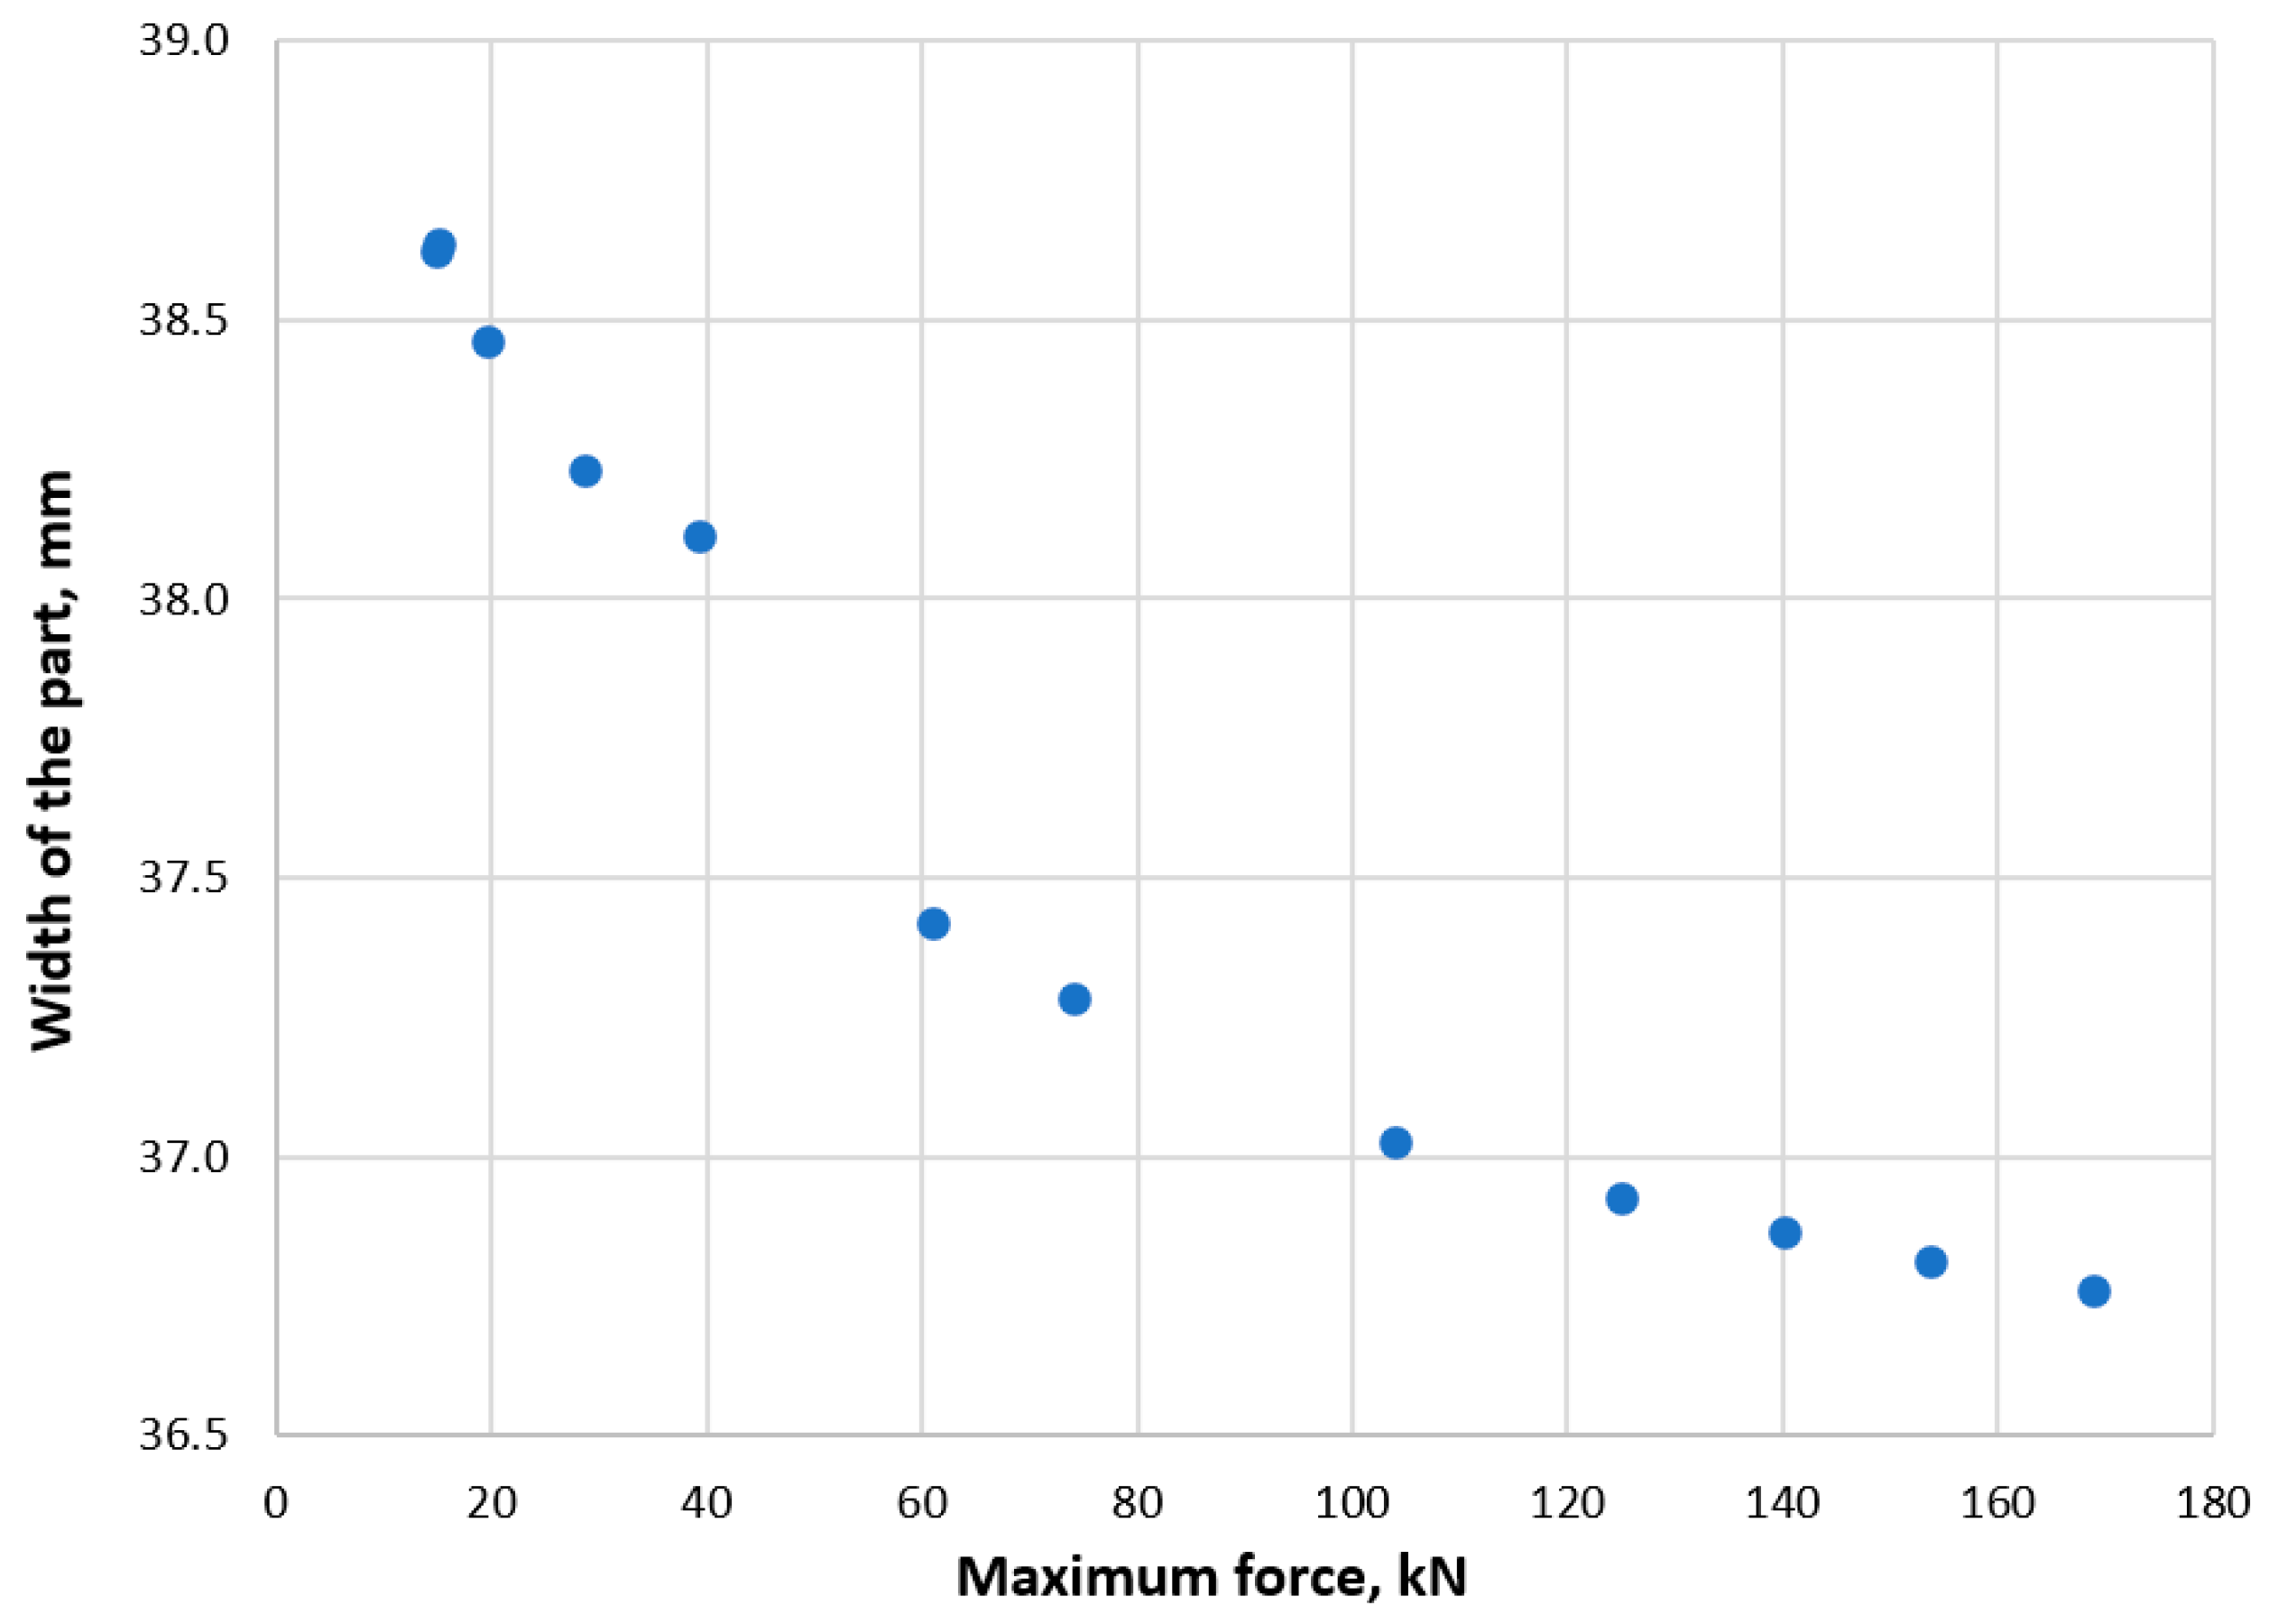
The correlation between stamping force and part width showed an analogous pattern (
Figure 14). These results indicate that there may be a correlation between the stamping force and the indicators of the quality of components, though it is not linear and takes the shape of a L or sphere instead.
This can be explained by the previously indicated fact that the bending die wall limits the capacity of the workpiece to bend. In line with this, the L-shaped curve is extremely useful because, if a slowdown in the angle’s decrease occurs over process modification, it could be assumed that the tool is already optimally injected and that lowering the slide further is not required. After all, performing so will only overload the die and the press and cause undesirable surface imprints throughout the parts.
4. Conclusions
This research confirms a strong relationship between stamping force, slide position, and part quality. After conducting research, the following conclusions were formulated:
1. The main findings include non-linear force-displacement behavior, deviations between experimental and simulated results due to the plane deflections, and the importance of optimizing tool injection for consistent part quality. These results validate the hypothesis that stamping force can monitor critical geometric parameters, aiding in process stability and defect prevention.
2. The relationship between the slide position and the stamping force is non-linear, showing S-shaped and L-shaped curves.
3. The R2 values indicate strong linearity until full injection (R2 = 0.9935) followed by reduced linearity (R2 = 0.9615) during the die compression.
4. Measured angles exhibit a steady increase compared to simulated values, attributed to deflections in planes caused by elastic recovery and material irregularities.
5. Clear S-shaped dependency between the slide position and bending angles, emphasizing optimal tool injection role in minimizing elastic recovery.
6. Experimental and simulated part widths showed close alignment, confirming that width is less sensitive to the plane deflection compared to bending angles.
7. Incremental slide lowering during testing process revealed the influence of material compression on force dynamics and bending quality.
8. Deviations between measured and simulated angles were caused by the simulation assumption of ideal spring-back conditions without accounting for the plane deflections.


