Abstract
This study investigates the mechanical behavior of ASTM D638-02a standard uniaxial tensile test specimens fabricated from 3D-printed acrylonitrile butadiene styrene (ABS) using fused deposition modeling (FDM) with a grid infill pattern at varying densities of 20%, 40%, 60%, and 100%. The research aims to provide a deeper understanding of how infill density influences the mechanical properties of FDM-printed ABS, an area critical for optimizing structural performance in additive manufacturing applications. Experimental uniaxial tensile tests reveal that as the infill density increases from 20% to 60%, the strain at break decreases from 4.7% to 3.9%; however, at 100% infill, the strain at break rises to 5.8%. Meanwhile, the average Young’s modulus exhibits an exponential increase from 513.78 MPa at 20% infill to 2394.8 MPa at full density, indicating greater stiffness with higher infill. Due to the inherent nonlinear elastic deformation of 3D-printed ABS, this study further explores the material’s behavior through finite element analysis (FEA) using Ansys Mechanical. Four hyperelastic material models—Neo-Hookean, Mooney–Rivlin (two-parameter), Mooney–Rivlin (three-parameter), and Yeoh (third order)—were evaluated using inverse analysis to determine material constants. The results indicate that while all models exhibit good correlation with experimental data, the three-parameter Mooney–Rivlin and Yeoh models achieve the highest accuracy (higher R2 values) across all infill densities. However, the Neo-Hookean model, despite being a single-parameter approach, demonstrates a consistent trend where its parameter value increases with infill density. This study provides novel insights into the nonlinear elastic properties of 3D-printed ABS and establishes a foundation for selecting appropriate hyperelastic models to accurately predict mechanical behavior in FDM-printed structures.
1. Introduction
Additive manufacturing (AM), also known as 3D printing, is a very flexible technology that has many benefits over conventional manufacturing techniques, like forging, milling, turning, etc. Its capacity to produce intricate geometries that are challenging or impossible to produce with conventional methods, such as molding or machining, is one of its main advantages. This flexibility allows for highly customized designs and rapid prototyping, reducing the time from concept to production. Unlike traditional methods that often require extensive tooling and setup, 3D printing enables on-demand production, significantly lowering costs for small batches. Additionally, AM reduces material waste by using only the necessary material to build each part layer by layer, which is especially valuable for industries like aerospace and automotive, where lightweight products are critical. The applications of 3D printing span a wide range of fields, from producing lightweight, high-performance parts for aerospace and automotive industries to custom medical implants and prosthetics and even creating architectural models and consumer products. This technology continues to revolutionize manufacturing by offering efficiency, precision, and customization capabilities not achievable with traditional methods [1,2,3,4,5,6]. Various 3D printing technologies are available to produce diverse shapes and models, with applications expanding beyond prototyping into a broad range of product development [7]. Over the past few decades, different 3D printing techniques have evolved based on the specific application and complexity of the models being created [8,9].
The behavior of 3D-printed materials under different loading circumstances, including bending, tensile, and torsional forces, has been the focus of a sizable amount of research. Key factors, such as infill density, build orientation, layer height, print speed, and nozzle temperature, have been identified as critical parameters that influence the structural integrity and durability of 3D-printed parts [10,11,12]. Using bound metal deposition (BMD) 3D printing, Khanafer et al. [4] investigated how build orientation angles and directions affected the mechanical characteristics of 316L stainless steel. Specimens were printed both horizontally and vertically in the 0°, 45°, and 90° directions. In addition to hardness and microstructure investigation, mechanical properties such as Young’s modulus, elongation at break, and ultimate tensile strength were measured. Their findings demonstrated that while the 45° and 90° orientations demonstrated a substantial influence on build direction, the tensile strength and elongation at 0° and horizontal builds were equivalent to the original material. Further, Young’s modulus was found to be notably lower in 3D-printed samples. Alhazmi and Backar [13] performed an experimental tensile study on 15 3D-printed PLA+ specimens. These were printed with varying infill densities (20%, 40%, 60%, 80%, and 100%) and three flat orientations (±45°, 45°, and 0°) to assess directional effects on mechanical properties. Using a universal testing machine, dog-bone-shaped specimens were tested to determine yield strength, ultimate strength, and breaking strength. The findings revealed that both infill angle and printing orientation significantly affected Young’s modulus, fracture location, and fracture angle. Infill percentage affects compressive strength, impact resistance, and overall structural integrity of the printed components [14]
Es-Said et al. [15] conducted a study to investigate how various layer orientations affect the mechanical properties of ABS-printed samples. In comparison to components with various raster orientations, their results showed that components with raster orientations parallel to the loading axis had higher tenses and bending stiffness. To assess the effect of different infill densities on the tensile and impact strength of PLA specimens, Tanveer et al. [16] carried out an experimental investigation. Their findings indicated that samples with varying infill densities demonstrated superior tensile strength compared to single infill density. Additionally, the specimens with varying infill densities were lighter than those with a solid infill or 100% infill, leading to material savings. Aloyadi et al. [17] used compression and low-velocity impact (LVI) tests to examine how infill patterns affected the mechanical characteristics of PLA specimens. The results showed that the triangular infill pattern achieved the highest energy consumption in the LVI test due to enhanced shear and contact layers. In contrast, the grid infill pattern revealed the highest compressive strength, attributed to better alignment of infill layers during compression. Traditional linear elastic models (e.g., Hooke’s law) are valid for small strain and assume constant stiffness, Young’s modulus, Poisson’s ratio, etc. Moreover, these laws are suitable for metals and ceramics. However, hyperelastic models can be implemented in large deformation and nonlinear material applications [4]. Moreover, instead of a single material constant, hyperelastic models require multiple empirical coefficients.
Hyperelastic behavior refers to the ability of certain materials, particularly elastomers, and some thermoplastics, to undergo large elastic deformations under stress and return to their original shape upon unloading. Thermoplastic materials like PLA and acrylonitrile butadiene styrene (ABS) exhibit this hyperelastic behavior to varying degrees, influenced by their molecular structures and processing conditions. PLA, known for its biodegradable properties and good mechanical performance, can demonstrate hyperelastic characteristics. On the other hand, ABS, a commonly used thermoplastic 3D printing, combines the rigidity of acrylonitrile and styrene with the toughness of butadiene, allowing it to withstand significant deformation without permanent damage. The hyperelastic nature of these materials makes them suitable for various applications. Understanding the hyperelastic behavior of PLA and ABS is crucial for optimizing their performance in applications that require significant flexibility and resilience, particularly in the context of additive manufacturing. Anisotropic hyperelasticity in PDMS polymers with additively manufactured surface patterns was modeled and applied in a work by Lee et al. [18]. Their study concentrated on the impact of 3D-printed micro-surface patterns on the mechanical characteristics of PDMS polymers, which is a crucial issue in numerous engineering applications. The impact on material properties was then analyzed using an anisotropic hyperelasticity model, providing insights into how additive manufacturing can alter mechanical behavior. Afshar et al. [19] studied the nonlinear material modeling of 3D-printed PLA polymer with varying infill densities. The findings showed that the nominal strain at break dropped from roughly 2.1% to 1.2% as the infill density rose from 10% to 100%. This suggests that the material was more ductile at lower infill densities, most likely because of the infill pattern altering the microstructure. Additionally, the authors proposed that a hyperelastic material model, such as the Neo-Hookean, Mooney–Rivlin, or Yeoh model, would best fit the mechanical behavior of PLA. Liu et al. [20] investigated the hyperelastic material properties of 3D-printed thermoplastic elastomers across various infill percentages. Regression studies were performed to investigate the link between the percentage of infill and the related material properties, and nonlinear stress-strain curves were fitted using the Ogden hyperelastic model. These known parameters were then used in finite element analysis (FEA) simulations of the tensile tests.
The literature’s lack of focus on the hyperelastic characterization of 3D-printed thermoplastic materials—specifically, the lack of quantified hyperelastic material properties for 3D-printed ABS—is a significant research gap. To close this gap, this study uses the extrusion-based FDM process to create a hyperelastic model that captures the nonlinear behavior of 3D-printed ABS at different infill levels. The Neo-Hookean, Mooney–Rivlin (with two and three parameters), and Yeoh material models will be used for mechanical modeling and numerical analysis across specimens with varying infill densities to validate the experimental results.
2. Materials and Methods
Uniaxial tensile tests were performed on 3D-printed ABS samples with varying infill densities to determine their hyperelastic material parameters. This section outlines the specifications of the test samples, setup, manufacturing parameters, tensile test settings, and the resulting data.
2.1. Specimens and Experiment
Solid Works 2024 was used in this investigation to create the dog-bone geometry for the 3D-printed tensile samples (ABS) according to ASTM D638-02a standard (Type IV specimen), as shown in Figure 1. Infill structures (e.g., hexagonal, rectilinear, and gyroid) create localized variations in material stiffness. In this study, ABS dog-bone parts were printed in 0° grid pattern orientations and different infill densities using FDM. Studies in the literature indicate that infill density significantly influences the hardness and modulus of elasticity of 3D-printed materials [21,22]. The specimen was printed using a Stratasys F370 CR Printer (Eden Prairie, MN, USA), as shown in Figure 2. The manufacturing parameters utilized in 3D printing are compiled in Table 1.
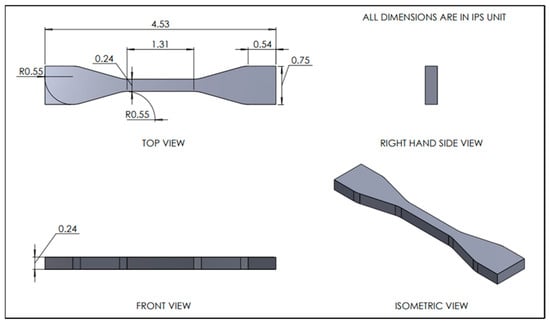
Figure 1.
Schematic diagram of ABS ASTM D638-02a standard dog-bone specimen.
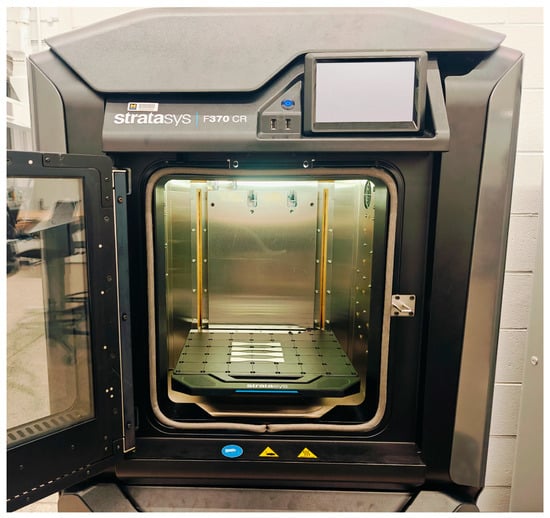
Figure 2.
Stratasys F370 CR (FDM-based 3D printer).

Table 1.
Three-dimensional printing parameters for test specimen fabrication.
In this study, the FDM process was selected as the 3D printing method. FDM is a 3D printing technique that creates objects by melting a thermoplastic filament and extruding it through a heated nozzle. The material is deposited layer by layer, following a digital design that has been sliced into thin cross-sectional layers. As the nozzle moves along programmed paths, the semi-liquid filament cools and solidifies, gradually forming the complete structure. FDM is widely used due to its cost-effectiveness, simplicity, and compatibility with diverse materials like PLA, ABS, and PETG. This technology finds applications in industries such as automotive, aerospace, and healthcare, where it is employed for prototyping and producing functional components. Three-dimensional printing builds parts in discrete layers, leading to directional material properties (i.e., anisotropy). This results in weaker interlayer bonding (Z-direction) compared to in-plane directions (X-Y). However, its ability to create complex geometries and lightweight structures with minimal waste makes FDM a key player in the additive manufacturing industries [23]. The mechanical tensile tests were carried out using an INSTRON machine (Norwood, MA, USA), following ASTM D638 standards, as depicted in Figure 3. A 50 kN load cell with a frame capacity of 200 kN was utilized for the tests. The nominal crosshead speed applied to the samples was 100 mm/min, and the test ended with a rupture. The extensometer model used during the testing was the INSTRON 2630-100 series clip-on type. For each infill percentage, at least three test specimens were produced with a standard deviation varying from 0.14 to 0.21 for tensile testing, with the median result chosen as the representative value for each infill level.
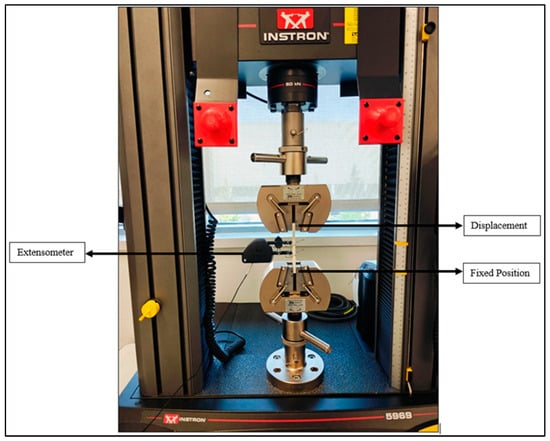
Figure 3.
Instron 2630-100 series uniaxial tensile testing machine with extensometer.
Strain Energy Density Calculation
The primary measurable quantities in this uniaxial tensile test are displacement and force. Figure 4 shows an example graph of tests that were performed for an ABS material with a 20% infill density. Calculated in the elastic zone, the average Young’s modulus, also known as the average modulus of elasticity, is 513.78 MPa for a 20% infill density. Figure 4 makes it clear that the material response is nonlinear; as a result, a hyperelastic constitutive equation is needed to describe the behavior of the material. However, the measurement of stress-strain should have certain limitations due to significant deflection, and instead of using this, stored energy density computation is required [24].
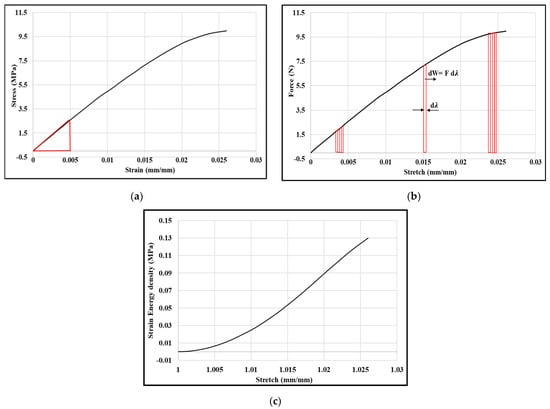
Figure 4.
Experimental graph for 20% infill density in uniaxial tensile tests: (a) stress vs. strain; (b) force vs. stretch; (c) strain energy density vs. stretch.
Based on force, F, and displacement, u, an inverse analysis (curve-fitting process) is used, according to Yeoh [24], to determine strain energy density W:
Here,
the initial volume is V0 (Material is isochoric, so volume does not change);
the initial length is L0;
stretch and d;
cross-sectional area is A0.
The stored energy is computed using Equation (1) and every step is shown in Figure 4. Figure 4c depicts the strain energy density-stretch relation.
This is a generic methodology that can be used for any infill ratio and strain energy density calculation, even though the strain energy density, W, calculation graph is displayed in this section for a sample of 20% ABS infill density (Figure 4).
2.2. Three-Dimensional Geometrical Model with Infill for Numerical Analysis
2.2.1. Three-Dimensional Geometrical Model with Infill
For numerical analysis in Ansys Mechanical, ASTM D638-02a standard dog bone with different infill densities was created using Solid Works 2024 by obeying a similar design for experiments. In this design, four infill densities were created. They are 20%, 40%, 60%, and 100%. Figure 5 shows all the dog bones with five different infill densities with grid patterns, which were designed in Solid Works.
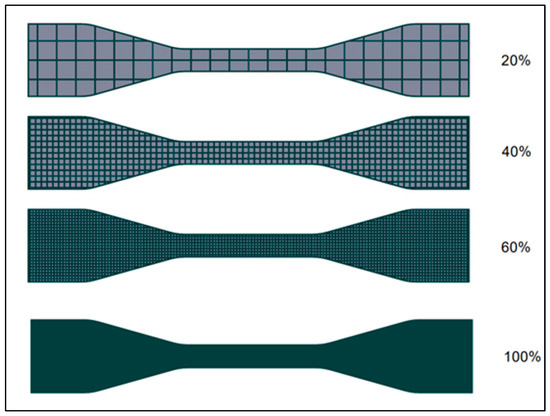
Figure 5.
Three-dimensional designed model (in Solid Works) of ASTM D638-02a standard dog-bone with different infill densities.
2.2.2. Numerical Analysis Method
The numerical analysis was conducted in Ansys Mechanical, and it utilized the finite element analysis (FEA) method for analysis. Further, the designed model in Solid Works was imported to Ansys Mechanical and a tetrahedron mesh for 20%, 40%, and 60% infill densities and rectangular mesh for 100% were generated with a mesh size of 1 mm (Figure 6).

Figure 6.
Generated mesh on dog-bone specimen: (a) tetrahedron mesh (for 20%, 40%, and 60% infill density); (b) rectangular mesh (for 100% infill density).
One end of the dog bone was left stationary in Ansys Mechanical, while the other end was loaded at a rate of 100 mm/min, which is an experimental crosshead speed. For each infill density, four numerical analyses were conducted, incorporating Neo-Hookean, Mooney–Rivlin with two and three parameters, and the Yeoh third-order hyperelastic model. Experimental data were added to Ansys Mechanical’s engineering data section before the simulation ran. Additionally, for each infill density, four distinct hyperelastic models (Neo-Hookean, Mooney–Rivlin with two and three parameters, and Yeoh third order) were included to run simulations.
2.3. Hyperelastic Material Modeling
Hooke’s law is widely used in engineering material characterization, providing accurate results in the elastic region (approximately 0.1% strain) for most engineering metals, where stress and strain exhibit a linear relationship. However, for rubbers, elastomers, and other soft materials, large-strain behavior is better described by hyperelasticity, a nonlinear elastic material model [25]. Polymers and hyperelastic materials typically exhibit significant deflection with nonlinearity. Afshar et al. [19] noted that polymers undergo large strains, making a linear model inadequate. Hyperelasticity in polymers represents a nonlinear stress-strain relationship, where Yavari and Goriely [26] describe deformation energy density—also known as strain or stored energy—by combining deformation tensor invariants. Hyperelastic models often assume isotropy, which may not hold in anisotropic AM lattices and fiber-reinforced polymers. The frame-invariant notion of anisotropic material response is naturally supported by hyperelastic materials since they only exhibit anisotropy in the potential, W [27]. As a result, strain energy function (SEF) solely depends on the strain invariants, represented by I1, I2, and I3. Thus, the SEF becomes
Here,
W = W (I1, I2, I3)
I1 =
I2 = ;
I1 = .
Here, λ1, λ2, and λ3 are principal stretches. As strain invariants depend on principal stretches λ1, λ2, and λ3 and strain-energy functions, the SEF equation may also be written as
Steinmann et al. [28] summarize 14 models for comparison. Among these models, we will consider the Mooney–Rivlin models (with two and three parameters), the Neo-Hookean model (Neo), and the Yeoh model (Yeoh).
W = W (λ1, λ2, λ3)
2.3.1. Neo-Hookean Model
This model is the modified version of the Hookean model to be applied to hyperelastic materials. Small strains in the material were good for this model’s performance [29] and were about 30% [30]. The SEF of the Ogden model [31] can be presented as
Here,
C10 = , is the initial shear modulus.
D1 is the compressibility (material constant).
2.3.2. Mooney–Rivlin Model
Out of all the complete polynomial models, the Mooney–Rivlin model is the most basic. This model is obtained by raising Neo-Hookean to a higher order. Hence, a general SEF of the Mooney–Rivlin model for incompressible materials is given below [19],
Here, Cij is an unknown material constant that can be determined from experimental data, which is also a great disadvantage. This model is usually valid for the nonlinear behavior of rubber-like material according to the work of Mooney [32] and Rivlin [33]. The most popular Mooney–Rivlin two-parameter SEF model is presented by Mooney [32] and Rivlin [33] as
Here, C10 and C01 are material constants. This model is perfect for 100 percent tensile strain with good curve fitting. However, the fitting will be more complicated if the number of parameters increases [34]. The five-parameter Mooney–Rivlin SEF model is
WMR3 = C10(I1 − 3) + C01(I2 − 3) + C11(I1 − 3) (I2 − 3)
Here, C10, C01, and C11 are material constants that can be determined from experimental data.
2.3.3. Yeoh Model
Yeoh [24] described that the Yeoh model is based on only the first invariant (I1). A higher-order term of I1 applies to the Neo-Hookean model to generate a reduced polynomial model, and SEF becomes [35,36]
Here,
C10 = , is the initial shear modulus.
D1 is the compressibility (material constant).
We conducted an inverse analysis of all the models to evaluate their respective performances in terms of how well they fit the experimental data.
3. Parameter Determination in Hyperelastic Material Models for Uniaxial Tensile Testing
Hyperelasticity is a fundamental model that effectively represents the deformation behavior of polymers based on underlying micro-mechanisms [37]. The hyperelastic material model parameters are often determined using deformation energy [19]. This study follows the methodology of [38], outlined briefly below, using conventional summation notation for repeated indices and continuous mechanical notation. As stated by Youssef [39], the higher-order deformation gradient tensor represents the displacement gradient relative to the initial reference placement:
where is the Kronecker delta or the identity tensor. However, in linear algebra, the Kronecker delta is the identity matrix [40]. Here,
From Fij, B = FFT and C = FT F are obtained, which are the left Cauchy–Green deformation tensor and the right Cauchy–Green deformation tensor, respectively. According to the Hamilton–Cayley theorem, a three-dimensional tensor has three invariants: I1, I2, and I3. The invariants of the left and right deformation tensors are the same. The invariants are linked to the measurable stretch in a planned experiment, like a uniaxial, biaxial, or triaxial tensile test, in the following manner, utilizing the stretch ratio in one, two, or three axes, λi (i = 1, 2, 3):
I1 = tr(C) = tr(B) = λ1 + λ2 + λ3,
We assume I3 = 1, which corresponds to a volume-preserving deformation. This assumption, commonly referred to as incompressibility or isochoric deformation, implies that det(C) represents the volumetric change during deformation. For the uniaxial tensile test,
I1 = λ2 + ;
I2 = 2λ + ;
I3 = 1 (for incompressible materials).
The ABS material is regarded as incompressible in this article. Since I3 displays a constant value, it can be disregarded. SEF is therefore solely dependent on I1 and I2. Thus, the SEF can also be written as
W = W (I1, I2)
Yavari and Goriely [26] employed a deformation energy density, also called strain energy or stored energy, which is obtained by combining the invariants of the deformation tensors. However, ellipticity restricted the dependency of invariant (I1, I2, and I3) so that the deformation gradient (continuity of F) was assured to be smooth [41].
Inverse Analysis
To determine model parameters, we use a standard inverse analysis technique. Due to nonlinearity, the Levenberg–Marquardt method is commonly applied for nonlinear regression [42]. However, the success of this approach, particularly for hyperelastic models, depends on accurate initial parameter estimation [39]. Afshar et al. [19] set C₀₀ = 0 as the initial parameter in the Mooney–Rivlin model. The optimal parameters minimize the squared error between measurements and estimates. Despite the nonlinear material model, the method results in a linear regression problem, yielding a unique set of coefficients. The following sections present the linear regression results, where solid-colored lines depict the fit curve, and black dotted lines represent experimental data. Model accuracy is assessed using R-squared (R2), a statistical measure defined below:
Using the total sum of squares, Stotal, and the residual sum of squares, Sres, i.e.,
where fi symbolizes the fitted data for a data set with n values marked by y1…yi…yn, and the mean value is
A comparison of all applied hyperelastic models and their corresponding R2 values with the figure are shown in subsequent sections.
4. Validation
In this section, the experimental tensile results for PLA+ materials found by Alhazmi and Backer [13] were used first for validation by developing hyperelastic models and then used in numerical analysis. Experimental analysis was conducted by Alhazmi and Backer [13] for PLA+ materials with a standard ASTM D638-10 dog bone. Tensile testing for the dog-bone specimen was executed at 100 mm/min crosshead speed. In their study, two angle orientations (0° and 45°) were considered to incorporate 20% and 40% infill densities for each angle orientation.
We assessed the strain energy density–stretch results between the experimental data [13] and the present results using numerical simulations and the developed hyperelastic models for the PLA+ material. Table 2 summarizes the parameters for different hyperelastic models (Neo-Hookean, two-parameter Mooney–Rivlin, and third-order Yeoh). As can be seen from Figure 7 and Figure 8 and the stated value of R2 in Table 2, all three models show sufficient agreement with the experimental data. In contrast, the Mooney–Rivlin model’s two parameters and Neo-Hookean’s one parameter are fewer than those of the Yeoh model’s three parameters, justifying their superiority. The Neo-Hookean model also has the benefit of having just one parameter, which rises monotonically with infill density.

Table 2.
Material parameters of three hyperplastic models for two infill ratios.
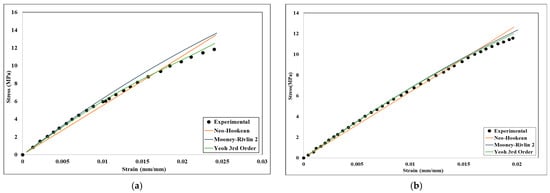
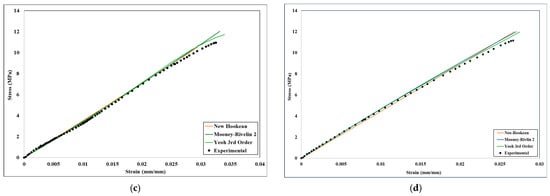
Figure 7.
stress-strain experimental and numerical validation graph of different hyperelastic models: (a) 0° infill orientation and 20% infill; (b) 0° infill orientation and 40% infill; (c) 45° infill orientation and 20% infill; (d) 45° infill orientation and 40% infill.
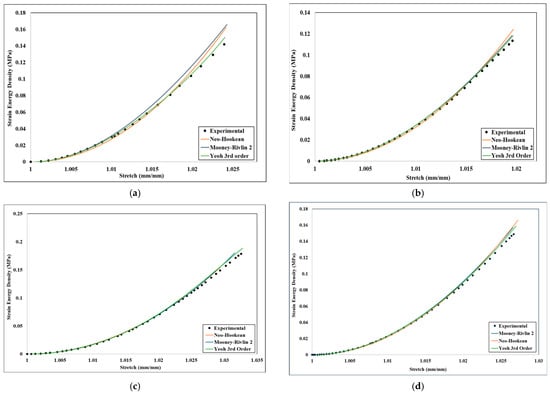
Figure 8.
Strain energy density–stretch experimental and numerical validation of different hyperelastic models: (a) 0° infill orientation and 20% infill; (b) 0° infill orientation and 40% infill; (c) 45° infill orientation and 20% infill; (d) 45° infill orientation and 40% infill.
The Neo-Hookean model with one parameter has an R2 value equal to or more than 0.96, indicating that the SEF models’ material response has a very reasonable fit. However, Mooney–Rivlin (two parameters) has an R2 of 0.98 for 0° and 45° infill orientation for all cases, which is a reasonable fit for the Neo-Hookean. The third-order Yeoh has an R2 of 0.99 for all cases except 0° angle orientation and 40% infill density. Thus, third-order Yeoh predicts slightly better results compared to the Neo-Hookean and two-parameter Mooney–Rivlin models. From the inverse analysis and the results discussed in Section 3, we can confirm that all three models depict very good agreement with the experimental analysis for PLA+. Any model can be used for analysis in the future for any PLA+-like materials such as ABS. However, as the Neo-Hookean model has only one parameter, I1, it will be easier for the calculation to determine the materials’ constant value.
5. Results and Discussion
5.1. Experimental Analysis
In this study, ABS material was used for the uniaxial tensile test. The dog-bones were 3D-printed with 0° grid infill orientation and a constant layer thickness of 0.254 mm. After the uniaxial tensile test, the stress-strain graph and other related properties were obtained. The stress-strain curves of all dog-bone printed samples after tensile testing are shown in Figure 9. It is evident from the tensile test results shown in Figure 9 and the attributes listed in Table 3 that the infill density has a major impact on the ABS printed samples’ tensile strength.
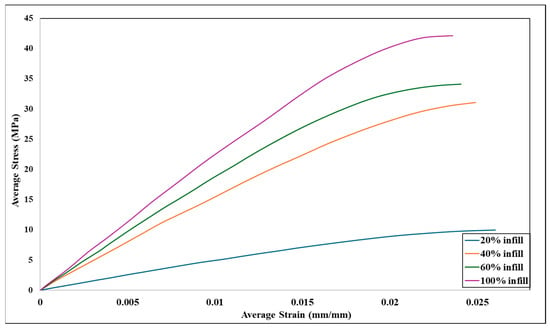
Figure 9.
Experimental stress-strain graph for varying infill densities.

Table 3.
Mechanical property of the ABS specimen after tensile testing.
Figure 8 and Table 3 data show that the tensile stress at yield and Young’s modulus increase in proportion with an increase in infill density from 20% to 100%. However, as the infill density rises from 20% to 80%, the tensile strength at break decreases. On the other hand, tensile strain at break has the highest value of 5.8% for the 100% infill density. At 100% infill, the printed structure is nearly fully dense, meaning it has fewer voids or internal gaps compared to lower infill percentages and improved stress distribution, enhanced layer adhesion, and suppression of premature crack formation. These factors collectively result in a more ductile failure mode compared to lower infill densities (e.g., 20%, 40%, and 60%), where stress concentrations and weak interfacial bonds lead to early fracture. By following the methodology described in Section 2.1, strain energy density can be obtained for all four infill densities (20%, 40%, 60%, and 100%), and it is shown in Figure 10. By following the methodology described in Section Strain Energy Density Calculation, strain energy density can be obtained for all five infill densities (20%, 40%, 60%, and 100%), and it is shown in Figure 9.
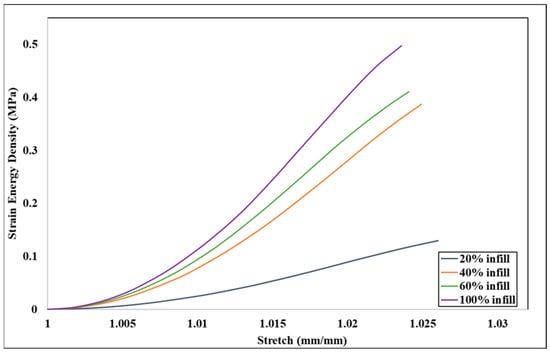
Figure 10.
Experimental strain energy density–stretch graph for different infill densities.
Figure 10 shows that 100% infill density has the highest strain energy density for similar stretch values. Strain energy density values of 40%, 60%, and 100% are closer, though 20% infill density has the minimum value, and it is far less than the other infill densities.
5.2. Curve Fitting for the Hyperelastic Model
Young’s modulus describes the properties of a material and is regarded as the material property for linear elasticity. However, Young’s modulus is unable to characterize the properties of the hyperelastic material model; instead, the material constant of the hyperelastic model describes the properties of rubber-like materials [42]. These coefficients cannot be measured directly by any means, though they can be measured by fitting experimental data for different hyperelastic models. Bhuiyan et al. [4] also determined the parameters of the different hyperelastic models for PLA+ from curve fitting, and the R2 value of that fitting was good enough. The curve fitting for several hyperelastic models for 20%, 40%, 60%, and 100% infill densities is displayed in Figure 11, Figure 12, Figure 13, and Figure 14, respectively. After integrating experimental stress-strain data, these curve-fitting figures were acquired from Ansys Mechanical’s engineering data department.
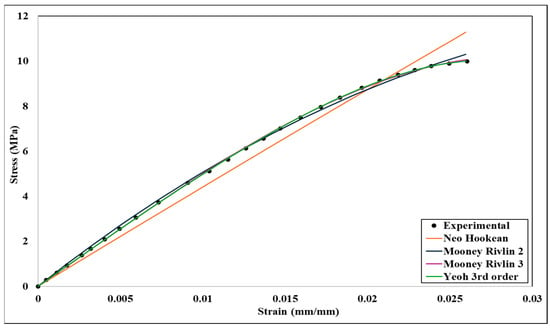
Figure 11.
Curve fitting of different hyperelastic models for 20% infill density.
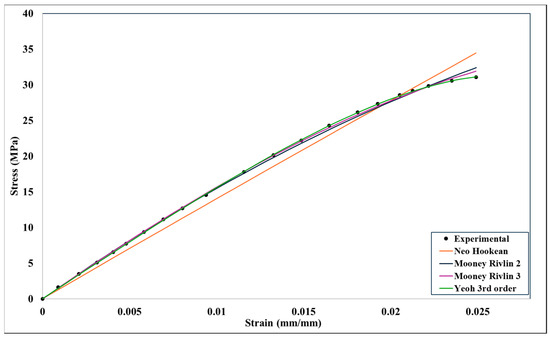
Figure 12.
Curve fitting different hyperelastic models for 40% infill density.
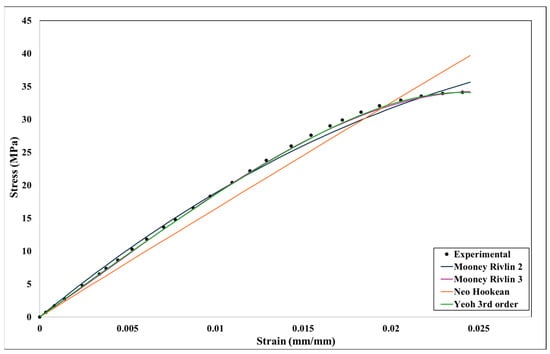
Figure 13.
Curve fitting different hyperelastic models for 60% infill density.
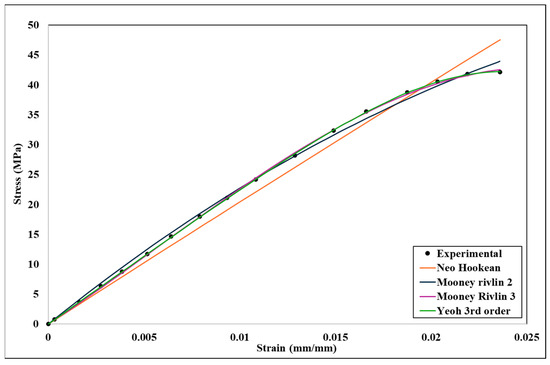
Figure 14.
Curve fitting of different hyperelastic models for 100% infill density.
Even though the Neo-Hookean model shows a little less fit at a higher infill density, it can be assumed that all the curves have reasonable fitting against the experimental data after analyzing all the curve fitting. As a result, any hyperelastic models can undergo numerical analysis. Based on the curve fitting displayed in Figure 11, Figure 12, Figure 13 and Figure 14, all four hyperelastic models’ parameters were acquired, and they are listed in Table 4.

Table 4.
Material parameters of four hyperplastic models for different infill ratios.
5.3. Numerical Analysis
The experiments conducted in Section 2, as shown in Figure 4, allow for a comparison using stress vs. strain and strain energy density vs. stretch. Several hyperelastic models are employed, with all computational results summarized in this section. It is important to note that all hyperelastic models were evaluated using the parameters specified in Table 4. As a result, it is difficult to determine why one model performs significantly better than the others.
5.3.1. Finite Element Analysis Results
Finite element analysis was conducted in Ansys Mechanical. Figure 15 and Figure 16 show the FEA results for 20% and 40% infill densities, respectively, for the four hyperelastic models. It can be seen from Figure 15 and Figure 16 that the four corners of the narrow section have the highest stress for every case, and the whole narrow section experiences more stress compared to the other parts of the specimen. Uniaxial tensile tests of AM hyperelastic materials often show directional variation (anisotropy). Due to mesh dependency in different printing directions, in Z-direction loading, standard hyperelastic models may overpredict stiffness. However, in X-Y plane loading (parallel to layers), simulations often align well with experiments. In this study, a uniaxial tensile loading condition was applied, which is identical to Z-direction loading. To overcome overprediction and directional variation, fine meshes were introduced in the FEA with adaptive refinement in high-strain regions to improve accuracy.
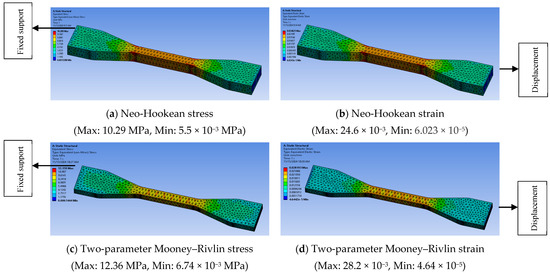
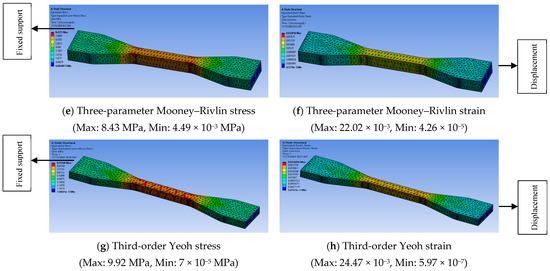
Figure 15.
FEA results for 20% infill density.
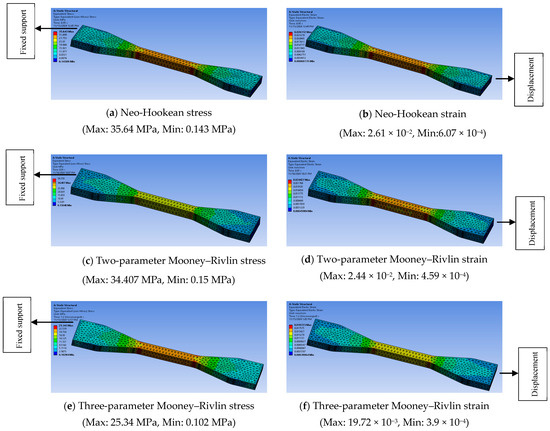

Figure 16.
FEA results for 40% infill density.
It can be seen from Figure 17 that changes in mesh size have a very negligible effect on simulation. Though mesh size changes from 0.5 mm to 3 mm, there are no significant changes in the trend of stress-strain. Thus, a small or very fine mesh can stabilize results but will increase computational cost significantly.
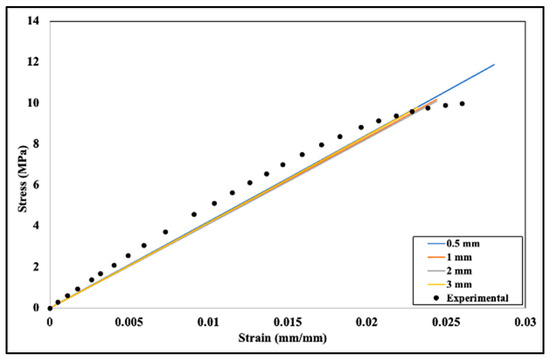
Figure 17.
Sensitivity analyses related to the mesh size for the Neo-Hookean model and 20% infill density.
5.3.2. Curve Fitting of FEA Results
After numerical simulation, stress-strain data were obtained from Ansys Mechanical for four infill densities (20%, 40%, 60%, and 100%). Based on these data and the methodology described in Section 2, Equation (1), Strain Energy Density Calculation, strain energy density–stretch graphs were obtained for each infill density and the four hyperelastic models. Figure 18, Figure 19, Figure 20 and Figure 21 show the stress-strain and corresponding strain energy density–stretch graphs.
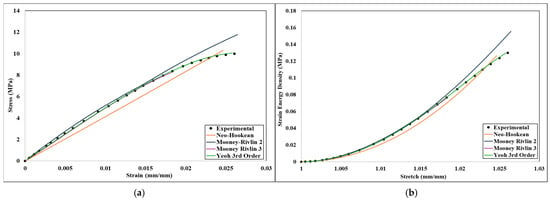
Figure 18.
Comparison of numerical and experimental analysis results for 20% infill density (a) stress-strain comparison and (b) Strain Energy Density-stretch comparison.
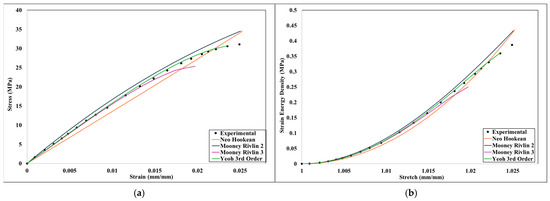
Figure 19.
Comparison of numerical and experimental analysis results for 40% infill density (a) stress-strain comparison and (b) Strain Energy Density-stretch comparison.
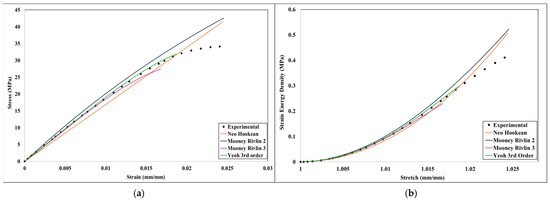
Figure 20.
Comparison of numerical and experimental analysis results for 60% infill density (a) stress-strain comparison and (b) Strain Energy Density-stretch comparison.
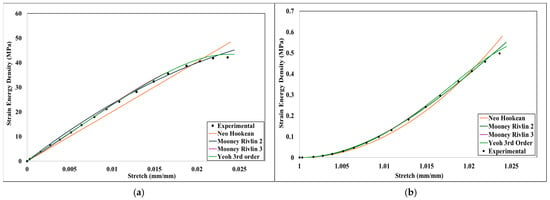
Figure 21.
Comparison of numerical and experimental analysis results for 100% infill density (a) stress-strain comparison and (b) Strain Energy Density-stretch comparison.
As shown by Figure 18 through Figure 20 and the R2 value in Table 5, all three models exhibit a sufficient degree of agreement with the experimental data. From Figure 18, Figure 19, Figure 20 and Figure 21 and Table 5, it can be assumed that three-parameter models (three-parameter Mooney–Rivlin and third-order Yeoh) performed better than the one-parameter Neo-Hookean and two-parameter Mooney–Rivlin models, as they have higher R2 values for every infill density.

The Mooney–Rivlin model with two parameters offers an advantage over the Yeoh model and the three-term Mooney–Rivlin model due to its lower complexity. The Neo-Hookean model has only one material parameter, C10, making it computationally efficient and easy to implement. In contrast, the Mooney–Rivlin and Yeoh models involve additional parameters, increased computational complexity, and increased runtime in finite element analysis (FEA). More complex models require higher numerical stability and can introduce convergence issues in nonlinear FEA solvers, particularly in large deformations. Thus, the Neo-Hookean model is suitable for small-to-moderate deformations and nearly incompressible materials (e.g., soft biological tissues and rubber at low strains). However, the Mooney–Rivlin model is more accurate for rubber-like materials, particularly when biaxial or shear deformations are present. In uniaxial loading, the Neo-Hookean model can show reasonable results with higher accuracy. The Neo-Hookean model is useful in early-stage design evaluations where qualitative trends are more important than precise stress-strain predictions. Consequently, the neo-Hookean model was selected to fit its parameter C10 across different infill densities, with the resulting fitted curve displayed in Figure 21. Additionally, the neo-Hookean model, requiring only a single parameter, provides a notable advantage, as this parameter increases consistently with infill density. A second-order polynomial can define the fit function for the C10 parameter regarding the infill ratio (x):
C10(x) = −547.34x2 + 978.46x − 90.868
The second-order polynomial can also produce a reasonably good result, with an R2 value of 0.9761. Afshar et al. [24] also considered second-order polynomials for the fit function of C10 of the Neo-Hookean parameter. However, in this research, third-order polynomials provide more accurate results, with an R2 value of 1. A third-order polynomial can define the fitting function for the C10 parameter regarding the infill ratio (x):
Figure 22 shows the fitted curve for the Neo-Hookean parameter C10 with changing infill densities.
C10(x) = 1684.6x3 − 3487.7x2 + 2432.7x − 286.4
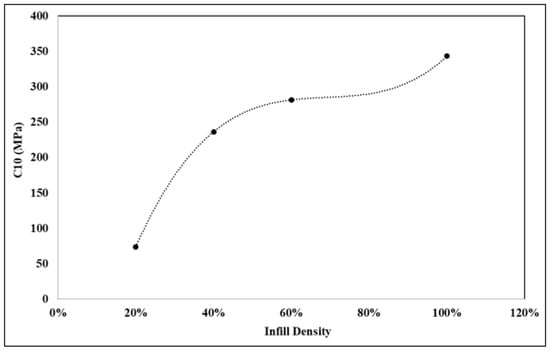
Figure 22.
Curve fitting for Neo-Hookean parameter C10 with a third-order polynomial.
Thus, it can be assumed that a third-order polynomial will generate a very good, more accurate C10 than a second-order polynomial will, upon changing the infill ratio. Thus, Equation (20) can be used in the future to determine C10 values with high accuracy. This equation will require less computational effort for determining C10 and will speed up material prototyping and bulk manufacturing for any infill densities ranging from 20% to 100%.
6. Conclusions
Using both experimental and numerical techniques, this work examined the nonlinear mechanical characteristics of 3D-printed ABS specimens with grid infill patterns and different infill densities. The results of the uniaxial tensile tests showed that the infill density has a major impact on the material’s mechanical performance. Young’s modulus increased exponentially with increasing infill density, reaching a maximum of 2394.8 MPa at 100% density. At the same time, strain at break displayed a non-monotonic trend, peaking at 5.8% for 100% infill density. Moreover, numerical simulations in Ansys Mechanical validated the experimental findings and highlighted the concentration of stress in the narrow sections of the specimens, correlating well with the observed fracture patterns. Hyperelastic material modeling using Neo-Hookean, Mooney–Rivlin, and Yeoh models effectively captured the nonlinear deformation behavior of the specimens. Among these, the three-parameter Mooney–Rivlin and third-order Yeoh models demonstrated superior fitting accuracy across all infill densities, as evidenced by higher R2 values. However, it is proposed that the Neo-Hookean model can be used because of its one-parameter model, and parameters can be determined by using a third-order polynomial equation for any infill density. The proposed hyperelastic models provide a robust framework for predicting the mechanical behavior of 3D-printed ABS parts with different infill densities. This research advances our understanding of nonlinear hyperelastic material modeling with different infill densities and mechanical behaviors, which offers valuable insights into optimizing design and manufacturing processes in additive manufacturing applications. Future research could build upon these results by exploring more complex infill geometries, multi-material printing, multi-axial loading conditions, and dynamic loading conditions to further enhance the predictive capabilities of hyperelastic modeling. Additionally, expanding the study to include other thermoplastic, polymeric, and composite materials could provide a broader understanding of the interplay between infill patterns and mechanical behavior, paving the way for advanced additive manufacturing applications.
Author Contributions
Conceptualization, K.K. and M.Z.H.B.; methodology, K.K. and M.Z.H.B.; software, M.Z.H.B.; validation, K.K. and M.Z.H.B.; formal analysis, K.K. and M.Z.H.B.; investigation, K.K. and M.Z.H.B.; resources; data curation, M.Z.H.B.; writing—original draft preparation, K.K. and M.Z.H.B.; writing—review and editing, K.K. and M.Z.H.B.; visualization, M.Z.H.B.; supervision, K.K.; project administration, K.K. All authors have read and agreed to the published version of the manuscript.
Funding
This research received no external funding.
Data Availability Statement
Data is contained within the article.
Conflicts of Interest
The authors declare no conflicts of interest.
References
- Kong, L.; Ambrosi, A.; Nasir, Z.; Guan, J.; Pumera, M. Self-propelled 3D-printed aircraft carrier of light-powered smart micromachines for large-volume nitroaromatic explosives removal. Adv. Funct. Mater. 2019, 29, 1903872. [Google Scholar] [CrossRef]
- Bao, X.; Zhu, L.; Huang, X.; Tang, D.; He, D.; Shi, J.; Xu, G. 3D biomimetic artificial bone scaffolds with dual-cytokines spatiotemporal delivery for large weight-bearing bone defect repair. Sci. Rep. 2017, 7, 7814. [Google Scholar] [CrossRef]
- Khosravani, R.; Reinicke, T. 3D-printed sensors: Current progress and future challenges. Sens. Actuators A 2020, 305, 111916. [Google Scholar] [CrossRef]
- Bhuiyan, M.Z.H.; Khanafer, K.; Rafi, E.I.; Shihab, M.S. Non-Linear hyperelastic model analysis and numerical validation of 3D printed PLA+ material incorporating various infill densities. Machines 2025, 13, 91. [Google Scholar] [CrossRef]
- Khanafer, K.; Park, J.; Eltaggaz, A.; Aboelkassem, Y. Investigation of the Mechanical Characteristics of Metal 3D Printing at Different Build Orientation and Directions. J. Eng. Mater. Technol. 2024, 146, 031001-1. [Google Scholar] [CrossRef]
- Khanafer, K.; Abbasspour, A.; Aboelkassem, Y. Thermal Conductivity of 3D Printed Metal using Extrusion-based Metal Additive Manufacturing Process. J. Eng. Mater. Technol. 2024, 147, 021002. [Google Scholar] [CrossRef]
- Khanafer, K.; Cao, J.; Kokash, H. Condition Monitoring in Additive Manufacturing: A Critical Review of Different Approaches. J. Manuf. Mater. Process. 2024, 8, 95. [Google Scholar] [CrossRef]
- Wang, Y.; Blache, R.; Xu, X. Selection of additive manufacturing processes. Rapid Prototype J. 2017, 23, 434–447. [Google Scholar] [CrossRef]
- Adugna, Y.W.; Akessa, A.D.; Lemu, H.G. Overview study on challenges of additive manufacturing for a healthcare application. IOP Conf. Ser. Mater. Sci. Eng. 2021, 1201, 012041. [Google Scholar] [CrossRef]
- Shahrubudin, N.; Lee, T.; Ramlan, R. An overview of 3D printing technology: Technological, materials, and applications. Procedia Manuf. 2019, 35, 1286–1296. [Google Scholar] [CrossRef]
- Khosravani, M.; Berto, F.; Ayatollahi, M.; Reinicke, T. Characterization of 3D-printed PLA parts with different raster orientations and printing speeds. Sci Rep. 2022, 12, 1016. [Google Scholar] [CrossRef]
- Ganeshkumar, S.; Kumar, S.D.; Magarajan, U.; Rajkumar, S.; Arulmurugan, B.; Sharma, S.; Li, C.; Ilyas, R.A.; Badran, M.F. Investigation of Tensile Properties of Different Infill Pattern Structures of 3D-Printed PLA Polymers: Analysis and Validation Using Finite Element Analysis in ANSYS. Materials 2022, 15, 5142. [Google Scholar] [CrossRef]
- Alhazmi, W.; Backar, H. Influence of Infill Density and Orientation on the Mechanical Response of PLA+ Specimens Produced using FDM 3D Printing. Int. J. Adv. Sci. Technol. 2020, 29, 362–3371. [Google Scholar]
- Alvarez, C.; Kenny, L.; Lagos, C.; Rodrigo, F.; Aizpun, M. Investigating the influence of infill percentage on the mechanical properties of fused deposition modeled ABS parts. Ing. E Investig. 2016, 36, 10–116. [Google Scholar]
- Es-Said, O.S.; Foyos, J.; Noorani, R.; Mendelson, M.; Marloth, R.; Pregger, B.A. Effect of layer orientation on mechanical properties of rapid prototyped samples. Mater. Manuf. Process. 2000, 15, 107–122. [Google Scholar] [CrossRef]
- Tanveer, M.Q.; Haleem, A.; Suhaib, M. Effect of variable infill density on mechanical behavior of 3-D printed PLA specimen: An experimental investigation. SN Appl. Sci. 2019, 1, 1701. [Google Scholar] [CrossRef]
- Aloyaydi, B.; Sivasankaran, S.; Mustafa, A. Investigation of infill-patterns on the mechanical response of 3D printed poly-lactic-acid. Polym. Test. 2020, 87, 106557. [Google Scholar] [CrossRef]
- Lee, H.M.; Sung, J.; Ko, B.; Lee, H.; Park, S.; So, H.; Yoon, G.H. Modeling and application of anisotropic hyperelasticity of PDMS polymers with surface patterns obtained by additive manufacturing technology. J. Mech. Behav. Biomed. Mater. 2021, 118, 104412. [Google Scholar] [CrossRef]
- Afshar, R.; Jeanne, S.; Abali, B.E. Nonlinear material modeling for mechanical characterization of 3-D printed PLA polymer with different infill densities. Appl. Compos. Mater. 2023, 30, 987–1001. [Google Scholar] [CrossRef]
- Liu, C.-H.; Hung, P.-T. Effect of the infill density on the performance of a 3D-printed compliant finger. Mater. Des. 2022, 223, 111203. [Google Scholar] [CrossRef]
- Sajjad, R.; Butt, S.U.; Saeed, H.A.; Anwar, M.T.; Rasheed, T. Impact of multiple infill strategy on the structural strength of single build FDM printed parts. J. Manuf. Process. 2023, 89, 105–110. [Google Scholar] [CrossRef]
- Prajapati, S.K.; Gnanamoorthy, R. Effect of the infill percentage of 3D printed Polyetheretherketone under the dry sliding condition. J. Manuf. Process. 2024, 131, 2073–2081. [Google Scholar] [CrossRef]
- Mohamed, O.A.; Masood, S.H.; Bhowmik, J.L. Optimization of fused deposition modeling process parameters: A review of current research and prospects. Adv. Manuf. 2015, 3, 42–53. [Google Scholar] [CrossRef]
- Yeoh, O.H. Some forms of the strain energy function for rubber. Rubber Chem. Technol. 1993, 66, 754–771. [Google Scholar] [CrossRef]
- Trobentar, B.; Glodež, S.; Zafošnik, B. Gear Tooth Deflection of Spur Polymer Gears; Elsevier: Amsterdam, The Netherlands, 2014; pp. 129–137. [Google Scholar] [CrossRef]
- Yavari, A.; Goriely, A. The Universal Program of Nonlinear Hyperelasticity. J. Elast. 2022, 154, 91–146. [Google Scholar] [CrossRef]
- Bostanabad, R.; Zhang, Y.; Li, X.; Kearney, T.; Brinson, L.C.; Apley, D.W.; Liu, W.K.; Chen, W. Computational microstructure characterization and reconstruction: Review of the state-of-the-art techniques. Prog. Mater. Sci. 2018, 95, 1–41. [Google Scholar] [CrossRef]
- Steinmann, P.; Hossain, M.; Possart, G. Hyperelastic models for rubber-like materials: Consistent tangent operators and suitability for Treloar’s data. Arch. Appl. Mech. 2012, 82, 1183–1217. [Google Scholar] [CrossRef]
- Timbrell, C.; Wiehahn, M.; Cook, G.; Muhr, A.H. Simulation of Crack Propagation in Rubber. In Constitutive Models for Rubber III; Busfield, J., Muhr, A., Eds.; A Balkema Publishers: London, UK, 2003; pp. 11–20. [Google Scholar]
- Ogden, R. Non-linear elastic deformations. Eng. Anal. 1984, 1, 119. [Google Scholar] [CrossRef]
- Sugihardjo, H.; Tavio, T.; Lesmana, Y. FE model of low-grade rubber for modeling housing’s Low-Cost rubber base isolators. Civ. Eng. J. 2018, 4, 24. [Google Scholar] [CrossRef]
- Mooney, M. A theory of large elastic deformation. J. Appl. Phys. 1940, 11, 582–592. [Google Scholar] [CrossRef]
- Rivlin, R.S. Large elastic deformations of isotropic materials IV. further developments of the general theory. Philos. Trans. R. Soc. Lond. Ser. A Math. Phys. Sci. 1948, 241, 379–397. [Google Scholar] [CrossRef]
- Bol, M.; Reese, S. Finite Element Modeling of Polymer Networks Based on Chain Statistics. In Constitutive Models for Rubber III; Busfield, J., Muhr, A., Eds.; A Balkema Publishers: London, UK, 2003; pp. 203–211. [Google Scholar]
- Gent, A.N. A new constitutive relation for rubber. Rubber Chem. Technol. 1996, 69, 59–61. [Google Scholar] [CrossRef]
- Bergstrom, J.S. Mechanics of Solid Polymers: Theory and Computational Modeling: Theory and Computational Modeling, 1st ed.; William Andrew: Montclair, NJ, USA, 2015. [Google Scholar]
- Yang, H.; Ganzosch, G.; Giorgio, I.; Abali, B.E. Material characterization and computations of a polymeric metamaterial with a pantographic substructure. Z. Angew. Math. Physik 2018, 69, 105. [Google Scholar] [CrossRef]
- Youssef, G. Hyperelastic Behavior of Polymers; Elsevier: Amsterdam, The Netherlands, 2022; pp. 117–144. [Google Scholar] [CrossRef]
- Kreyszig, E. Advanced Engineering Mathematics; John Wiley & Sons: Hoboken, NJ, USA, 2010. [Google Scholar]
- Rosakis, P. Ellipticity and deformations with discontinuous gradients in finite elastostatics. Arch. Ration. Mech. Anal. 1990, 109, 1–37. [Google Scholar] [CrossRef]
- Ruíz, M.J.G.; González, L.Y.S. Comparison of hyperelastic material models in the analysis of fabrics. Int. J. Cloth. Sci. Technol. 2006, 18, 314–325. [Google Scholar] [CrossRef]
- Shabbir, S.; Satyanarayana, B.; Sreeramulu, K. Characterization of hyperelastic material by experimental tests and curve fitting. Mater. Today Proc. 2020, 24, 1670–1679. [Google Scholar] [CrossRef]
Disclaimer/Publisher’s Note: The statements, opinions and data contained in all publications are solely those of the individual author(s) and contributor(s) and not of MDPI and/or the editor(s). MDPI and/or the editor(s) disclaim responsibility for any injury to people or property resulting from any ideas, methods, instructions or products referred to in the content. |
© 2025 by the authors. Licensee MDPI, Basel, Switzerland. This article is an open access article distributed under the terms and conditions of the Creative Commons Attribution (CC BY) license (https://creativecommons.org/licenses/by/4.0/).