
Improvement of Material Removal Rate and Within Wafer Non-Uniformity in Chemical Mechanical Polishing Using Computational Fluid Dynamic Modeling


Abstract

1. Introduction
- -
- Develop a detailed CFD model to simulate slurry movement during CMP, focusing on critical parameters such as wall shear stress, pressure distribution, and mass flow.
- -
- Compare the performance of radial and concentric groove patterns in terms of their effects on slurry distribution, reduction of back-mixing, and overall process efficiency.
- -
- Validate the accuracy and reliability of the CFD simulations through experimental data.
- -
- Provide practical insights for designing optimized polishing pads to achieve higher material removal rates and improved uniformity across wafers.
2. Methodology
2.1. Simulation
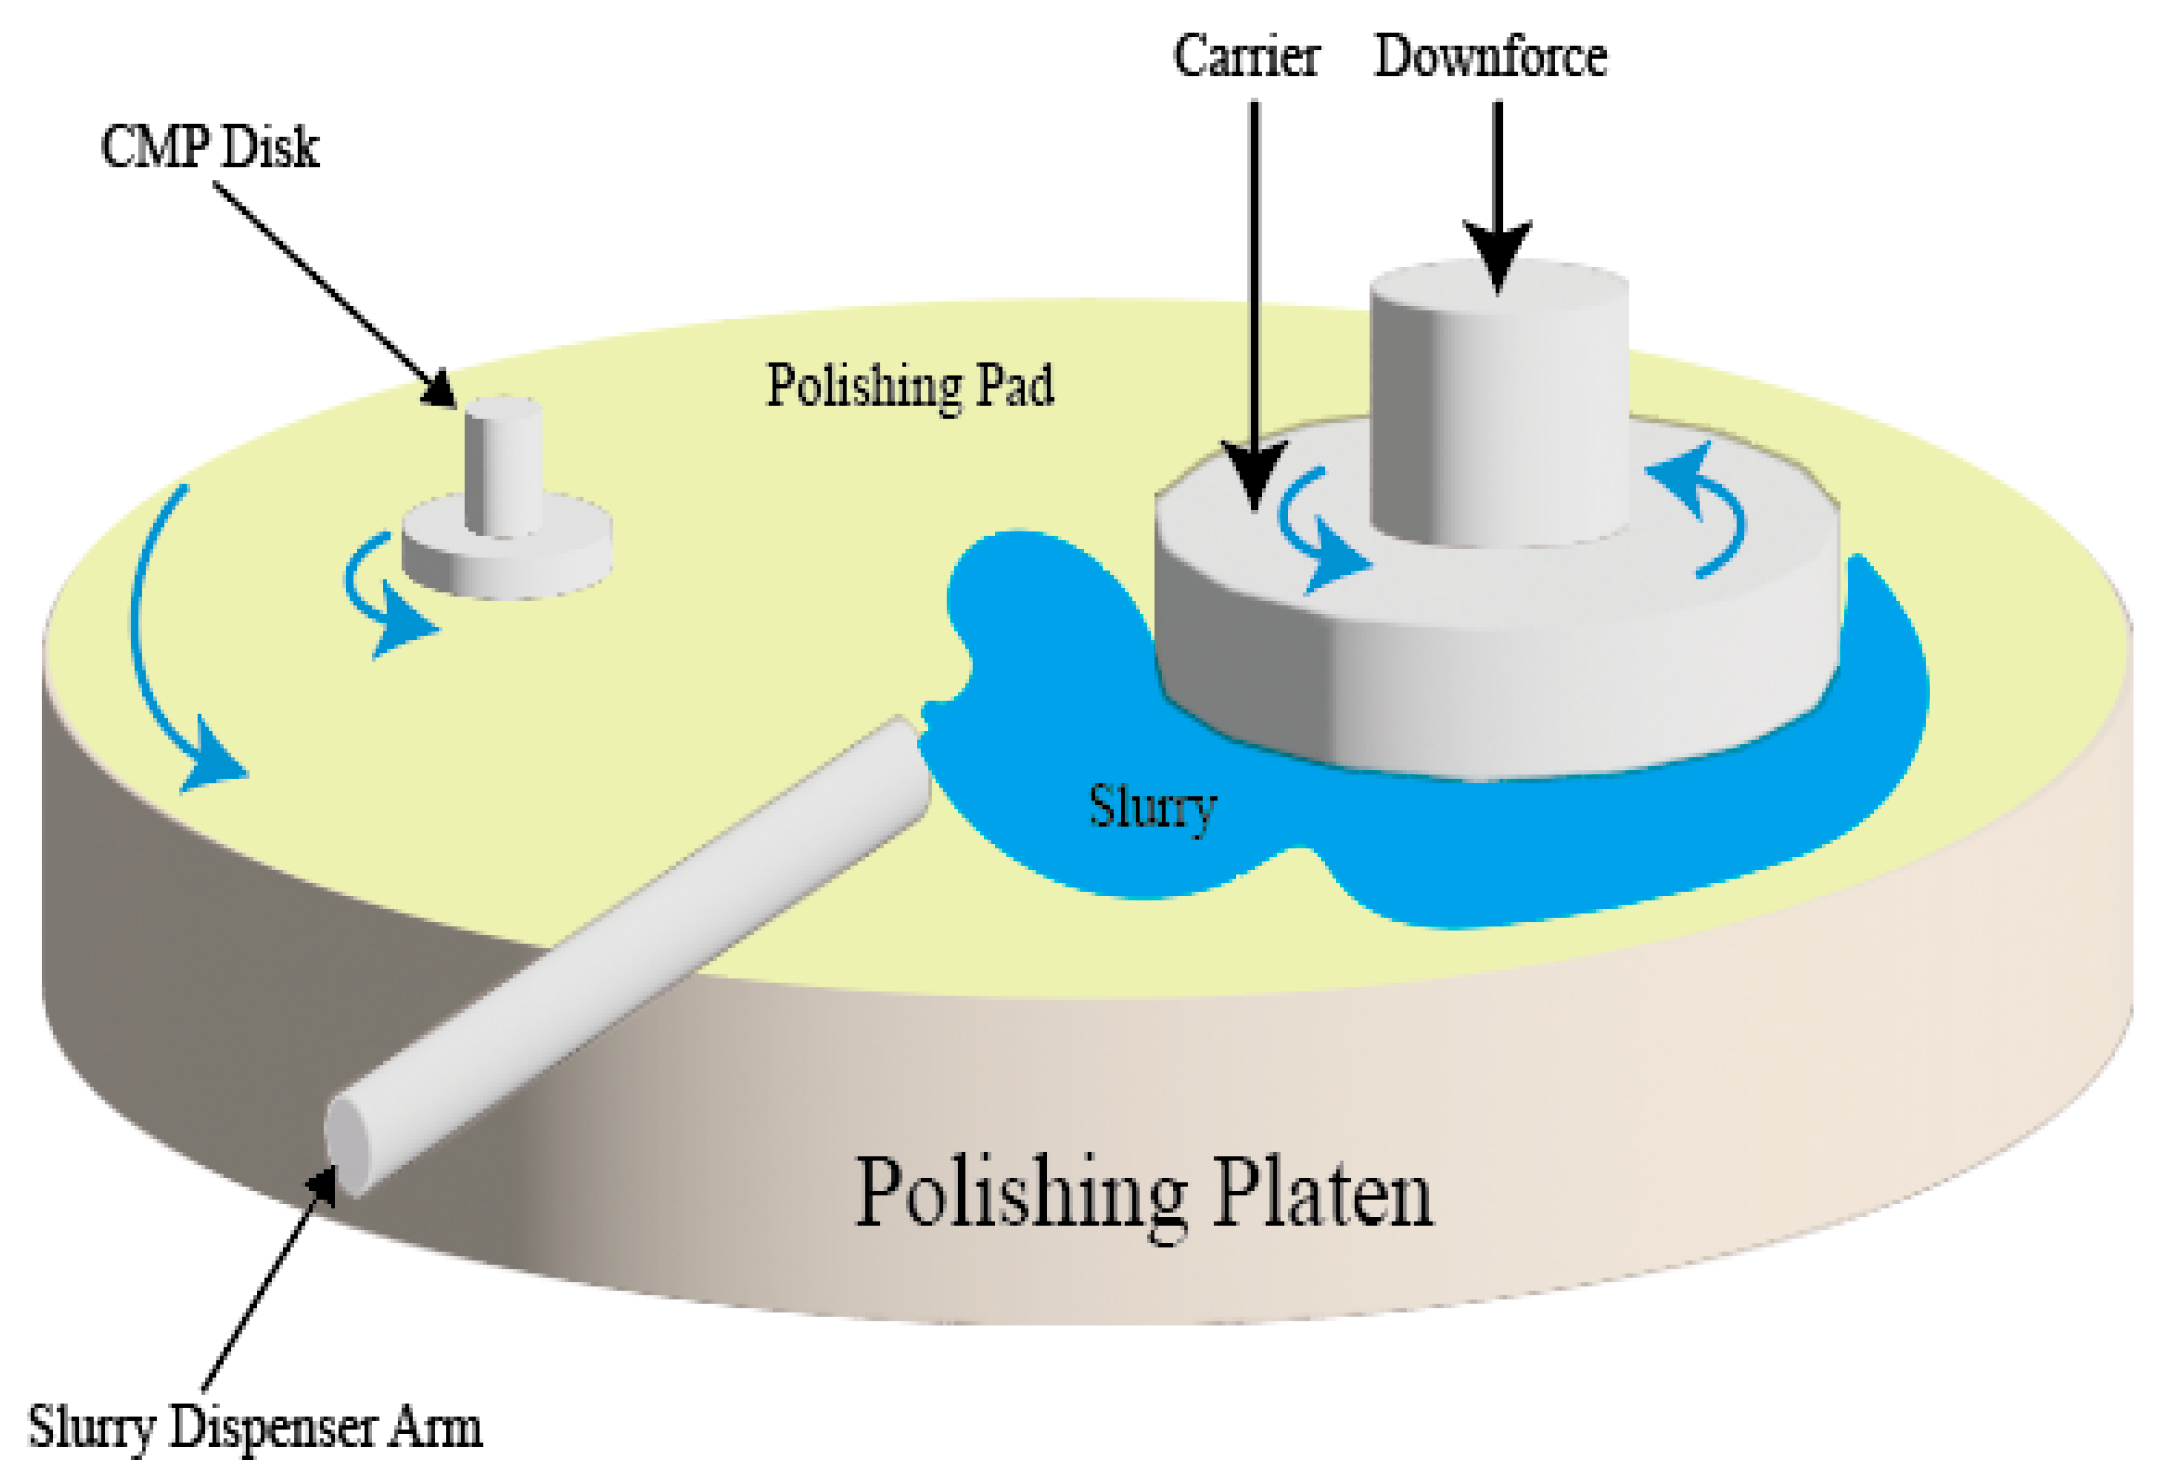
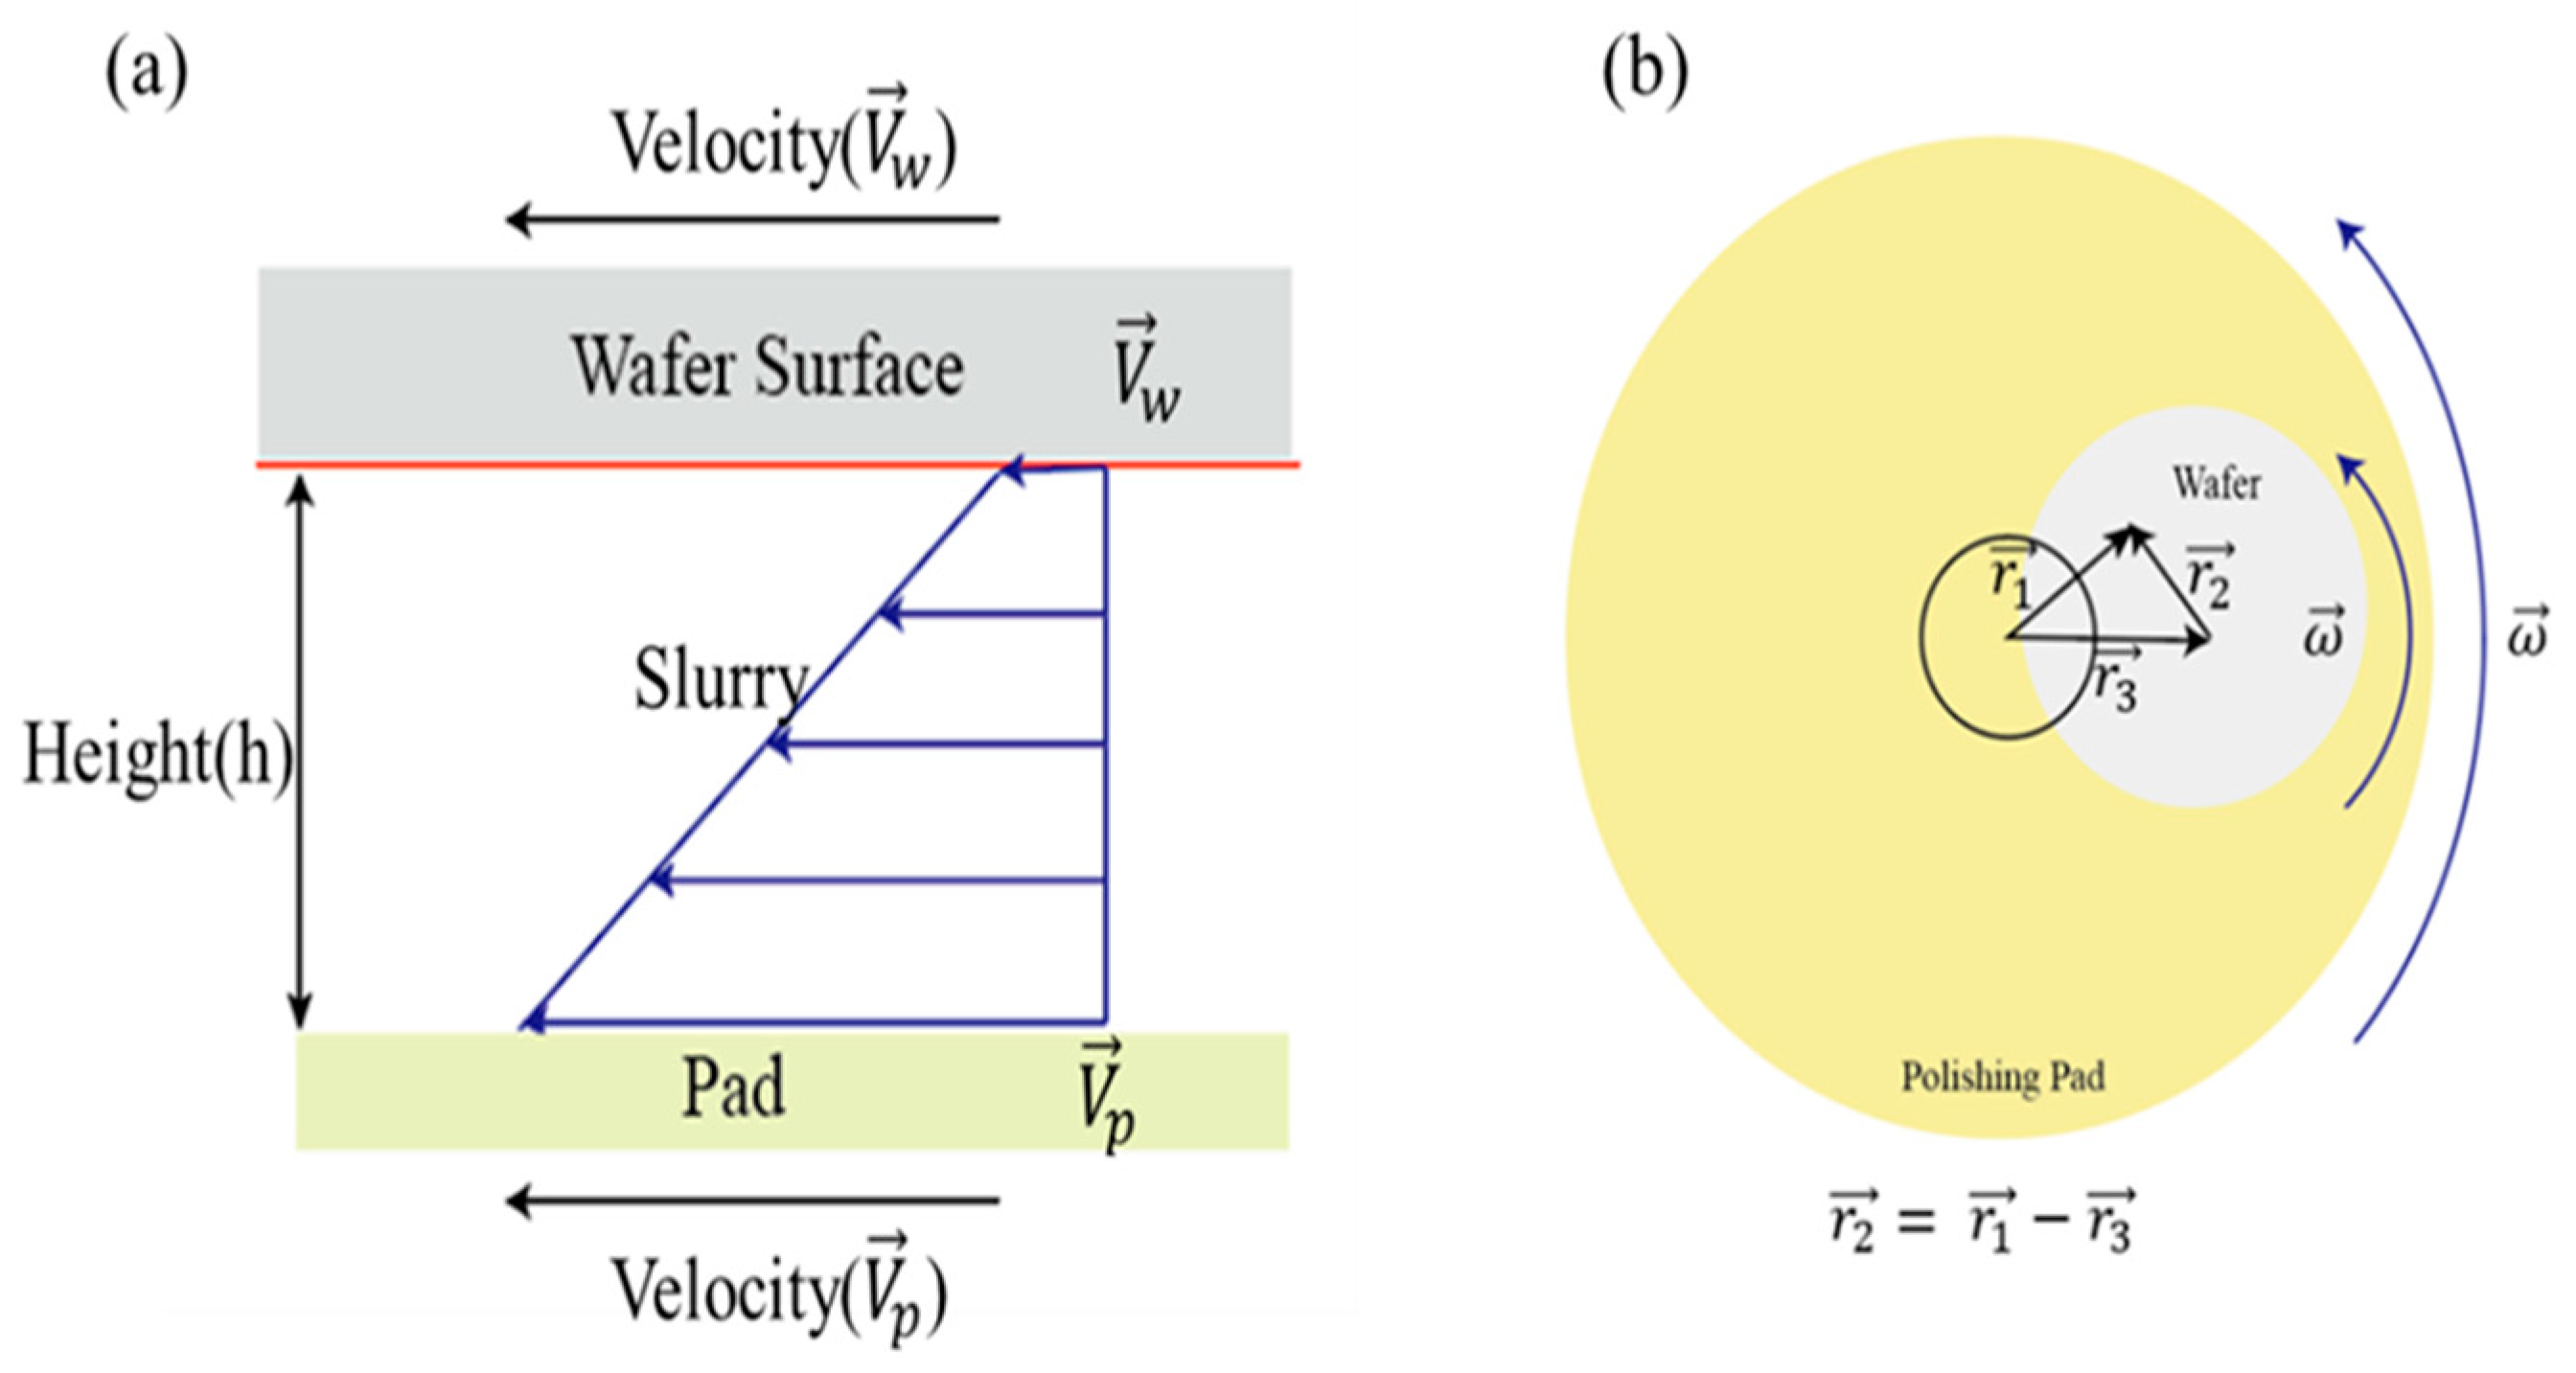
2.2. CMP Model
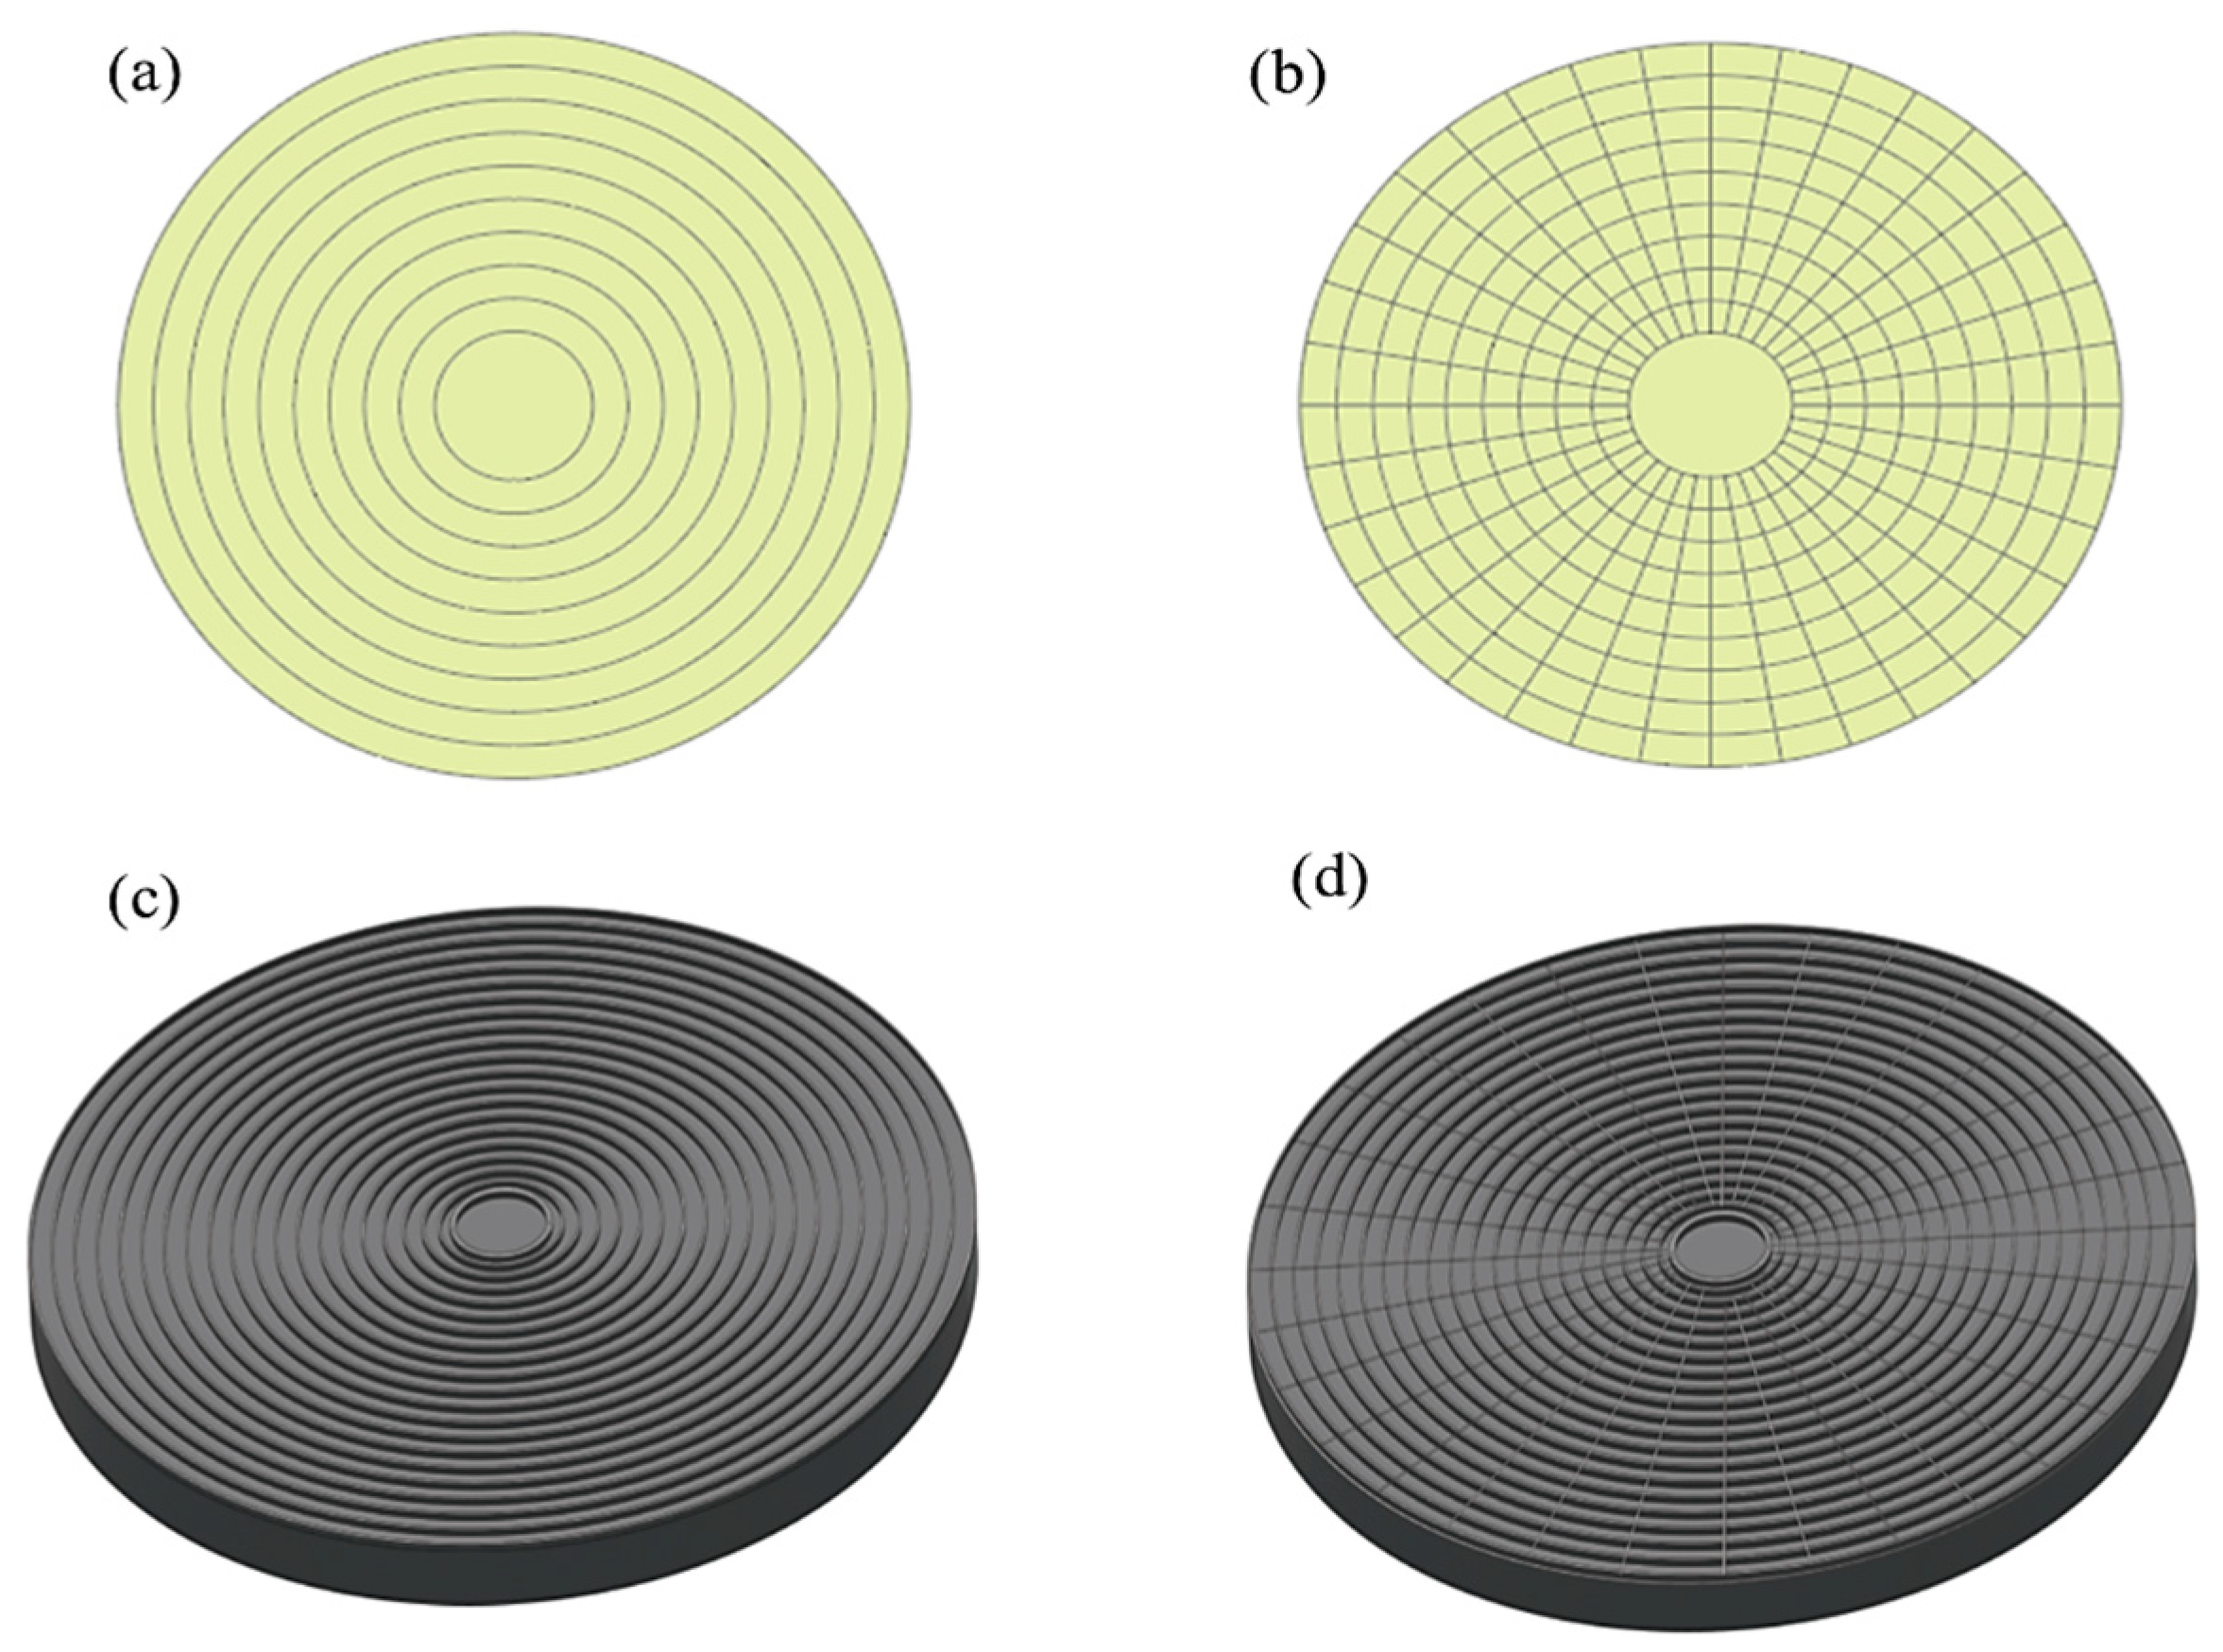
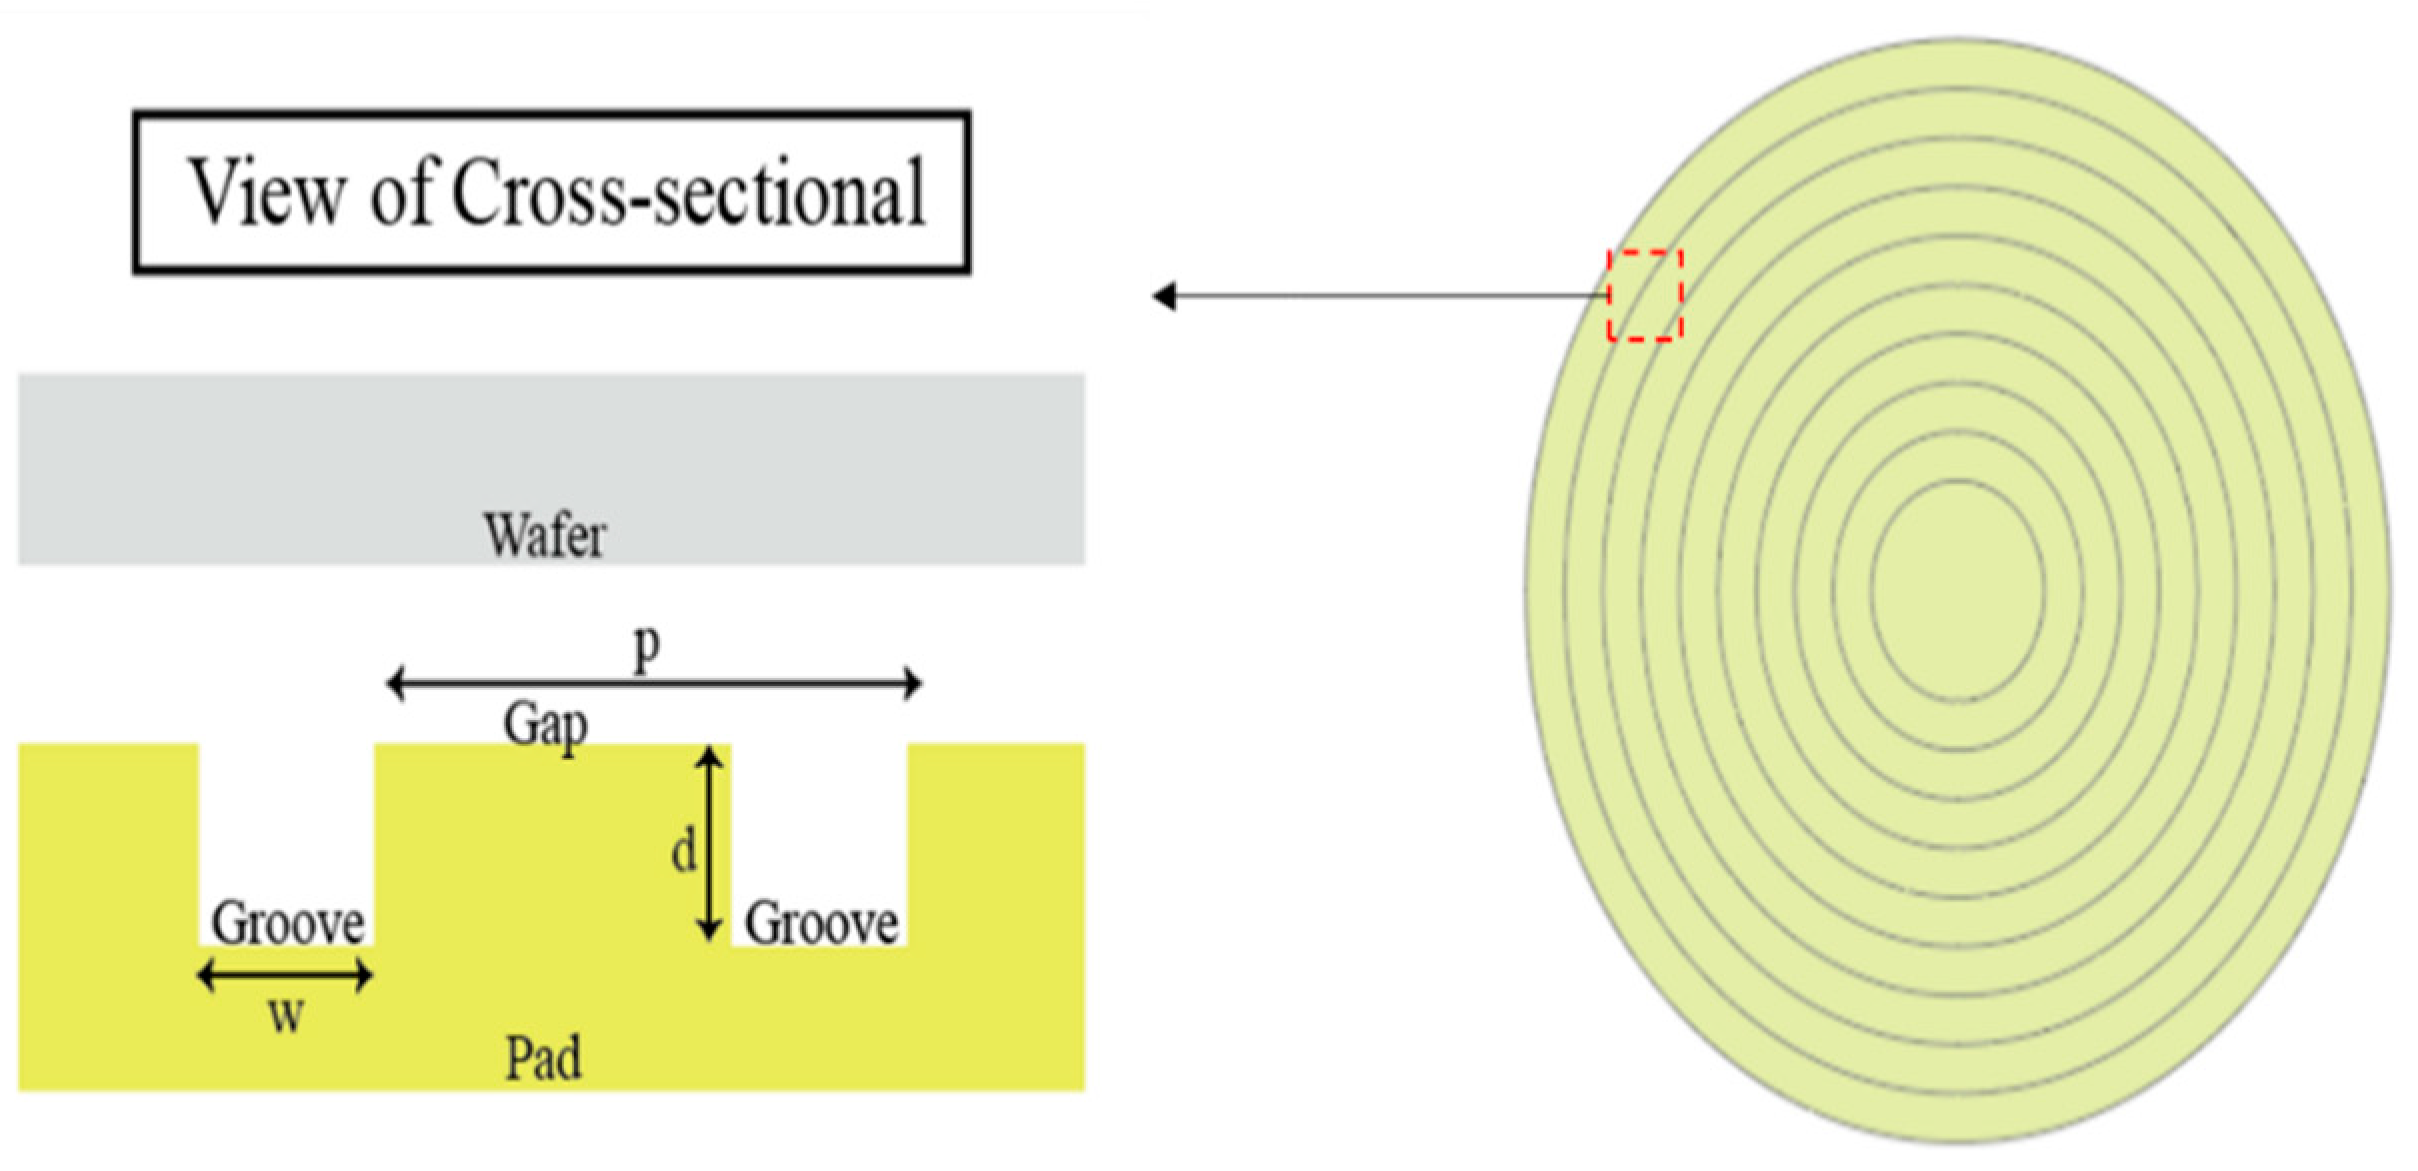
2.3. Polishing Pad Groove Forms
3. Results and Discussion
3.1. Pressure Field Distribution
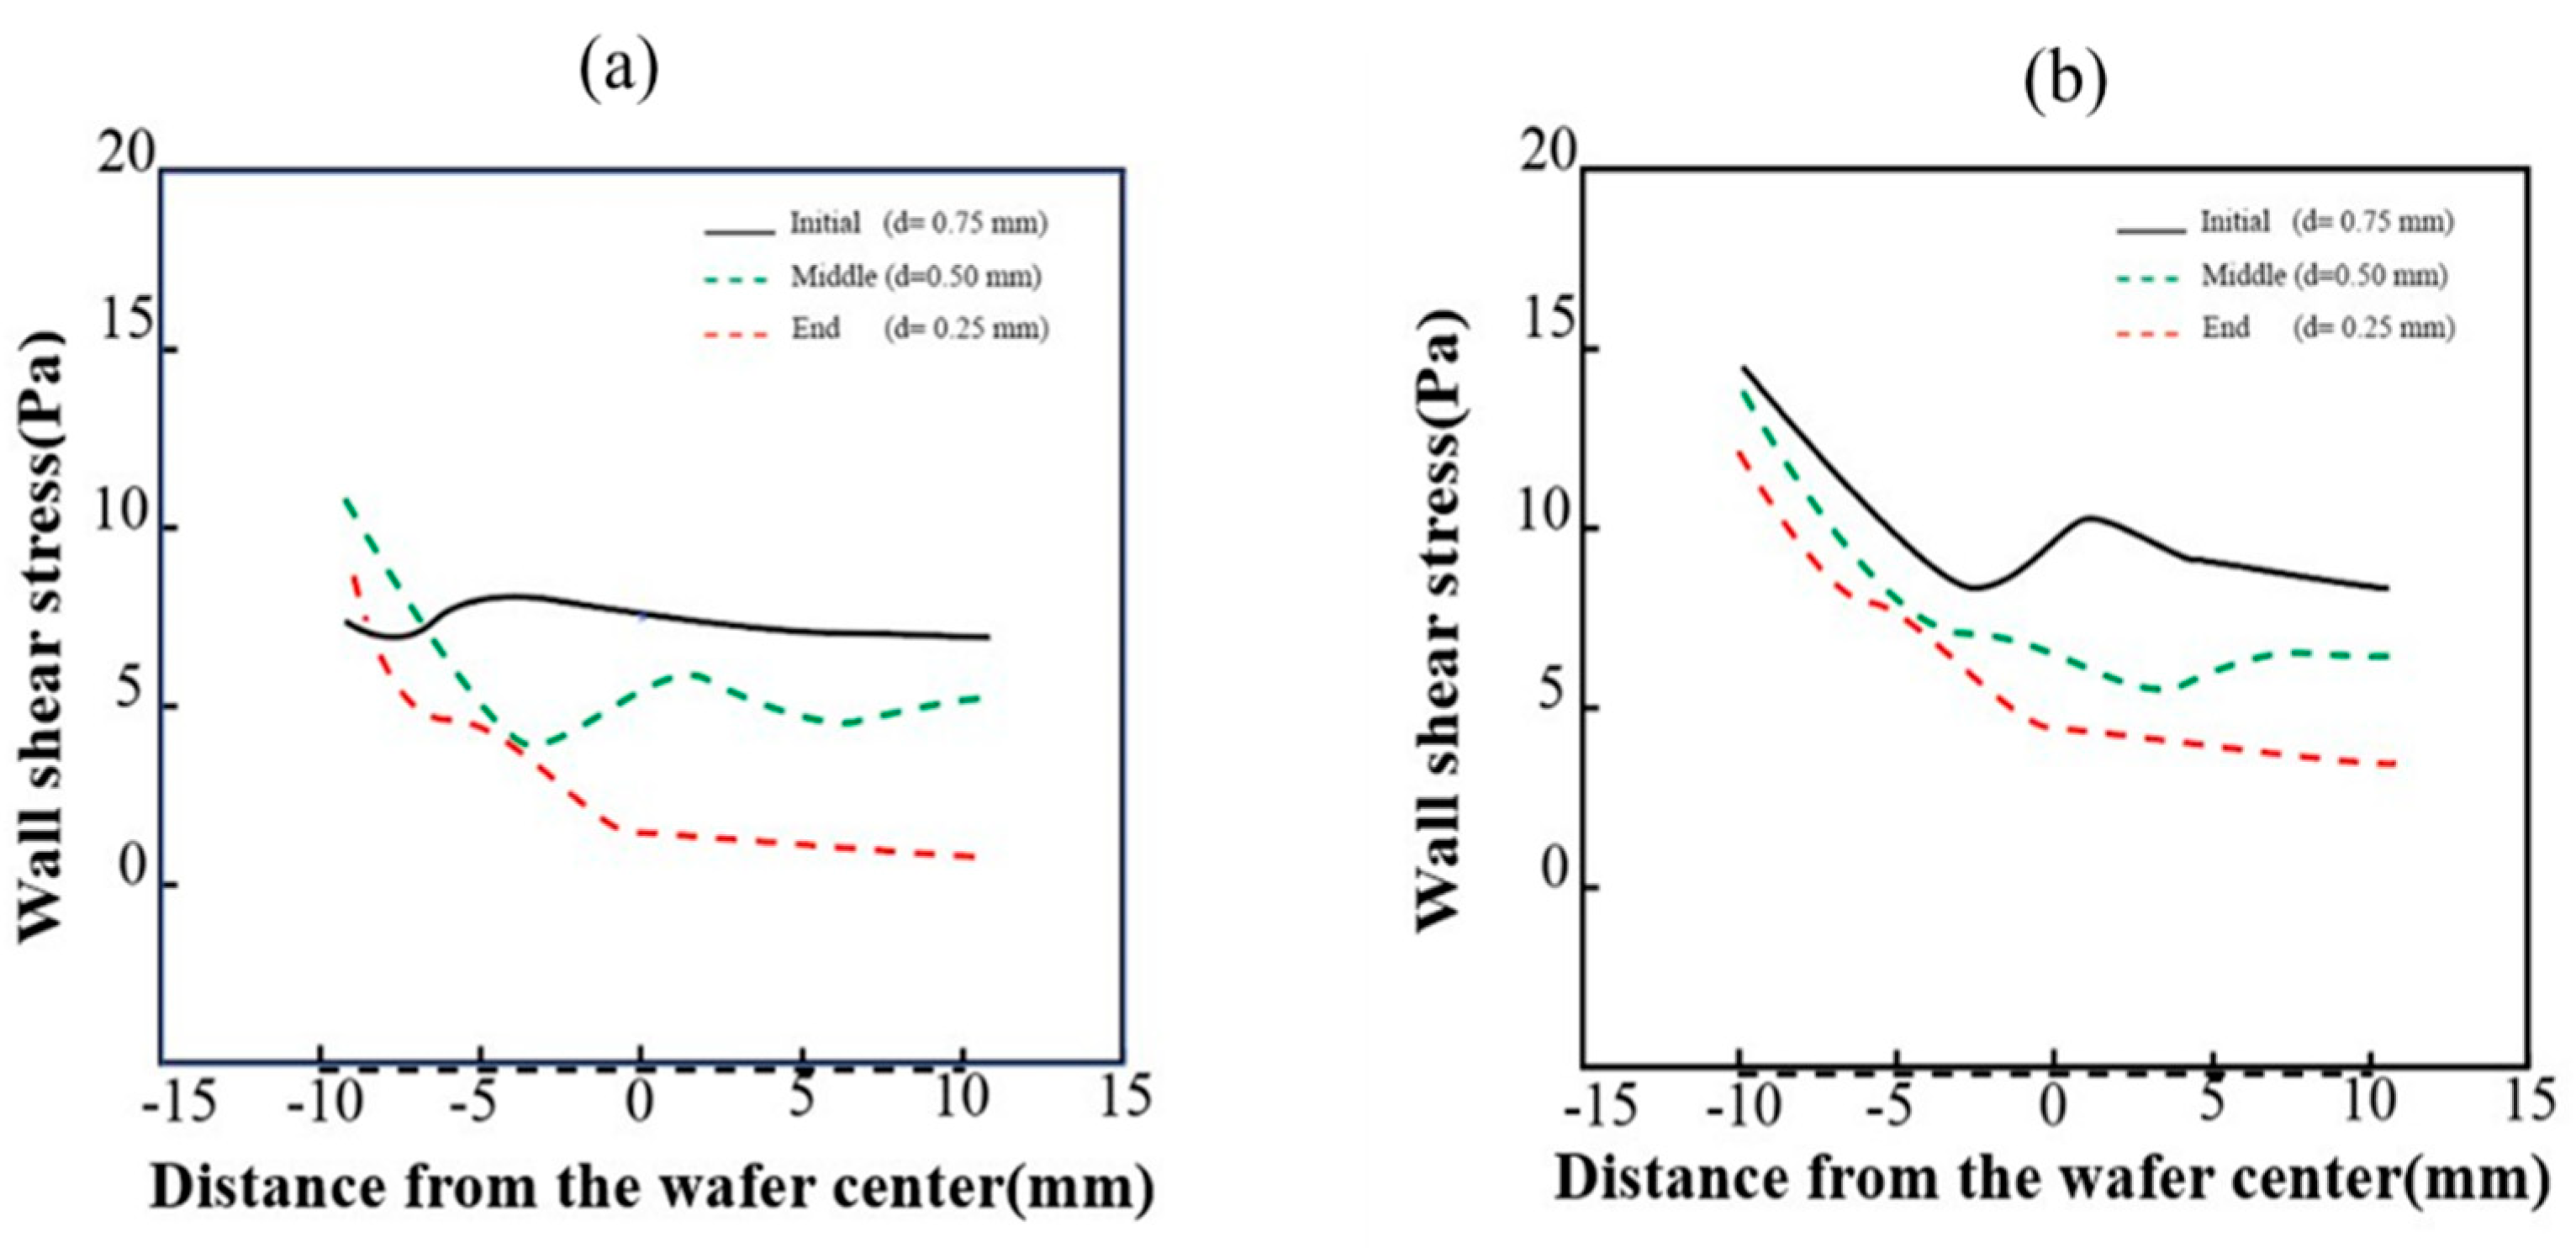
3.2. Effect of Wall Shear Stress
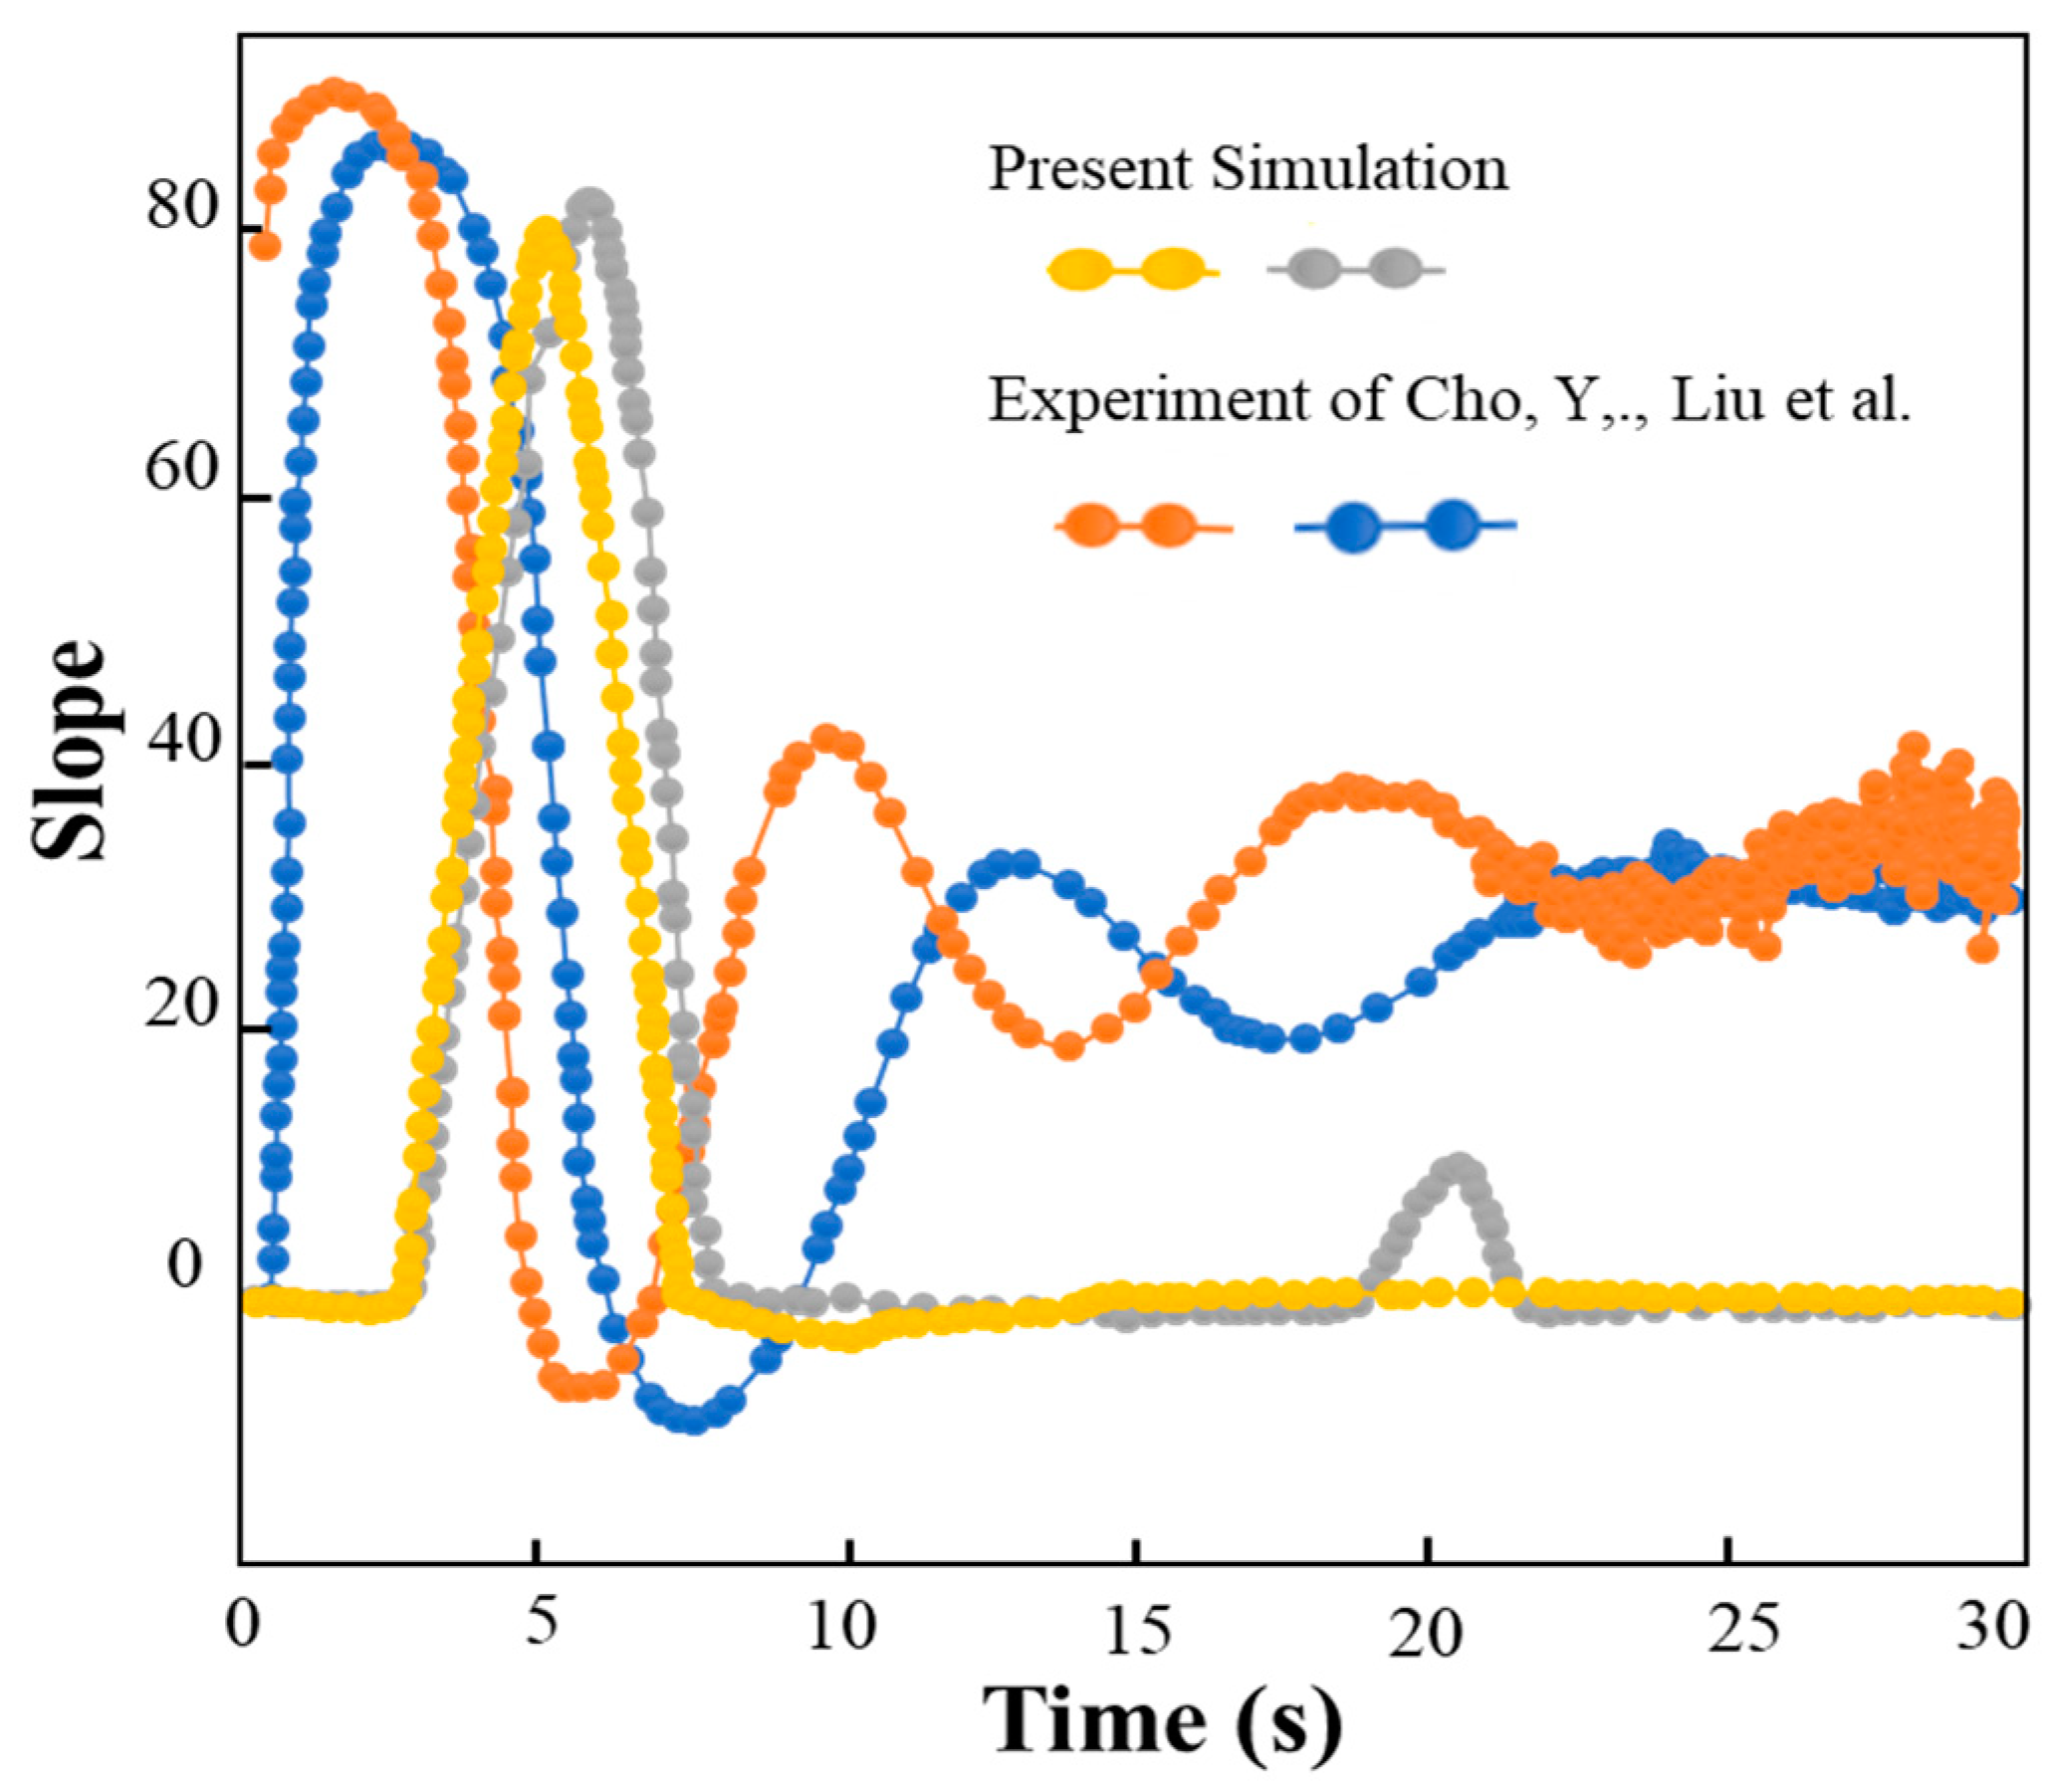
3.3. Validation
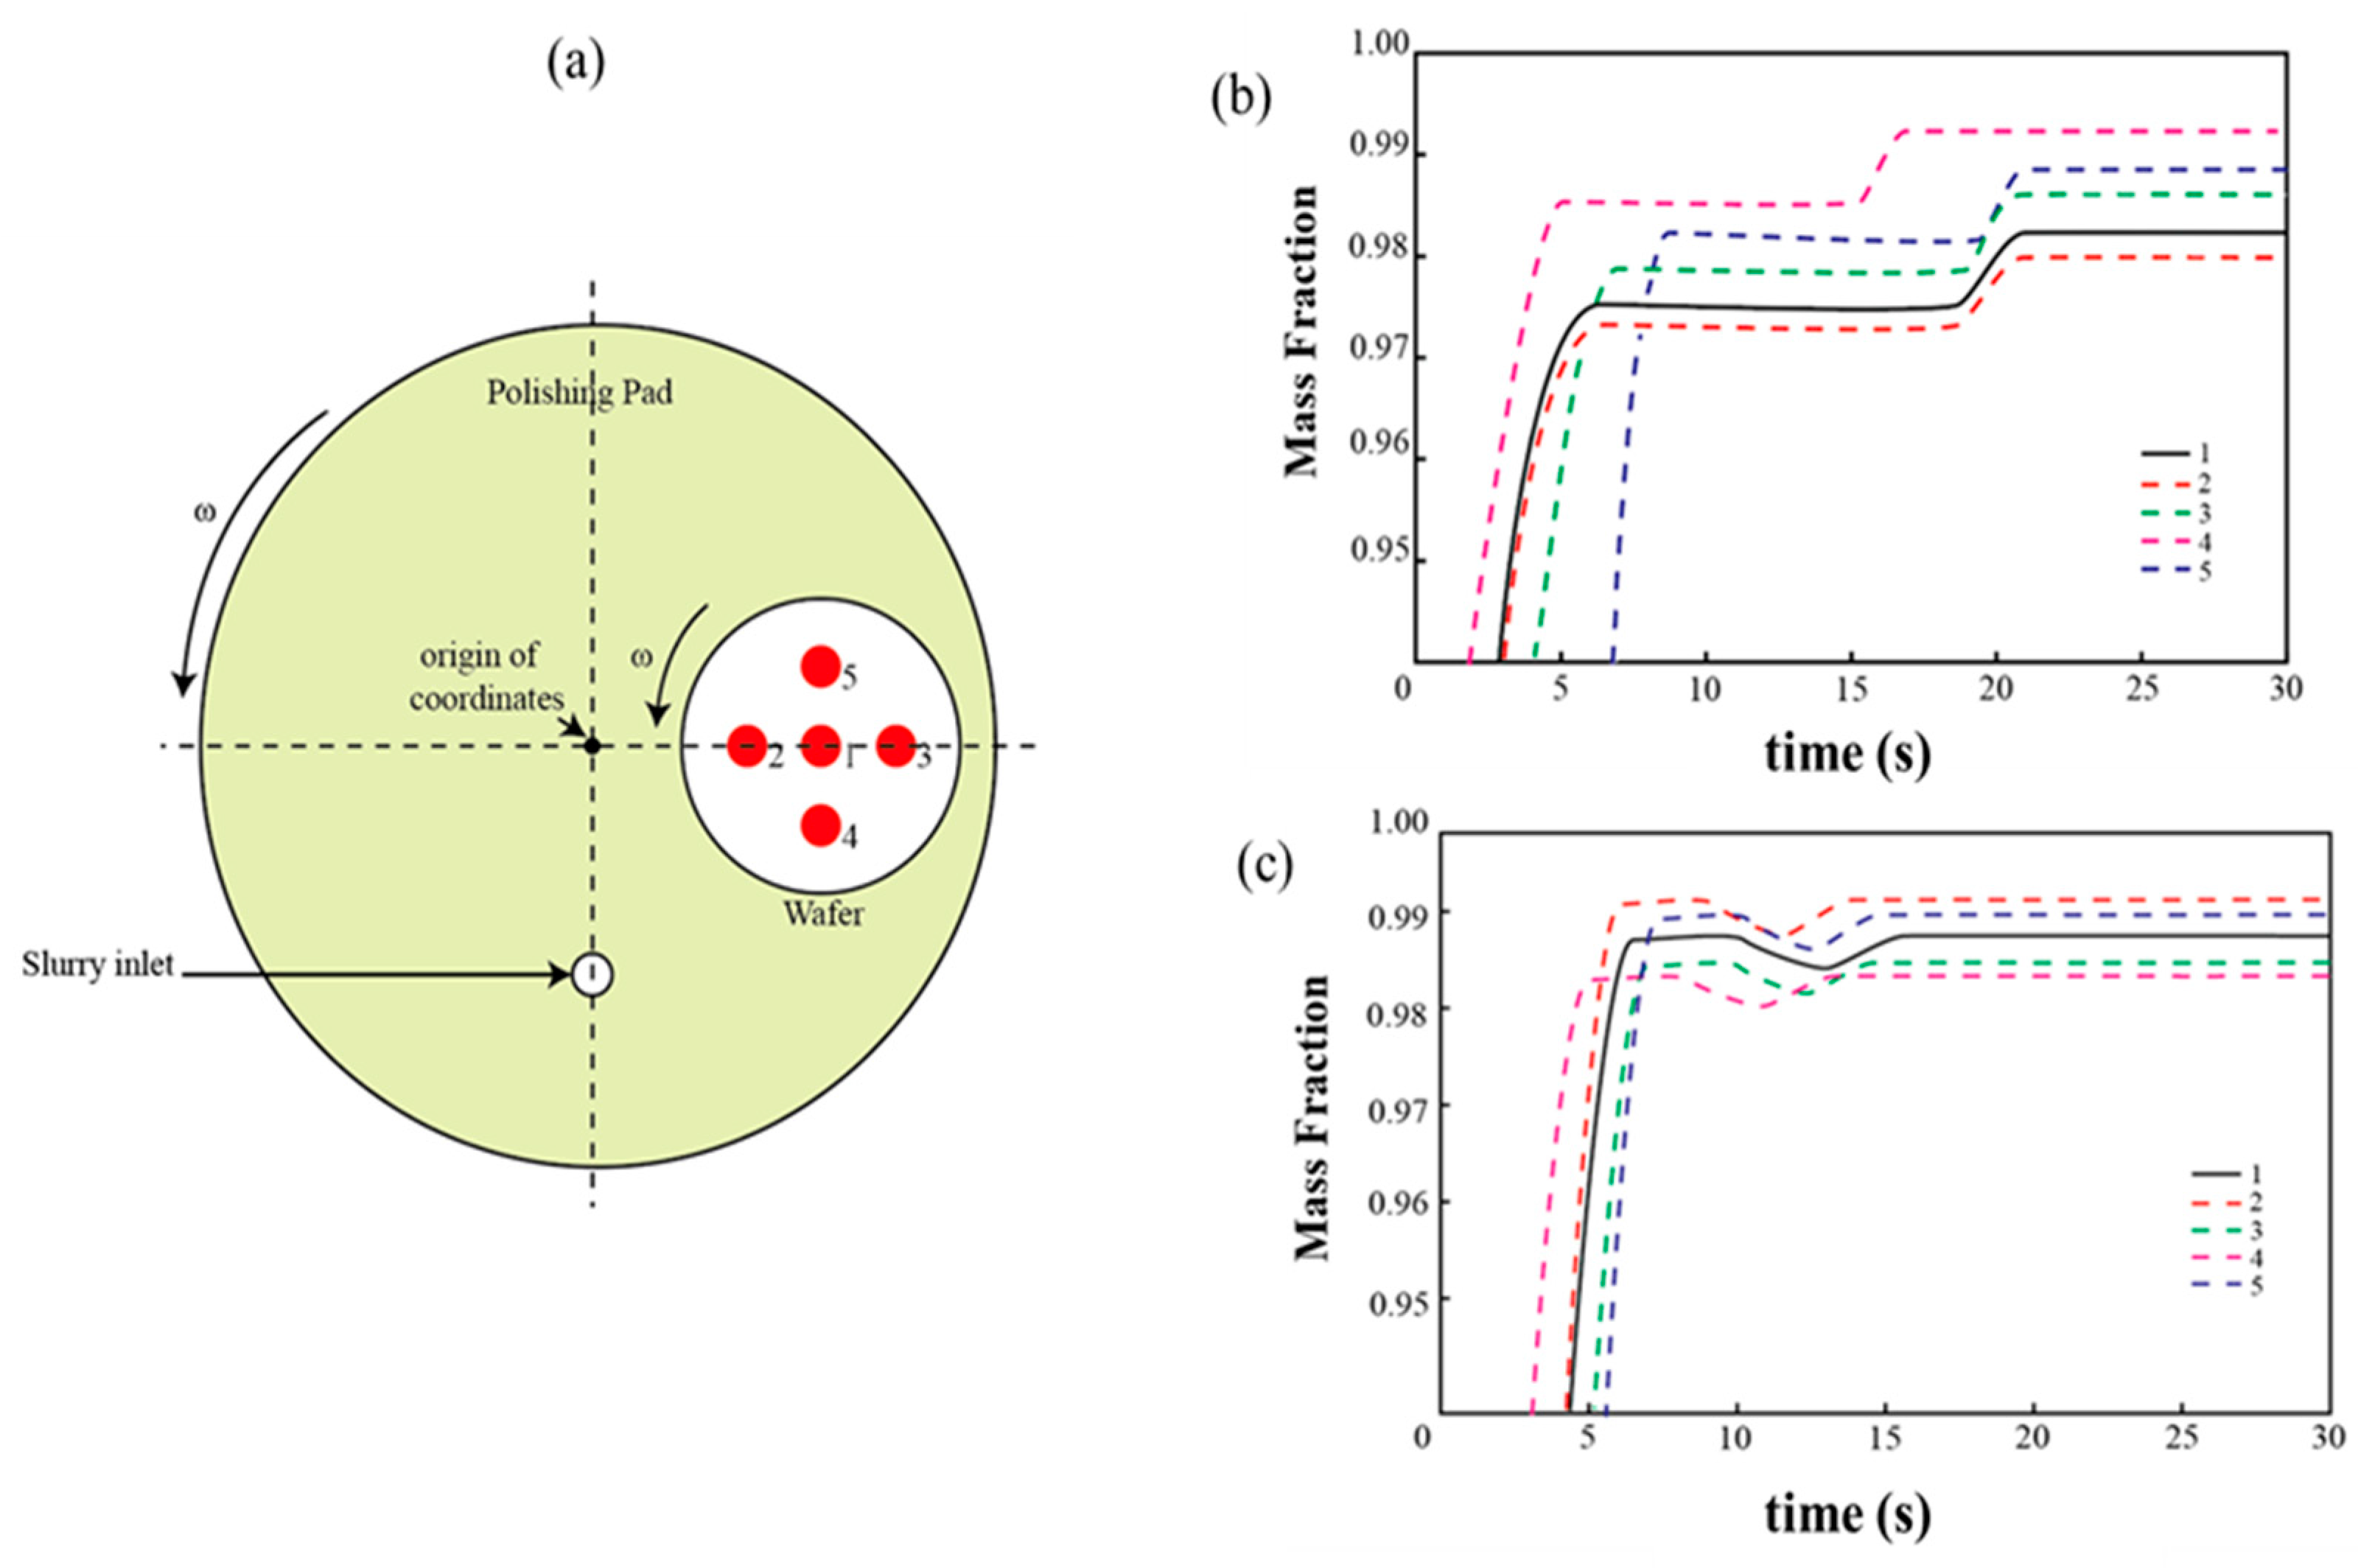
Mass Fraction of Slurry
3.4. Removal Rate and Non-Uniformity
4. Conclusions
Supplementary Materials
Author Contributions
Funding
Data Availability Statement
Conflicts of Interest
References
- Zantye, P.B.; Kumar, A.; Sikder, A.K. Chemical Mechanical Planarization for Microelectronics Applications. Mater. Sci. Eng. R Rep. 2004, 45, 89–220. [Google Scholar] [CrossRef]
- Liu, P.; Kang, C.; Oh, S.; Jeon, S.; Lee, H. Investigating the Impact of Pad Groove Depth Reduction on Process Variation in Oxide Chemical Mechanical Polishing. ECS J. Solid State Sci. Technol. 2024, 13, 104006. [Google Scholar] [CrossRef]
- McGrath, J.; Davis, C. Polishing Pad Surface Characterisation in Chemical Mechanical Planarisation. J. Mater. Process. Technol. 2004, 153–154, 666–673. [Google Scholar] [CrossRef]
- Ein-Eli, Y.; Starosvetsky, D. Review on Copper Chemical-Mechanical Polishing (CMP) and Post-CMP Cleaning in Ultra Large System Integrated (ULSI)-An Electrochemical Perspective. Electrochim. Acta 2007, 52, 1825–1838. [Google Scholar] [CrossRef]
- Terrell, E.J.; Fred Higgs, C. Hydrodynamics of Slurry Flow in Chemical Mechanical Polishing. J. Electrochem. Soc. 2006, 153, K15. [Google Scholar] [CrossRef]
- Krishnan, M.; Nalaskowski, J.W.; Cook, L.M. Chemical Mechanical Planarization: Slurry Chemistry, Materials, and Mechanisms. Chem. Rev. 2010, 110, 178–204. [Google Scholar] [CrossRef] [PubMed]
- Nguyen, V.T.; Wait, J.; Nishi, T.; Hamada, S.; Himaya, H.; Seo, J. Systematic Root Cause Analysis of Ceria-Induced Defects during Chemical Mechanical Planarization and Cleaning. J. Manuf. Process. 2024, 127, 27–34. [Google Scholar] [CrossRef]
- Zhong, Z.W. Recent Advances in Polishing of Advanced Materials. Mater. Manuf. Process. 2008, 23, 449–456. [Google Scholar] [CrossRef]
- Xie, W.; Zhang, Z.; Wang, L.; Cui, X.; Yu, S.; Su, H.; Wang, S. Chemical Mechanical Polishing of Silicon Wafers Using Developed Uniformly Dispersed Colloidal Silica in Slurry. J. Manuf. Process. 2023, 90, 196–203. [Google Scholar] [CrossRef]
- Levert, J.A.; Korach, C.S. CMP Friction as a Function of Slurry Silica Nanoparticle Concentration and Diameter. Tribol. Trans. 2009, 52, 256–261. [Google Scholar] [CrossRef]
- Thakurta, D.G.; Borst, C.L.; Schwendeman, D.W.; Gutmann, R.J.; Gill, W.N. Three-Dimensional Chemical Mechanical Planarization Slurry Flow Model Based on Lubrication Theory. J. Electrochem. Soc. 2001, 148, G207. [Google Scholar] [CrossRef]
- Zhang, Z.; Yin, T.A. Coupled CFD–DEM Simulation of Slurry Infiltration and Filter Cake Formation during Slurry Shield Tunneling. Infrastructures 2018, 3, 15. [Google Scholar] [CrossRef]
- Huo, Y.; Golchin, M.; Zhou, K.; Abraham, A.; Sontti, S.G.; Zhang, X. Effects of Coal Particles on Microbubble-Enhanced Bitumen Separation in the Concentrated Slurry Flow of Oil Sands Tailings. Ind. Eng. Chem. Res. 2024, 63, 10027–10040. [Google Scholar] [CrossRef]
- Remsen, E.E.; Anjur, S.; Boldridge, D.; Kamiti, M.; Li, S.; Johns, T.; Dowell, C.; Kasthurirangan, J.; Feeney, P. Analysis of Large Particle Count in Fumed Silica Slurries and Its Correlation with Scratch Defects Generated by CMP. J. Electrochem. Soc. 2006, 153, G453. [Google Scholar] [CrossRef]
- Phatak, U.; Bukkapatnam, S.; Kong, Z.; Komanduri, R. Sensor-Based Modeling of Slurry Chemistry Effects on the Material Removal Rate (MRR) in Copper-CMP Process. Int. J. Mach. Tools Manuf. 2009, 49, 171–181. [Google Scholar] [CrossRef]
- Li, J.; Huang, J.; Hua, C.; Wang, J.; Zhu, Y.; Zuo, D. Design of Surface Grooves on a Polishing Pad Based on Slurry Uniform Flow. Int. J. Adv. Manuf. Technol. 2019, 103, 4795–4803. [Google Scholar] [CrossRef]
- Yin, T.; Doi, T.; Kurokawa, S.; Ohnishi, O.; Yamazaki, T.; Wang, Z.; Tan, Z. The Effects of Strong Oxidizing Slurry and Processing Atmosphere on Double-Sided CMP of SiC Wafer. Adv. Mater. Res. 2012, 591–593, 1131–1134. [Google Scholar] [CrossRef]
- Li, M.; Song, F.; Huang, Z. Control Strategy of Machining Efficiency and Accuracy in Weak-Chemical-Coordinated-Thickening Polishing (WCCTP) Process on Spherical Curved 9Cr18 Components. J. Manuf. Process. 2022, 74, 266–282. [Google Scholar] [CrossRef]
- Lee, H.; Kim, H.; Jeong, H. Approaches to Sustainability in Chemical Mechanical Polishing (CMP): A Review. Int. J. Precis. Eng. Manuf.—Green Technol. 2022, 9, 349–367. [Google Scholar] [CrossRef]
- Yang, S.; Li, X.; Zhao, Y.; Al-amin, M.; Grøndahl, L.; Lu, M.; Cheung, C.F.; Huang, H. MD Simulation of Chemically Enhanced Polishing of 6H-SiC in Aqueous H2O2. J. Manuf. Process. 2023, 107, 515–528. [Google Scholar] [CrossRef]
- Lee, H.S. Trends in tribology research in chemical mechanical polishing (CMP) process. J. Korean Tribol. Soc. 2018, 34, 115–122. [Google Scholar]
- Menk, G.E.; Dhandapani, S.; Garretson, C.C.; Chang, S.S.; Fung, J.G.; Tsai, S. Method for Improved CMP Pad Conditioning Performance. In Proceedings of the 2010 IEEE/SEMI Advanced Semiconductor Manufacturing Conference (ASMC), San Francisco, CA, USA, 11–13 July 2010; pp. 149–153. [Google Scholar] [CrossRef]
- Lee, H.; Lee, D.; Jeong, H. Mechanical Aspects of the Chemical Mechanical Polishing Process: A Review. Int. J. Precis. Eng. Manuf. 2016, 17, 525–536. [Google Scholar] [CrossRef]
- Zhang, X.; Meng, N.; Li, X.; Mei, X.; Yang, L.; He, Y. The Role of Ammonium Citrate and Dodecyl Pyridinium Chloride on Chemical Mechanical Polishing Relevant to SiO2 Dielectric Layer. J. Manuf. Process. 2023, 107, 333–344. [Google Scholar] [CrossRef]
- Basim, G.B.; Adler, J.J.; Mahajan, U.; Singh, R.K.; Moudgil, B.M. Effect of Particle Size of Chemical Mechanical Polishing Slurries for Enhanced Polishing with Minimal Defects. J. Electrochem. Soc. 2000, 147, 3523. [Google Scholar] [CrossRef]
- Mofakham, A.S.; Kim, H.; Cho, H.; Lee, K.; Ahmadi, G.; Seo, J. Enhancing CMP Performance of Micro-Structured Pad Patterns: CFD Simulations and Experimental Evaluations. ECS J. Solid State Sci. Technol. 2024, 13, 114006. [Google Scholar] [CrossRef]
- Zhang, Z.; Liu, J.; Hu, W.; Zhang, L.; Xie, W.; Liao, L. Chemical Mechanical Polishing for Sapphire Wafers Using a Developed Slurry. J. Manuf. Process. 2021, 62, 762–771. [Google Scholar] [CrossRef]
- Lee, H.; Lee, S. Investigation of Pad Wear in CMP with Swing-Arm Conditioning and Uniformity of Material Removal. Precis. Eng. 2017, 49, 85–91. [Google Scholar] [CrossRef]
- Zhang, K.; Niu, X.; Wang, C.; Wang, J.; Yin, D.; Wang, R. Effect of Chelating Agent and Ammonium Dodecyl Sulfate on the Interfacial Behavior of Copper CMP for GLSI. ECS J. Solid State Sci. Technol. 2018, 7, P509–P517. [Google Scholar] [CrossRef]
- Lin, K.C.; Liao, C.C. Simulation of Slurry Residence Time during Chemical-Mechanical Polishing Using 3-D Computational Fluid Dynamics. Chem. Eng. Res. Des. 2023, 191, 375–386. [Google Scholar] [CrossRef]
- Li, S.; Gaudet, G.; Nair, J. ILD CMP with Silica Abrasive Particles: Effect of Pore Size of CMP Pad on Removal Rate Profiles. ECS J. Solid State Sci. Technol. 2013, 2, 97–103. [Google Scholar] [CrossRef]
- Gu, Y.; Li, Z.; Lin, J.; Zhou, X.; Xu, Z.; Zhou, W.; Zhang, S.; Gao, Y. Enhanced Machinability of Aluminium-Based Silicon Carbide by Non-Resonant Vibration-Assisted Magnetorheological Finishing. J. Mater. Process. Technol. 2024, 324, 118223. [Google Scholar] [CrossRef]
- Guan, J.; Zhao, Y. Dual-Wafer Intergrinding Thinning by Bipolar-Discharge EDM with a Capacity-Coupled Pulse Generator Considering Large Gap Capacitance and Minimization of Discharge Energy. Results Eng. 2022, 15, 100526. [Google Scholar] [CrossRef]
- Philipossian, A.; Borucki, L.; Sampurno, Y.; Zhuang, Y. Novel Slurry Injection System for Improved Slurry Flow and Reduced Defects in CMP. Solid State Phenom. 2015, 219, 143–147. [Google Scholar] [CrossRef]
- Bott, S.; Rzehak, R.; Vasilev, B.; Kücher, P.; Bartha, J.W.A. CMP Model Including Global Distribution of Pressure. IEEE Trans. Semicond. Manuf. 2011, 24, 304–314. [Google Scholar] [CrossRef]
- Xu, Y.; Zhao, G.; Wang, Q.; Zhan, Y.; Chen, B. Study on Material Removal Mechanism of Sapphire Wafer with CeO2 Coated Diamond Composite Abrasives via Green Polishing. J. Manuf. Process. 2023, 92, 412–421. [Google Scholar] [CrossRef]
- Ma, J.; Xu, N.; Cheng, J.; Pu, Y.A. Review on the Development of Ceria for Chemical Mechanical Polishing. Powder Technol. 2024, 444, 119989. [Google Scholar] [CrossRef]
- Ghulghazaryan, R.; Wilson, J.; Abouzeid, A. FEOL CMP Modeling: Progress and Challenges. In Proceedings of the 2015 International Conference on Planarization/CMP Technology (ICPT), Chandler, AZ, USA, 30 September–2 October 2015; pp. 1–4. [Google Scholar]
- Wang, M.; Qu, N. Improving Material Removal Rate in Macro Electrolyte Jet Machining of TC4 Titanium Alloy through Back-Migrating Jet Channel. J. Manuf. Process. 2021, 71, 489–500. [Google Scholar] [CrossRef]
- Montante, G.; Moštěk, M.; Jahoda, M.; Magelli, F. CFD Simulations and Experimental Validation of Homogenisation Curves and Mixing Time in Stirred Newtonian and Pseudoplastic Liquids. Chem. Eng. Sci. 2005, 60, 2427–2437. [Google Scholar] [CrossRef]
- Samsung Electronics Develops Reusable Pads for Polishing Semiconductor Wafers. Available online: https://www.businesskorea.co.kr/news/articleView.html?idxno=71530 (accessed on 1 February 2025).
- Hong, S.; Bae, S.; Choi, S.; Liu, P.; Kim, H.; Kim, T.A. Numerical Study on Slurry Flow with CMP Pad Grooves. Microelectron. Eng. 2020, 234, 111437. [Google Scholar] [CrossRef]
- Makiuchi, Y.; Hashimoto, F.; Beaucamp, A. Model of Material Removal in Vibratory Finishing, Based on Preston’s Law and Discrete Element Method. CIRP Ann. 2019, 68, 365–368. [Google Scholar] [CrossRef]
- Mu, Y.; Zhuang, Y.; Sampurno, Y.; Wei, X.; Ashizawa, T.; Morishima, H.; Philipossian, A. Effect of Pad Groove Width on Slurry Mean Residence Time and Slurry Utilization Efficiency in CMP. Microelectron. Eng. 2016, 157, 60–63. [Google Scholar] [CrossRef]
- Rogers, C.; Coppeta, J.; Racz, L.; Philipossian, A.; Kaufman, F.B.; Bramono, D. Analysis of Flow between a Wafer and Pad during CMP Processes. J. Electron. Mater. 1998, 27, 1082–1087. [Google Scholar] [CrossRef]
- Zhou, C.; Shan, L.; Robert Hight, J.; Ng, S.H.; Danyluk, S. Fluid Pressure and Its Effects on Chemical Mechanical Polishing. Wear 2002, 253, 430–437. [Google Scholar] [CrossRef]
- Rosales-Yeomans, D.; Lee, H.; Suzuki, T.; Philipossian, A. Effect of Concentric Slanted Pad Groove Patterns on Slurry Flow during Chemical Mechanical Planarization. Thin Solid Films 2012, 520, 2224–2232. [Google Scholar] [CrossRef]
- Cho, Y.; Liu, P.; Jeon, S.; Lee, J.; Bae, S.; Hong, S.; Kim, Y.H.; Kim, T. Simulation and Experimental Investigation of the Radial Groove Effect on Slurry Flow in Oxide Chemical Mechanical Polishing. Appl. Sci. 2022, 12, 4339. [Google Scholar] [CrossRef]
- Muldowney, G.P. Modeling CMP Transport and Kinetics at the Pad Groove Scale. MRS Online Proc. Libr. 2004, 816, 531–536. [Google Scholar] [CrossRef]


| Name | Parameter | Value |
|---|---|---|
| Diameter of pad | Dp | 400 mm |
| Diameter of carrier | Dc | 150 mm |
| Diameter of wafer | Dw | 100 mm |
| Distance from pad center to wafer center | L | 100 mm |
| Distance from pad center to inlet | V | 160 mm |
| Distance between wafer and pad | h | 0.1 mm |
| Distance between carrier and pad | hc | 0.3 mm |
| Parameter | Value | Unit |
|---|---|---|
| Density of particle | 1110 | kg/m3 |
| Diameters of the particles | 20~80 | nm |
| Average Diameters of the particle | 50 | nm |
| Velocity of water flow | 100 | mL/min |
| Velocity of particle flow | 100 | mL/min |
| Mass Diffusivity | 1 × 10⁻⁹ | m2/s |
| Dynamic Viscosity | 8.9 × 10⁻⁴ | kg/m·s |
| Model | Discretization |
|---|---|
| Pressure | PRESTO |
| Solution Method | SIMPLE |
| Momentum | Second-order upwind |
| Viscous | Laminar, Realizable k = ϵ (Standard wall function) |
| Parameter | Parameter Symbol | Setting |
|---|---|---|
| Meshing Method | Multizone | |
| Fluid layer thickness | 40 µm | |
| Particle density | ρp | 1100 kg/m3 |
| Water density | ρ | 998 kg/m3 |
| Average particle diameter | dp | 50 nm |
| Slurry flow rate | 200 mL/min | |
| Pressure outlet | Atmospheric | |
| Pad rotation speed | ωp | 90 rpm |
| Head Pressure | 2 psi | |
| Wafer rotation speed | ωw | 90 rpm |
| Concentric Groove | Radial Groove | |
|---|---|---|
| Experiment [48] | 21.52 s | 15.54s |
| Simulation | 22.23 s | 16.06 s |
| Error | 3.33% | 3.35% |
Disclaimer/Publisher’s Note: The statements, opinions and data contained in all publications are solely those of the individual author(s) and contributor(s) and not of MDPI and/or the editor(s). MDPI and/or the editor(s) disclaim responsibility for any injury to people or property resulting from any ideas, methods, instructions or products referred to in the content. |
© 2025 by the authors. Licensee MDPI, Basel, Switzerland. This article is an open access article distributed under the terms and conditions of the Creative Commons Attribution (CC BY) license (https://creativecommons.org/licenses/by/4.0/).
Share and Cite
Irfan, H.M.; Lee, C.-Y.; Mazumdar, D.; Aryanfar, Y.; Wu, W. Improvement of Material Removal Rate and Within Wafer Non-Uniformity in Chemical Mechanical Polishing Using Computational Fluid Dynamic Modeling. J. Manuf. Mater. Process. 2025, 9, 95. https://doi.org/10.3390/jmmp9030095
Irfan HM, Lee C-Y, Mazumdar D, Aryanfar Y, Wu W. Improvement of Material Removal Rate and Within Wafer Non-Uniformity in Chemical Mechanical Polishing Using Computational Fluid Dynamic Modeling. Journal of Manufacturing and Materials Processing. 2025; 9(3):95. https://doi.org/10.3390/jmmp9030095
Chicago/Turabian StyleIrfan, Hafiz M., Cheng-Yu Lee, Debayan Mazumdar, Yashar Aryanfar, and Wei Wu. 2025. "Improvement of Material Removal Rate and Within Wafer Non-Uniformity in Chemical Mechanical Polishing Using Computational Fluid Dynamic Modeling" Journal of Manufacturing and Materials Processing 9, no. 3: 95. https://doi.org/10.3390/jmmp9030095
APA StyleIrfan, H. M., Lee, C.-Y., Mazumdar, D., Aryanfar, Y., & Wu, W. (2025). Improvement of Material Removal Rate and Within Wafer Non-Uniformity in Chemical Mechanical Polishing Using Computational Fluid Dynamic Modeling. Journal of Manufacturing and Materials Processing, 9(3), 95. https://doi.org/10.3390/jmmp9030095