Article

Influence of Interlayer Temperature and Deposition Method on the Wall Geometry and Vickers Microhardness Profile of ER70S-6 Parts Manufactured by Additive Manufacturing Using CMT

by
André Luis Silva da Costa
1,
Raphael Lima de Paiva
2,
Déborah de Oliveira
1,* and
Maksym Ziberov
1
1
School of Mechanical Engineering, University of Brasilia, Brasilia 70910-900, DF, Brazil
2
School of Mechanical Engineering, Federal University of Piauí, Teresina 64049-550, PI, Brazil
*
Author to whom correspondence should be addressed.
J. Manuf. Mater. Process. 2025, 9(3), 93; https://doi.org/10.3390/jmmp9030093
Submission received: 20 February 2025 / Revised: 7 March 2025 / Accepted: 13 March 2025 / Published: 14 March 2025

Abstract

Wire and arc additive manufacturing (WAAM) stands out from other deposition techniques for being able to produce bigger parts and with higher deposition rates. However, due to the high thermal input, it is necessary to carefully select the deposition strategy and parameters to achieve good geometry, low defects and adequate mechanical properties. As a recent technology, different studies have been developed comprehending the deposition approach, aiming to achieve parts with specific characteristics, usually evaluating the geometry, microstructure and mechanical properties, such as yield and tensile strengths, residual stresses and microhardness; however, the last is usually presented by mean values, requiring more details to comprehend its behavior further. In this sense, this work aims to evaluate the microhardness variation on walls of ER70S-6 deposited by WAAM-CMT in detail, with different deposition strategies, unidirectional and bidirectional, and with and without interlayer temperature control. The wall’s geometry was also assessed in terms of height and width. The results showed that both bidirectional deposition and temperature control contributed to improving the wall’s geometry. Combining methods led to a 26% increase in the wall width and 9% in the height; combining both methods also led to a more homogeneous distribution of microhardness throughout the wall with less than 15 HV variation. For all the deposition strategies, the wall region influenced the microhardness, and relatively higher values were obtained on the upper region of the wall, followed by the central and lower regions.

1. Introduction

Additive Manufacturing (AM) originated in the 1980s when rapid prototyping was introduced as a technique for developing 3D prototypes using computer-aided design (CAD) software [1]. In recent years, the need to manufacture customizable components with geometric complexity has intensified, making them difficult to manufacture using traditional methodologies. In this context, AM has emerged as a promising solution, as it can produce complex geometries more easily with a wide range of materials [2]. This manufacturing method, based on the successive addition of layers of material, has gained prominence in Industry 4.0 due to the benefits it offers, including time and material savings, rapid prototyping, high efficiency and decentralized production methods [3].
The application of AM is vast and spans sectors such as the aerospace, automotive and medical sectors, where customization capabilities and localized production are particularly valued. A notable example of an application was the production of a fuel tank for the Terran One rocket using 3D printing with a variation of directed energy deposition (DED) [4]. Wire and Arc Additive Manufacturing (WAAM) is a specific technique within AM that uses an electric arc as an energy source to melt the deposition material, depositing layer upon layer in the form of a bead [5]. Once this process is based on electric arcs, the heat input plays a major role in the result; therefore, it is important to comprehend the thermal history of the part to achieve the desired microstructure, which can be made by controlling the deposition parameters, material composition and heat treatments [6]. However, if the parameters are not properly selected, this process can lead to the formation of defects in manufactured components, which can compromise their integrity and, consequently, their applicability in sectors that require cyclical efforts and durability [7], reducing their fatigue life and mechanical resistance [8] and leading to the need of hybrid methods [9] or different post processing techniques [10].
In this sense, studies have been developed in order to verify the WAAM’s ability to achieve a part with similar capabilities to a conventional part such as one manufactured by a foundry or through forging. With respect to corrosion resistance, Ron et al. [11] compared an ER70S-6 part manufactured by WAAM with a wrought steel alloy (ST-37). The authors performed a 90-day corrosion evaluation in 3.5% NaCl solution, and they pointed out that the removal of the corrosion products was carried out using a NaOH solution with Zn chips for 30 min at 80 °C. The corrosion rate of both materials remained similar, with no statistically significant variation, and values were within the expected range. Therefore, the authors concluded that the deposition did not hinder the corrosion resistance of the part, and it would have adequate behavior in a corrosive environment.
In terms of deposition strategy, Novelino et al. [12] evaluated the effect of current, Wire Feed Speed (WFS), torch Travel Speed (TTS), deposition direction and interlayer temperature control on the wall’s quality of ER70S-6 deposited by WAAM. The authors concluded that the best configuration to achieve more regular geometry was a combination of 65 A, a wire feed speed of 2.6 m/min and a torch travel speed of 24 mm/s. Additionally, the authors observed that the natural cooling during uninterrupted deposition adversely affected walls’ quality, thereby leading to surface irregularities and lower height. Dekis et al. [13] also evaluated different TTS (120 mm/min, 150 mm/min and 180 mm/min). The authors verified that higher speed resulted in more geometric homogeneous walls with lower porosity, which was attributed to lower thermal input during the deposition process.
Aiming to attenuate defects resulting from higher thermal inputs, Soares et al. [14] applied different conditions for deposition, with temperature control on the WAAM deposition of 410NiMo, without temperature control, block interlayer temperature control and layer-by-layer temperature control, with 112 A, 11.60 V and a TTS of 3 m/min. The findings show that layer-by-layer temperature control presented better results in comparison to other deposition strategies, resulting in higher height and enhanced effective area. However, the authors pointed out that layer-by-layer temperature control is not recommended due to the excessive time required to reduce the part temperature by natural convection, thereby hindering its application. In another work, Zhai et al. [15] evaluated the interlayer temperature control on the WAAM-CMT (Cold Metal Transfer) deposition of H5 steel. The authors selected 600, 350 and 150 °C as interpass temperatures. For the highest one (600 °C), no proper deposition was observed, and the authors reported that the part collapsed due to the high input of heat. When evaluating the microstructure, the lower temperatures resulted in smaller grains once the heat enabled the grain growth.
Considering the requirement for better temperature control, Vieira et al. [16] evaluated several different deposition parameters and interlayer temperature control methods in order to enhance the quality of inclined walls of ER70S-6 deposited by WAAM. The authors pointed out that applying interlayer temperature control resulted in an increase of 71% of the wall angle when compared to continuous deposition, and a more homogeneous geometry. In this context, it is possible to notice that controlling the temperature during the process can significantly affect WAAM parts, and proper control can ensure interesting characteristics that contribute to the quality and safety of manufactured parts such as high dimensional quality and low microhardness variation.
The literature review above shows that recent works have been focused on deposition strategies in terms of temperature control and deposition direction, investigating their influence on geometric homogeneity, porosity, mechanical and corrosion resistance, and microstructure. Nevertheless, few studies investigate geometric characteristics and hardness at different regions of the manufactured part, especially considering the variation of both temperature control and deposition direction. Thus, to contribute to understanding the effect of different deposition strategies on distinct regions of the manufactured part, this work aims to investigate the influence of both interlayer temperature control and deposition direction on dimensional characteristics (height and width) and microhardness distribution of ER70S-6 walls manufactured by the Cold Metal Transfer WAAM process. The output parameters were evaluated at different regions of the wall (upper, central and lower).

2. Methodology

The deposition system used a Schneider Electric MAXR23-S42-H42-C42 Cartesian robot, programmed with G-code to follow a predefined trajectory and equipped with a torch and collision sensor, in addition to the Fronius TransPuls Synergic 5000 CMT source, which was compatible with conventional and pulsed Gas Metal Arc Welding (GMAW), and conventional CMT and Gas Tungsten Arc Welding (GTAW) processes, with the wall deposition process being carried out using the conventional GMAW-CMT. An infrared digital thermometer, KLX manufacturer, with a resolution of 0.10 °C and accuracy of ±1.50 °C was applied to monitor the interlayer temperature. The deposition material used was ER70S-6 wire with a diameter of 1.2 mm, a chemical composition of 0.07% wt of C, 0.85% wt of Si, 1.5% wt of Mn,=; the protection gas was a mixture of Ar + 18% CO2 with a flow rate ranging from 15 L/min to 20 L/min.
Figure 1a illustrates the system with the substrate in which the walls were deposited and the torch, with the use of clamps being crucial to ensure adequate stabilization of the substrate on the worktable. Figure 1b represents the complete deposition system, highlighting the robot’s Human-Machine Interface (HMI), used to input G-code and adjust torch displacement parameters, while the power source’s HMI allows adjustment of voltage, current, and other essential process parameters.

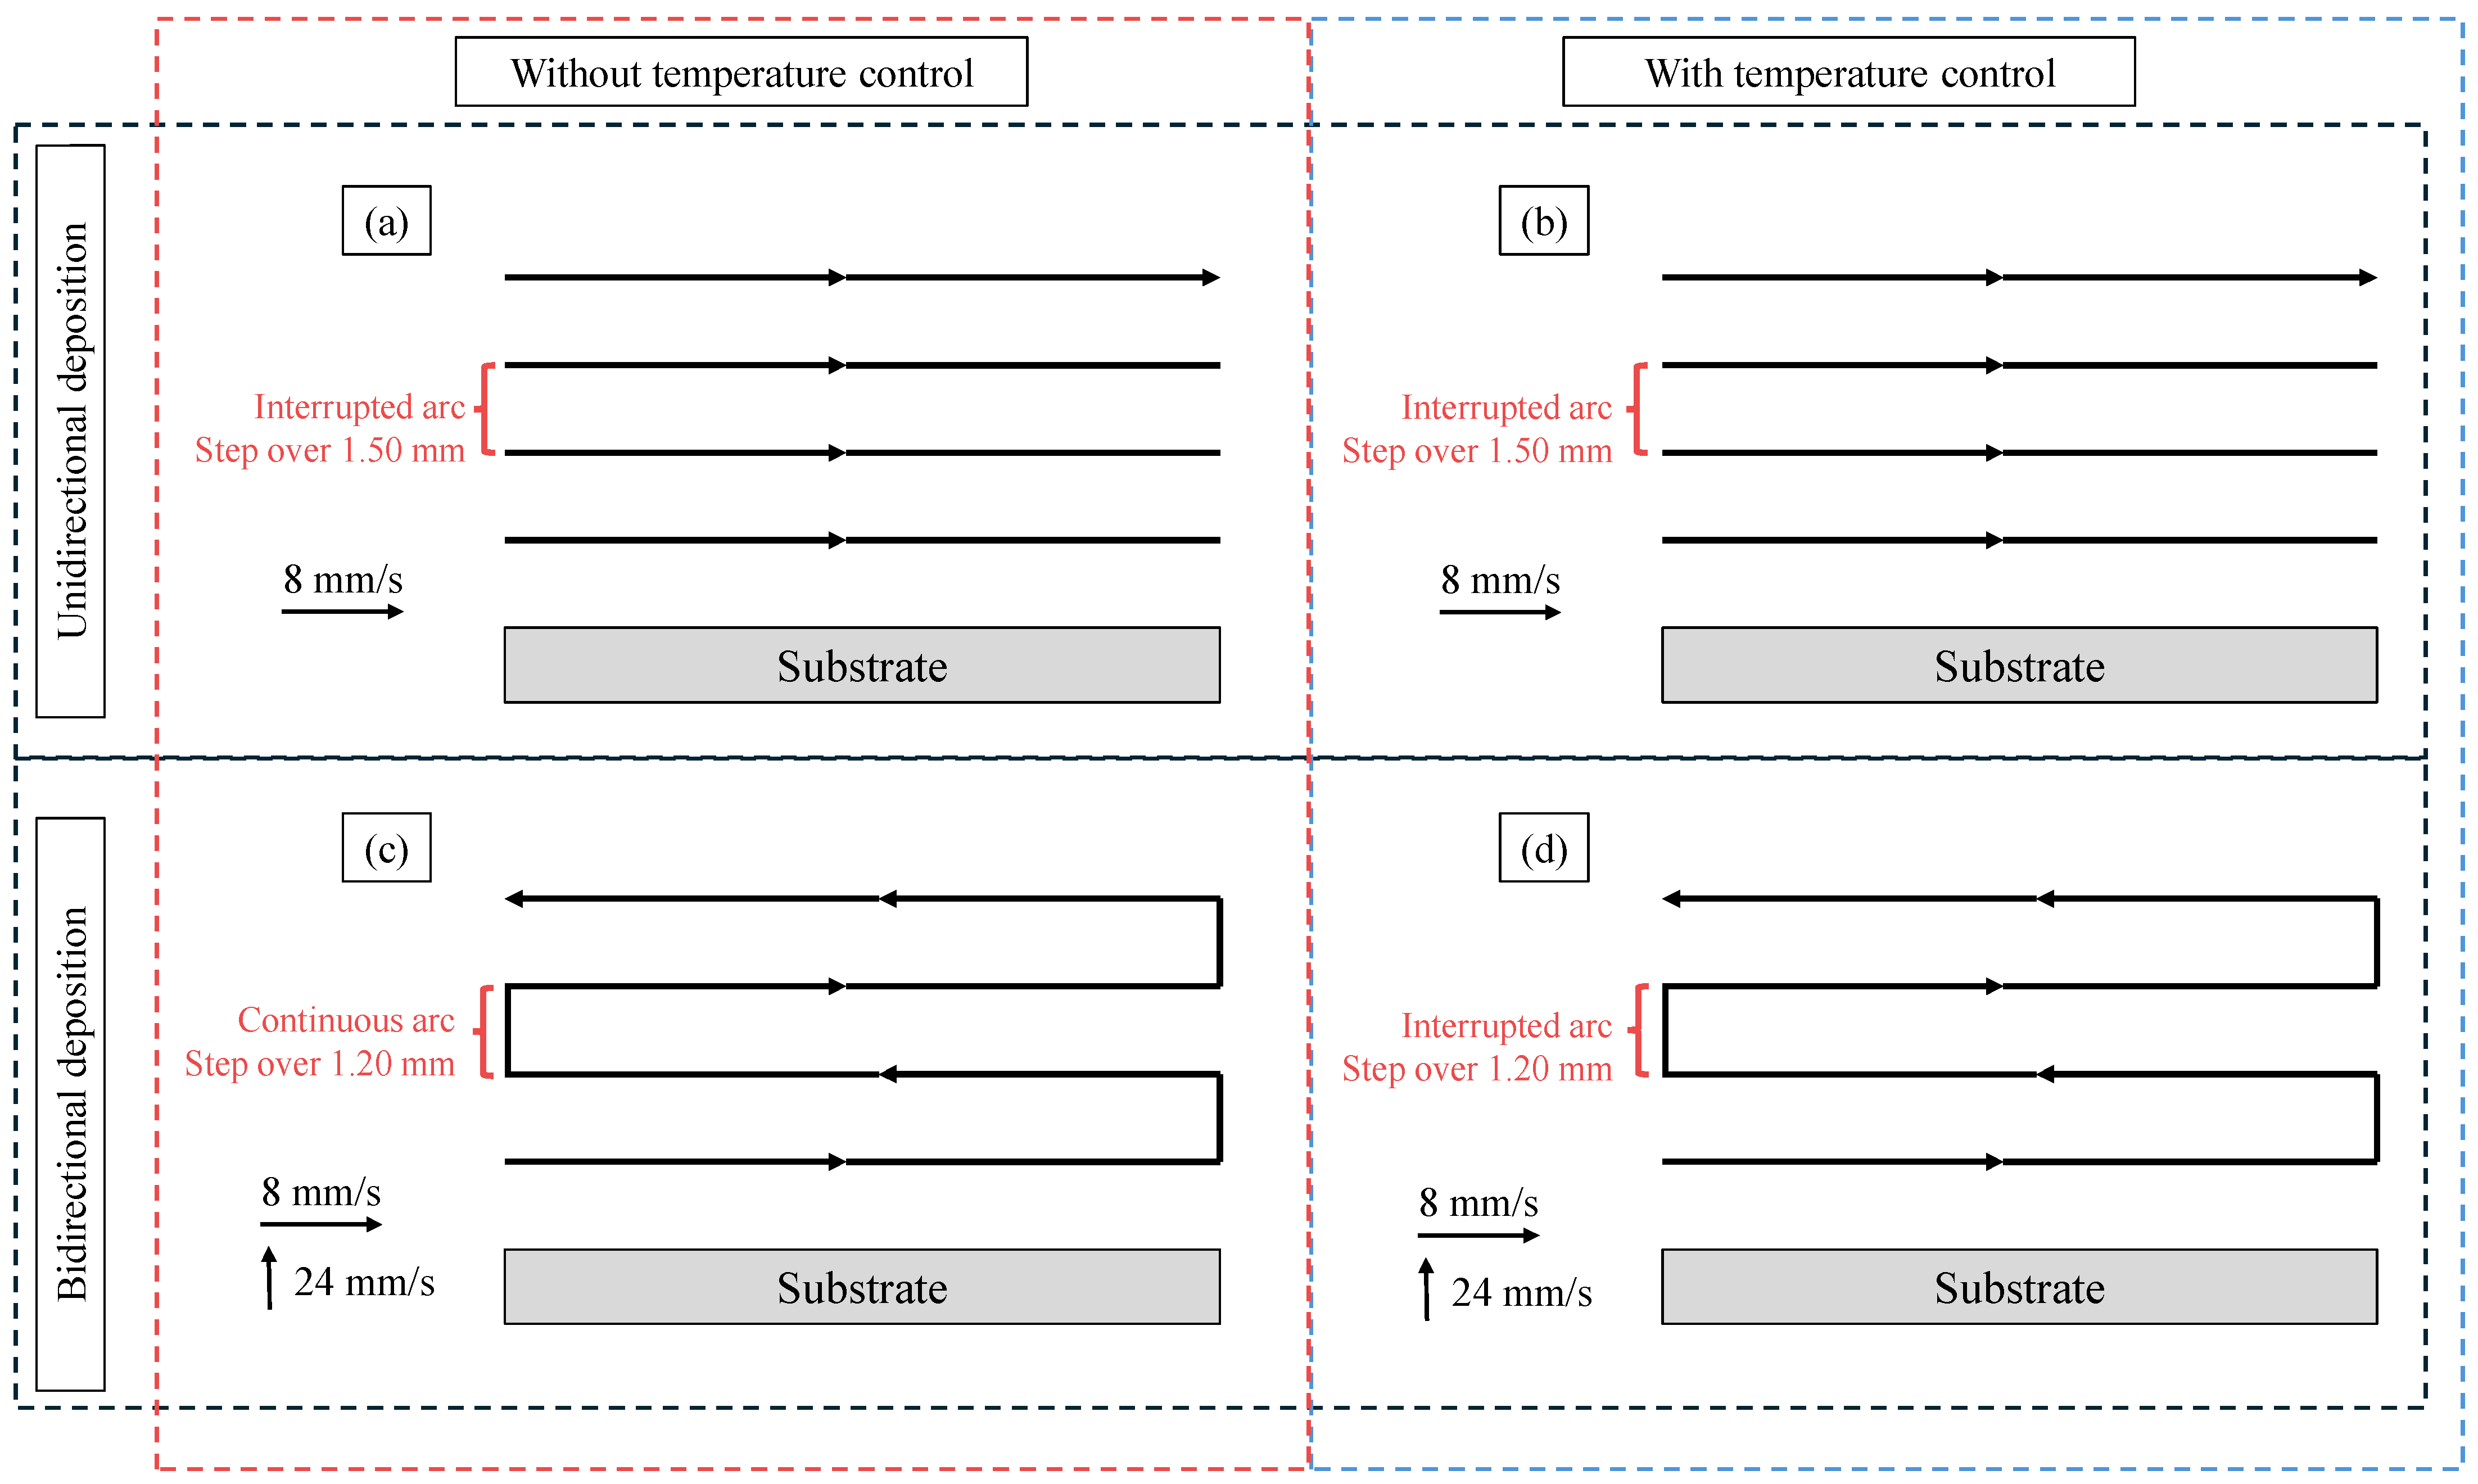
2.1. Deposition Method

After fixing the base metal, four walls with 350 mm length were deposited, varying the deposition direction and interlayer temperature control. The deposition strategies were based on the work of Soares et al. [14], who studied the WAAM-CMT deposition of 410NiMo in which the authors noticed that interlayer temperature control resulted in higher walls with a 25% increase in height when compared with no temperature control conditions. Considering that the authors evaluated the influence for 410NiMo, it is important to evaluate if a similar influence would be observed for ER70S-6, which is a low alloy steel.
Therefore, the first wall, similar to Soares et al. [14], was composed of 26 layers and used a unidirectional deposition strategy without temperature control. In the second wall, also with 26 layers, the interlayer temperature control of 60 °C was applied combined with unidirectional deposition direction. The third wall followed a bidirectional deposition strategy with 30 layers and no temperature control. Finally, aiming to improve the wall quality, the fourth wall, with 25 layers, combined the bidirectional deposition strategy with temperature control at 60 °C. Figure 2a–d illustrates the strategies adopted, the length, the pitch and the torch travel speeds (TTS) used in the different methods described for the four deposition walls mentioned above, the black arrows represent the torch path. The parameters adopted for wall deposition, according to the deposition method presented in Figure 2, are shown in Table 1. It is important to highlight that the step over and the TTS were programed into the code and that the robot possesses axis accuracy of 0.05 mm in the vertical direction and 0.1 mm in other directions.

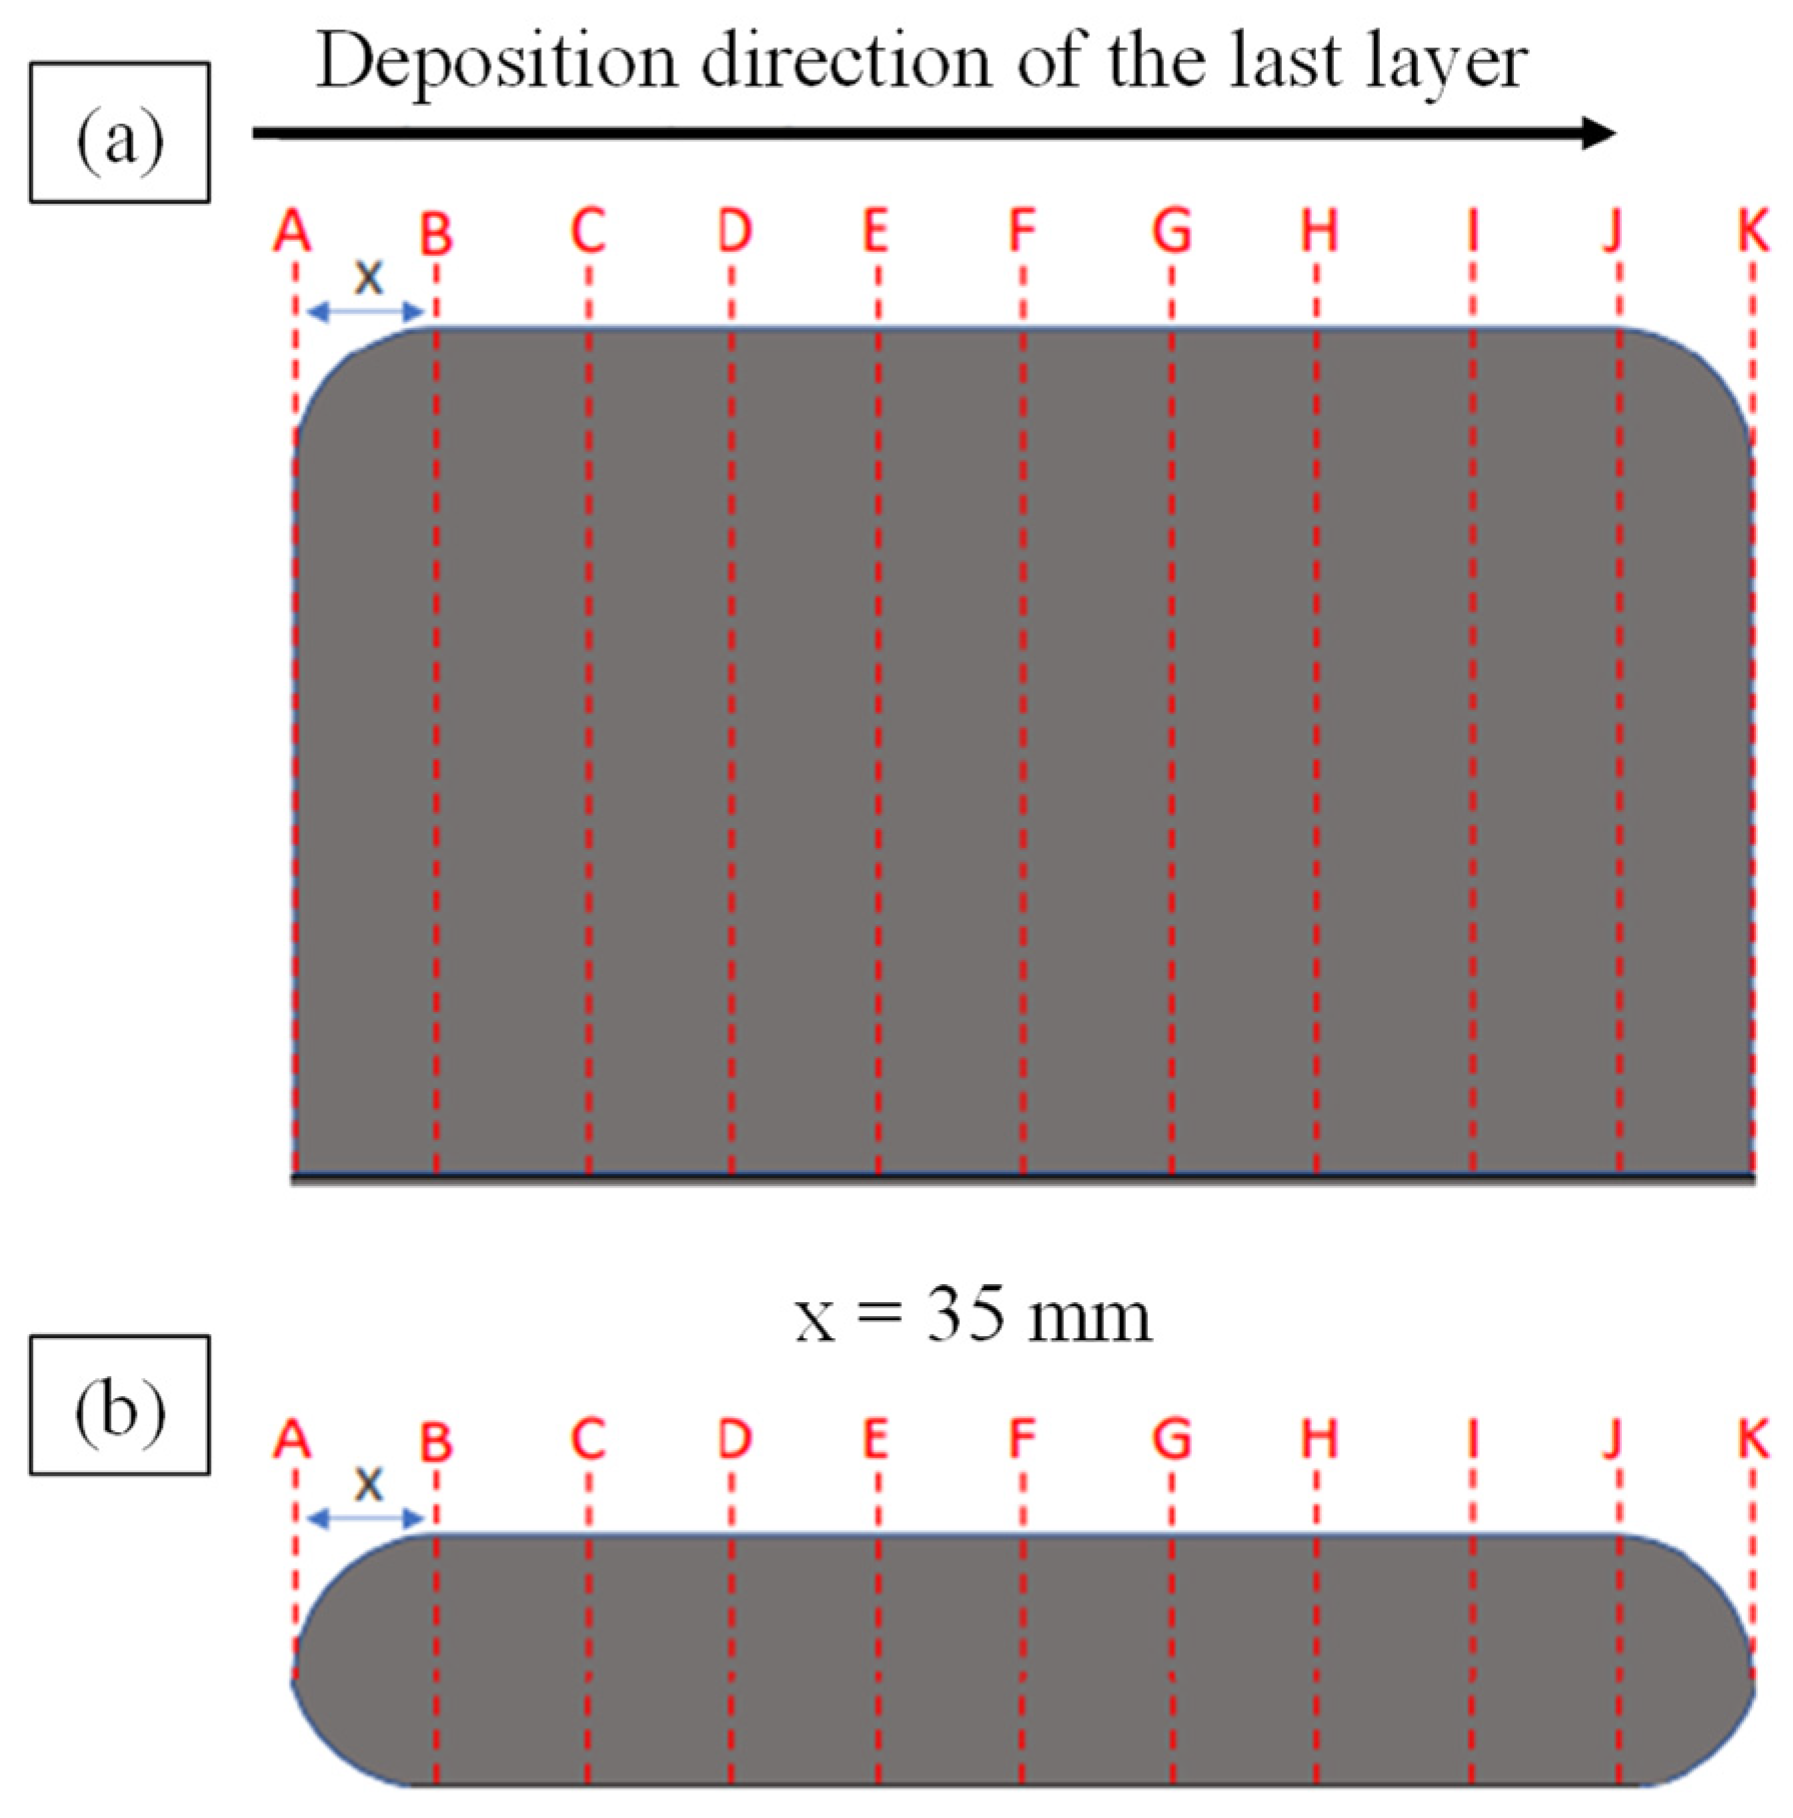
2.2. Geometric Analysis

The geometric dimensions of the walls were measured with a caliper with 0.05 mm resolution and uncertainty of ± 0.025 mm. Height and width measurements were taken every 35 mm along the 350 mm length of the walls. At each point, five measurements were made and the results were presented as mean and standard deviation, with a 99.73% confidence interval. Width measurements were made at the upper and lower regions of the walls. Figure 3 shows the measurement scheme of the walls.

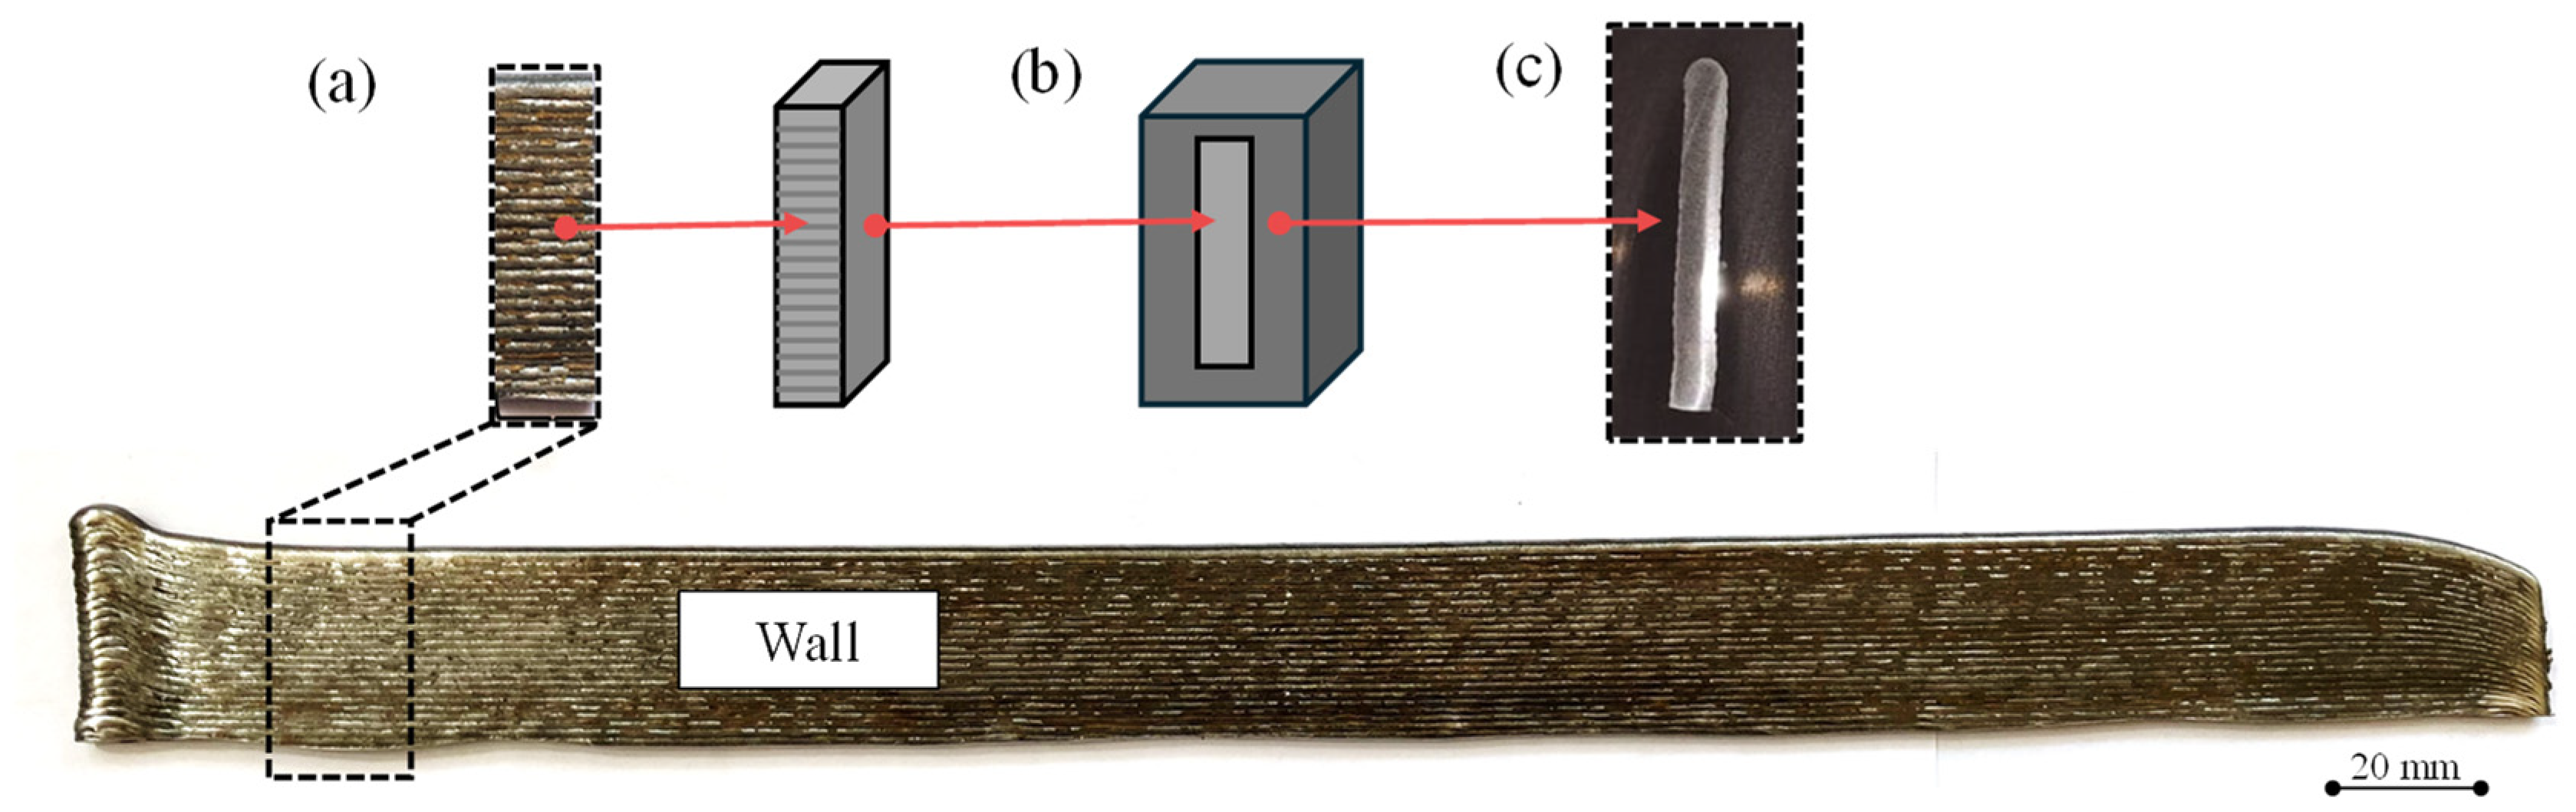
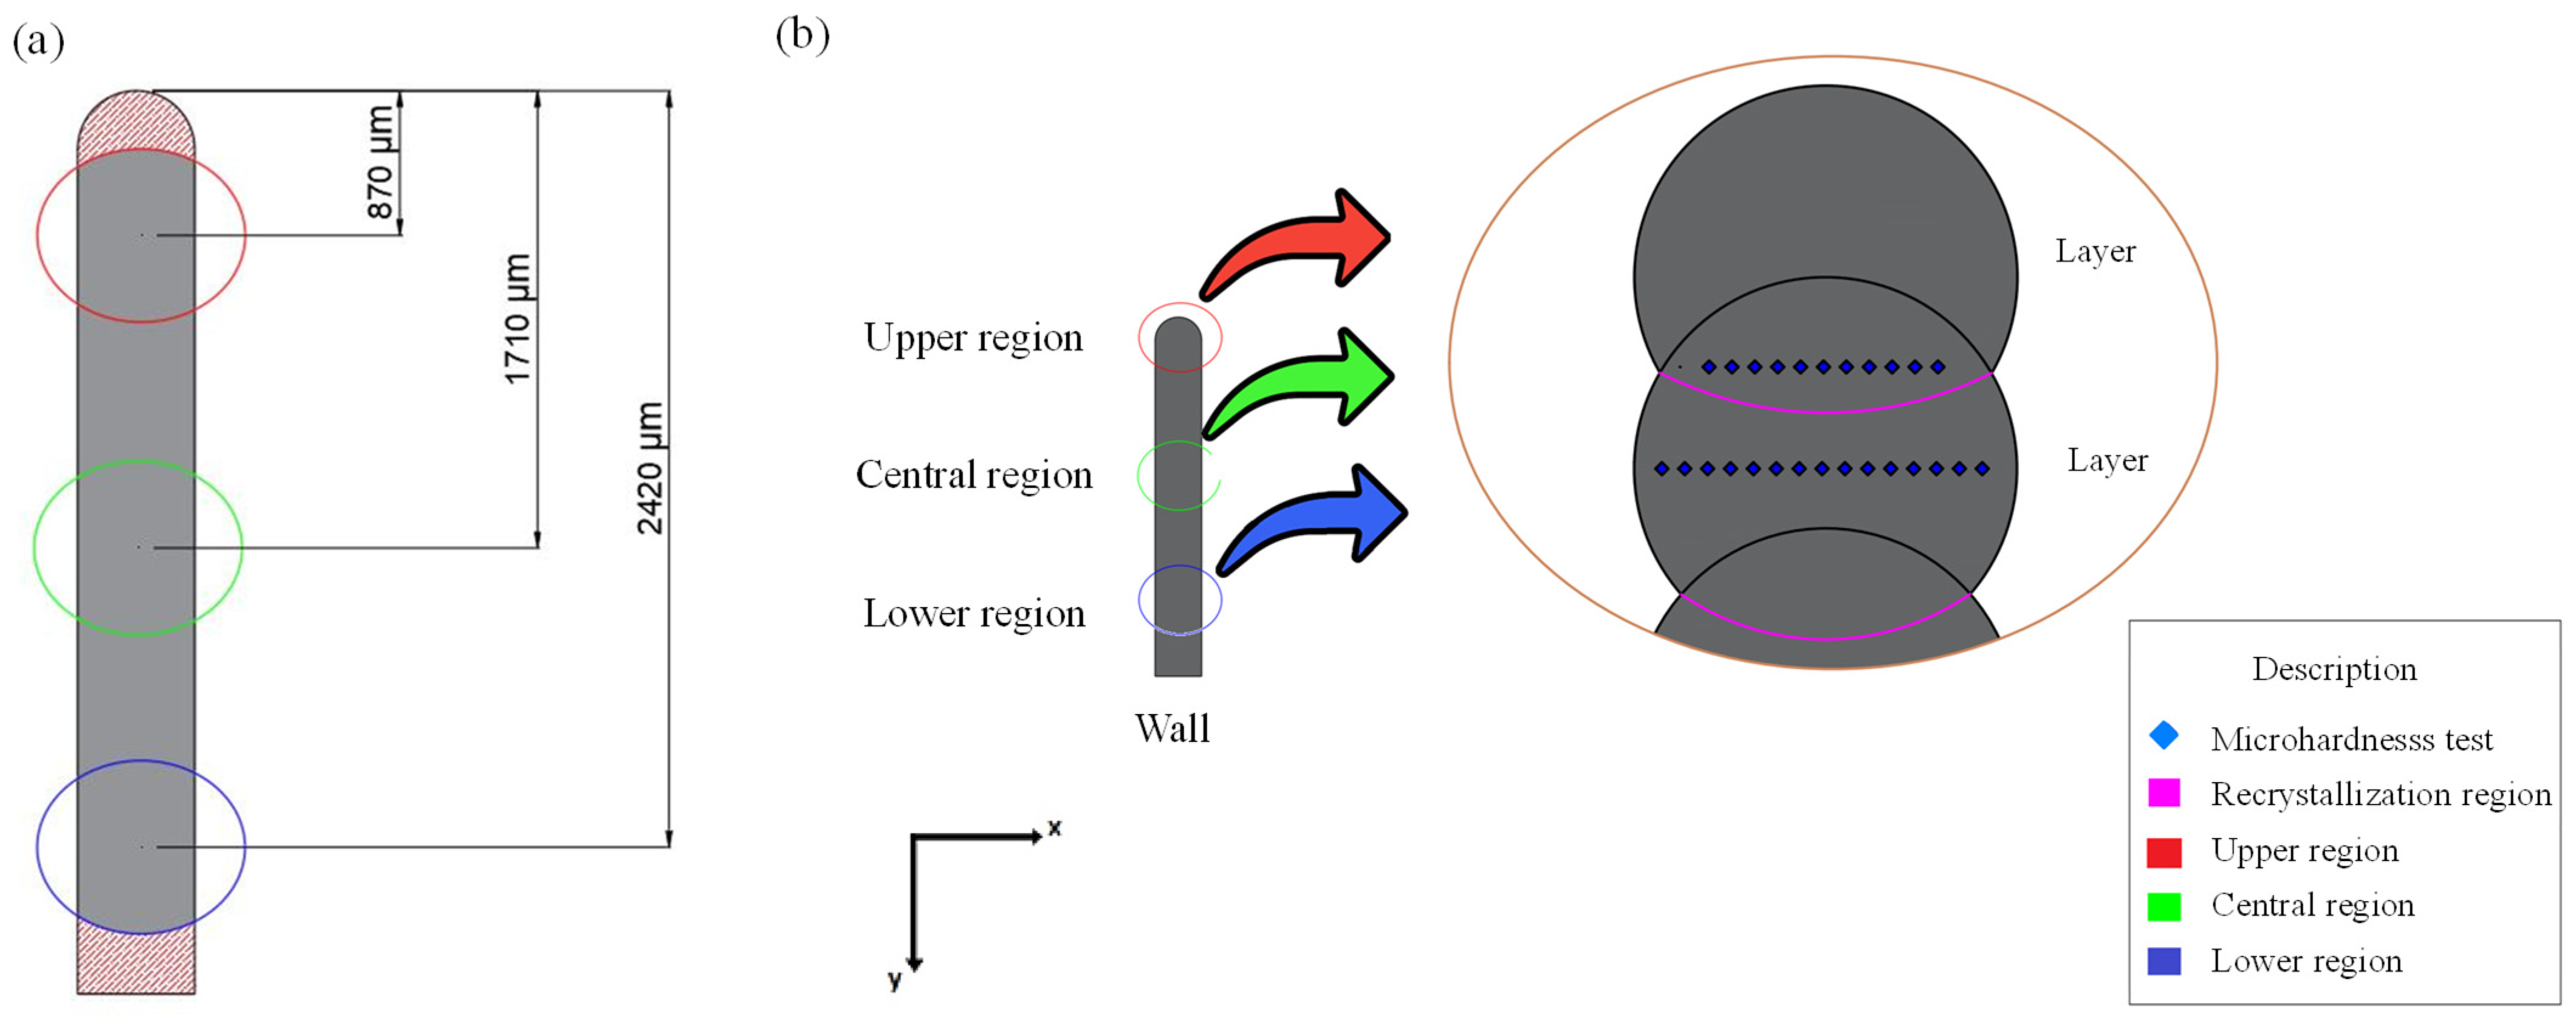
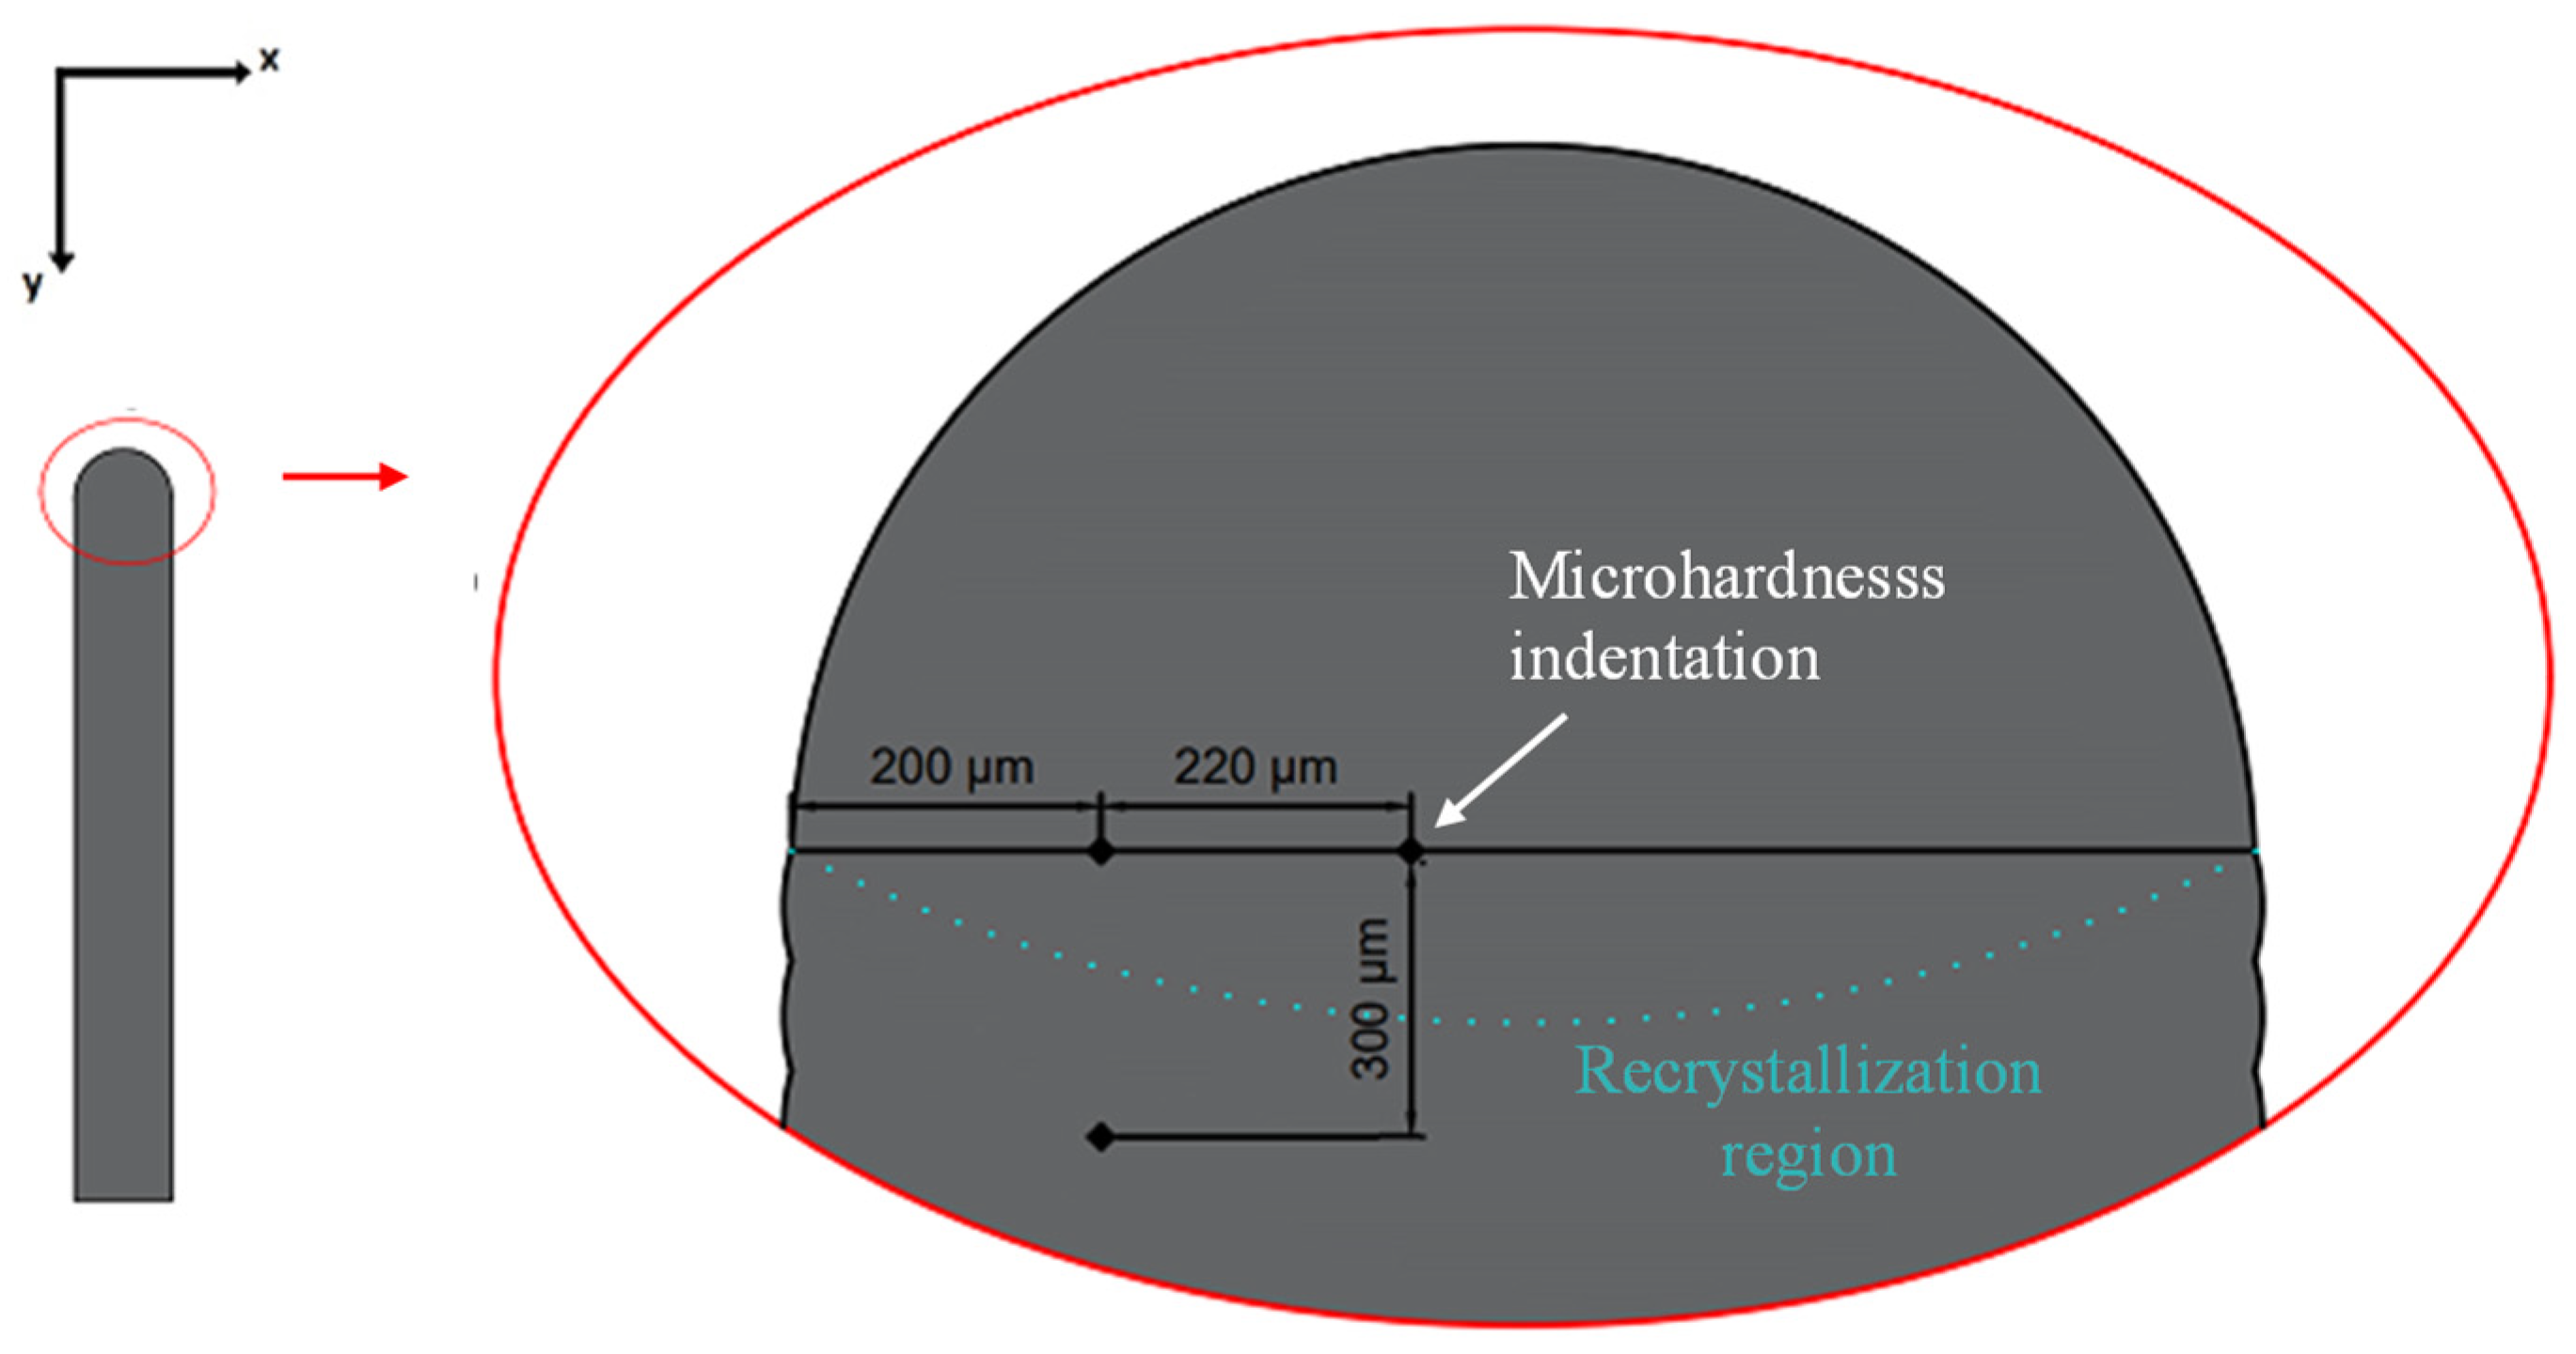
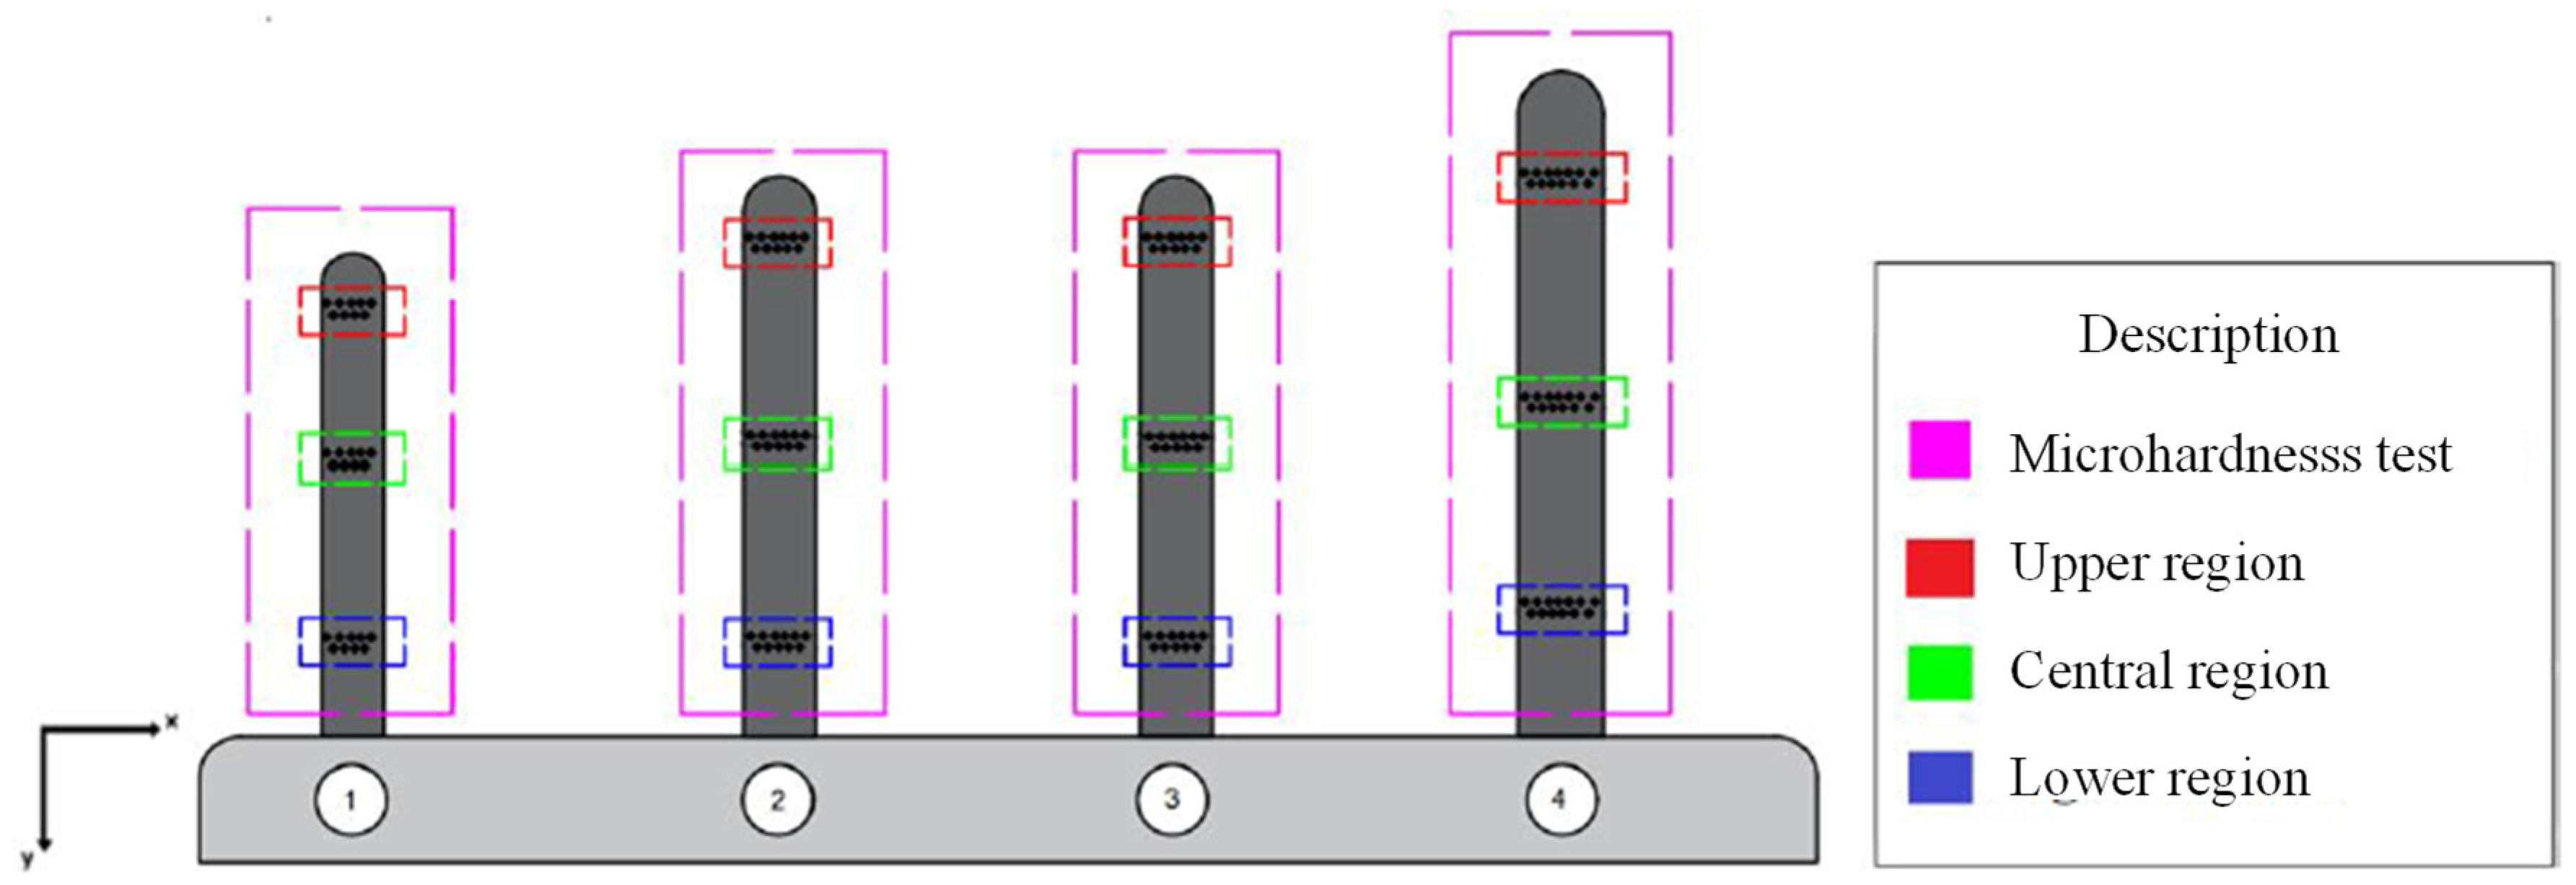
2.3. Wall Preparation and Microhardness Measurements

To extract the walls, cross-sections were made using a horizontal saw with the application of cutting fluid. The extracted walls were approximately 8 ± 0.67 mm, as shown in Figure 4a, and the temperature was monitored during cutting to avoid changes in the microstructure. For cold casting, the walls were placed in polypropylene molds with adequate spacing. Carplast polyester resin was used in a proportion of 100 mL to 4 mL of catalyst, with a curing time of 24 h. Figure 4b illustrates the demolding process. Finally, for progressive sanding, a variable speed polisher was used in conjunction with wet sandpaper, following the grain size sequence: 120, 220, 400, 600, 800 and 1200. The walls were sanded in alternating movements, clockwise and counterclockwise, for 5 min with each sandpaper, ensuring uniform grinding. The result of progressive sanding is illustrated in Figure 4c.
The Vickers microhardness test was conducted using the DuraScan equipment from EMCO TEST, using a pyramidal indenter and an angle between faces of 136°. The applied load was 0.5 kgf and lasted seven seconds. During the test, 10× and 40× magnification lenses were used to quantify microhardness. The indentation impressions on the walls were made in three distinct regions: upper, central and lower, as illustrated in Figure 5a. In each region, two sets of impressions were made, one between the layers and another in the center of the layer. This method was selected to evaluate the microhardness variation throughout the wall without measuring it at the entire surface, which would be very time-consuming. The results obtained were analyzed with confidence intervals of 68% and 99.7%, ensuring a robust and reliable evaluation of the microhardness measurements. The indentations were made by taking the top of wall 4 as a reference because this wall has the greatest height. Thus, the upper region is located 870 μm from the top, the central region is located 1710 μm from the top and the lower region is 2420 μm from the top. Figure 5b shows the positions of these regions.
The average length of the indenter diagonals was 70 μm, thus a minimum distance of 200 μm between the center of the impression and the edge of the wall was employed, and 220 μm between the centers of two adjacent impressions, as illustrated in Figure 6. The microhardness measurements at each position were also used to create a contour plot (mapping) to better visualize the microhardness variation of the wall. A cubic interpolation (cubic Hermite spline) was employed for adjacent points with the aid of the open-source Octave software.

3. Results and Discussion

Figure 7 contains a visual representation of the profiles of each deposited wall, where the numbers correspond to the walls, following the parameters of Table 1. It is important to note that the base metal contains only two walls, highlighting the distinction between the base material and the additions resulting from the deposition process. This figure provides a clearer perspective of the dimensional characteristics, such as width and height, in addition to showing variations in terms of leveling and uniformity in the deposited walls.

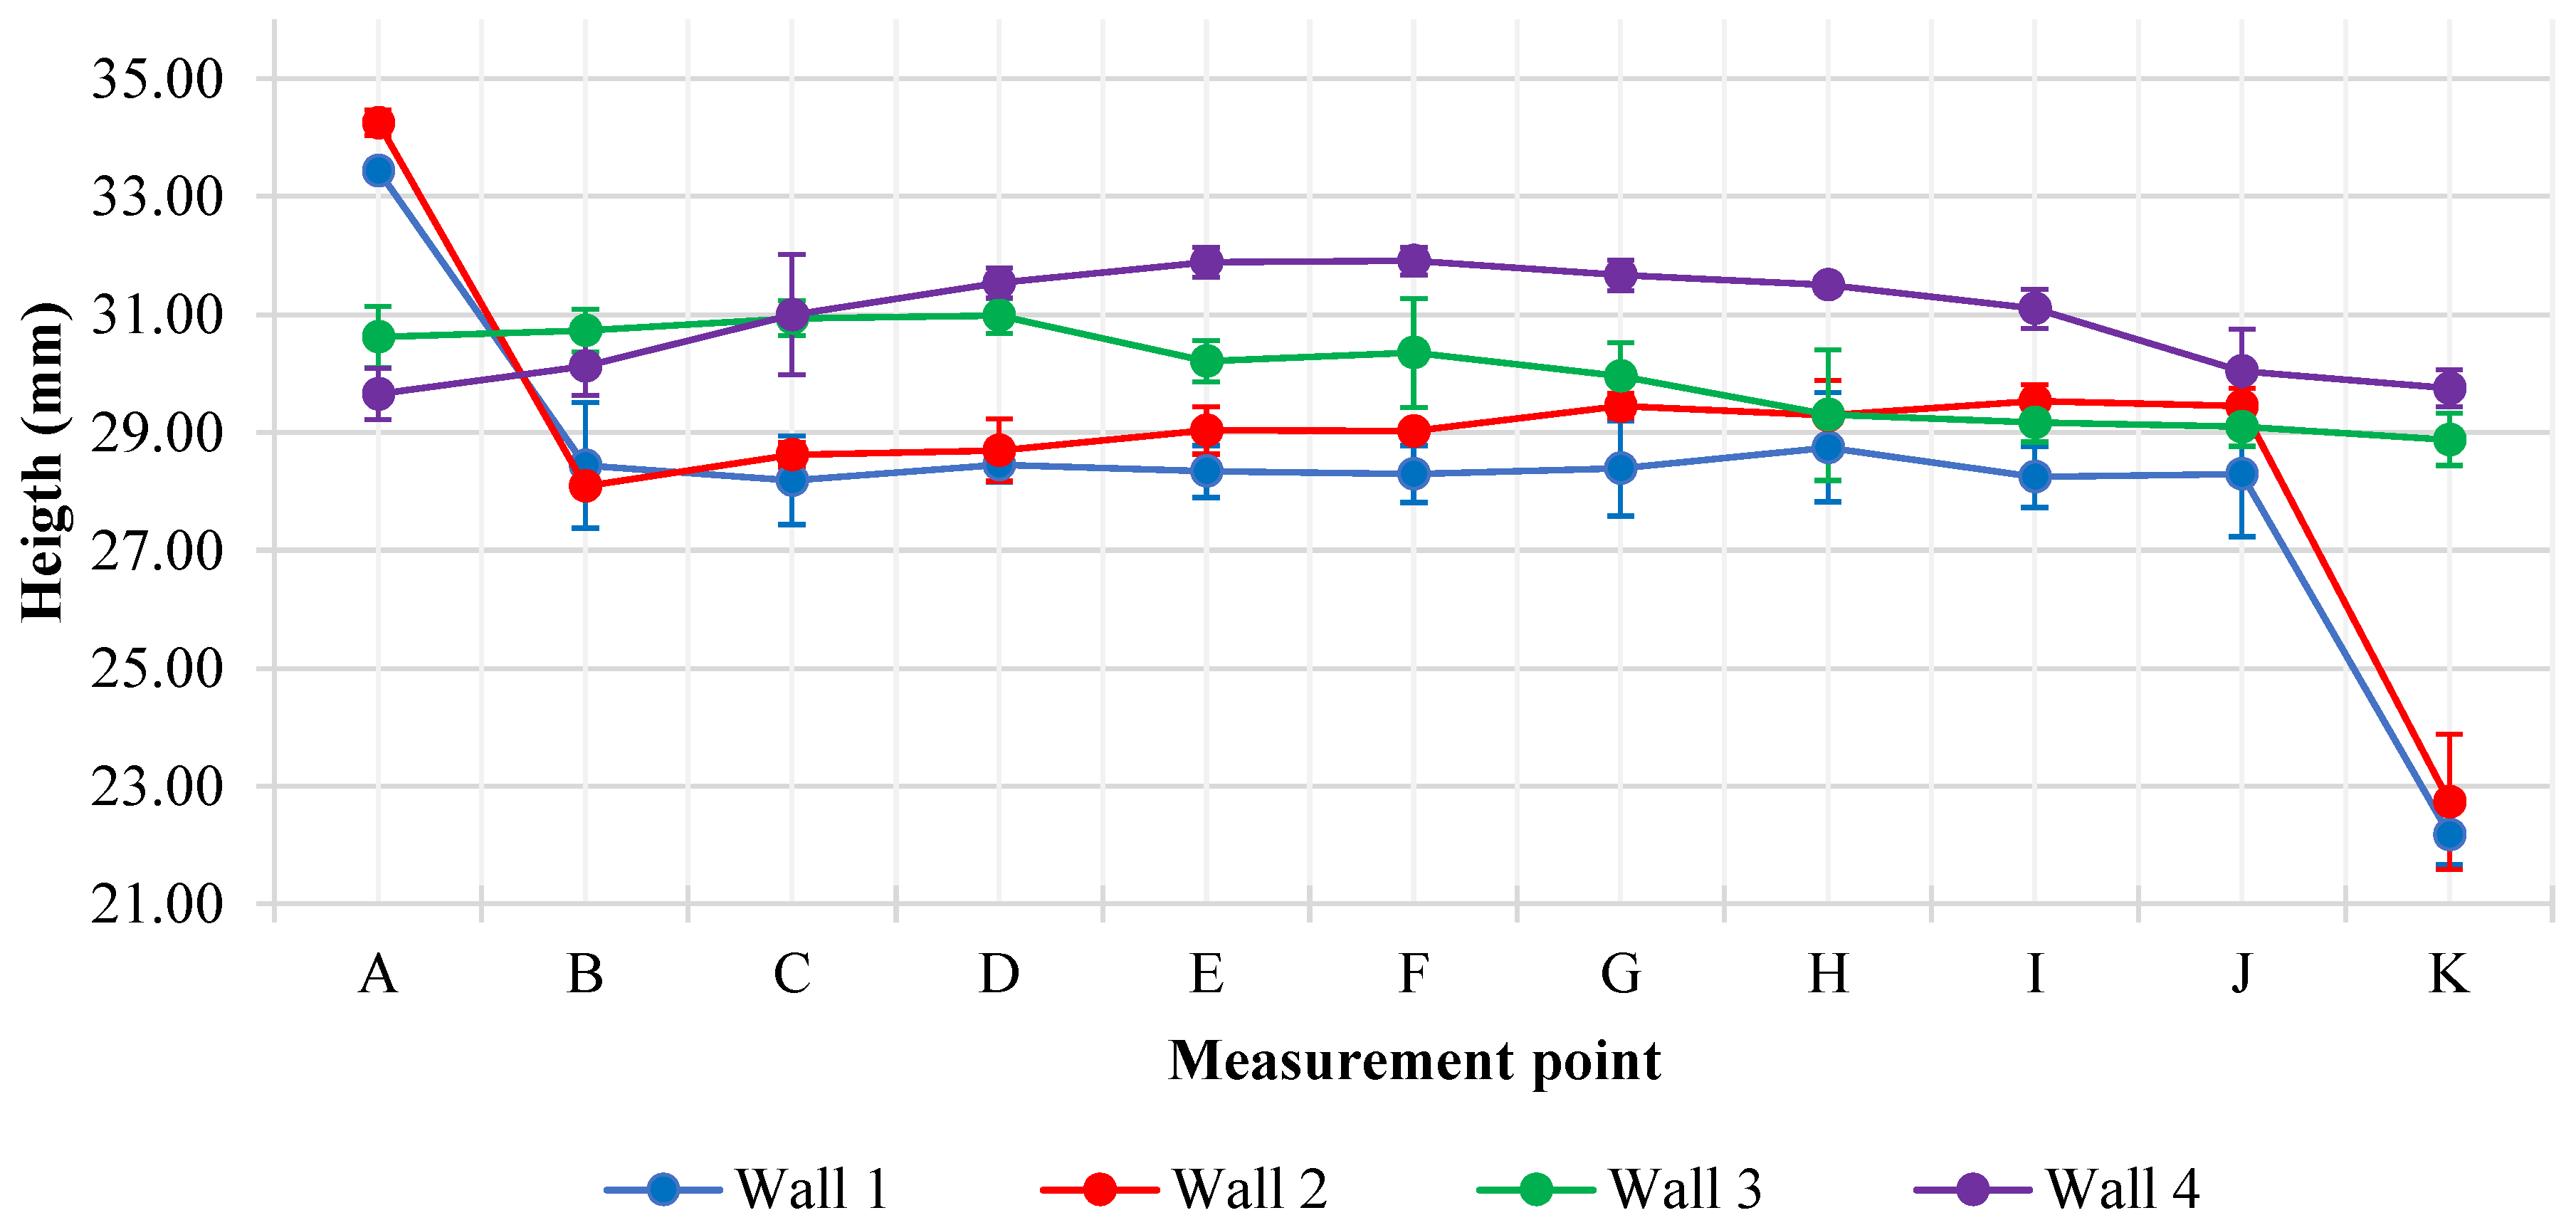
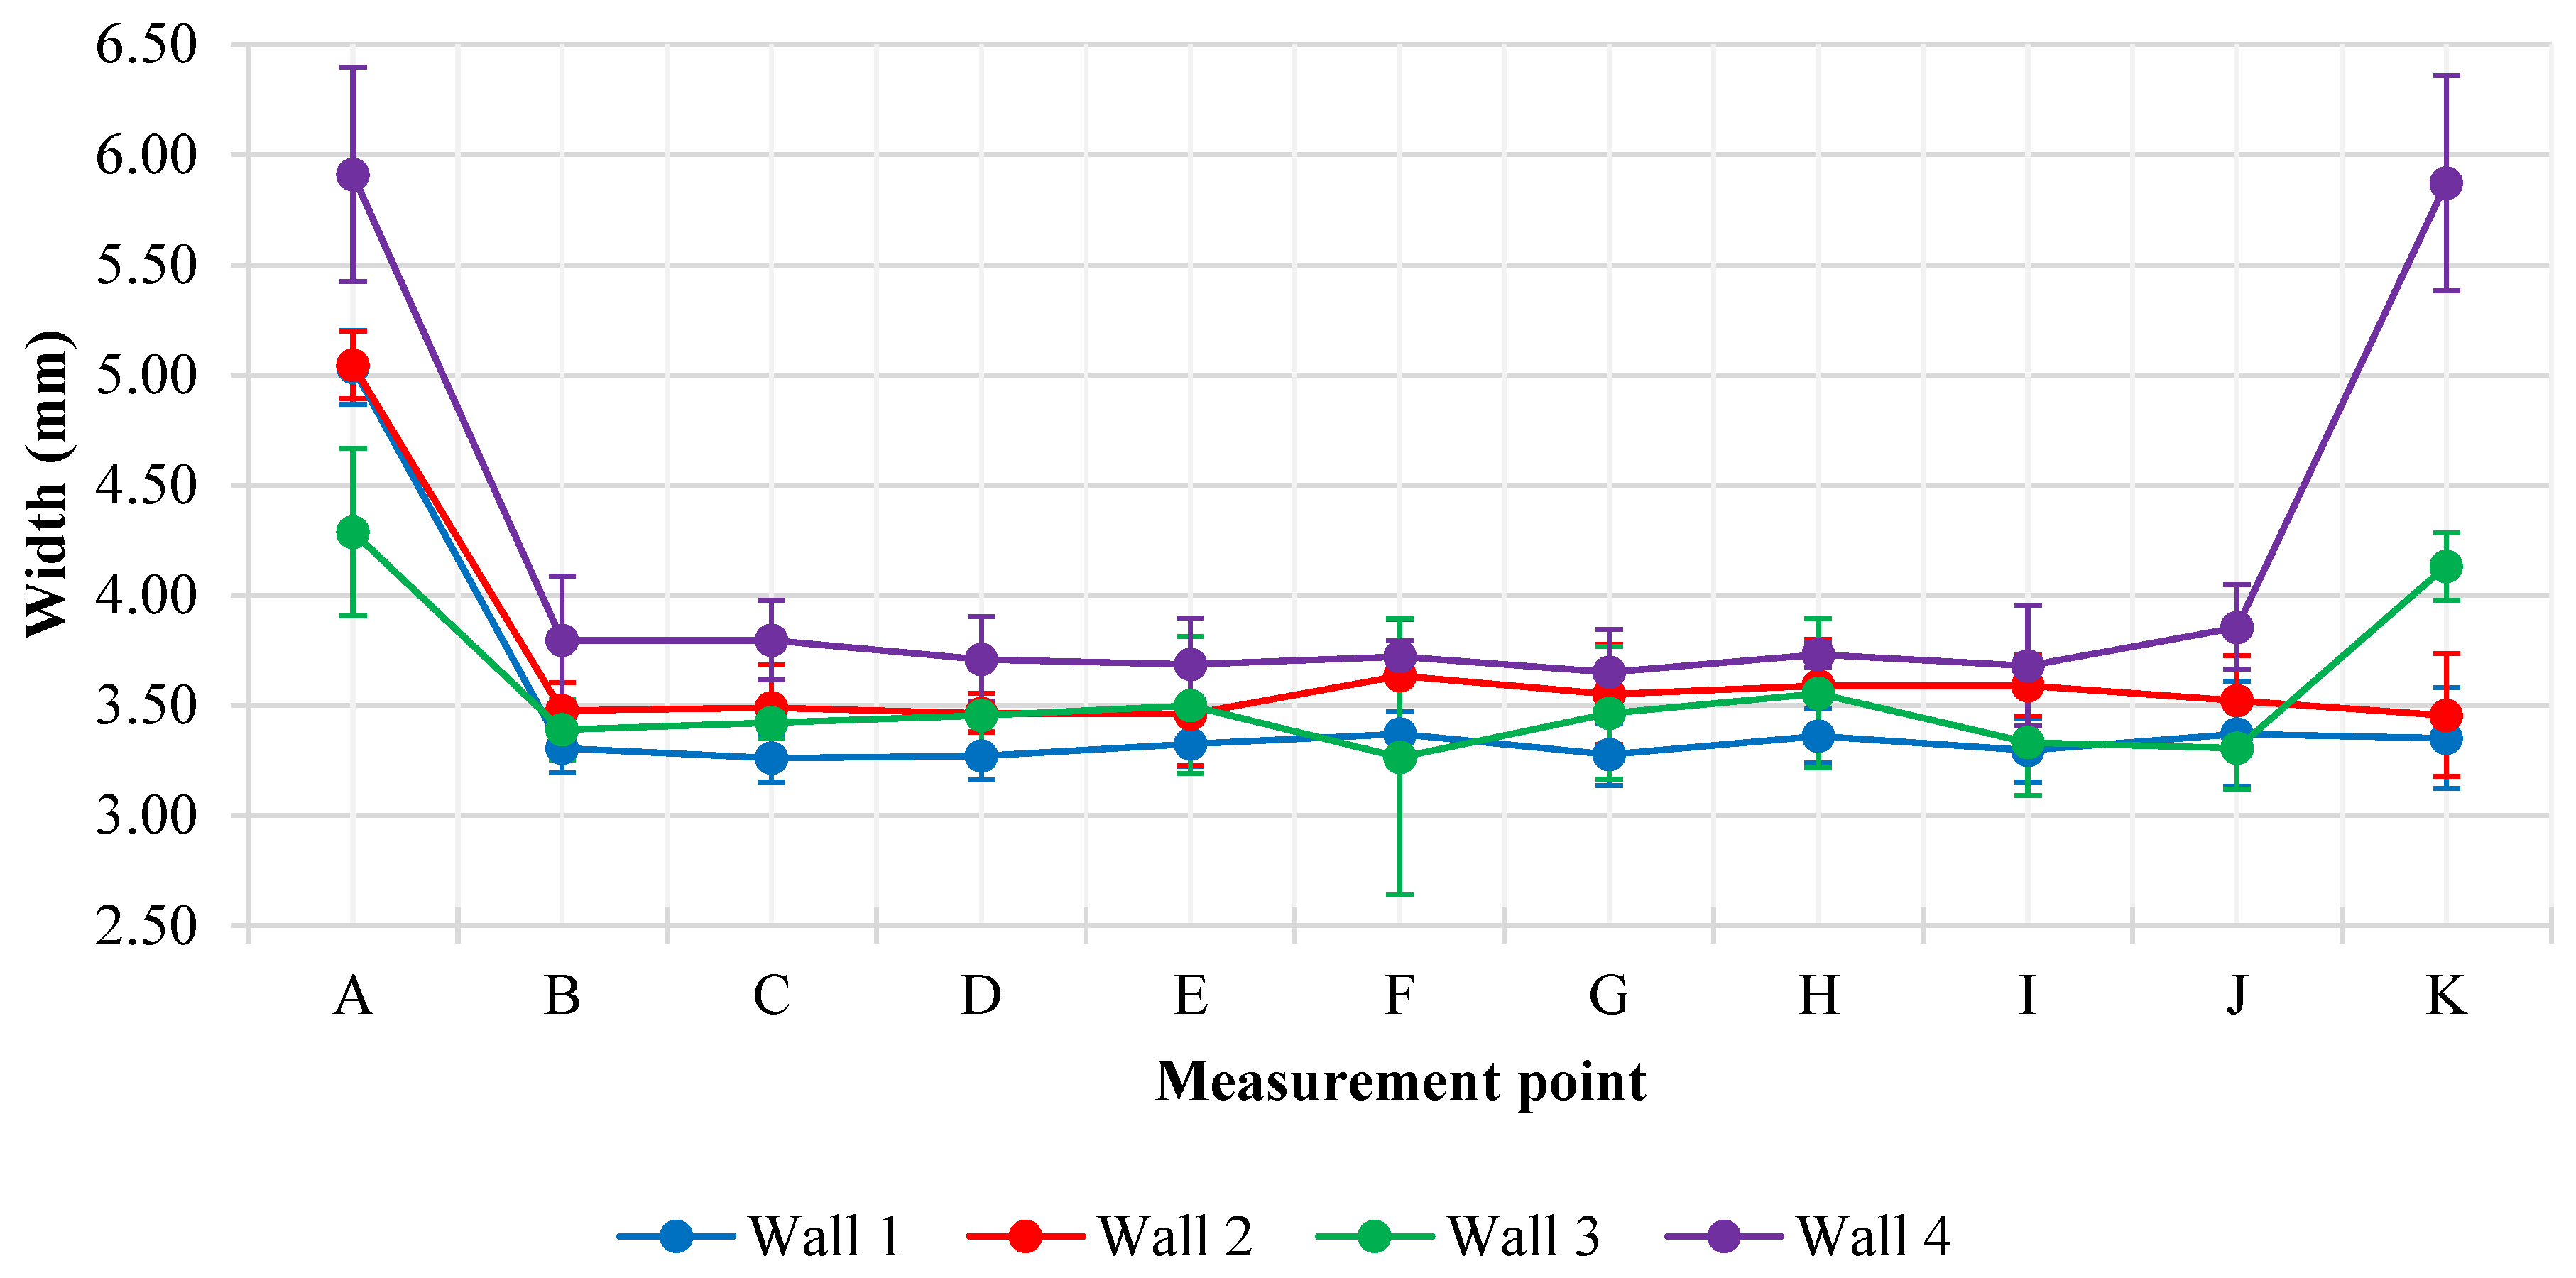
3.1. Dimensional Analysis

The dimensional analysis of the height and width of the walls totaled 440 measurements, which allowed an accurate evaluation of the geometry associated with each deposition methodology. The results obtained for each dimension will be discussed in detail below, highlighting the differences between the methodologies. Figure 8 illustrates the comparative graph between the heights of the walls. It can be noticed that the heights of walls 1, 2, 3 and 4 showed significant variations according to the deposition strategy used. Wall 1, with unidirectional deposition, showed lower heights and a progressive drop along the length, especially at the ends (measurement points I–K), due to the flow of liquid metal in the opposite direction to the torch movement. The introduction of temperature control in wall 2 provided a slight average increase, although there were still differences at the ends due to the absence of height compensation by unidirectional deposition.
With bidirectional deposition, wall 3 resulted in a more uniform height, approximately 6.17% higher than wall 1. Wall 4, which combines bidirectional deposition and temperature control, presented the highest average height value and a more uniform distribution, approximately 9.37% higher than wall 1. Kesarwani et al. [17] evaluated the deposition direction on the characteristics of a bimetallic wall (ER4043 and ER5356) produced by WAAM. As they summarize, the unidirectional deposition will lead to heat accumulation on one side/extremity of the wall due to the similar start point of the deposition; the bidirectional deposition, on the other hand, has the deposition initiating on both sides of the wall, which results in better interlayer fusion and higher bonding strength.
Figure 9 shows the comparison graph of wall widths. Wall 1 presented the smallest width, with the highest value at the initial part (measurement point A) due to the lateral flow of the material until the arc stabilized. Wall 2, with temperature control, resulted in an average increase in width of 5.39% compared to wall 1, reflecting the greater lateral dispersion of the material. For wall 3, the bidirectional movement resulted in a uniform width at the central points (measurement points B–J), possibly due to the slightly lower exposure to the arc in these regions, and a slight increase at the end (point K). Finally, wall 4, with bidirectional deposition and temperature control, obtained the largest average width, approximately 26.14% greater than wall 1. Similarly, Zhang et al. [18] also observed a great impact of the heat input on the layer height in their work, evaluating the WAAM deposition of In 625, the layer height varied from approximately 1.75 mm to 3.00 mm when the heat input was reduced from 828 J/mm to 276 J/mm, reinforcing the importance of controlling the heat to achieve the desired geometry.

3.2. Microhardness

A total of 307 indentations were performed with the durometer, providing data that allowed a comprehensive analysis of the microhardness properties of the walls. To interpret this data, three analysis procedures were adopted: overall analysis, column analysis and line analysis. The overall microhardness analysis was performed by considering the average of all results across the different regions of the walls, followed by the average of these regional values to obtain an overall value, as illustrated in Figure 10. This approach allows an overview of the distribution of the average Vickers microhardness in the walls, facilitating comparison between them. It is worth mentioning that the x-axis and y-axis correspond to thickness and height directions, respectively. A general analysis concerning microhardness mapping was also discussed.

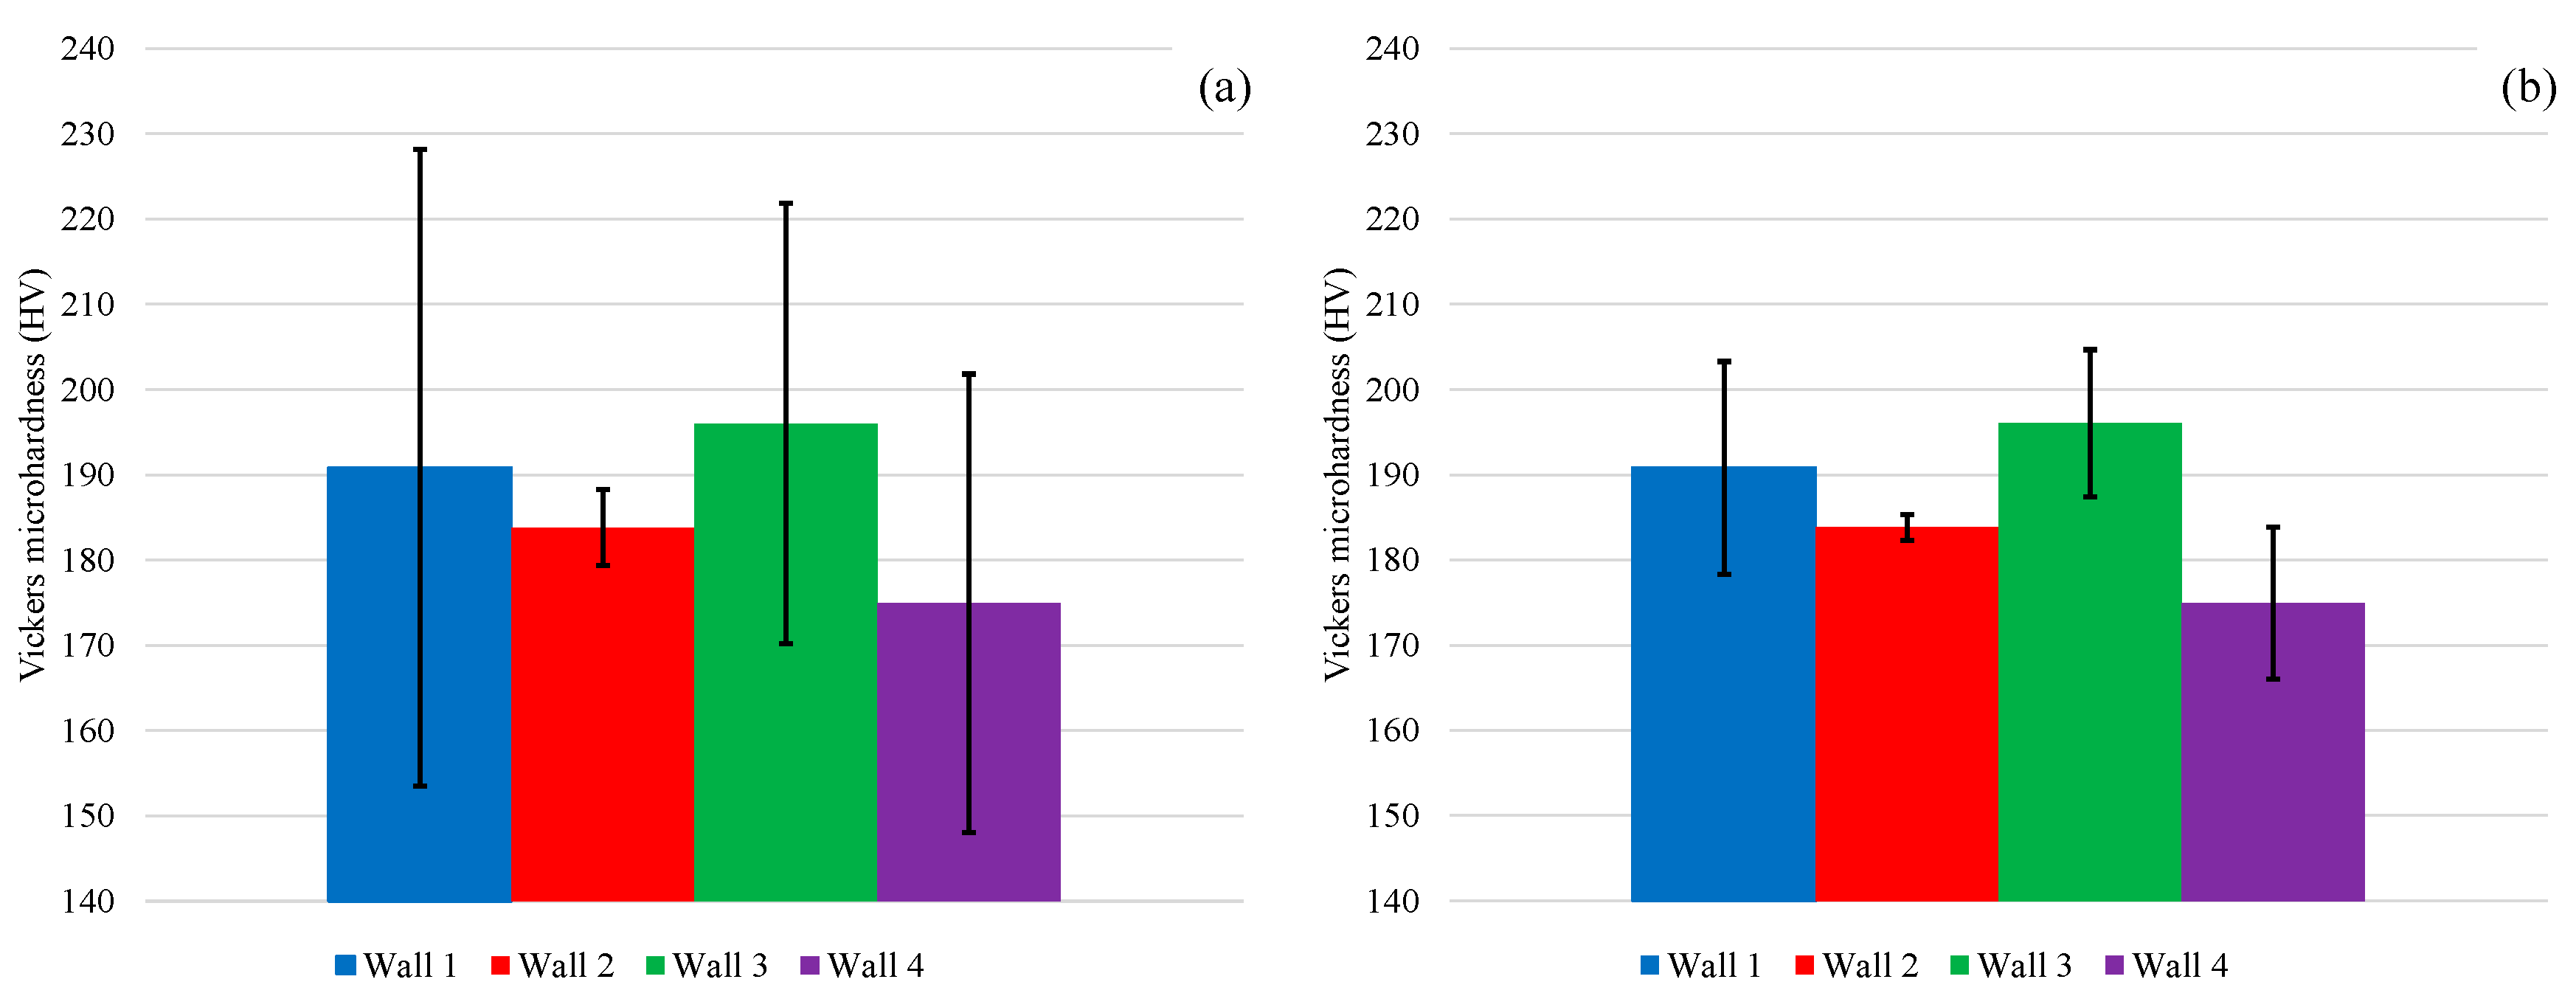
3.2.1. Overall Microhardness Analysis

Figure 11, with line graphs, illustrates the microhardness variations between the walls in the different regions, highlighting the influence of the confidence intervals on the standard deviations and mean values, which facilitates the understanding of the consistency of the results. Overall, wall 3 presented the highest microhardness averages in the upper (208.44 ± 14.35 HV), central (193.21 ± 9.73 HV) and lower (187.20 ± 6.01 HV) regions, while wall 4 recorded the lowest values in the central and lower regions. Those results are in agreement with the work of Zhai et al. [19], who studied ER70S-6/S355 bimetal component, manufactured by WAAM. In their work, the microhardness of the ER70S-6 varied between 150 and 200 HV as deposited. The authors also quenched the part, resulting in an increase up to about 280 HV for the ER70S-6 and about 330 HV for the S355.
Finally, Figure 12, represented by a bar graph, illustrates the overall average microhardness among the walls, showing that wall 3 achieves the highest average values, followed by wall 1, while wall 4 presents the lowest results. It can also be observed that, by expanding the confidence interval to 99.7%, the variability of the data increases significantly, leading to a more conservative interpretation of the consistency and variations of microhardness among the walls.

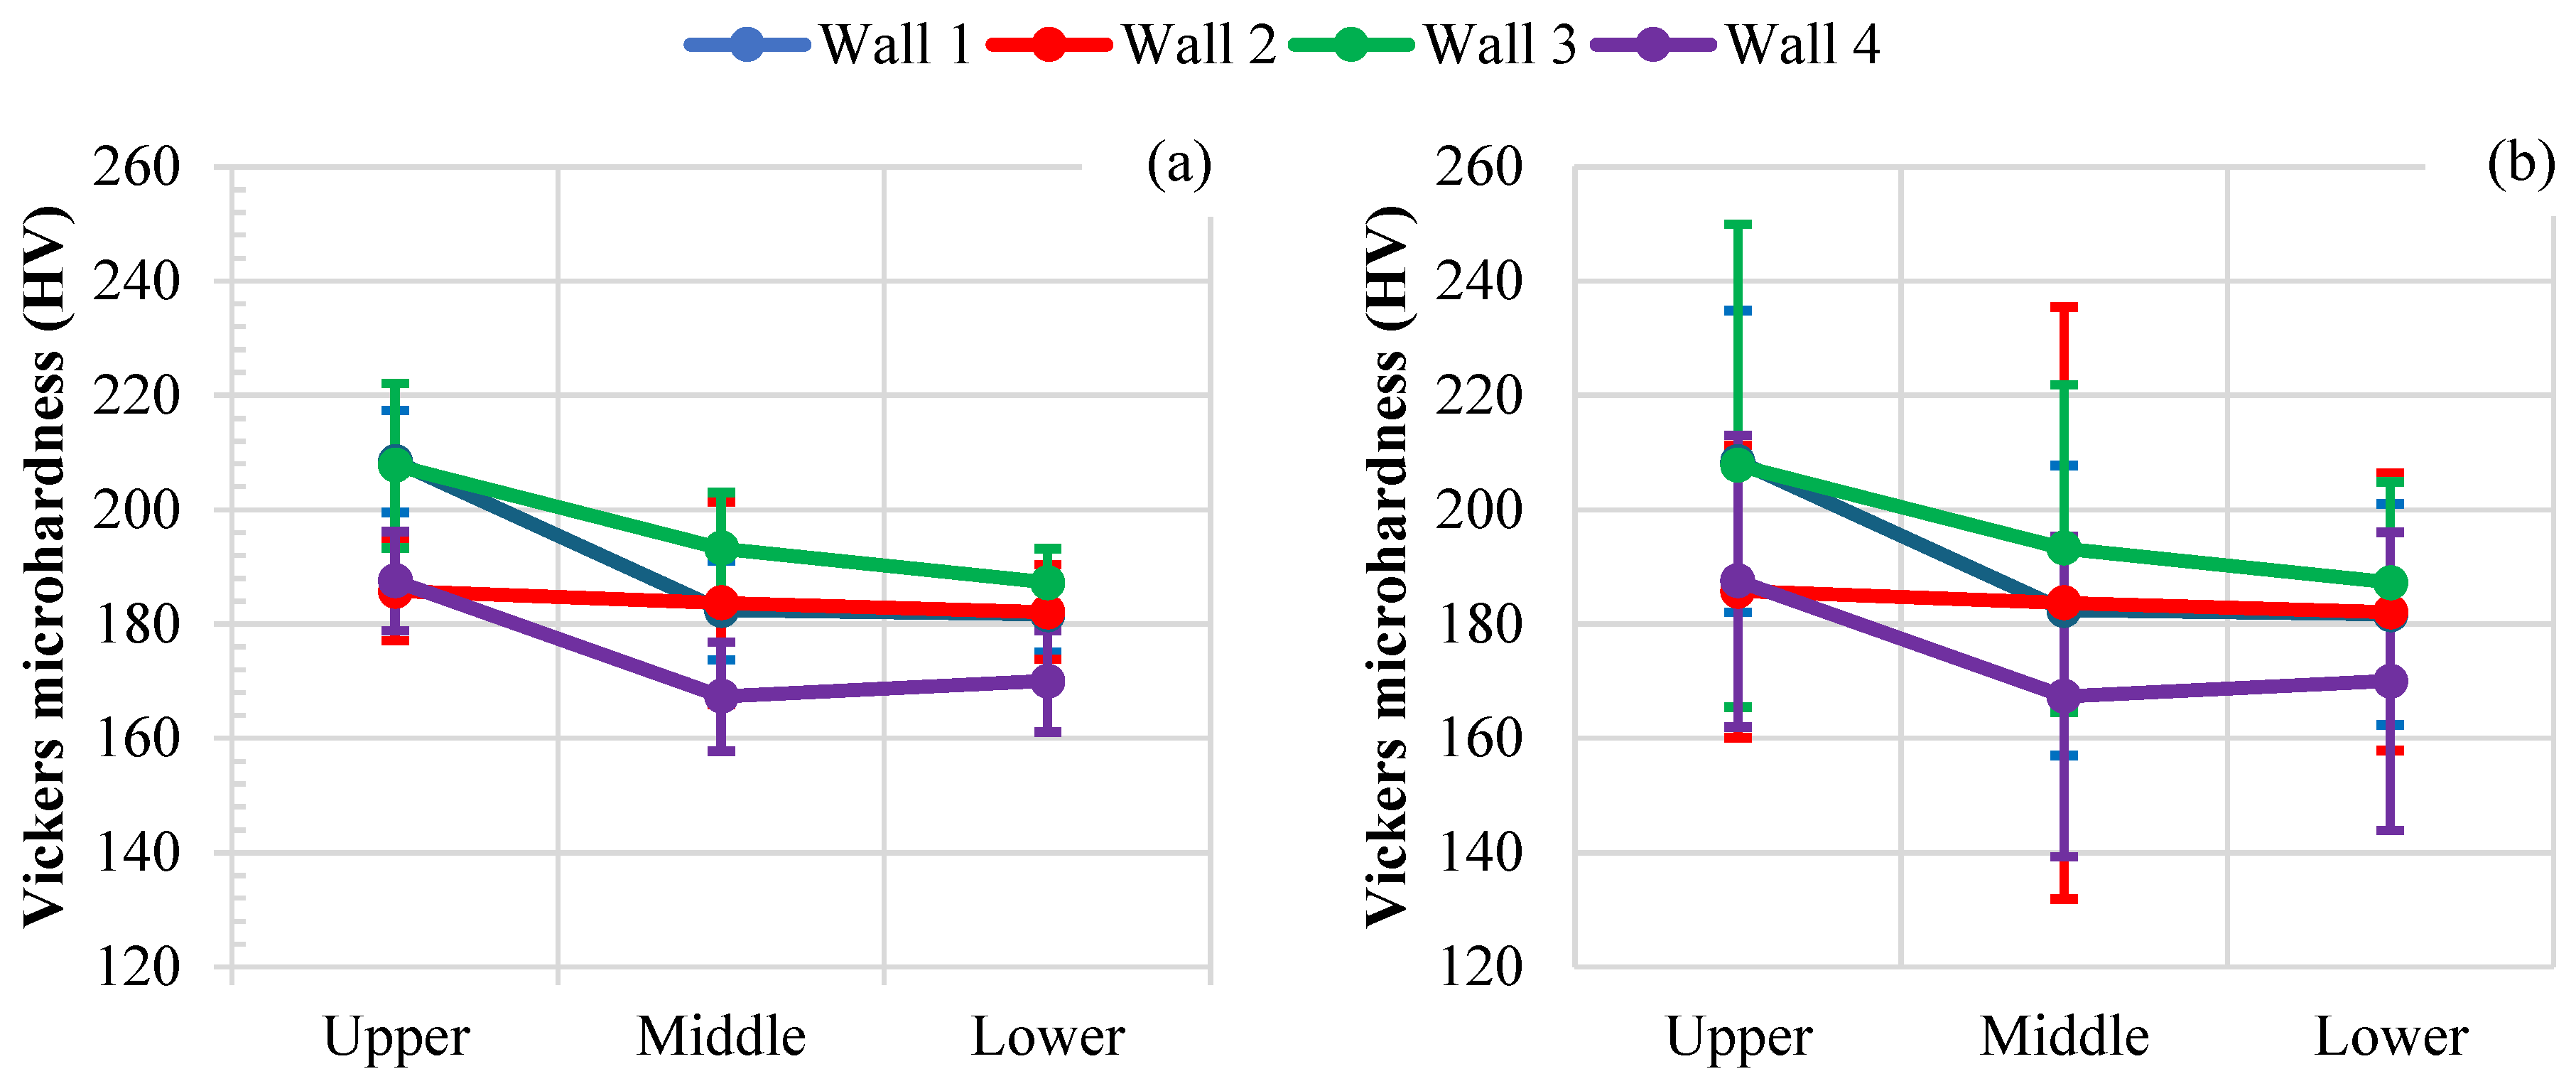
3.2.2. Vertical Microhardness Analysis

The vertical (column) analysis was performed by considering the average of the vertically aligned microhardness measurements belonging to each column. For each x value, two indentations were performed per region, totaling six indentations along the different regions. Thus, this approach aims to map the microhardness values along the x-axis, throughout the thickness of the walls, covering both the regions adjacent to the walls and the central regions of the walls, as graphically represented in Figure 13.
One notes that in Figure 13, wall 3 with bidirectional deposition without temperature control resulted in higher average microhardness values. In contrast, wall 4, with interlayer temperature control of 60 °C, revealed lower average microhardness values. Comparatively, walls 1 and 2, both with unidirectional deposition, showed intermediate values, with wall 2 presenting a slight reduction of 2.07% in the average microhardness values in relation to wall 1.
It is noted that the error bars present in the graphs in Figure 13 suggest that the variation in the microstructure occurs along the height because the microhardness values in each column are inserted in the same uncertainty interval. This is in accordance with Safarzade et al. [20], who point out that grain growth occurs in the direction of the maximum temperature gradient, which explains the uniformity of the average microhardness results along the x-axis because the maximum gradient occurs in the direction of the y-axis. In addition, studies by Kumar et al. [21] and Das et al. [22], who investigated the microstructure of the same material discussed in this article, found similar results. Kumar et al. [21] identified distinct microstructures in the upper, central and lower regions: martensitic, transition and equiaxed, respectively. Das et al. [22] observed microstructures of cementite and bainite in the upper part, a transition zone in the central and ferrite in the lower part.

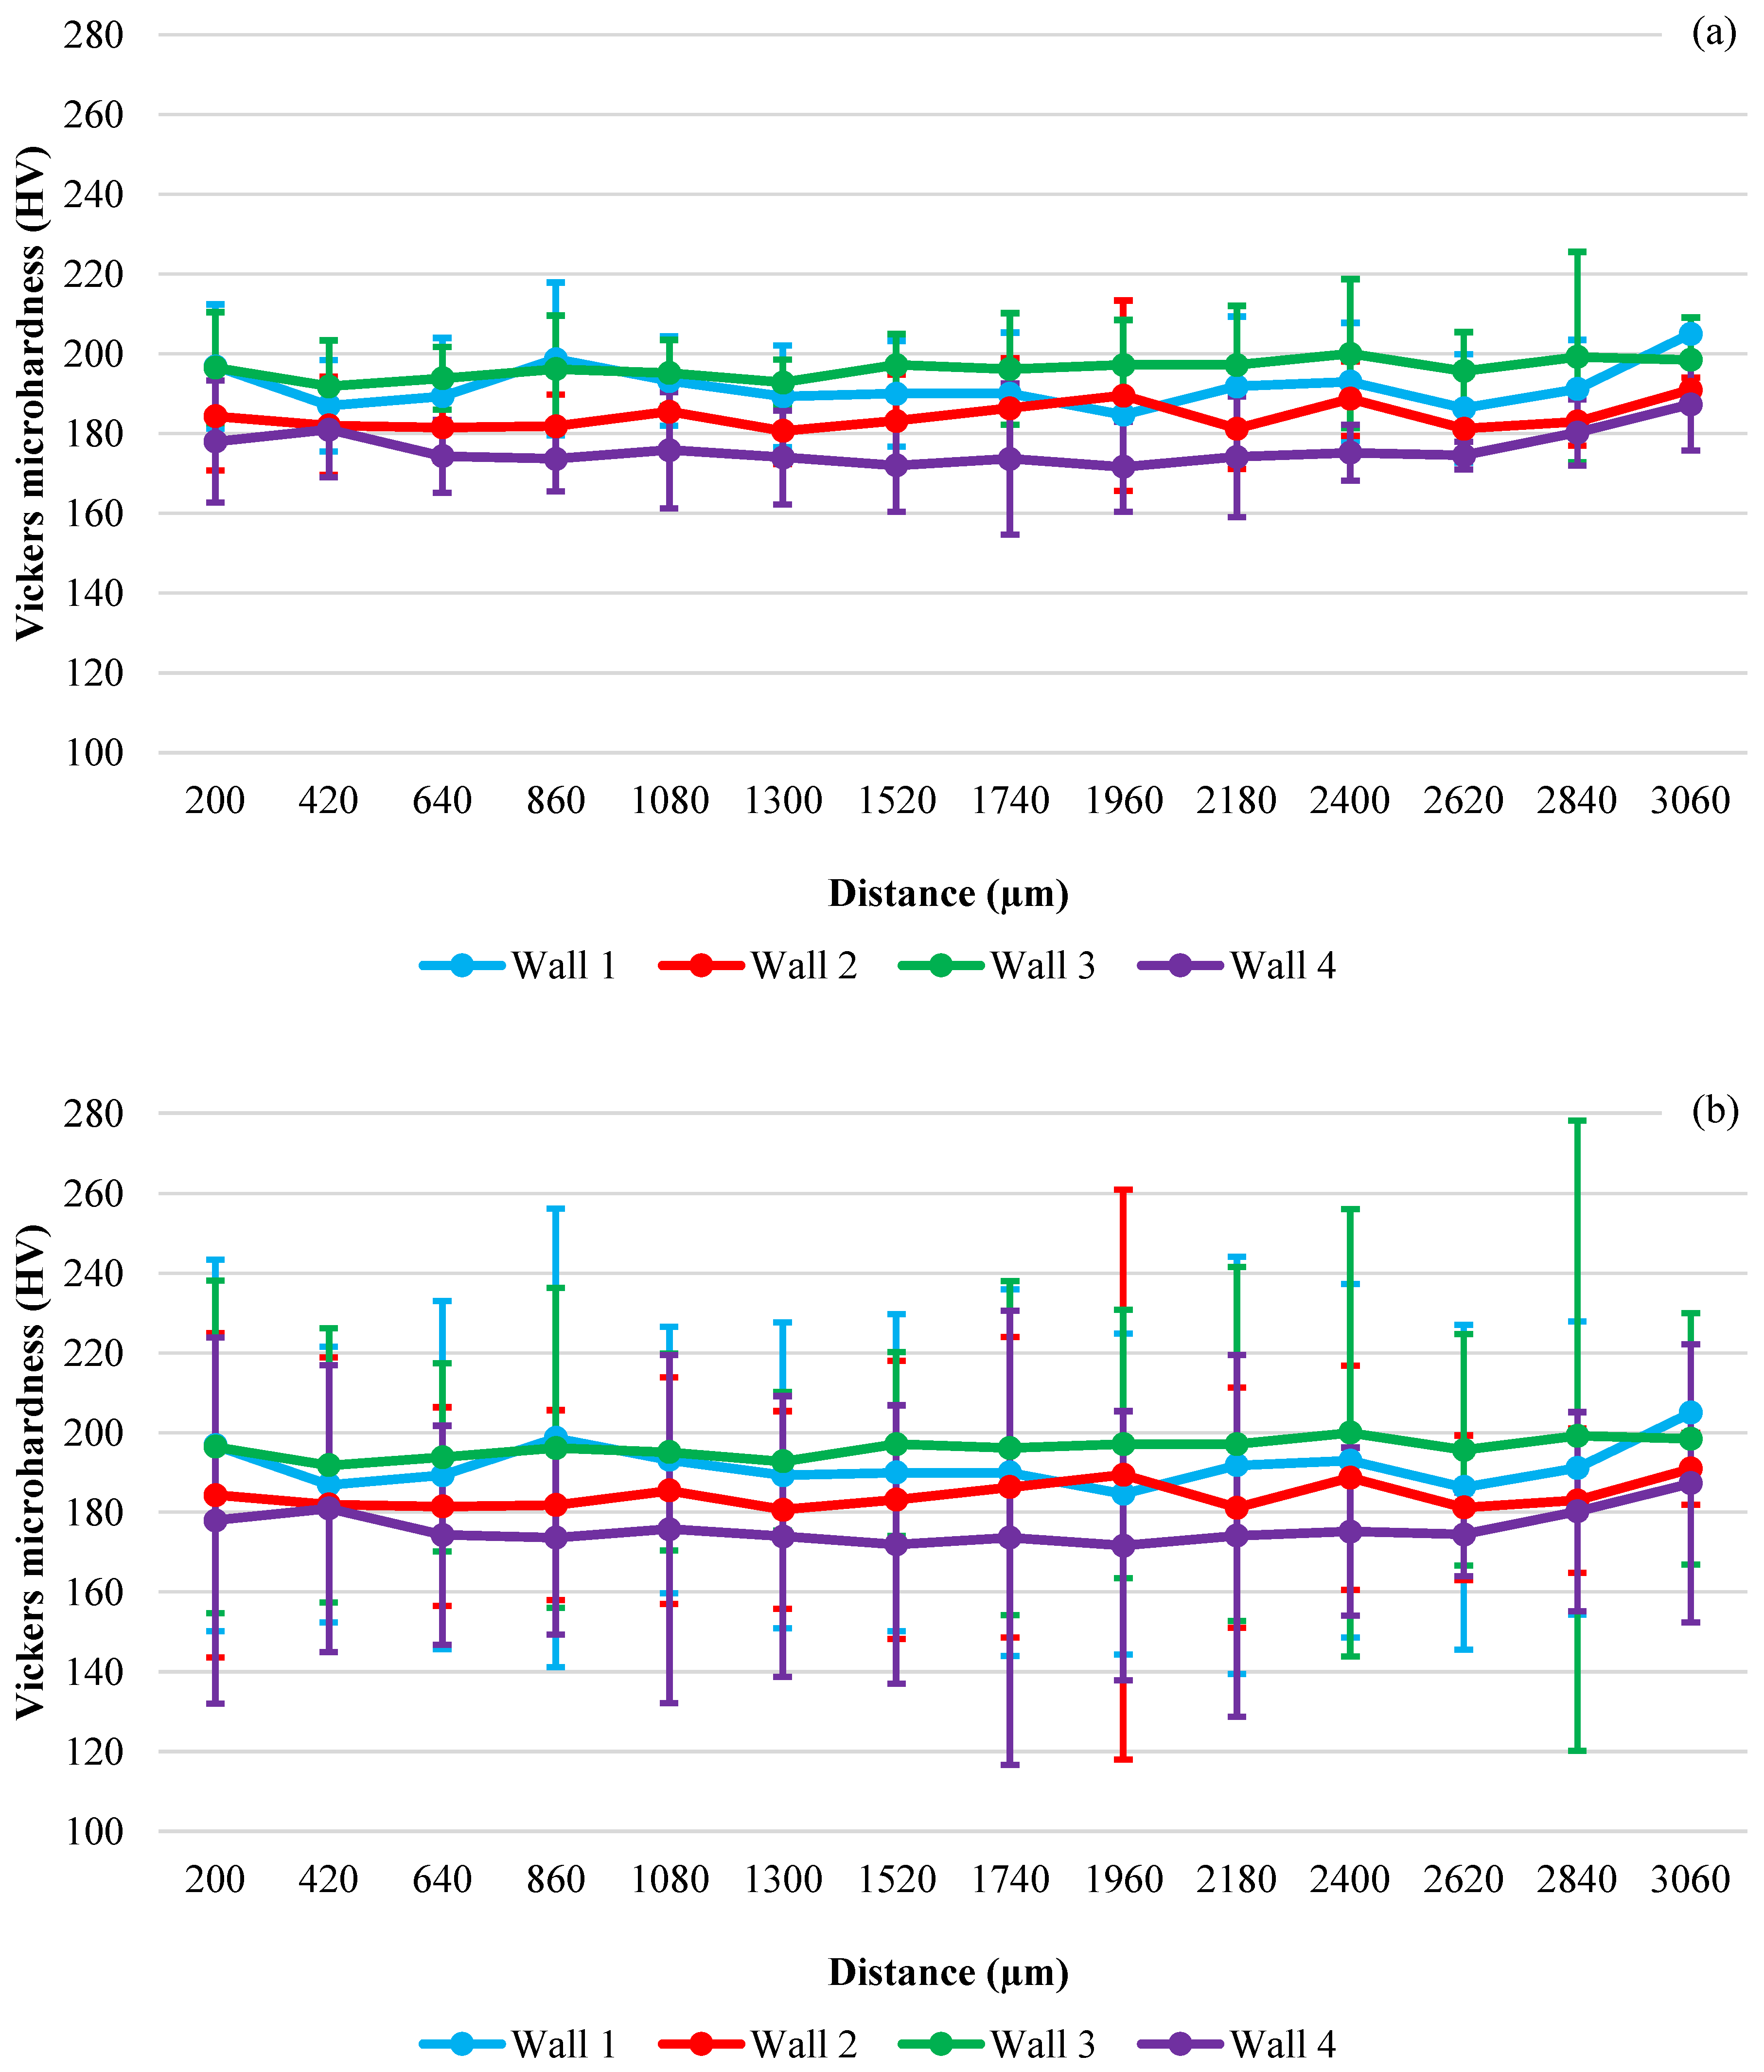
3.2.3. Horizontal Microhardness Analysis

For line analysis, the Vickers microhardness results were organized horizontally, dividing them into lines and calculating the average of these values for each line. This methodology aims to outline the distribution of Vickers microhardness values along the y-axis, representing the three regions: upper, central and lower. Figure 14 contains the graphical visualization of the microhardness values measured.
The line analysis of the walls shows significant variations in the microhardness values along the height, highlighting the impact of the deposition and thermal control strategies. As illustrated in Figure 14, wall 3, which used bidirectional deposition without interlayer temperature control, presented the highest microhardness values, with an increase of 12.18% in relation to wall 4, which obtained the lowest values. Between walls 1 and 2, wall 1 showed microhardness values 4.24% higher, suggesting that thermal control reduces hardness by modifying the secondary phases, as pointed out by Zhang et al. [13].
The error bars in the graphs in Figure 14 indicate more subtle variations along the height compared to the column analysis, evidencing that the thermal gradient is more significant in the height than in the width, which results in distinct microstructures along the y-axis. The choice of confidence interval (68% or 99.7%) also influences the assessment of microhardness uniformity, being more evident in walls 2 and 4, mainly in the central region. It is worth mentioning that the variation in the upper region was expected; Das et al. [22] noted that the microstructure will vary with height when evaluating the microstructure of ER70S-6 deposited with WAAM-CMT. They observed that near the substrate, the microstructure will be more equiaxed, followed by a mix of equiaxed, columnar and dendritic microstructure in the central region of the wall and a predominantly dendritic microstructure in the upper regions. This is in agreement with the observations in this work, with higher microhardness values in the upper regions. Also, considering the central section, the variation could be associated with measurements in different microstructures, leading to the hardness variation.
Other work that studied the characteristics of WAAM parts was performed by Rodrigues et al. [23], who deposited HSLA steel and evaluated the temperature influence on the part properties. The authors concluded that when a layer is deposited, it influences the previous layers, reducing the cooling rate, which enhances the microstructure and reduces defects such as cracks. They also highlight that once the walls are not constrained, the material benefits from being able to accommodate the residual stresses. The fact that the last layers are submitted to less re-heat cycles and therefore to faster cooling might have an impact on the resulting microstructure, not only for steel [22,23] but also for other metallic alloys such as Fe3Al [24] and Ti6Al4V [25].

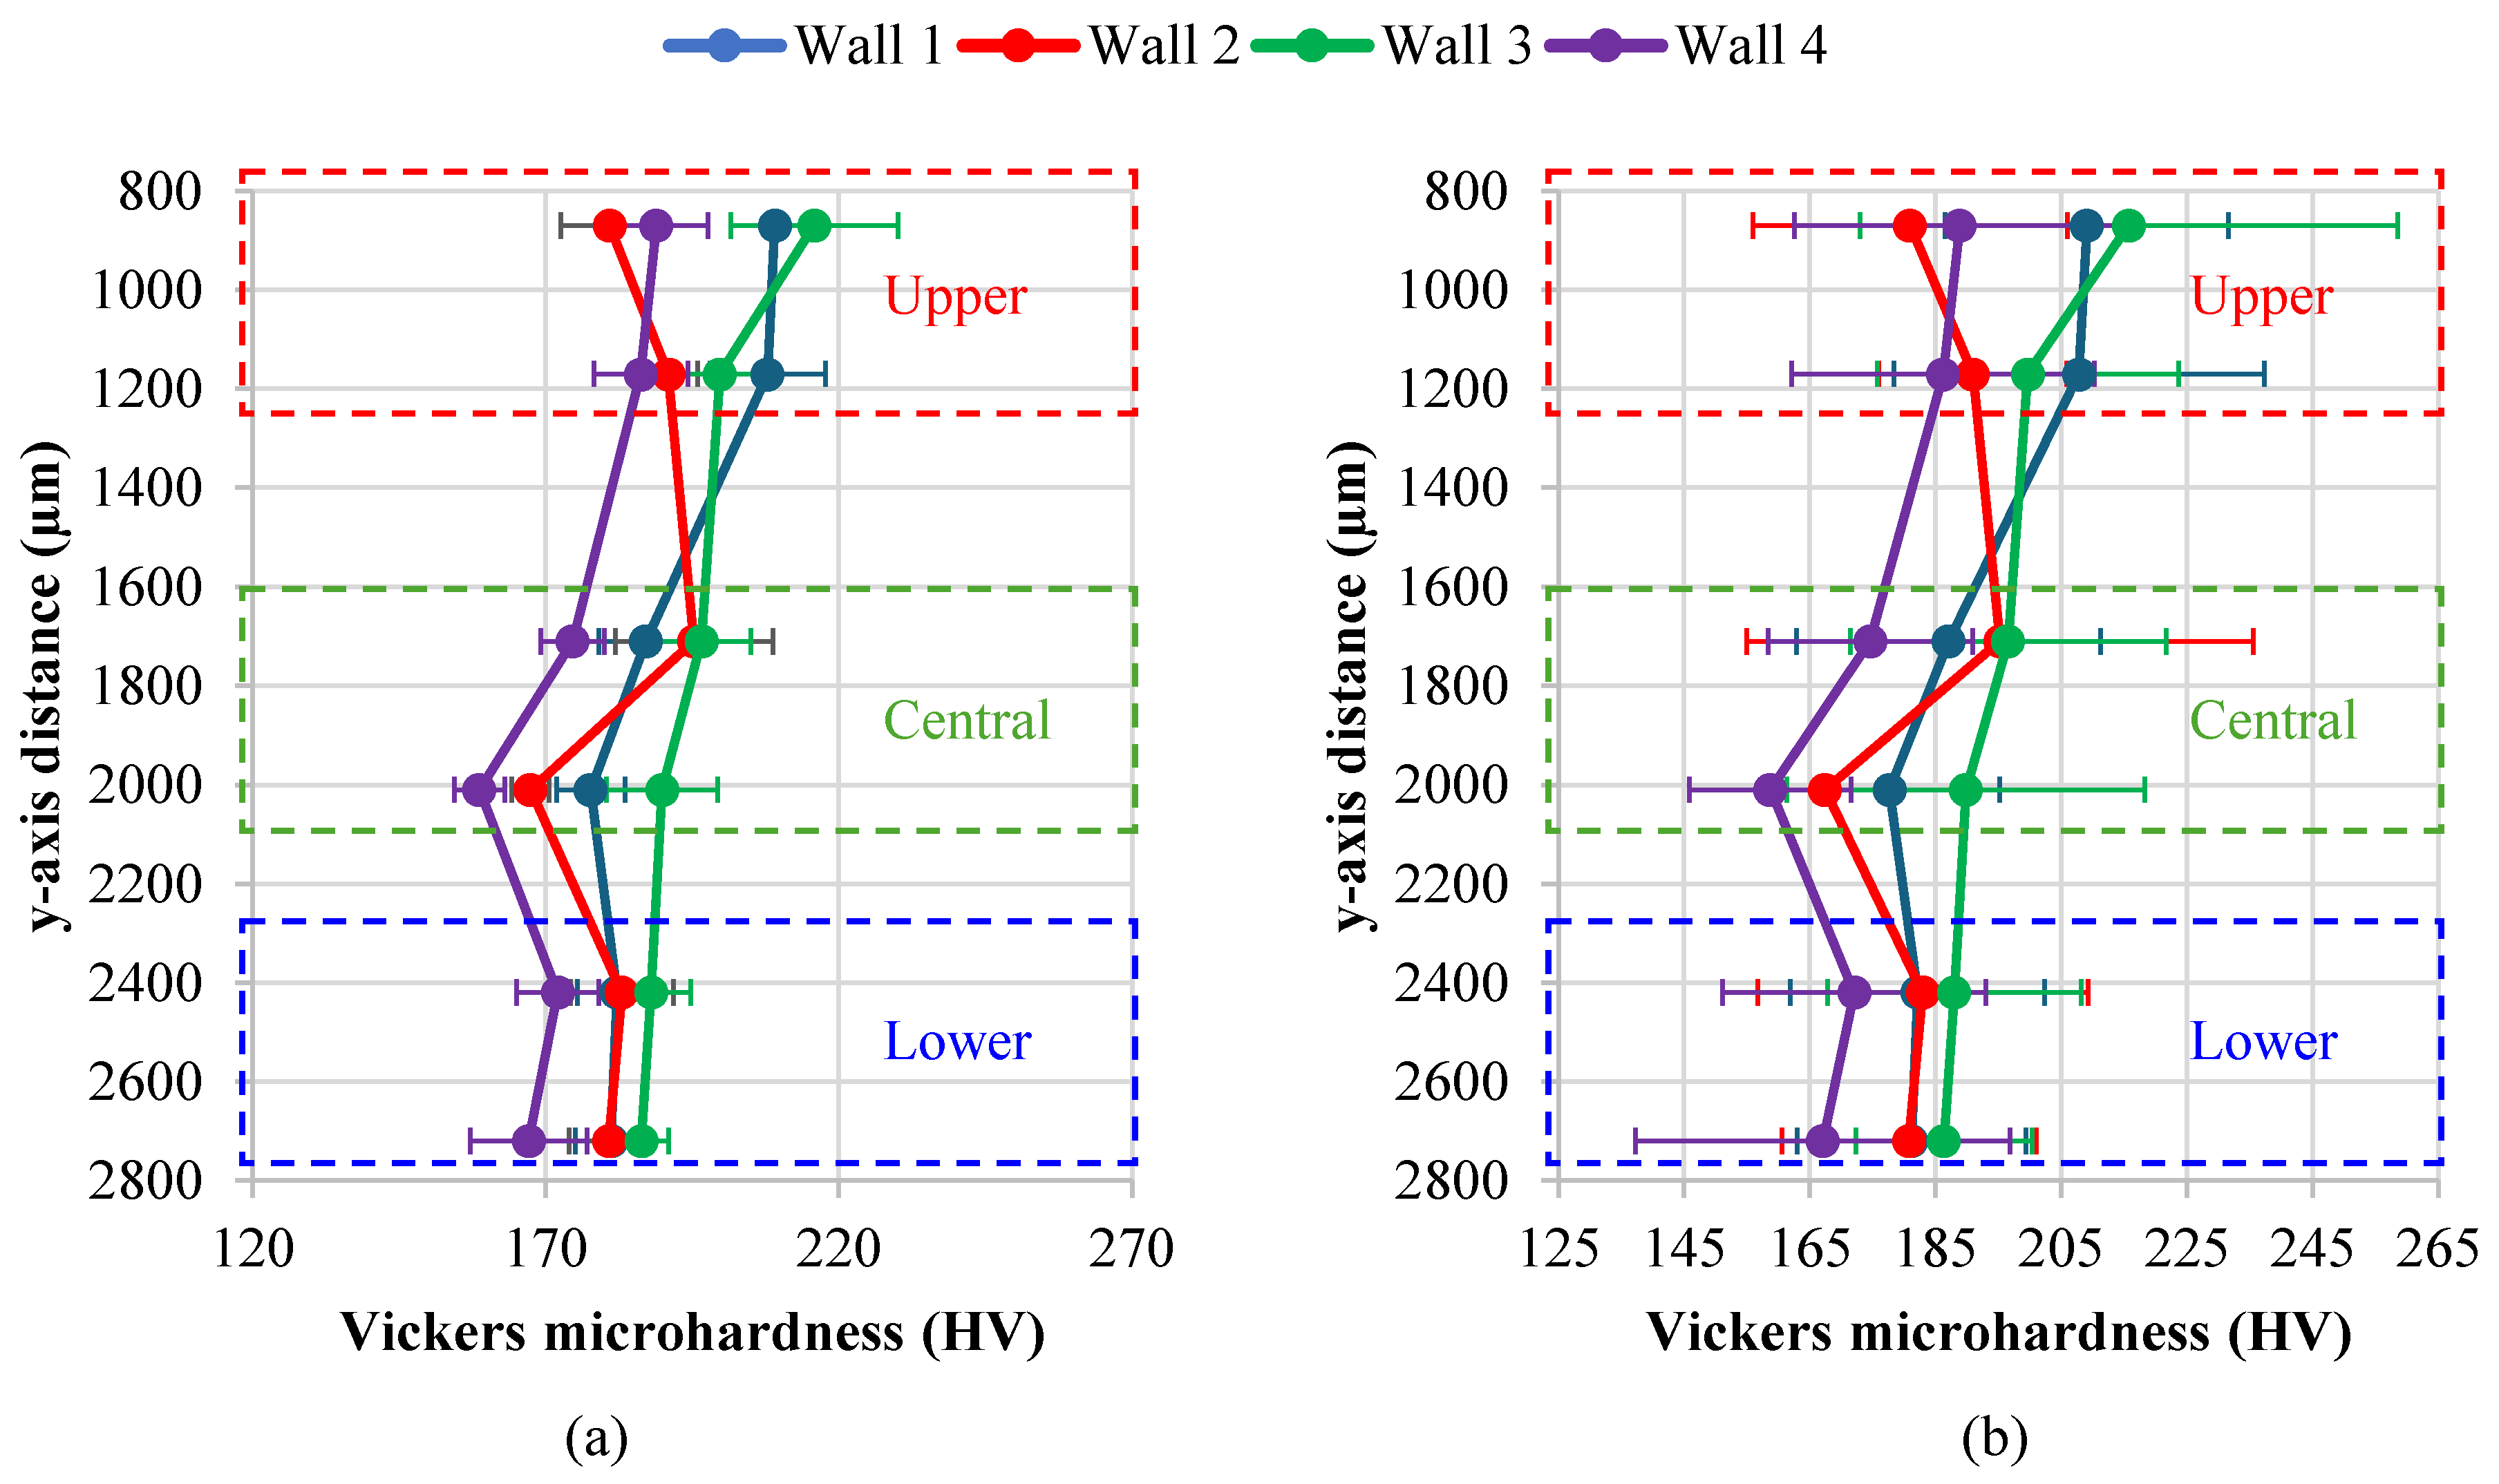
3.2.4. Microhardness Mapping Analysis

To better represent the overall microhardness variation within the wall, Figure 15 contains the microhardness mapping for all the deposition conditions evaluated. As mentioned, in item 3.2.3, it is expected that the walls present a slightly higher hardness on the upper region due to the heat accumulated during the deposition. This behavior can be noticed in Figure 15, especially for wall 1 and wall 3, Figure 15a,c, respectively. Additionally, it can be noticed that using temperature control (wall 2 and 4), the variation in microhardness is higher for the central region, while walls 1 and 3 (no temperature control) presented higher variation at the upper region. This can be attributed to the higher heat accumulation in the upper region, as previously discussed.
When comparing the deposition strategies, it is possible to notice that bidirectional deposition, Figure 15c,d, resulted in a more homogeneous distribution, which might be associated with the cinematic of the heat source. Now, focusing on the temperature control, Figure 15b,d, the difference is notable, resulting in lower hardness and lower variations. Finally, when associating both methods, Figure 15d, it is possible to obtain a wall with more hardness value homogeneity, which can contribute to the usability of the part, reducing the need for heat treatments as a post-processing method. The improvement in this case has two reasons, the bidirectional deposition and the interlayer temperature control. Regarding temperature control, the lower temperature could be associated with the formation of a more refined microstructure, which can be achieved when temperature control is applied to the process [15]. The possibility to produce a WAAM part with no need for heat treatment as post-processing can reduce production time and costs while also favoring repairing and maintenance applications.
Regarding the benefits of the bidirectional deposition, Novelino et al. [12] pointed out that the cinematic of the bidirectional deposition enables a more homogeneous heat input along all layer lengths, which also led to more homogeneous wall height and width in their study. This effect was also observed for the height of this work (Figure 8). Raja et al. [26] pointed out that for the WAAM deposition of IN625, the bidirectional deposition resulted in lower microstructural heterogeneity when vertically evaluating the wall, leading to a more uniform hardness variation in comparison to the unidirectional deposition.

4. Conclusions

This paper presented how the interlayer temperature and the deposition method influence the wall’s height and width and microhardness profile in ER70S-6 printed parts by WAAM. Through the results presented, it was possible to conclude that:
  • The unidirectional deposition with no temperature control presented the lowest height and a progressive drop along the wall’s length. Temperature control slightly increased the wall’s height, while the bidirectional deposition without temperature control resulted in a more uniform height. The combination of bidirectional deposition and temperature control further improved the wall’s height and distribution.
  • The bidirectional deposition with temperature control increased the wall’s average width by up to 26.14%. The lowest average width was found for wall 1 (unidirectional deposition without temperature control). A more uniform width was observed after bidirectional deposition with no temperature control (wall 3).
  • Regardless of the deposition method, the wall region (lower, central or upper) influenced the microhardness. The highest and lowest microhardness were found in the upper and lower regions, respectively. As a transition region, the center of the wall can present high microhardness value variation.
  • Considering the strategies evaluated in this work, the bidirectional method resulted in lower microhardness variation. Applying temperature control contributes to more homogeneous microhardness distribution. When both methods are combined, it is possible to achieve a taller and thicker wall, with less than 15 HV microhardness variation.
  • For future research directions, it is suggested to evaluate distinct control temperatures and analyze the material’s microstructure to further comprehend the microhardness variation.

Author Contributions

A.L.S.d.C.: Methodology, Research, Writing—original version. D.d.O.: Methodology, Writing—analysis, review and editing. R.L.d.P.: Methodology, Writing—analysis, review and editing. M.Z.: Conceptualization, Writing—review and editing, Supervision. All authors have read and agreed to the published version of the manuscript.

Funding

This research was funded by CNPq, grant number 405499/2022-1, 402730/2023-2, 443148/2023-6 and 200018/2025-6.

Data Availability Statement

The original contributions presented in this study are included in the article. Further inquiries can be directed to the corresponding author(s).

Acknowledgments

The authors are grateful to the University of Brasilia. The authors are also grateful to Brazilian funding agencies CAPES and FAP-DF. The authors are grateful to CNPq and LAETA/INEGI—Associate Laboratory of Energy, Transports and Aerospace/Institute of Science and Innovation in Mechanical Engineering and Industrial Engineering.

Conflicts of Interest

The authors declare no conflict of interest.

References

  1. Zhang, Y.; Wu, L.; Guo, X.; Kane, S.; Deng, Y.; Jung, Y.-G.; Lee, J.-H.; Zhang, J. Additive Manufacturing of Metallic Materials: A Review. J. Mater. Eng. Perform. 2018, 27, 1–13. [Google Scholar] [CrossRef]
  2. Kumar, M.B.; Sathiya, P. Methods and materials for additive manufacturing: A critical review on advancements and challenges. Thin-Walled Struct. 2021, 159, 107228. [Google Scholar] [CrossRef]
  3. Mehrpouya, M.; Dehghanghadikolaei, A.; Fotovvati, B.; Vosooghnia, A.; Emamian, S.S.; Gisario, A. The Potential of Additive Manufacturing in the Smart Factory Industrial 4.0: A Review. Appl. Sci. 2019, 9, 3865. [Google Scholar] [CrossRef]
  4. du Plessis, A.; Broeckhoven, C.; Yadroitsava, I.; Yadroitsev, I.; Hands, C.H.; Kunju, R.; Bhate, D. Beautiful and Functional: A Review of Biomimetic Design in Additive Manufacturing. Addit. Manuf. 2019, 27, 408–427. [Google Scholar] [CrossRef]
  5. Norrish, J.; Polden, J.; Richardson, I. A review of wire arc additive manufacturing: Development, principles, process physics, implementation and current status. J. Phys. D Appl. Phys. 2021, 54, 473001. [Google Scholar] [CrossRef]
  6. Jin, W.; Zhang, C.; Jin, S.; Tian, Y.; Wellmann, D.; Liu, W. Wire Arc Additive Manufacturing of Stainless Steels: A Review. Appl. Sci. 2020, 10, 1563. [Google Scholar] [CrossRef]
  7. Barroqueiro, B.; Andrade-Campos, A.; Valente, R.A.F.; Neto, V. Metal Additive Manufacturing Cycle in Aerospace Industry: A Comprehensive Review. J. Manuf. Mater. Process. 2019, 3, 52. [Google Scholar] [CrossRef]
  8. da Silva, C.P.; Silva, G.P.; Santos, M.C.; Ziberov, M.; Malcher, L. Hybrid search methodology for mechanical characterization of material produced via WAAM assuming Gurson porous material. J. Braz. Soc. Mech. Sci. Eng. 2024, 46, 1–16. [Google Scholar] [CrossRef]
  9. Albannai, A.I.; León-Henao, H.; Ramirez, A.J. Preventing columnar grains growth during hybrid wire arc additive manufacturing of austenitic stainless steel 316L. Eng. Rep. 2024, 6, e12914. [Google Scholar] [CrossRef]
  10. Shah, A.; Aliyev, R.; Zeidler, H.; Krinke, S. A Review of the Recent Developments and Challenges in Wire Arc Additive Manufacturing (WAAM) Process. J. Manuf. Mater. Process. 2023, 7, 97. [Google Scholar] [CrossRef]
  11. Ron, T.; Levy, G.K.; Dolev, O.; Leon, A.; Shirizly, A.; Aghion, E. Environmental Behavior of Low Carbon Steel Produced by a Wire Arc Additive Manufacturing Process. Metals 2019, 9, 888. [Google Scholar] [CrossRef]
  12. Novelino, A.; Carvalho, G.; Ziberov, M. Influence of WAAM-CMT deposition parameters on wall geometry. Adv. Ind. Manuf. Eng. 2022, 5, 100105. [Google Scholar] [CrossRef]
  13. Dekis, M.; Tawfik, M.; Egiza, M.; Dewidar, M. Unveiling the Characteristics of ER70S-6 low Carbon Steel Alloy Produced by wire arc Additive Manufacturing at Different Travel Speeds. Met. Mater. Int. 2024, 31, 325–338. [Google Scholar] [CrossRef]
  14. de Araújo Soares, M.A.; Novelino, A.L.B.; Ziberov, M. Geometry Study on 410NiMo Alloy Parts Printed by WAAM-CMT. In Brazilian Manufacturing Engineering Congress; Springer Nature: Cham, Switzerland, 2024; pp. 114–125. [Google Scholar] [CrossRef]
  15. Zhai, W.; Wu, N.; Zhou, W. Effect of Interpass Temperature on Wire Arc Additive Manufacturing Using High-Strength Metal-Cored Wire. Metals 2022, 12, 212. [Google Scholar] [CrossRef]
  16. Vieira, R.D.A.d.M.; Liskevych, O.; de Oliveira, D.; Ziberov, M. Influence of parameter variation and interlayer temperature control in wall angle, curvature and measurement methodology of ER70S-6 parts obtained by WAAM. Manuf. Lett. 2024, 42, 40–45. [Google Scholar] [CrossRef]
  17. Kesarwani, S.; Yuvaraj, N.; Niranjan, M.S. Impact of depositional direction and current on microstructure and mechanical properties of the bimetallic wall of ER5356/ER4043 fabricated by cold metal transfer based wire arc additive manufacturing. CIRP J. Manuf. Sci. Technol. 2024, 53, 17–33. [Google Scholar] [CrossRef]
  18. Zhang, C.; Qiu, Z.; Zhu, H.; Wang, Z.; Muránsky, O.; Ionescu, M.; Pan, Z.; Xi, J.; Li, H. On the Effect of Heat Input and Interpass Temperature on the Performance of Inconel 625 Alloy Deposited Using Wire Arc Additive Manufacturing–Cold Metal Transfer Process. Metals 2022, 12, 46. [Google Scholar] [CrossRef]
  19. Zhai, W.; Guo, Y.; Aishwarya; Canturri, C.; Shandro, R.; Zhou, W. Wire arc additive manufacturing of ER70S-6/S355 bimetal component. Mater. Sci. Eng. A 2024, 900, 146498. [Google Scholar] [CrossRef]
  20. Safarzade, A.; Sharifitabar, M.; Afarani, M.S. Effects of heat treatment on microstructure and mechanical properties of Inconel 625 alloy fabricated by wire arc additive manufacturing process. Trans. Nonferr. Met. Soc. China 2020, 30, 3016–3030. [Google Scholar] [CrossRef]
  21. Kumar, V.; Mandal, A.; Das, A.K.; Kumar, S. Parametric study and characterization of wire arc additive manufactured steel structures. Int. J. Adv. Manuf. Technol. 2021, 115, 1723–1733. [Google Scholar] [CrossRef]
  22. Das, B.; Panda, B.N.; Dixit, U.S. Microstructure and Mechanical Properties of ER70S-6 Alloy Cladding on Aluminum Using a Cold Metal Transfer Process. J. Mater. Eng. Perform. 2022, 31, 9385–9398. [Google Scholar] [CrossRef]
  23. Rodrigues, T.A.; Duarte, V.; Avila, J.A.; Santos, T.G.; Miranda, R.; Oliveira, J. Wire and arc additive manufacturing of HSLA steel: Effect of thermal cycles on microstructure and mechanical properties. Addit. Manuf. 2019, 27, 440–450. [Google Scholar] [CrossRef]
  24. Shen, C.; Pan, Z.; Cuiuri, D.; Ding, D.; Li, H. Influences of deposition current and interpass temperature to the Fe3Al-based iron aluminide fabricated using wire-arc additive manufacturing process. Int. J. Adv. Manuf. Technol. 2016, 88, 2009–2018. [Google Scholar] [CrossRef]
  25. Wu, B.; Pan, Z.; Ding, D.; Cuiuri, D.; Li, H.; Fei, Z. The effects of forced interpass cooling on the material properties of wire arc additively manufactured Ti6Al4V alloy. J. Mech. Work. Technol. 2018, 258, 97–105. [Google Scholar] [CrossRef]
  26. Raja, M.; Tiwari, Y.; Mukherjee, M.; Maji, B.; Chatterjee, A. Effect of bidirectional and switchback deposition strategies on microstructure and mechanical properties of wire arc additive manufactured Inconel 625. Int. J. Adv. Manuf. Technol. 2022, 119, 4845–4861. [Google Scholar] [CrossRef]
Figure 1. Representation of the deposition site: (a) experimental setup for preliminary trials and (b) schematic representation of the deposition equipment used, adapted from Novelino et al. [12].
Jmmp 09 00093 g001
Figure 2. Schematic representation of wall deposition method for: (a) wall 1, (b) wall 2, (c) wall 3 and (d) wall 4.
Jmmp 09 00093 g002
Figure 3. Wall measurement diagram: (a) Front view and (b) Top view.
Jmmp 09 00093 g003
Figure 4. Scheme of the sample preparation for microhardness measurements: (a) Extracted wall, (b) cold-mounted wall section and (c) mounted wall section after sanding.
Jmmp 09 00093 g004
Figure 5. Scheme of the microhardness measurements: (a) dimensions indicating the three evaluation regions and (b) detail of microhardness indentation regions.
Jmmp 09 00093 g005
Figure 6. Microhardness distance between adjacent prints.
Jmmp 09 00093 g006
Figure 7. Deposited walls.
Jmmp 09 00093 g007
Figure 8. Wall height comparison.
Jmmp 09 00093 g008
Figure 9. Wall width comparison.
Jmmp 09 00093 g009
Figure 10. Schematic representation of the general microhardness analysis. In the figure, from left to right: wall 1, 2, 3 and 4.
Jmmp 09 00093 g010
Figure 11. Average microhardness for the respective regions: (a) with 68% confidence interval and (b) with 99.7% confidence interval.
Jmmp 09 00093 g011
Figure 12. Comparison of mean microhardness: (a) with a 68% confidence interval and (b) with a 99.7% confidence interval.
Jmmp 09 00093 g012
Figure 13. Comparison of the average microhardness along with the thickness: (a) with a 68% confidence interval and (b) with a 99.7% confidence interval.
Jmmp 09 00093 g013
Figure 14. Comparison of mean microhardness along height: (a) with a 68% confidence interval and (b) with a 99.7% confidence interval.
Jmmp 09 00093 g014
Figure 15. Microhardness mapping for walls deposited with different conditions.
Jmmp 09 00093 g015
Table 1. Wall deposition parameters.
ParameterWall 1Wall 2Wall 3Wall 4
Step over (mm)1.501.501.201.20
Current (A)75.0075.0075.0075.00
Tension (V)14.0013.7613.5013.84
TTS (mm/s)8.008.008.00 horizontal 8.00 horizontal
DirectionUnidirectionalUnidirectionalBidirectionalBidirectional
ArcInterrupted InterruptedContinuousInterrupted
Disclaimer/Publisher’s Note: The statements, opinions and data contained in all publications are solely those of the individual author(s) and contributor(s) and not of MDPI and/or the editor(s). MDPI and/or the editor(s) disclaim responsibility for any injury to people or property resulting from any ideas, methods, instructions or products referred to in the content.

