
Prediction and Modelling with Taguchi, ANN and ANFIS of Optimum Machining Parameters in Drilling of Al 6082-T6 Alloy


Abstract
1. Introduction
2. Materials and Methods
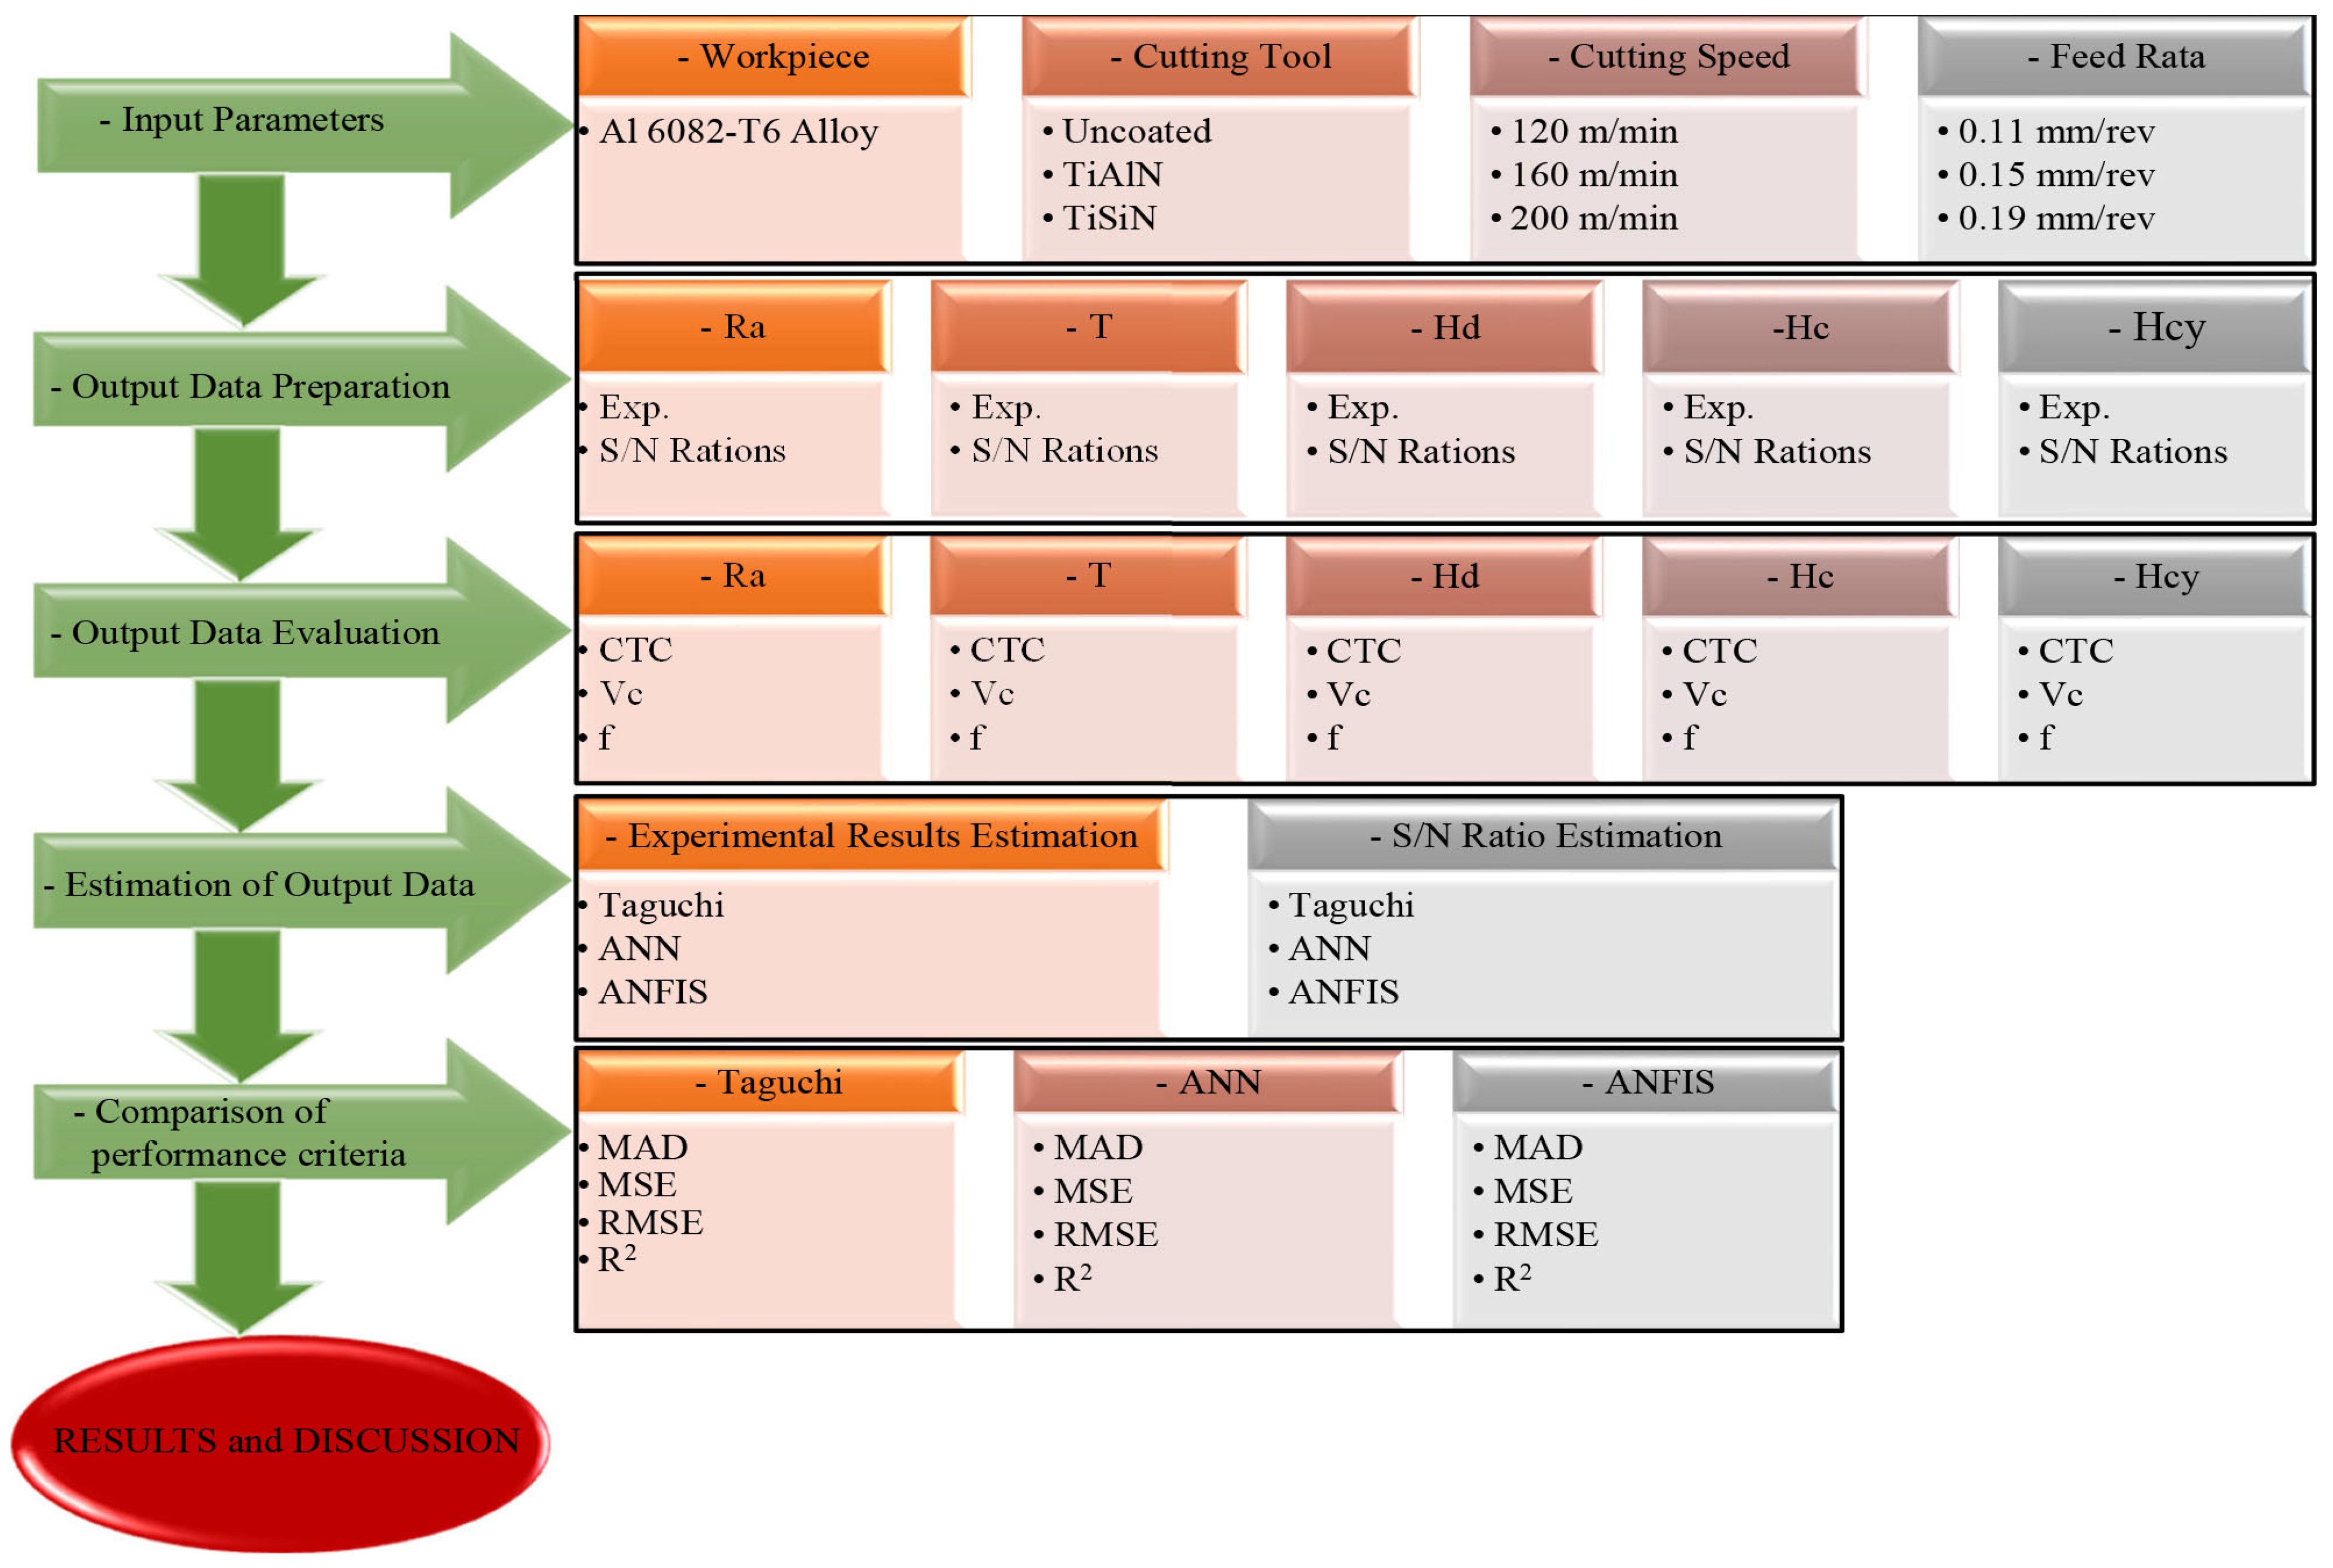
2.1. Workpiece, Cutting Tool, Machine Tool and Experimental Measurements
2.2. Experimental Design
2.3. Calculating S/N Ratios
3. Results and Discussions
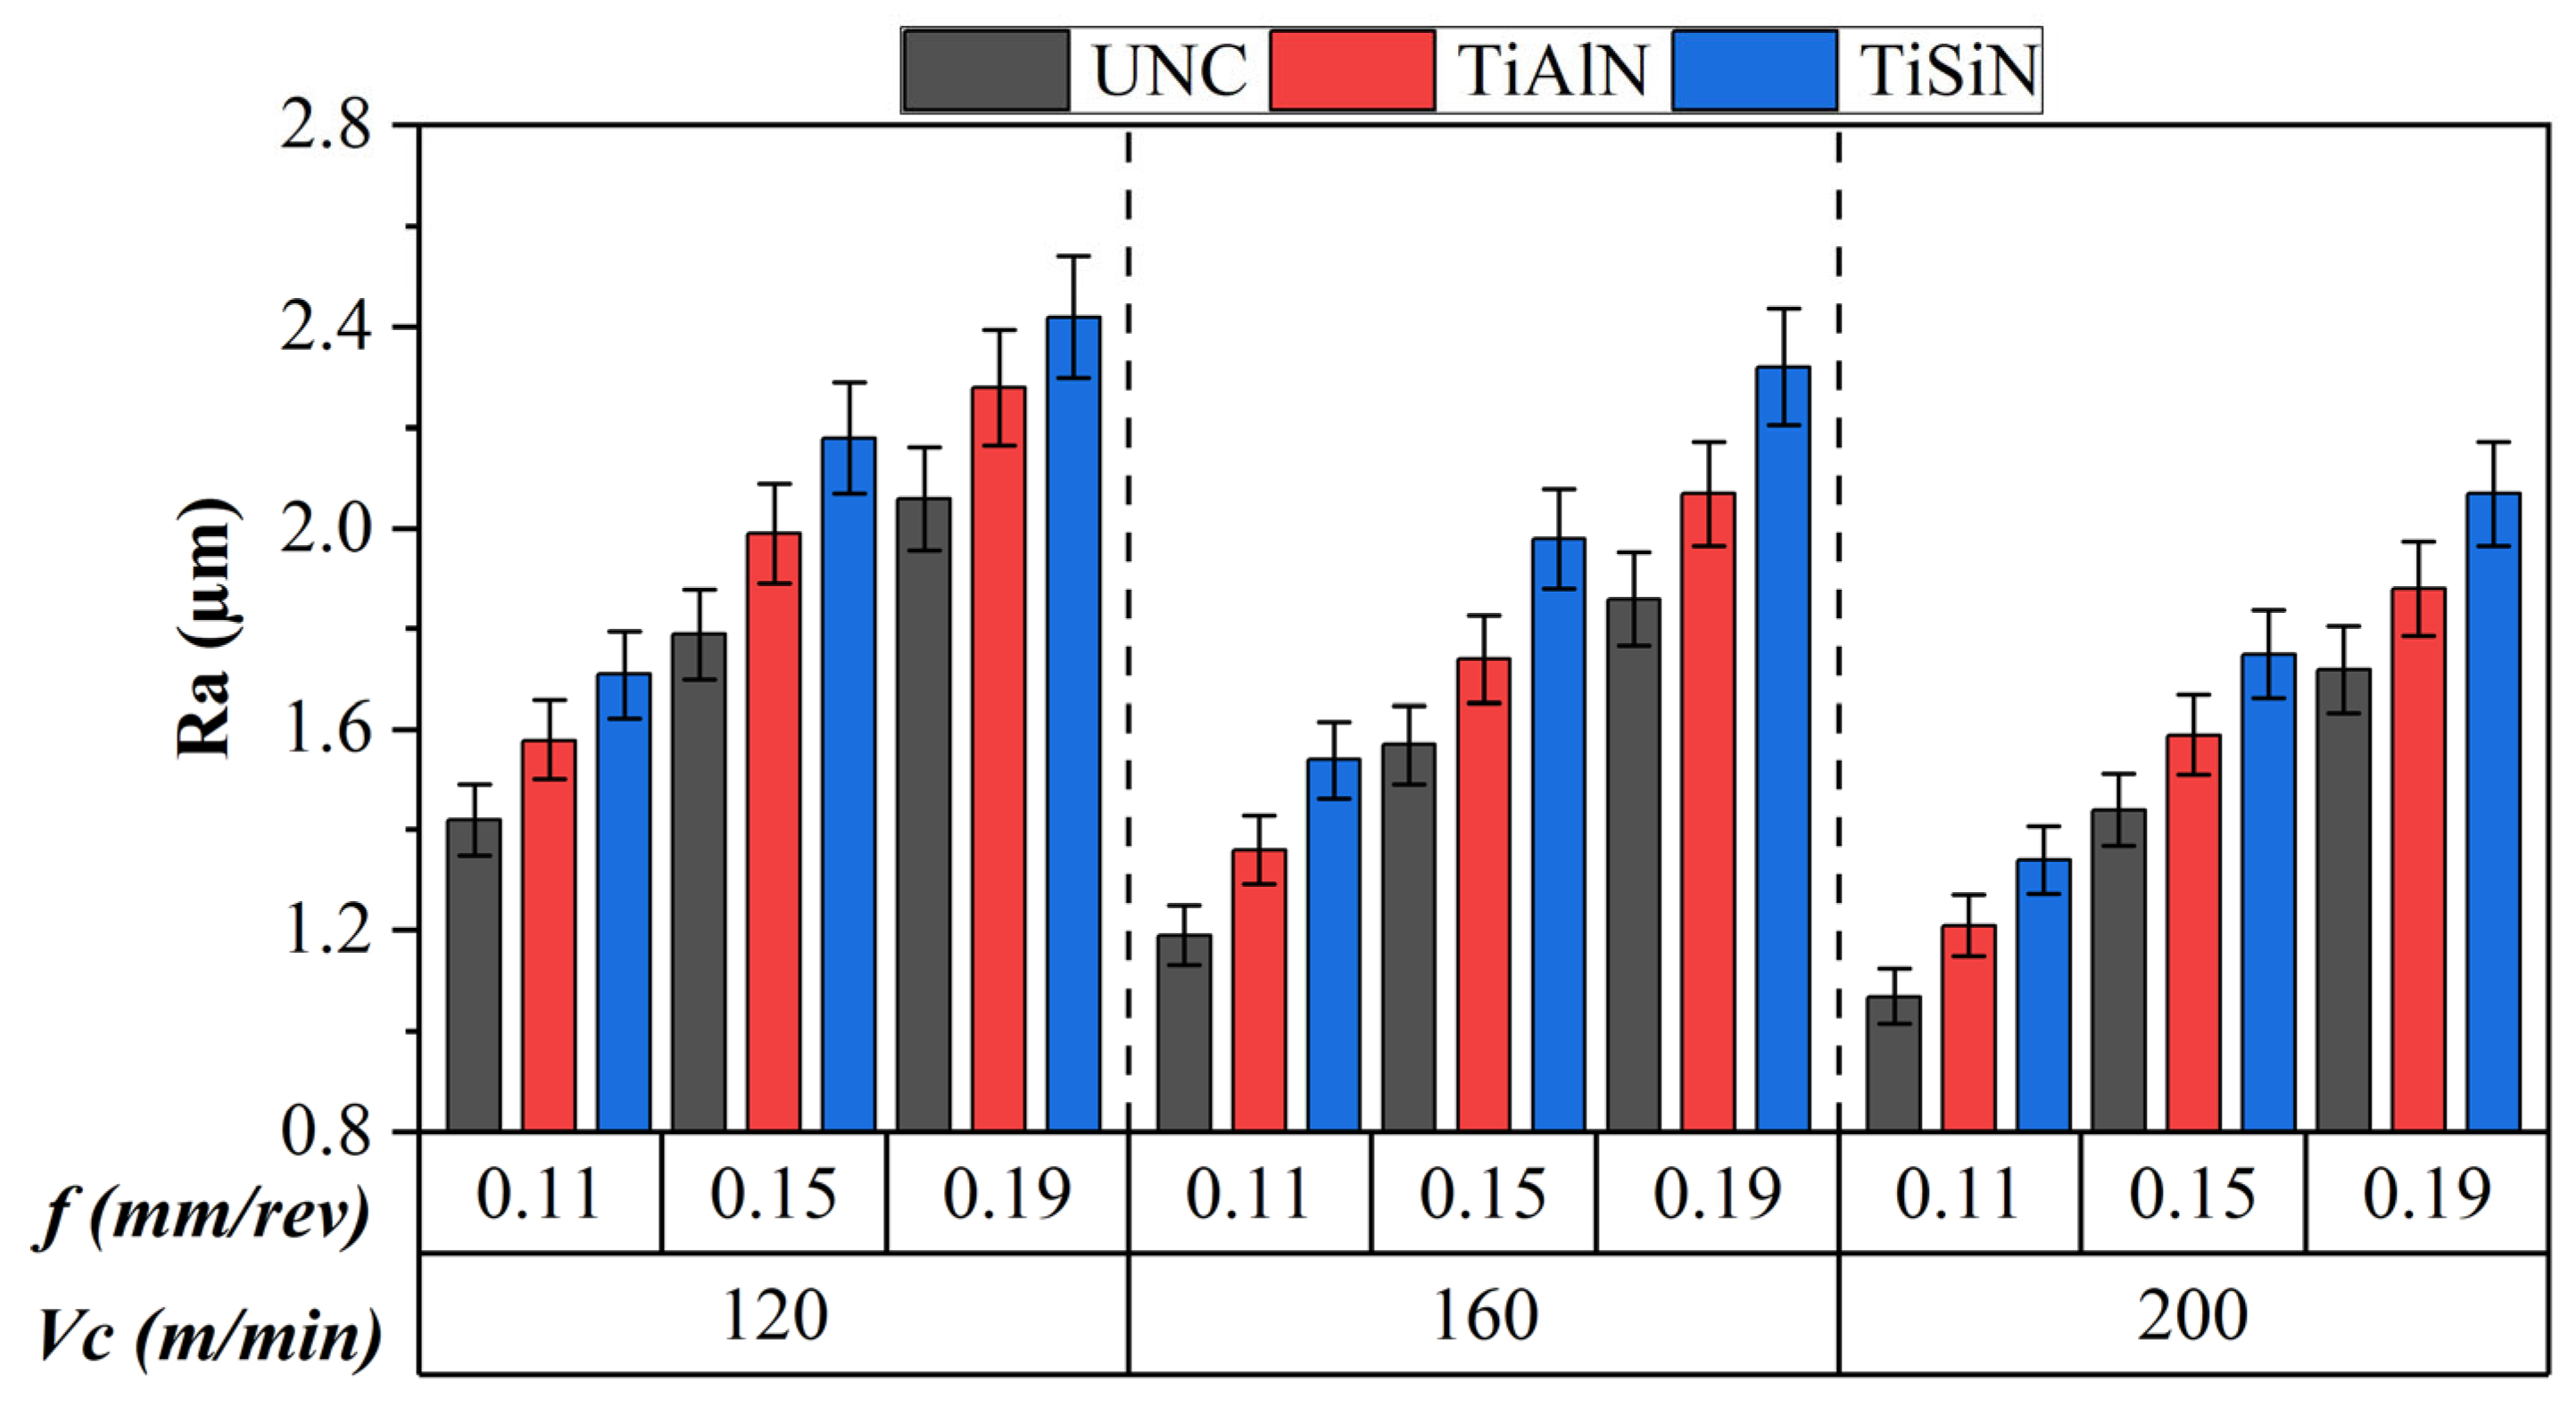
3.1. Surface Roughness
3.2. Cutting Temperature
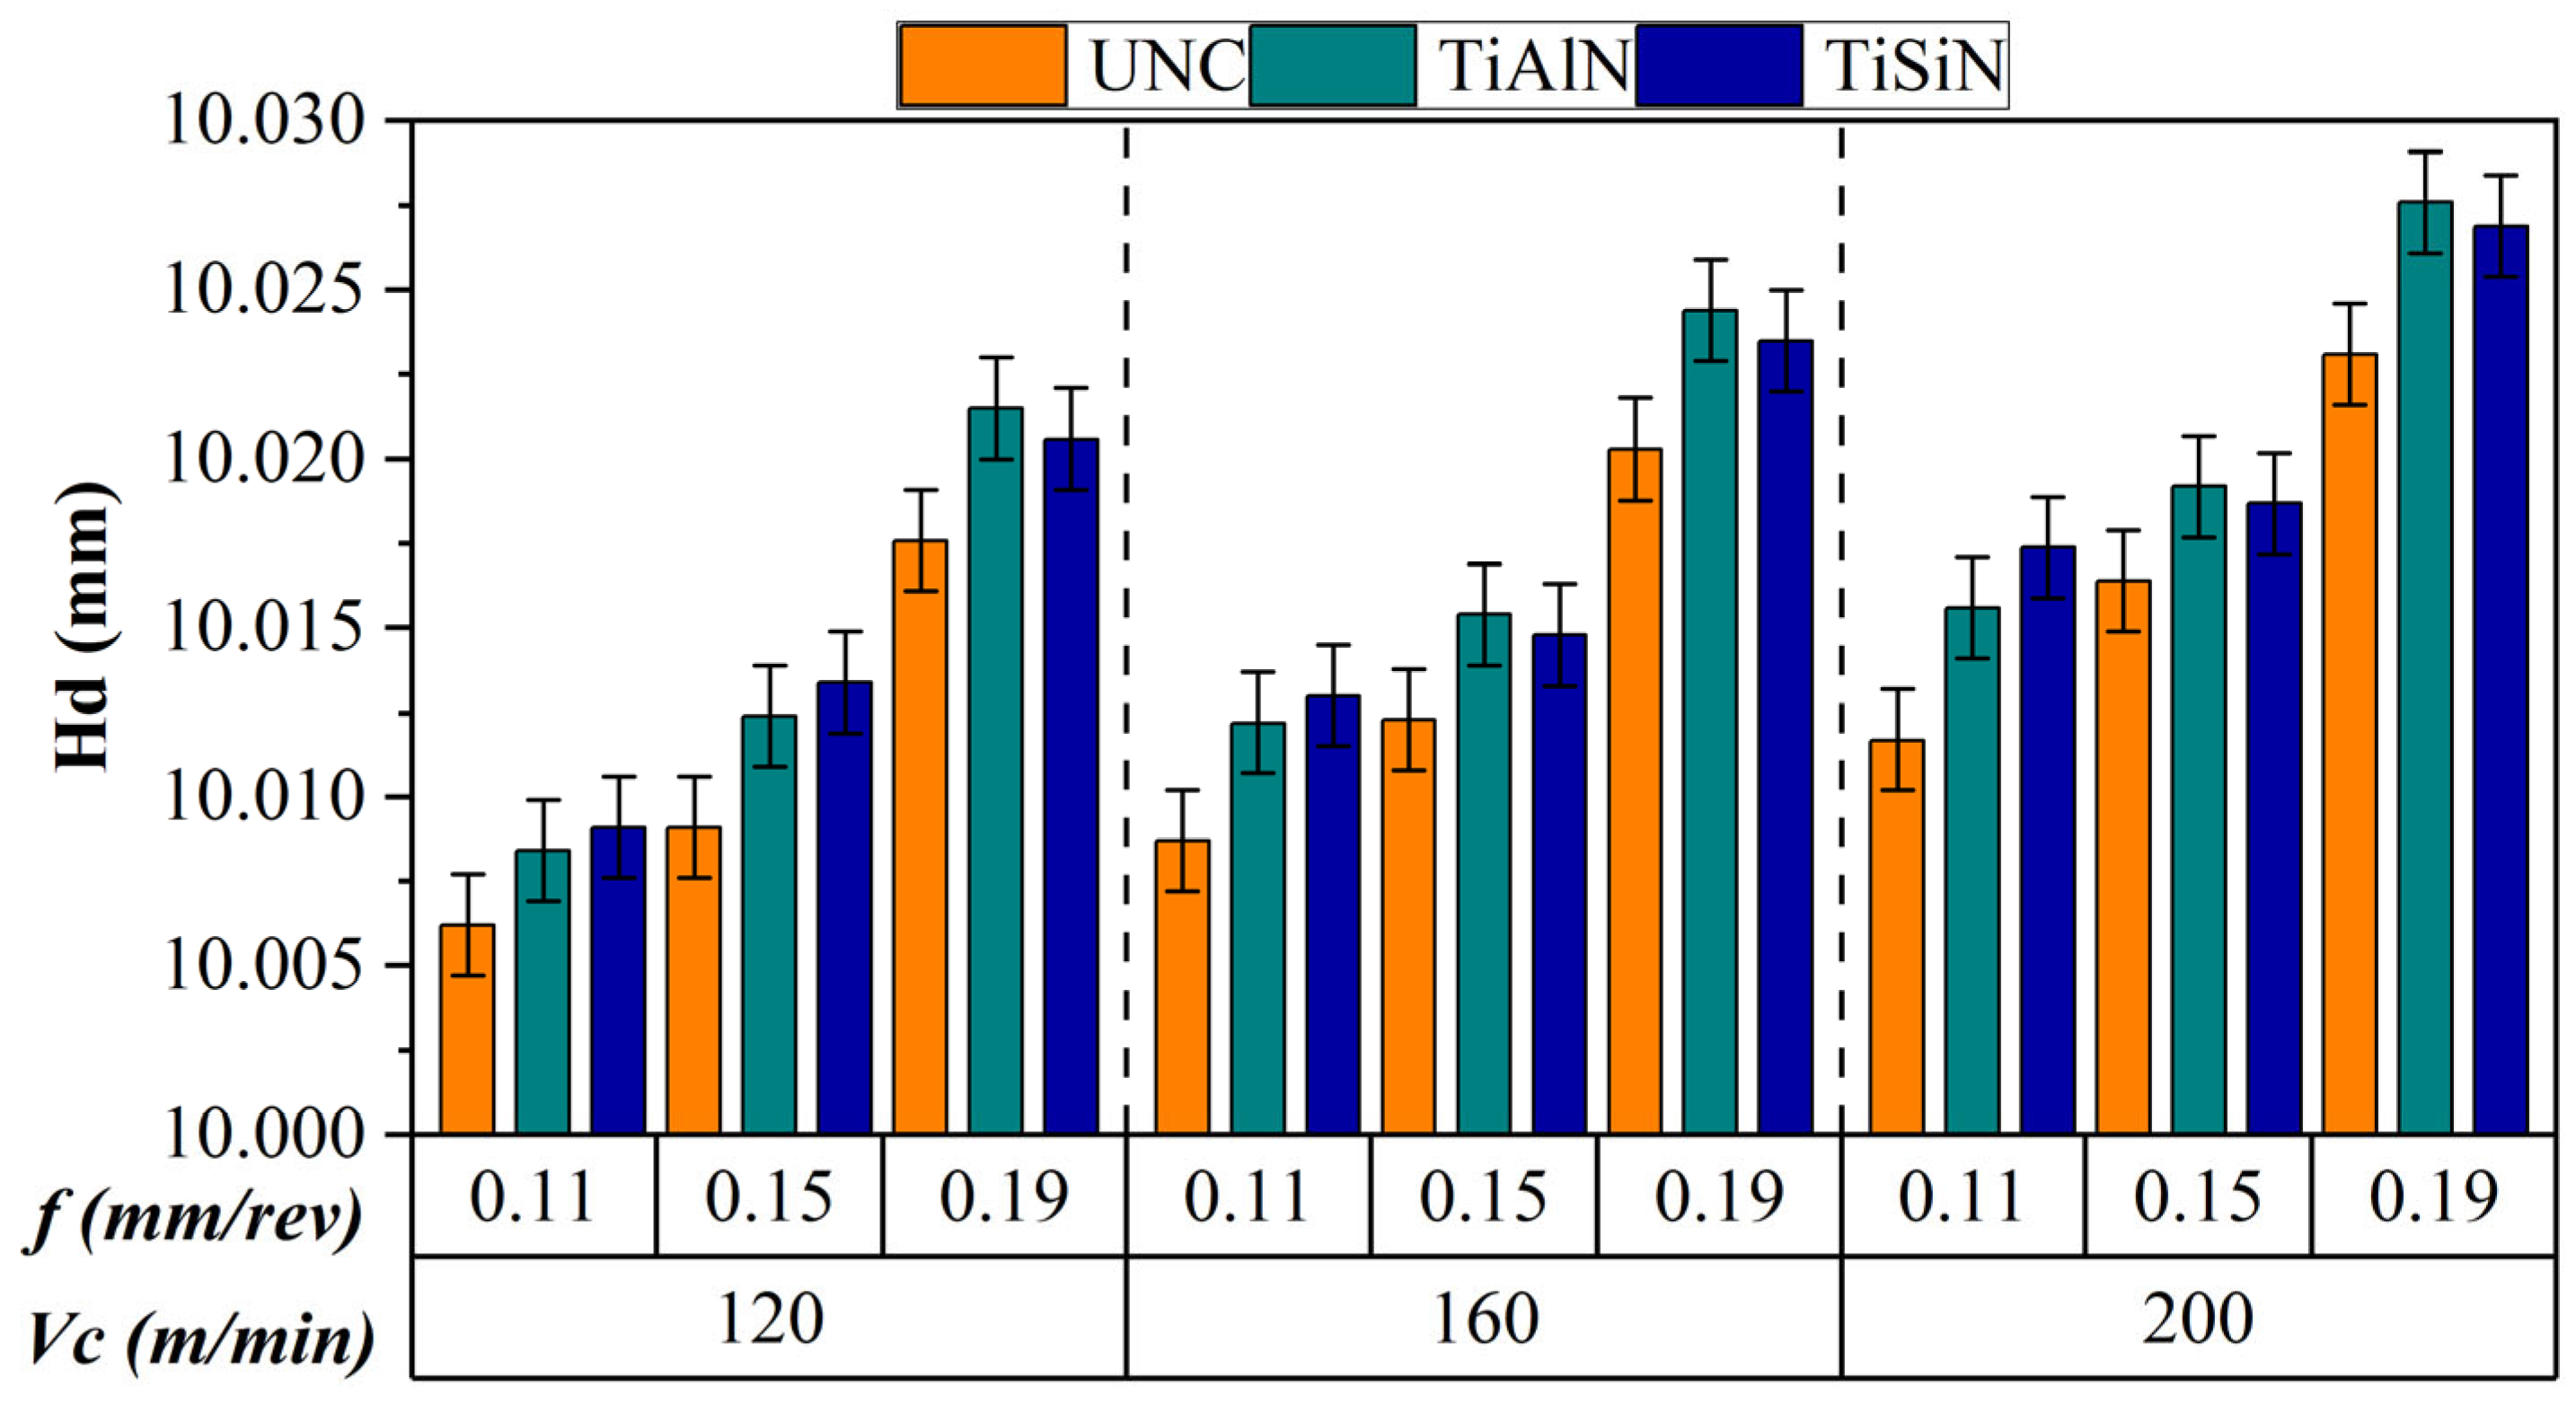
3.3. Hole Diameter Error
3.4. Hole Circularity Error
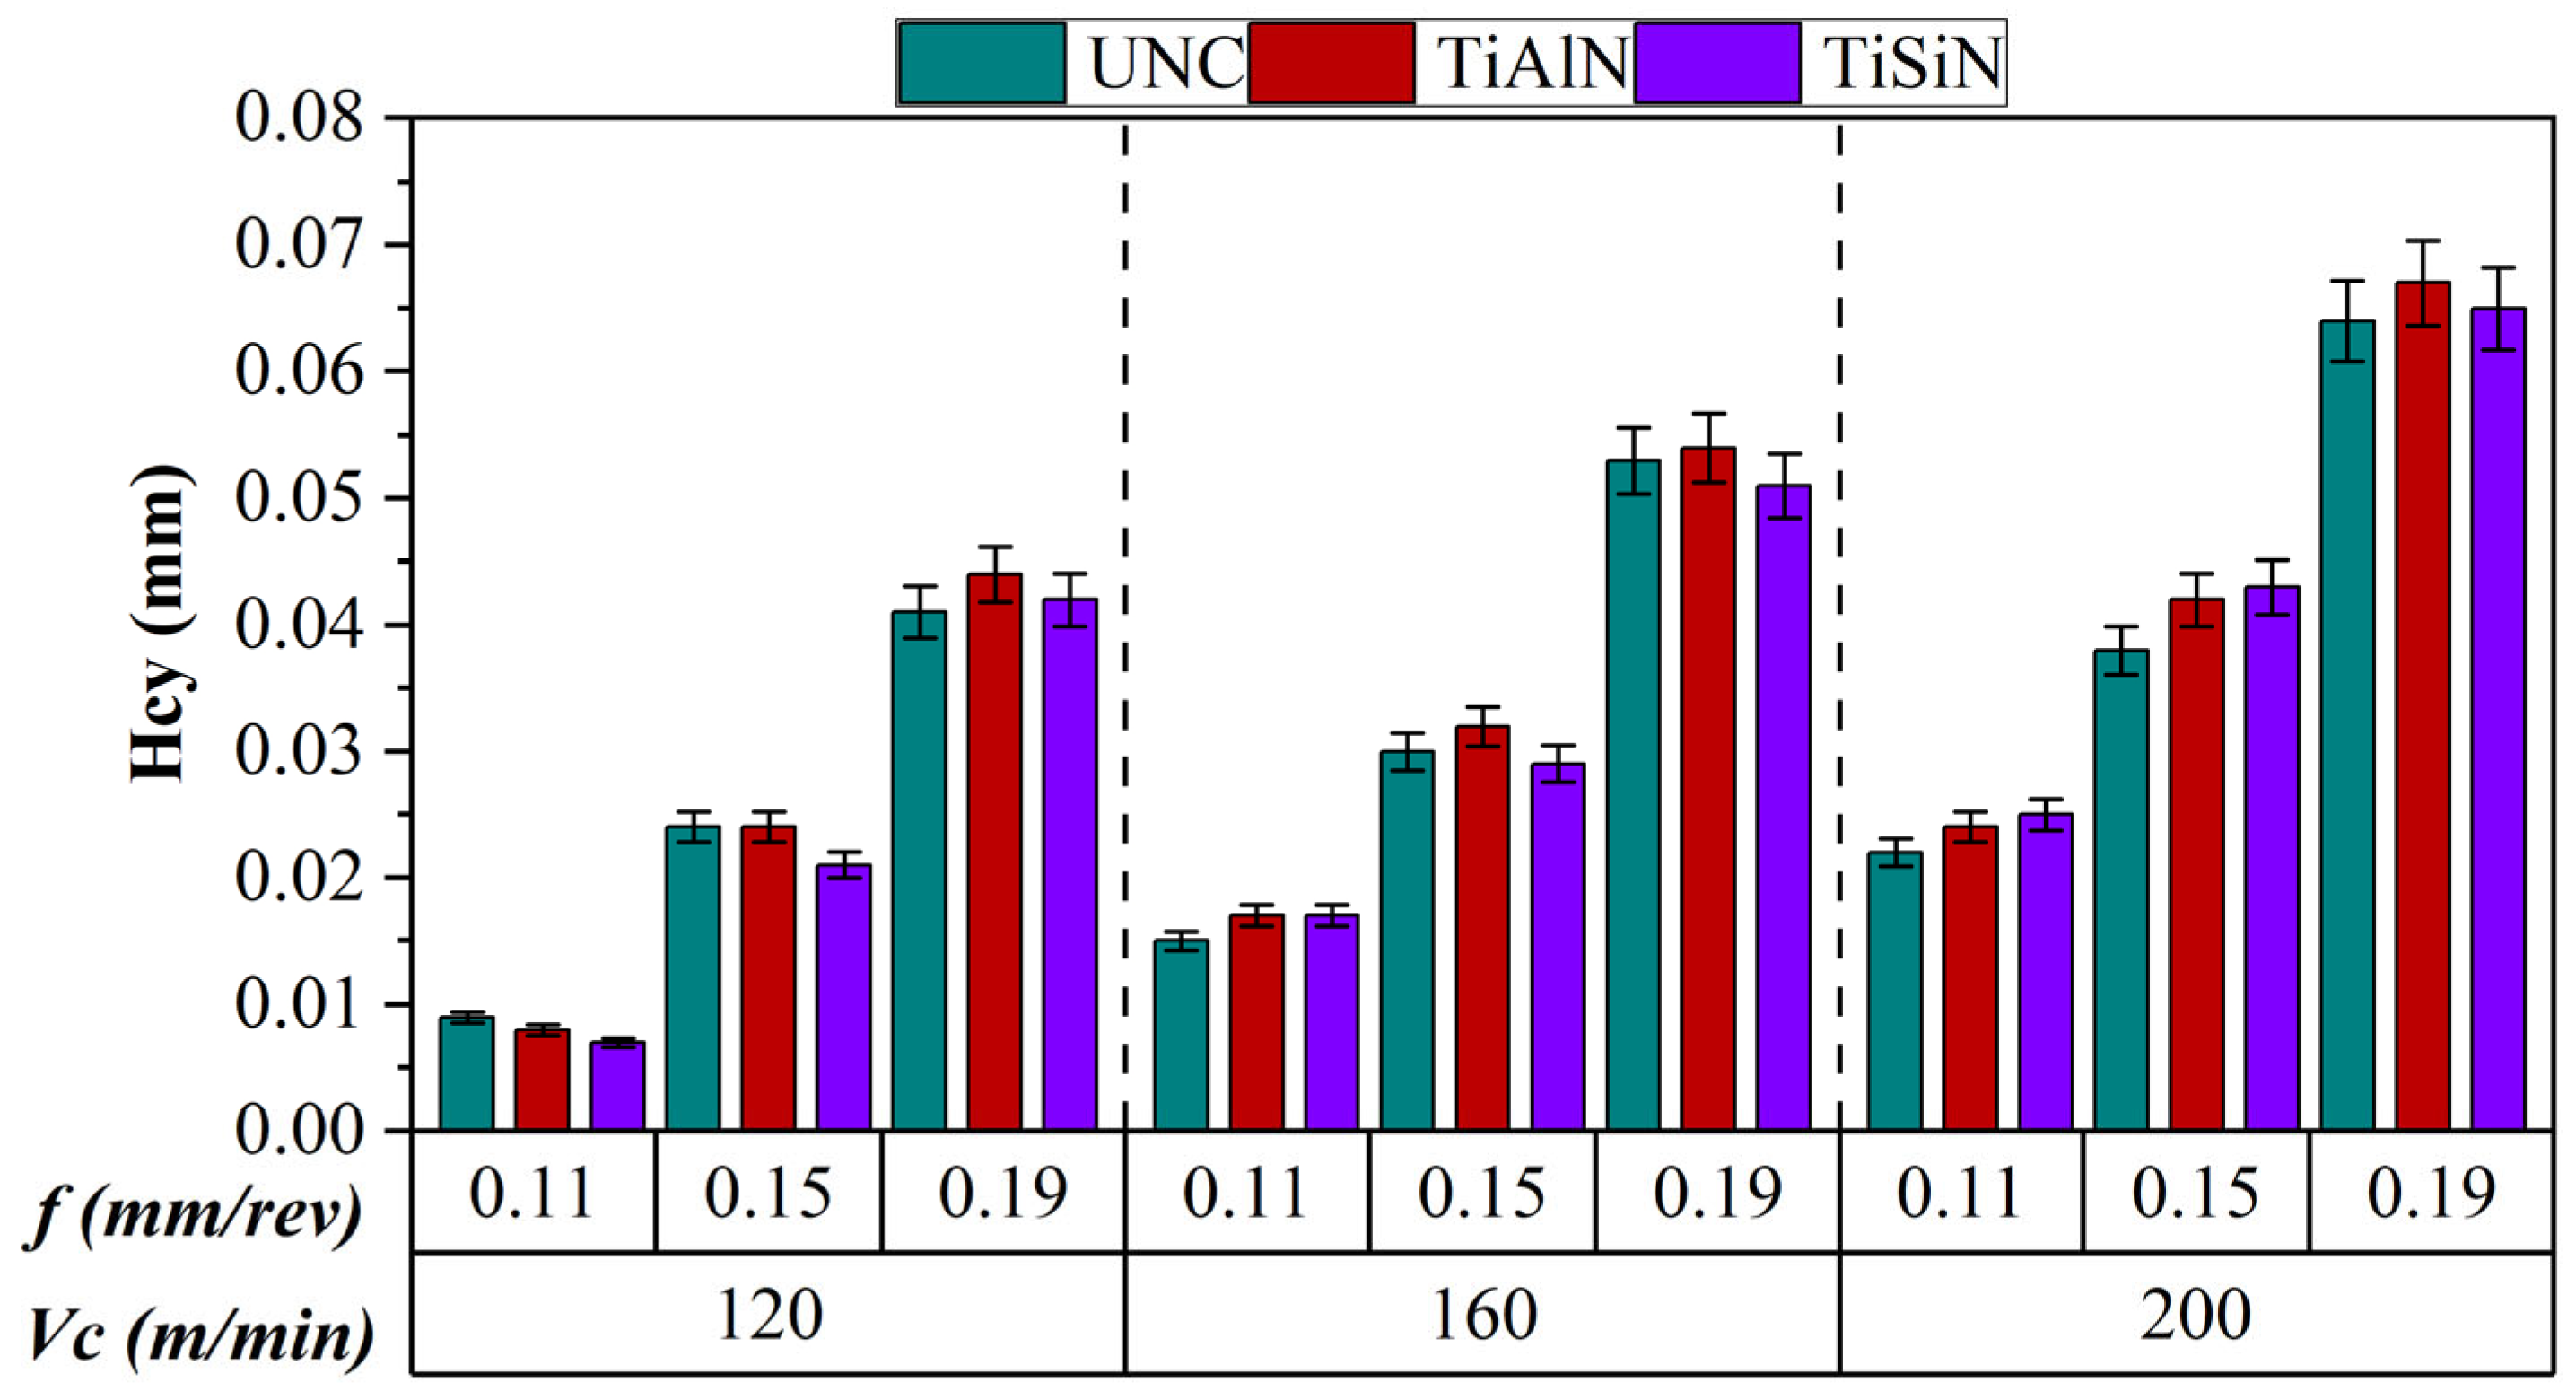
3.5. Hole Cylindricity Error
3.6. Statistical Analysis
3.7. Determination of Optimum Cutting Parameters Using Taguchi
3.8. Determination of Optimum Cutting Parameters by Taguchi
3.9. Estimation with Taguchi Method
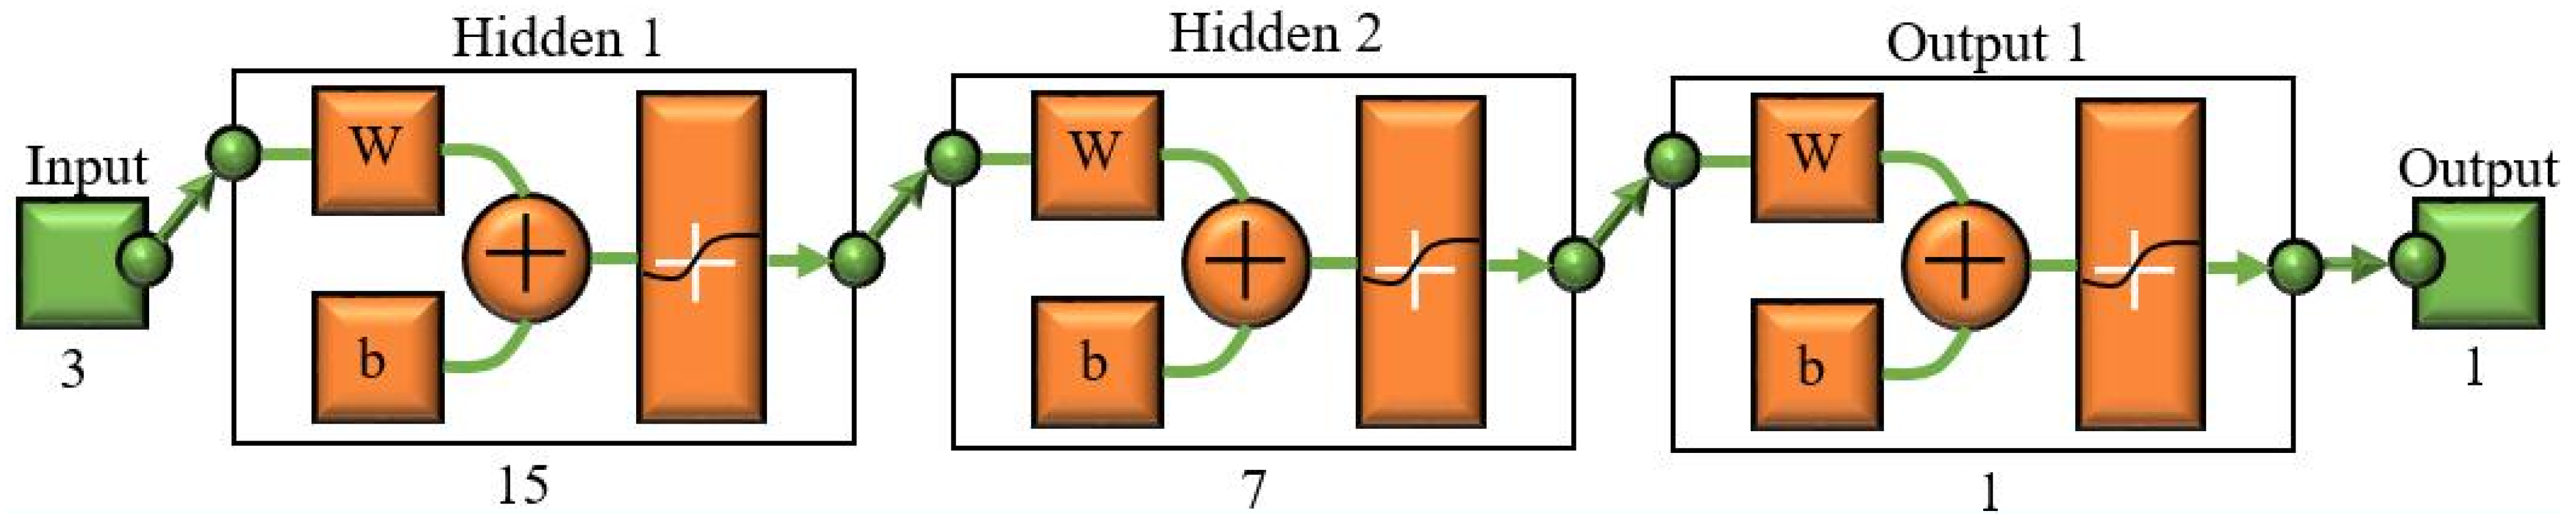
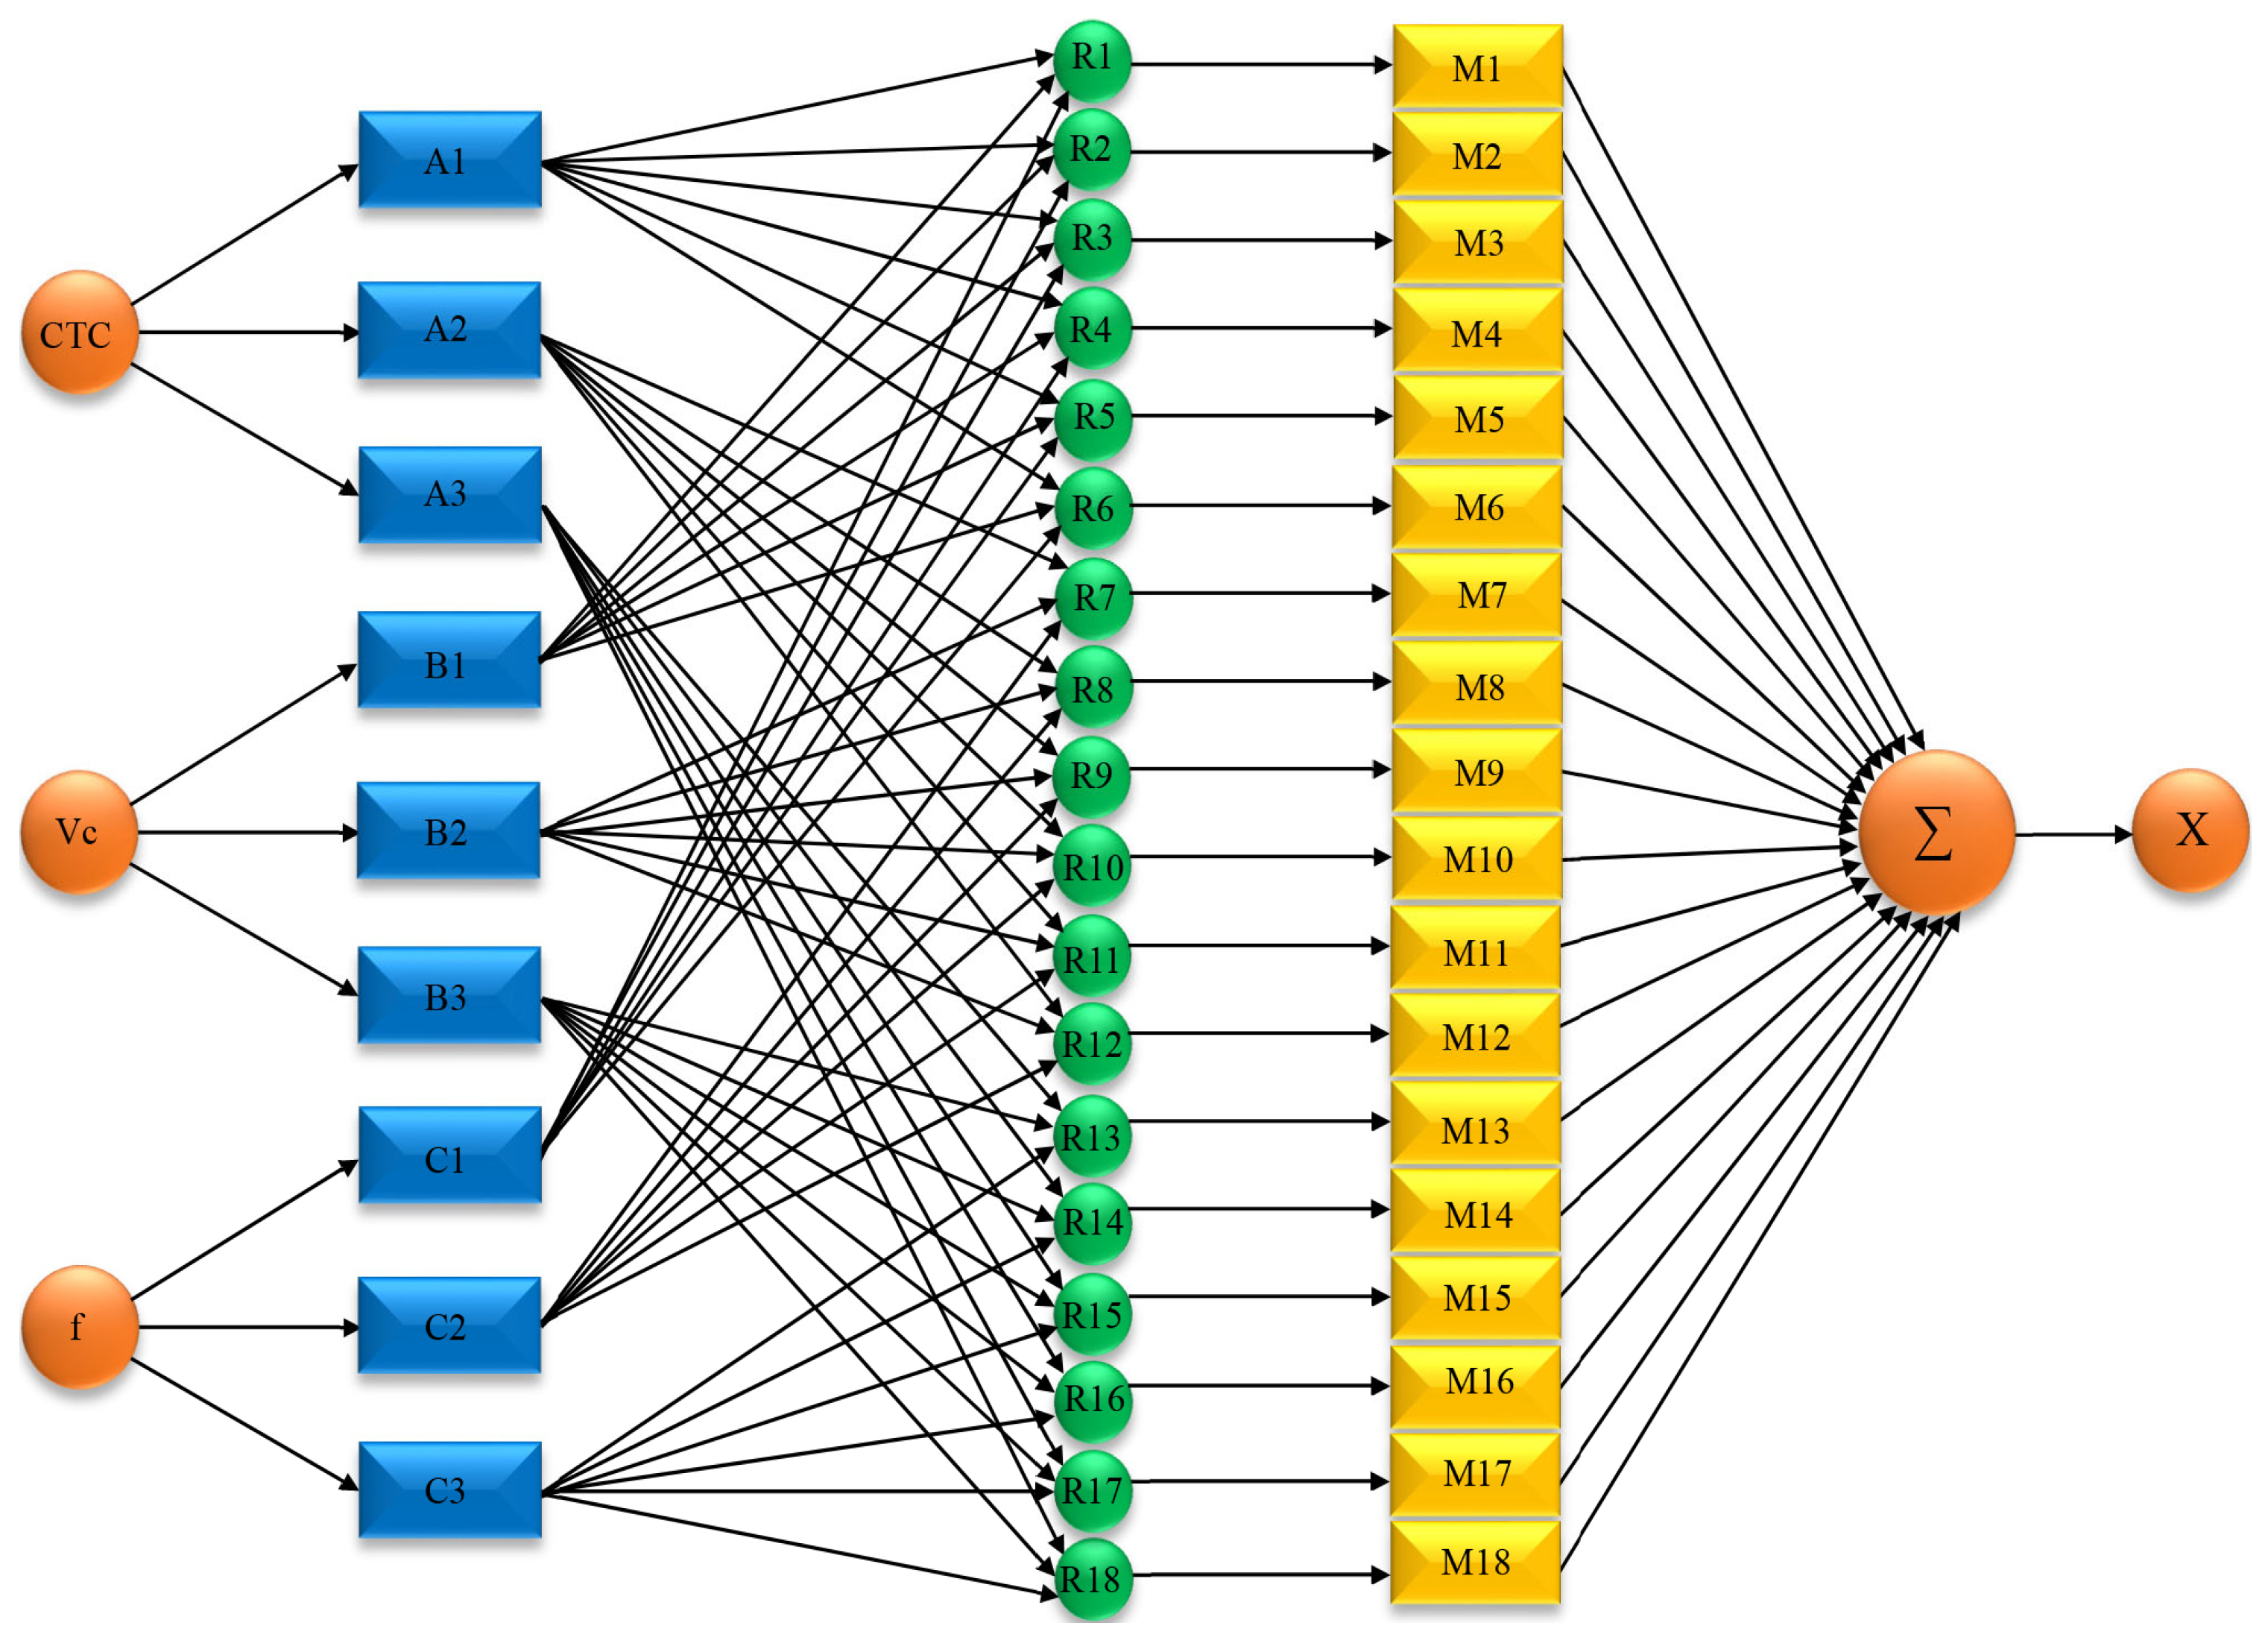
3.10. Prediction with ANN Method
3.11. ANFIS-Based Estimation Method
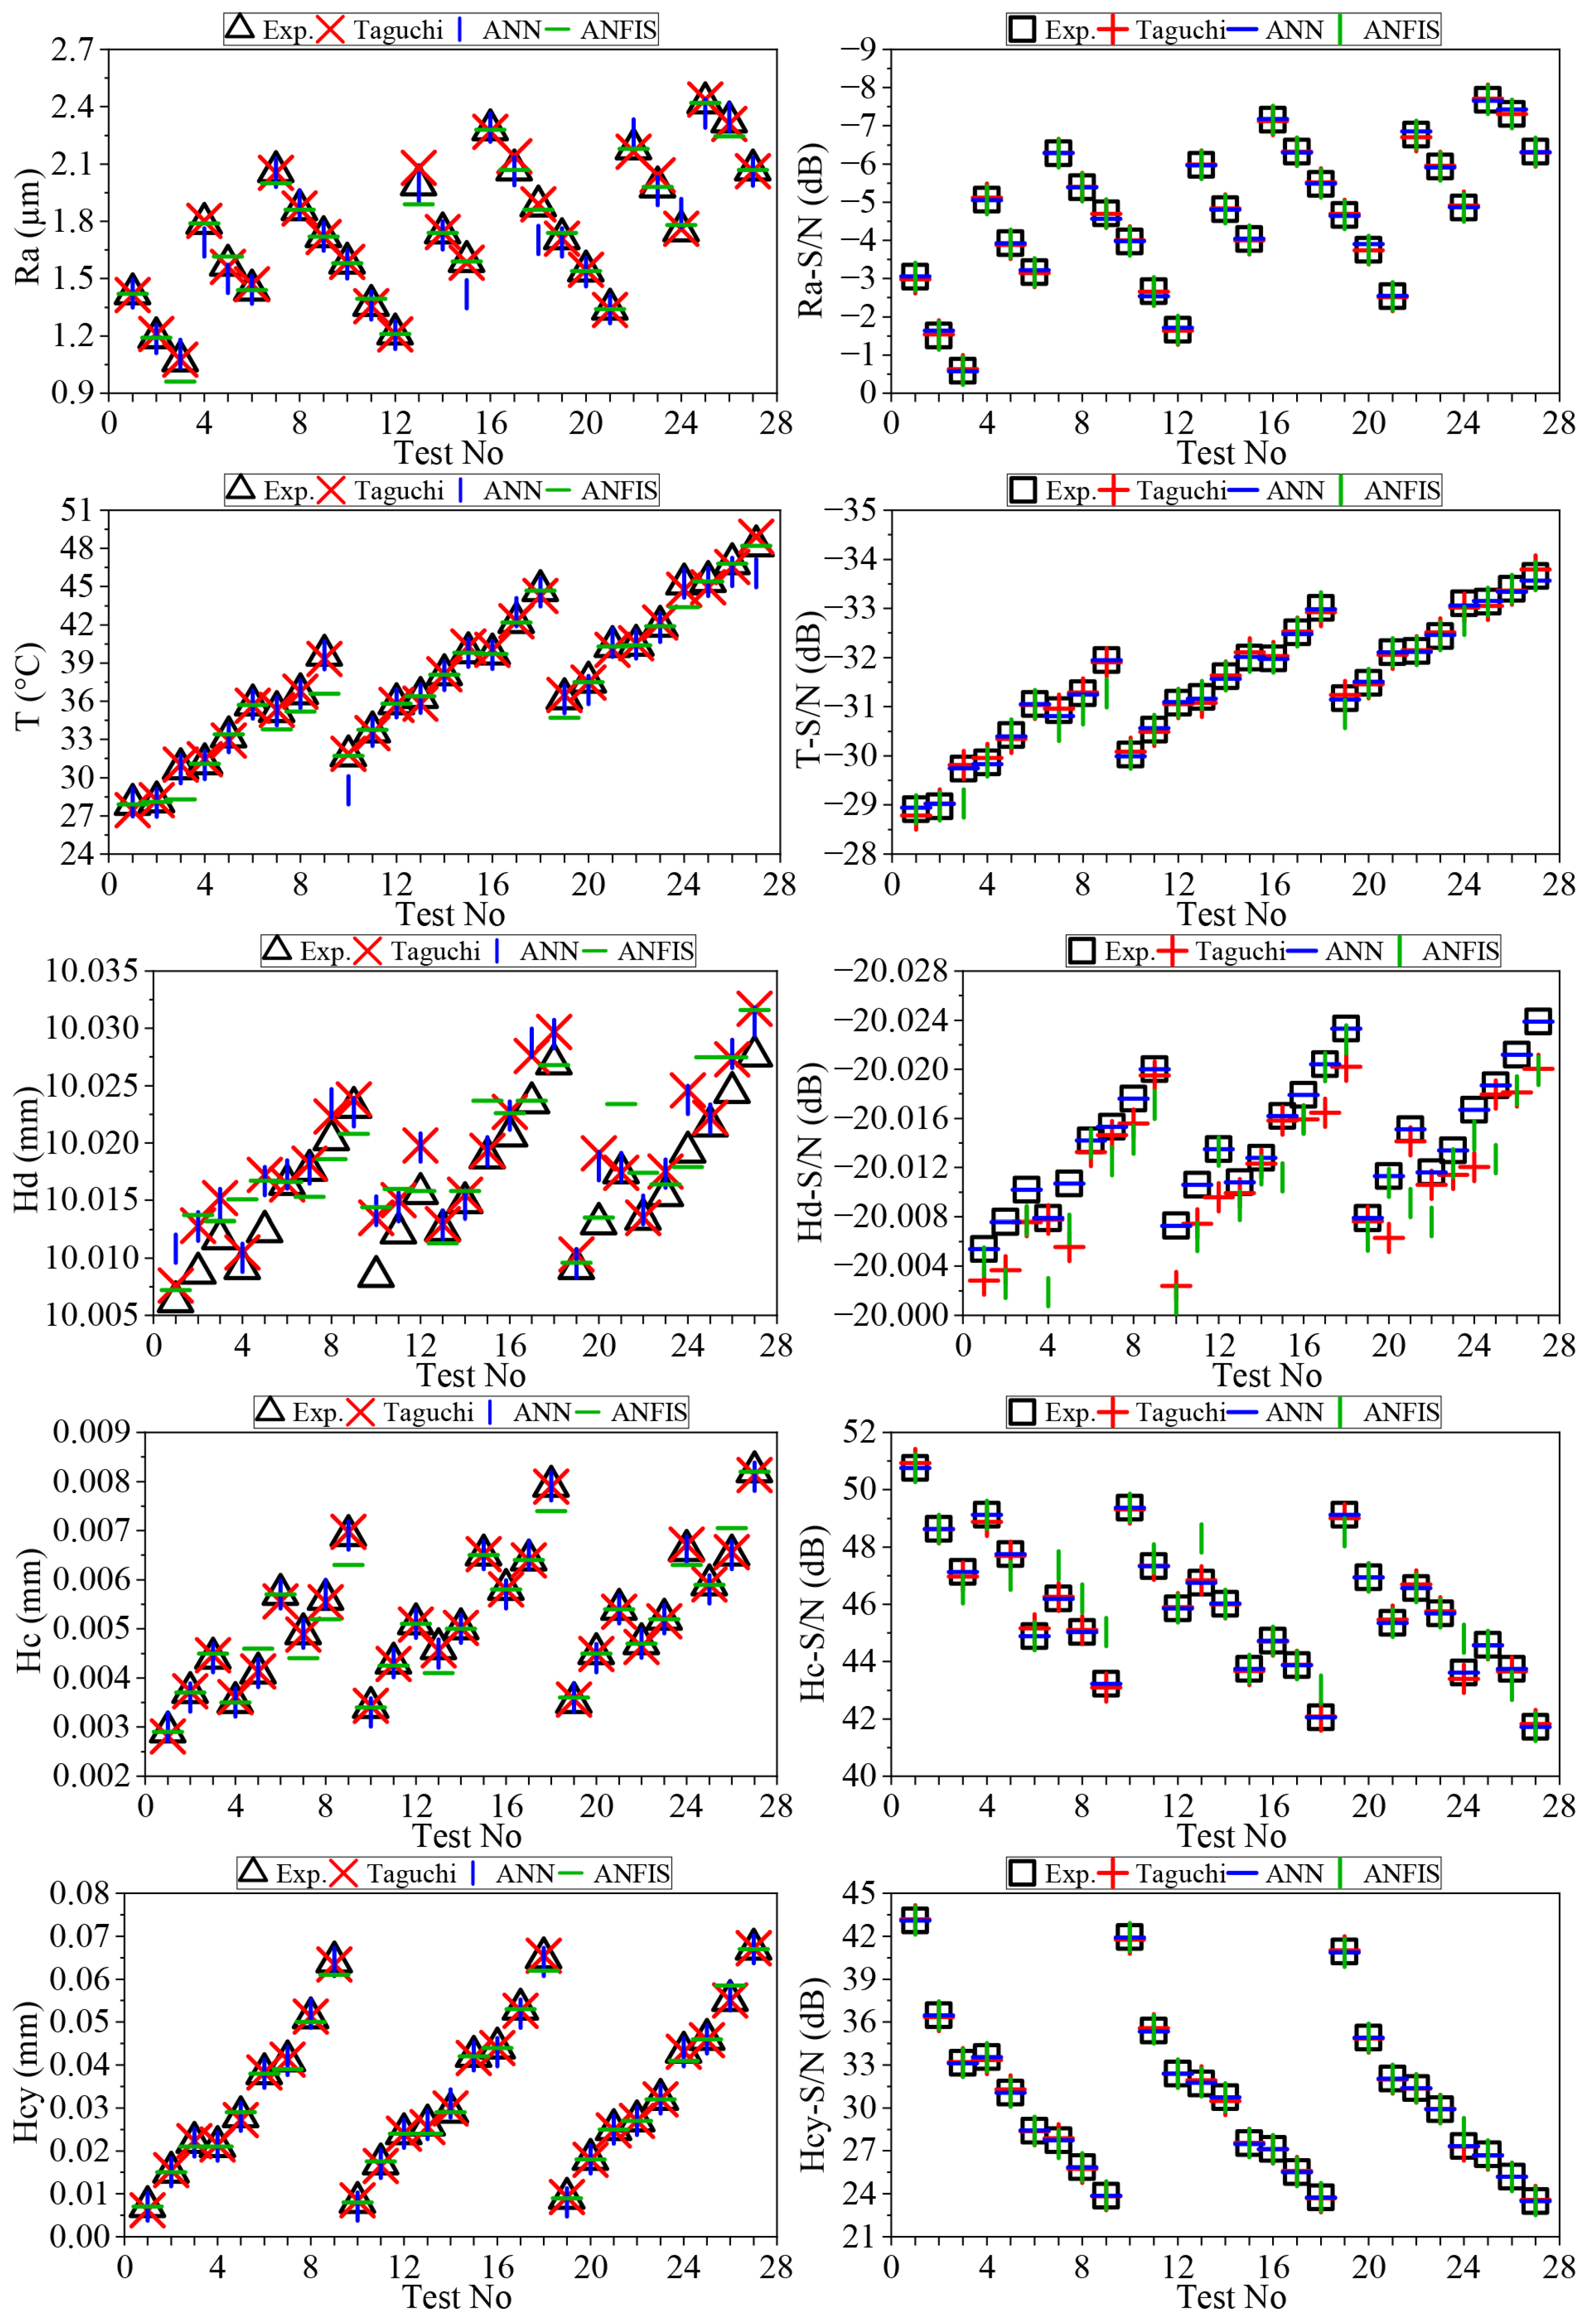
3.12. Comparison of Estimation Methods
4. Conclusions
- In the experiments conducted with all cutting tool coatings, it was observed that increasing the cutting speed and feed rate increased the cutting temperature, hole diameter error, hole circularity error and hole cylindricity error. While increasing the cutting speed had a positive effect on the surface roughness, increasing the feed rate caused the surface roughness to increase.
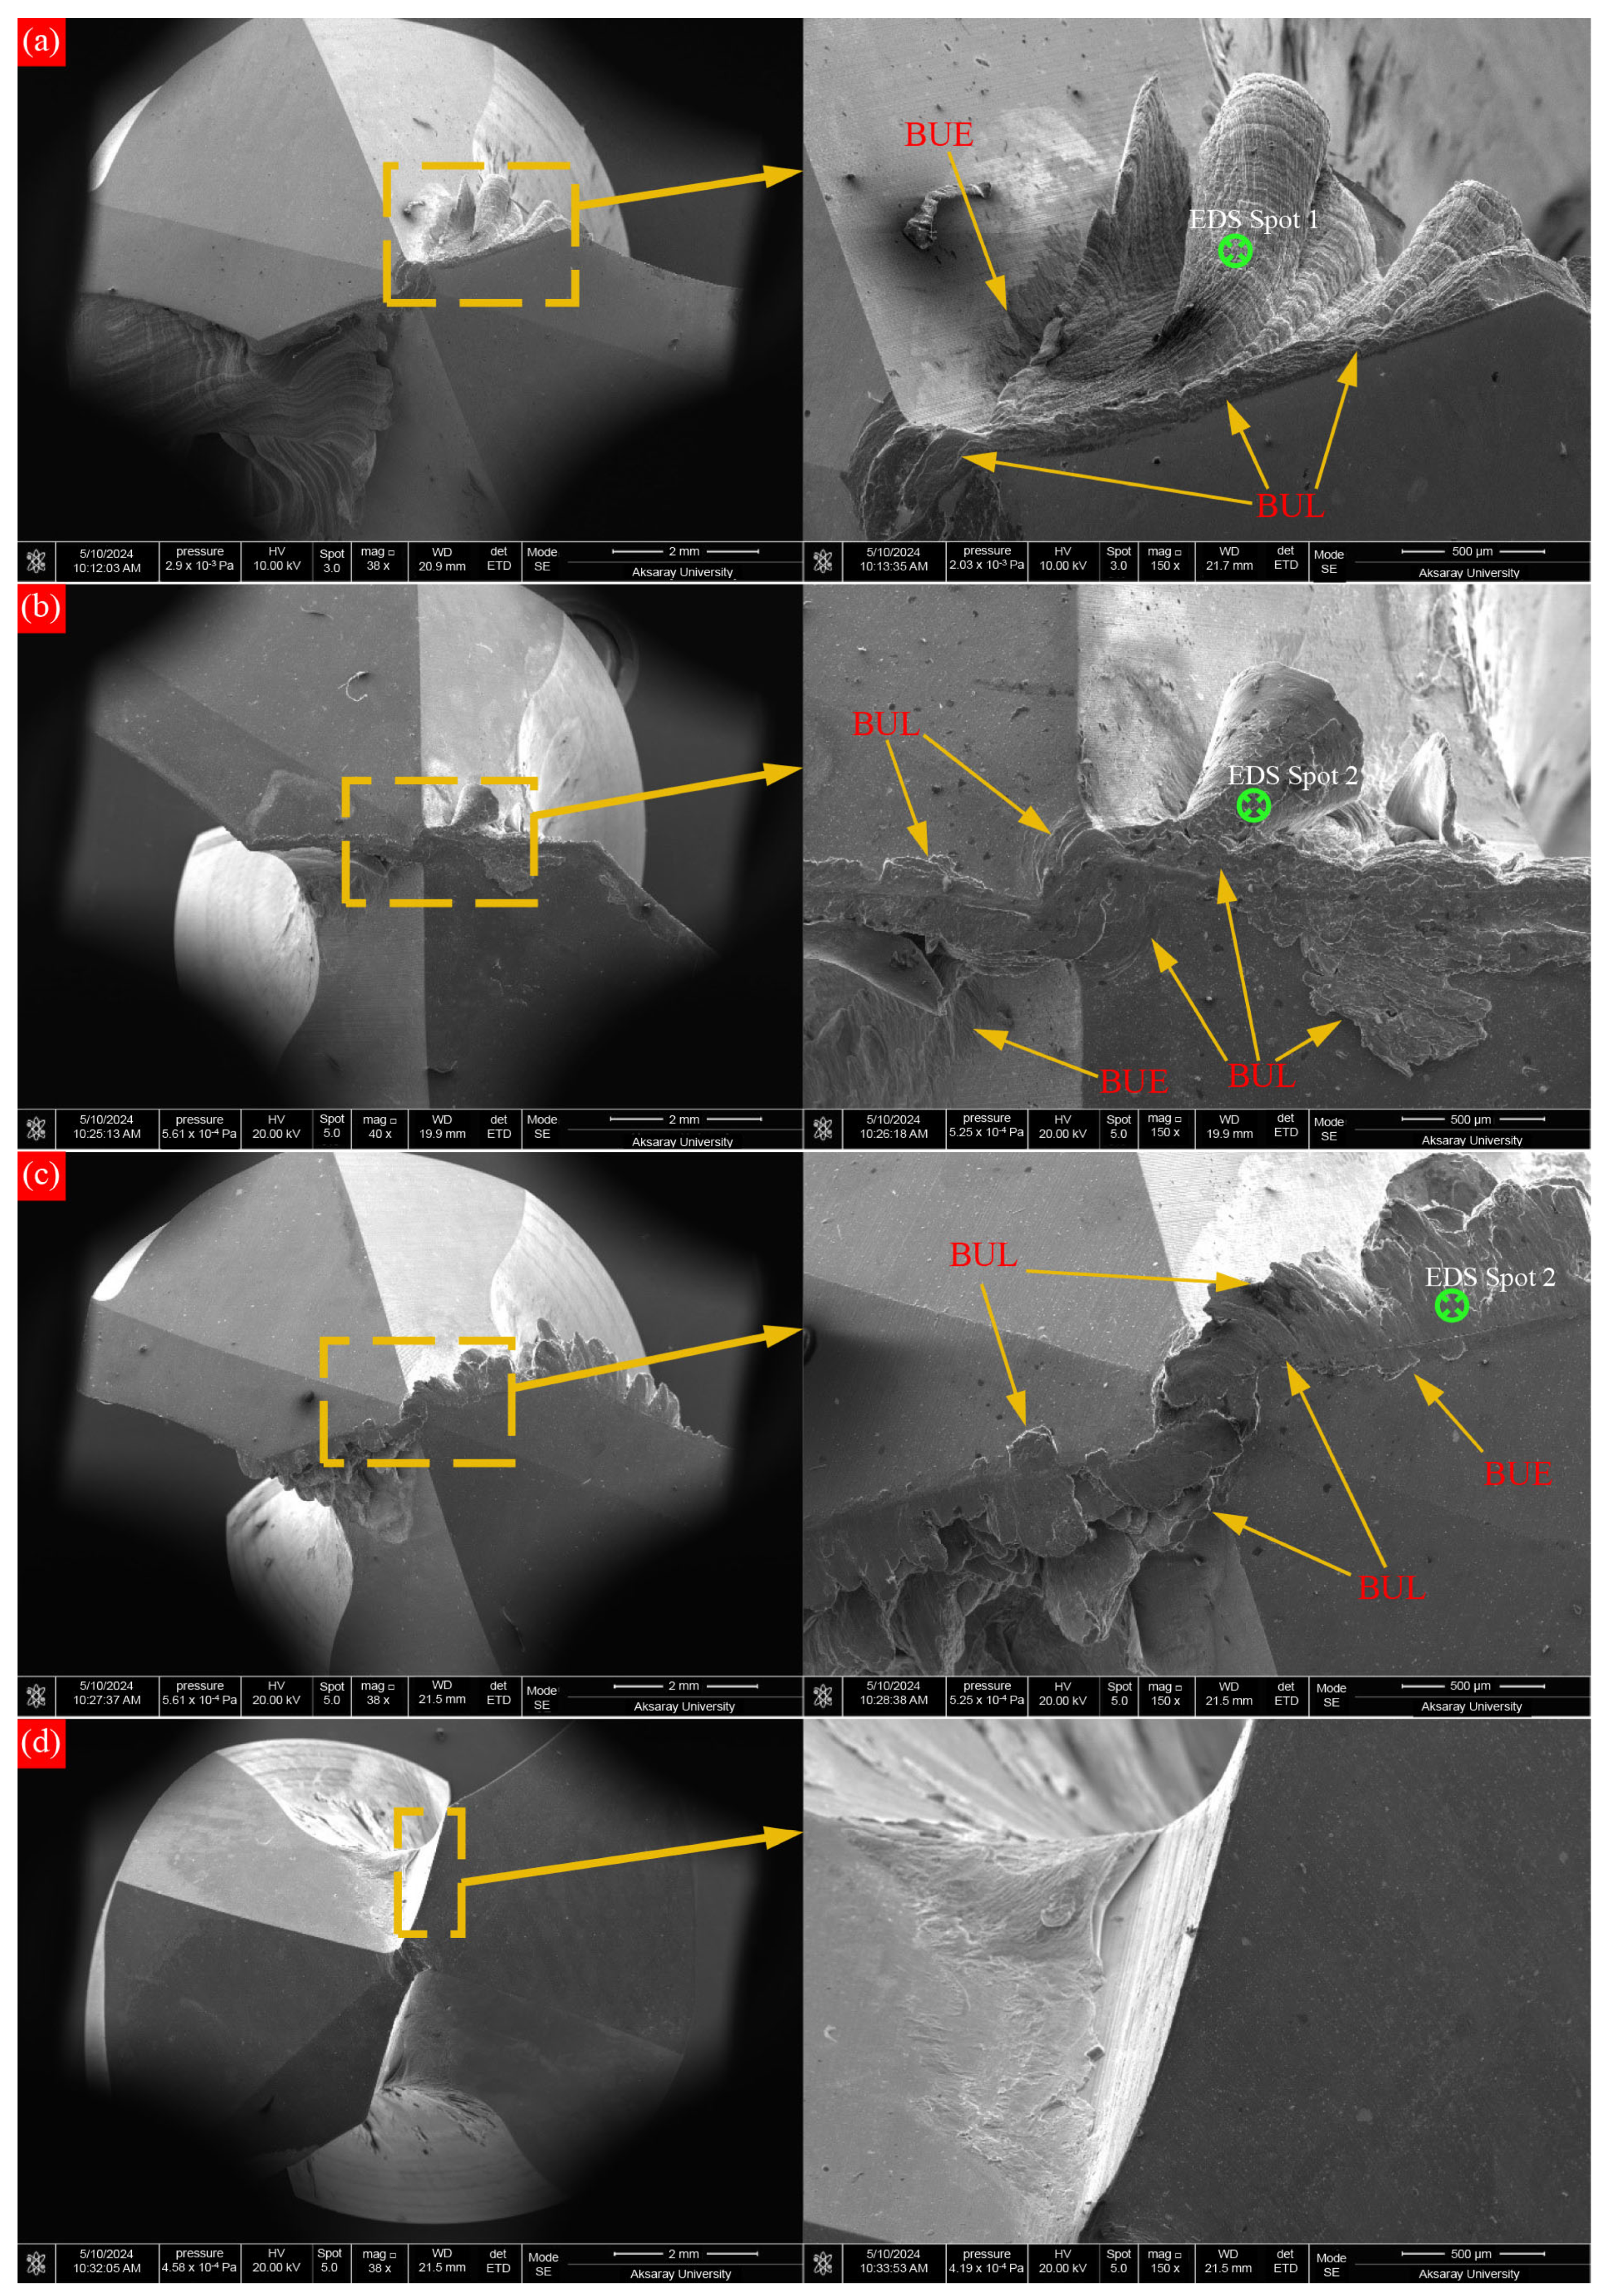
- In drilling operations performed with all cutting tool coatings, BUE and BUL formations were observed in cutting tools at a low cutting speed and a high feed rate.
- In the drilling experiments, the lowest surface roughness and cutting temperature values were measured in the coated cutting tool. The maximum surface roughness and cutting temperature occurred in the TiSiN-coated cutting tool.
- The lowest values for hole diameter error and hole circularity error occurred in the drilling process performed with the uncoated cutting tool. The maximum hole diameter error and cylindricity error were measured in the drilling process performed with the TiAlN-coated cutting tool.
- It was observed that minimum hole circularity error values were obtained in drilling operations performed with TiAlN-coated cutting tools, while maximum cylindricity values were obtained in drilling operations performed with uncoated cutting tools.
- As a result of the analysis, it was determined that the optimum cutting parameters were A1B1C3 (Uncoated, 0.11 mm/rev, 200 m/min) for surface roughness, A1B1C1 (Uncoated, 0.11 mm/rev, 120 m/min) for cutting temperature, hole diameter error, hole circularity error and hole cylindricity error.
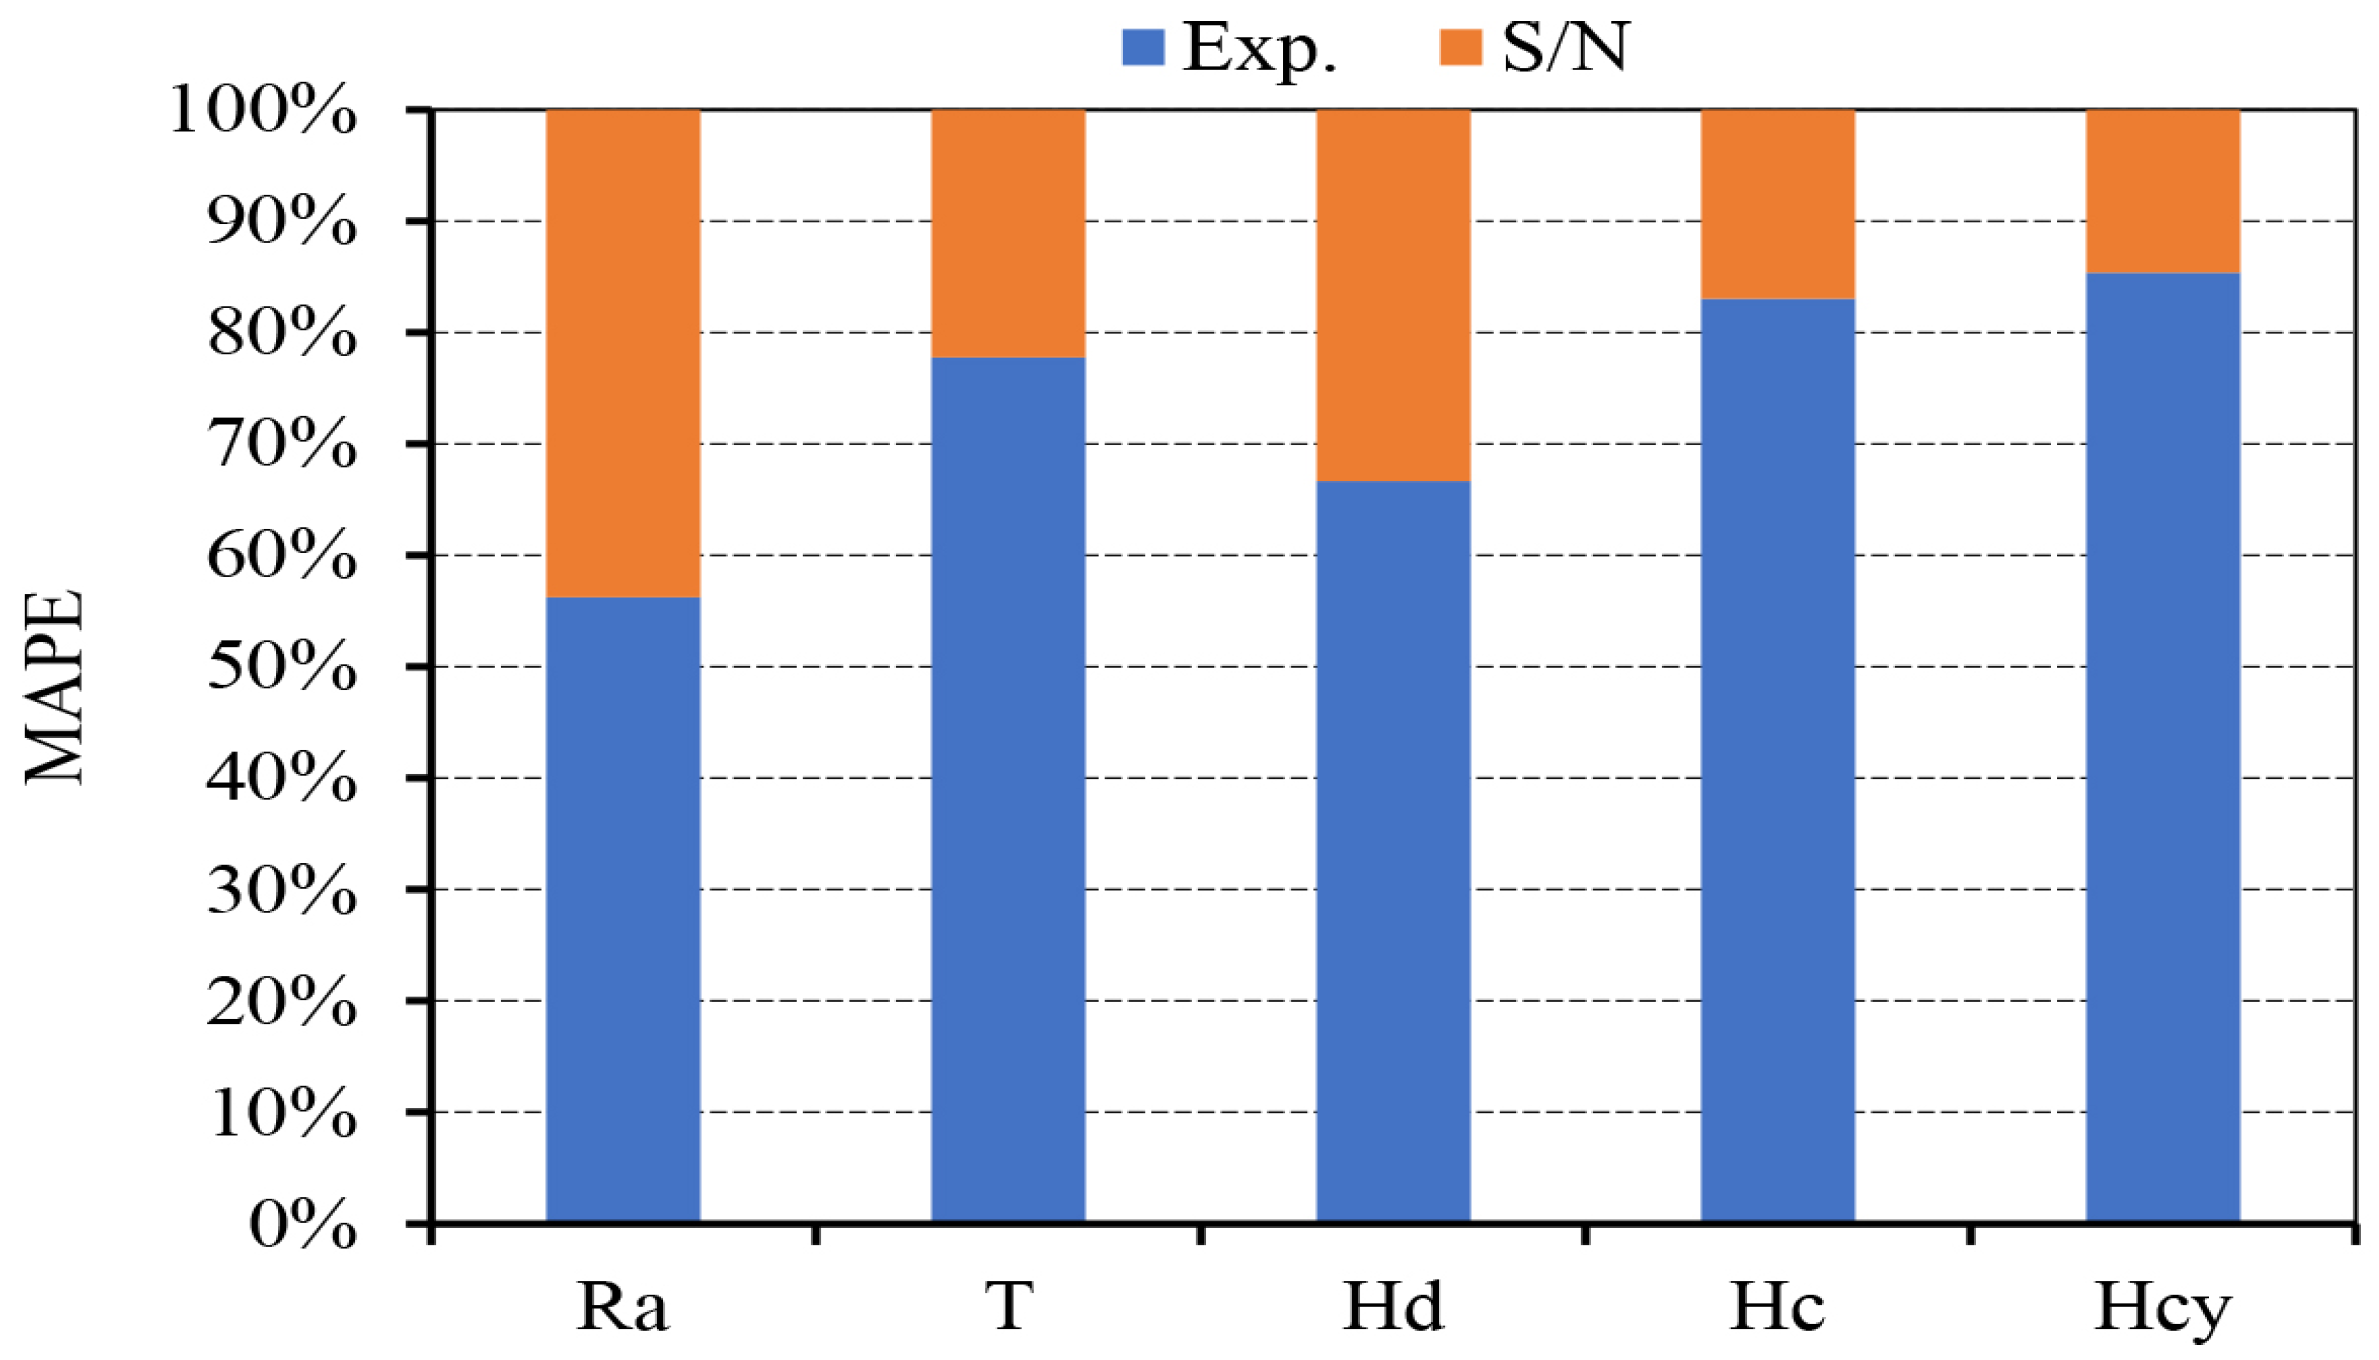
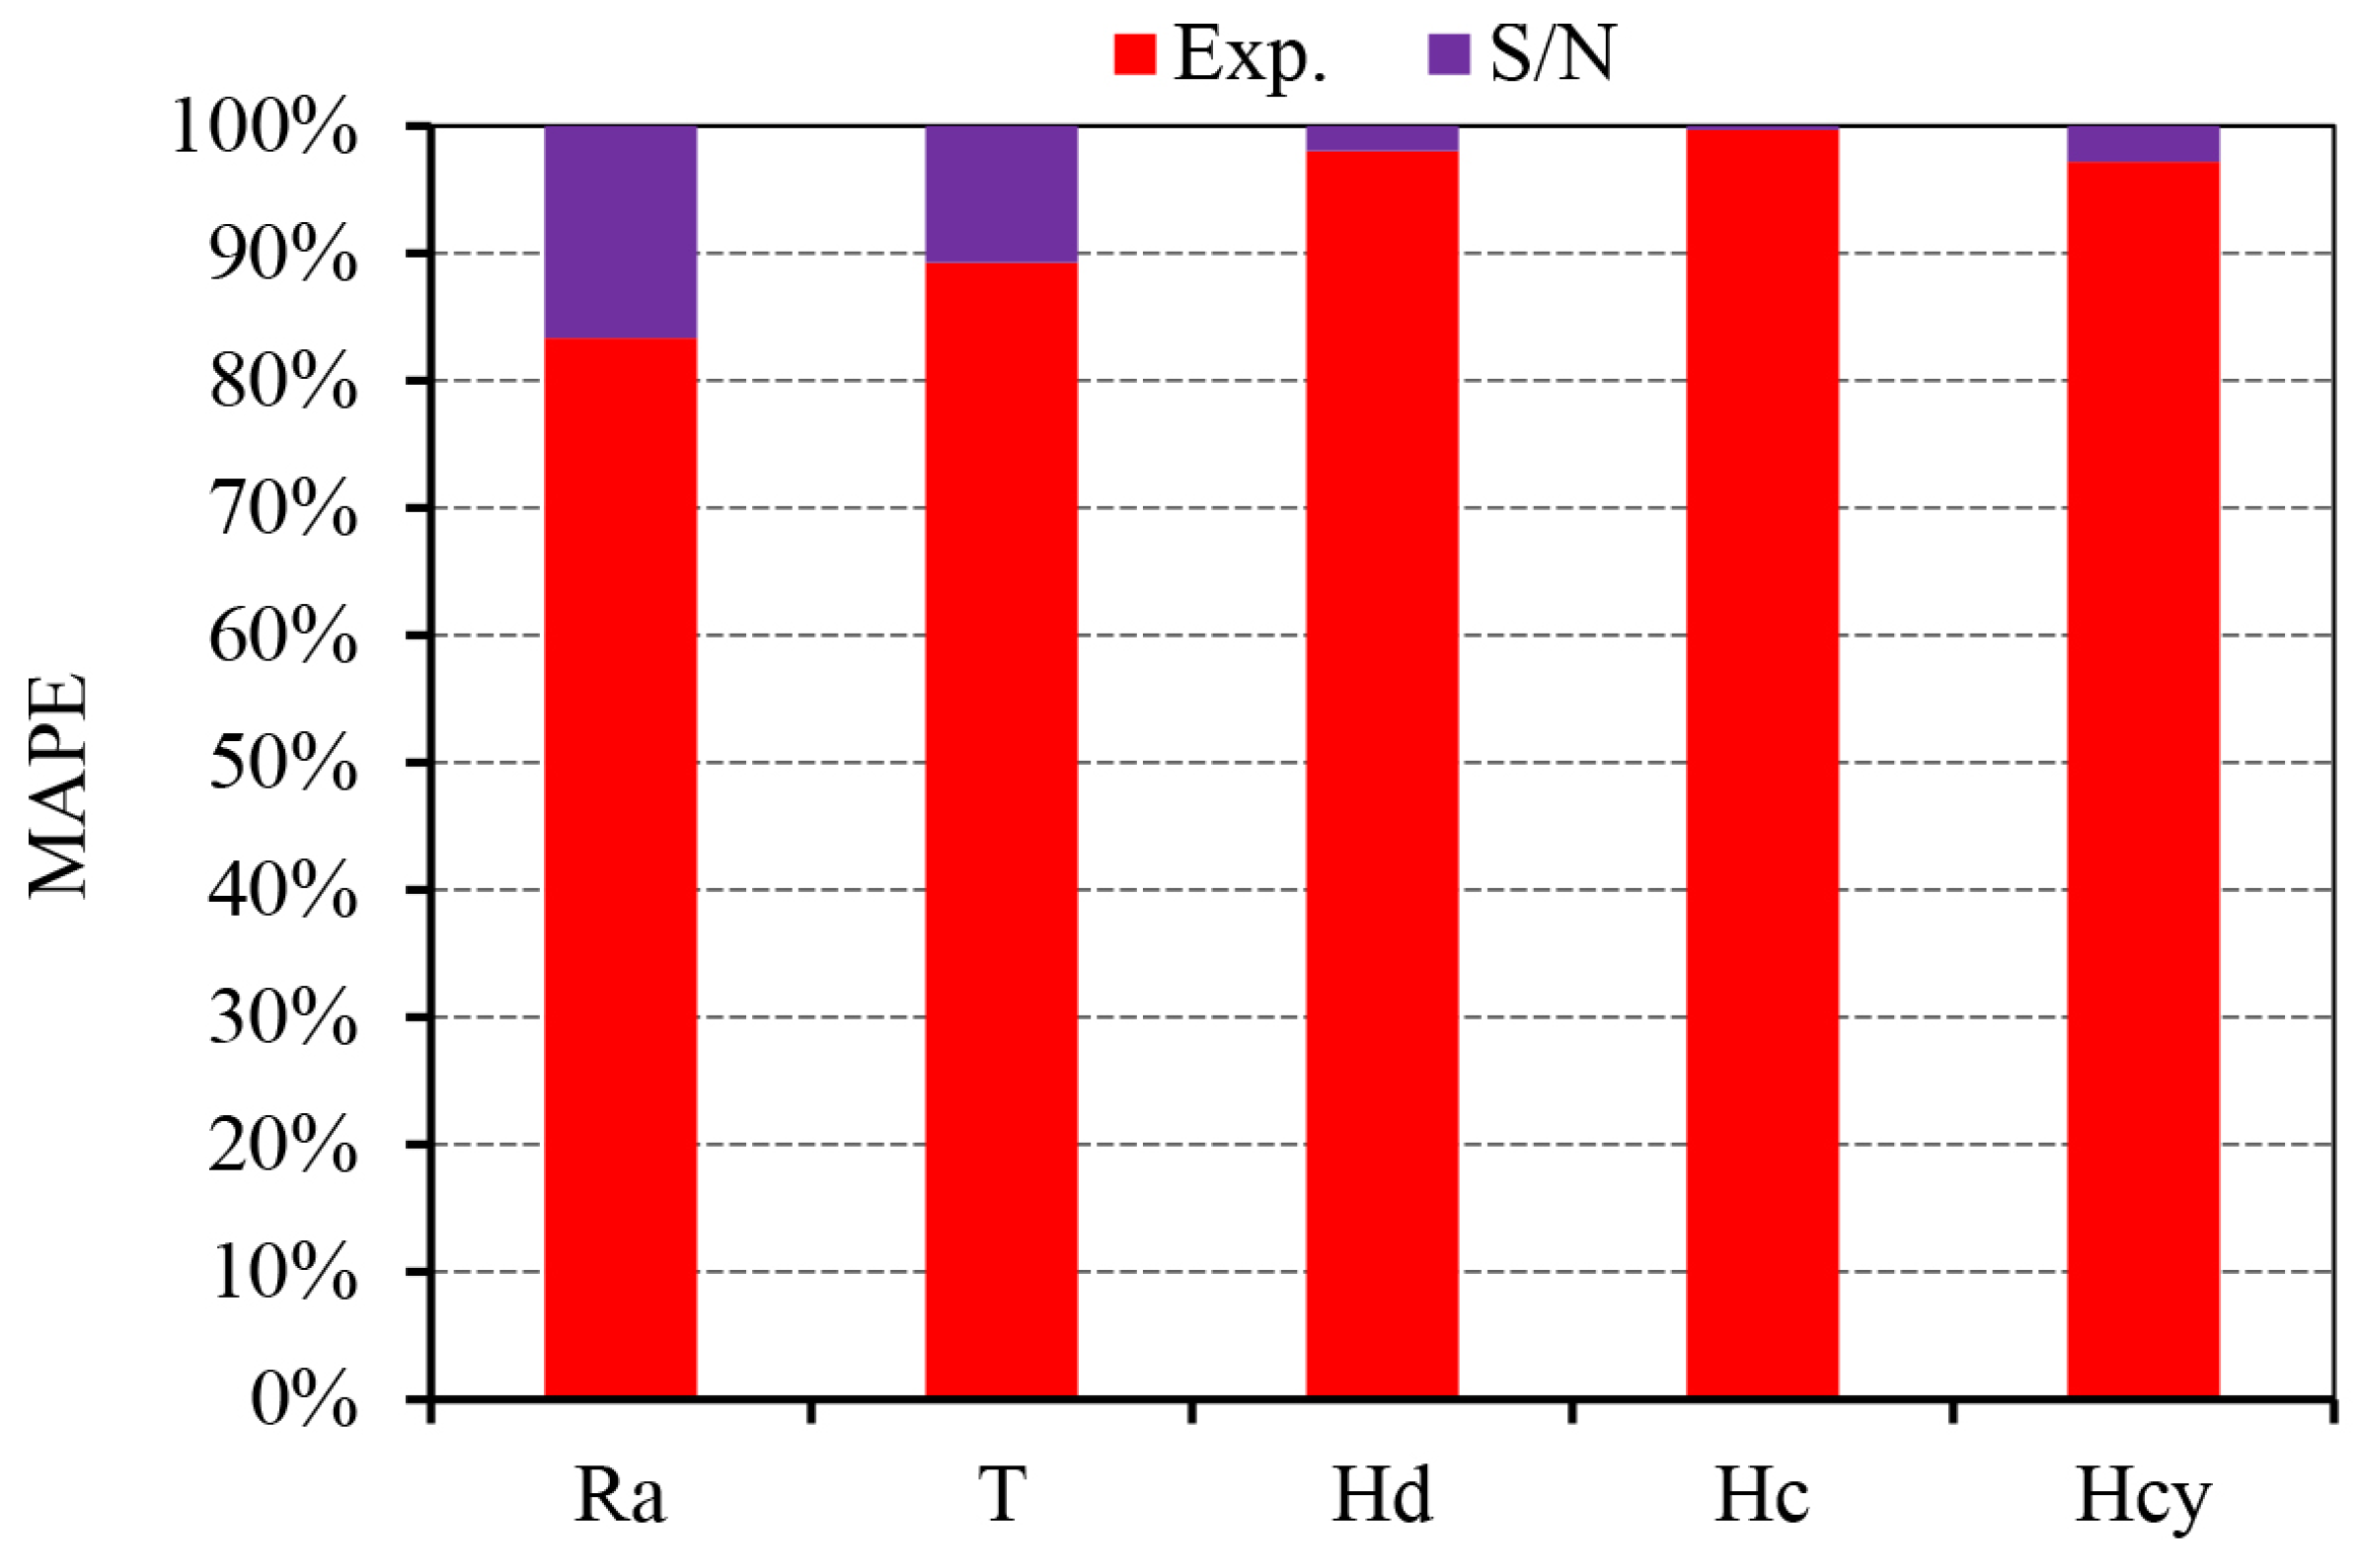
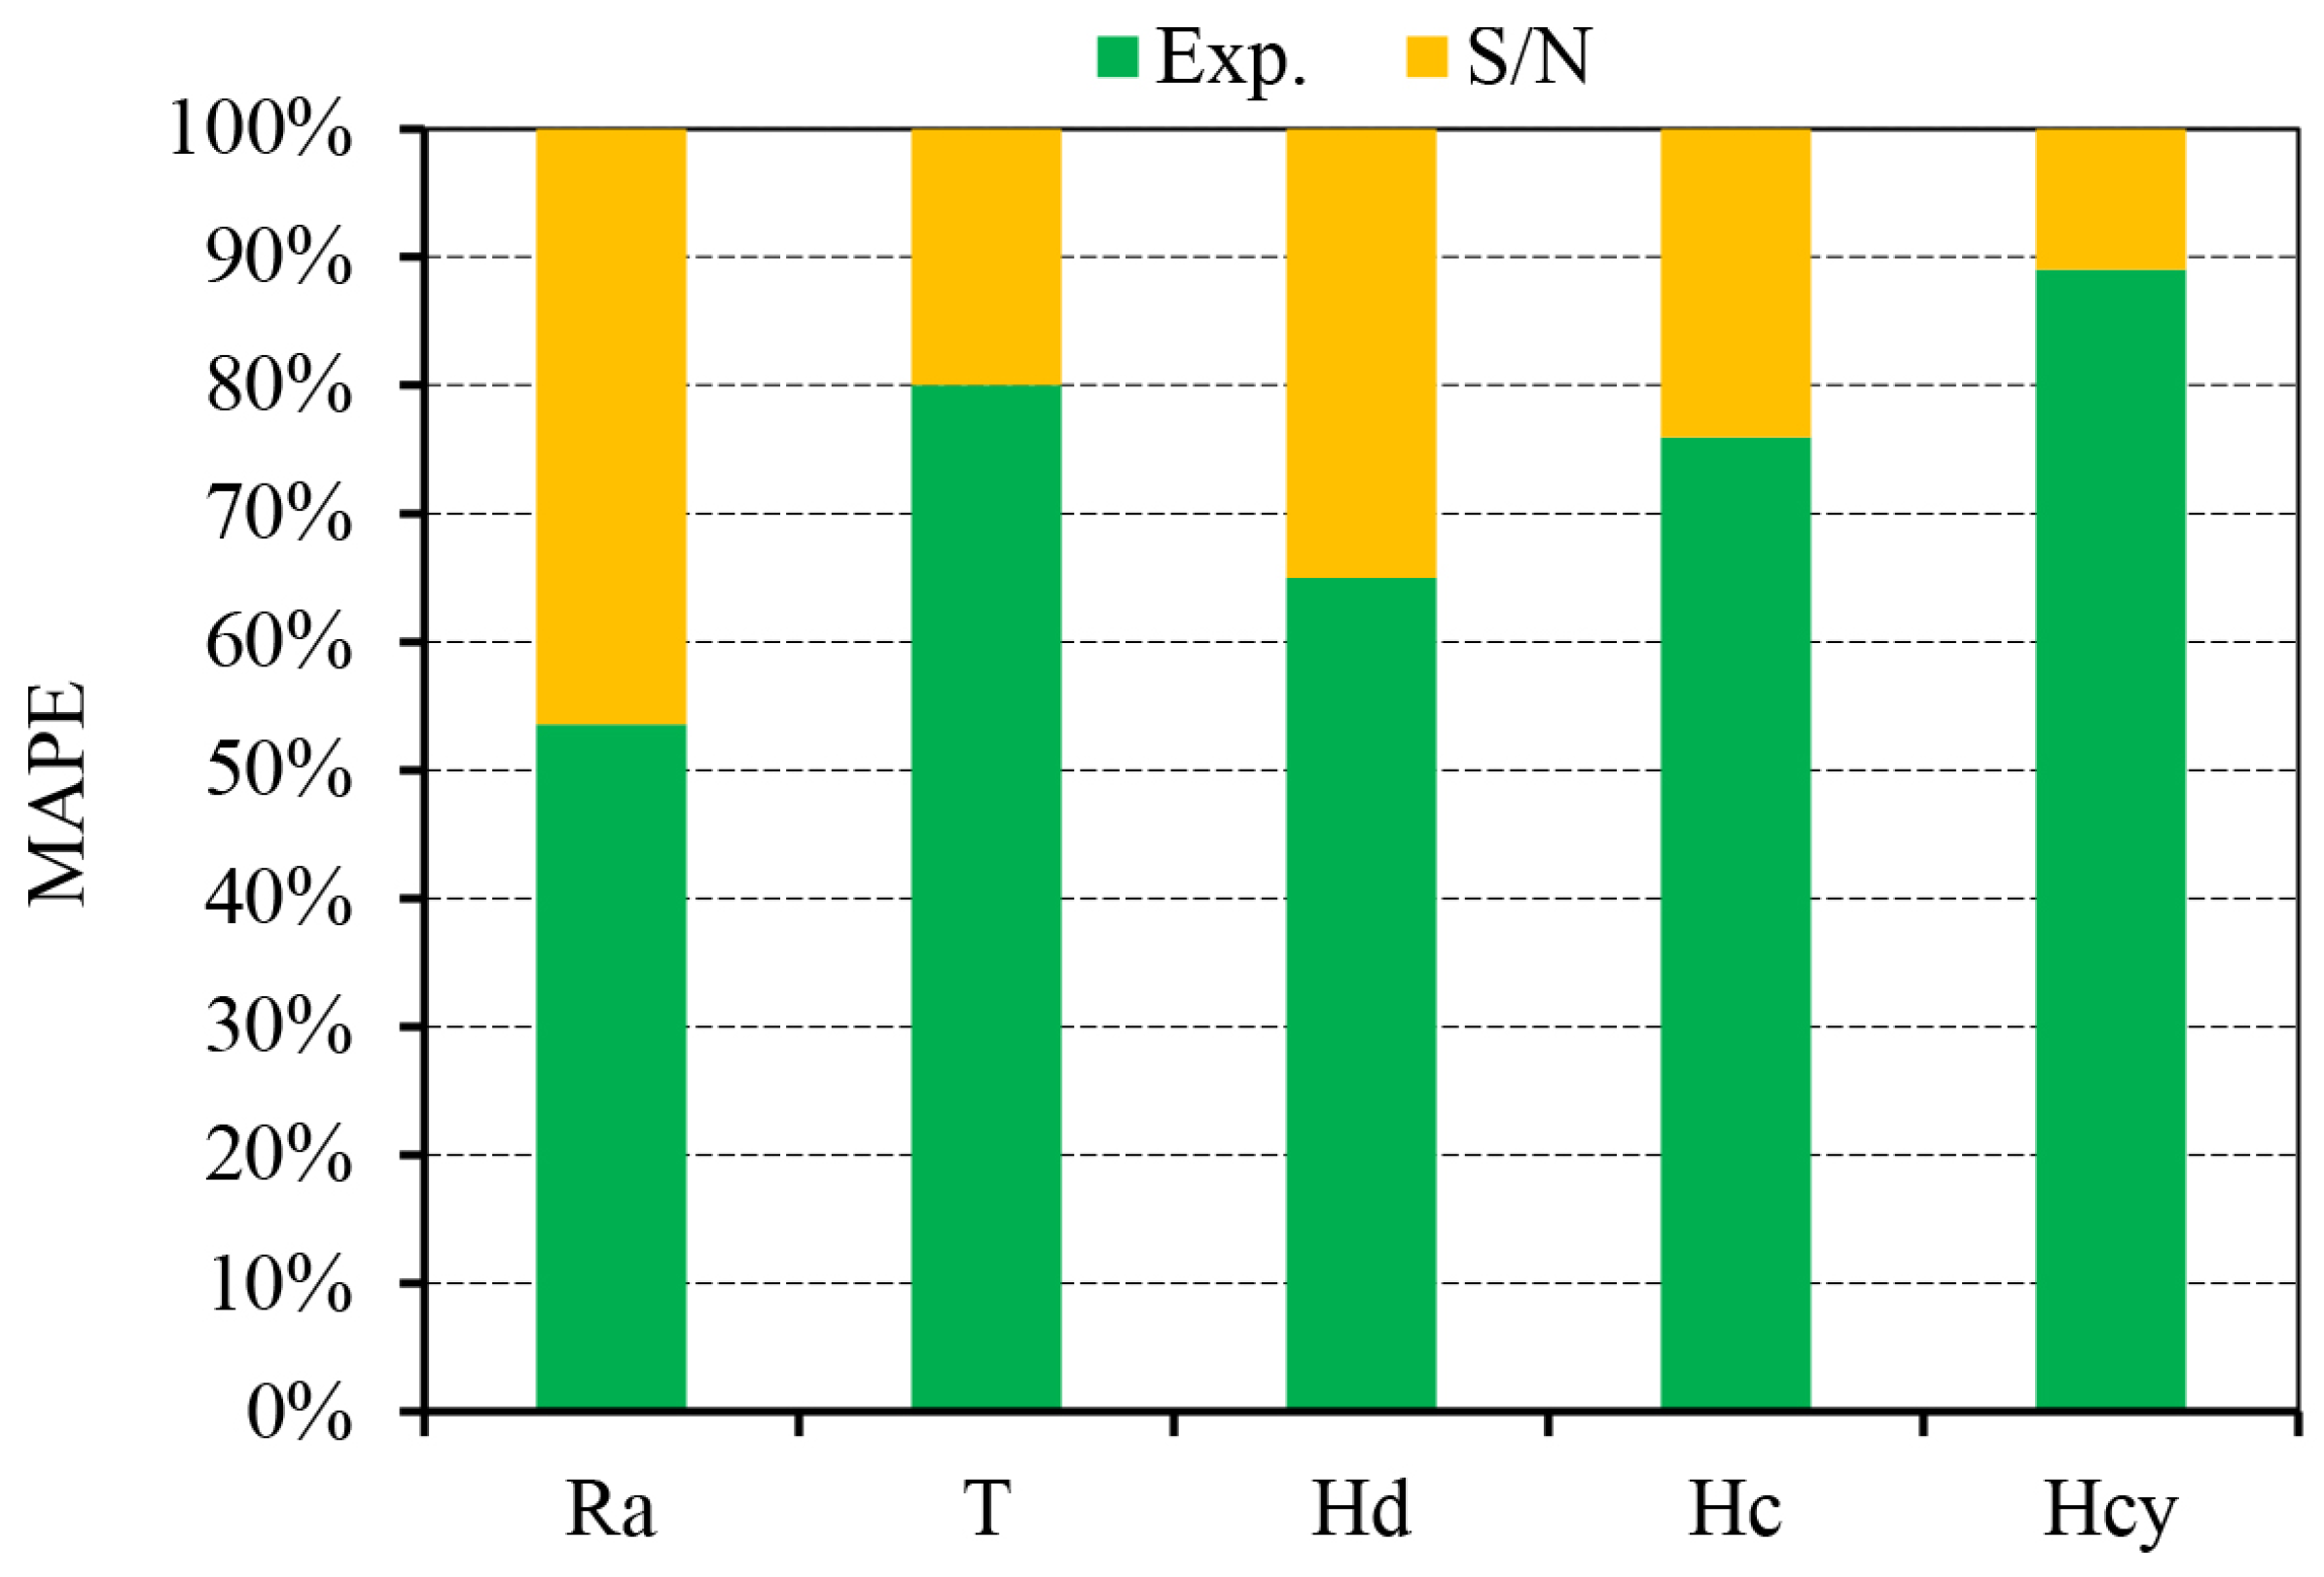
- It was observed that the accuracy percentage of the estimations made by converting the values to S/N ratios in the estimation of the output parameters with Taguchi, ANN and ANFIS is higher than the estimations made with the experimental results.
- It shows that the reliability coefficient and prediction ability of the ANN model are higher than the Taguchi and ANFIS models in estimating the output parameters.
Author Contributions
Funding
Data Availability Statement
Conflicts of Interest
Abbreviations
| CTC | Cutting Tool Coating |
| f | Feed Rate |
| Vc | Cutting Speed |
| Ra | Surface Roughness |
| T | Cutting Temperature |
| Hd | Hole Diameter Error |
| Hc | Hole Circularity Error |
| Hcy | Hole Cylindricity Error |
| BUE | Built-Up Edge |
| BUL | Built-Up Layer |
| ANN | Artificial Neural Networks |
| ANFIS | Adaptive Neuro-Fuzzy Inference System |
| MAD | Mean Absolute Deviation |
| MSE | Mean Squared Error |
| RMSE | Root Mean Squared Error |
| R2 | R-Squared |
References
- Li, K.; Pan, Q.; Li, R.; Liu, S.; Huang, Z.; He, X. Constitutive modeling of the hot deformation behavior in 6082 aluminum alloy. J. Mater. Eng. Perform. 2019, 28, 981–994. [Google Scholar] [CrossRef]
- Algahtani, A.; Mahmoud, E.R. Erosion and corrosion resistance of plasma electrolytic oxidized 6082 aluminum alloy surface at low and high temperatures. J. Mater. Res. Technol. 2019, 8, 2699–2709. [Google Scholar] [CrossRef]
- Zhao, N.; Sun, Q.; Pang, Q.; Hu, Z. Comprehensive study of hot compression behaviors and microstructure evolution of solutionized 6082 aluminum alloy extruded bar. J. Alloys Compd. 2023, 931, 167541. [Google Scholar] [CrossRef]
- Zhu, R.; Gong, W.B.; Cui, H. Temperature evolution, microstructure, and properties of friction stir welded ultra-thick 6082 aluminum alloy joints. Int. J. Adv. Manuf. Technol. 2020, 108, 331–343. [Google Scholar] [CrossRef]
- Pu, J.; Zhang, Y.; Zhang, X.; Yuan, X.; Ren, P.; Jin, Z. Mapping the fretting corrosion behaviors of 6082 aluminum alloy in 3.5% NaCl solution. Wear 2021, 482, 203975. [Google Scholar] [CrossRef]
- Yin, Q.; Chen, G.; Cao, H.; Teng, X.; Wei, S.; Zhang, B.; Leng, X. Microstructural analysis and mechanical property optimization for TP347HFG steel/6082 aluminum alloy electron beam welded joint. Vacuum 2022, 203, 111259. [Google Scholar] [CrossRef]
- Zhang, P.; Song, A.; Fang, Y.; Yue, X.; Wang, Y.; Yu, X. A study on the dynamic mechanical behavior and microtexture of 6082 aluminum alloy under different direction. Vacuum 2020, 173, 109119. [Google Scholar] [CrossRef]
- Kustas, F.M.; Fehrehnbacher, L.L.; Komanduri, R. Nanocoatings on cutting tools for dry machining. Ann. CIRP 1997, 46, 39–42. [Google Scholar] [CrossRef]
- Sarikaya, M.; Gupta, M.K.; Tomaz, I.; Danish, M.; Mia, M.; Rubaiee, S.; Jamil, M.; Pimenov, D.Y.; Khanna, N. Cooling techniques to improve the machinability and sustainability of light-weight alloys: A state-of-the-art review. J. Manuf. Process. 2021, 62, 179–201. [Google Scholar] [CrossRef]
- Dasch, J.M.; Ang, C.C.; Wong, C.A.; Cheng, Y.T.; Weiner, A.M.; Lev, L.C.; Konca, E. A comparison of five categories of carbon-based tool coatings for dry drilling of aluminum. Surf. Coat. Technol. 2006, 200, 2970–2977. [Google Scholar] [CrossRef]
- Roy, P.; Sarangi, S.K.; Ghosh, A.; Chattopadhyay, A.K. Machinability study of pure aluminium and Al–12% Si alloys against uncoated and coated carbide inserts. Int. J. Refract. Met. Hard. Mater. 2009, 27, 535–544. [Google Scholar] [CrossRef]
- Braga, D.U.; Diniz, A.E.; Miranda, G.W.; Coppini, N.L. Using a minimum quantity of lubricant (MQL) and a diamond coated tool in the drilling of aluminum–silicon alloys. J. Mater. Process Technol. 2022, 122, 127–138. [Google Scholar] [CrossRef]
- Haja Syeddu Masooth, P.; Jayakumar, V. Experimental investigation on surface finish of drilled hole by TiAlN, TiN, AlCrN coated HSS drill under dry conditions. Mater. Today Proc. 2020, 22, 315–321. [Google Scholar] [CrossRef]
- Mohan, N.; Kalam, S.A.; Mahaveerakannan, R.; Shah, M.; Yadav, J.S.; Sharma, V.; Naik, P.S.; Narasimha, D.B. Statistical evaluation of machining parameters in drilling of glass laminate aluminum reinforced epoxy composites using machine learning model. Eng. Sci. 2022, 20, 244–251. [Google Scholar] [CrossRef]
- Al-Tameemi, H.A.; Al-Dulaimi, T.; Awe, M.O.; Sharma, S.; Pimenov, D.Y.; Koklu, U.; Giasin, K. Evaluation of cutting-tool coating on the surface roughness and hole dimensional tolerances during drilling of Al6061-T651 alloy. Materials 2021, 14, 1783. [Google Scholar] [CrossRef]
- Aamir, M.; Tolouei-Rad, M.; Vafadar, A.; Raja, M.N.A.; Giasin, K. Performance analysis of multi-spindle drilling of Al2024 with TiN and TiCN coated drills using experimental and artificial neural networks technique. Appl. Sci. 2020, 10, 8633. [Google Scholar] [CrossRef]
- Muduli, S.; Mahapatra, T.R.; Murty, A.V.; Parimanik, S.R.; Mishra, D.; Padhi, P.C. Supervised machine learning algorithms for machinability assessment of graphene reinforced aluminium metal matrix composites. In Smart Technologies for Improved Performance of Manufacturing Systems and Services; CRC Press: Boca Raton, FL, USA, 2024; pp. 163–180. [Google Scholar] [CrossRef]
- Uğur, L. A Numerical and Statistical Approach of Drilling Performance on Machining of Ti–6Al–4V alloy. Surf. Rev. Lett. 2022, 29, 2250168. [Google Scholar] [CrossRef]
- Hayajneh, M.T.; Hassan, A.M.; Mayyas, A.T. Artificial neural network modeling of the drilling process of self-lubricated aluminum/alumina/graphite hybrid composites synthesized by powder metallurgy technique. J. Alloys Compd. 2009, 478, 559–565. [Google Scholar] [CrossRef]
- Kashyzadeh, K.R.; Ghorbani, S. New neural network-based algorithm for predicting fatigue life of aluminum alloys in terms of machining parameters. Eng. Fail. Anal. 2023, 146, 107128. [Google Scholar] [CrossRef]
- Öztürk, B.; Uğur, L.; Yildiz, A. Investigation of effect on energy consumption of surface roughness in X-axis and spindle servo motors in slot milling operation. Measurement 2019, 139, 92–102. [Google Scholar] [CrossRef]
- Nas, E.; Kara, F. Optimization of EDM machinability of hastelloy C22 super alloys. Machines 2022, 10, 1131. [Google Scholar] [CrossRef]
- Akgün, M. Measurement and optimization of cutting forces, surface roughness and temperature in turning of AZ91 Mg alloy. Sādhanā 2023, 48, 60. [Google Scholar] [CrossRef]
- Ganesha, A.; Joseph, A.; Pai, R.; Khader, S.M.A.; Kumar, N.; Kumar, S.; Girish, H. Performance Optimization of a Multi-groove Water Lubricated Journal Bearing with Partial Slip by Taguchi Analysis. Arab. J. Sci. Eng. 2024, 49, 2249–2267. [Google Scholar] [CrossRef]
- Özlü, B. Experimental and statistical investigation of the effects of cutting parameters on kerf quality and surface roughness in laser cutting of Al 5083 alloy. Surf. Rev. Lett. 2021, 28, 2150093. [Google Scholar] [CrossRef]
- Özlü, B. Evaluation Of energy consumption, cutting force, surface roughness and vibration In machining toolox 44 steel using taguchi-based gray relational analysis. Surf. Rev. Lett. 2022, 29, 2250103. [Google Scholar] [CrossRef]
- Şirin, E.; Kıvak, T.; Yıldırım, Ç.V. Effects of mono/hybrid nanofluid strategies and surfactants on machining performance in the drilling of Hastelloy X. Tribol. Int. 2021, 157, 106894. [Google Scholar] [CrossRef]
- Çiçek, A.; Kıvak, T.; Ekici, E. Optimization of drilling parameters using Taguchi technique and response surface methodology (RSM) in drilling of AISI 304 steel with cryogenically treated HSS drills. J. Intell. Manuf. 2015, 26, 295–305. [Google Scholar] [CrossRef]
- Özlü, B. Investigation of the effect of cutting parameters on cutting force, surface roughness and chip shape in turning of Sleipner cold work tool steel. J. Fac. Eng. Archit. Gazi Univ. 2021, 36, 1241–1251. [Google Scholar] [CrossRef]
- Özlü, B.; Demir, H.; Türkmen, M. The effect of mechanical properties and the cutting parameters on machinability of AISI 5140 steel cooled at high cooling rates after hot forging. J. Polytech. 2019, 22, 879–887. [Google Scholar] [CrossRef]
- Statoncoating. Coatings for Cutting Tools. Available online: https://www.statoncoating.com/en/coatings/coatings-cutting-tools (accessed on 30 December 2024).
- Dumkum, C.; Jaritngam, P.; Tangwarodomnukun, V. Surface characteristics and machining performance of TiAlN-, TiN- and AlCrN-coated tungsten carbide drills. Proc. Inst. Mech. Eng. Part. B J. Eng. Manuf. 2019, 233, 1075–1086. [Google Scholar] [CrossRef]
- Yücel, A.; Yıldırım, Ç.V.; Sarıkaya, M.; Şirin, Ş.; Kıvak, T.; Gupta, M.K.; Tomaz, Í.V. Influence of MoS2 based nanofluid-MQL on tribological and machining characteristics in turning of AA 2024 T3 aluminum alloy. J. Mater. Res. Technol. 2021, 15, 1688–1704. [Google Scholar] [CrossRef]
- Aouici, H.; Yallese, M.A.; Fnides, B.; Mabrouki, T. Machinability investigation in hard turning of AISI H11 hot work steel with CBN tool. Mechanics 2021, 86, 71–77. [Google Scholar]
- Liang, X.; Liu, Z.; Wang, B. State-of-the-art of surface integrity induced by tool wear effects in machining process of titanium and nickel alloys: A review. Measurement 2019, 132, 150–181. [Google Scholar] [CrossRef]
- Sousa, V.F.; Da Silva, F.J.G.; Pinto, G.F.; Baptista, A.; Alexandre, R. Characteristics and wear mechanisms of TiAlN-based coatings for machining applications: A comprehensive review. Metals 2021, 11, 260. [Google Scholar] [CrossRef]
- Zhao, J.; Liu, Z.; Wang, B.; Hu, J.; Wan, Y. Tool coating effects on cutting temperature during metal cutting processes: Comprehensive review and future research directions. Mech. Syst. Signal Process 2021, 150, 107302. [Google Scholar] [CrossRef]
- Akula, S.; Nayak, S.N.; Bolar, G.; Managuli, V. Comparison of conventional drilling and helical milling for hole making in Ti6Al4V titanium alloy under sustainable dry condition. Manuf. Rev. 2021, 8, 12. [Google Scholar] [CrossRef]
- Niinomi, M. Mechanical properties of biomedical titanium alloys. Mater. Sci. Eng. A 1998, 243, 231–236. [Google Scholar] [CrossRef]
- Antonialli, A.I.S.; Diniz, A.E.; Pederiva, R. Vibration analysis of cutting force in titanium alloy milling. Int. J. Mach. Tools Manuf. 2010, 50, 65–74. [Google Scholar] [CrossRef]
- Astakhov, V.P. Effects of the cutting feed, depth of cut, and workpiece (bore) diameter on the tool wear rate. Int. J. Adv. Manuf. Technol. 2007, 34, 631–640. [Google Scholar] [CrossRef]
- Hanif, M.I.; Aamir, M.; Ahmed, N.; Maqsood, S.; Muhammad, R.; Akhtar, R.; Hussain, I. Optimization of facing process by indigenously developed force dynamometer. Int. J. Adv. Manuf. Technol. 2019, 100, 1893–1905. [Google Scholar] [CrossRef]
- Kurt, M.; Kaynak, Y.; Bagci, E. Evaluation of drilled hole quality in Al 2024 alloy. Int. J. Adv. Manuf. Technol. 2008, 37, 1051–1060. [Google Scholar] [CrossRef]
- Pereira Guimaraes, B.M.; da Silva Fernandes, C.M.; Amaral de Figueiredo, D.; Correia Pereira da Silva, F.S.; Macedo Miranda, M.G. Cutting temperature measurement and prediction in machining processes: Comprehensive review and future perspectives. Int. J. Adv. Manuf. Technol. 2022, 120, 2849–2878. [Google Scholar] [CrossRef]
- Thirukkumaran, K.; Menaka, M.; Mukhopadhyay, C.K.; Venkatraman, B. A study on temperature rise, tool wear, and surface roughness during drilling of Al–5% SiC composite. Arab. J. Sci. Eng. 2020, 45, 5407–5419. [Google Scholar] [CrossRef]
- Bono, M.; Ni, J. The effects of thermal distortions on the diameter and cylindricity of dry drilled holes. Int. J. Mach. Tools Manuf. 2001, 41, 2261–2270. [Google Scholar] [CrossRef]
- Aydin, K. Investigation of optimal machining Monel 400 superalloy considering carbon emissions using FEM, regression and ANN methods. J. Clean. Prod. 2024, 447, 141616. [Google Scholar] [CrossRef]
- Wu, T.Y.; Lei, K.W. Prediction of surface roughness in milling process using vibration signal analysis and artificial neural network. Int. J. Adv. Manuf. Technol. 2019, 102, 305–314. [Google Scholar] [CrossRef]
- Pradhan, M.K.; Biswas, C.K. Neuro-fuzzy and neural network-based prediction of various responses in electrical discharge machining of AISI D2 steel: NF and NN based prediction of responses in EDM of D2 steel. Int. J. Adv. Manuf. Technol. 2010, 50, 591–610. [Google Scholar] [CrossRef]
- Singh, N.K.; Singh, Y.; Kumar, S.; Sharma, A. Predictive analysis of surface roughness in EDM using semi-empirical. ANN and ANFIS techniques: A comparative study. Mater. Today Proc. 2020, 25, 735–741. [Google Scholar] [CrossRef]
- Aydin, K. Comparison of regression, ANN, ANFIS, and ChatGPT prediction of turning cutting force. J. Eng. Des. 2024, 35, 338–357. [Google Scholar] [CrossRef]


| Elements | |||||||||
|---|---|---|---|---|---|---|---|---|---|
| Si | Fe | Cu | Mn | Mg | Cr | Zn | Ti | Al | |
| Wt% | 0.96 | 0.38 | 0.03 | 0.69 | 0.94 | 0.002 | 0.03 | 0.023 | Bal. |
| Symbols | Cutting Parameters | Units | Levels | ||
|---|---|---|---|---|---|
| Level 1 | Level 2 | Level 3 | |||
| A | Cutting Tool Coating, (CTC) | - | Uncoated | TiAlN | TiSiN |
| B | Feed Rate, (f) | mm/rev | 0.11 | 0.15 | 0.19 |
| C | Cutting Speed, (Vc) | m/min | 120 | 160 | 200 |
| Test No | Drilling Parameters | Test Results and S/N Ratio for Test Results | |||||||||||
|---|---|---|---|---|---|---|---|---|---|---|---|---|---|
| CTC | f (mm/rev) | Vc (m/min) | Ra (µm) | Ra (dB) | T (°C) | T (dB) | Hd (mm) | Hd (dB) | Hc (mm) | Hc (dB) | Hcy (mm) | Hcy (dB) | |
| 1 | UNC | 0.11 | 120 | 1.42 | −3.05 | 27.9 | −28.91 | 10.0062 | −20.0054 | 0.0029 | 50.7520 | 0.007 | 43.098 |
| 2 | UNC | 0.11 | 160 | 1.19 | −1.51 | 28.1 | −28.97 | 10.0087 | −20.0076 | 0.0037 | 48.6360 | 0.015 | 36.478 |
| 3 | UNC | 0.11 | 200 | 1.07 | −0.59 | 30.7 | −29.74 | 10.0117 | −20.0102 | 0.0044 | 47.1309 | 0.022 | 33.152 |
| 4 | UNC | 0.15 | 120 | 1.79 | −5.06 | 31.1 | −29.86 | 10.0091 | −20.0079 | 0.0035 | 49.1186 | 0.021 | 33.556 |
| 5 | UNC | 0.15 | 160 | 1.57 | −3.92 | 33.2 | −30.42 | 10.0123 | −20.0107 | 0.0041 | 47.7443 | 0.028 | 31.057 |
| 6 | UNC | 0.15 | 200 | 1.44 | −3.17 | 35.7 | −31.05 | 10.0164 | −20.0142 | 0.0057 | 44.8825 | 0.038 | 28.404 |
| 7 | UNC | 0.19 | 120 | 2.06 | −6.28 | 35.2 | −30.93 | 10.0176 | −20.0153 | 0.0049 | 46.1961 | 0.041 | 27.744 |
| 8 | UNC | 0.19 | 160 | 1.86 | −5.39 | 36.6 | −31.27 | 10.0203 | −20.0176 | 0.0056 | 45.0362 | 0.051 | 25.849 |
| 9 | UNC | 0.19 | 200 | 1.72 | −4.71 | 39.6 | −31.95 | 10.0231 | −20.0200 | 0.0069 | 43.2230 | 0.064 | 23.876 |
| 10 | TiAlN | 0.11 | 120 | 1.58 | −3.97 | 31.7 | −30.02 | 10.0084 | −20.0073 | 0.0034 | 49.3704 | 0.008 | 41.938 |
| 11 | TiAlN | 0.11 | 160 | 1.36 | −2.67 | 33.6 | −30.53 | 10.0122 | −20.0106 | 0.0043 | 47.3306 | 0.017 | 35.391 |
| 12 | TiAlN | 0.11 | 200 | 1.21 | −1.66 | 35.8 | −31.08 | 10.0156 | −20.0135 | 0.0051 | 45.8486 | 0.024 | 32.396 |
| 13 | TiAlN | 0.15 | 120 | 1.99 | −5.98 | 36.3 | −31.20 | 10.0124 | −20.0108 | 0.0046 | 46.7448 | 0.026 | 31.701 |
| 14 | TiAlN | 0.15 | 160 | 1.74 | −4.81 | 38.1 | −31.62 | 10.0148 | −20.0128 | 0.005 | 46.0206 | 0.029 | 30.752 |
| 15 | TiAlN | 0.15 | 200 | 1.59 | −4.03 | 39.8 | −32.00 | 10.0187 | −20.0162 | 0.0065 | 43.7417 | 0.042 | 27.535 |
| 16 | TiAlN | 0.19 | 120 | 2.28 | −7.16 | 39.7 | −31.98 | 10.0206 | −20.0179 | 0.0058 | 44.7314 | 0.044 | 27.131 |
| 17 | TiAlN | 0.19 | 160 | 2.07 | −6.32 | 42.2 | −32.51 | 10.0235 | −20.0204 | 0.0064 | 43.8764 | 0.053 | 25.514 |
| 18 | TiAlN | 0.19 | 200 | 1.88 | −5.48 | 44.7 | −33.01 | 10.0269 | −20.0233 | 0.0079 | 42.0475 | 0.065 | 23.742 |
| 19 | TiSiN | 0.11 | 120 | 1.71 | −4.66 | 36.2 | −31.17 | 10.0091 | −20.0079 | 0.0035 | 49.1186 | 0.009 | 40.915 |
| 20 | TiSiN | 0.11 | 160 | 1.54 | −3.75 | 37.5 | −31.48 | 10.0130 | −20.0113 | 0.0045 | 46.9357 | 0.018 | 34.895 |
| 21 | TiSiN | 0.11 | 200 | 1.34 | −2.54 | 40.3 | −32.11 | 10.0174 | −20.0151 | 0.0054 | 45.3521 | 0.025 | 32.041 |
| 22 | TiSiN | 0.15 | 120 | 2.18 | −6.77 | 40.4 | −32.13 | 10.0134 | −20.0116 | 0.0047 | 46.5580 | 0.027 | 31.373 |
| 23 | TiSiN | 0.15 | 160 | 1.98 | −5.93 | 41.9 | −32.44 | 10.0154 | −20.0134 | 0.0052 | 45.6799 | 0.032 | 29.897 |
| 24 | TiSiN | 0.15 | 200 | 1.75 | −4.86 | 45.2 | −33.10 | 10.0192 | −20.0167 | 0.0066 | 43.6091 | 0.043 | 27.331 |
| 25 | TiSiN | 0.19 | 120 | 2.42 | −7.68 | 45.4 | −33.14 | 10.0215 | −20.0187 | 0.0059 | 44.5830 | 0.046 | 26.745 |
| 26 | TiSiN | 0.19 | 160 | 2.32 | −7.31 | 46.8 | −33.40 | 10.0244 | −20.0212 | 0.0065 | 43.7417 | 0.055 | 25.193 |
| 27 | TiSiN | 0.19 | 200 | 2.07 | −6.32 | 48.2 | −33.66 | 10.0276 | −20.0239 | 0.0082 | 41.7237 | 0.067 | 23.479 |
| EDS Spot | Element Weights (%) | ||||||||||
|---|---|---|---|---|---|---|---|---|---|---|---|
| C | O | Mg | Al | Si | Ti | Cr | Mn | Fe | Cu | Zn | |
| 1 | 26.82 | 4.1 | 1.46 | 29.25 | 16.58 | 0.38 | 0.73 | 0.67 | 0.74 | 2.64 | 16.63 |
| 2 | 22.29 | 5.8 | 2.58 | 26.64 | 18.41 | 0.42 | 1.08 | 0.82 | 0.78 | 3.11 | 18.07 |
| 3 | 24.69 | 4.61 | 1.82 | 28.38 | 17.53 | 0.31 | 0.81 | 0.76 | 0.69 | 2.78 | 17.62 |
| Symbol | S/N Ratios | ||||
|---|---|---|---|---|---|
| Level 1 | Level 2 | Level 3 | Delta | Rank | |
| Ra | |||||
| CTC | −3.741 | −4.675 | −5.536 | 1.795 | 3 |
| f | −2.711 | −4.947 | −6.294 | 3.583 | 1 |
| Vc | −5.622 | −4.624 | −3.706 | 1.916 | 2 |
| T | |||||
| CTC | −30.35 | −31.55 | −32.52 | 2.17 | 1 |
| f | −30.45 | −31.54 | −32.43 | 1.98 | 2 |
| Vc | −31.04 | −31.41 | −31.97 | 0.93 | 3 |
| Hd | |||||
| CTC | −20.012 | −20.015 | −20.016 | 0.003 | 3 |
| f | −20.010 | −20.013 | −20.020 | 0.010 | 1 |
| Vc | −20.011 | −20.014 | −20.017 | 0.006 | 2 |
| Hc | |||||
| CTC | 46.97 | 45.52 | 45.26 | 1.71 | 3 |
| f | 47.83 | 46.01 | 43.91 | 3.92 | 1 |
| Vc | 47.46 | 46.11 | 44.17 | 3.29 | 2 |
| Hcy | |||||
| CTC | 31.47 | 30.68 | 30.21 | 1.26 | 3 |
| f | 36.7 | 30.18 | 25.47 | 11.23 | 1 |
| Vc | 33.8 | 30.56 | 28 | 5.81 | 2 |
| Ra (µm) | T (°C) | Hd (mm) | Hc (mm) | Hcy (mm) | |||||||||||||||
|---|---|---|---|---|---|---|---|---|---|---|---|---|---|---|---|---|---|---|---|
| Exp. | S/N Ratios | Exp. | S/N Ratios | Exp. | S/N Ratios | Exp. | S/N Ratios | Exp. | S/N Ratios | ||||||||||
| Pred µm | APE % | Pred dB | APE % | Pred °C | APE % | Pred dB | APE % | Pred mm | APE % | Pred dB | APE % | Pred mm | APE % | Pred dB | APE % | Pred mm | APE % | Pred dB | APE % |
| 1.41 | 0.5 | −2.98 | 2.2 | 27.44 | 1.7 | −28.79 | 0.4 | 10.0076 | 0.006 | −20.0028 | 0.003 | 0.0028 | 3.19 | 50.9286 | 0.35 | 0.006 | 11.64 | 43.175 | 0.18 |
| 1.21 | 1.7 | −1.54 | 1.3 | 28.24 | 0.5 | −29.03 | 0.2 | 10.0088 | 0.001 | −20.0077 | 0.001 | 0.0037 | 0.80 | 48.6180 | 0.04 | 0.016 | 3.46 | 36.349 | 0.35 |
| 1.08 | 0.6 | −0.62 | 6.3 | 31.03 | 1.1 | −29.81 | 0.2 | 10.0122 | 0.005 | −20.0106 | 0.002 | 0.0045 | 1.43 | 46.9724 | 0.34 | 0.022 | 1.35 | 33.204 | 0.16 |
| 1.80 | 0.7 | −5.12 | 0.5 | 31.44 | 1.1 | −29.95 | 0.3 | 10.0098 | 0.007 | −20.0085 | 0.003 | 0.0036 | 3.07 | 48.8837 | 0.48 | 0.022 | 2.47 | 33.352 | 0.61 |
| 1.56 | 0.5 | −3.88 | 1.0 | 32.90 | 0.9 | −30.34 | 0.3 | 10.0122 | 0.001 | −20.0106 | 0.001 | 0.0041 | 0.72 | 47.6938 | 0.11 | 0.027 | 2.91 | 31.282 | 0.72 |
| 1.47 | 2.1 | −3.14 | 0.7 | 35.66 | 0.1 | −31.03 | 0.1 | 10.0159 | 0.005 | −20.0138 | 0.002 | 0.0056 | 2.40 | 45.1680 | 0.64 | 0.038 | 0.78 | 28.383 | 0.08 |
| 2.05 | 0.3 | −6.28 | 0.1 | 35.33 | 0.4 | −30.96 | 0.1 | 10.0176 | 0.000 | −20.0152 | 0.000 | 0.0049 | 0.30 | 46.2545 | 0.13 | 0.041 | 0.72 | 27.871 | 0.46 |
| 1.87 | 0.4 | −5.40 | 0.1 | 36.76 | 0.4 | −31.29 | 0.1 | 10.0203 | 0.000 | −20.0176 | 0.000 | 0.0055 | 1.06 | 45.1048 | 0.15 | 0.051 | 0.58 | 25.753 | 0.37 |
| 1.72 | 0.1 | −4.70 | 0.3 | 39.31 | 0.7 | −31.90 | 0.2 | 10.0232 | 0.001 | −20.0201 | 0.000 | 0.0070 | 1.07 | 43.0961 | 0.29 | 0.063 | 0.93 | 23.846 | 0.13 |
| 1.59 | 0.5 | −4.01 | 0.8 | 31.87 | 0.5 | −30.08 | 0.2 | 10.0085 | 0.001 | −20.0074 | 0.001 | 0.0034 | 0.87 | 49.3107 | 0.12 | 0.009 | 6.48 | 41.755 | 0.44 |
| 1.35 | 0.4 | −2.65 | 0.7 | 33.50 | 0.3 | −30.49 | 0.1 | 10.0120 | 0.002 | −20.0104 | 0.001 | 0.0043 | 0.34 | 47.3439 | 0.03 | 0.017 | 2.83 | 35.563 | 0.49 |
| 1.21 | 0.2 | −1.64 | 0.8 | 35.73 | 0.2 | −31.05 | 0.1 | 10.0156 | 0.000 | −20.0136 | 0.000 | 0.0051 | 0.29 | 45.8951 | 0.10 | 0.024 | 0.15 | 32.407 | 0.03 |
| 2.08 | 4.5 | −5.98 | 0.1 | 35.80 | 1.4 | −31.08 | 0.4 | 10.0122 | 0.002 | −20.0106 | 0.001 | 0.0046 | 0.81 | 46.8429 | 0.21 | 0.026 | 1.85 | 31.924 | 0.70 |
| 1.74 | 0.2 | −4.83 | 0.4 | 38.10 | 0.0 | −31.63 | 0.0 | 10.0149 | 0.001 | −20.0129 | 0.000 | 0.0050 | 0.37 | 45.9967 | 0.05 | 0.030 | 2.94 | 30.487 | 0.86 |
| 1.58 | 0.4 | −4.00 | 0.6 | 40.29 | 1.2 | −32.10 | 0.3 | 10.0188 | 0.001 | −20.0163 | 0.000 | 0.0065 | 0.28 | 43.6676 | 0.17 | 0.042 | 0.88 | 27.577 | 0.15 |
| 2.27 | 0.5 | −7.12 | 0.1 | 40.03 | 0.8 | −32.03 | 0.2 | 10.0207 | 0.001 | −20.0179 | 0.000 | 0.0058 | 0.13 | 44.6931 | 0.09 | 0.044 | 0.08 | 27.091 | 0.15 |
| 2.14 | 3.4 | −6.32 | 0.0 | 42.29 | 0.2 | −32.53 | 0.1 | 10.0236 | 0.001 | −20.0205 | 0.000 | 0.0064 | 0.06 | 43.8871 | 0.02 | 0.053 | 0.70 | 25.607 | 0.36 |
| 1.89 | 0.5 | −5.52 | 0.1 | 44.28 | 0.9 | −32.92 | 0.2 | 10.0267 | 0.002 | −20.0232 | 0.001 | 0.0079 | 0.05 | 42.0751 | 0.07 | 0.065 | 0.63 | 23.689 | 0.22 |
| 1.71 | 0.1 | −4.69 | 0.2 | 36.49 | 0.8 | −31.24 | 0.2 | 10.0096 | 0.005 | −20.0083 | 0.002 | 0.0036 | 1.80 | 49.0018 | 0.24 | 0.009 | 3.29 | 41.022 | 0.26 |
| 1.55 | 0.4 | −3.74 | 0.3 | 37.46 | 0.1 | −31.46 | 0.1 | 10.0130 | 0.000 | −20.0113 | 0.000 | 0.0045 | 0.33 | 46.9405 | 0.01 | 0.018 | 0.21 | 34.851 | 0.12 |
| 1.34 | 0.3 | −2.52 | 0.9 | 40.05 | 0.6 | −32.06 | 0.1 | 10.0169 | 0.005 | −20.0146 | 0.002 | 0.0054 | 0.89 | 45.4642 | 0.25 | 0.025 | 1.04 | 31.978 | 0.20 |
| 2.16 | 0.7 | −6.70 | 0.1 | 40.56 | 0.4 | −32.15 | 0.1 | 10.0129 | 0.005 | −20.0112 | 0.002 | 0.0046 | 1.50 | 46.6950 | 0.29 | 0.027 | 0.14 | 31.353 | 0.06 |
| 2.04 | 3.0 | −5.95 | 0.3 | 42.19 | 0.7 | −32.51 | 0.2 | 10.0155 | 0.001 | −20.0134 | 0.000 | 0.0052 | 0.93 | 45.7544 | 0.16 | 0.032 | 0.12 | 29.937 | 0.13 |
| 1.76 | 0.6 | −4.91 | 0.2 | 44.75 | 1.0 | −33.02 | 0.3 | 10.0196 | 0.004 | −20.0170 | 0.002 | 0.0067 | 1.80 | 43.3978 | 0.48 | 0.043 | 0.17 | 27.311 | 0.07 |
| 2.44 | 0.7 | −7.71 | 0.4 | 44.95 | 1.0 | −33.05 | 0.3 | 10.0215 | 0.000 | −20.0186 | 0.000 | 0.0059 | 0.13 | 44.5629 | 0.05 | 0.046 | 0.56 | 26.659 | 0.32 |
| 2.31 | 0.4 | −7.30 | 0.1 | 46.55 | 0.5 | −33.36 | 0.1 | 10.0243 | 0.001 | −20.0211 | 0.000 | 0.0066 | 0.97 | 43.6625 | 0.18 | 0.055 | 0.13 | 25.196 | 0.01 |
| 2.06 | 0.3 | −6.30 | 0.4 | 48.90 | 1.5 | −33.79 | 0.4 | 10.0277 | 0.001 | −20.0240 | 0.000 | 0.0081 | 0.86 | 41.8230 | 0.24 | 0.067 | 0.28 | 23.562 | 0.35 |
| 0.9 | 0.7 | 0.7 | 0.2 | 0.002 | 0.001 | 0.98 | 0.20 | 1.75 | 0.30 | ||||||||||
| Ra (µm) | T (°C) | Hd (mm) | Hc (mm) | Hcy (mm) | |||||||||||||||
|---|---|---|---|---|---|---|---|---|---|---|---|---|---|---|---|---|---|---|---|
| Exp. | S/N Ratios | Exp. | S/N Ratios | Exp. | S/N Ratios | Exp. | S/N Ratios | Exp. | S/N Ratios | ||||||||||
| Pred µm | APE % | Pred dB | APE % | Pred °C | APE % | Pred dB | APE % | Pred mm | APE % | Pred dB | APE % | Pred mm | APE % | Pred dB | APE % | Pred mm | APE % | Pred dB | APE % |
| 1.42 | 0.2 | −3.06 | 0.3 | 28.08 | 0.64 | −28.94 | 0.1 | 10.0108 | 0.0262 | −20.0054 | 0.0001 | 0.0030 | 3.448 | 50.7495 | 0.005 | 0.007 | 0.000 | 43.095 | 0.007 |
| 1.18 | 0.5 | −1.64 | 1.3 | 28.05 | 0.19 | −29.02 | 0.2 | 10.0127 | 0.0002 | −20.0076 | 0.0002 | 0.0036 | 2.703 | 48.6360 | 0.000 | 0.015 | 0.000 | 36.476 | 0.005 |
| 1.11 | 3.3 | −0.58 | 1.7 | 30.66 | 0.12 | −29.75 | 0.0 | 10.0148 | 0.0007 | −20.0102 | 0.0002 | 0.0044 | 0.000 | 47.1309 | 0.000 | 0.022 | 0.000 | 33.124 | 0.084 |
| 1.69 | 5.7 | −5.05 | 0.2 | 30.98 | 0.39 | −29.83 | 0.1 | 10.0100 | 0.0024 | −20.0079 | 0.0000 | 0.0035 | 0.000 | 49.1178 | 0.002 | 0.021 | 0.000 | 33.558 | 0.006 |
| 1.50 | 4.6 | −3.92 | 0.0 | 33.11 | 0.27 | −30.39 | 0.1 | 10.0167 | 0.0064 | −20.0107 | 0.0001 | 0.0041 | 0.000 | 47.7443 | 0.000 | 0.028 | 0.000 | 31.056 | 0.003 |
| 1.44 | 0.2 | −3.22 | 0.3 | 35.75 | 0.14 | −31.05 | 0.0 | 10.0172 | 0.0034 | −20.0142 | 0.0002 | 0.0057 | 0.000 | 44.8825 | 0.000 | 0.038 | 0.000 | 28.431 | 0.095 |
| 2.05 | 0.3 | −6.29 | 0.2 | 35.21 | 0.04 | −30.81 | 0.4 | 10.0177 | 0.005 | −20.0153 | 0.0001 | 0.0049 | 0.000 | 46.1843 | 0.026 | 0.041 | 0.000 | 27.747 | 0.011 |
| 1.89 | 1.4 | −5.38 | 0.2 | 36.55 | 0.14 | −31.25 | 0.1 | 10.0235 | 0.0118 | −20.0176 | 0.0001 | 0.0057 | 1.786 | 45.0362 | 0.000 | 0.052 | 1.961 | 25.848 | 0.004 |
| 1.72 | 0.0 | −4.56 | 0.6 | 39.60 | 0.00 | −31.95 | 0.0 | 10.0227 | 0.0101 | −20.0200 | 0.0002 | 0.0069 | 0.000 | 43.2230 | 0.000 | 0.064 | 0.000 | 23.869 | 0.029 |
| 1.57 | 0.4 | −3.98 | 0.3 | 29.01 | 8.49 | −29.99 | 0.1 | 10.0141 | 0.007 | −20.0073 | 0.0000 | 0.0033 | 2.941 | 49.3748 | 0.009 | 0.007 | 12.500 | 41.918 | 0.048 |
| 1.36 | 0.0 | −2.54 | 0.4 | 33.60 | 0.01 | −30.57 | 0.1 | 10.0145 | 0.0075 | −20.0106 | 0.0000 | 0.0043 | 0.000 | 47.3306 | 0.000 | 0.017 | 0.000 | 35.329 | 0.175 |
| 1.21 | 0.4 | −1.71 | 0.6 | 35.85 | 0.14 | −31.09 | 0.1 | 10.0196 | 0.0000 | −20.0135 | 0.0002 | 0.0051 | 0.000 | 45.8486 | 0.000 | 0.024 | 0.000 | 32.392 | 0.012 |
| 1.98 | 0.6 | −5.96 | 0.3 | 36.21 | 0.24 | −31.16 | 0.1 | 10.0129 | 0.002 | −20.0108 | 0.0002 | 0.0045 | 2.174 | 46.7448 | 0.000 | 0.026 | 0.000 | 31.751 | 0.158 |
| 1.73 | 0.7 | −4.81 | 0.0 | 37.99 | 0.29 | −31.57 | 0.2 | 10.0147 | 0.0075 | −20.0128 | 0.0002 | 0.0050 | 0.000 | 46.0233 | 0.006 | 0.031 | 6.897 | 30.752 | 0.000 |
| 1.42 | 10.7 | −4.04 | 0.3 | 39.82 | 0.04 | −32.02 | 0.1 | 10.0193 | 0.0009 | −20.0162 | 0.0001 | 0.0065 | 0.000 | 43.7417 | 0.000 | 0.042 | 0.000 | 27.479 | 0.203 |
| 2.29 | 0.4 | −7.18 | 0.3 | 39.65 | 0.12 | −31.97 | 0.0 | 10.0224 | 0.0021 | −20.0179 | 0.0001 | 0.0057 | 1.724 | 44.7314 | 0.000 | 0.043 | 2.273 | 27.131 | 0.000 |
| 2.06 | 0.4 | −6.3 | 0.3 | 42.99 | 1.87 | −32.48 | 0.1 | 10.0287 | 0.0124 | −20.0204 | 0.0001 | 0.0065 | 1.562 | 43.8759 | 0.001 | 0.052 | 1.887 | 25.514 | 0.000 |
| 1.7 | 9.4 | −5.48 | 0.0 | 44.56 | 0.32 | −32.98 | 0.1 | 10.0295 | 0.0039 | −20.0233 | 0.0002 | 0.0079 | 0.000 | 42.0475 | 0.000 | 0.064 | 1.538 | 23.742 | 0.000 |
| 1.69 | 1.1 | −4.64 | 0.4 | 36.17 | 0.07 | −31.15 | 0.1 | 10.0095 | 0.0029 | −20.0079 | 0.0000 | 0.0036 | 2.857 | 49.1186 | 0.000 | 0.008 | 11.111 | 40.876 | 0.095 |
| 1.53 | 0.4 | −3.90 | 0.3 | 36.88 | 1.65 | −31.51 | 0.1 | 10.018 | 0.0002 | −20.0113 | 0.0001 | 0.0044 | 2.222 | 46.9357 | 0.000 | 0.018 | 0.000 | 34.895 | 0.000 |
| 1.34 | 0.0 | −2.55 | 0.4 | 40.58 | 0.69 | −32.11 | 0.0 | 10.0179 | 0.0000 | −20.0151 | 0.0000 | 0.0054 | 0.000 | 45.3521 | 0.000 | 0.025 | 0.000 | 32.040 | 0.003 |
| 2.26 | 3.6 | −6.85 | 1.2 | 40.45 | 0.14 | −32.12 | 0.0 | 10.0142 | 0.0016 | −20.0116 | 0.0002 | 0.0047 | 0.000 | 46.5580 | 0.000 | 0.027 | 0.000 | 31.372 | 0.003 |
| 1.96 | 1.0 | −5.91 | 0.3 | 41.76 | 0.34 | −32.47 | 0.1 | 10.0173 | 0.0007 | −20.0134 | 0.0002 | 0.0052 | 0.000 | 45.6799 | 0.000 | 0.032 | 0.000 | 29.897 | 0.000 |
| 1.84 | 5.4 | −4.87 | 0.2 | 45.24 | 0.09 | −33.06 | 0.1 | 10.0238 | 0.0043 | −20.0167 | 0.0002 | 0.0066 | 0.000 | 43.6091 | 0.000 | 0.043 | 0.000 | 27.331 | 0.000 |
| 2.36 | 2.3 | −7.65 | 0.4 | 45.36 | 0.08 | −33.15 | 0.0 | 10.0221 | 0.0005 | −20.0187 | 0.0002 | 0.0058 | 1.695 | 44.5722 | 0.024 | 0.046 | 0.000 | 26.688 | 0.213 |
| 2.34 | 1.0 | −7.43 | 0.1 | 46.14 | 1.41 | −33.33 | 0.2 | 10.0278 | 0.0039 | −20.0212 | 0.0002 | 0.0065 | 0.000 | 43.7417 | 0.000 | 0.056 | 1.818 | 25.193 | 0.000 |
| 2.06 | 0.5 | −6.31 | 0.2 | 46.05 | 4.46 | −33.57 | 0.3 | 10.0306 | 0.0100 | −20.0239 | 0.0002 | 0.0081 | 1.220 | 41.7178 | 0.014 | 0.067 | 0.000 | 23.479 | 0.000 |
| 2.0 | 0.4 | 0.83 | 0.1 | 0.005 | 0.0001 | 0.901 | 0.003 | 1.481 | 0.043 | ||||||||||
| Ra (µm) | T (°C) | Hd (mm) | Hc (mm) | Hcy (mm) | |||||||||||||||
|---|---|---|---|---|---|---|---|---|---|---|---|---|---|---|---|---|---|---|---|
| Exp. | S/N Ratios | Exp. | S/N Ratios | Exp. | S/N Ratios | Exp. | S/N Ratios | Exp. | S/N Ratios | ||||||||||
| Pred µm | APE % | Pred dB | APE % | Pred °C | APE % | Pred dB | APE % | Pred mm | APE % | Pred dB | APE % | Pred mm | APE % | Pred dB | APE % | Pred mm | APE % | Pred dB | APE % |
| 1.42 | 0.0 | −3.05 | 0.14 | 27.90 | 0.0 | −28.91 | 0.0 | 10.0072 | 0.010 | −20.0044 | 0.005 | 0.0029 | 0.000 | 50.7520 | 0.000 | 0.007 | 0.00 | 43.098 | 0.00 |
| 1.19 | 0.0 | −1.51 | 0.06 | 28.10 | 0.0 | −28.97 | 0.0 | 10.0137 | 0.050 | −20.0026 | 0.025 | 0.0037 | 0.000 | 48.6359 | 0.000 | 0.015 | 0.00 | 36.478 | 0.00 |
| 0.96 | 10.3 | −0.59 | 3.01 | 28.30 | 7.8 | −29.03 | 2.4 | 10.0132 | 0.015 | −20.0077 | 0.012 | 0.0045 | 2.272 | 46.5198 | 1.297 | 0.021 | 4.55 | 33.154 | 0.01 |
| 1.79 | 0.0 | −5.06 | 0.06 | 31.10 | 0.0 | −29.86 | 0.0 | 10.0151 | 0.060 | −20.0019 | 0.030 | 0.0035 | 0.000 | 49.1186 | 0.000 | 0.021 | 0.00 | 33.556 | 0.00 |
| 1.61 | 2.9 | −3.92 | 2.48 | 33.40 | 0.6 | −30.45 | 0.1 | 10.0167 | 0.044 | −20.0070 | 0.018 | 0.0046 | 12.195 | 47.0005 | 1.558 | 0.029 | 3.57 | 31.064 | 0.02 |
| 1.44 | 0.0 | −3.17 | 0.09 | 35.70 | 0.0 | −31.05 | 0.0 | 10.0166 | 0.002 | −20.0140 | 0.001 | 0.0057 | 0.000 | 44.8825 | 0.000 | 0.038 | 0.00 | 28.404 | 0.00 |
| 2.00 | 2.9 | −6.28 | 1.71 | 33.80 | 4.0 | −30.59 | 1.1 | 10.0153 | 0.023 | −20.0125 | 0.014 | 0.0044 | 10.204 | 47.3558 | 2.510 | 0.039 | 4.88 | 27.480 | 0.95 |
| 1.86 | 0.0 | −5.39 | 2.05 | 35.20 | 3.8 | −30.93 | 1.1 | 10.0186 | 0.017 | −20.0143 | 0.017 | 0.0052 | 7.143 | 46.1960 | 2.575 | 0.050 | 1.96 | 25.852 | 0.01 |
| 1.72 | 0.0 | −4.71 | 0.44 | 36.60 | 7.6 | −31.27 | 2.1 | 10.0208 | 0.023 | −20.0171 | 0.014 | 0.0063 | 8.696 | 45.0362 | 4.195 | 0.061 | 4.69 | 23.886 | 0.04 |
| 1.58 | 0.0 | −3.97 | 0.08 | 31.70 | 0.0 | −30.02 | 0.0 | 10.0144 | 0.060 | −20.0013 | 0.030 | 0.0034 | 0.000 | 49.3704 | 0.000 | 0.008 | 0.00 | 41.938 | 0.00 |
| 1.39 | 2.6 | −2.67 | 1.66 | 33.75 | 0.4 | −30.55 | 0.1 | 10.0160 | 0.038 | −20.0064 | 0.021 | 0.0042 | 1.163 | 47.6095 | 0.589 | 0.018 | 3.02 | 35.491 | 0.28 |
| 1.21 | 0.0 | −1.66 | 0.26 | 35.80 | 0.0 | −31.08 | 0.0 | 10.0158 | 0.002 | −20.0133 | 0.001 | 0.0051 | 0.000 | 45.8486 | 0.000 | 0.024 | 0.00 | 32.396 | 0.00 |
| 1.89 | 5.0 | −5.98 | 0.22 | 36.40 | 0.3 | −31.24 | 0.1 | 10.0113 | 0.011 | −20.0089 | 0.009 | 0.0041 | 10.870 | 48.2993 | 3.326 | 0.024 | 7.69 | 31.781 | 0.25 |
| 1.74 | 0.0 | −4.81 | 0.02 | 38.10 | 0.0 | −31.62 | 0.0 | 10.0158 | 0.010 | −20.0118 | 0.005 | 0.0050 | 0.000 | 46.0205 | 0.000 | 0.029 | 0.00 | 30.752 | 0.00 |
| 1.59 | 0.0 | −4.03 | 0.05 | 39.80 | 0.0 | −32.00 | 0.0 | 10.0237 | 0.050 | −20.0112 | 0.025 | 0.0065 | 0.000 | 43.7417 | 0.000 | 0.042 | 0.00 | 27.535 | 0.00 |
| 2.28 | 0.0 | −7.16 | 0.02 | 39.70 | 0.0 | −31.98 | 0.0 | 10.0226 | 0.020 | −20.0159 | 0.010 | 0.0058 | 0.000 | 44.7314 | 0.000 | 0.044 | 0.00 | 27.131 | 0.00 |
| 2.07 | 0.0 | −6.32 | 0.01 | 42.20 | 0.0 | −32.51 | 0.0 | 10.0237 | 0.002 | −20.0202 | 0.001 | 0.0064 | 0.000 | 43.8763 | 0.000 | 0.053 | 0.00 | 25.514 | 0.00 |
| 1.86 | 1.1 | −5.48 | 0.06 | 44.70 | 0.0 | −33.04 | 0.1 | 10.0268 | 0.001 | −20.0224 | 0.004 | 0.0074 | 6.329 | 43.0212 | 2.316 | 0.062 | 4.62 | 23.788 | 0.19 |
| 1.74 | 1.8 | −4.66 | 6.44 | 34.70 | 4.1 | −30.85 | 1.0 | 10.0096 | 0.005 | −20.0064 | 0.007 | 0.0036 | 2.857 | 48.5191 | 1.221 | 0.009 | 0.00 | 40.825 | 0.22 |
| 1.54 | 0.0 | −3.75 | 0.01 | 37.50 | 0.0 | −31.48 | 0.0 | 10.0135 | 0.005 | −20.0108 | 0.003 | 0.0045 | 0.000 | 46.9356 | 0.000 | 0.018 | 0.00 | 34.895 | 0.00 |
| 1.34 | 0.0 | −2.54 | 0.08 | 40.30 | 0.0 | −32.11 | 0.0 | 10.0234 | 0.060 | −20.0091 | 0.030 | 0.0054 | 0.000 | 45.3521 | 0.000 | 0.025 | 0.00 | 32.041 | 0.00 |
| 2.18 | 0.0 | −6.77 | 0.01 | 40.40 | 0.0 | −32.13 | 0.0 | 10.0174 | 0.040 | −20.0076 | 0.020 | 0.0047 | 0.000 | 46.5580 | 0.000 | 0.027 | 0.00 | 31.373 | 0.00 |
| 1.98 | 0.0 | −5.93 | 0.06 | 41.90 | 0.0 | −32.44 | 0.0 | 10.0164 | 0.010 | −20.0124 | 0.005 | 0.0052 | 0.000 | 45.6798 | 0.000 | 0.032 | 0.00 | 29.897 | 0.00 |
| 1.78 | 1.7 | −4.86 | 4.72 | 43.40 | 4.0 | −32.75 | 1.1 | 10.0179 | 0.013 | −20.0146 | 0.010 | 0.0063 | 4.545 | 44.8016 | 2.735 | 0.041 | 4.65 | 28.321 | 3.62 |
| 2.42 | 0.0 | −7.68 | 0.05 | 45.40 | 0.0 | −33.14 | 0.0 | 10.0275 | 0.060 | −20.0127 | 0.030 | 0.0059 | 0.000 | 44.5830 | 0.000 | 0.046 | 0.00 | 26.745 | 0.00 |
| 2.24 | 3.2 | −7.31 | 4.24 | 46.80 | 0.0 | −33.40 | 0.0 | 10.0275 | 0.031 | −20.0183 | 0.015 | 0.0070 | 8.461 | 43.1533 | 1.345 | 0.058 | 6.34 | 25.165 | 0.11 |
| 2.07 | 0.0 | −6.32 | 0.01 | 48.20 | 0.0 | −33.66 | 0.0 | 10.0316 | 0.040 | −20.0199 | 0.020 | 0.0082 | 0.000 | 41.7237 | 0.000 | 0.067 | 0.00 | 23.479 | 0.00 |
| 1.2 | 1.04 | 1.2 | 0.3 | 0.026 | 0.014 | 2.768 | 0.877 | 1.70 | 0.21 | ||||||||||
| Model | Ra | T | Hd | Hc | Hcy | |||||
|---|---|---|---|---|---|---|---|---|---|---|
| Exp. | S/N Ratios | Exp. | S/N Ratios | Exp. | S/N Ratios | Exp. | S/N Ratios | Exp. | S/N Ratios | |
| Taguchi | 99.11 | 99.12 | 99.24 | 99.80 | 99.976 | 99.988 | 99.021 | 99.805 | 98.248 | 99.704 |
| ANN | 97.97 | 99.60 | 99.17 | 99.91 | 99.986 | 99.999 | 99.098 | 99.997 | 98.519 | 99.957 |
| ANFIS | 98.84 | 98.96 | 98.79 | 99.65 | 99.974 | 99.986 | 97.232 | 99.123 | 98.298 | 99.788 |
| Experimental | S/N Ratios | |||||
|---|---|---|---|---|---|---|
| Taguchi | ANN | ANFIS | Taguchi | ANN | ANFIS | |
| Ra Error | ||||||
| MAD | 0.011 | 0.020 | 0.016 | 0.0104 | 0.0081 | 0.0115 |
| MSE | 0.0002 | 0.0014 | 0.0007 | 0.000148 | 0.000141 | 0.00035 |
| RMSE | 0.0115 | 0.0196 | 0.159 | 0.01037 | 0.00815 | 0.011481 |
| R2 | 0.997 | 0.998 | 0.994 | 0.99956 | 0.999958 | 0.999895 |
| T Error | ||||||
| MAD | 0.010 | 0.008 | 0.011 | 0.0452 | 0.0048 | 0.0519 |
| MSE | 0.00015 | 0.00014 | 0.00035 | 0.00272 | 0.00009 | 0.01060 |
| RMSE | 0.0104 | 0.0081 | 0.0115 | 0.045 | 0.004 | 0.052 |
| R2 | 0.99996 | 0.99999 | 0.99989 | 0.998 | 0.999 | 0.993 |
| Hd Error | ||||||
| MAD | 0.00023 | 0.00010 | 0.00011 | 0.000181 | 0.000063 | 0.000115 |
| MSE | 0.00000012 | 0.00000006 | 0.00000007 | 0.000000064 | 0.000000007 | 0.000000048 |
| RMSE | 0.00024 | 0.00010 | 0.00011 | 0.000181 | 0.000063 | 0.000115 |
| R2 | 0.9966 | 0.9982 | 0.9979 | 0.996 | 0.999 | 0.997 |
| Hc Error | ||||||
| MAD | 0.00028 | 0.00017 | 0.00069 | 0.0002 | 0.0001 | 0.0914 |
| MSE | 0.00000013 | 0.00000005 | 0.00000056 | 0.00000027 | 0.00000022 | 0.01355134 |
| RMSE | 0.0003 | 0.0002 | 0.0007 | 0.0003 | 0.0001 | 0.0914 |
| R2 | 0.928 | 0.974 | 0.819 | 0.99947 | 0.99957 | 0.997318 |
| Hcy Error | ||||||
| MAD | 0.00248 | 0.00237 | 0.00085 | 0.0015 | 0.0005 | 0.2288 |
| MSE | 0.0000137 | 0.0000078 | 0.0000019 | 0.00004129 | 0.00000089 | 0.09132296 |
| RMSE | 0.0025 | 0.0024 | 0.0009 | 0.00152 | 0.00052 | 0.22882 |
| R2 | 0.954 | 0.994 | 0.974 | 0.999998 | 0.999999 | 0.996799 |
Disclaimer/Publisher’s Note: The statements, opinions and data contained in all publications are solely those of the individual author(s) and contributor(s) and not of MDPI and/or the editor(s). MDPI and/or the editor(s) disclaim responsibility for any injury to people or property resulting from any ideas, methods, instructions or products referred to in the content. |
© 2025 by the authors. Licensee MDPI, Basel, Switzerland. This article is an open access article distributed under the terms and conditions of the Creative Commons Attribution (CC BY) license (https://creativecommons.org/licenses/by/4.0/).
Share and Cite
Turan, İ.; Özlü, B.; Ulaş, H.B.; Demir, H. Prediction and Modelling with Taguchi, ANN and ANFIS of Optimum Machining Parameters in Drilling of Al 6082-T6 Alloy. J. Manuf. Mater. Process. 2025, 9, 92. https://doi.org/10.3390/jmmp9030092
Turan İ, Özlü B, Ulaş HB, Demir H. Prediction and Modelling with Taguchi, ANN and ANFIS of Optimum Machining Parameters in Drilling of Al 6082-T6 Alloy. Journal of Manufacturing and Materials Processing. 2025; 9(3):92. https://doi.org/10.3390/jmmp9030092
Chicago/Turabian StyleTuran, İbrahim, Barış Özlü, Hasan Basri Ulaş, and Halil Demir. 2025. "Prediction and Modelling with Taguchi, ANN and ANFIS of Optimum Machining Parameters in Drilling of Al 6082-T6 Alloy" Journal of Manufacturing and Materials Processing 9, no. 3: 92. https://doi.org/10.3390/jmmp9030092
APA StyleTuran, İ., Özlü, B., Ulaş, H. B., & Demir, H. (2025). Prediction and Modelling with Taguchi, ANN and ANFIS of Optimum Machining Parameters in Drilling of Al 6082-T6 Alloy. Journal of Manufacturing and Materials Processing, 9(3), 92. https://doi.org/10.3390/jmmp9030092