1. Introduction
Recent changes in our societies, driven by technological advancements, require the integration of an increasing number of performance factors to maintain industrial competitiveness. To achieve this goal, companies are focusing on multi-criterion improvements based on the ‘cost—quality—lead time’ triptych. These three factors are the subject of numerous studies, where engineers and researchers seek to reduce costs, improve quality and meet production deadlines.
This study focuses on thermal cutting processes, in particular laser cutting. The consumption and waste associated with this process have led to research into ways of reducing costs, often in connection with an energy study. This approach was proposed by the research team of Kellens K. and Duflou J.R. The researchers studied electricity and assist gas consumption, as well as the direct emissions and steel waste of a laser cutting machine. Their goal was to assess the environmental impact and suggest possible action levers [
1]. They also compared the environmental impact of different laser cutting processes, such as CO
2 lasers, fibre lasers and diode lasers, with different maximum output powers [
2]. However, a review of the literature indicates that more studies have focused on improving the quality of laser-cut metal parts. In fact, several literature reviews on optimising the quality of laser cutting have been published between 2008 and 2022 [
3,
4,
5,
6,
7], but none specifically address cost minimisation or reducing the environmental impact.
To understand this, it is important to note that laser cutting is an established process, first used in 1967, and quickly industrialised in the American aerospace industry. However, this fast industrialisation has hindered the development of a coherent scientific approach to understanding the physics of metal cutting [
8]. As a result, other studies have focused on the physical modelling of the process, particularly in understanding the heating of the material that leads to defects [
9].
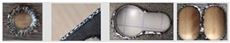
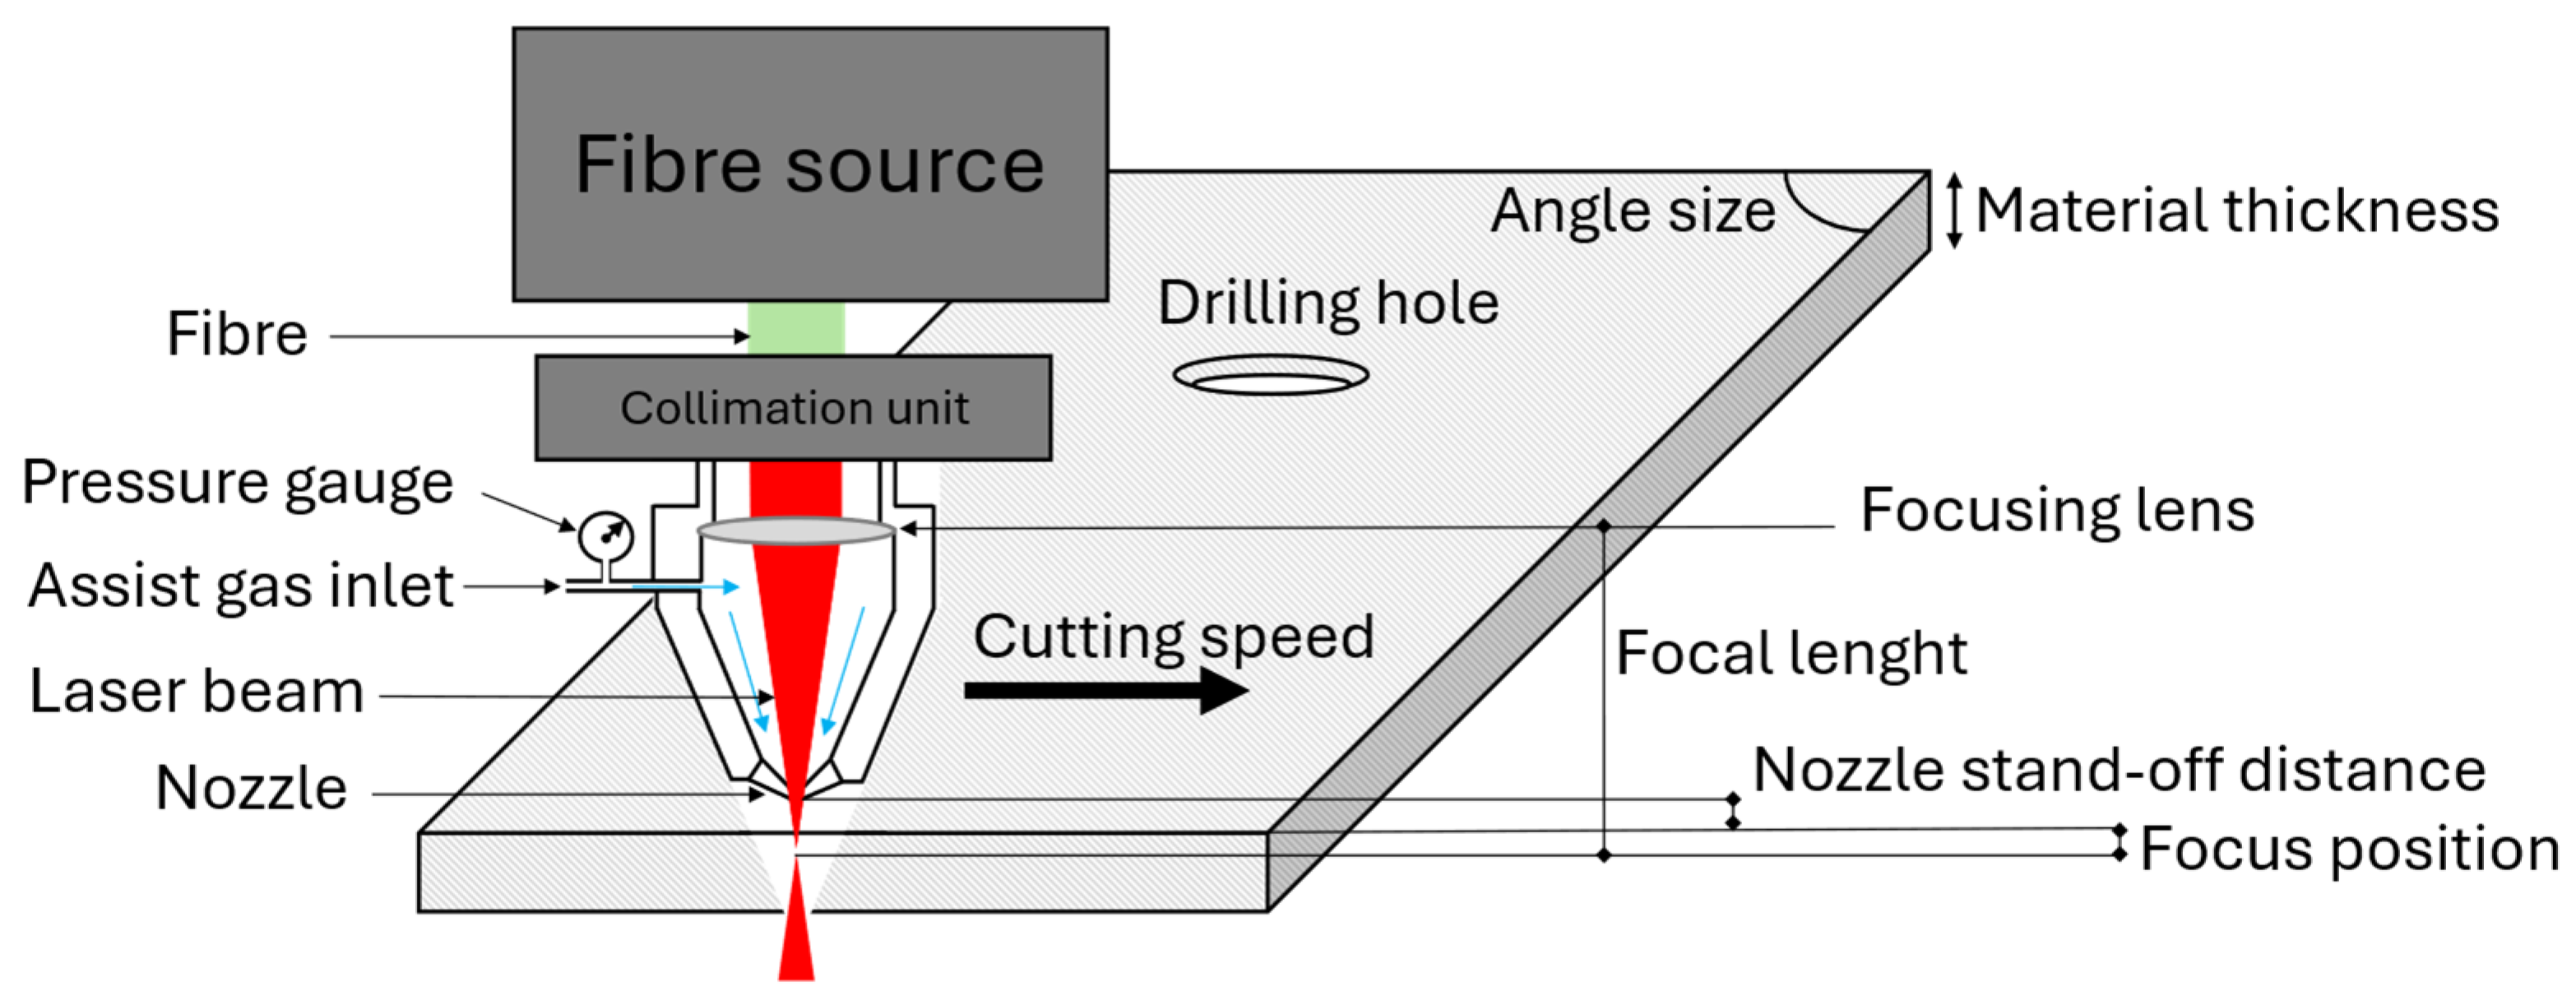
Laser cutting is a non-contact processing technology, where the laser wave, used as a heat source, is focused on a very small area of the part. The material absorbs the laser energy, resulting in localised heating. Laser cutting also has an assist gas, which can vary in type, to eject the molten material and cool the cut. The phase transitions from solid to liquid and liquid to vapour, caused by heating the material to its melting point, lead to complex phenomena. These well-documented thermal effects highlight that laser cutting is a multi-physics process, making it challenging to achieve high cutting quality. Indeed, these thermal effects are responsible for various known and standardised cutting defects (
Table 1).
From the 1990s to the 2020s, several studies have been carried out to understand the mechanisms involved in heating metals and to improve cutting quality. This highlights the general lack of formalisation of this process and explains the interest of researchers in identifying methods and models to improve quality as a priority. Early studies focusing on single-criterion ‘quality’ approaches sought to minimise a specific defect such as the Heat-Affected Zone (HAZ) [
11,
12], surface roughness [
13,
14] or kerf geometry [
15,
16]. These studies indicate that cutting quality can be improved by correctly selecting the laser manufacturing parameters and the part parameters, as concluded in a previous literature review [
4]. However, the association of several optimisation parameters implies the search for a compromise, to improve the quality of a cut by taking into consideration all the defects. Several links between optimisation parameters and the efficiency of the laser cutting process have already been established. But efforts are focused on specific quality optimisation rather than a global approach that considers all cutting defects and types of parts. The global approach provides information on the quality level of a part, regardless of the nature and number of defects and regardless of the nature of the part observed. Identifying a single indicator can provide a rapid and comprehensive analysis of quality.
The goal of this study is to propose a method for providing exhaustive and critical justification for the reduction in certain cutting defects, while also considering the constraints of influential parameters.
Firstly, the literature will be examined to identify the parameters selected to improve the quality of a cut and to highlight certain bottlenecks. Next, a method will be identified and adapted to provide an exhaustive characterisation of the quality of the cut. Lastly, results will be presented based on a case study illustrating the characterisation of defects in metal part cutting. This will help to rank defects and provide guidelines for decision-making in terms of improvement.
2. State of the Art
The parameters selected in the literature to determine cutting quality include optimisation parameters and non-variable parameters. The latter are studied and known, such as the material. Its nature is a determining parameter for quality, but it cannot be used as a lever to improve it. Therefore, before cutting, it is essential to know the physico-chemical properties of the material to be cut. These properties have been identified in several literature reviews that were interested in laser cutting of these materials. Then,
Figure 1 illustrates the laser cutting process and the main optimisation parameters that have been studied in the literature. An older review by Avanish Kumar Dubey in 2008 [
3] concluded that the performance of a laser beam machining mainly depends on laser parameters (e.g., laser power, wavelength, modes of operation), material parameters (e.g., type, thickness) and process parameters (e.g., feed rate, focal plane position, frequency, energy, pulse duration, assist gas types and pressure) in the same way as two more recent reviews of Amit Sharma and Vinod Yadava in 2017 [
6] and Pushkal Badoniya in 2018 [
7]. Based on these findings, it can be concluded from the literature that the key optimisation parameters include laser parameters, material thickness and process parameters.
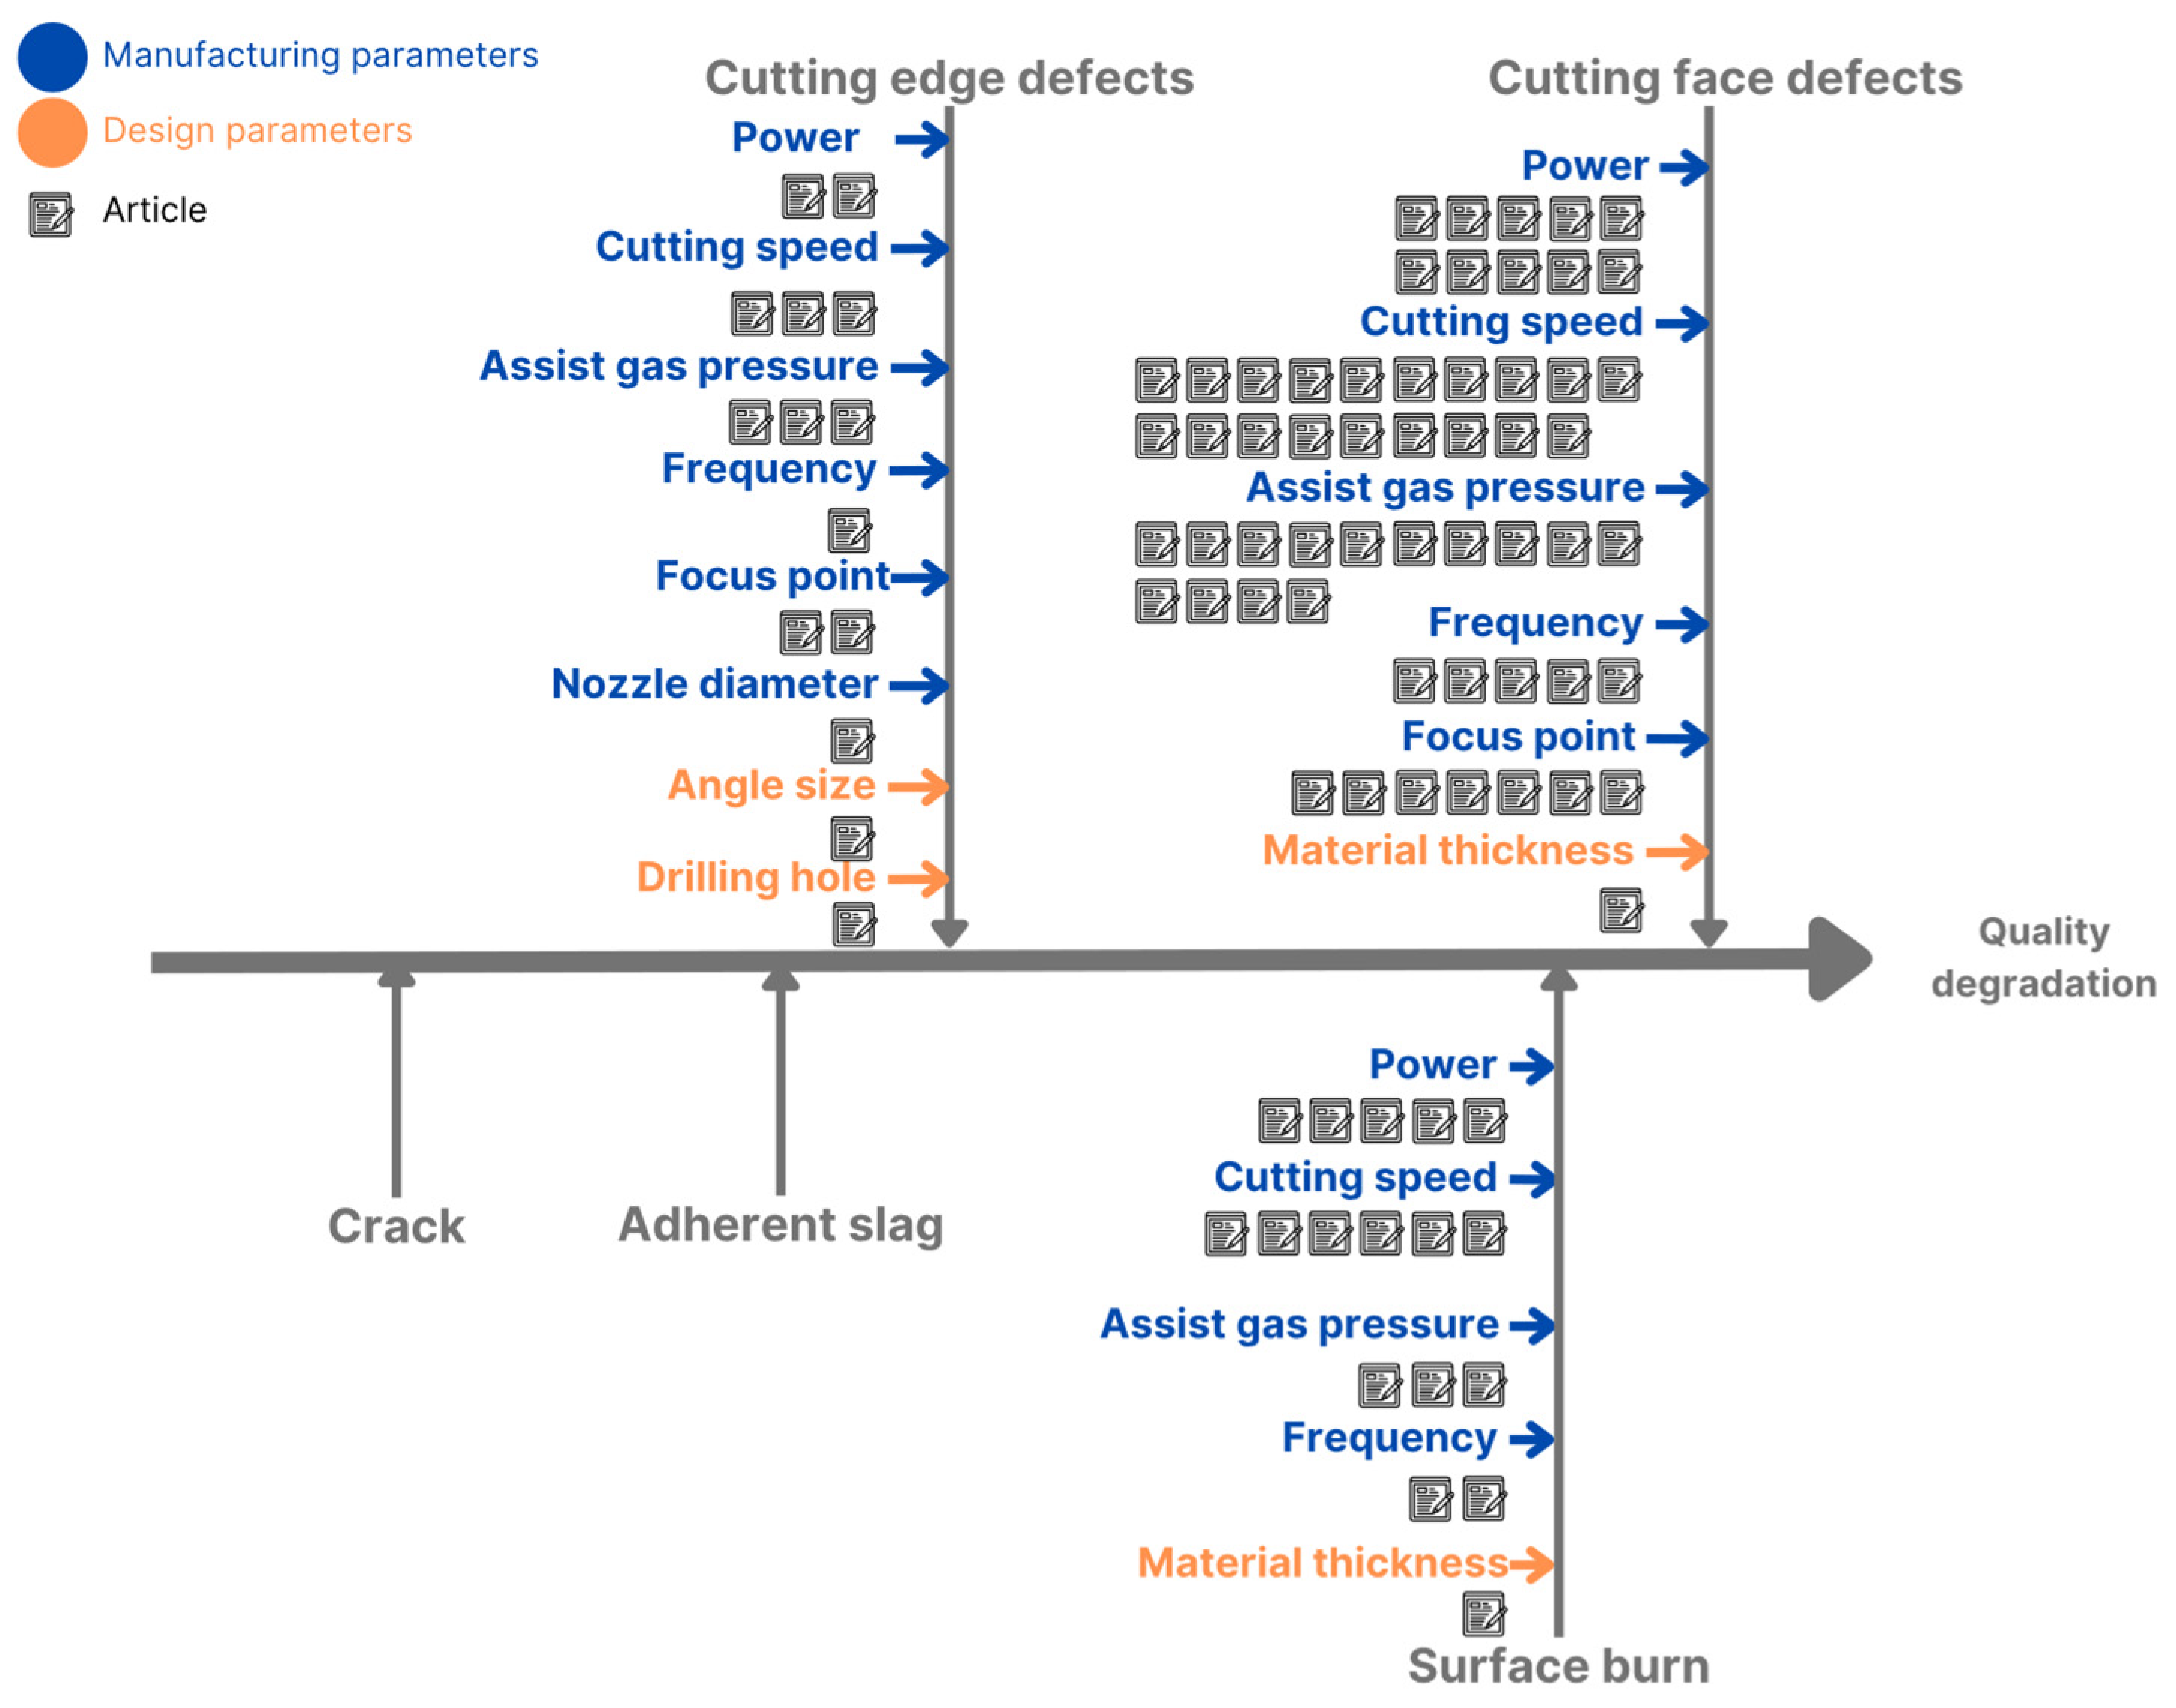
The goal of this study is to propose a comprehensive characterisation of cutting quality by considering all optimisation parameters. Although manufacturing parameters, which include both laser and process parameters, are well studied in the literature, design parameters are not always considered. In fact, the literature mainly focuses on the effects of material types or thickness, and only a few studies have examined the influence of part morphologies.
For a more comprehensive approach, it is possible to divide optimisation parameters into two categories: ‘manufacturing parameters’ (i.e., cutting speed, power, pulse frequency, assist gas pressure, focus point, nozzle diameter) and ‘design parameters’ (i.e., material thickness, morphology). The present study aims to include both categories, based on the previous literature selections, as shown in
Figure 2 according to references [
11,
12,
13,
14,
15,
16,
17,
18,
19,
20,
21,
22,
23,
24,
25,
26,
27,
28,
29,
30,
31,
32,
33,
34,
35,
36]. Other factors influencing quality can be studied, such as humidity, ambient temperature or the composition of the assist gas. These parameters relate to the external environment, and this study proposes to focus on the process–product relationship before including more parameters including the external environment. The studies listed in
Figure 2 systematically take manufacturing parameters into account. In fact, they are based on various improvement methods. Some, such as Grey Relational Analysis, aim to identify the optimum parameters for minimising a number of cutting defects, such as the HAZ, kerf width and surface roughness [
12]. Other research employs neural networks to reduce one defect, like the study by John D. Kechagias et al. on laser-cut edges’ surface roughness [
29], or several defects, like the study by Ming-Jong Tsai et al. on HAZ and kerf width [
34]. In addition, some studies adopt experimental approaches, such as the Taguchi method, to improve one or more cutting defects like the study by Wandera et al. [
31] or Raghavendra Rao and Vinod Yadava [
35]. Specialised software, such as CalCUT developed by Dirk Petring [
37], has also been used to find the optimum parameters, particularly with a view to reducing the kerf width. But this study will highlight the importance of design parameters as well.
Most of the experimental studies carried out in the past, such as those by Patel et al. [
30], Yilbas et al. [
24], Wandera et al. [
31] and Levichev et al. [
25], focused on cutting segments of different lengths without exploring how part morphology influences quality. Since the 2000s, only two papers have explained the importance of taking morphology into account. The first study addresses the size of the angle on the cutting quality, explaining that the sharper the angle, the more excess melt in the corners [
19], and the second discusses the drilling hole, proposing a predictive visualisation of the diameter and height of a laser-cut hole using a neural network model [
23]. These two studies consider morphology as an optimisation parameter to better understand the process.
Moreover, material thickness is not generally selected for quality optimisation. Studies have shown that the thickness of the material directly affects the absorption of the laser beam, resulting in heat loss by conduction and potentially increasing the risk of cutting defects, as shown by the research team of Wandera, C. and Kujanpää, V. between 2010 and 2011 [
17,
20,
26]. Consequently, there is no generalised model showing the accurate correlation between the thickness of the material and the quality of the cut. These data are rarely considered for optimisation, apart from specific studies such as that by O’Neill and Gabzdyl in 2000, which highlighted the impact of the thickness of roughness defects and HAZ for {7, 20, 30, 50} mm thick steels [
32].
This raises the question of how the complexity of the parts, defined by the diversity and number of morphologies, affects the quality of the cut and the probability of defects. Their formation is closely linked to the trajectories and movements of the tool, which adapt according to the morphologies required by the part. It is because of the observation of an increased frequency of excess melt on corners that some researchers have been encouraged to examine the influence of the size of angles on cutting quality [
19]. Indeed, the study by Ahn D.-G. and Yoo, Y.-T. in 2006 [
19] showed that for angles cut between 30° and 150°, the sharper the angle, the more excess melt appeared. The study quantified this melt area in mm
2, showing that it decreases as the angle increases, reaching zero when the angle is 150°. Several tests varying manufacturing parameters (such as power, cutting speed, and assist gas pressure) confirmed these findings.
In summary, while manufacturing parameters are well understood in the context of cut quality, design parameters, such as part morphology and material thickness, have received less attention. This study aims to fill this gap by examining how these design parameters can be optimised alongside the manufacturing parameters to improve the overall quality of the cut.
This brings up the following question: can we determine exactly how design parameters and, above all, morphologies affect the quality of laser cutting?
Figure 2 also shows that studies aimed at improving quality do not consider all the defects in laser cutting. The difficulty is that the defects are various in nature and require different measurement methods. The studies focus on minimising a specific defect such as excess molten material in corners [
19], burrs [
18,
21,
22], irregular surface profiles [
18,
22,
27,
28,
29], kerf taper [
15] or the HAZ [
12]. These defects, classified by the standard as cutting edge defects, cutting face defects or surface burns (
Table 1), are named by various terminologies in the studies, and this is why there are no optimisation parameters selected from the literature to improve crack and adherent slag in
Figure 2. Adherent slag is not studied, or at least this terminology is not used in the literature. The focus is on excess melt or burrs. Cracks are not studied for quality optimisation; they are a consequence of surface burn, known in the literature, but which the laser cutting research community is not trying to reduce. Indeed, the study by Wang et al. in 2017 explained that previous studies have shown that heating the material leads to a decrease in hardness and causes cracks to appear. These cracks are a consequence of the HAZ where the hardness of the material decreases [
38].
This analysis highlights the importance of using the standard to ensure a complete characterisation of the quality of the cut, while revealing the lack of a comprehensive optimisation method for comparing and ranking the criticality of all cutting defects. Such a model would be essential to help decision-making to improve quality and explain why certain defects are less studied than others.
This leads to the second question: is it possible to identify a common indicator for quantifying and comparing the criticality of laser cutting defects of different types?
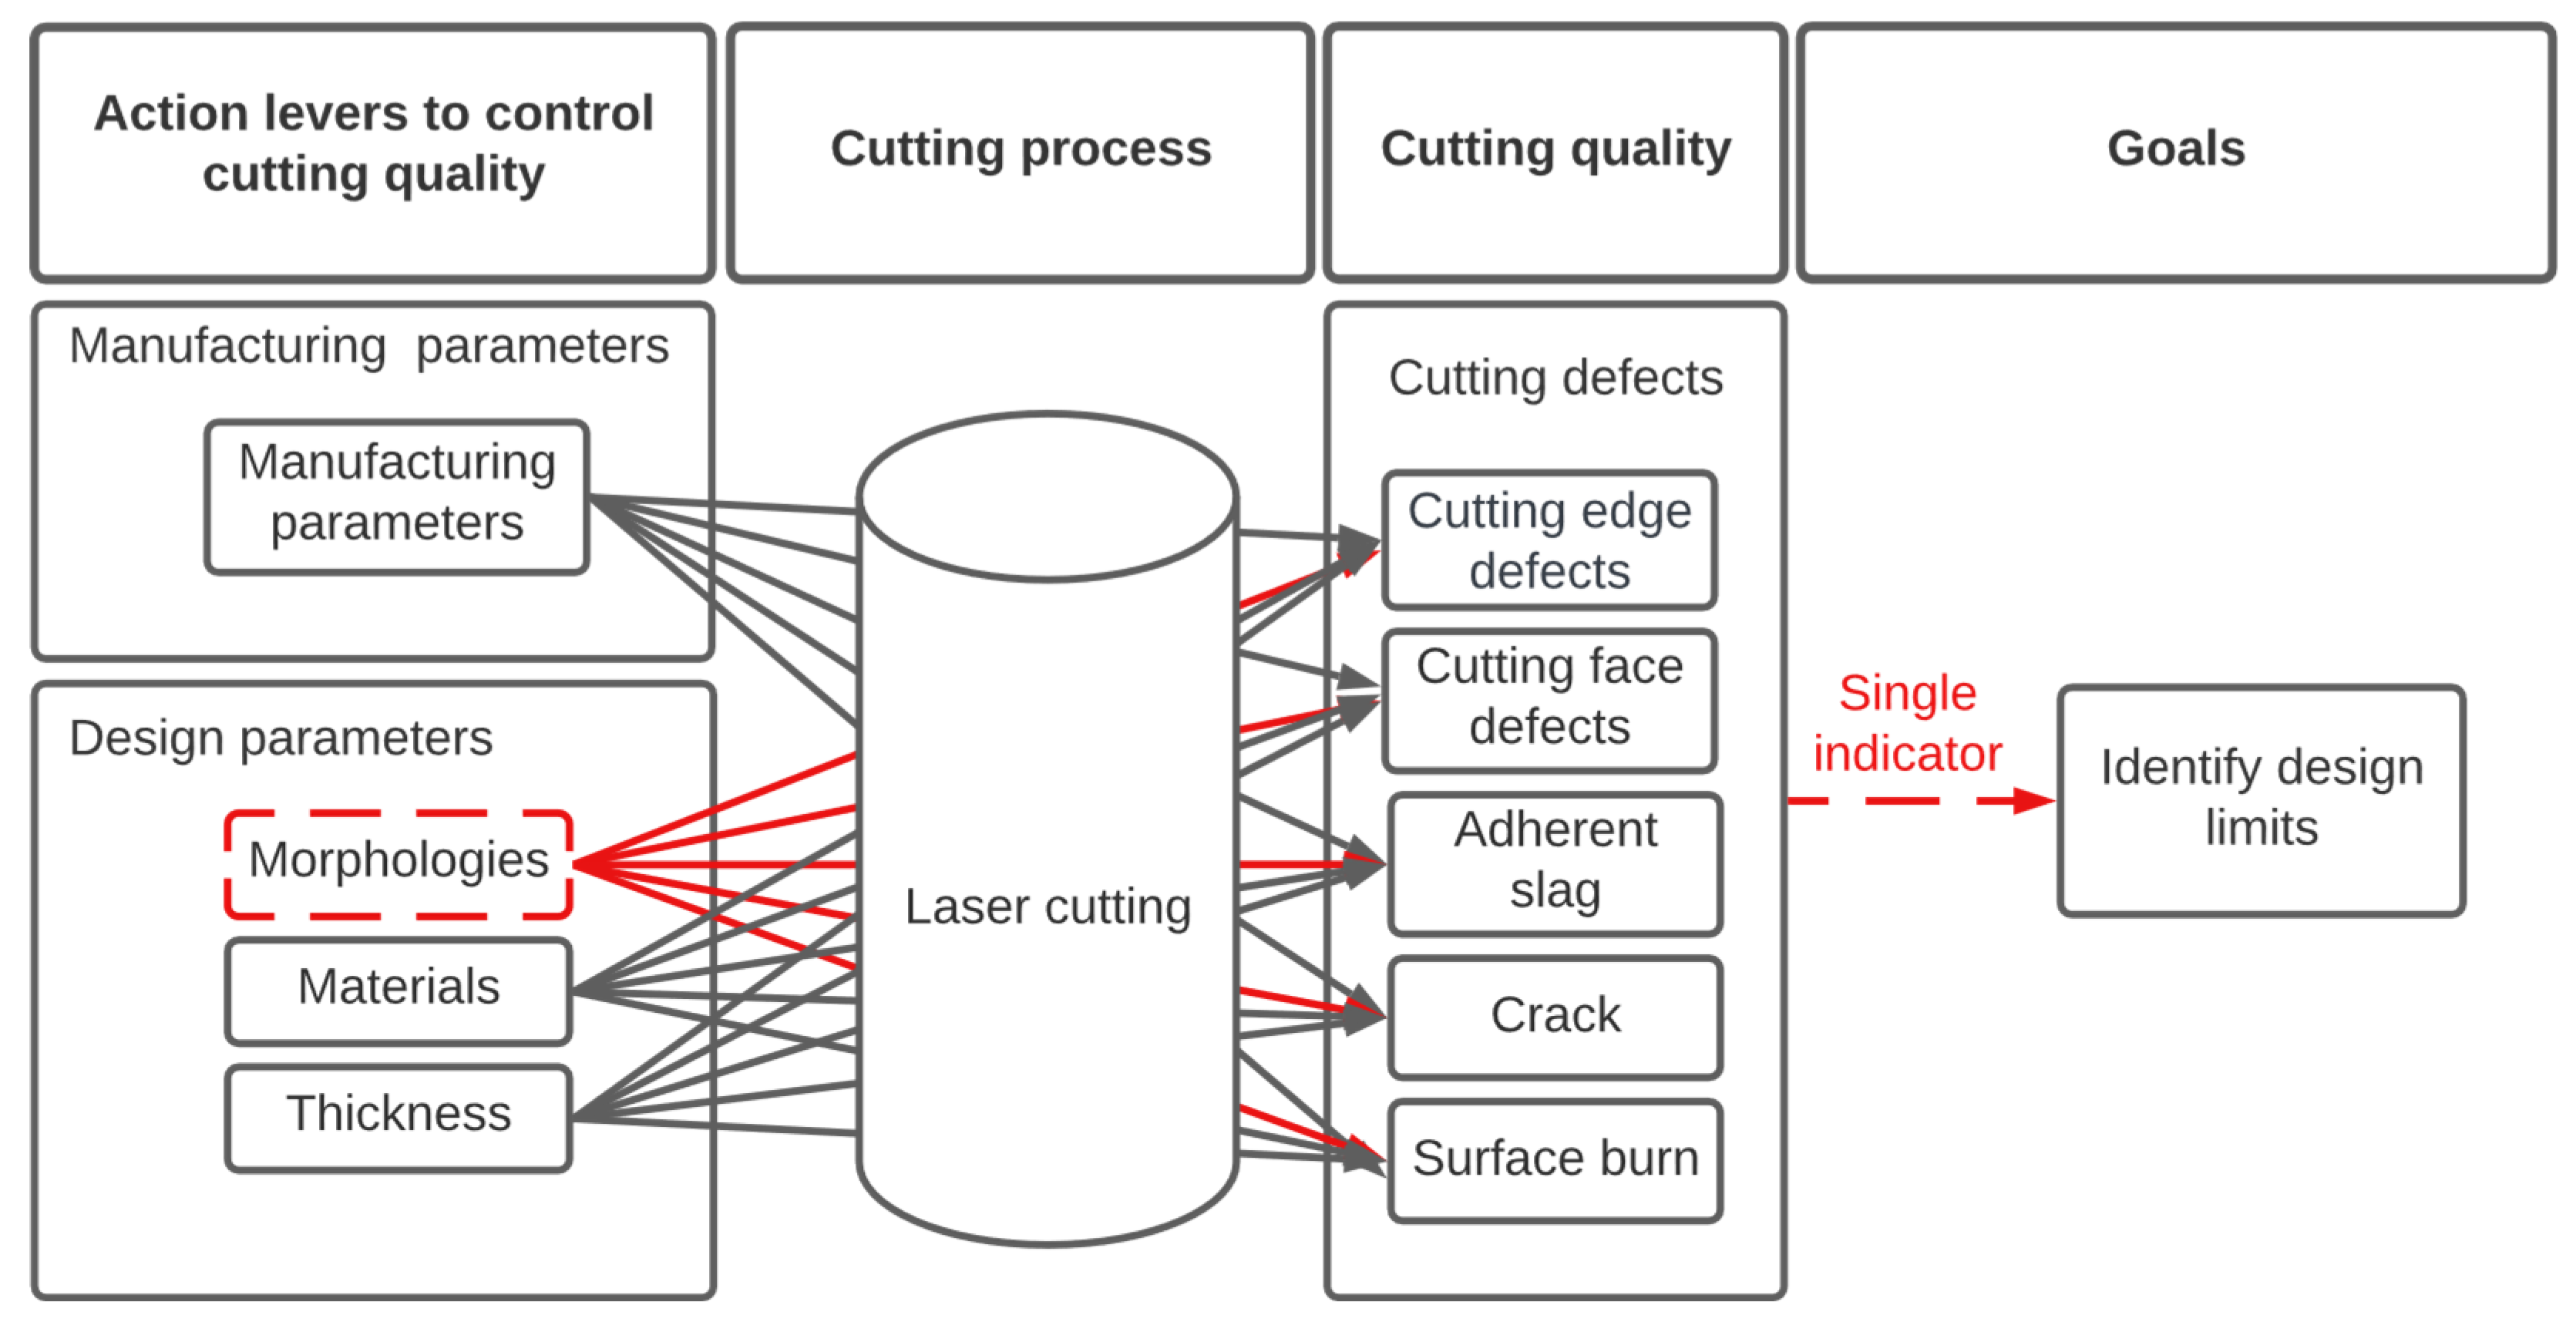
Figure 3 illustrates the two key issues addressed in this study. The process in question, laser cutting, has several optimisation parameters which can be divided into two categories: manufacturing parameters and design parameters. Each parameter influences the various cutting defects (
Table 1). Among the design parameters, the study proposes to address the first question by integrating morphologies into the optimisation parameters to demonstrate their impact on cutting quality. Moreover, the study addresses a second question by proposing a common indicator to quantify and compare the criticality of various laser cutting defects, both in nature and in quantity. That is why an arrow is represented in
Figure 3 to show the end goal of this indicator: compare and rank all cutting defects to identify design limitations. For example, a thickness limit could be identified for each cutting defect for a given material and morphology, which would help optimisation choices.
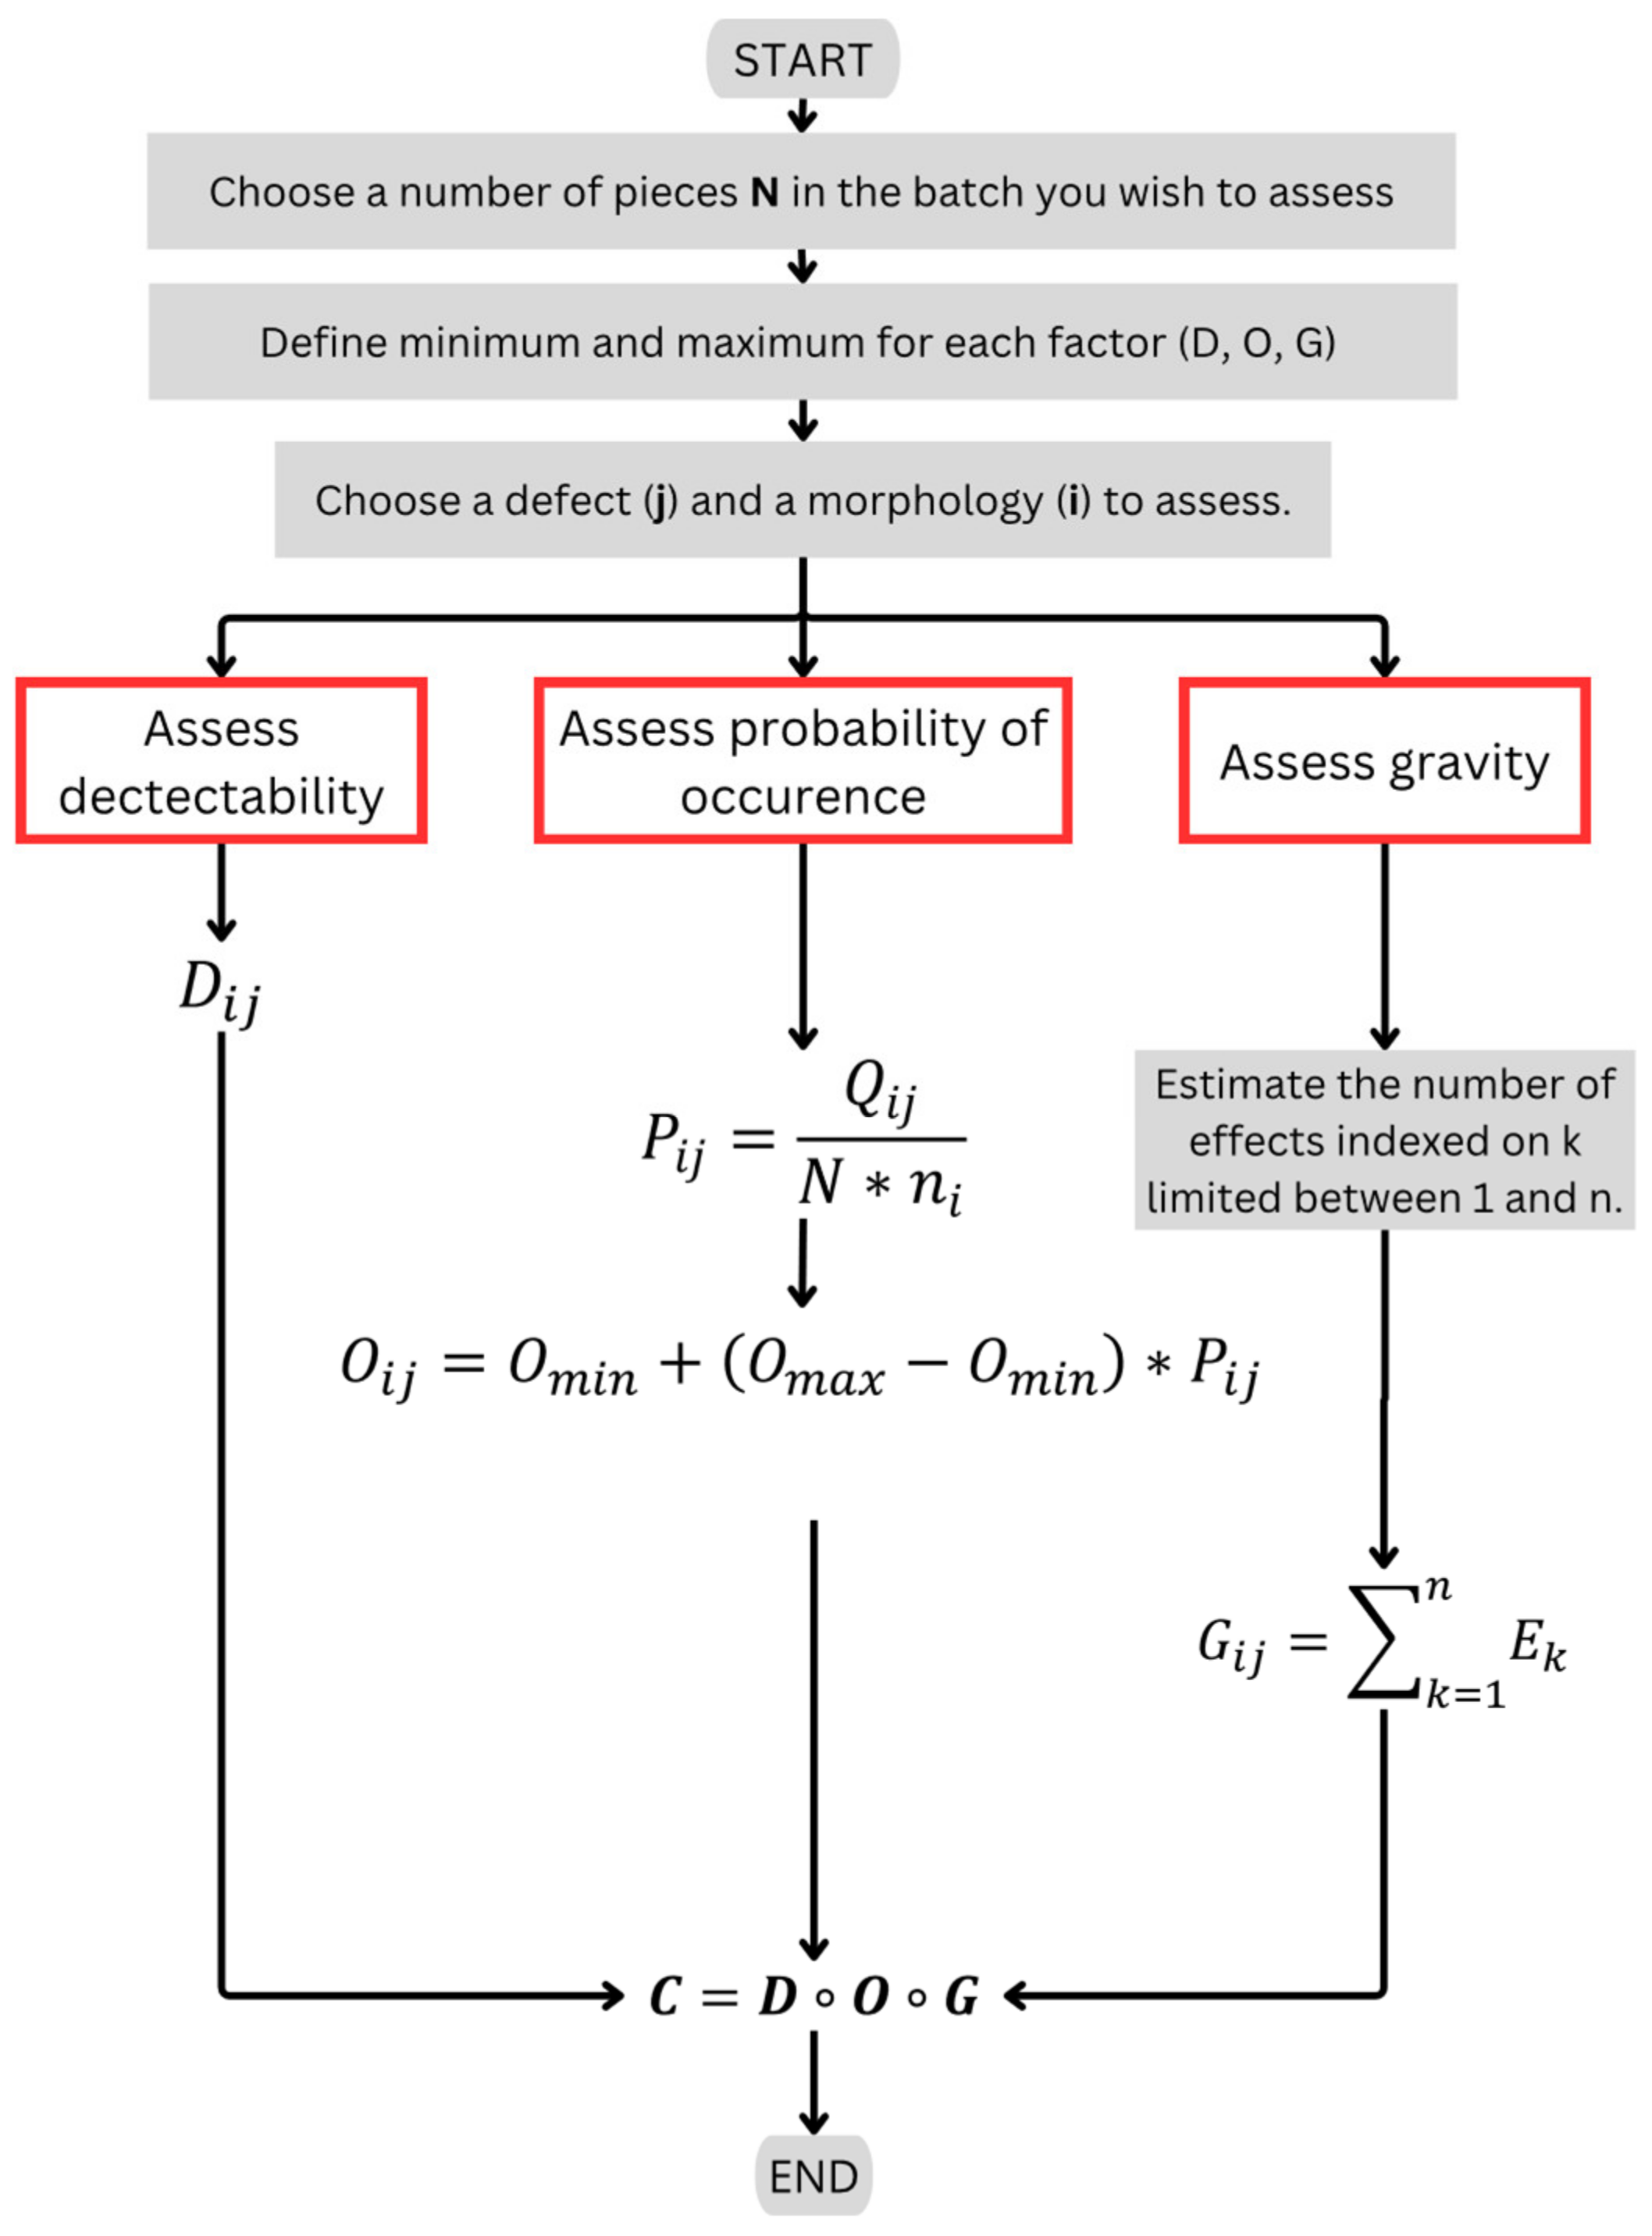
To answer the second question, an exhaustive optimisation method that compares and ranks the criticality of all cutting defects has been mentioned. Criticality can be determined using various methods, including FMECA (Failure Modes, Effects and Criticality Analysis), which has been standardised [
39] and is widely used by the industrial sector. This method is often integrated into continuous improvement projects for production lines. It is used to qualify and quantify machine failures to assess their criticality. The results are used to prioritise optimisation actions, targeting the most critical machines to ensure the reliability and availability of production resources, reduce downtime and improve maintenance. This is a FMECA for production resources. A recent study used this method to identify the faultiest production line and the bearings of the most critical machines [
40]. This method seems well suited to our needs. It allows different types of failure to be compared. It also makes it possible to quantify them using a common indicator—criticality—whatever the systems studied. As a result, this method makes it possible to quantify each defect for each morphology, material and thickness with the actual manufacturing parameters. The aim is to understand the influence of morphologies by assessing the detectability, occurrence and gravity of each cutting defect on each morphology, for example, to assess burrs on acute angles. The results can then be compared with different materials and thicknesses. As shown in
Figure 3, the proposed method will make it possible to highlight the influence of design parameters, in particular morphologies, by calculating the criticality of each defect, which will make it possible to identify design limits and the current quality level of the parts studied.
4. Industrial Application of the Method
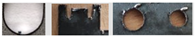
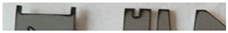
The method is tested on a test-part application. The selected process for this study is a laser cutting machine, focusing on the cutting of batches containing 10 identical parts made from DC01 steel (C: 0.12%, Mn: 0.6%, P: 0.045%, S: 0.045%). The thicknesses examined range from 0.6 mm to 4 mm, specifically {0.6, 0.8, 1, 1.2, 1.5, 2, 3, 4} mm. The machine is equipped with a 3000 W continuous wave fibre source and nitrogen as the assist gas. Cutting speed varies between 4 m/min and 20 m/min, and pressure is between 10 bars and 30 bars. Manufacturing parameters vary for different thicknesses, according to current production settings. The parts selected were specially designed to test all possible laser cutting morphologies, which are defined in the following section. Each batch was evaluated to quantify the criticality of the various cutting defects on the morphologies in accordance with the proposed method. It should be noted that these parts, which are intended to be powder-coated, have an aesthetic rather than a structural function in the product. Consequently, defects will be detected by the naked eye after cutting.
4.1. Definition of Morphologies
To test all possible laser cutting morphologies, three types were defined: arcs, segments and angles. These primary morphologies were then classified according to characteristic dimensions that defined secondary morphologies and enabled this study to be more precise. In the industrial application of this study, this classification was based on distinctive criteria established with the help of design and production experts (
Table 2). Classes 1 to 3 correspond to the radius and segment dimensions most used for the test company’s industrial parts. For arcs, morphology classes were distinguished solely by radius. The angle of the arc was not a discriminating factor in this industrial case. For segments, only one class was defined, since, according to production experts, the dimension of this morphology does not significantly affect variations in cutting defects. Classes 4 to 6 correspond to angles, which were classified as acute angles between ]0;90 [° and right and obtuse angles ranging from [90;180 [U]180;360 [°. Flat angles were not considered. The classification of angles was determined with expert input, based on the difficulty of reworking defects. Acute angles are identified as the most difficult to rework, which aligns with findings in the literature [
25]. Then, according to the experts, some right and obtuse angles are more difficult to rectify than others. A classification was therefore proposed for these angles, which explains why there are two morphologies identified for these angles.
Consequently, there are three distinct categories of angles:
Acute angles between ]0;90 [°, which are considered the most difficult to rework;
Right and obtuse angles between [90;180 [U]180;360 [° which are easier to rework;
Right and obtuse angles between [90;180 [U]180;360 [° which are more difficult to rework.
The classification of morphologies is likely to change in line with the development of industrialised parts in this case of the application, as well as with the need to specify design limits.
Table 2 shows the six morphologies identified for this study. Each morphology has its own colour, enabling it to be mapped. Thanks to this detailed definition, it is easy to see that a part can be defined by different morphologies and different quantities of them.
Figure 5 represents the selected part of this study, including all morphologies.
4.2. Evaluation of the Criticality of Tested Parts
For this study, cutting defects are described in accordance with a standard (
Table 1), which defines the following defects: burrs, irregular surface profile, geometric deviation, adherent slag, crack visible to the naked eye and surface burns; these defects are indexed from 1 to 6, respectively. Morphologies are also defined and are indexed from 1 to 6.
In this application of the method described in
Figure 4, detectability is assessed on a scale from 1 to 2, probability of occurrence on a scale from 1 to 3, and gravity on a scale from 1 to 4. While the conventional FMECA approach often uses a 1-to-10 scale, the standard does not impose a fixed numerical range but rather allows for adaptation based on the context and objectives of the analysis. Here, the scales are limited to 4 because the factors are determined through calculation. The chosen scales align with the nature of our analysis and the constraints of our industrial application. Expanding these scales further would not provide additional meaningful discrimination. Detectability, which is a binary factor in this industrial application because of its detection method, is represented by a scale of 1 to 2. Probability of occurrence is defined using parameter
, which classifies the evaluated parts into three categories: unlikely, moderately likely, and highly likely. To give greater weight to gravity while maintaining mathematical consistency among the factors, the gravity scale is set between 1 and 4, resulting in criticality ranging from 1 to 24.
Probability of occurrence is considered more significant than detectability because it determines whether a defect is more likely to appear in one morphology than another. Lastly, gravity is regarded as the most important factor, as a severe defect can lead to multiple consequences.
When minimum and maximum for each factor are decided, it is important to evaluate them.
First, a detection method must be defined. In this study, the following approach is used: if a defect is easy to see with the naked eye at the end of production, then
. If it needs a more precise detection method, then
. A detectability matrix
is then created for each defect type and morphology (Equation (3)).
In this application, cracks are harder to detect and need a more precise detection method; thus, . In addition, irregular cut face profiles are easier to observe in arcs and segments because these morphologies have continuous shapes. However, it is harder to detect on angles due to the sudden changes in the profile’s shape, which makes detection more difficult. Therefore, , and .
Secondly, to assess the probability of occurrence of the defect, it is necessary to count the number of morphologies that present the defect and divide it by the total number of morphologies in the batch of parts studied. The probability of occurrence is defined from to and (Equation (1)).
Thirdly, the effects associated with gravity need to be assessed. According to the algorithm in
Figure 4, to assess the criticality of cutting defects, this study proposes to define three gravity effects for the case of laser cutting defects in a global approach like those given as an example in
Section 3.1.2. FMECA Method in the Case of Criticality of Cutting Defects.
However, given the resources of the industrial case treated as an example here, it is not possible to determine all the effects. This has no impact on the approach, which is to assess the criticality of all cutting defects in batches of parts representing different morphologies.
To measure , an evaluation method needs to be defined. In this case study, the operator’s experience was used to classify the morphologies by the level of recovery difficulty. The effect is measured by marking the morphologies with a defect that causes injury to the operator. Then, is measured by marking the scrap generated on workstations after laser cutting and whose origin is a laser cutting defect present on a morphology. The latter effects, and , are difficult to assess in production and are therefore neglected for this application.
Lastly, for this application, gravity corresponds to the sum of the effects, so
with
and
(
Figure 4). A gravity matrix
is then created for each defect type and morphology (Equation (4)).
Geometric deviations () have the highest gravity because this defect cannot be reworked and systematically generates scraps. Secondly, cracks () and surface burns () are not reworked in this industrial case study because they are not severe defects that require reworking. The parts are painted after this process, so this is not a significant defect at this scale. Other defects need to be assessed beforehand by the operators to establish a gravity matrix (Equation (4)).
Once the morphologies, defects, effects and scales of each factor were defined, criticality could be calculated. This study includes 80 parts analysed, with 288 criticality assessments calculated for each defect and morphology present in each batch of varying thicknesses.
5. Results
The results of this study are presented in
Figure 6 and illustrate the criticality of laser cutting defects as a function of the design parameter, which are the thicknesses and morphologies of the test parts. The criticality is represented from 1 to 12, the maximum criticality calculated for these test parts.
Figure 6a shows the evolution of the criticality of burrs as a function of the thickness and for different morphologies. Burrs are more critical of certain morphologies such as small arcs, long arcs, acute angles and right and obtuse angles with a more difficult rework. Criticality varies with thickness, allowing for the identification of a thickness limit beyond which the criticality of burrs increases. Then, the evolution of the criticality of the burrs on the segments and that of the right and obtuse angles with an easier rework are much less significant. This shows that all morphologies influence burrs, but that the criticality depends on their nature and the thickness of the material.
Figure 6b shows the criticality of irregular surface profiles and shows a difference in evolution compared to burrs. The criticality of this defect does not change with thickness. It is a systematically present defect whose criticality depends solely on its morphology. Arcs and angles appear to be the most sensitive morphology for this defect.
Figure 6c shares the same characteristics as
Figure 6b, as there is no variation in criticality based on thickness, but no variation in morphology either.
Figure 6d represents the criticality of adherent slag and in contrast to
Figure 6b,c, criticality changes with thickness. In a similar way to the criticality of burrs shown in
Figure 6a, some morphologies have more critical adherent slag than others. In decreasing order, the morphologies with the most critical slag are acute angles, small arcs, long arcs, right and obtuse angles with a more difficult rework, right and obtuse angles with an easier rework and lastly segments. In the same way as the criticality of burrs, it is possible to identify a thickness limit above which the criticality of slag becomes more important.
Figure 6e shows the criticality of the cracks. In the same way as the criticality of geometric deviations shown in
Figure 6c, the criticality does not change with thickness and morphology.
Lastly, the criticality of surface burns shown in
Figure 6f is almost constant for all thicknesses. The criticality is highest for acute angles.
The analysis of these results makes it possible to rank the defects from the most critical to the least critical for each morphology and to identify a thickness limit above which there is a significant increase in criticality. Burrs (
Figure 6a), irregular surface profiles (
Figure 6b) and adherent slag (
Figure 6d) are the most critical cutting defects in these batches of parts. These defects are directly linked to the heating of the material by the laser energy input. Their development is closely linked to the trajectories and movements of the tool, which are adapted to the required morphologies.
Moreover, among these defects, only burrs and adherent slag are influenced by the thickness, so the study shows that it is possible to identify a focus on minimising these defects.
The key point to note from these results is that the morphology of the part influences all the defects. Moreover, thickness is also an influential factor, making it possible to identify priority optimisation windows. This analysis makes it possible to rank defects in morphology according to their criticality, opening the way to the definition of design limits.
6. Discussion
The results have made it possible to identify the most critical defects for each morphology and for each thickness limit. To do this, it is necessary to examine each morphology individually to identify the priority optimisation windows specific to each of them. Next, they need to be prioritised by first comparing those associated with burrs and slag, and then analysing all the morphologies (arcs, segments and angles).
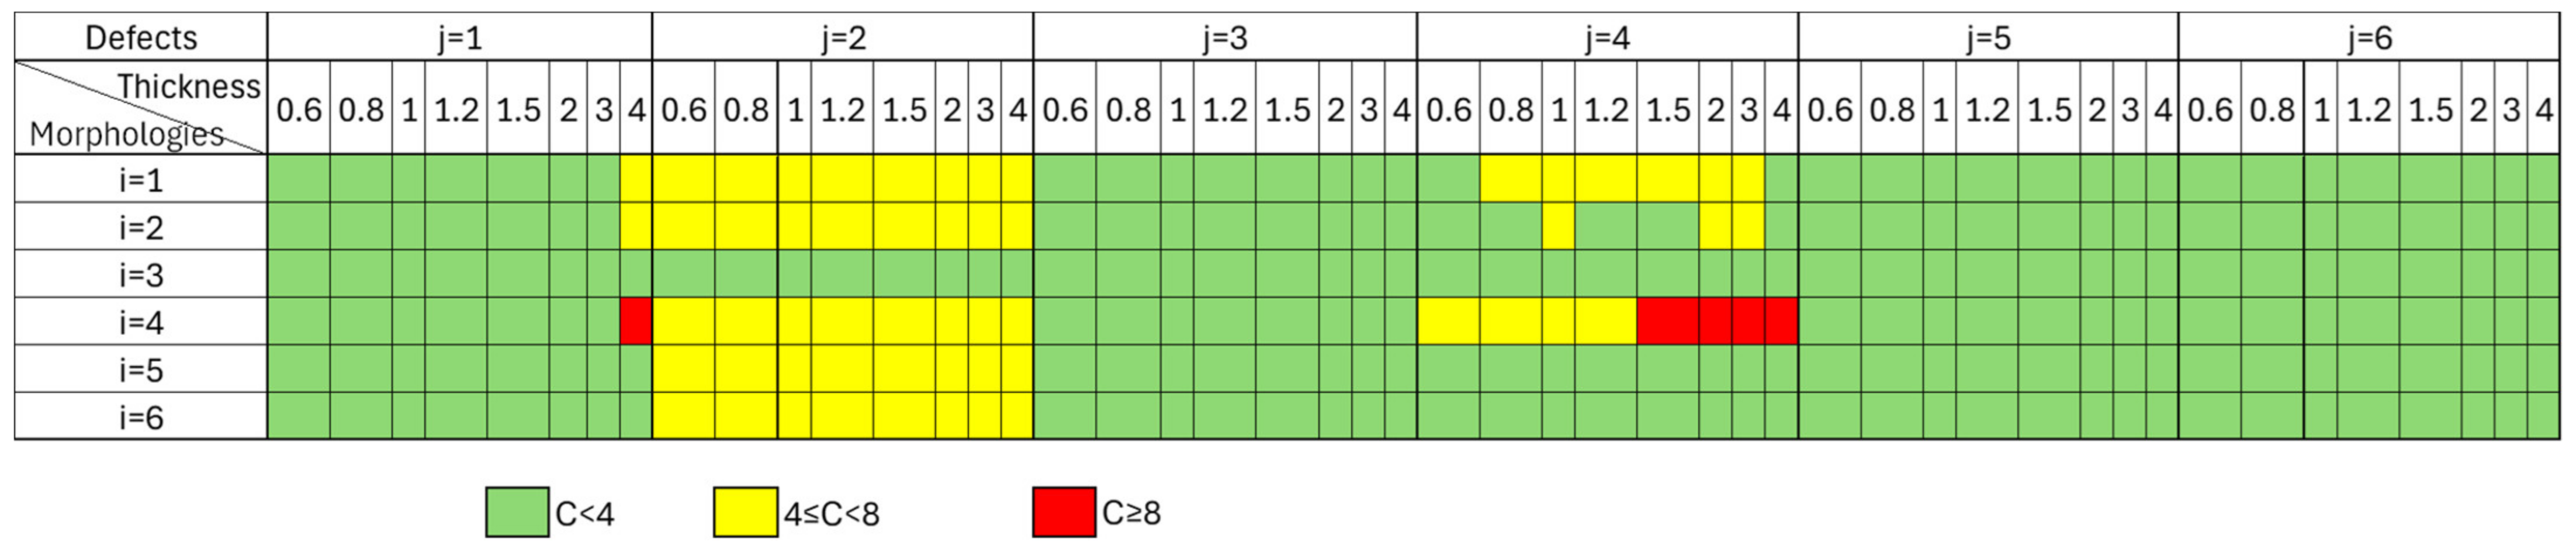
Figure 7 shows the design limits using the established threshold. For this application, the maximum criticality calculated is equal to 12, so it is possible to colour in green the criticalities of defects on the morphology that are less than 4, those between 4 and 8 in yellow, and those above 8 in red. This analysis gives a better view of the design limits and provides designers with an initial design support tool.
For small arcs, adherent slag is more critical within the 0.6 mm to 1.5 mm thickness range. For this same thickness range, burrs are three times less critical. From 3 mm to 4 mm thick, the trend is reversed, with burrs being twice as critical as slag. These results highlight the minimisation of slag between 0.6 mm and 3 mm and the minimisation of burrs between 3 mm and 4 mm in this morphology. This makes it possible to identify priority optimisation windows. In the same way, for long arcs, the evolution of the criticality of adherent slag and burrs differs according to the thickness. In fact, a decrease in criticality is observed from 2 mm upwards, and this decrease is more significant for adherent slag than for burrs, compared with the previous morphology. This shows that as the arc diameter increases, the criticality of the adherent slag decreases from a certain thickness. For burrs, the trend is identical to the previous morphology, but the criticality is half as critical between 3 mm and 4 mm thickness. These results make it possible to determine a thickness limit, but also a limit for the characteristic dimension of the morphology, in this case a diameter.
Segments are the least sensitive to the appearance of critical cutting defects. This morphology is widely used in studies using the design of experiments to improve the quality of the cut. However, the influence of morphology is not taken into consideration, and these results show that the tests are carried out on the morphology that is least sensitive to the appearance of critical defects. This finding confirms the lack of exhaustiveness of existing studies [
20,
25,
30,
31] and the high interest in studying the influence of morphologies to optimise quality.
Acute angles are particularly sensitive to the appearance of burrs and slag as soon as the thickness exceeds 3 mm. In comparison, right and obtuse angles with an easier rework show adherent slag four times less critical and burrs three times less critical than acute angles. Then, for right and obtuse angles with a more difficult rework, there are slightly more critical defects, but still less severe than those observed on the acute angles. The gravity of the defects is accentuated by the difficulty of rectifying them, which explains the difference between these two morphologies. It is therefore essential to give priority to optimising the quality of acute angles. This observation is in line with the results of the study by Ahn D.-G. and Yoo, Y.-T. [
19] which shows that the size of the angle influences the appearance of excess melt. It shows that the sharper the angle, the more sensitive it is to the appearance of cutting defects [
19]. This study clarifies this influence by showing that the priority optimisations are to minimise burrs from 3 mm to 4 mm and slag of 1.5 mm to 4 mm thickness.
Comparing the criticality of burrs and adherent slags according to different morphologies, acute angles are the most sensitive, followed by small arcs, and lastly medium arcs. The results of this study offer two distinct perspectives.
Firstly, they make it possible to prioritise defects in terms of quality and quantity for each design input, helping to guide optimisation choices. Indeed, the analysis revealed that the most critical defects are thermal, especially burrs and slag. Furthermore, the results show that the morphologies most sensitive to these defects are arcs and angles beyond a certain thickness and characteristic dimension. This initial analysis could be used to initiate research into the optimisation of laser cutting quality in an exhaustive and justified manner. The goal would be to define criticality thresholds to identify the limits. In this way, it would be possible to determine the optimum manufacturing parameters for each morphology and thickness, focusing on the most critical cutting defects according to the thresholds set.
Secondly, this method is applied to the assessment of the criticality of laser cutting defects, but it is entirely possible to change this method by defining other defects and other morphologies, whatever the process being studied. The algorithm in
Figure 4 proposes a framework of the FMECA method that can be adapted to various applications. However, certain recommendations should be taken into consideration, such as the following:
Clearly define the gravity effects specific to the defects studied and the measurement methods available.
Ensure that the factors taken into consideration are independent of each other.
Define limits for each factor. Adapt the weights of the factors according to the application, ensuring that the minimum criticality is equivalent to one.
Then, to analyse the results, it is recommended to use a table to calculate the criticality, and the results can be presented in different ways, for example, a three-dimensional graph as in
Figure 6, or operating windows where the thickness is on the y-axis, the morphologies on the x-axis, and the criticality is shown by a gradation of colours according to the thresholds established. This second visualisation of criticality will help in the decision-making process to optimise cutting quality.
This approach enables a detailed visual analysis of the design parameters that influence the quality of the cut.
7. Conclusions
This study presents a clear method for measuring and comparing cutting defects between different morphologies and thicknesses, allowing accurate assessment of part quality. The results show that design parameters, in particular morphologies, have a significant impact on the quality of cut, filling an important gap in the current literature. By showing how morphologies (arcs, angles and segments) affect all the types of cutting defects listed in the standard, i.e., burrs, irregular surface profiles, geometric deviations, adherent slag, cracks and burns, this study highlights the importance of taking them into account when optimising the quality of the cut [
10].
This method also introduces a useful indicator called ‘criticality’, which allows different types of defects to be compared within the same part, giving an overall view of the quality of the part. According to the literature, manufacturing parameters influence quality. Similarly, this research shows that design parameters can also be used to reduce cutting defects, particularly morphologies. By evaluating all the standard defects at the same time as the characteristics of the part, this method provides useful tools for improving the quality of industrial processes. For example, in the industrial case of this study, the method used made it possible to identify the two most influential morphologies on two types of defects, namely arcs and angles, which influence the appearance of burrs and slag, which are very critical for quality. Their influence depends on a certain thickness, which makes it possible to define a design limit for each of these morphologies.
It is important to note that certain improvements are possible in the application of the proposed method. In particular, the assessment of gravity depends solely on the experience of the operators and is therefore more subjective. Research has been carried out to quantify the difficulty of rework based on the geometry of the rework tool by defining an accessibility zone. It was not easy to make this assessment more objective, which is why we opted for surveys of experienced operators. Similarly, the detection method can be a source of human uncertainty. It would be interesting to propose a more robust method.
The next step will be to reduce the criticality of these priority defects and morphologies using the best manufacturing parameters. Further studies should test this method with different materials, thicknesses and cutting processes to confirm its effectiveness in other cases. Some preliminary tests have been carried out on parts similar to this study, cut from stainless steel using the same process. Other similar parts were also manufactured using a flame-cutting process, as the standard is the same for cutting defects in flame cutting, laser cutting and plasma cutting [
10]. The results showed that it was possible to prioritise cutting defects according to design parameter using other materials and other thermal cutting processes. It would be interesting to conduct a more complete study to propose recommendations for the adaptation of this method. This study focuses only on optimisation parameters that have already been studied in the literature, such as manufacturing and design parameters. It highlights the influence of morphologies, less explored in the literature. This method can also be used to quantify the influence of other parameters on the cutting quality, such as the composition of the assist gas, humidity or ambient temperature, for example.
This research not only provides a clear picture of current quality levels, but also practical tools to help industries optimise quality on an ongoing basis.


