Article

Bayesian Optimization-Based Parameter Identification for Discrete Element Method Simulation of Consolidation and Its Application to Powder Spreading Analysis

1
Degradation Diagnostics Research Team, Integrated Research Center for Resilient Infrastructure, National Institute of Advanced Industrial Science and Technology, 1-1-1 Higashi Tsukuba, Ibaraki 305-8567, Japan
2
Additive Manufacturing Group, Research Center for Structural Materials, National Institute for Materials Science, 1-2-1 Sengen, Tsukuba 305-0047, Japan
*
Author to whom correspondence should be addressed.
J. Manuf. Mater. Process. 2025, 9(12), 383; https://doi.org/10.3390/jmmp9120383
Submission received: 24 October 2025 / Revised: 18 November 2025 / Accepted: 20 November 2025 / Published: 21 November 2025

Abstract

This study develops a Bayesian optimization framework to calibrate two discrete element method (DEM) parameters—the cohesion-related surface energy coefficient (k) and the rolling resistance coefficient (μr)—based on experimental void ratio data obtained from powder consolidation tests. The optimized parameter set reproduces the void ratio obtained from the consolidation experiment, demonstrating efficient and physically plausible calibration under confined loading. However, when these parameters are applied to powder spreading simulations, the resulting powder beds become excessively cohesive, leading to poor layer uniformity. This discrepancy is attributed to (i) the mismatch in mechanical scaling (σ/E) between the experimental and simulated conditions and (ii) the shift in dominant particle-scale mechanics from normal-force-controlled consolidation to shear-dominated spreading. The results indicate that DEM parameter calibration for powder bed-based additive manufacturing should incorporate shear-related experimental metrics and scaling considerations rather than rely solely on consolidation-based fitting.

1. Introduction

The deterioration of transportation infrastructure such as bridges has become a critical issue in many countries worldwide, including Japan. Repairing such infrastructure requires restoration measures that are commensurate with the extent and nature of the degradation. In recent years, additive manufacturing (AM) technologies have attracted significant attention as innovative approaches for the maintenance and repair of bridges.
This study focuses on laser powder bed fusion (PBF-LM), one of the AM processes. In the PBF-LM process, thin layers of metal powder are sequentially spread and selectively melted and solidified by a moving laser beam, thereby enabling the fabrication of arbitrarily shaped three-dimensional objects. In such manufacturing processes, it is naturally anticipated that both the condition of the spread powder layer, often referred to as the powder bed, and the laser processing parameters, including laser scanning speed and laser power, significantly influence the quality of the fabricated parts.
Conventionally, laser technology has been extensively investigated in the field of metal laser welding, and correspondingly, numerous studies have been conducted on the influence of the laser processing parameters on build quality in PBF-LM. It has been reported that the dimensions of the molten pool formed by the laser—specifically its depth, width, length, and their ratios—are correlated with defects occurring during the fabrication process [1,2]. Consequently, research efforts have been directed towards identifying the process window, i.e., the range of laser processing parameters under which various defects do not occur [2,3,4,5,6].
In contrast, comparatively fewer investigations, such as [7], have addressed the effects of the powder bed condition on build quality relative to those concerning laser parameters. One feasible reason for this is that the field of powder engineering has been historically oriented towards the management of large quantities of powder as bulk material. This suggests that applications involving the thin and widespread distribution of powder have historically been less prevalent. In view of this, we aim to evaluate the influence of powder characteristics such as particle size, morphology, and adhesion on the powder bed quality.
Metallic powders with an average particle diameter of several tens of mm have been often employed in PBF-LM manufacturing. At the micrometer scale, adhesion forces arising from electrostatic interactions, van der Waals forces, and humidity become non-negligible compared to the gravitational force acting on the powder particles [8]. To accurately simulate the behavior of the metal powders, it is essential to incorporate adhesion effects within the particle contact force models of the discrete element method (DEM) [9]. Furthermore, it is imperative to ascertain the model parameters that govern the adhesion force in order to accurately reproduce experimental observations.
Conventionally, the process of parameter selection has involved multiple simulation runs with varied parameters, followed by a comparison with experiments. For example, past studies have calibrated DEM parameters to match the experimental angle of repose (e.g., [10,11,12]), while Lupo et al. calibrated the rolling friction coefficient against powder spreading measurements of packing density [13]. In past studies, parameters to be identified are chosen a priori and identified via manual parametric exploration and expert assessment. However, such a manual procedure frequently entails substantial effort and time for parameter identification. From a statistical viewpoint, the parameters may be systematically varied and simulations conducted in an exhaustive manner. Nevertheless, DEM simulations tend to be computationally expensive, and consequently, it is unfeasible to run a large number of cases. The objective of this study is to utilize Bayesian optimization to achieve parameter identification with a minimal number of simulation runs.
The paper is organized as follows. The second section provides a comprehensive overview of the materials utilized in the study, along with a detailed description of the experimental procedures and a thorough exposition of the DEM analysis methodology, and the parameter identification approach, which combines Bayesian optimization with DEM simulations. In Section 3, the identified parameter values are discussed. Also, we conducted the powder spreading simulations using the identified parameters, compared the results with previous studies, and verified the validity of the identified parameters.

2. Materials and Methods

In this study, the squared error between the void ratio obtained from the consolidation experiment and that derived from the DEM simulation of consolidation was employed as the objective function. The optimal parameter set of k and μr was determined by minimizing this objective function through Bayesian optimization. The identified parameters were subsequently applied to powder spreading simulations to examine their transferability. A schematic illustration of the entire procedure is presented in Figure 1, and detailed descriptions of each step are provided in the following subsections.

2.1. Materials Used

We used gas-atomized Hastelloy X (HX) powder (AMPERPRINT 0228.074, Höganäs AB, Höganäs, Skåne Län, Sweden) with a density of 8220 kg/m3. The particle morphology is nearly spherical. The particle diameters were mostly distributed in the range of 10–40 mm, with an average particle diameter of approximately 29 μm [14].

2.2. Consolidation Experiment

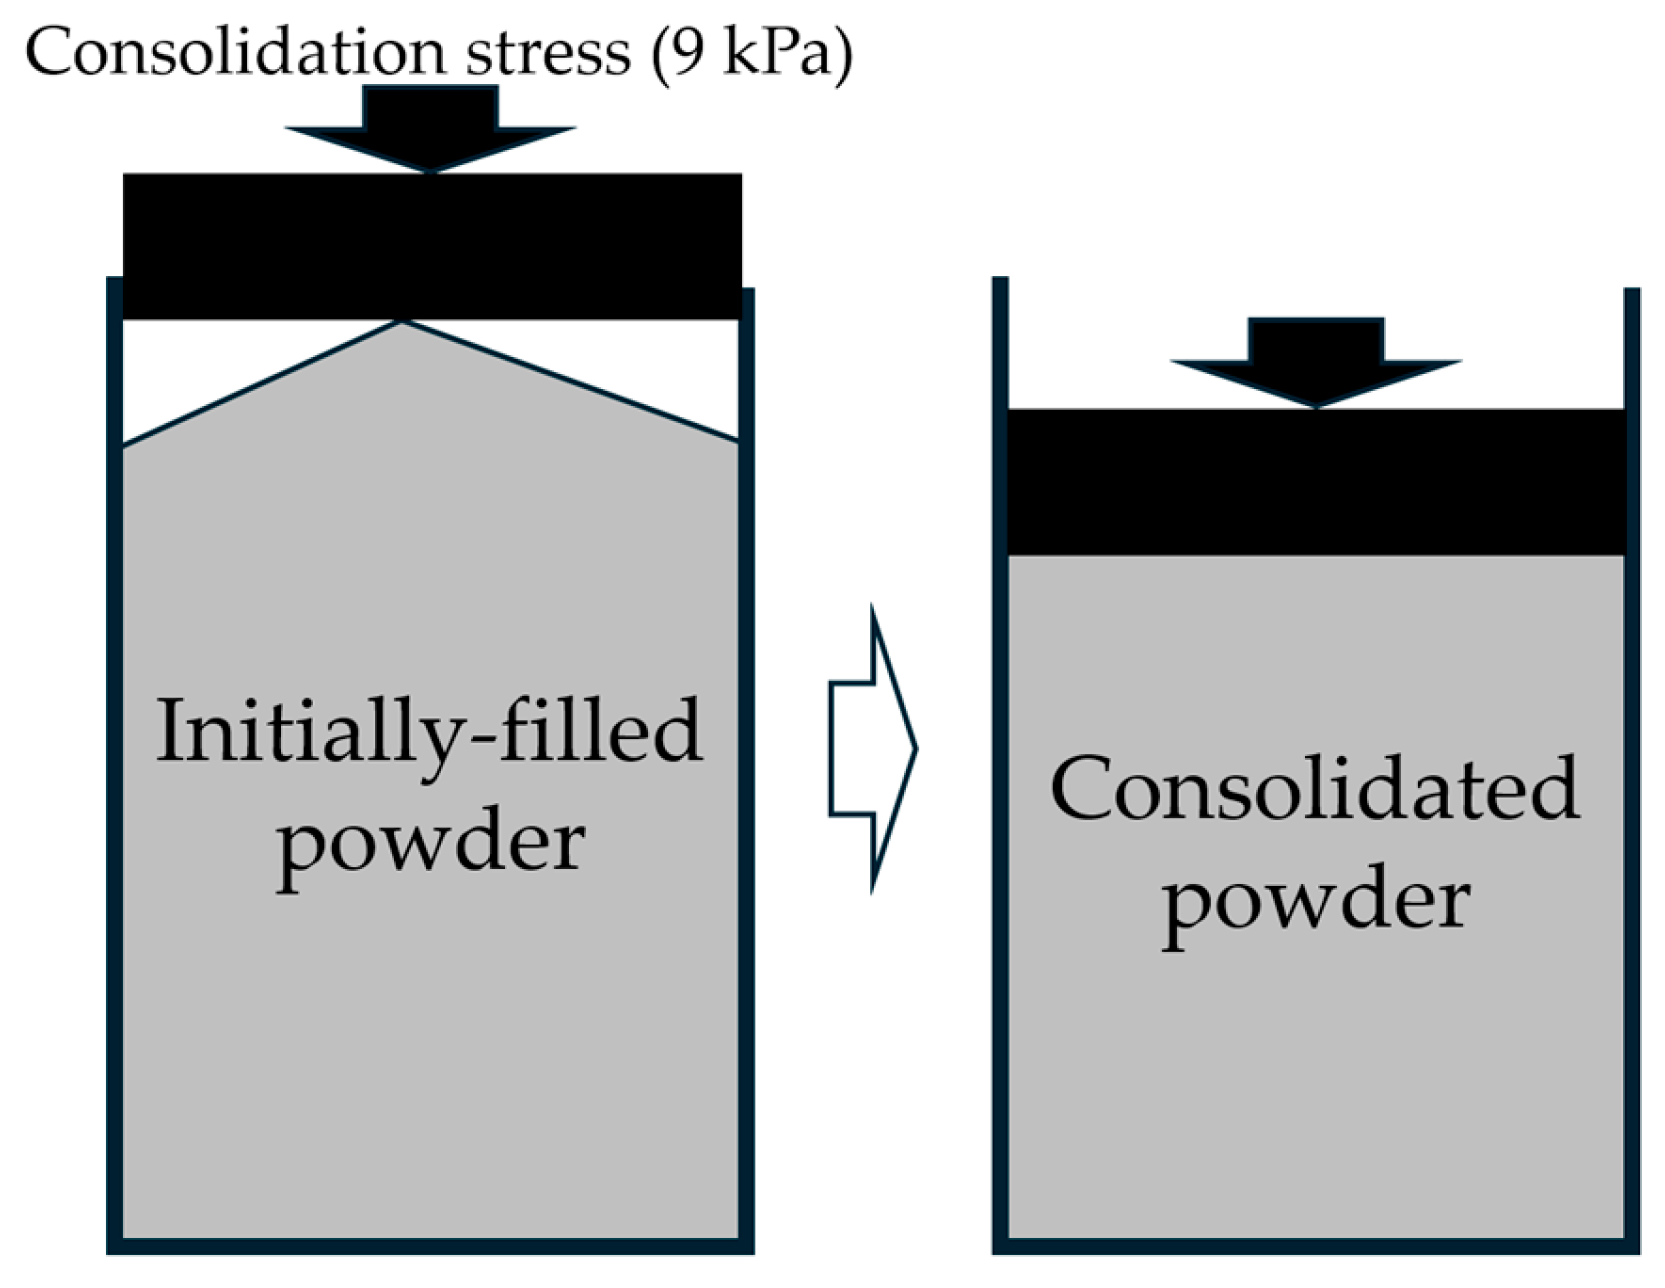
A consolidation experiment was conducted using an FT4 powder rheometer (Freeman Technology Ltd., Tewkesbury, Gloucestershire, UK) [15,16,17]. The cylindrical vessel was initially filled with the powder via a funnel. Subsequently, the powder was compressed by the top wall under a constant applied stress of 9 kPa, as shown in Figure 2. Subsequent to the process of consolidation, the void ratio (e), defined as the ratio of the post-consolidation void volume to the total volume of the particle assembly, was calculated. Smaller values of e indicate a denser packing state.

2.3. Discrete Element Method Overview

The open-source DEM software LIGGGHTS-PUBLIC (ver. 3.8.0) [18] was employed in this study. The simulation parameters are shown in Table 1. In order to reproduce the cohesion of the powders, a simplified Johnson–Kendall–Roberts (SJKR)-type adhesion model (the sjkr2 model) and a rolling resistance model (cdt model) were also adopted [18]. The JKR model and the cdt model are expressed by Equations (1) and (2), respectively.
  F = 4 k π δ n r i r j r i + r j ,
T   r f = μ r   k n   δ n   ω r , s h e a r | | ω r , s h e a r | | r i r j r i + r j ,

2.4. Consolidation Simulation

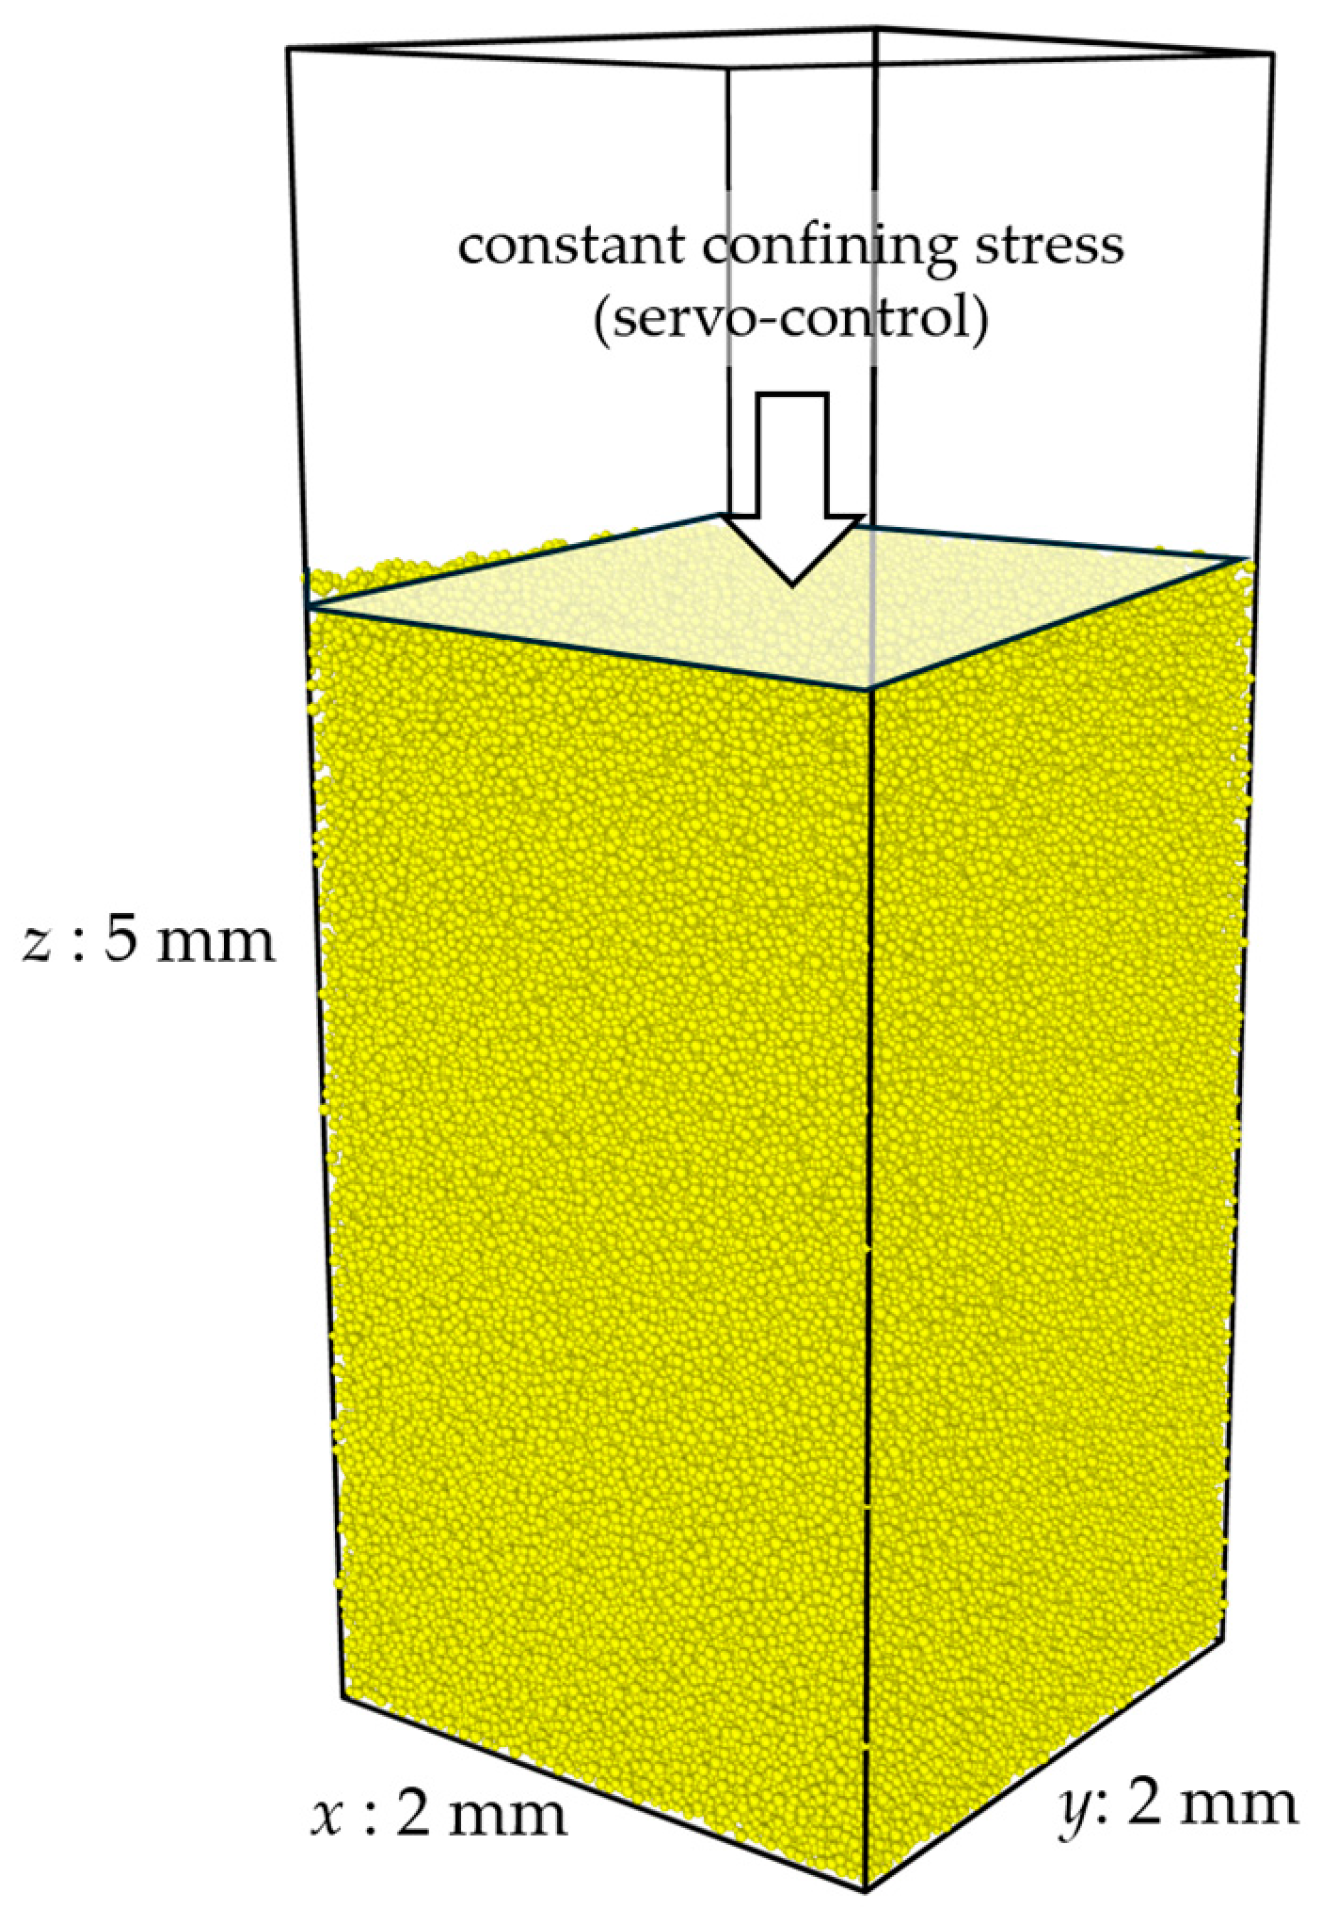
A simulation was conducted to reproduce a certain volume of the element subjected to the consolidation test. Figure 3 shows an example snapshot of the final state of the consolidation simulation. A computational domain of 2 mm in the x and y directions was defined, with periodic boundary conditions. The initial height was set to 5 mm, and rigid walls were placed at z = 0 mm and z = 5 mm under fixed boundary conditions. In total, 500,000 particles inserted from the upper part of the computational domain were settled under gravity. Subsequently, the powder layer was compressed by the servo controlling the upper rigid wall, and then we calculated e.
For the HX considered in this study, Young’s modulus is about 200 GPa [19]. In other words, a consolidation pressure of 9 kPa is maintained by a particle assembly with a stiffness of approximately 2 × 10¹¹ Pa. However, employing a stiffness of 2 × 10¹¹ Pa in DEM simulations results in an extremely small time step, leading to unfeasible computation times. Considering the above discussion, we employed an empirically determined consolidation pressure of 0.9 kPa.

2.5. Bayesian Optimization

Python library GpyOpt 1.2.6 (the required libraries are Gpy 1.13.2, NumPy 1.26.4, Python 3.9) [20] was utilized. Upper and lower bounds were specified for two parameters, and preliminary simulations were conducted for four cases corresponding to the combinations of these bounds, as well as one case using the midpoint values of both parameters, resulting in a total of five initial cases. It should be noted that the optimization was initiated with five initial samples. Although the use of prior information is not strictly necessary, it has been empirically demonstrated that the incorporation of such information generally increases the possibility of identifying an optimal solution. To distribute data points widely in the design space, researchers typically employ grid search or Latin hypercube sampling (LHS). Given the potential for these strategies to inflate the number of simulations, using a coarse-level grid (i.e., a few levels per variable) is frequently a reasonable compromise. The parameter search was then executed using the results of the five initial cases as prior information. The parameter values in Bayesian optimization are summarized in Table 2. The acquisition weight (wa), often referred to as jitter, governs the extent to which prior information is considered, with larger values tending to explore regions further from the prior points and smaller values tending to search in the vicinity of the prior points. The value of wa was manually adjusted for each optimization run. Then, the workflow shown in Figure 1 was conducted to identify the parameter set.
Table 3. Results of preliminary analysis and Bayesian optimization.
Casek [J/m3]μr [-]Void Ratio
0–11020.050.575
0–21050.71.459
0–31020.70.566
0–41050.051.120
0–55 × 1020.40.568
155700.130.569
270,5000.371.064
391000.240.565
436,9000.630.658
542,8000.310.721
655,4000.660.889
717,5000.680.566
856,4000.490.897
969,8000.561.080
1055,4000.560.886
1142,8000.550.716
1256,4000.460.897
best47,5000.50.776
It is important to note that the experimental void ratio target was obtained from a single trial. As anticipated, experimental measurements show random variability. In GPyOpt, measurement noise can be accommodated by setting “exact_feval = False”, which allows the Gaussian process likelihood to include a noise term. When multiple experimental replicates are available, one may supply the replicate observations directly or use their average together with an estimate of the noise variance (e.g., from the sample standard deviation) so that the optimizer treats the objective as noisy and robustness can be assessed.

2.6. Powder Spreading Simulation

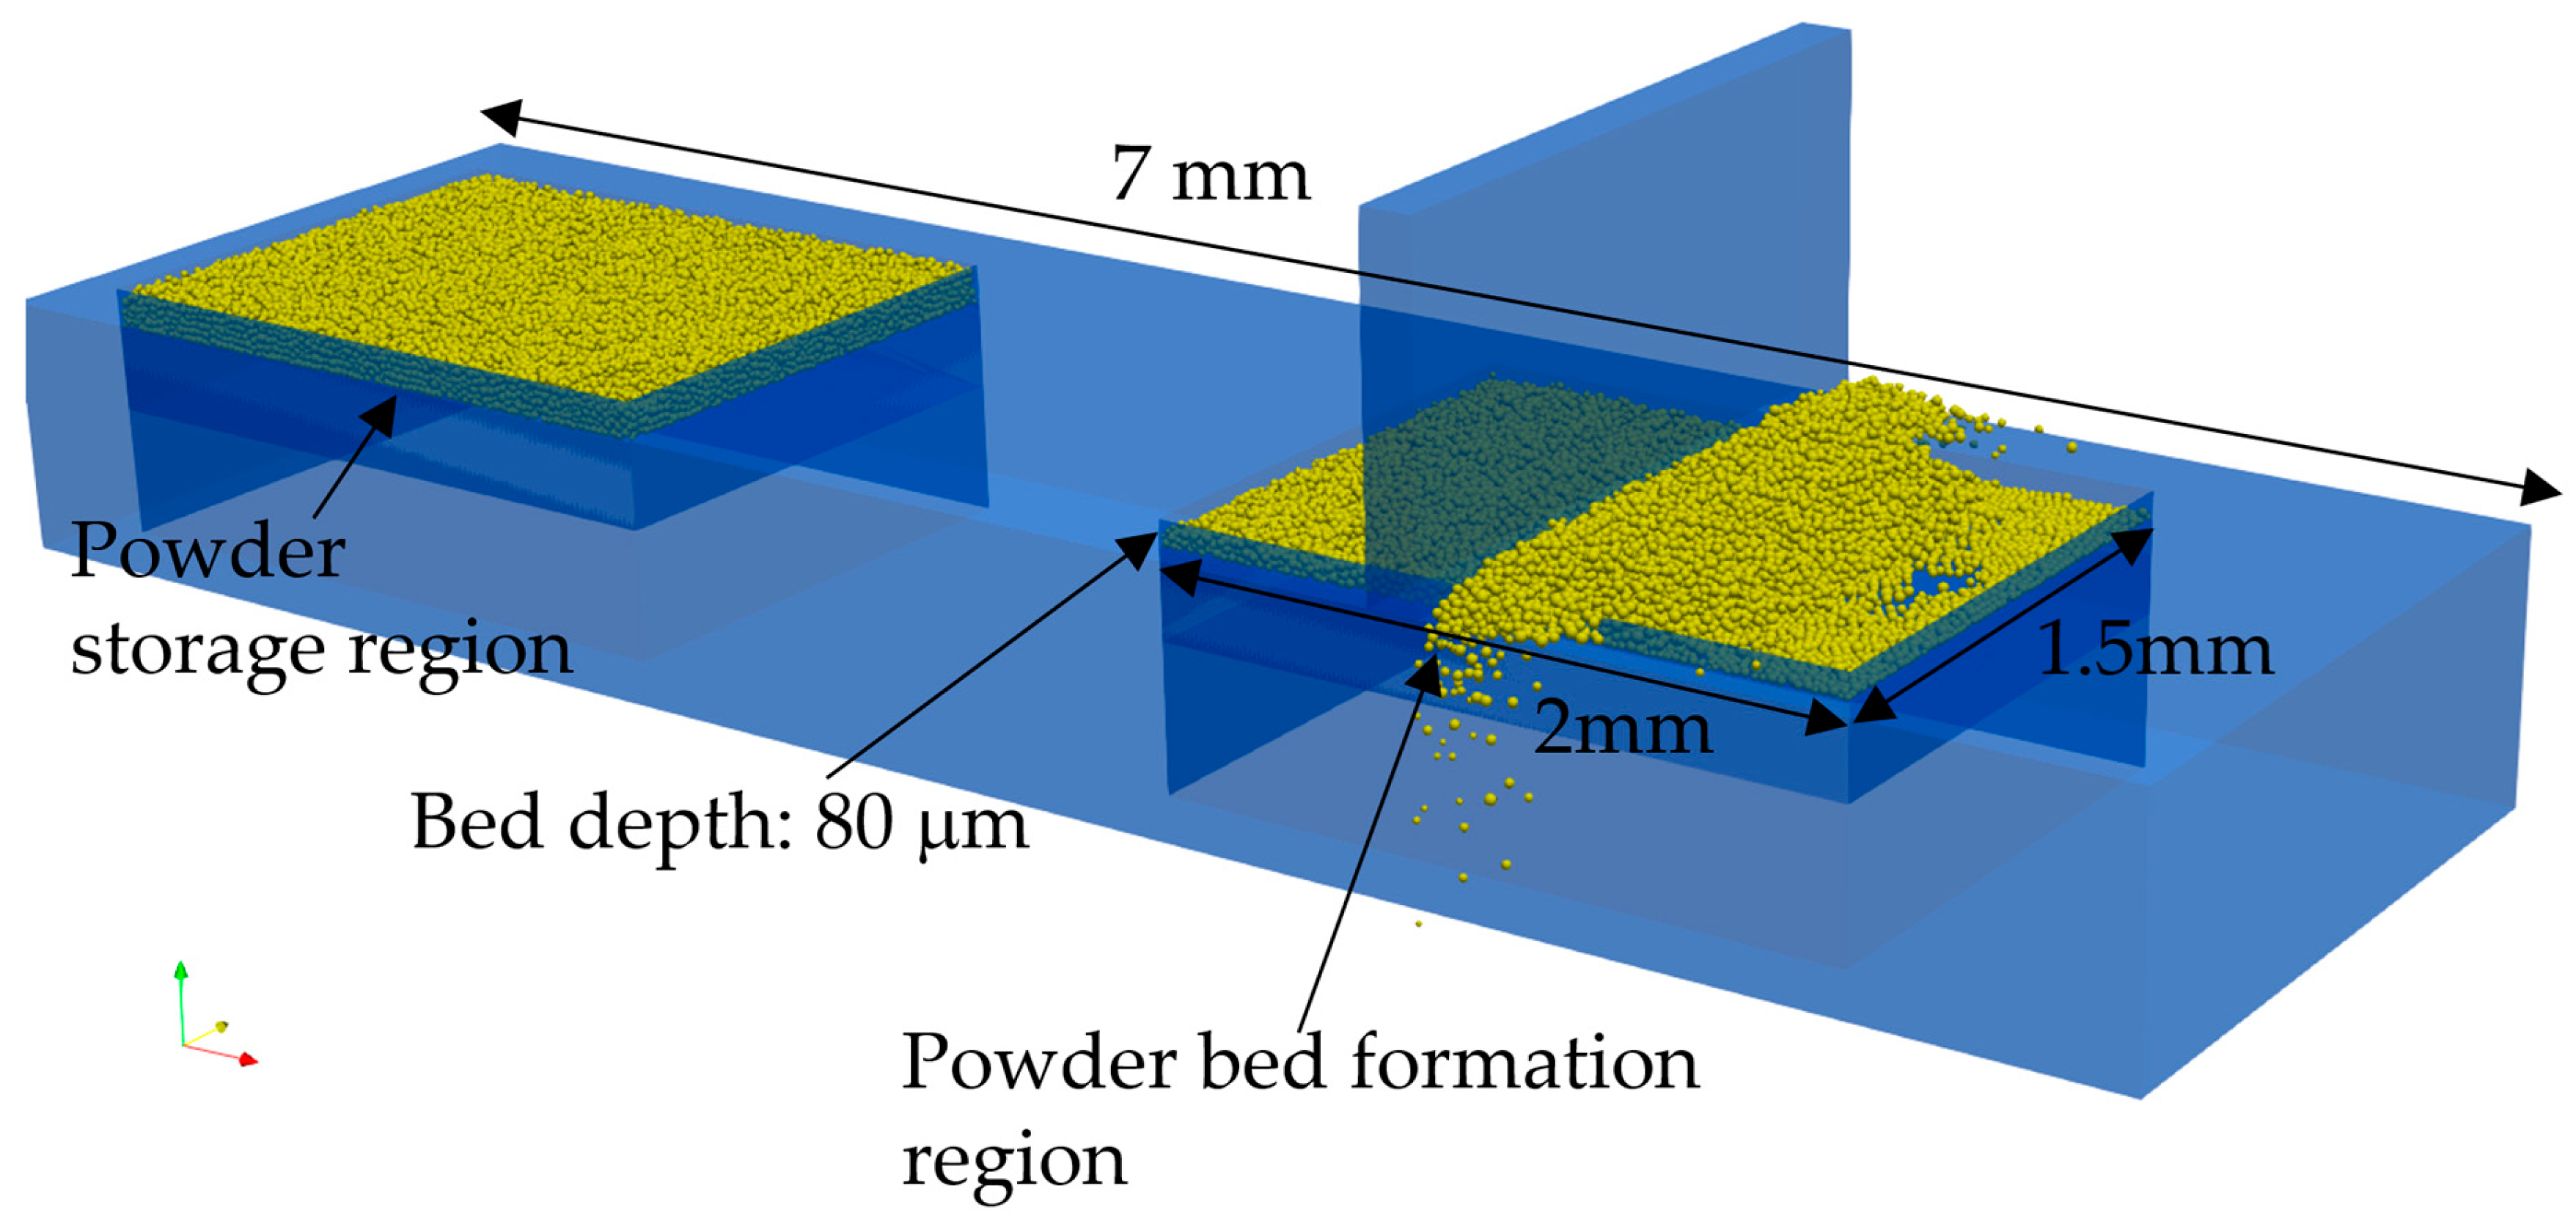
A powder spreading simulation was conducted using the identified parameters. The computational geometry of the powder bed formation simulation is shown in Figure 4. Initially, 50,000 powder particles were deposited into a designated powder storage region by gravity. Thereafter, a rectangular coater blade, located behind the storage region, was translated at a constant velocity of 25 mm/s to disperse the powder into the powder bed formation region located in front of the storage region. The depth of the bed formation region was set to 80 mm. Moreover, the computational domain was specified as a rectangular volume extending beyond the geometrical boundaries of the model, and particles reaching the domain boundaries were deleted. This boundary condition is the f boundary style implemented in LIGGGHTS [18].

3. Results

3.1. Optimization Results

Before conducting Bayesian optimization, preliminary analyses of consolidation were performed for the cases listed in case numbers 0–1 and 0–5 in Table 3. These cases correspond to combinations of the minimum and maximum values of the two parameter sets, as well as the results obtained using intermediate values of the two parameters. The Table 3 also provides the void ratios that were obtained from the DEM simulations. The void ratio exhibited a range of values between 0.575 and 1.459, depending on the parameter values. The experimental value was found to be 0.783, which is believed to be achievable within the specified parameter ranges. Consequently, the search ranges for the parameters were set to k = 102 to 105 J/m3 and mr = 0.05 to 0.7.
Using the five preliminary analysis results as prior information, optimization calculations were performed, and the results are summarized in Table 3. The Table 3 presents the results obtained from 12 trials. It is important to note that in these 12 trials, wa was varied between 0.01 and 1, depending on the results. Although no parameter set was identified that could exactly reproduce the experimental void ratio of 0.783 across the 12 trials, cases 5, 6, 8, 10, 11, and 12 achieved values that were relatively close to the experimental one. Hence, it was determined that when k and mr were designated as 47,500 J/m3 and 0.5, respectively, the DEM simulation yielded a void ratio of 0.776.
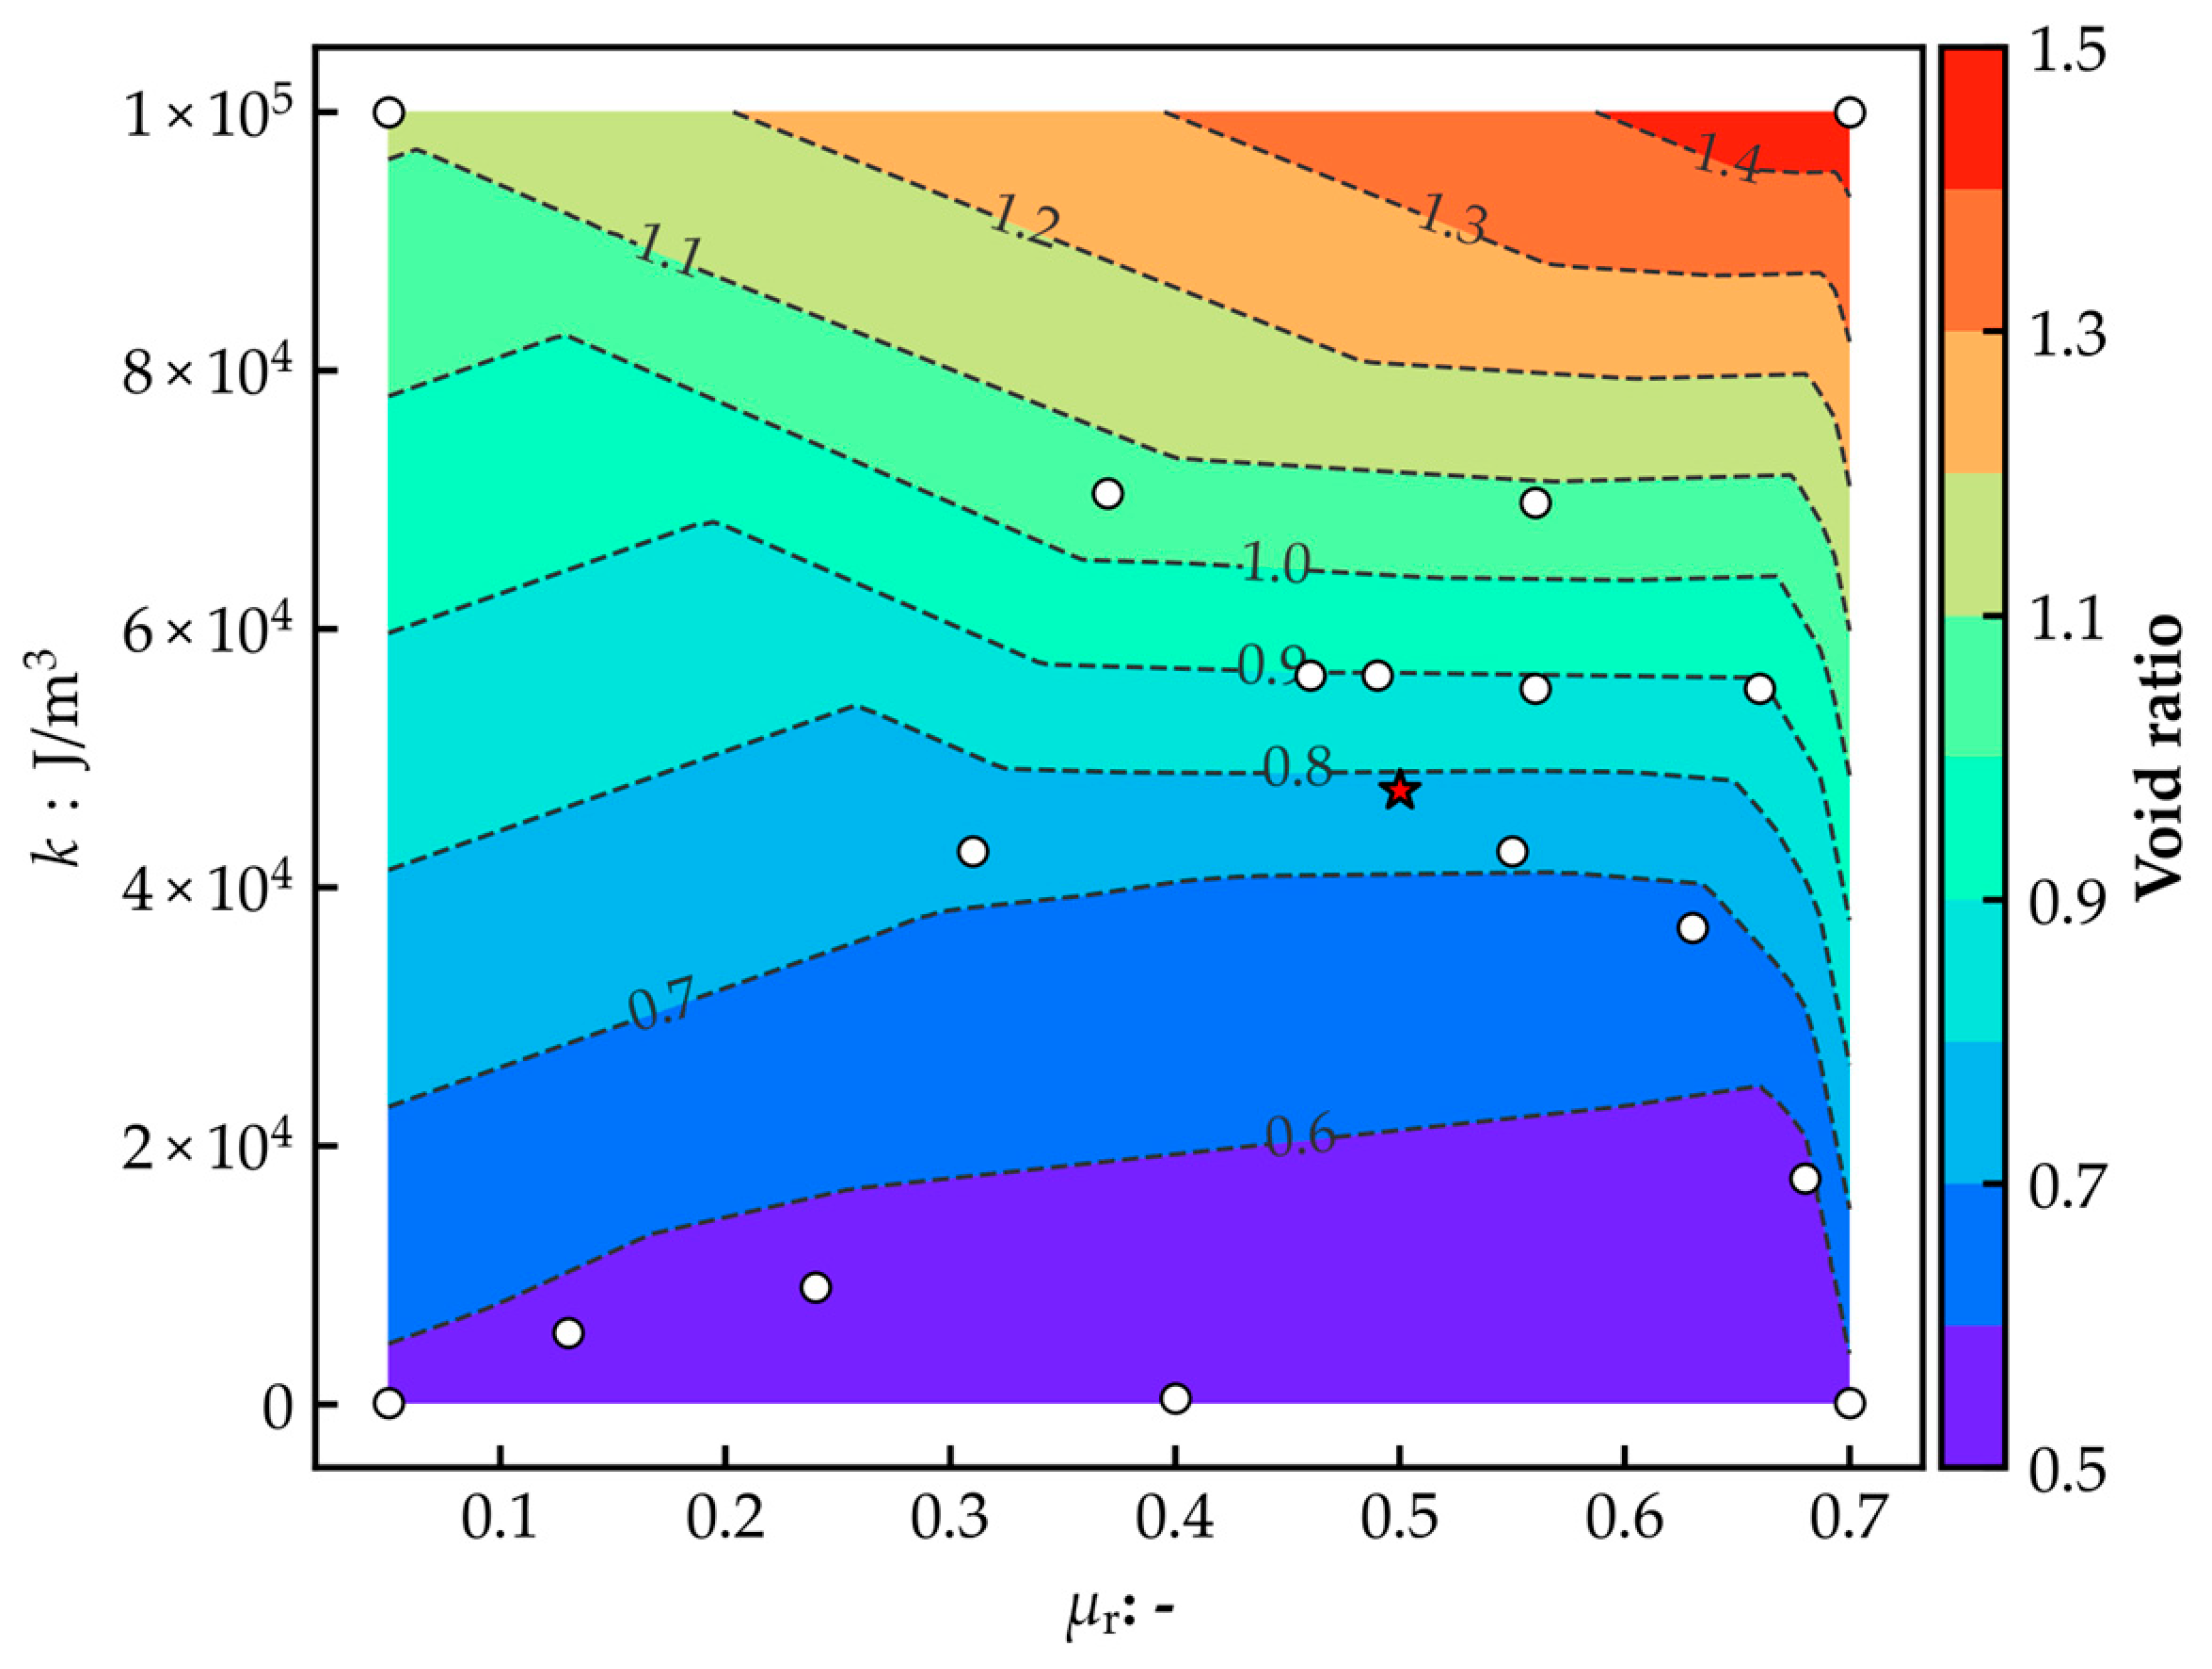
Figure 5 presents a color map of simulated void ratio esim (k,μr). The horizontal and vertical axes correspond to cohesion-related parameter k and rolling-friction coefficient μr, respectively. The color field is obtained by interpolating the simulated values in Table 3 using the SciPy library (Python). White circles mark the actual simulation points listed in Table 3, and the red star denotes the previously identified optimal condition. It has been observed that, under the framework of Bayesian optimization, the search process exhibits a propensity to explore the vicinity of the red star, even in the initial stages of optimization. Despite the fact that points in proximity to the red star were repeatedly predicted, it proved challenging to achieve convergence toward values that more closely aligned with the experimental results, i.e., the optimal value. In Bayesian optimization, the prediction model is iteratively updated based on the accumulated results. Increasing the number of trials does not necessarily yield a better parameter set than those already obtained. This behavior differs from optimization methods that rely on gradient-based approaches. In the gradient-based approaches, the next candidate point is obtained by following the gradient from the initial value so that repeated trials progressively approach the optimum value. In contrast, Bayesian optimization employs Gaussian process regression to explore regions of the solution space that are not included in prior information. This suggests that the parameter sets that can reproduce the experimental void ratio can be proposed, even with a small number of trials. In the present study, a near-optimal value was obtained as early as the fifth trial in Table 3. On the other hand, depending on the wa value, subsequent candidates are directed towards the sparsely sampled region of the solution space. Hence, an increase in the number of trials does not guarantee the approach to the optimum value. This characteristic is both an advantage of Bayesian optimization and a factor that complicates convergence assessment.
In recent years, significant attention has been focused on concepts such as human-in-the-loop (HITL) optimization, e.g., [21,22,23]. The term HITL is used to denote methods in which human judgment is incorporated into the optimization process. In the present optimization procedure, the value of wa was adjusted by the user based on the simulation results, which can be considered a form of HITL. Nevertheless, the evaluation of the results was based on a mechanistic criterion: the minimization of the squared error relative to the experimental values. Consequently, although a human might have estimated the optimum by the fifth or sixth trial, additional trials were conducted. For problems where the solution is a continuous function, gradient-based optimization methods guarantee convergence towards the optimum with repeated trials, which allows fully automated optimization. In contrast, for many engineering problems where the form of the solution is unknown, the active incorporation of human judgment in the selection of optimization parameters and the evaluation of objective values can be crucial to achieving successful optimization.
It is important to note that the number of parameters to be identified was only two in the present study. In many engineering optimization problems, the number of parameters may often exceed ten. In such cases, it becomes critically important to cover the minimum and maximum ranges of the solution space with as few preliminary trials as possible. Such techniques, including orthogonal arrays and Latin hypercube sampling, can be employed to sample the parameter sets. However, prior to Bayesian optimization, a minimum of several tens of preliminary simulations are likely to be necessary.
In the original optimization trial, we varied wa (the EI exploration parameter); hence the effect of wa on convergence is not clear. Consequently, a parametric study was conducted with respect to wa. To maintain a reasonable computational cost, the DEM evaluations in the workflow of Figure 1 were substituted with a surrogate model that was trained on the dataset presented in Table 3. The surrogate model maps the two inputs (k, μr) to the void ratio (output). Six regression algorithms were assessed in this study: Gaussian Process Regression (GPR), Random Forest (RF), Gradient Boosting (GB), Support Vector Regression (SVR), Ridge Regression, and k-Nearest Neighbors (kNN). The RF surrogate was selected because it yielded the highest coefficient of determination (R2) on hold-out validation.
A single DEM run requires about 8 h, whereas the surrogate returns a prediction in less than 1 s. This speed enhancement enables a systematic exploration over wa. Note that the number of simulation results were limited, which implies that higher-fidelity surrogate requires additional cases.
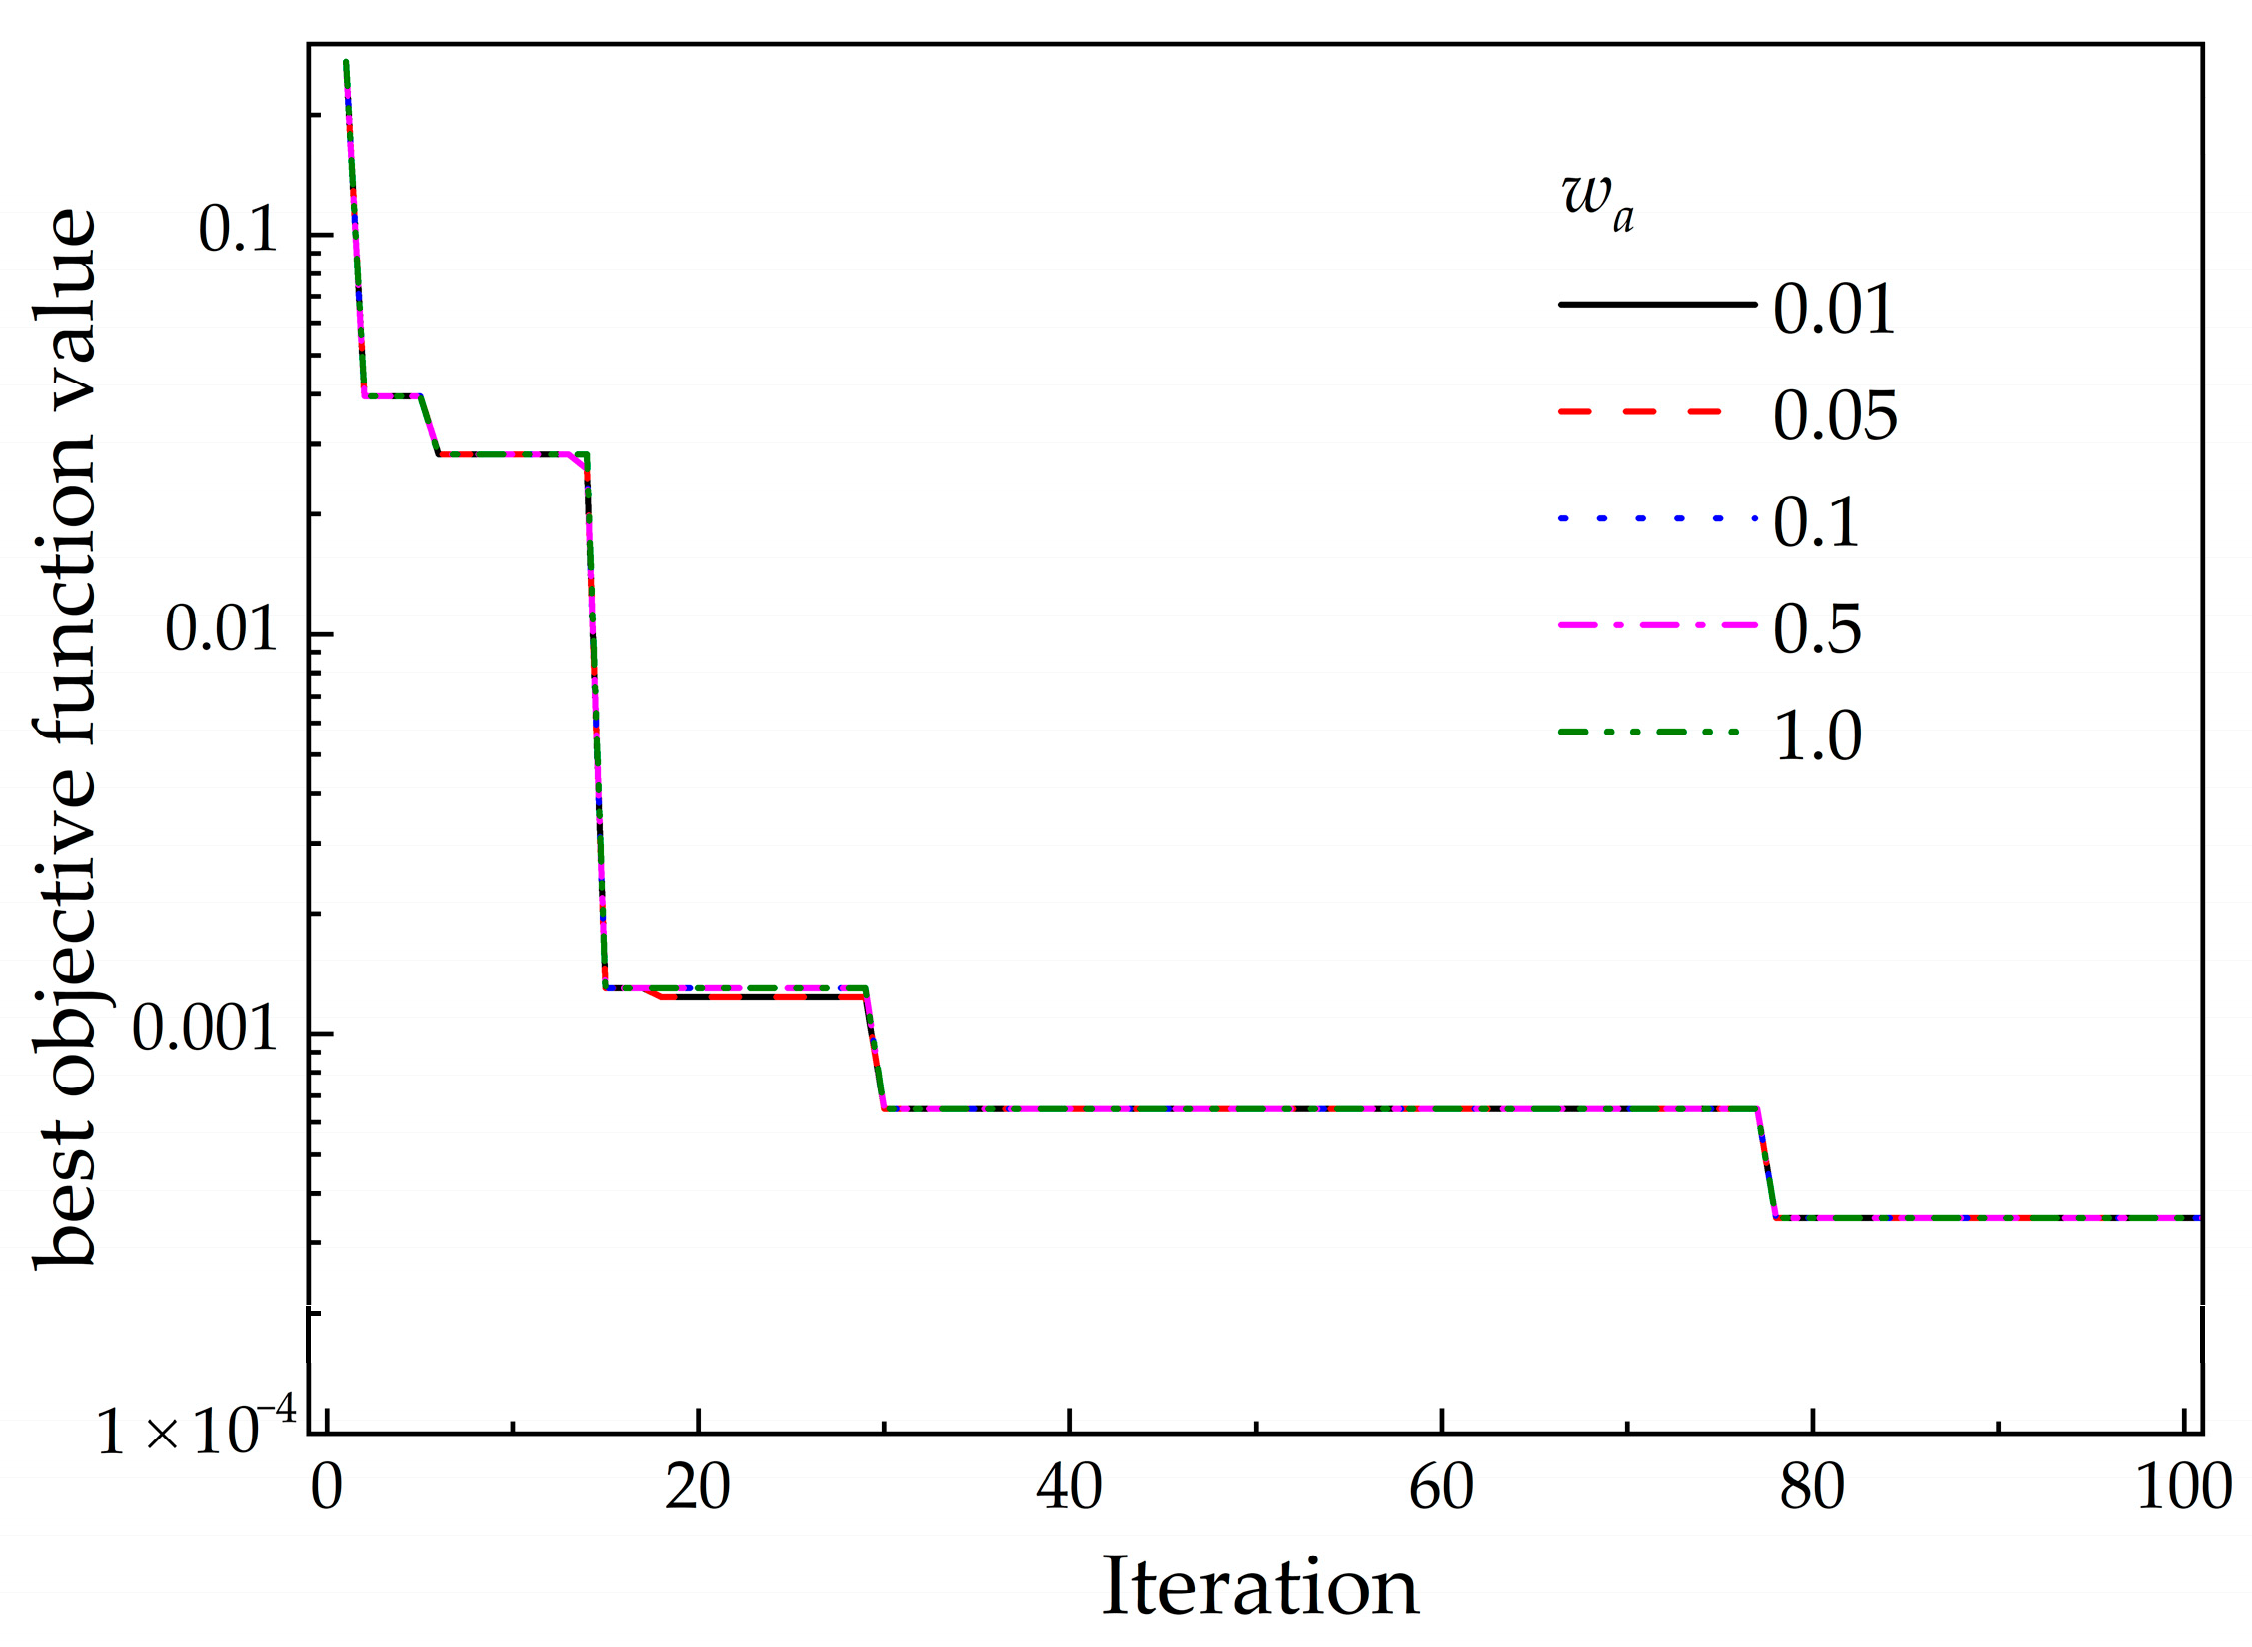
Figure 6 shows the evolution of the minimum objective function value during the optimization. The execution of Bayesian optimization with wa = {0.01, 0.05, 0.1, 0.5, 1.0} held fixed has yielded the same result: k = 48,779.3 J/m3 and mr = 0.60. These results suggest that the impact of wa on the optimization path and the attained optimum is negligible under the present conditions.

3.2. Powder Spreading Simulation Using the Parameters Estimated

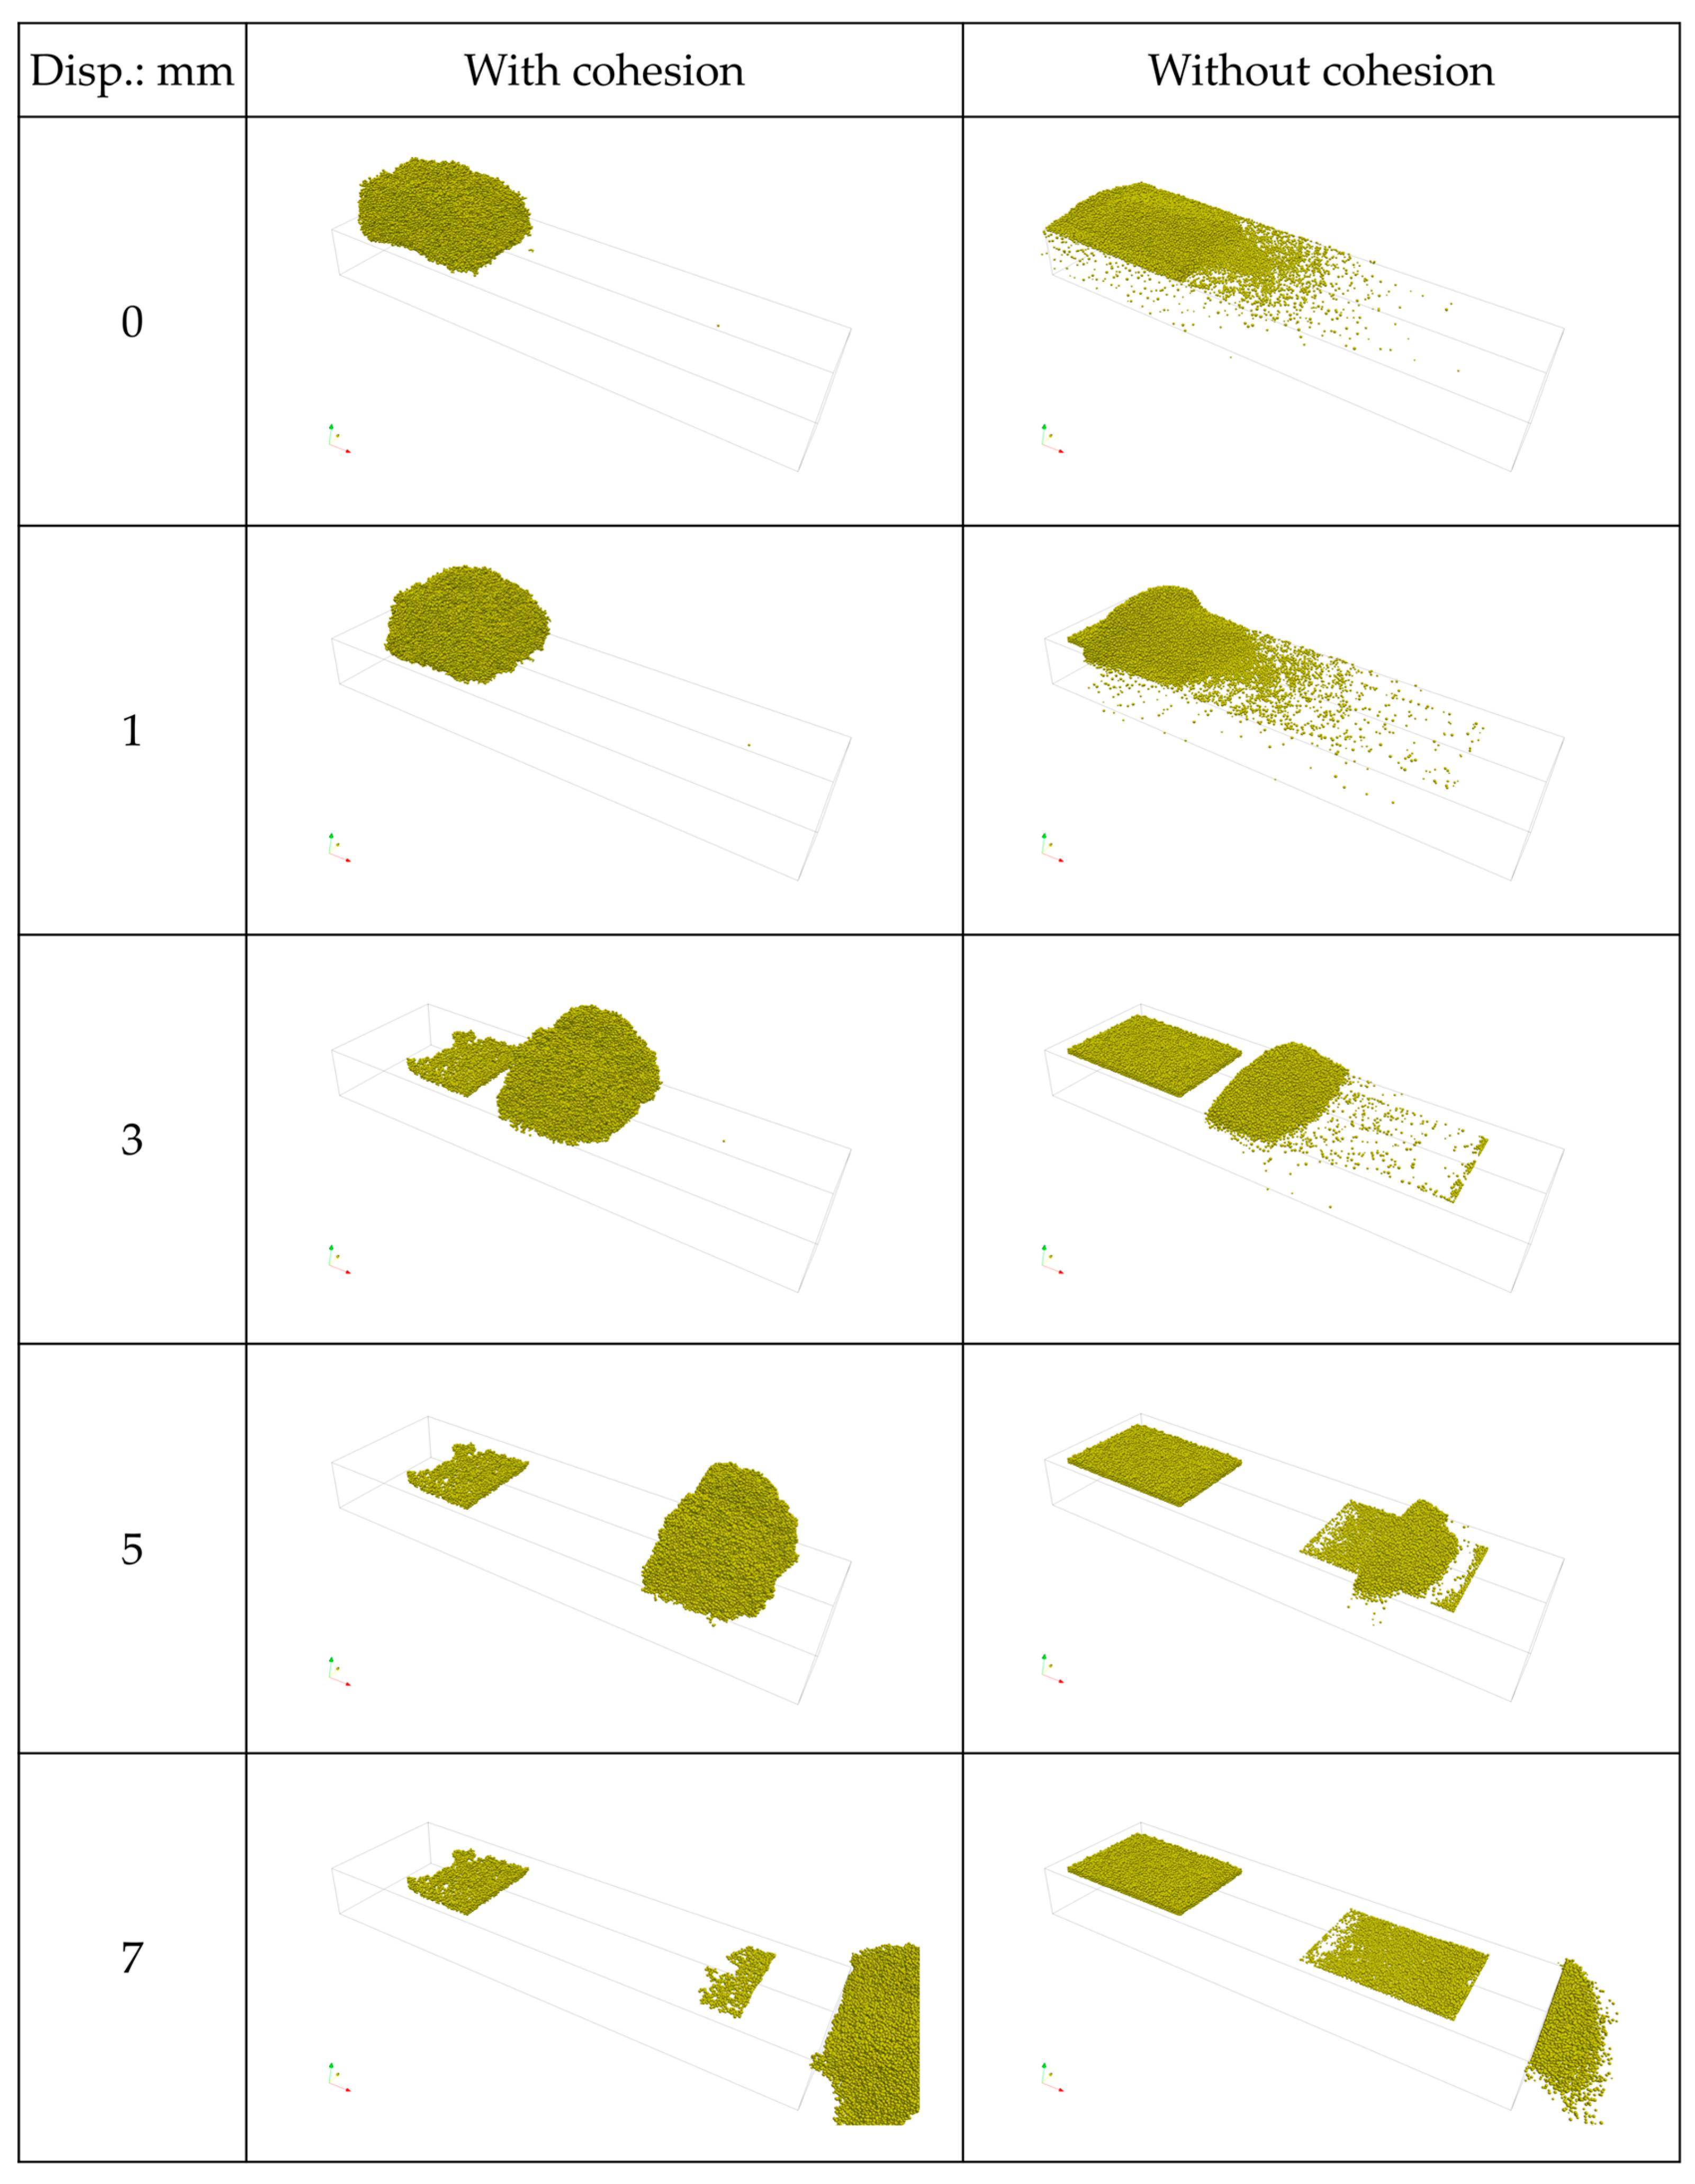
Figure 7 presents snapshots of the simulations performed with the parameter sets identified by Bayesian optimization and the simulation lacking the adhesion model. In the simulation with adhesion, a strong inter-particle adhesive force is apparent, resulting in the collective movement of powder particles as a uniform mass. Moreover, the strong adhesion of the powder bed results in its formation being limited to a small portion of the domain. The powder bed formed under these conditions appears to differ to that observed in actual PBF-LM manufacturing. This finding suggests that the parameter set calibrated to reproduce the consolidation may overestimate the adhesive properties of the particles.
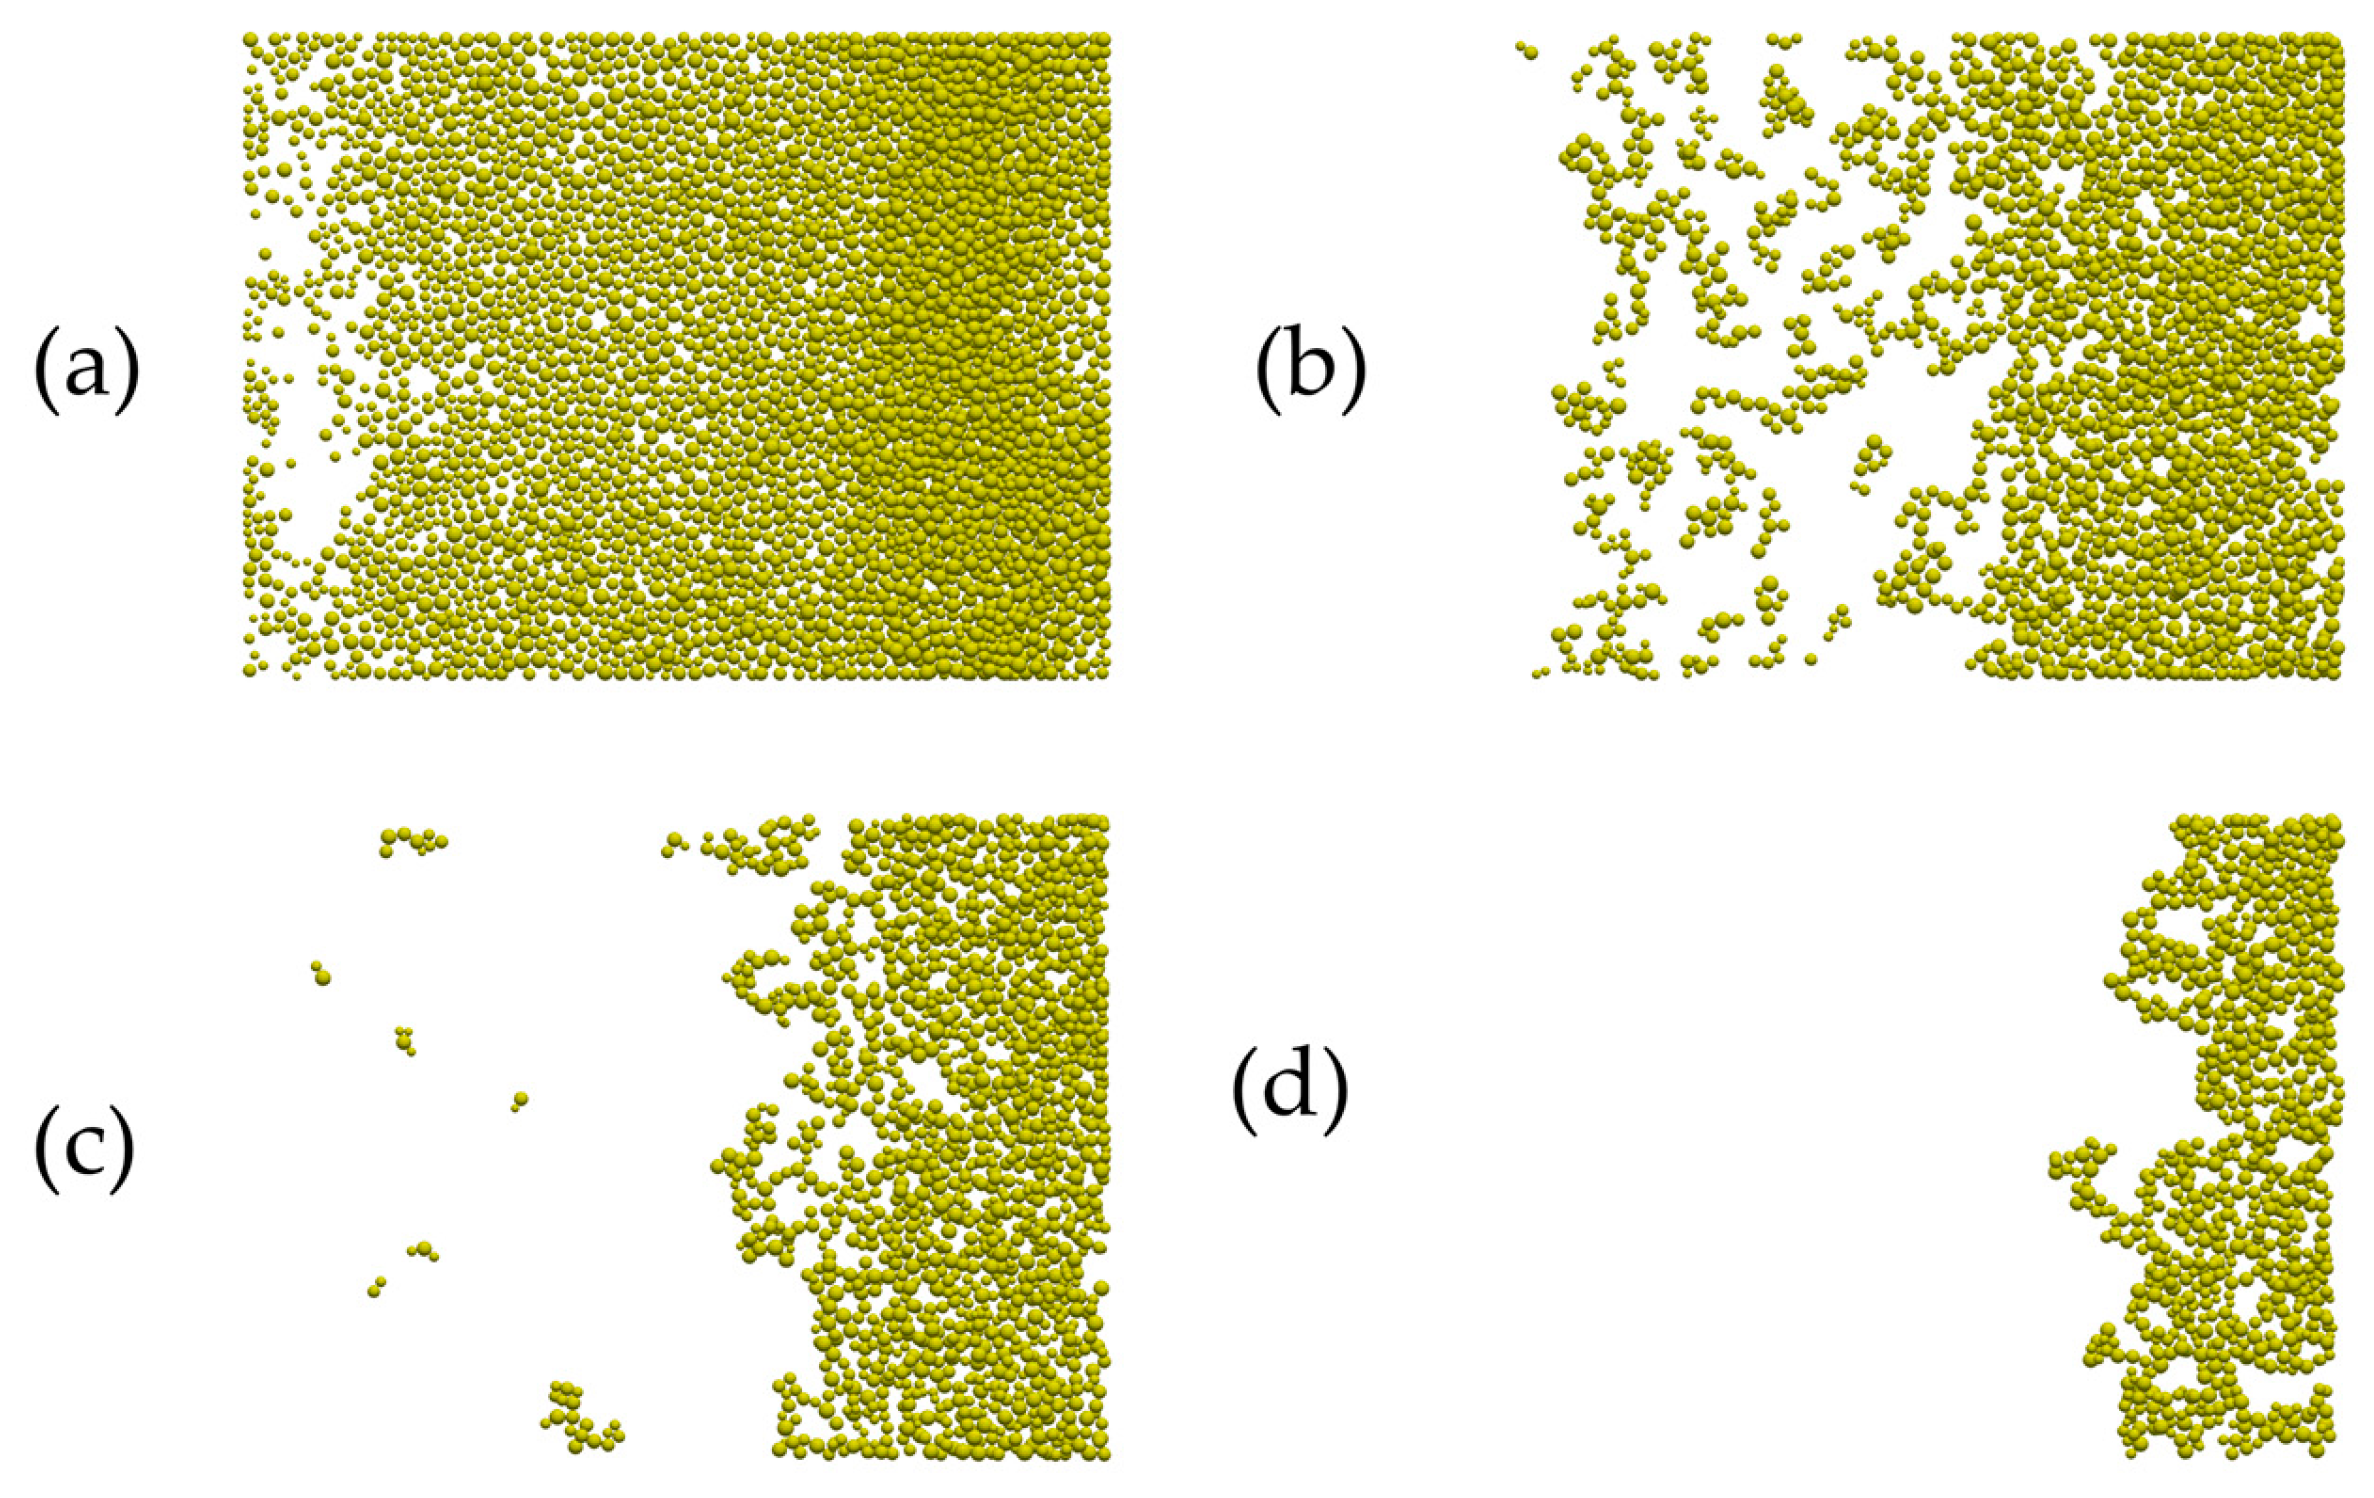
Accordingly, simulations were conducted with k set to 23,750 and 15,833 J/m3; these results, the result with k = 47,500 J/m3, and the result without cohesion are illustrated in Figure 8. It is evident that as the magnitude of k decreases, the inter-particle adhesion weakens, which results in the formation of a broader powder bed region. According to previous experimental studies [24,25], the powder beds do not become densely and homogeneously packed but instead appear to exhibit a sparse structure. In the simulation with k = 15,833 J/m3, a sparse structure consistent with previous experimental observations is formed.

4. Discussions

In light of the aforementioned observations, it can be concluded that the parameter set determined to reproduce the consolidation is not able to reproduce the powder bed formation. This discrepancy is hypothesized to arise from two factors: (1) the difference in scaling and (2) difference in particle-scale dynamics between the consolidation and powder spreading.

4.1. Scaling

Guided by Buckingham’s P theorem, we first specify the response of interest—here, the void ratio, e, which is dimensionless—and identify the dominant physical quantities governing uniaxial consolidation under quasi-static loading. With the representative length (particle diameter D) held fixed and other conditions kept constant, the principal scales are the applied consolidation stress, σ, and the material stiffness (Young’s modulus E). A convenient dimensionless group that characterizes consolidation is therefore
Π 1 = σ E .
Our scaling requirement is to match P1 for the experiment and simulation. Denoting the experimental conditions by subscript “0” and DEM conditions by “1”, we impose
σ 0 E 0 = σ 1 E 1 .
In the experiments, σ0 = 9 kPa and E0 = 2 × 10¹¹ Pa. To mitigate the time step constraint in the DEM simulations, we set E1 = 5 × 10⁶ Pa. Enforcing Equation (4) yields the equivalent consolidation stress:
σ 1 = σ 0 E 1 E 0 =   0.225   P a .
Thus, by matching σ/E, we preserve the leading non-dimensional control parameter relevant to e while permitting a smaller E (and hence a larger stable time step) in DEM. We note that if additional mechanisms (e.g., adhesion or rate effects) are significant, further P groups may be required; in the present consolidation setting, P1 = σ/E provides the first-order scaling used to set the simulation load.
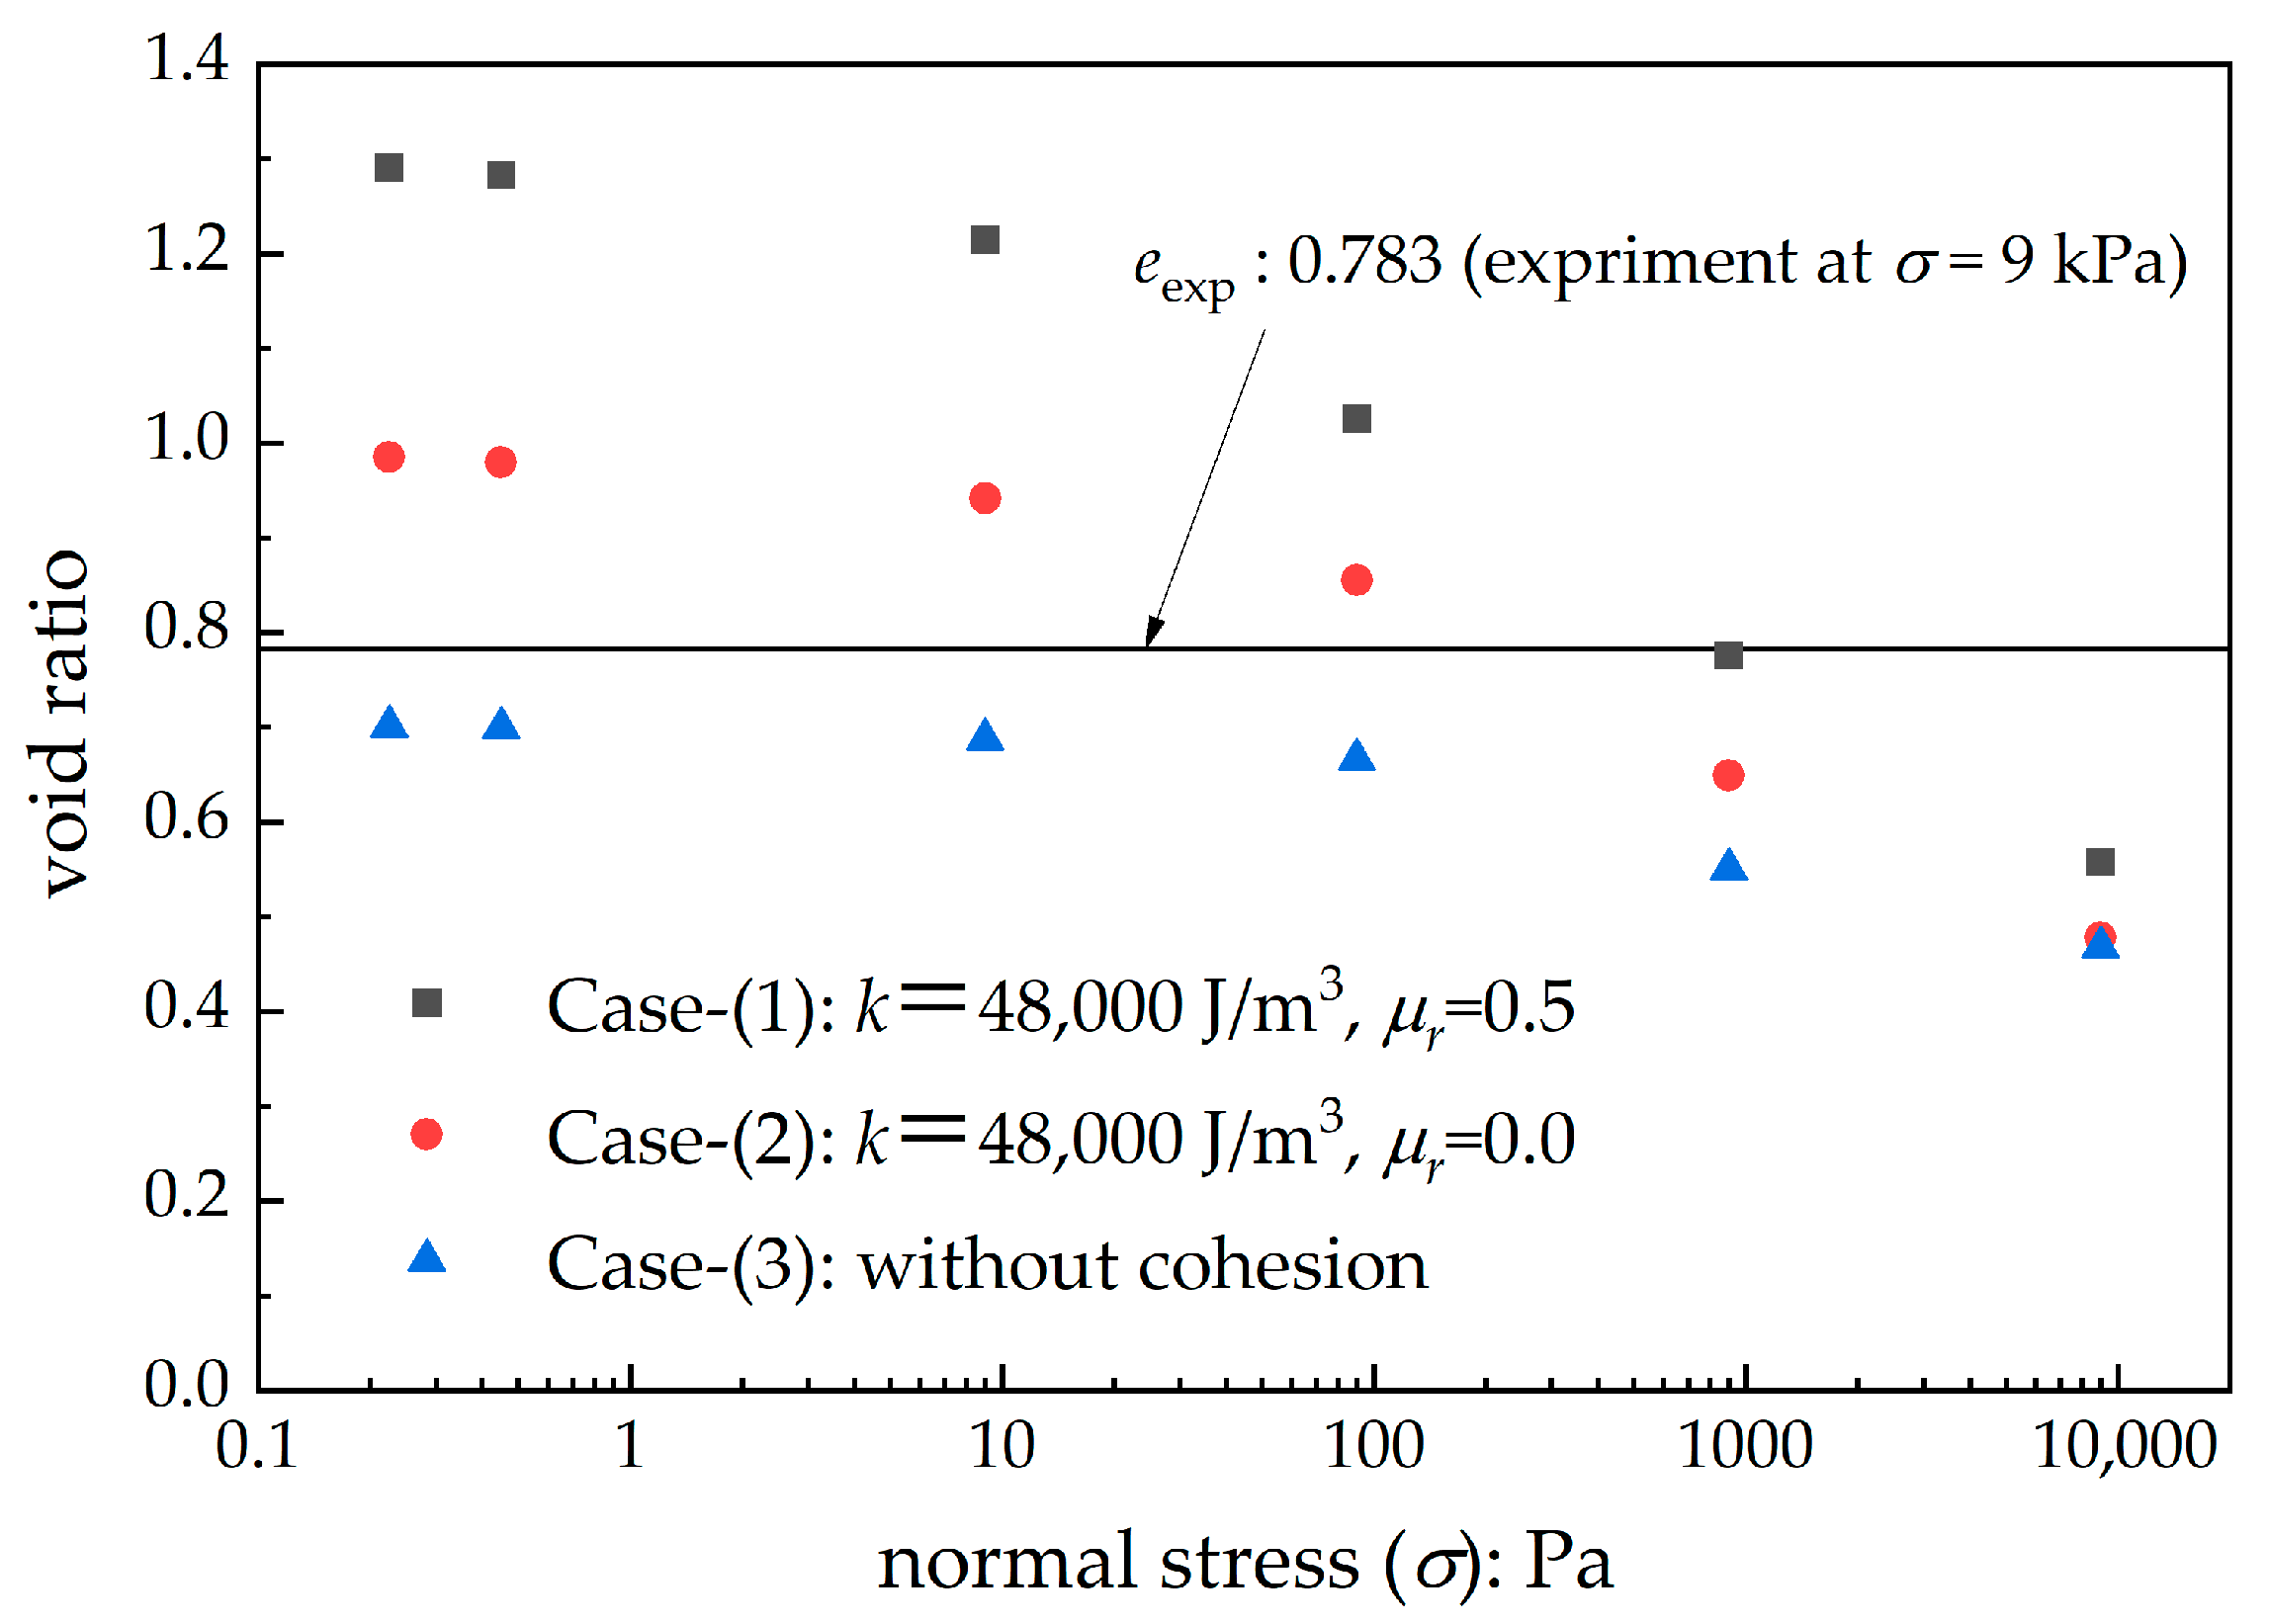
For the three cases of (1) k = 48,000 J/m3 and mr = 0.5, (2) k = 48,000 J/m3 and mr = 0, and (3) without cohesion, consolidation simulations at s = 0.225, 0.45, 9, 90, 900, and 9000 Pa were conducted, and the corresponding void ratios are shown in Figure 9. As illustrated by the Figure 9, when 9 kPa consolidation stress is applied, the simulated void ratio is lower than in the experiment, even with the adhesion model incorporated. This can be attributed to the fact that, for the given particle stiffness, the applied pressure is relatively high. This allows easier compression and results in a lower void ratio. It is hypothesized that the reduction in the void ratio is the result of two factors: firstly, the rearrangement of the particle assembly, and secondly, an increase in particle overlap.
The Figure 9 illustrates the void ratio (eexp) derived from the consolidation experiment conducted at s = 9 kPa. At σ = 0.225 Pa, where the scaling is satisfied using Young’s modulus from the DEM analysis, the void ratio is slightly larger than eexp for case (1). Of the three cases under consideration, case (1) is the closest to the cohesion parameters determined by Bayesian optimization under conditions that do not satisfy the scaling law. In case (1), the void ratio at σ = 0.225 Pa deviates significantly from the experimental value. This finding indicates that the DEM simulation, which did not satisfy the scaling law, may have resulted in excessive cohesion parameters.

4.2. Difference in Particle-Scale Dynamics

In the case of consolidation, the application of s = 9 kPa corresponds to the resistance force exerted by the particle assembly. In this case, the lateral boundaries are cylindrical, and the top and bottom are constrained by disks, which prevent shear deformations that would generate significant sliding along the tangential directions between particles, as shown in Figure 10. In other words, the resistance against external pressure is primarily provided by inter-particle normal forces. The JKR-type model applied in this study provides cohesion along the contact normal direction between particles. In contrast, the rotational resistance model insignificantly affects the contact normal direction but suppresses rotations due to torque, thereby contributing to tangential inter-particle forces.
In the consolidation scenario, once the particle arrangement is partially fixed, the normal inter-particle forces become the dominant mechanism. Thus, an increase in k enables the reproduction of the consolidation phenomenon. In contrast, as shown in Figure 10, direct shear occurs between the coater blade and the powder particles during powder bed formation simulations. Within this shear zone, the separation at inter-particle contacts and sliding at contact points become the dominant phenomena. Since the powder above the shear band zone will disappear due to the coater movement, the powder particles within the bed formation region are originally within the shear zone.
In the angle of repose-based calibration by Lupo et al. [13], the authors conducted a comprehensive analysis of powder behavior during powder spreading. It has been reported that, at the proximity of the coater, shear stresses exerted between the coater blade and the particle assembly induce irregular particle motion, thereby promoting the formation of localized voids in front of the coater. In the present study, we likewise infer that inter-particle shear is dominant immediately before and after powder bed formation, providing evidence that supports the observations made by Lupo et al.
The findings indicate that distinct optimal parameters may be required for consolidation and shear-dominated powder spreading. Prior studies typically calibrate against a single experimental modality—such as a consolidation metric or an angle-of-repose test—rather than jointly across consolidation and shear. To the best of our knowledge, few studies have identified DEM parameters simultaneously for both regimes on the same powder within a unified framework. This gap matters because powders dissipate energy efficiently through inter-particle friction and sliding; consequently, the governing micromechanics—and the associated parameter sensitivities—differ between normal-force-dominated consolidation and tangential-sliding-dominated spreading. Consistent with this, the parameter set calibrated for consolidation does not accurately reproduce spreading, underscoring both the nonlinearity of powder behavior and the need for phenomenon-aware calibration.
Guided by these insights, our planned work proceeds in two stages. First, we will identify parameters under consolidation while enforcing stress–stiffness scaling (e.g., matched σ/E) to ensure proper non-dimensional scaling. Second, if that set still mispredicts spreading, we will pivot to shear-relevant observables for powder bed formation (e.g., bulk density, area coverage, shear metrics) and reassess both scaling and the parameter values for the shear regime. This strategy advances a multi-mechanism fitting paradigm in which parameters are validated across the distinct physical mechanisms governing consolidation and spreading.

5. Conclusions

In the present study, a Bayesian optimization-based parameter identification method was developed to minimize the squared error between the powder bed void ratio obtained from consolidation experiments and that predicted by DEM simulations. This methodology was applied to metallic powders used in PBF-LM, and the identified parameter set was subsequently employed for powder spreading simulations.
  • A sequential optimization process was conducted utilizing Bayesian optimization. Although the optimal parameter set was not directly identified within twelve trials, several parameter sets close to the optimum were obtained as early as the fifth trial.
  • Proposing the next candidate parameter sets based on the user’s judgment rather than relying solely on Gaussian process regression resulted in the successful attainment of a parameter set consistent with the experimental values.
  • The parameter set identified for reproducing consolidation, in which inter-particle normal forces were dominant, was found to be incapable of reproducing the powder bed formation.
  • This inconsistency may be caused by two main aspects: (1) the scaling law (the ratio of Young’s modulus to consolidation stress) between the experiments and DEM does not match and (2) there is a difference between the particle-scale dynamics between consolidation and direct shear in powder spreading.
In the present study, the identification of parameters was conducted via Bayesian optimization for the consolidation process. Utilizing the same experimental apparatus, it is also possible to evaluate the shear strength, or internal friction angle, of a powder layer under confined pressure. Future work will focus on determining parameters based on shear strength and direct experimental observations of powder bed formation.
In this study, we employed Bayesian optimization as the sole optimizer. Although numerous gradient-based and metaheuristic methods are available, the strong nonlinearity and discontinuities of DEM simulations make reliable and robust gradient evaluation difficult, limiting the applicability of robust gradient-based schemes. In practice, derivative-free metaheuristics—such as genetic algorithms, particle swarm optimization, and ant colony optimization—have also been widely used. A systematic assessment of how the choice of optimizer affects convergence behavior and solution quality will be an important topic for future work.

Author Contributions

Conceptualization, J.K., M.K. and M.W.; methodology, M.K. and J.K.; software, M.K. and J.K.; validation, M.K. and J.K.; formal analysis, J.K., M.K. and M.W.; investigation, J.K.; resources, J.K. and M.K.; data curation, J.K.; writing—original draft preparation, J.K. and M.K.; writing—review and editing, J.K., M.K. and M.W.; visualization, J.K. and M.K.; project administration, M.W.; funding acquisition, M.W. All authors have read and agreed to the published version of the manuscript.

Funding

Financial support came from the Innovative Science and Technology Initiative for Security, Grant Number JPJ004596, implemented by the Acquisition, Technology, and Logistics Agency (ATLA).

Data Availability Statement

The original contributions presented in this study are included in the article. Further inquiries can be directed to the corresponding author.

Acknowledgments

We acknowledge the financial support from Innovative Science and Technology Initiative for Security, Grant Number JPJ004596 implemented by the Acquisition, Technology, and Logistics Agency (ATLA).

Conflicts of Interest

The authors declare no conflicts of interest.

Abbreviations

The following abbreviations are used in this manuscript:
PBF-LMPowder bed fusion laser melting
BOBayesian optimization
DEMDiscrete element method
HXHastelloy X
SJKRSimplified Johnson–Kendall–Roberts
HITLHuman in the loop

References

  1. DebRoy, T.; Wei, H.L.; Zuback, J.S.; Mukherjee, T.; Elmer, J.W.; Milewski, J.O.; Beese, A.M.; Wilson-Heid, A.; De, A.; Zhang, W. Additive manufacturing of metallic components—Process, structure and properties. Prog. Mater. Sci. 2018, 92, 112–224. [Google Scholar] [CrossRef]
  2. Seede, R.; Shoukr, D.; Zhang, B.; Whitt, A.; Gibbons, S.; Flater, P.; Elwany, A.; Arroyave, R.; Karaman, I. An ultra-high strength martensitic steel fabricated using selective laser melting additive manufacturing: Densification, microstructure, and mechanical properties. Acta Mater. 2020, 186, 199–214. [Google Scholar] [CrossRef]
  3. Fürstenau, J.-P.; Wessels, H.; Weißenfels, C.; Wriggers, P. Generating virtual process maps of slm using powder-scale sph simulations. Comput. Part. Mech. 2020, 7, 655–677. [Google Scholar] [CrossRef]
  4. Grange, D.; Queva, A.; Guillemot, G.; Bellet, M.; Bartout, J.D.; Colin, C. Effect of processing parameters during the laser beam melting of inconel 738: Comparison between simulated and experimental melt pool shape. J. Mater. Process. Technol. 2021, 289, 116897. [Google Scholar] [CrossRef]
  5. Alphonso, W.; Baier, M.; Carmignato, S.; Hattel, J.; Bayat, M. On the possibility of doing reduced order, thermo-fluid modelling of laser pow- der bed fusion (l-pbf)—Assessment of the importance of recoil pressure and surface tension. J. Manuf. Process. 2023, 94, 564–577. [Google Scholar] [CrossRef]
  6. Katagiri, J.; Kusano, M.; Minamoto, S.; Kitano, H.; Daimaru, K.; Tsujii, M.; Watanabe, M. Melt pool shape evaluation by single-track experiments and finite-element thermal analysis: Balling and lack of fusion criteria for generating process window of inconel738lc. Materials 2023, 16, 1729. [Google Scholar] [CrossRef]
  7. Katagiri, J.; Nomoto, S.; Kusano, M.; Watanabe, M. Particle size effect on powder packing properties and molten pool dimensions in laser powder bed fusion simulation. J. Manuf. Mater. Process. 2024, 8, 71. [Google Scholar] [CrossRef]
  8. Masuda, H. Adhesion of powder particles. Denshi Shashin Gakkaishi (Electrophotogr.) 1997, 36, 169–174. [Google Scholar] [CrossRef]
  9. Cundall, P.A.; Strack, O.D. A discrete element model for granular assemblies. Geotechnique 1979, 29, 47–65. [Google Scholar] [CrossRef]
  10. Li, T.; Peng, Y.; Zhu, Z.; Zou, S.; Yin, Z. Discrete Element Method Simulations of the Inter-Particle Contact Parameters for the Mono-Sized Iron Ore Particles. Materials 2017, 10, 520. [Google Scholar] [CrossRef]
  11. Yim, S.; Bian, H.; Aoyagi, K.; Yamanaka, K.; Chiba, A. Spreading behavior of Ti–48Al–2Cr–2Nb powders in powder bed fusion additive manufacturing process: Experimental and discrete element method study. Addit. Manuf. 2022, 49, 102489. [Google Scholar] [CrossRef]
  12. Geer, S.; Bernhardt-Barry, M.L.; Garboczi, E.J.; Whiting, J.; Donmez, A. A more efficient method for calibrating discrete element method parameters for simulations of metallic powder used in additive manufacturing. Granul. Matter 2018, 20, 77. [Google Scholar] [CrossRef]
  13. Lupo, M.; Ajabshir, S.Z.; Sofia, D.; Barletta, D.; Poletto, M. Discrete element method model calibration and validation for the spreading step of the powder bed fusion process to predict the quality of the layer surface. Particuology 2024, 94, 261–273. [Google Scholar] [CrossRef]
  14. Kitano, H.; Kusano, M.; Tsujii, M.; Yumoto, A.; Watanabe, M. Process parameter optimization framework for the selective laser melting of hastelloy x alloy considering defects and solidification crack occurrence. Crystals 2021, 11, 578. [Google Scholar] [CrossRef]
  15. Freeman, R. Measuring the flow properties of consolidated, conditioned and aerated powders—A comparative study using a powder rheometer and a rotational shear cell. Powder Technol. 2007, 174, 25–33. [Google Scholar] [CrossRef]
  16. Liu, Y.; Guo, X.; Lu, H.; Gong, X. An investigation of the effect of particle size on the flow behavior of pulverized coal. Procedia Eng. 2015, 102, 698–713. [Google Scholar] [CrossRef]
  17. Koynov, S.; Duda, K.; Santos, P.A.D.L.; Goldfarb, D.J. Comparative evaluation of peschl and ft4 full-bed rotational shear cells for powder flow characterization. Powder Technol. 2025, 456, 120810. [Google Scholar] [CrossRef]
  18. DCS Computing GmbH. Liggghts-Public Documentation, Version 3.x. 2025. Available online: https://www.cfdem.com/media/DEM/docu/Manual.html (accessed on 15 August 2025).
  19. Haynes International. Hastelloy-X. 2025. Available online: https://haynesintl.com/en/alloys/alloy-portfolio/high-temperature-alloys/hastelloy-x/#physical-properties (accessed on 15 August 2025).
  20. The GpyOpt Authors. Gpyopt: A Bayesian Optimization Framework in Python. 2016. Available online: http://github.com/SheffieldML/GPyOpt (accessed on 15 August 2025).
  21. Kim, M.; Ding, Y.; Malcolm, P.; Speeckaert, J.; Siviy, C.J.; Walsh, C.J.; Kuindersma, S. Human-in-the-loop bayesian optimization of wearable device parameters. PLoS ONE 2017, 12, e0184054. [Google Scholar] [CrossRef]
  22. Sousa, J.; Sousa, A.; Brueckner, F.; Reis, L.P.; Reis, A. Hu-man-in-the-loop multi-objective bayesian optimization for directed energy deposition with in-situ monitoring. Robot. Comput.-Integr. Manuf. 2025, 92, 102892. [Google Scholar] [CrossRef]
  23. Kim, D.B.; Bajestani, M.S.; Lee, J.Y.; Shin, S.-J.; Kim, G.-Y.; Sajadieh, S.M.M.; Noh, S. Human-in-the-loop in smart manufacturing (h-sm): A review and perspective. J. Manuf. Syst. 2025, 82, 178–199. [Google Scholar] [CrossRef]
  24. Kikuchi, K.; Tanifuji, Y.; Zhou, W.; Nomura, N.; Kawasaki, A. Experimental characterization and computational simulation of powder bed for powder bed fusion additive manufacturing. Mater. Trans. 2022, 63, 931–938. [Google Scholar] [CrossRef]
  25. Okugawa, M.; Isono, Y.; Koizumi, Y.; Nakano, T. Raking process for powder bed fusion of ti–6al–4v alloy powder analyzed by discrete element method. Mater. Trans. 2023, 64, 37–43. [Google Scholar] [CrossRef]
Figure 1. A schematic of the flow of the consolidation experiment, the DEM simulation of consolidation, Bayesian optimization, and its application to powder spreading simulation.
Jmmp 09 00383 g001
Figure 2. A schematic of the consolidation experiment.
Jmmp 09 00383 g002
Figure 3. An example snapshot of the consolidation DEM simulation.
Jmmp 09 00383 g003
Figure 4. An example snapshot of the powder spreading simulation.
Jmmp 09 00383 g004
Figure 5. Simulated void ratio esim (k,μr) over the (k,μr) domain. The color map is interpolated from the simulation results in Table 3; white circles indicate the computed data points (cases 0–1 to 12), and the red star marks the best condition identified in Table 3.
Jmmp 09 00383 g005
Figure 6. The relationship between the number of iterations and best objective value obtained from the Bayesian optimization process using the machine learning surrogate model.
Jmmp 09 00383 g006
Figure 7. Snapshots of powder spreading simulations with and without adhesion.
Jmmp 09 00383 g007
Figure 8. Snapshots of final step of powder spreading simulations without cohesion (a), with k = 15,833 J/m3 (b), 23,750 J/m3 (c), and 47,500 J/m3 (d).
Jmmp 09 00383 g008
Figure 9. Results of the consolidation simulations varying the normal stress: relationship between the normal stress and the void ratios for the cases of (1) k = 48,000 J/m3 and mr = 0.5, (2) k = 48,000 J/m3 and mr = 0, and (3) without cohesion.
Jmmp 09 00383 g009
Figure 10. Particle-scale schematics of consolidation and direct shear in the powder spreading processes.
Jmmp 09 00383 g010
Table 1. The DEM model parameters and parameters to be set for the simulation.
ParameterValue
Contact lawHertz–Mindlin (no history)
Density8220 kg/m3
Young’s modulus5 × 106 Pa
Poisson’s ratio0.3
Restitution coefficient0.4
Particle–particle friction coefficient0.3
Particle–wall friction coefficient0.3
Time increment1 × 10−6 s
Gravity9.81 m/s2
Neighbor list radius40 μm
Integratornve/sphere
Boundary conditionx: periodic, y: periodic, z: fixed
Wall consolidation stress0.9 kPa
Servo wall maximum velocity0.1 m/s
Wall servo control parameters (kp)0.1
k is the surface energy density. ri and rj are the radii of i-th and j-th particles, respectively. dn is the overlap depth between i-th and j-th particles. mr, kn, and wr,shear are the rolling friction coefficient, normal spring constant, and contact tangential component of the relative rotation vector between i-th and j-th particles, respectively. The JKR model requires the input of parameter k, whilst the rotational resistance model requires mr. In the case of a hybrid model of the two models, it is necessary to set two model parameters.
Table 2. Bayesian optimization parameters used.
ParameterValue
Acquisition
(acquisition_type)
Expected improvement
(EI)
Model type
(model_type)
Gaussian process
(GP)
Allowance of duplicate proposals
(de_duplication)
True
Inclusion of noise in objective function
(exact_feval)
False
Acquisition weight: wa
(acquisition_weight)
0.01–1.0
Objective function(eexpeDEM)2
Optimization typeMinimization
Initial cases
(initial_design_num_data, X, Y)
5 (0–1 to 0–5 in Table 3)
Range of k102–105 J/m3
Range of μr0.05–0.7
Number of iterations100
Disclaimer/Publisher’s Note: The statements, opinions and data contained in all publications are solely those of the individual author(s) and contributor(s) and not of MDPI and/or the editor(s). MDPI and/or the editor(s) disclaim responsibility for any injury to people or property resulting from any ideas, methods, instructions or products referred to in the content.